2017 Display Industry Key words - Markit© 2016 IHS Markit. All Rights Reserved. 2017 keyword for...
14
© 2016 IHS Markit. All Rights Reserved. © 2016 IHS Markit. All Rights Reserved. 2017 Display Industry Key words November 2016
-
Upload
nguyenduong -
Category
Documents
-
view
218 -
download
0
Transcript of 2017 Display Industry Key words - Markit© 2016 IHS Markit. All Rights Reserved. 2017 keyword for...
© 2016 IHS Markit. All Rights Reserved. © 2016 IHS Markit. All Rights Reserved.
2017 Display Industry Key words
November 2016
© 2016 IHS Markit. All Rights Reserved.
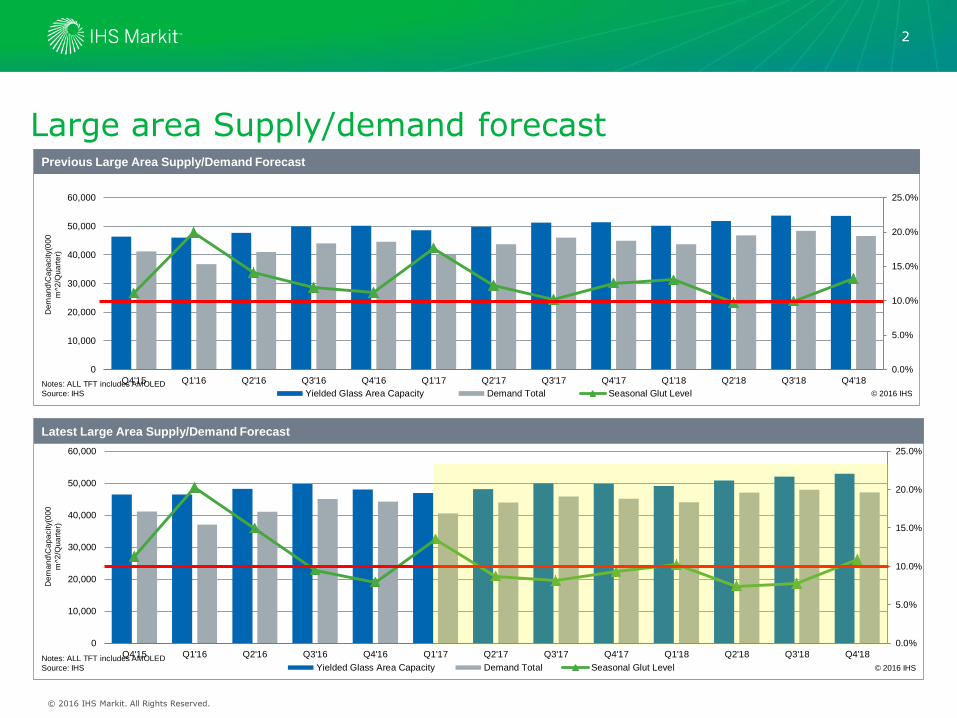
Large area Supply/demand forecast
2
0.0%
5.0%
10.0%
15.0%
20.0%
25.0%
0
10,000
20,000
30,000
40,000
50,000
60,000
Q4'15 Q1'16 Q2'16 Q3'16 Q4'16 Q1'17 Q2'17 Q3'17 Q4'17 Q1'18 Q2'18 Q3'18 Q4'18
Yielded Glass Area Capacity Demand Total Seasonal Glut Level
Previous Large Area Supply/Demand Forecast
Notes: ALL TFT includes AMOLED
Source: IHS © 2016 IHS
Dem
an
d\C
ap
acity(0
00
m^2
/Qu
art
er)
0.0%
5.0%
10.0%
15.0%
20.0%
25.0%
0
10,000
20,000
30,000
40,000
50,000
60,000
Q4'15 Q1'16 Q2'16 Q3'16 Q4'16 Q1'17 Q2'17 Q3'17 Q4'17 Q1'18 Q2'18 Q3'18 Q4'18
Chart Title
Yielded Glass Area Capacity Demand Total Seasonal Glut Level
Latest Large Area Supply/Demand Forecast
Notes: ALL TFT includes AMOLED
Source: IHS © 2016 IHS
Dem
an
d\C
ap
acity(0
00
m^2
/Qu
art
er)
© 2016 IHS Markit. All Rights Reserved.
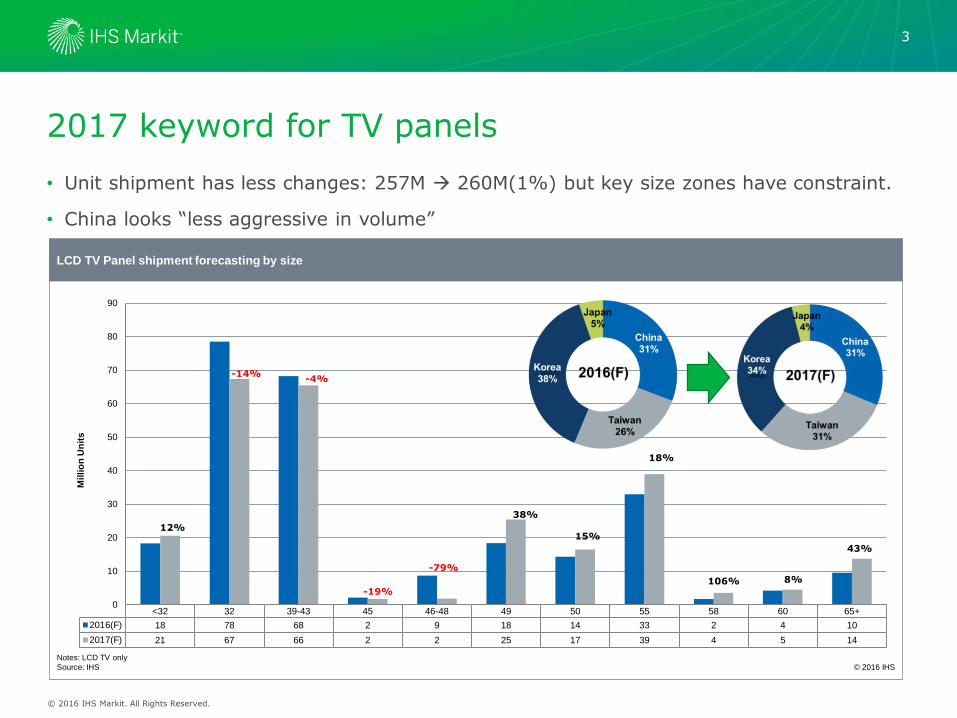
<32 32 39-43 45 46-48 49 50 55 58 60 65+
2016(F) 18 78 68 2 9 18 14 33 2 4 10
2017(F) 21 67 66 2 2 25 17 39 4 5 14
0
10
20
30
40
50
60
70
80
90
Millio
n U
nit
s
Chart Title LCD TV Panel shipment forecasting by size
Notes: LCD TV only
Source: IHS © 2016 IHS
2017 keyword for TV panels
• Unit shipment has less changes: 257M 260M(1%) but key size zones have constraint.
• China looks “less aggressive in volume”
3
12%
-14% -4%
-19%
-79%
38%
15%
18%
106% 8%
43%
© 2016 IHS Markit. All Rights Reserved.
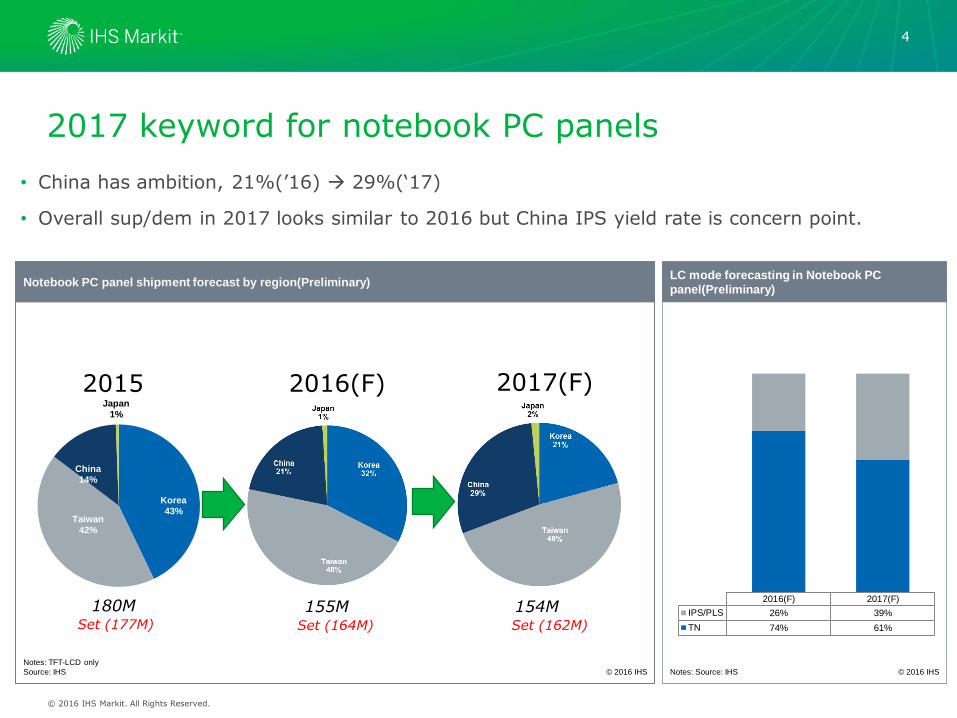
2017 keyword for notebook PC panels
4
• China has ambition, 21%(’16) 29%(‘17)
• Overall sup/dem in 2017 looks similar to 2016 but China IPS yield rate is concern point.
Korea 43%
Taiwan 42%
China 14%
Japan
1%
Notebook PC panel shipment forecast by region(Preliminary)
© 2016 IHS
Notes: TFT-LCD only
Source: IHS
2016(F) 2017(F)
IPS/PLS 26% 39%
TN 74% 61%
Chart Title LC mode forecasting in Notebook PC
panel(Preliminary)
Notes: Source: IHS © 2016 IHS
2015 2016(F) 2017(F)
180M 155M 154M Set (177M) Set (164M) Set (162M)
© 2016 IHS Markit. All Rights Reserved.
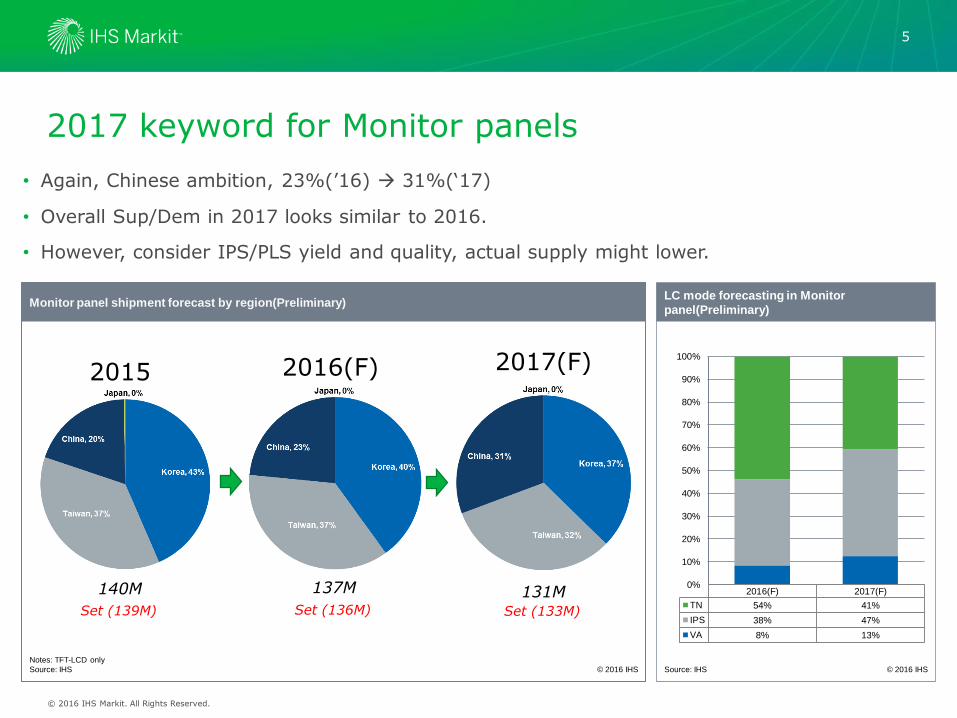
2017 keyword for Monitor panels
5
Monitor panel shipment forecast by region(Preliminary)
© 2016 IHS
Notes: TFT-LCD only
Source: IHS
2015 2016(F) 2017(F)
140M 137M 131M
• Again, Chinese ambition, 23%(’16) 31%(‘17)
• Overall Sup/Dem in 2017 looks similar to 2016.
• However, consider IPS/PLS yield and quality, actual supply might lower.
2016(F) 2017(F)
TN 54% 41%
IPS 38% 47%
VA 8% 13%
0%
10%
20%
30%
40%
50%
60%
70%
80%
90%
100%
Chart Title LC mode forecasting in Monitor
panel(Preliminary)
© 2016 IHS
Source: IHS
Set (139M) Set (136M) Set (133M)
© 2016 IHS Markit. All Rights Reserved.
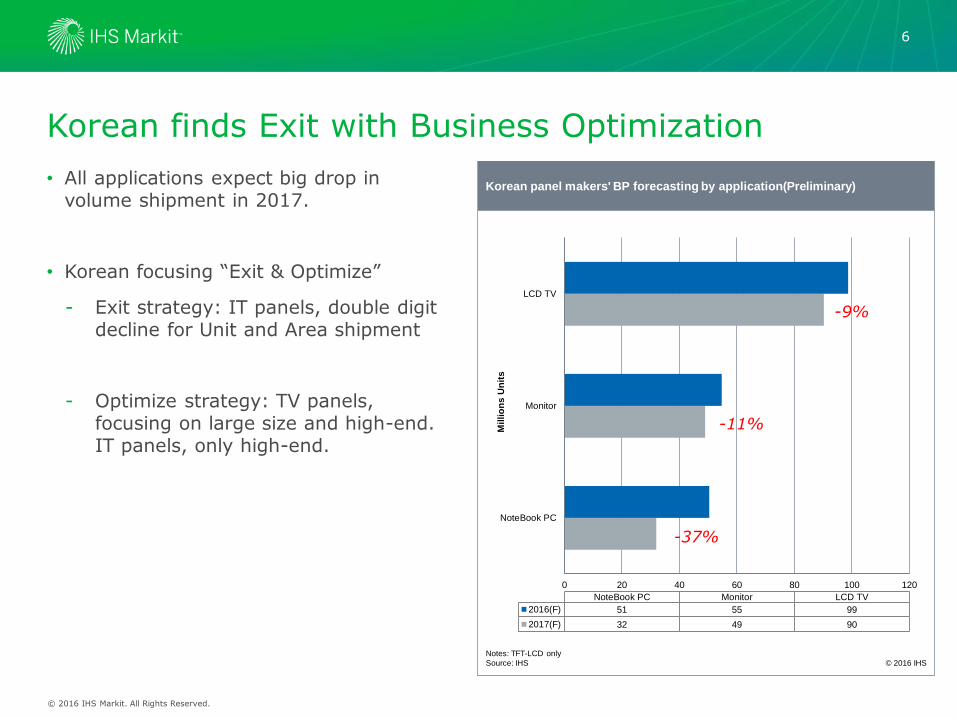
Korean finds Exit with Business Optimization
• All applications expect big drop in volume shipment in 2017.
• Korean focusing “Exit & Optimize”
- Exit strategy: IT panels, double digit decline for Unit and Area shipment
- Optimize strategy: TV panels, focusing on large size and high-end. IT panels, only high-end.
6
0 20 40 60 80 100 120
NoteBook PC
Monitor
LCD TV
NoteBook PC Monitor LCD TV
2016(F) 51 55 99
2017(F) 32 49 90
Chart Title Korean panel makers' BP forecasting by application(Preliminary)
© 2016 IHS
Notes: TFT-LCD only
Source: IHS
Millio
ns U
nit
s
-9%
-11%
-37%
© 2016 IHS Markit. All Rights Reserved.
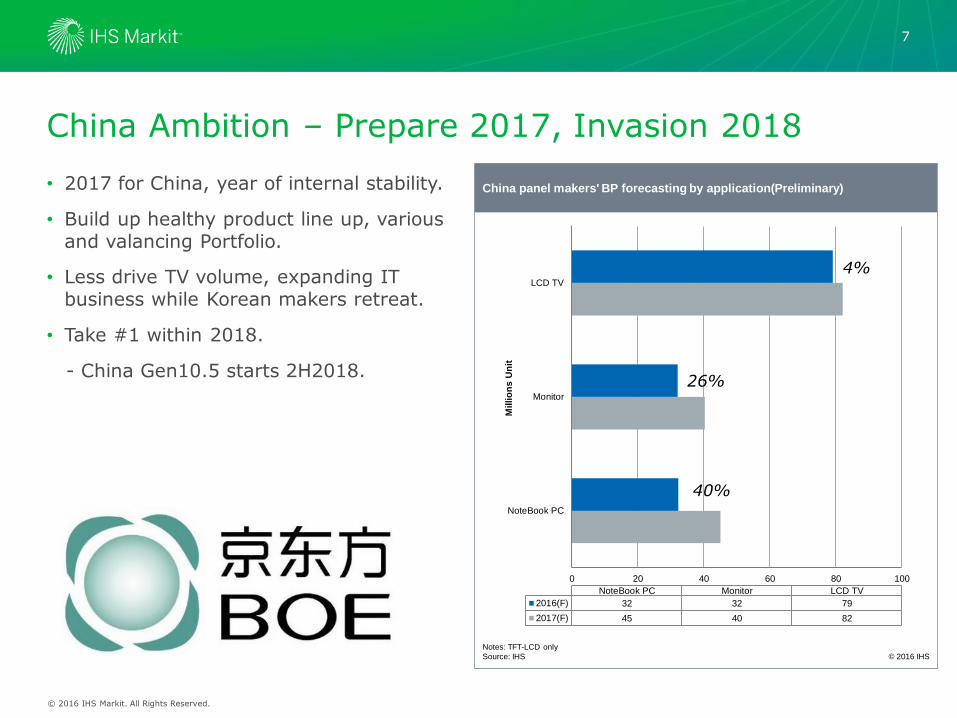
China Ambition – Prepare 2017, Invasion 2018
7
• 2017 for China, year of internal stability.
• Build up healthy product line up, various and valancing Portfolio.
• Less drive TV volume, expanding IT business while Korean makers retreat.
• Take #1 within 2018.
- China Gen10.5 starts 2H2018.
0 20 40 60 80 100
NoteBook PC
Monitor
LCD TV
NoteBook PC Monitor LCD TV
2016(F) 32 32 79
2017(F) 45 40 82
Chart Title China panel makers' BP forecasting by application(Preliminary)
© 2016 IHS
Notes: TFT-LCD only
Source: IHS
Millio
ns U
nit
4%
26%
40%
© 2016 IHS Markit. All Rights Reserved.
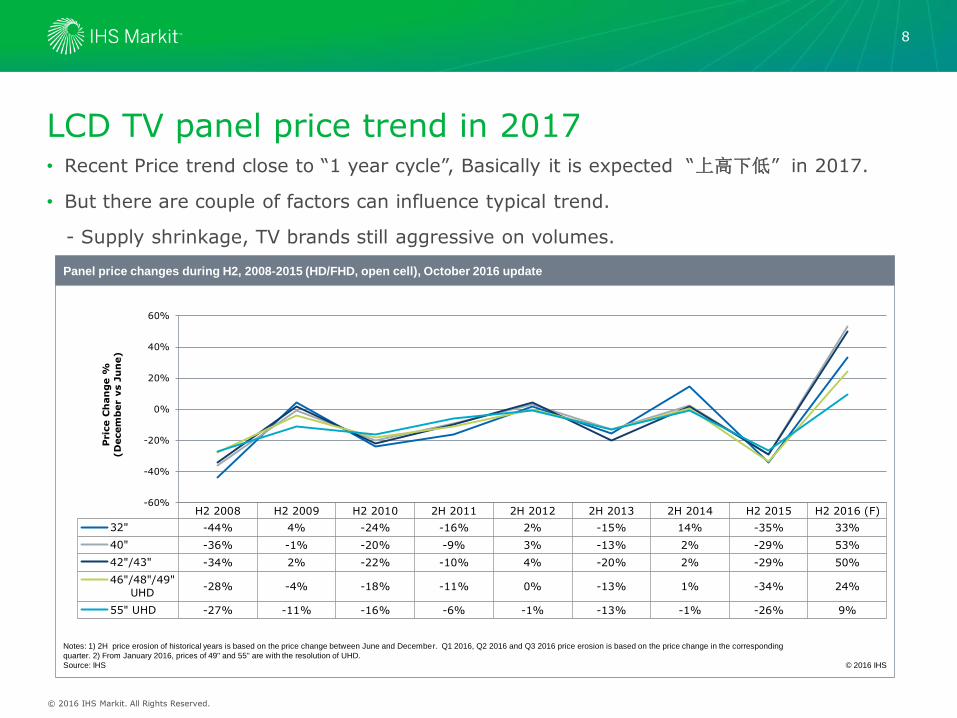
LCD TV panel price trend in 2017 • Recent Price trend close to “1 year cycle”, Basically it is expected “上高下低” in 2017.
• But there are couple of factors can influence typical trend.
- Supply shrinkage, TV brands still aggressive on volumes.
8
H2 2008 H2 2009 H2 2010 2H 2011 2H 2012 2H 2013 2H 2014 H2 2015 H2 2016 (F)
32" -44% 4% -24% -16% 2% -15% 14% -35% 33%
40" -36% -1% -20% -9% 3% -13% 2% -29% 53%
42"/43" -34% 2% -22% -10% 4% -20% 2% -29% 50%
46"/48"/49"
UHD-28% -4% -18% -11% 0% -13% 1% -34% 24%
55" UHD -27% -11% -16% -6% -1% -13% -1% -26% 9%
-60%
-40%
-20%
0%
20%
40%
60%
Pri
ce C
han
ge %
(D
ecem
ber
vs J
un
e)
Panel price changes during H2, 2008-2015 (HD/FHD, open cell), October 2016 update
Notes: 1) 2H price erosion of historical years is based on the price change between June and December. Q1 2016, Q2 2016 and Q3 2016 price erosion is based on the price change in the corresponding
quarter. 2) From January 2016, prices of 49" and 55" are with the resolution of UHD.
Source: IHS © 2016 IHS
© 2016 IHS Markit. All Rights Reserved.
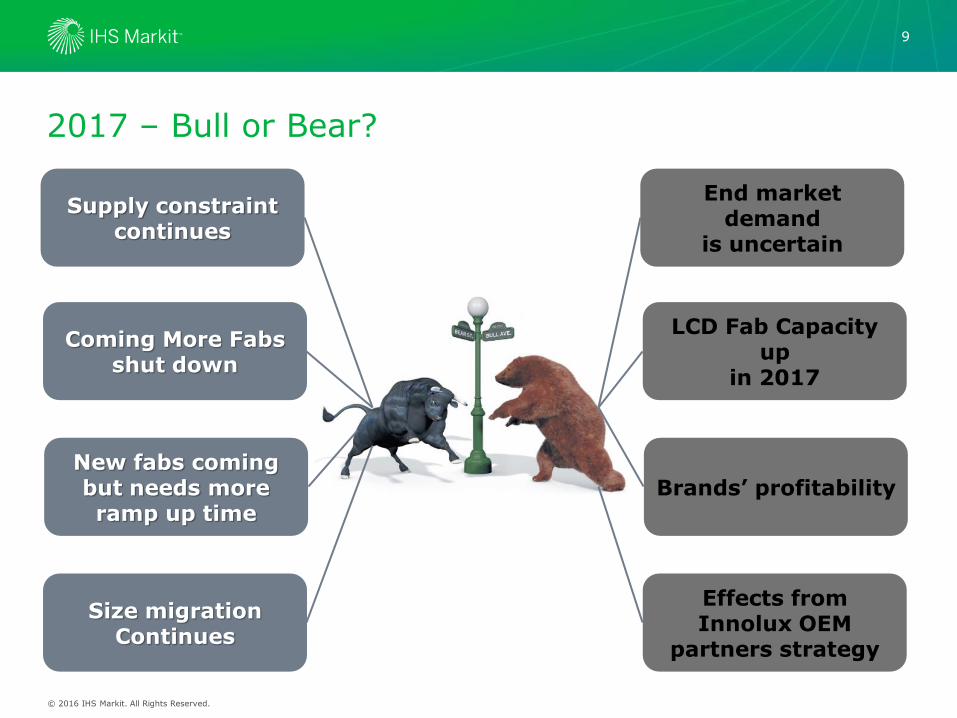
Supply constraint continues
Coming More Fabs shut down
New fabs coming but needs more ramp up time
Size migration Continues
End market demand
is uncertain
LCD Fab Capacity up
in 2017
Brands’ profitability
Effects from Innolux OEM
partners strategy
9
2017 – Bull or Bear?
9
© 2016 IHS Markit. All Rights Reserved.
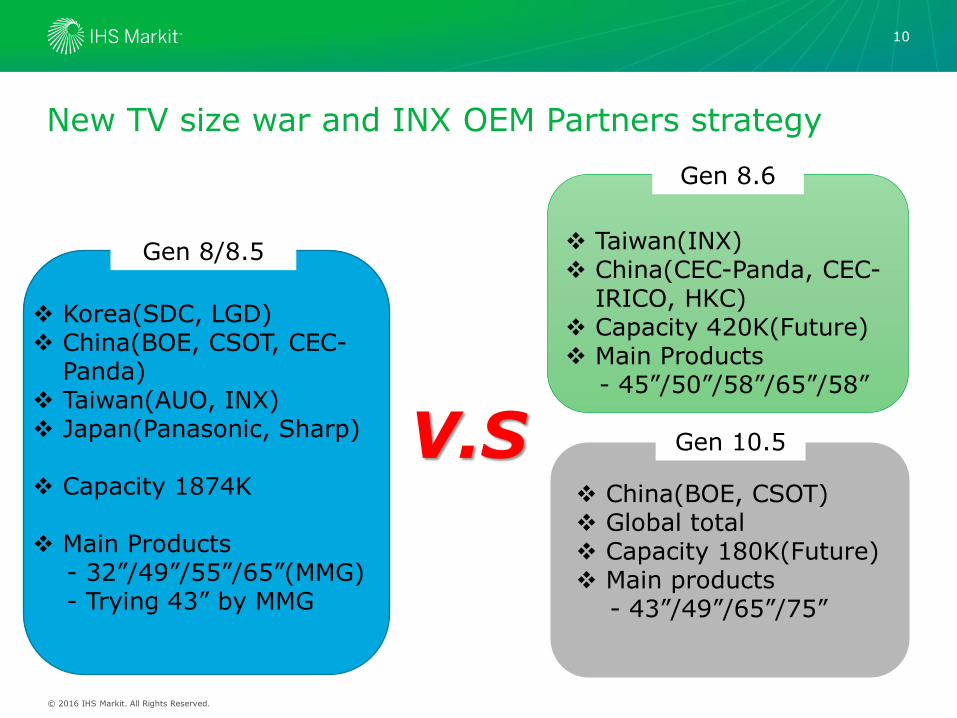
New TV size war and INX OEM Partners strategy
10
Gen 8/8.5
Gen 8.6
Korea(SDC, LGD) China(BOE, CSOT, CEC-
Panda) Taiwan(AUO, INX) Japan(Panasonic, Sharp)
Capacity 1874K
Main Products - 32”/49”/55”/65”(MMG) - Trying 43” by MMG
Taiwan(INX) China(CEC-Panda, CEC-
IRICO, HKC) Capacity 420K(Future) Main Products - 45”/50”/58”/65”/58”
Gen 10.5
China(BOE, CSOT) Global total Capacity 180K(Future) Main products - 43”/49”/65”/75”
V.S
© 2016 IHS Markit. All Rights Reserved.
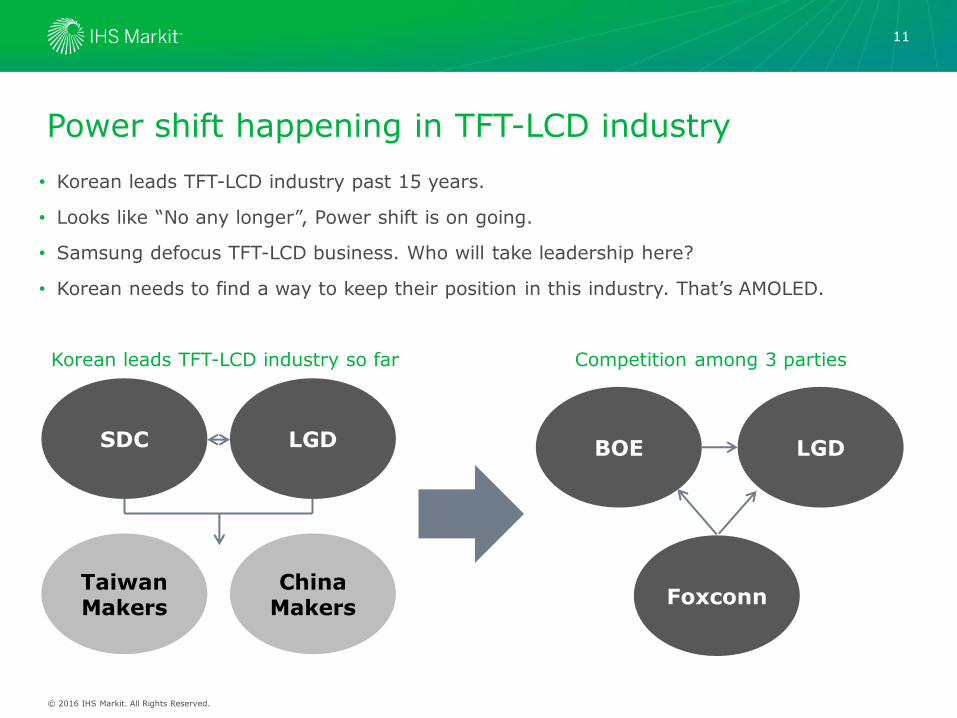
Power shift happening in TFT-LCD industry
11
• Korean leads TFT-LCD industry past 15 years.
• Looks like “No any longer”, Power shift is on going.
• Samsung defocus TFT-LCD business. Who will take leadership here?
• Korean needs to find a way to keep their position in this industry. That’s AMOLED.
SDC
Taiwan Makers
LGD
China Makers
LGD
Foxconn
BOE
Korean leads TFT-LCD industry so far Competition among 3 parties

© 2016 IHS Markit. All Rights Reserved.
Status of AMOLED panel suppliers • Small and medium AMOLED industry
> Only Samsung Display reached mass production of Quad HD & flexible AMOLED, placing it ahead of others for more than three years. To overcome the lack of core technology and experience, suppliers should avoid the exclusive patent of Samsung.
• Large AMOLED industry
> Only LG Display reached mass production of Ultra HD larger than 65 inches, but it is suffering from low yield rate and high cost. To overcome these issues, suppliers should develop innovative manufacturing processes.
AMOLED Panel Supplier’s Development Status
© 2016 IHS
Source: IHS
Improve Technology
(need more core tech.)
Improve Yield Rate
(need more experience)
Application Target
(Monitor, Wearables)
Increase Capacity
(Flexible, TV panel)
SDC, LGD AUO, Sony BOE, Tianma, EDO, GVO INX, Truly, CPT
JOLED, JDI, CSOT
Move to flexible AMOLED
by 2018
Differentiate
with flexible / large OLED
Reduce
manufacturing cost Secure
core technology
R&D Pilot run Small MP
(Niche market) MP
12
12
© 2016 IHS Markit. All Rights Reserved.
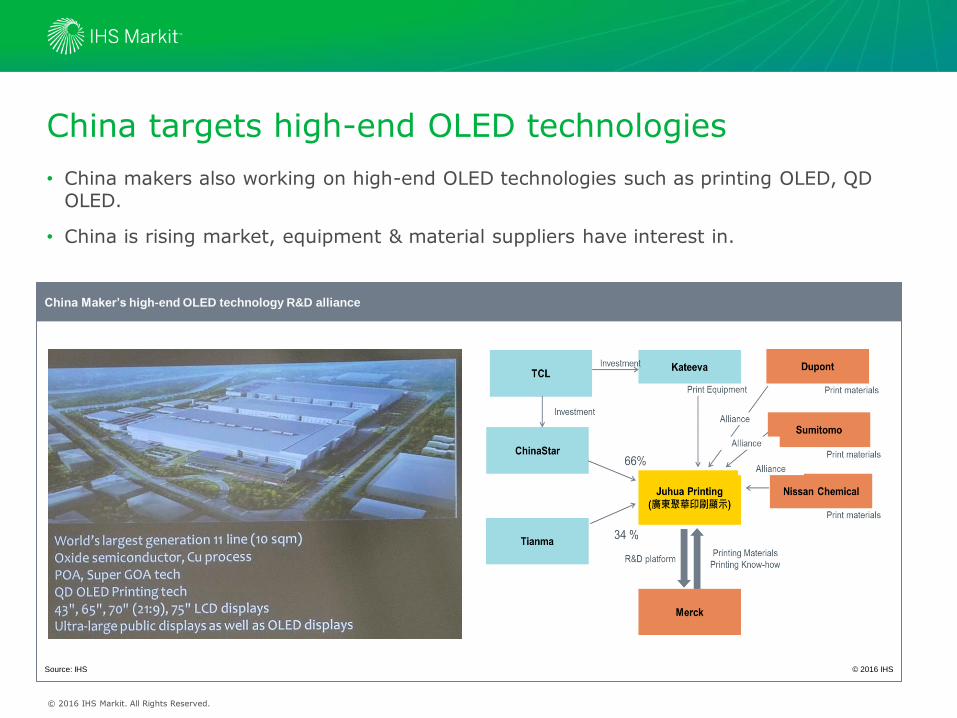
China Maker’s high-end OLED technology R&D alliance
© 2016 IHS Source: IHS
• China makers also working on high-end OLED technologies such as printing OLED, QD OLED.
• China is rising market, equipment & material suppliers have interest in.
China targets high-end OLED technologies
© 2016 IHS Markit. All Rights Reserved.
14
Thank you for your attentions
• 2016.11.2
• Yoonsung Chung
• Director, Displays
• IHS Technology