
Kshema Kutuhula - Kshemaraj 3252 Alm 15 Shlf 2 Devanagari - Ayurveda


RESEARCH INSTITUTE OF AGRICULTURAL ECONOMICS
HUNGARIAN CENTRAL STATISTICAL OFFICE
HUNGARIAN FOODAND AGRICULTURAL
STATISTICS 2017
BUDAPEST, 2018

Published by: Research Institute of Agricultural Economics H-1093 Budapest, Zsil utca 3-5. Mailing address: H-1463 Budapest, Pf. 944 Phone: (+36 1) 217-1011 Fax: (+36 1) 217-4469 www.aki.gov.hu [email protected]
DOI: http://dx.doi.org/10.7896/zsk.1802 ISSN 1586-0086ISSN 2063-6628 (Agricultural Economics Information)
Printed and bound by Prime Rate Kft.© Research Institute of Agricultural Economics
All rights reserved. Reproduction of any parts of the document as well as storing, transmission or use of data (in written or electronic format) with any kind of database manager is only possible with the prior written permis-sion of the publisher.
Published by: dr. Kemény, Gábor Interim General Director Research Institute of Agricultural Economics
Prepared by: Directorate of Information Systems of Research Institute of Agricultural Economics on Department of Agricultural Statistics Head of Department: Bábáné Demeter, Edit
in co-operation with
DepartmentofSectoralStatistics,HungarianCentralStatisticalOffice(KSH) Head of Department: Valkó, Gábor

3
CONTENTS
1. SUMMARY DATA OF AGRICULTURAL BRANCHES ...................................................91.1. NUMBER OF PERSONS EMPLOYED ........................................................................111.2. GROSS OUTPUT AND GROSS VALUE ADDED BY BRANCHES ..........................121.3. INVESTMENTS OUTLAY BY BRANCHES (1/2) ......................................................131.3. INVESTMENTS OUTLAY BY BRANCHES (2/2) ......................................................141.4. AVERAGE MONTHLY GROSS AND NET EARNINGS OF EMPLOYEES ..............15
2. AGRICULTURE ...................................................................................................................172.1. AREA BY BRANCHES OF CULTIVATION (31ST MAY) ............................................192.2. PRODUCTIVE AND ARABLE LAND OF ECONOMIC
ORGANIZATIONS BY SIZE GROUP ..........................................................................202.3. VINEYARD AND ORCHARD AREA OF ECONOMIC
ORGANIZATIONS BY SIZE GROUP ..........................................................................212.4. LAND USE BY LEGAL FORMS (31ST MAY) ..............................................................222.5. MAIN ENERGY SOURCES IN FORESTRY AND AGRICULTURE ..........................222.6. SALE AND USE OF FERTILIZERS .............................................................................232.7. USE OF FERTILIZERS BY AGRICULTURAL ENTERPRISESa) ..............................242.8. MANURING OF AGRICULTURAL ENTERPRISES (1/2) .........................................252.8. MANURING OF AGRICULTURAL ENTERPRISES (2/2) .........................................252.9. FODDER PRODUCTION ..............................................................................................262.10. SALES OF PESTICIDES .............................................................................................272.11. PRODUCTION OF MAIN CROPS ..............................................................................282.12. VITICULTURE AND FRUIT GROWING ..................................................................292.13. LIVESTOCK.................................................................................................................302.14. PRODUCTION OF ANIMALS FOR SLAUGHTER AND ANIMAL PRODUCTS ..312.15. PRINCIPAL INDICATORS OF ANIMAL HUSBANDRY ..........................................322.16. TERMS OF TRADE .....................................................................................................332.17. PRODUCER-PROCUREMENT PRICE INDICES .....................................................342.18. PROCUREMENT VOLUME INDICES OF AGRICULTURAL PRODUCT .............352.19. PROCUREMENT OF AGRICULTURAL PRODUCTS ..............................................362.20. AVERAGE PRODUCER-PROCUREMENT PRICES OF MAIN PRODUCTS .........372.21. AVERAGE PRODUCER-MARKET PRICES (1/2).....................................................382.21. AVERAGE PRODUCER-MARKET PRICES (2/2).....................................................392.22. CONSUMER PRICES OF SELECTED GOODS ........................................................402.23. STOCK OF MAIN MACHINES 2013 .........................................................................412.24. SALES OF AGRICULTURAL MACHINERY ...........................................................422.26. AGRICULTURAL LABOUR INPUT ..........................................................................432.25. ECONOMIC ACCOUNTS OF AGRICULTURE ........................................................432.27. AGRICULTURAL INCOME INDICES .......................................................................442.28. VOLUMEN INDICES OF AGRICULTURAL OUTPUT AND
GROSS VALUE ADDED ............................................................................................44
3. FOOD INDUSTRY ...............................................................................................................453.1. REGISTERED FOOD PROCESSING ENTERPRISES BY BRANCHES ...................473.2. PERSONS EMPLOYED IN BRANCHES OF FOOD INDUSTRY ..............................483.3. GROSS MONTHLY EARNINGS OF EMPLOYEES IN BRANCHES
OF FOOD INDUSTRY...................................................................................................493.4. NET MONTHLY EARNINGS OF EMPLOYEES IN BRANCHES
OF FOOD INDUSTRY...................................................................................................50

4
3.5. VOLUME INDICES OF GROSS OUTPUT IN BRANCHES OF FOOD INDUSTRY .........................................................................................................51
3.6. INVESTMENTS OF FOOD PROCESSING ENTERPRISES ......................................523.7. CONSUMPTION PER CAPITA .....................................................................................53
4. FORESTRY, FISHERY ........................................................................................................554.1. FOREST AREA, RATIO OF FORESTED LAND .........................................................574.2. FORESTATION ..............................................................................................................584.3. LOGGING ......................................................................................................................584.4. WOODED AREA AND LOGGING BY SPECIES ........................................................594.5. TOTAL STATEMENT OF FOREST DAMAGE 2017 1/2 .............................................604.5. TOTAL STATEMENT OF FOREST DAMAGE 2017 2/2 .............................................614.6. STOCK OF GAMES (2018+), ESTIMATED) ...............................................................624.7. GAME MANAGEMENT 2016 ......................................................................................634.8. GAME MANAGEMENT 2017 ......................................................................................644.9. FISHERY AND AQUACULTURE PRODUCTION 2016 .............................................654.10. FISHERY AND AQUACULTURE PRODUCTION 2017 ...........................................65
5. EXTERNAL, TRADE ..........................................................................................................675.1. EXPORTS AND IMPORTS BY MAIN COMMODITY GROUPS ...............................695.2. EXTERNAL TRADE BY COMMODITY GROUPS ....................................................705.3. EXPORTS BY COMMODITY GROUPS ......................................................................715.4. IMPORTS BY COMMODITY GROUPS ......................................................................725.5. EXPORTS OF MAIN AGRICULTURAL AND FOOD-INDUSTRIAL PRODUCTS ..735.6. IMPORTS OF MAIN AGRICULTURAL AND FOOD-INDUSTRIAL PRODUCTS ..745.7. EXPORT TO MAIN PARTNER COUNTRIES..............................................................755.8. IMPORT FROM MAIN PARTNER COUNTRIES ........................................................76
6. COUNTY DATA ....................................................................................................................776.1. LAND AREA BY REGIONS 31ST MAY 2016 (1/2) ......................................................796.1. LAND AREA BY REGIONS 31ST MAY 2016 (2/2) ......................................................806.2. LAND AREA BY REGIONS 31ST MAY 2017 (1/2) ......................................................816.2. LAND AREA BY REGIONS 31ST MAY 2017 (2/2) ......................................................826.3. PRODUCTION OF WHEAT BY REGIONS 2016 ........................................................836.4. PRODUCTION OF BARLEY BY REGIONS 2016 ......................................................846.5. PRODUCTION OF MAIZE BY REGIONS 2016 .........................................................856.6. PRODUCTION OF SUGAR-BEET BY REGIONS 2016 .............................................866.7. PRODUCTION OF SUNFLOWER SEED BY REGIONS 2016 ...................................876.8. PRODUCTION OF POTATOES BY REGIONS 2016 ..................................................886.9. PRODUCTION OF WHEAT BY REGIONS 2017 ........................................................896.10. PRODUCTION OF BARLEY BY REGIONS 2017 ....................................................906.11. PRODUCTION OF MAIZE BY REGIONS 2017........................................................916.12. PRODUCTION OF SUGAR-BEET BY REGIONS 2017 ...........................................926.13. PRODUCTION OF SUNFLOWER SEED BY REGIONS 2017 .................................936.14. PRODUCTION OF POTATOES BY REGIONS 2017 ................................................946.15. PRODUCTION OF FRUIT AND GRAPES BY REGIONS ........................................956.16. CATTLE AND PIG STOCK BY REGIONS 1ST DECEMBER 2016 ...........................966.17. CATTLE AND PIG STOCK BY REGIONS 1ST DECEMBER 2017 ...........................976.18. SHEEP AND CHICKEN STOCK BY REGIONS 1ST DECEMBER 2016 ..................986.19. SHEEP AND CHICKEN STOCK BY REGIONS 1ST DECEMBER 2017 ..................996.20. LIVESTOCK DENSITY .............................................................................................100

5
7. INTERNATIONAL DATA .................................................................................................1017.1. PRODUCTION OF CEREALS ....................................................................................1037.2. PRODUCTION OF WHEAT ........................................................................................1047.3. PRODUCTION OF BARLEY ......................................................................................1057.4. PRODUCTION OF RYE ..............................................................................................1067.5. PRODUCTION OF OATS ............................................................................................1077.6. PRODUCTION OF MAIZE .........................................................................................1087.7. PRODUCTION OF RICE, PADDY .............................................................................1097.8. PRODUCTION OF SUGAR-BEET .............................................................................1107.9. PRODUCTION OF SUNFLOWER SEEDS ................................................................1117.10. PRODUCTION OF RAPE SEED ...............................................................................1127.11. PRODUCTION OF POTATOES ................................................................................1137.12. TOTAL PRODUCTION OF VEGETABLES .............................................................1147.13. PRODUCTION OF APPLE ........................................................................................1157.14. PRODUCTION OF GRAPES ....................................................................................1167.15. CATTLE ......................................................................................................................1177.16. PIGS ............................................................................................................................1187.17. SHEEP .........................................................................................................................1197.18. PIGMEAT PRODUCTION .........................................................................................1207.19. BEEF AND VEAL PRODUCTION ...........................................................................1217.20. MILK PRODUCTION ................................................................................................1227.21. EMPLOYMENT .........................................................................................................1237.22. PRODUCER PRICE INDICES, NOMINAL VALUE................................................1247.23. INPUT PRICE INDICES, NOMINAL VALUE .........................................................1257.24. PRODUCER PRICE INDICES, NOMINAL VALUE................................................1267.25. PURCHASING PRICE INDEX OF AGRICULTURAL GOOD AND
SERVICES, NOMINAL VALUE................................................................................127


7
The publication provides information on the results achieved in 2017 in agriculture, forestry and food industry. We assured the comparability of time-series in connection with the pocket-books published in the recent years.
Besides the national and branch indicators and data, the principal agricultural data are also given in details by counties.
The international data are suitable to demonstrate the main trends.
The published data are compiled on the basis of the publications of the Central Statistical Office(KSH),theNationalGameManagementDatabase(OVA),theNationalFoodChainSafetyOffice(NÉBIH),EUROSTAT,theFoodandAgriculturalOrganization(FAO)andtheResearchInstitute of Agricultural Economics.

8
EXPLANATION OF SYMBOLS
.. = data not available
... =confidentialdataclosedwithdatasecuritybarriers
- = no data
0 = data cannot be expressed, being smaller than the unit applied
+) = preliminary estimate
NOTE: Data for the year 2017 are preliminary, therefore they may later change.

1. SUMMARY DATA OF AGRICULTURAL BRANCHES


11
1.1. NUMBER OF PERSONS EMPLOYEDa)
Denomination2014 2015 2016 2017 2017
years thousands personIndustries, total 3,892.8 4,100.8 4,210.5 4,351.6 4,421.4
Agriculture,forestry,fishery 184.6 189.6 203.2 217.0 220.0Of which: plant production, animal husbandry, farming and connecting services
161.4 165.1 176.8 191.5 194.8
Forestry 21.9 23.4 24.6 23.6 23.2Fishery 1.3 1.1 1.8 1.9 2.0Manufacture of food, beverages and tobacco products 130.2 143.0 140.3 143.8 145.9
Together 314.8 332.6 343.6 360.8 365.9Percentage share, percent
Industries, total 100.0 100.0 100.0 100.0 100.0
Agriculture,forestry,fishery 4.7 4.6 4.8 5.0 5.0Of which: plant production, animal husbandry, farming and connecting services
4.1 4.0 4.2 4.4 4.4
Forestry 0.6 0.6 0.6 0.5 0.5Fishery 0.034 0.028 0.043 0.043 0.045Manufacture of food, beverages and tobacco products 3.3 3.5 3.3 3.3 3.3
Together 8.1 8.1 8.2 8.3 8.3
a) Due to the high sampling error, the data between 2.5-4.9 thousand persons should be treated with reservation, and the data below the 2.5 thousand person should be disregarded. Source:HungarianCentralStatisticalOffice

12
Denomination2011 2013 2014 2015 2016+)
at current basic pricesOutput, billion HUF
National economy, totala) 58,300.9 60,873.4 65,157.0 68,303.3 70,257.5Agricultureandfishery 2,531.1 2,696.1 2,824.0 2,824.3 2,943.7Forestry 130.9 133.9 138.6 151.3 155.5Food and tobacco industry 2,910.1 3,069.5 3,040.3 3,124.7 3,247.6Together 5,572.0 5,899.5 6,002.9 6,100.3 6,346.8
Percentage distribution percentNational economy, total 100.0 100.0 100.0 100.0 100.0Agricultureandfishery 4.3 4.4 4.3 4.1 4.2Forestry 0.2 0.2 0.2 0.2 0.2Food and tobacco industry 5.0 5.0 4.7 4.6 4.6Together 9.6 9.7 9.2 8.9 9.0
Gross value added (GVA), billion HUFNational economy, totala) 24,191.3 25,519.4 27,494.0 28,823.4 29,943.4Agricultureandfishery 1,045.9 1,105.8 1,231.9 1,207.2 1,245.9Forestry 60.7 59.4 60.5 66.3 71.3Food and tobacco industry 536.6 597.6 642.8 647.7 672.2Together 1,643.3 1,762.8 1,935.2 1,921.2 1,989.4
Percentage distribution, percentNational economy, total 100.0 100.0 100.0 100.0 100.0Agricultureandfishery 4.3 4.3 4.5 4.2 4.2Forestry 0.3 0.2 0.2 0.2 0.2Food and tobacco industry 2.2 2.3 2.3 2.2 2.2Together 6.8 6.9 7.0 6.7 6.6
a) (On based price) total sectors. Source:HungarianCentralStatisticalOffice
1.2. GROSS OUTPUT AND GROSS VALUE ADDED BY BRANCHES

13
Branches2013 2014 2015 2016 2017+)
at current prices, million HUF
Investments totalNational economy, total 3,824,750 4,649,382 5,104,114 4,302,682 5,217,362Agriculture 194,330 236,191 181,620 151,284 174,969
Production of non-perennial corps 64,562 90,361 59,958 51,543 65,030
Production perennial crops 6,324 3,819 6,726 2,690 3,233Production of plant propa-gating material 990 1,247 2,108 1,447 2,348
Animal husbandry 109,208 123,372 100,956 86,183 91,380Mixed farming 1,932 7,111 2,579 1,051 1,430Agricultural after-harvest service 11,230 10,218 9,187 8,310 11,483
Wildlife management, wildlife management service 83 64 106 61 65
Forestry 9,535 11,083 11,804 11,342 10,950Forestry, other forestry activity 726 1,032 2,026 2,174 984
Logging 7,978 9,108 8,857 7,536 8,768Collecting of other self-sown forest product .. .. .. .. ..
Forestry service 831 941 906 1,630 1,195Fishery 1,009 1,684 2,160 469 1,146
Fishery 457 642 942 105 477Fish farming 552 1,042 1,218 365 669
Food industry 113,667 155,055 129,575 185,660 197,756Together 318,540 404,014 325,159 348,756 384,822
Construction investmentsNational economy, total 1,880,190 2,265,743 2,489,450 1,720,677 2,269,492Agriculture 69,732 61,807 48,795 33,662 34,972
Production of non-perennial corps 17,032 22,121 15,127 11,736 12,759
Production perennial crops 2,687 770 586 727 420Production of plant propa-gating material 521 310 446 704 326
Animal husbandry 46,349 33,450 30,380 18,972 19,848Mixed farming 482 2,674 336 212 229Agricultural after-harvest service 2,647 2,469 1,888 1,300 1,378
Wildlife management, wild-life management service 15 12 31 12 13
a) Data of enterprises with more than 4 employees and full scale data of the administration social security and non-profitorganisations. Source:HungarianCentralStatisticalOffice
1.3. INVESTMENTS OUTLAY BY BRANCHESa) (1/2)

14
1.3. INVESTMENTS OUTLAY BY BRANCHESa) (2/2)
Branches2013 2014 2015 2016 2017+)
at current prices, million HUF
Construction investmentsForestry 5,373 6,377 7,114 5,342 5,090
Forestry, other forestry activity 372 416 1,469 731 248
Logging 4,864 5,899 5,617 4,468 4,683Collecting of other self-sown forest product .. .. .. .. ..
Forestry service 136 62 28 142 160Fishery 727 983 840 125 605
Fishery 324 476 515 64 288Fish farming 403 506 325 61 316
Food industry 38,393 44,596 37,605 72,342 66,170Together 114,225 113,762 94,354 111,471 106,837
Machinery investmentsNational economy, total 1,893,304 2,331,115 2,563,613 2,528,672 2,898,517Agriculture 79,515 126,379 85,750 68,501 93,286
Production of non-perennial corps 39,233 59,278 38,326 32,898 43,079
Production perennial crops 2,822 2,321 5,503 1,134 2,132Production of plant propagating material 391 837 1,561 630 1,806
Animal husbandry 28,530 53,840 32,228 26,791 36,256Mixed farming 794 3,035 1,335 623 946Agricultural after-harvest service 7,681 7,021 6,729 6,383 9,020
Wildlife management, wildlife management service 63 47 69 42 47
Forestry 4,030 4,566 4,542 5,931 5,653Forestry, other forestry activity 339 603 459 1,406 722
Logging 3,013 3,097 3,191 3,037 4,009Collecting of other self-sown forest product .. .. .. .. ..
Forestry service 678 864 878 1,486 919Fishery 261 692 1,316 344 487
Fishery 113 166 427 40 142Fish farming 148 526 889 304 345
Food industry 73,738 108,962 90,506 111,153 130,335Together 157,543 240,600 182,114 185,930 229,761
a) Data of enterprises with more than 4 employees and full scale data of the administration social security and non-profitorganisations. Source:HungarianCentralStatisticalOffice

15
1.4. AVERAGE MONTHLY GROSS AND NET EARNINGS OF EMPLOYEESa)
Denomination 2013 2014 2015 2016 2017+)
Gross earnings, HUFNational economy 230,714 237,695 247,924 263,171 297,017Agriculture, hunting, forestry and fishing 171,679 180,251 189,136 204,385 230,638
Of Which: plant production, animal husbandry, farming and connecting services
177,754 189,027 198,514 212,996 236,845
Forestry 147,590 146,227 151,581 169,084 201,827Fishery 146,319 149,570 156,358 164,033 183,518Manufacture of food products, beverages and tobacco products 196,392 210,821 218,440 231,360 259,094
Net earnings, HUFNational economy 151,118 155,690 162,391 175,009 197,516Agriculture, hunting, forestry and fishing 112,450 118,065 123,885 135,917 153,374
Of Which: plant production, animal husbandry, farming and connecting services
116,429 123,813 130,028 141,643 157,502
Forestry 96,672 95,778 99,287 112,442 134,213Fishery 95,849 97,969 102,420 109,089 122,040Manufacture of food products, beverages and tobacco products 128,635 138,087 143,079 153,855 172,298
a)Dataofeconomicorganizationswithmorethan5employees,aswellasdataofstateownedandnon-profitorganizations regardless their employment. Source:HungarianCentralStatisticalOffice

16

2. AGRICULTURE


19
2.1. AREA BY BRANCHES OF CULTIVATION (31ST MAY)
DenominationAverage of 2008-2012 2013 2014 2015 2016 2017+)
thousand hectares
Arable land 4,394 4,326 4,331 4,332 4,332 4,334Garden 87 81 80 80 65 47Orchard 95 92 93 92 93 93Vineyard 82 82 81 81 76 73Grassland 859 759 761 761 783 804Agricultural area 5,518 5,340 5,346 5,346 5,349 5,352Forest 1,911 1,934 1,938 1,940 1,941 1,940Reeds 63 65 65 65 49 42Fish-pond 36 37 37 36 37 37Productive land area 7,528 7,376 7,386 7,388 7,376 7,371Uncultivated land area 1,775 1,927 1,917 1,916 1,927 1,933Land area, total 9,303 9,303 9,303 9,303 9,303 9,303
Source:HungarianCentralStatisticalOffice

20
Size group, hectareNumber of organizations Size of land area
hectare2016 2017+) 2016 2017+)
Productive land arealess than 10 2,143 2,151 8,703 8,75810.1-50.0 1,993 2,005 50,897 50,96550.1-100.0 952 928 69,213 66,349
100.1-200.0 973 998 139,833 145,437200.1-300.0 583 574 145,074 144,403300.1-500.0 570 582 225,295 230,333500.1-1,000.0 683 687 490,107 502,415
1,000.1-2,500.0 478 414 652,168 614,1512,500.1-3,000.0 24 25 64,369 67,4163,000.1-3,500.0 16 11 51,194 35,8183,500.1-4,000.0 6 6 21,854 22,3464,000.1-4,500.0 8 5 34,011 21,2984,500.1-5,000.0 5 1 22,668 4,549more than 5,000.1 47 49 1,234,125 1,239,788
Total 8,481 8,436 3,209,511 3,154,026Arable land
less than 10 1,894 1,946 7,165 7,26110.1-50.0 1,379 1,373 34,550 34,53750.1-100.0 679 657 49,920 47,910
100.1-200.0 733 780 105,997 112,017200.1-300.0 468 479 116,895 119,203300.1-500.0 471 501 185,315 198,788500.1-1,000.0 623 633 453,678 463,611
1,000.1-2,500.0 390 377 535,370 499,9982,500.1-3,000.0 13 11 36,295 30,2483,000.1-3,500.0 7 4 22,193 12,5163,500.1-4,000.0 1 2 3,684 7,3094,000.1-4,500.0 10 6 42,770 25,4764,500.1-5,000.0 3 1 14,035 4,743More than 5,000.1 8 10 66,022 81,665
Total 6,679 6,780 1,673,886 1,645,282
Source:HungarianCentralStatisticalOffice
2.2. PRODUCTIVE AND ARABLE LAND OF ECONOMIC ORGANIZATIONS BY SIZE GROUP

21
Size group, hectareNumber of organizations Size of vineyard
and orchard area, hectare2016 2017 2016 2017
Vineyardless than 10 427 423 1,500 1,48910.1-50.0 225 222 5,219 5,05350.1-100.0 45 41 3,110 2,671
100.1-200.0 18 21 2,446 2,747200.1-300.0 6 6 1,520 1,447300.1- 2 2 789 769
Total 723 711 14,584 14,176Orchard
less than 10 699 756 2,027 2,02810.1-50.0 285 270 6,347 6,13250.1-100.0 64 63 4,365 4,315
100.1-200.0 27 28 3,834 3,892200.1-300.0 10 8 2,365 1,813300.1- 2 3 863 1,198
Total 1,087 1,128 19,801 19,378
Source:HungarianCentralStatisticalOffice
2.3. VINEYARD AND ORCHARD AREA OF ECONOMIC ORGANIZATIONS BY SIZE GROUP

22
Denomination2013 2014 2015 2016 2017+)
year, percent
Agricultural enterprises 39.8 38.1 38.2 36.7 36.1Private farmers 33.1 33.7 35.1 35.5 36.7Areanotidentifiablea) 27.1 28.2 26.7 27.9 27.2Of which: Non-agricultural areab) 12.1 12.0 11.1 17.9 17.8Total 100.0 100.0 100.0 100.0 100.0
a) It includes area used for non-agricultural purposes. b)Non-agricultural,non-profit,communalareashavebeenincluded. Source:HungarianCentralStatisticalOffice
2.5. MAIN ENERGY SOURCES IN FORESTRY AND AGRICULTURE
Denomination2012 2013 2014 2015 2016
year
Coal (thousand tons) 1.0 2.0 0.0 1.0 1.0Natural gas (million cu. m.) 116.0 130.0 180.0 136.0 178.0Solid biomass (thousand tonnes)a) 39.0 31.0 32.0 34.0 51.0Petrol (thousand tons) 4.0 3.0 3.0 3.0 4.0Diesel oil (thousand tons) 207.0 298.0 301.0 322.0 334.0Heating oil (thousand tons) 1.0 1.0 1.0 1.0 0.1Electricity (million kWh) 782.0 719.0 815.0 865.0 905.0
a) Estimation. Source: National Environment and Energy Centre, Hungarian Energy and Public Utility Regulatory Authority
2.4. LAND USE BY LEGAL FORMS (31ST MAY)

23
YearNitrogenous Phosphorous Potassium Total
fertilizer in active ingredientsSale, thousand tons
2013 343 76 71 4902014 327 82 78 4872015 358 81 80 5202016 366 92 97 5552017 415 113 111 639
kg per hectare of agricultural area2013 64 14 13 922014 61 15 15 912015 67 15 15 972016 68 17 18 1042017 78 21 21 119
a) Direct sales of organizations dealing with the trade of agricultural goods to agriculture and forestry. Source:HungarianCentralStatisticalOffice,ResearchInstitutionofAgriculturalEconomics
2.6. SALE AND USE OF FERTILIZERSa)

24
Year TotalOf which:
arable land orchards vineyards grassland
Fertilized area, thousand hectares2013 1,524.7 1,506.6 10.7 1.8 5.62014 1,505.9 1,488.0 10.4 1.5 6.02015 1,401.5 1,384.3 9.9 1.7 5.62016 1,380.4 1,361.7 9.5 2.7 6.42017 1,342.9 1,325.4 8.9 2.5 6.0
Used fertilizer in active ingredients, thousand tons2013 239.9 237.7 1.5 0.3 0.42014 246.7 244.5 1.4 0.3 0.52015 232.5 230.4 1.3 0.3 0.42016 237.2 234.8 1.5 0.4 0.52017 240.0 237.6 1.4 0.5 0.5
kg per hectare fertilized area2013 157.3 157.8 138.9 147.3 76.82014 163.8 164.3 139.9 163.3 85.42015 165.9 166.4 136.5 184.7 71.82016 171.8 172.5 152.8 147.8 78.62017 178.7 179.3 157.8 185.9 75.0
Source:HungarianCentralStatisticalOffice
2.7. USE OF FERTILIZERS BY AGRICULTURAL ENTERPRISES

25
Year TotalOf which:
arable land orchard vineyard
Manured area, hectare2014 137,134 130,425 1,533 8022015 136,530 130,216 1,100 8122016 133,824 128,749 1,331 738
Used manure, thousand tons2014 2,859 2,803 22 172015 3,064 3,006 16 172016 3,100 3,027 20 15
Manure per hectare, tons2014 21 21 15 222015 22 23 15 202016 23 24 15 20
Source:HungarianCentralStatisticalOffice
2.8. MANURING OF AGRICULTURAL ENTERPRISESa) (2/2)
Year Denomination Total Orchard Vineyard
Area with organic fertilizer, hectare
2016Total solid FYM 99,535 1,218 696Total slurry 41,755 175 54
2017Total solid FYM 101,318 1,115 390Total slurry 33,947 57 -
Quantity of used organic fertilizer, tonnes 2016 Total solid FYM 2,133,308 17,062 12,7052017 Total solid FYM 2,031,083 11,879 9,558
Quantity of used organic fertilizer, m3
2016 Total slurry 2,493,494 7,459 2362017 Total slurry 2,003,152 749 -
a) The organic fertilizer had divided into solid FYM and slurry from 2016, data is not available in tonnes. Source:HungarianCentralStatisticalOffice
2.8. MANURING OF AGRICULTURAL ENTERPRISES (1/2)
26
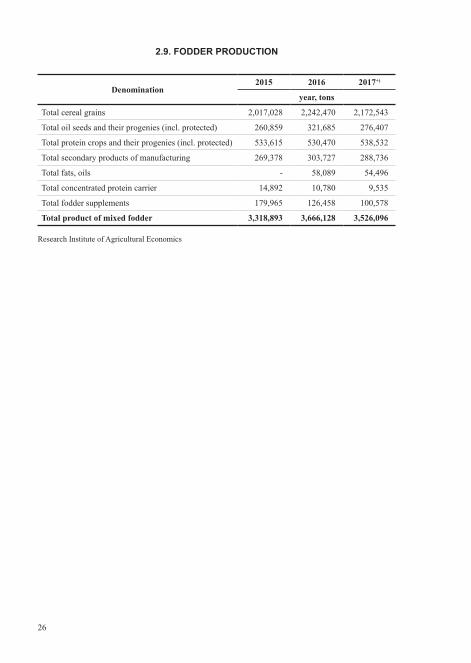
Denomination2015 2016 2017+)
year, tons
Total cereal grains 2,017,028 2,242,470 2,172,543
Total oil seeds and their progenies (incl. protected) 260,859 321,685 276,407
Total protein crops and their progenies (incl. protected) 533,615 530,470 538,532
Total secondary products of manufacturing 269,378 303,727 288,736
Total fats, oils - 58,089 54,496
Total concentrated protein carrier 14,892 10,780 9,535
Total fodder supplements 179,965 126,458 100,578
Total product of mixed fodder 3,318,893 3,666,128 3,526,096
Research Institute of Agricultural Economics
2.9. FODDER PRODUCTION

27
2.10. SALES OF PESTICIDESa)
YearTotal Insecticide Fungicide Herbicide Other
chemicalsSale directly to farmers
Sale, thousand tons 2013 23,392 4,832 4,717 9,115 4,7282014 29,093 6,385 5,744 9,116 7,8472015 27,528 5,491 5,699 9,121 7,2152016 27,541 4,834 5,418 9,607 7,7262017 29,558 5,024 5,446 9,325 9,762
Sale, million HUF2013 90,732 15,801 22,775 44,334 7,8222014 105,897 20,729 30,131 45,351 9,6852015 104,912 17,753 27,416 49,531 10,2112016 106,858 18,190 30,992 45,893 10,6282017 108,791 18,332 29,846 50,270 10,342
a) Direct sales of agricultural production equipment to end users. Source: Research Institute of Agricultural Economics

28
Denomination Average of 2008-2012 2013 2014 2015 2016 2017+)
Harvested area, thousand hectaresWheat 1,067 1,090 1,113 1,029 1,044 966Rye 38 35 34 38 27 26Barley 294 262 288 296 313 268Oats 54 51 51 45 36 37Maize 1,174 1,243 1,191 1,146 1,012 989Sugar-beet 14 19 15 16 16 19Sunflowerseed 556 597 594 612 630 695Rape seed 233 198 214 221 257 303Lucerne hay 133 129 123 134 190 194Potatoes 23 21 21 19 16 15
Total production, thousand tonsWheat 4,382 5,058 5,262 5,331 5,603 5,246Rye 83 108 96 104 84 87Barley 1,092 1,062 1,275 1,409 1,594 1,416Oats 135 132 136 129 104 95Maize 7,233 6,756 9,315 6,633 8,730 6,739Sugar-beet 773 991 1,067 911 1,121 1,172Sunflowerseed 1,277 1,484 1,597 1,557 1,875 2,022Rape seed 541 533 700 590 925 932Lucerne hay 598 571 595 596 973 971Potatoes 505 487 567 452 429 341
Yields, kg per hectareWheat 4,110 4,640 4,730 5,180 5,370 5,430Rye 2,210 3,070 2,860 2,760 3,090 3,290Barley 3,720 4,050 4,420 4,760 5,090 5,280Oats 2,500 2,570 2,670 2,830 2,850 2,540Maize 6,160 5,440 7,820 5,790 8,630 6,820Sugar-beet 53,710 52,660 69,200 58,720 70,090 62,830Sunflowerseed 2,290 2,490 2,690 2,550 2,980 2,910Rape seed 2,320 2,690 3,270 2,680 3,600 3,080Lucerne hay 4,500 4,410 4,830 4,430 5,110 5,020Potatoes 22,149 21,690 25,580 22,530 24,970 21,490
Source:HungarianCentralStatisticalOffice
2.11. PRODUCTION OF MAIN CROPS
29
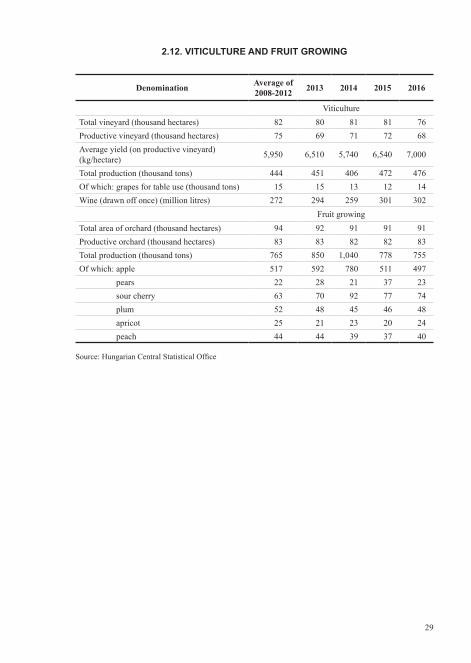
Denomination Average of 2008-2012 2013 2014 2015 2016
ViticultureTotal vineyard (thousand hectares) 82 80 81 81 76Productive vineyard (thousand hectares) 75 69 71 72 68Average yield (on productive vineyard) (kg/hectare) 5,950 6,510 5,740 6,540 7,000
Total production (thousand tons) 444 451 406 472 476Of which: grapes for table use (thousand tons) 15 15 13 12 14Wine (drawn off once) (million litres) 272 294 259 301 302
Fruit growing Total area of orchard (thousand hectares) 94 92 91 91 91Productive orchard (thousand hectares) 83 83 82 82 83Total production (thousand tons) 765 850 1,040 778 755Of which: apple 517 592 780 511 497
pears 22 28 21 37 23sour cherry 63 70 92 77 74plum 52 48 45 46 48apricot 25 21 23 20 24peach 44 44 39 37 40
Source:HungarianCentralStatisticalOffice
2.12. VITICULTURE AND FRUIT GROWING

30
Denomination Average of 2008-2012
2013 2014 2015 2016 2017
1st December, thousand pieces
Farms, totalCattle, total 708 782 802 821 852 870of which: cows 323 345 359 368 383 395Pigs, total 3,166 3,004 3,136 3,124 2,907 2,870of which: breeding sows 217 190 200 197 177 172Sheep, total 1,189 1,214 1,185 1,190 1,141 1,146Hen 31,615 29,474 30,521 32,432 32,027 31,844
CorporationsCattle, total 462 489 500 515 512 521of which: cows 212 218 229 232 228 234Pigs, total 2,234 2,201 2,328 2,304 2,202 2,202of which: breeding sows 156 143 149 147 136 133Sheep, total 153 159 151 150 156 148Hen 19,026 17,130 19,235 20,584 21,797 21,200
Source:HungarianCentralStatisticalOffice
2.13. LIVESTOCK

31
Denomination Average of 2008-2012 2013 2014 2015 2016 2017+)
Animals for slaughter, total (thousand tons) 1,355 1,339 1,414 1,507 1,575 1,501
Of which: cattle for slaughter 81 77 80 87 92 89pigs for slaughter 564 523 557 587 596 590sheep for slaughter 19 18 19 19 19 20poultry for slaughter 664 688 724 783 830 772
Fish (thousand tons) 20 19 19 19 20 20Cow milk production (million litres) 1,715 1,726 1,826 1,890 1,868 1,868Hen eggs production (million pieces) 2,644 2,469 2,420 2,554 2,527 2,413Wool (tons) 4,148 3,843 3,887 3,840 3,739 3,739
Source:HungarianCentralStatisticalOffice
2.14. PRODUCTION OF ANIMALS FOR SLAUGHTER AND ANIMAL PRODUCTS

32
Denomination 2013 2014 2015 2016 2017+)
year, kg
Cattle for slaughterper cow 226 226 238 245 228per capita 7.8 8.1 8.8 9.4 9.1
Pigs for slaughterper sow 2,682 2,799 2,920 3,222 3,371per capita 52.8 56.4 59.6 60.6 60.2
Sheep for slaughterper capita 1.8 1.9 1.9 1.9 2.0
Poultry for slaughterper capita 69.4 73.3 79.4 84.4 78.8
Milk production. litresper cow 6,933 7,248 7,501 7,562 7,624per capita 174.2 184.9 191.8 190.0 190.7
Eggs production, piecesper hen 208 214 218 225 225per capita 249 245 259 257 246
Wool productionper sheep 3.6 3.5 3.6 3.5 3.6per capita 0.4 0.4 0.4 0.4 0.4
Source:HungarianCentralStatisticalOffice
2.15. PRINCIPAL INDICATORS OF ANIMAL HUSBANDRY

33
previous year = 100.0
Denomination 2013 2014 2015 2016 2017+)
Producer price index 92.2 93.9 100.4 96.2 105.6Price indices of inputs 102.1 97.1 99.5 98.0 100.1Intermediate consumption 102.2 96.4 99.0 97.4 99.6
Seeds 103.3 102.0 109.5 97.5 96.9Energy 97.7 96.3 89.4 93.9 105.7Fertilisers 95.9 96.1 102.6 88.8 93.4Plant protection products 103.0 101.6 102.4 101.4 100.4Fodder 105.3 89.4 97.3 98.7 96.8
Maintenance of machines 101.9 101.0 101.4 102.0 102.6Maintenance of buildings 101.5 101.9 103.3 103.8 105.5Veterinary products 104.9 101.3 103.3 101.6 101.9Other costs 107.1 102.4 101.6 100.9 101.5Agricultural investments 101.6 102.1 102.8 101.7 103.0
Machines 101.4 102.6 103.1 100.7 100.6Buildings 101.7 102.0 102.6 103.2 105.9
Terms of tradea) 90.3 96.7 100.9 98.2 105.5
a) According to EUROSTAT methodology terms of trade is equal the producer price index divided by the input price index. Sources:HungarianCentralStatisticalOffice
2.16. TERMS OF TRADE

34
Goods 2013 2014 2015 2016 2017+)
2005 = 100.0Plant cultivation and horticultural products 200.0 181.6 193.2 182.2 188.2
Cereals 224.5 204.5 210.9 193.6 203.1Vegetables 173.7 169.7 180.8 175.9 175.4Fruitsa) 168.9 138.0 164.3 157.3 188.0
Live animals and animal products 156.2 154.5 141.5 140.7 153.8Agricultural products total 181.0 169.9 170.6 164.1 173.3
Previous year = 100.0Plant cultivation and horticultural products 86.3 90.8 106.4 94.3 103.3
Cereals 80.3 91.1 103.1 91.8 104.9Vegetables 109.0 97.7 106.5 97.3 99.7Fruitsa) 95.2 81.7 119.1 95.7 119.5
Live animals and animal products 103.4 98.9 91.6 99.4 109.3Agricultural products total 92.2 93.9 100.4 96.2 105.6
a) Grape included. Source:HungarianCentralStatisticalOffice
2.17. PRODUCER-PROCUREMENT PRICE INDICES

35
Goods 2013 2014 2015 2016 2017+)
2005 = 100.0 Plant cultivation and horticultural products 80.4 96.9 99.7 117.1 105.8
Cereals 81.5 99.5 101.4 125.2 111.7Vegetables 65.9 72.9 73.8 75.0 83.1Fruits 103.0 108.2 97.6 107.8 94.9
Live animals and animal products 95.4 102.2 108.0 113.1 108.7Agricultural products total 90.1 102.9 107.3 118.9 110.5
Previous year = 100.0Plant cultivation and horticultural products 117.3 120.5 102.9 117.4 90.4
Cereals 117.2 122.1 101.9 123.5 89.2Vegetables 96.1 110.7 101.2 101.7 110.7Fruits 123.4 105.1 90.2 110.4 88.1
Live animals and animal products 98.0 107.1 105.7 104.7 96.1Agricultural products total 106.9 114.2 104.3 110.8 92.9
Source:HungarianCentralStatisticalOffice
2.18. PROCUREMENT VOLUME INDICES OF AGRICULTURAL PRODUCT

36
Denomination 2013 2014 2015 2016 2017+)
year, thousand tons
Wheat 2,009 1,984 2,005 2,901 2,592Barley 276 316 528 558 514Maize 2,246 3,217 3,216 3,622 3,166Sunflowerseed 585 686 828 770 704Potatoes 15 17 21 18 18Onions, dry 9 11 7 7 6Green peas (shelled weight) 35 61 61 53 56Tomatoes 44 57 74 69 160Green pepper 31 33 34 34 40Apple 268 370 216 254 194Cattle for slaughtera) 27 23 20 24 23Pigs for slaughterb) 395 442 474 496 476Sheep for slaughter 5 5 5 6 6Poultry for slaughter 464 484 502 539 502Hen eggs (million pieces) 394 363 250 273 239Cow milk (million litres) 1,230 1,324 1,450 1,473 1,488
a) Calf included. b) Gilt and piglet included. Source:HungarianCentralStatisticalOffice
2.19. PROCUREMENT OF AGRICULTURAL PRODUCTS

37
Denomination 2013 2014 2015 2016 2017+)
Wheat (HUF per ton) 47,752 48,389 48,652 39,958 43,650Barley (HUF per ton) 46,559 43,167 41,891 36,731 36,142Maize (HUF per ton) 48,792 41,498 42,494 41,677 43,662Sunflowerseed(HUFperton) 99,804 96,261 112,654 105,832 100,006Rape seed (HUF per ton) 113,564 102,216 113,049 109,921 111,856Potatoes (HUF per ton) 86,967 63,095 66,948 80,372 69,731White cabbage (HUF per kg) 80 56 77 66 66Onions, dry (HUF per kg) 78 62 71 64 63Green beans (HUF per kg) 78 76 76 74 73Green peas (shelled weight), (HUF per kg) 90 90 86 87 86Tomatoes (HUF per kg) 96 93 87 92 64Green pepper (HUF per kg) 193 191 203 221 207Apple (HUF per kg) 34 17 40 27 61Pears (HUF per kg) 79 114 79 105 116Apricots (HUF per kg) 118 165 186 162 121Peaches (HUF per kg) 61 68 75 81 67Wine-grapes (HUF per kg) 112 92 98 90 90Pigs for slaughtera) (HUF per kg) 400 386 346 364 403Cattle for slaughterb) (HUF per kg) 431 416 414 399 408Poultry for slaughter (HUF per kg) 338 319 305 297 292Cow milk (HUF per litre) 99 106 82 76 96Hen eggs for consumption (HUF per piece) 17 18 19 18 20
a) Without gilt and piglet. b) Without calf for slaughter. Source:HungarianCentralStatisticalOffice
2.20. AVERAGE PRODUCER-PROCUREMENT PRICES OF MAIN PRODUCTS

38
Denomination 2013 2014 2015 2016 2017+)
HUF per kg
Plant cultivation productsBean (dry) 955 999 1,095 1,150 1,185Pea (dry) 448 466 500 644 662Lentil (for consumption) 599 641 659 770 795Poppy seed (for consumption) 1,251 1,414 1,413 1,437 1,464Potato (for consumption) 173 149 160 163 161
VegetablesWhite cabbage 173 150 200 180 181Kohlrabi 428 446 518 518 517Carrot 219 204 263 268 252Parsley root 501 513 666 654 623Radish 495 574 647 634 651Onion 182 181 194 196 178Garlic 1,100 1,211 1,097 1,097 1,771Lettuce 513 436 438 475 488Spinach 624 666 631 816 871Cucumber 333 315 335 281 318Squash 229 244 274 181 189Sugary melon 209 273 290 280 257Watermelon 130 128 146 125 133Green beans 500 523 623 530 639Green peas, in the shell 394 397 491 570 527Tomato 375 452 444 426 437Sweet corn 382 335 412 389 410Mushroom (cultivated) 585 602 583 657 658Green pepper 441 447 499 420 422
a) Average offer prices. Source:HungarianCentralStatisticalOffice
2.21. AVERAGE PRODUCER-MARKET PRICESa) (1/2)
39
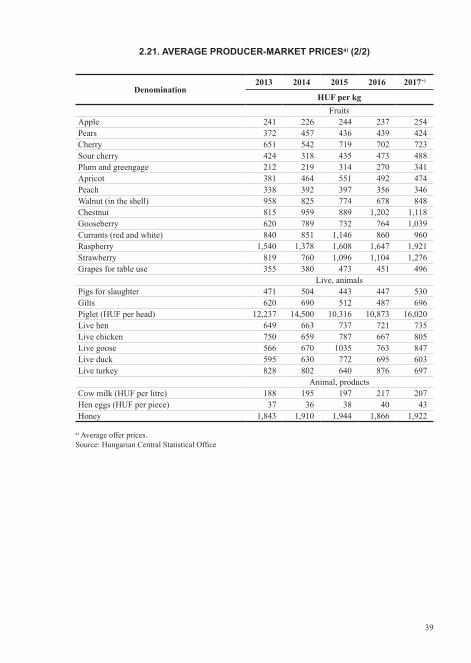
Denomination 2013 2014 2015 2016 2017+)
HUF per kgFruits
Apple 241 226 244 237 254Pears 372 457 436 439 424Cherry 651 542 719 702 723Sour cherry 424 318 435 473 488Plum and greengage 212 219 314 270 341Apricot 381 464 551 492 474Peach 338 392 397 356 346Walnut (in the shell) 958 825 774 678 848Chestnut 815 959 889 1,202 1,118Gooseberry 620 789 732 764 1,039Currants (red and white) 840 851 1,146 860 960Raspberry 1,540 1,378 1,608 1,647 1,921Strawberry 819 760 1,096 1,104 1,276Grapes for table use 355 380 473 451 496
Live, animalsPigs for slaughter 471 504 443 447 530Gilts 620 690 512 487 696Piglet (HUF per head) 12,237 14,500 10,316 10,873 16,020Live hen 649 663 737 721 735Live chicken 750 659 787 667 805Live goose 566 670 1035 763 847Live duck 595 630 772 695 603Live turkey 828 802 640 876 697
Animal, productsCow milk (HUF per litre) 188 195 197 217 207Hen eggs (HUF per piece) 37 36 38 40 43Honey 1,843 1,910 1,944 1,866 1,922
a) Average offer prices. Source:HungarianCentralStatisticalOffice
2.21. AVERAGE PRODUCER-MARKET PRICESa) (2/2)

40
Goods 2013 2014 2015 2016 2017
year, HUF
Pork, leg, without bone and hoof, kg 1,350 1,350 1,300 1,110 1,220Beef, shoulder, with bone, kg 1,790 1,800 1,810 1,840 1,910Chicken ready to cook, kg 805 812 791 779 659Sausage „Gyulai” type, kg 3,160 3,150 3,150 3,140 3,270Sausage „Bologna” type, kg 1,260 1,280 1,290 1,300 1,360Fresh eggs, 10 pieces 379 365 384 374 389Milk, pasteurized, 2,8 percent fat content, litre 234 249 230 217 216Trappista cheese, kg 1,690 1,800 1,580 1,500 1,680Sour cream 20 percent fat content 140-175 grams plastic cup, piecea) 126 135 130 128 141
Lard, 500 grams 428 387 353 331 358Fat bacon, kg 1,410 1,470 1,470 1,460 1,480Sunfloweroil,litre 496 431 453 484 489Flour prime quality, kg 167 140 135 138 137Rice unpolished, kg 295 288 303 317 318Bread, home-made type, kg 313 306 304 310 331Sugar, white granulated, kg 275 222 197 248 266Roasted coffee, ground, 200-250 g packb) 668 621 640 669 729White table wine, 1,5-2 litres bottlec) 690 613 586 576 565Beer, 0,4-0,5 litres bottled) 192 190 191 189 194Fruit or based spirit, 0,2 litres bottlee) 682 646 779 771 826Cigarettes„Sopianae”multifiltershort 19 pieces box 814 946 968 992 1,080
a) Until 2013 150-175 grams. b) Until 2015 250 grams. c) Until 2015 2 litres. d) Until 2015 0.5 litres. e) From the year 2017 not less than 30 percent alcoholic strength. Source:HungarianCentralStatisticalOffice
2.22. CONSUMER PRICES OF SELECTED GOODS
41
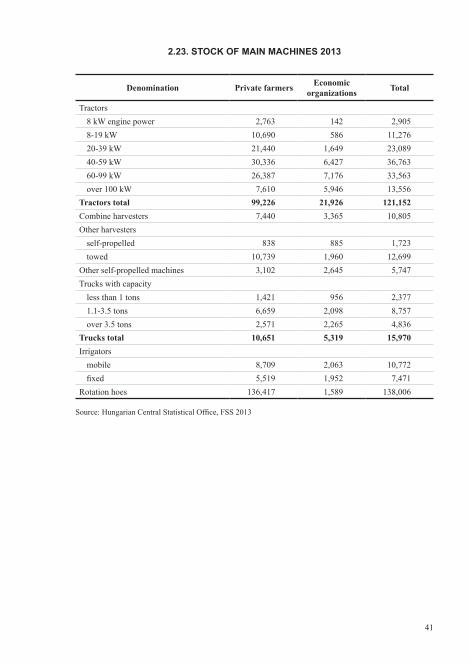
Denomination Private farmers Economic organizations Total
Tractors8 kW engine power 2,763 142 2,9058-19 kW 10,690 586 11,27620-39 kW 21,440 1,649 23,08940-59 kW 30,336 6,427 36,76360-99 kW 26,387 7,176 33,563over 100 kW 7,610 5,946 13,556
Tractors total 99,226 21,926 121,152Combine harvesters 7,440 3,365 10,805Other harvesters
self-propelled 838 885 1,723towed 10,739 1,960 12,699
Other self-propelled machines 3,102 2,645 5,747Trucks with capacity
less than 1 tons 1,421 956 2,3771.1-3.5 tons 6,659 2,098 8,757over 3.5 tons 2,571 2,265 4,836
Trucks total 10,651 5,319 15,970Irrigators
mobile 8,709 2,063 10,772fixed 5,519 1,952 7,471
Rotation hoes 136,417 1,589 138,006
Source:HungarianCentralStatisticalOffice,FSS2013
2.23. STOCK OF MAIN MACHINES 2013
42
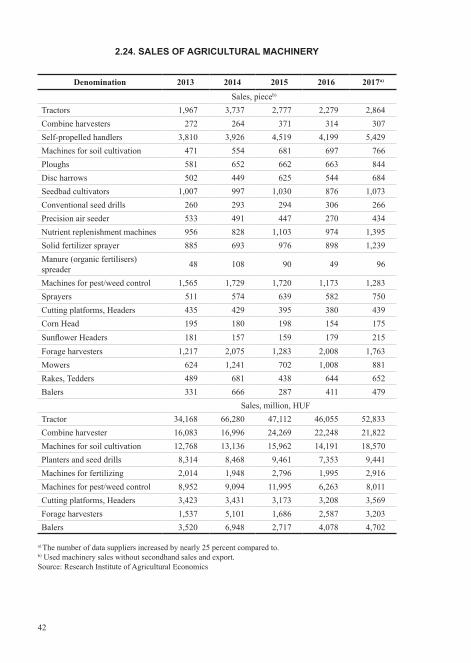
Denomination 2013 2014 2015 2016 2017a)
Sales, pieceb)
Tractors 1,967 3,737 2,777 2,279 2,864Combine harvesters 272 264 371 314 307Self-propelled handlers 3,810 3,926 4,519 4,199 5,429Machines for soil cultivation 471 554 681 697 766Ploughs 581 652 662 663 844Disc harrows 502 449 625 544 684Seedbad cultivators 1,007 997 1,030 876 1,073Conventional seed drills 260 293 294 306 266Precision air seeder 533 491 447 270 434Nutrient replenishment machines 956 828 1,103 974 1,395Solid fertilizer sprayer 885 693 976 898 1,239Manure (organic fertilisers) spreader 48 108 90 49 96
Machines for pest/weed control 1,565 1,729 1,720 1,173 1,283Sprayers 511 574 639 582 750Cutting platforms, Headers 435 429 395 380 439Corn Head 195 180 198 154 175SunflowerHeaders 181 157 159 179 215Forage harvesters 1,217 2,075 1,283 2,008 1,763Mowers 624 1,241 702 1,008 881Rakes, Tedders 489 681 438 644 652Balers 331 666 287 411 479
Sales, million, HUFTractor 34,168 66,280 47,112 46,055 52,833Combine harvester 16,083 16,996 24,269 22,248 21,822Machines for soil cultivation 12,768 13,136 15,962 14,191 18,570Planters and seed drills 8,314 8,468 9,461 7,353 9,441Machines for fertilizing 2,014 1,948 2,796 1,995 2,916Machines for pest/weed control 8,952 9,094 11,995 6,263 8,011Cutting platforms, Headers 3,423 3,431 3,173 3,208 3,569Forage harvesters 1,537 5,101 1,686 2,587 3,203Balers 3,520 6,948 2,717 4,078 4,702
a) The number of data suppliers increased by nearly 25 percent compared to.
b) Used machinery sales without secondhand sales and export. Source: Research Institute of Agricultural Economics
2.24. SALES OF AGRICULTURAL MACHINERY

43
Denomination
Current price
2013 2014 2015 2016 2017+)
million HUF
Cereals (inc. seeds) 668,082 733,183 640,968 692,499 618,356Industrial crops (inc. pulses) 263,420 284,349 304,510 379,601 380,730Forage plants 51,221 55,754 65,878 69,207 68,837Grapes, fruits 158,339 133,691 164,717 152,727 167,936Vegetables and horticultural products 177,585 198,307 233,407 222,206 218,139Potatoes (inc. seed tuber) 34,445 36,115 25,902 30,611 23,202Other crop products 11,307 13,251 16,084 14,868 14,868Crop output total 1,364,399 1,454,649 1,451,467 1,561,720 1,492,069Animals 541,550 555,881 601,722 603,686 610,800Animal products 251,330 280,033 253,912 235,113 272,001Animal output total 792,880 835,914 855,635 838,799 882,801Agricultural goods output 2,157,279 2,290,563 2,307,102 2,400,519 2,374,870Agricultural services 108,467 117,477 126,464 131,478 137,318Inseparable non-agricultural secondary activities 52,969 48,377 53,239 55,756 55,756
Agricultural output total 2,318,715 2,456,418 2,486,804 2,587,753 2,567,944Total intermediate consumption 1,456,954 1,459,129 1,478,959 1,513,335 1,505,891Gross value added at basic prices 861,760 997,288 1,007,846 1,074,417 1,062,053Net value added at basic prices 1,051,400 1,207,864 1,120,341 1,189,826 1,183,789Operating surplus / Mixed income 767,644 888,218 772,372 812,137 773,253Entrepreneurial income 665,958 783,203 672,474 701,595 665,171
Sources:HungarianCentralStatisticalOffice,ResearchInstituteofAgriculturalEconomics
2.26. AGRICULTURAL LABOUR INPUT
(Annual Working Unit)
Denomination 2013 2014 2015 2016 2017+)
Total 444,424 462,930 441,903 434,281 426,100Paid 120,820 126,766 130,936 132,265 135,300Non-paid 323,604 336,165 310,966 302,015 290,800
Sources:HungarianCentralStatisticalOffice
2.25. ECONOMIC ACCOUNTS OF AGRICULTURE

44
(previous year = 100.0)
Denomination 2013 2014 2015 2016 2017+)
’A’ index 109.85 106.70 95.37 107.04 98.63’C’ index 119.52 113.78 84.27 103.34 92.21
Sources:HungarianCentralStatisticalOffice,ResearchInstituteofAgriculturalEconomics
2.28. VOLUMEN INDICES OF AGRICULTURAL OUTPUT AND GROSS VALUE ADDED
previous year = 100.0
Denomination 2013 2014 2015 2016 2017+)
Cereals (inc. seeds) 131.4 123.3 85.4 118.4 84.5Industrial crops (inc. pulses) 118.1 115.4 94.2 130.9 103.5Forage plants 118.0 105.2 91.3 133.2 97.2Grapes. fruits 122.7 99.1 102.5 99.3 102.2Vegetables and horticultural products 100.8 111.0 107.9 101.9 97.4Potatoes (inc. seed tuber) 89.6 115.3 79.3 94.9 81.5Other crop products 148.2 101.8 107.2 108.9 100.0Crop output total 122.4 116.3 92.0 116.3 92.9Animals 97.7 105.0 106.4 101.0 95.5Animal products 100.4 105.4 104.4 96.4 99.4Animal output total 98.5 105.1 105.7 99.6 96.6Agricultural goods output 113.4 112.2 97.0 110.1 94.2Agricultural services 101.8 104.3 103.8 98.0 103.0Inseparable non-agricultural secondary activities 99.0 91.2 110.9 102.0 100.0Agricultural output total 112.5 111.4 97.6 109.3 94.8Total intermediate consumption 103.0 103.8 102.3 104.3 100.2Gross value added at basic prices 130.7 124.1 90.8 116.7 87.0
Sources:HungarianCentralStatisticalOffice,ResearchInstituteofAgriculturalEconomics
2.27. AGRICULTURAL INCOME INDICES

3. FOOD INDUSTRY

47
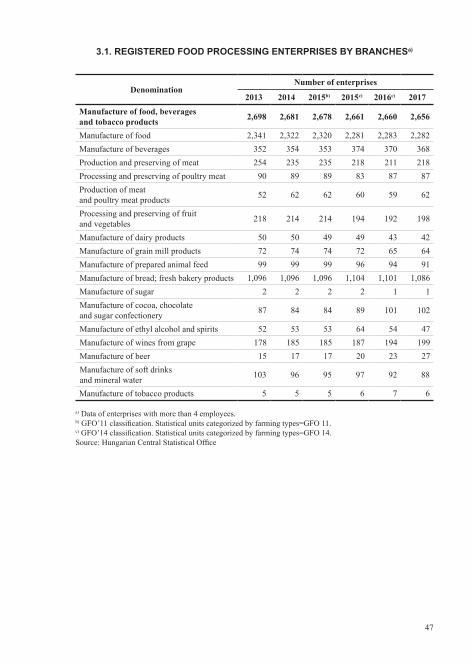
3.1. REGISTERED FOOD PROCESSING ENTERPRISES BY BRANCHESa)
DenominationNumber of enterprises
2013 2014 2015b) 2015c) 2016c) 2017Manufacture of food, beverages and tobacco products 2,698 2,681 2,678 2,661 2,660 2,656
Manufacture of food 2,341 2,322 2,320 2,281 2,283 2,282Manufacture of beverages 352 354 353 374 370 368Production and preserving of meat 254 235 235 218 211 218Processing and preserving of poultry meat 90 89 89 83 87 87Production of meat and poultry meat products 52 62 62 60 59 62
Processing and preserving of fruit and vegetables 218 214 214 194 192 198
Manufacture of dairy products 50 50 49 49 43 42Manufacture of grain mill products 72 74 74 72 65 64Manufacture of prepared animal feed 99 99 99 96 94 91Manufacture of bread; fresh bakery products 1,096 1,096 1,096 1,104 1,101 1,086Manufacture of sugar 2 2 2 2 1 1Manufacture of cocoa, chocolate and sugar confectionery 87 84 84 89 101 102
Manufacture of ethyl alcohol and spirits 52 53 53 64 54 47Manufacture of wines from grape 178 185 185 187 194 199Manufacture of beer 15 17 17 20 23 27Manufacture of soft drinks and mineral water 103 96 95 97 92 88
Manufacture of tobacco products 5 5 5 6 7 6
a) Data of enterprises with more than 4 employees. b)GFO’11classification.Statisticalunitscategorizedbyfarmingtypes=GFO11. c)GFO’14classification.Statisticalunitscategorizedbyfarmingtypes=GFO14. Source:HungarianCentralStatisticalOffice

48
Denomination 2013 2014 2015 2016 2017+)
year, personsManufacture of food products 83,014 86,034 86,432 83,346 83,987Production and preserving of meat, processing of meat products 24,430 23,281 23,811 24,336 23,589
Of which:Processing and preserving of meat 9,906 8,313 8,135 7,647 7,371Processing and preserving of poultry-meat 8,030 8,240 9,063 9,621 9,695Processing of meat and poultry-meat products 6,494 6,728 6,614 7,068 6,523
Processingandpreservingoffish ... ... ... ... ...Processing and preserving of fruit and vegetables 7,209 7,336 7,617 7,577 7,850
Processing of vegetable and animal oil 908 860 995 1,024 1,032Manufacture of dairy products 6,407 6,466 6,499 6,652 6,711Manufacture of grain mill products and starch 2,001 2,129 2,283 2,127 2,163Manufacture of bakery and pasta products 25,498 28,244 27,111 26,140 27,044Of which:
Manufacture of bread; fresh bakery products 20,255 22,238 20,973 20,253 21,025Manufacture of preserved bakery products 3,832 4,202 4,250 4,398 4,416Manufacture of pasta products 1,411 1,805 1,888 1,489 1,603
Manufacture of other food products 12,333 12,993 13,229 8,843 9,153Of which:
Manufacture of sugar ... ... ... ... ...Manufacture of sugar confectionary 2,747 2,698 2,743 2,917 2,656
Manufacture of prepared animal feed 4,217 4,684 4,830 6,617 6,439Manufacture of beverages 9,749 9,583 10,467 9,975 9,921Of which:
Manufacture of wines from grape 3,025 3,057 3,386 3,398 3,539Manufacture of beer 1,839 1,805 1,815 1,782 1,744Manufacture of soft drinks, production of mineral water 3,716 3,600 3,872 3,380 3,343
Manufacture of tobacco products 1,255 1,285 1,326 1,306 1,430Manufacture of food products, beverages and tobacco products 94,018 96,902 98,225 94,627 95,338
a) Data of enterprises with more than 4 employees. Source:HungarianCentralStatisticalOffice
3.2. PERSONS EMPLOYED IN BRANCHES OF FOOD INDUSTRYa)

49
Denomination2013 2014 2015 2016 2017
year, HUFManufacture of food products 182,751 197,546 204,793 218,883 247,399Production and preserving of meat, processing of meat products 157,218 173,597 182,639 198,046 223,790
Of which:Processing and preserving of meat 143,240 160,365 166,506 179,126 211,978Processing and preserving of poultry-meat 156,793 171,286 179,267 195,948 218,425Processing of meat and poultry-meat products 182,347 195,311 210,778 224,625 248,531
Processingandpreservingoffish ... ... ... ... ...Processing and preserving of fruit and vegetables 179,274 200,506 201,796 223,841 250,755
Processing of vegetable and animal oil 408,419 442,793 446,073 430,848 465,553Manufacture of dairy products 218,244 229,329 241,350 244,939 276,573Manufacture of grain mill products and starch 254,860 278,563 266,543 278,592 312,889Manufacture of bakery and pasta products 147,575 155,366 163,783 177,042 203,004Of which:
Manufacture of bread; fresh bakery products 134,842 138,837 147,806 157,936 181,261Manufacture of preserved bakery products 196,123 207,373 214,896 235,681 261,293Manufacture of pasta products 160,655 195,017 194,171 219,155 267,062
Manufacture of other food products 234,067 255,623 256,845 254,824 270,131Of which:
Manufacture of sugar ... ... ... ... ...Manufacture of sugar confectionary 186,013 207,572 209,875 220,890 236,055
Manufacture of prepared animal feed 245,647 256,764 262,021 303,428 358,065Manufacture of beverages 279,722 302,529 306,179 320,709 343,701Of which:
Manufacture of wines from grape 181,120 191,401 205,694 233,240 238,069Manufacture of beer 349,850 377,708 377,418 407,706 437,705Manufacture of soft drinks, production of mineral water 328,846 360,961 368,595 373,607 408,575
Manufacture of tobacco products 341,446 325,781 334,674 298,260 308,329Manufacture of food products, beverages and tobacco products 196,392 210,821 218,440 231,360 259,094
a) Data of enterprises with more than 4 employees. Source:HungarianCentralStatisticalOffice
3.3. GROSS MONTHLY EARNINGS OF EMPLOYEES IN BRANCHES OF FOOD INDUSTRYa)

50
Denomination 2013 2014 2015 2016 2017+)
year, HUFManufacture of food products 119,701 129,393 134,140 145,558 164,521Production and preserving of meat, processing of meat products 102,978 113,706 119,629 131,700 148,821
Of which:Processing and preserving of meat 93,822 105,039 109,063 119,118 140,966Processing and preserving of poultry-meat 102,699 112,192 117,420 130,305 145,253Processing of meat and poultry-meat products 119,437 127,929 138,060 149,376 165,273
Processingandpreservingoffish ... ... ... ... ...Processing and preserving of fruit and vegetables 117,424 131,332 132,178 148,854 166,753
Processing of vegetable and animal oil 267,514 290,029 292,178 286,513 309,592Manufacture of dairy products 142,950 150,211 158,084 162,884 183,921Manufacture of grain mill products and starch 166,899 182,459 174,587 185,262 208,072Manufacture of bakery and pasta products 96,660 101,764 107,280 117,735 134,997Of which:
Manufacture of bread; fresh bakery products 88,320 90,938 96,815 105,031 120,538Manufacture of preserved bakery products 128,461 135,829 140,757 156,728 173,760Manufacture of pasta products 105,228 127,736 127,184 145,736 177,598
Manufacture of other food products 153,314 167,433 168,235 169,457 179,637Of which:
Manufacture of sugar ... ... ... ... ...Manufacture of sugar confectionary 121,839 135,959 137,471 146,889 156,978
Manufacture of prepared animal feed 160,899 168,181 171,624 201,779 238,114Manufacture of beverages 183,218 198,157 200,547 213,272 228,564Of which:
Manufacture of wines from grape 118,634 125,370 134,729 155,106 158,318Manufacture of beer 229,152 247,399 247,208 271,125 291,074Manufacture of soft drinks, production of mineral water 215,394 236,429 241,429 248,450 271,704
Manufacture of tobacco products 223,647 213,387 219,211 198,342 205,038Manufacture of food products, beverages and tobacco products 128,635 138,087 143,079 153,855 172,298
a) Data of enterprises with more than 4 employees. Source:HungarianCentralStatisticalOffice
3.4. NET MONTHLY EARNINGS OF EMPLOYEES IN BRANCHES OF FOOD INDUSTRYa)

51
Denomination 2013 2014 2015 2016 2017
previous year = 100.0Manufacture of food beverages and tobacco products 99.0 104.4 104.3 101.0 102.0
Of which:Production and preserving of meat 102.9 86.3 102.9 100.8 109.8Processing and preserving of poultry meat 96.3 106.2 109.2 106.0 89.2Production of meat and poultry meat products 94.9 103.6 105.3 106.8 92.9Processing and preserving of fruit and vegetables 91.0 110.2 91.7 113.7 103.4
Manufacture of dairy products 97.0 105.2 100.3 108.7 106.0Manufacture of grain mill products 102.1 102.5 110.7 88.7 108.8Manufacture of prepared animal feeds 95.0 116.5 107.3 128.5 100.8Manufacture of bread and fresh bakery products 95.5 103.8 101.0 98.7 97.8
Manufacture of sugar … … … … …Manufacture of cocoa, chocolate and sugar confectionery 115.5 102.3 109.2 115.0 88.7
Manufacture of ethyl alcohol and spirits 91.2 139.3 101.2 90.6 92.1Manufacture of wines from grape 113.0 105.2 109.5 91.0 104.3Manufacture of beer 94.3 99.1 100.4 108.1 103.6Manufacture of soft drinks and mineral water 104.6 103.7 108.9 95.2 107.3Manufacture of tobacco products 104.1 109.6 91.3 96.6 109.9
a) Data of enterprises with more than 4 employees. Source:HungarianCentralStatisticalOffice
3.5. VOLUME INDICES OF GROSS OUTPUT IN BRANCHES OF FOOD INDUSTRYa)

52
Denomination2013 2014 2015 2016 2017+)
at current prices, million HUF
Manufacture of food beverages and tobacco products 113,667 155,055 129,575 185,660 197,756
Of which:Production and preserving of meat 5,070 11,595 11,272 18,317 10,206Processing and preserving of poultry meat 4,617 11,366 11,400 16,156 17,501
Processing and preserving of fruit and vegetables 7,138 13,192 13,033 11,039 14,721
Manufacture of dairy products 8,313 4,962 4,974 6,430 10,409Manufacture of grain mill products 2,192 4,571 4,521 3,886 4,066Manufacture of prepared animal feeds 5,489 11,047 10,734 15,879 25,325Manufacture of sugar .. .. .. .. ..Manufacture of sugar confectionery 5,605 4,548 4,632 4,746 4,728Manufacture of ethyl alcohol and spirits 1,796 2,628 2,244 1,896 1,404
Manufacture of wines from grape 7,397 8,839 9,863 8,328 4,960Manufacture of beer 4,173 4,500 4,492 4,724 5,073Manufacture of soft drinks and mineral water 8,010 10,530 11,442 12,539 16,914
Manufacture of tobacco products 6,123 10,872 10,872 2,702 5,878
a)Dataofenterpriseswithmorethan4employees,alsothebudgetaryunitsandentitiesaswellasnon-profitorganizations. Source:HungarianCentralStatisticalOffice
3.6. INVESTMENTS OF FOOD PROCESSING ENTERPRISESa)

53
DenominationAverage of 2008-2012 2013 2014 2015 2016
year, kg
Yearly consumptionMeat, meat products 58.4 55.5 58.6 63.9 66.4Of which: pork 25.5 24.0 25.3 27.5 29.3
beef and veal 2.6 2.2 2.5 2.8 3.0edible offal 2.5 2.2 2.1 2.3 2.0poultry meat 26.2 24.9 26.3 28.8 30.0
Fisha) 3.6 3.7 5.4 5.8 5.7Milk 155.9 147.5 156.7 165.6 169.0Eggs 13.6 12.4 12.8 13.3 13.6Fats and oils 35.2 33.1 34.6 36.3 37.3Of which: lard 11.7 10.0 10.8 11.7 11.9Flour 82.0 81.4 80.1 79.3 82.8Rice 5.1 3.6 4.1 4.5 5.6Sugar 29.2 28.3 28.9 30.2 30.8Potatoes 62.5 58.6 63.0 60.6 59.4Vegetablesb) 110.8 100.8 107.6 116.4 115.2Fruitb) 81.3 85.7 91.6 86.2 89.2Spiritsc) litre 6.7 6.4 7.0 6.1 6.4Wine, litre 24.2 23.8 21.8 25.3 26.9Beer, litre 70.1 64.6 66.7 67.1 67.4Tobacco 1.5 1.4 1.3 1.4 1.3Coffee 2.4 2.1 2.2 2.3 2.4Tea, dkg 22.7 19.1 20.1 20.5 21.6
Daily consumption of nutritive materialKilojoule 12,808 12,233 12,639 13,096 13,513proteins, gram 96.6 92.1 95.6 100.0 103.1Of which: animal proteins, gram 54.3 51.3 54.2 58.3 60.0Fat, gram 137.4 129.4 135.6 143.6 148.0Carbohydrates, gram 363.1 351.3 357.7 362.7 375.0
a) Thequantityoffishhascountedinliveweightfrom2016.Thedataof2015wasadaptedaccordingtothenewmethod. Source: Research Institute of Agricultural Economics. b) Processed products expressed in natural product weight. c) Converted into 50 per cent spirits. Source:HungarianCentralStatisticalOffice
3.7. CONSUMPTION PER CAPITA


4. FORESTRY, FISHERY

57
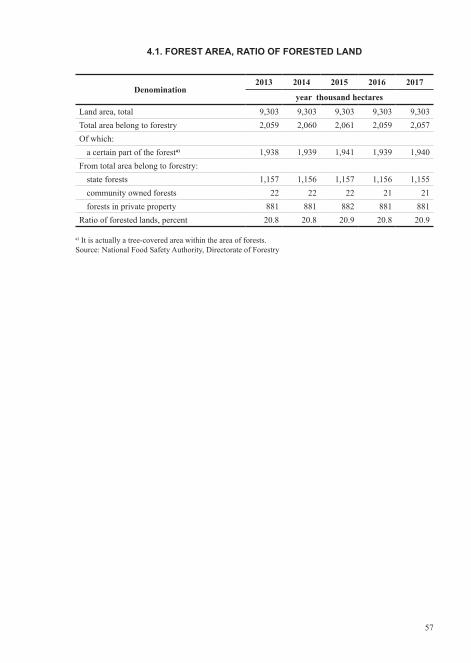
4.1. FOREST AREA, RATIO OF FORESTED LAND
Denomination2013 2014 2015 2016 2017
year thousand hectares
Land area, total 9,303 9,303 9,303 9,303 9,303Total area belong to forestry 2,059 2,060 2,061 2,059 2,057Of which:
a certain part of the foresta) 1,938 1,939 1,941 1,939 1,940From total area belong to forestry:
state forests 1,157 1,156 1,157 1,156 1,155community owned forests 22 22 22 21 21forests in private property 881 881 882 881 881
Ratio of forested lands, percent 20.8 20.8 20.9 20.8 20.9
a) It is actually a tree-covered area within the area of forests. Source: National Food Safety Authority, Directorate of Forestry

58
Denomination2013 2014 2015 2016 2017
year, hectares
First planting of reforestationa)
State foresters 7,998 8,430 7,241 8,003 6,636Other foresters 10,278 10,187 9,452 9,604 8,993
Total 18,277 18,617 16,693 17,607 15,629First planting of afforestation
State foresters 136 201 135 78 0Other foresters 2,395 1,086 183 80 626
Total 2,530 1,287 318 158 626
a) Data without forest renewal. Source: National Food Safety Authority, Directorate of Forestry
4.3. LOGGING
Denomination2013 2014 2015 2016 2017
year, thousand m3
Gross logging, above the surface 7,875 7,517 7,354 7,338 7,576Net logging, above the surface 6,731 6,404 6,345 6,176 6,317Of which: Industrial wood 3,189 3,119 3,065 2,950 2,862
Firewood 3,542 3,285 3,280 3,226 3,454
Source: National Food Safety Authority, Directorate of Forestry
4.2. FORESTATION

59
Denomination 2013 2014 2015 2016 2017
Wooded area, thousand hectaresOak 387 387 388 388 388Moss-capped oak 209 210 211 212 212Beech 111 111 111 112 112Hornbeam 96 96 97 97 97Acacia 450 452 455 455 455Other hard deciduous 111 113 115 116 118Poplar 196 197 197 198 197Other soft deciduous 99 99 99 99 98Coniferous (pines, spruce) 204 201 198 195 191Total 1,864 1,865 1,869 1,869 1,869
Logging, thousand m3
Oak 1,038 941 941 938 988Moss-capped oak 937 843 815 794 863Beech 669 658 666 739 728Hornbeam 305 256 261 259 281Acacia 1,745 1,541 1,488 1,429 1,488Other hard deciduous 253 264 276 262 316Poplar 1,358 1,351 1,328 1,329 1,368Other soft deciduous 307 308 339 314 337Coniferous (pines, spruce) 1,261 1,355 1,240 1,276 1,207Total 7,875 7,518 7,354 7,338 7,576
Source: National Food Safety Authority, Directorate of Forestry
4.4. WOODED AREA AND LOGGING BY SPECIES

60
Groups of damage
Damage to power
Total Defence0-10% Slight
damage
11-25% Poor
damage
26-60% Mode-
rate damage
61-99% Severe
damage
100% Total
damage
Area, hectares
Emergency damage 0 0 0 0 0 0 0Damage caused by insects 915 1,386 3,522 1,271 909 8,004 510
Damage caused by vertebrates 1,387 3,375 4,166 836 7,991 17,754 1,569
Damage caused by pathogens 26 112 746 287 688 1,860 297
Damage caused by plant demaging 0 7 1 2 0 10 1
Tree destructions 35 20 274 484 1,853 2,665 876Abiotic damage 3,875 3,350 13,176 10,712 47,832 78,946 12,064Human damage 12 0 1 4 566 583 94Unknown damage 0 3 7 43 110 163 62Total 6,250 8,253 21,893 13,639 59,950 109,984 15,473
Source: National Food Safety Authority, Directorate of Forestry
4.5. TOTAL STATEMENT OF FOREST DAMAGE 2017 1/2

61
Groups of damage
Damage to power
Total Defence0-10% Slight
damage
11-25% Poor
damage
26-60% Mode-
rate damage
61-99% Severe
damage
100% Total
damage
The rate of damaged trees (%)
Emergency damage 0 0 0 0 0 0 0Damage caused by insects 62 93 91 88 40 82 6
Damage caused by vertebrates 53 49 31 55 32 38 9
Damage caused by pathogens 27 70 51 57 28 44 16
Damage caused by plant demaging 0 20 40 94 0 38 13
Tree destructions 36 90 58 43 21 30 33Abiotic damage 25 46 47 67 25 35 15Human damage 25 0 80 37 10 11 16Unknown damage 0 100 41 13 62 49 38Total 37 55 52 67 26 39 14
Source: National Food Safety Authority, Directorate of Forestry
4.5. TOTAL STATEMENT OF FOREST DAMAGE 2017 2/2

62
4.6. STOCK OF GAMES (2018+), ESTIMATED)
Regions Dee
r
Fallo
w D
eer
Roe
Dee
r
Muf
flon
Wild
boar
Har
e
Phea
sant
Part
ridg
e
HeadPest, Budapest 5,047 4,389 22,879 1,511 7,230 16,169 24,964 1,718Central Hungary 5,047 4,389 22,879 1,511 7,230 16,169 24,964 1,718Fejér 3,031 1,374 17,480 829 6,033 12,353 34,356 422Komárom-Esztergom 4,696 1,670 7,711 1,824 5,746 3,418 7,080 91Veszprém 11,924 1,776 12,401 2,036 8,106 10,603 15,607 146Central Transdanubia 19,651 4,820 37,592 4,689 19,885 26,374 57,043 659Győr-Moson-Sopron 6,353 806 20,389 73 5,770 17,362 19,180 1,869Vas 7,480 692 11,191 72 5,218 4,114 10,313 189Zala 9,390 308 11,547 135 8,899 3,478 12,695 56Western Transdanubia 23,223 1,806 43,127 280 19,887 24,954 42,188 2,114Baranya 12,040 1,406 12,234 376 8,073 6,236 13,550 38Somogy 17,065 3,950 15,436 364 11,922 4,256 14,402 45Tolna 6,170 5,728 18,421 0 6,759 13,572 24,407 62Southern Transdanubia 35,275 11,084 46,091 740 26,754 24,064 52,359 145
Borsod-Abaúj-Zemplén 7,974 165 23,936 1,626 8,707 11,877 22,775 656Heves 5,915 149 13,733 3,082 4,716 14,191 20,710 110Nógrád 5,211 1,035 5,876 1,118 4,575 2,736 6,467 140Northern Hungary 19,100 1,349 43,545 5,826 17,998 28,804 49,952 906Hajdú-Bihar 303 1,746 24,599 0 2,143 32,574 36,484 712Jász-Nagykun-Szolnok 6 97 28,590 0 883 43,550 37,318 187Szabolcs-Szatmár-Bereg 1,967 2,123 33,229 97 3,489 28,690 51,571 929
Northern Great Plain 2,276 3,966 86,418 97 6,515 104,814 125,373 1,828Bács-Kiskun 6,390 3,421 31,976 22 4,793 39,055 60,357 1,416Békés 339 4,000 43,308 30 1,209 82,285 96,720 1,394Csongrád 149 795 26,686 55 925 35,154 47,226 1,401Southern Great Plain 6,878 8,216 101,970 107 6,927 156,494 204,303 4,211Total 111,450 35,630 381,622 13,250 105,196 381,673 556,182 11,581
Source: National Game-management Database

63
Regions Dee
r
Fallo
w D
eer
Roe
Dee
r
Muf
flon
Wild
boar
Har
e
Phea
sant
Part
ridg
e
HeadPest, Budapest 2,232 1,620 6,742 349 9,162 4,464 19,782 734Central Hungary 2,232 1,620 6,742 349 9,162 4,464 19,782 734Fejér 1,363 565 4,139 147 5,701 1,558 25,912 500Komárom-Esztergom 1,875 577 1,602 372 6,833 162 3,671 0Veszprém 5,763 724 4,874 506 9,760 677 11,459 0Central Transdanubia 9,001 1,866 10,615 1,025 22,294 2,397 41,042 500Győr-Moson-Sopron 3,792 524 7,982 8 8,252 6,736 26,804 759Vas 4,159 190 4,379 11 8,295 466 3,147 37Zala 5,323 94 5,073 44 9,983 113 3,619 0Western Transdanubia 13,274 808 17,434 63 26,530 7,315 33,570 796Baranya 5,129 360 3,134 27 11,128 203 1,361 0Somogy 8,866 1,969 4,292 53 16,576 246 4,938 317Tolna 3,697 2,483 3,785 0 8,413 1,010 7,898 0Southern Transdanubia 17,692 4,812 11,211 80 36,117 1,459 14,197 317
Borsod-Abaúj-Zemplén 3,191 40 6,824 552 14,166 1,772 7,996 0Heves 3,256 33 4,486 1,108 7,353 1,887 19,840 0Nógrád 3,088 413 2,334 330 8,016 170 12,532 0Northern Hungary 9,535 486 13,644 1,990 29,535 3,829 40,368 0Hajdú-Bihar 120 1,040 7,648 0 3,587 5,311 19,136 0Jász-Nagykun-Szolnok 0 14 8,091 0 1,711 6,582 41,126 156Szabolcs-Szatmár-Bereg 553 676 10,473 60 5,264 5,077 25,205 0
Northern Great Plain 673 1,730 26,212 60 10,562 16,970 85,467 156Bács-Kiskun 2,478 1,023 9,215 5 6,032 7,292 29,791 47Békés 62 155 7,312 0 1,423 8,459 29,268 343Csongrád 127 1,846 11,273 2 1,426 10,624 88,546 792Southern Great Plain 2,667 3,024 27,800 7 8,881 26,375 147,605 1,182Total 55,074 14,346 113,658 3,574 143,081 62,809 382,031 3,685
a) Shot games. Source: National Game-management Database
4.7. GAME MANAGEMENTa) 2016

64
Regions Dee
r
Fallo
w D
eer
Roe
Dee
r
Muf
flon
Wild
boar
Har
e
Phea
sant
Part
ridg
e
HeadPest, Budapest 2,827 1,887 7,196 404 11,105 4,193 24,951 600Central Hungary 2,827 1,887 7,196 404 11,105 4,193 24,951 600Fejér 1,370 496 3,582 103 5,869 1,276 18,235 400Komárom-Esztergom 2,104 553 1,776 411 7,680 193 5,314 0Veszprém 6,436 796 5,005 581 12,394 558 9,851 0Central Transdanubia 9,910 1,845 10,363 1,095 25,943 2,027 33,400 400Győr-Moson-Sopron 3,943 361 7,603 11 9,255 5,068 26,516 496Vas 4,408 212 4,316 8 10,941 547 3,812 335Zala 5,728 73 5,178 28 12,307 78 2,615 0Western Transdanubia 14,079 646 17,097 47 32,503 5,693 32,943 831Baranya 5,924 396 3,100 14 13,079 201 1,485 0Somogy 8,257 1,440 3,942 28 15,445 244 6,926 205Tolna 3,711 2,500 3,626 45 8,968 906 6,805 0Southern Transdanubia 17,892 4,336 10,668 87 37,492 1,351 15,216 205
Borsod-Abaúj-Zemplén 3,292 37 6,933 492 14,961 1,670 7,940 124Heves 3,246 36 4,410 1,022 7,722 1,701 19,468 0Nógrád 3,316 615 2,552 362 8,636 188 7,576 0Northern Hungary 9,854 688 13,895 1,876 31,319 3,559 34,984 124Hajdú-Bihar 122 1,069 7,512 0 3,925 5,165 21,065 0Jász-Nagykun-Szolnok 0 14 8,270 0 1,753 4,633 38,610 0Szabolcs-Szatmár-Bereg 604 876 10,241 101 4,693 4,799 25,613 0
Northern Great Plain 726 1,959 26,023 101 10,371 14,597 85,288 0Bács-Kiskun 2,586 897 8,626 2 5,948 6,437 30,130 71Békés 75 197 8,227 9 1,826 5,667 31,484 408Csongrád 119 1,275 11,536 2 1,572 11,191 90,131 101Southern Great Plain 2,780 2,369 28,389 13 9,346 23,295 151,745 580Total 58,068 13,730 113,631 3,623 158,079 54,715 378,527 2,740
a) Shot games. Source: National Game-management Database
4.8. GAME MANAGEMENTa) 2017

65
Counties RegionsProductive pond area,
hectares
Cat
ch
Of w
hich
: eat
ing
fish
Eat
ing
fish
catc
h of
in
tens
ive
prod
uctio
n
Tota
l inc
reas
e
per
hect
ares
Car
p in
crea
se
per
hect
ares
tons kgCentral Hungary 818 815 481 ... 695.9 559.8Central Transdanubia 2,479 2,271 1,238 2 581.4 506.9Western Transdanubia 531 600 496 138 948.0 697.5Southern Transdanubia 6,870 5,602 4,169 284 519.6 357.2Northern Hungary 409 367 323 65 - -Northern Great Plain 9,413 5,977 3,702 1,684 446.3 357.0Southern Great Plain 5,960 4,226 2,870 1,011 477.8 386.4Total 26,480 19,858 13,278 3,242 502.7 388.6
a) Increase excluding intensive production. Source: Research Institute of Agricultural Economics
4.10. FISHERY AND AQUACULTURE PRODUCTIONa) 2017
Counties RegionsProductive pond area,
hectares
Cat
ch
Of w
hich
: eat
ing
fish
Eat
ing
fish
catc
h of
in
tens
ive
prod
uctio
n
Tota
l inc
reas
e
per
hect
ares
Car
p in
crea
se
per
hect
ares
tons kgCentral Hungary 817 813 494 ... 715.5 599.6Central Transdanubia 2,510 1,887 1,235 ... 493.1 429.8Western Transdanubia 522 493 413 132 704.7 645.6Southern Transdanubia 6,803 5,795 4,385 325 585.5 471.0Northern Hungary 388 377 343 54 601.2 476.6Northern Great Plain 9,146 6,511 4,316 1,737 492.8 395.7Southern Great Plain 5,879 5331 3,707 1,080 643.8 533.5Total 26,065 21,208 14,893 3,364 563.9 462.3
a) Increase excluding intensive production. Source: Research Institute of Agricultural Economics
4.9. FISHERY AND AQUACULTURE PRODUCTIONa) 2016


5. EXTERNAL, TRADE


69
5.1. EXPORTS AND IMPORTS BY MAIN COMMODITY GROUPS
Main commodity group2013 2014 2015 2016 2017
billion HUF
ExportsFoods, beverages, tobacco 1,938.3 1,975.4 2,040.2 2,045.2 2,243.3Raw materials 737.9 689.2 636.1 645.6 736.8Fuels, electricity energy 869.8 872.4 643.5 528.4 776.5Manufactured goods 7,659.3 8,248.1 8,693.8 9,062.8 9,996.0Machinery, transport equipment 12,912.6 14,278.8 15,999.9 16,678.3 17,350.4Total 24,117.8 26,064.0 28,013.5 28,960.5 31,103.0
ImportsFoods, beverages, tobacco 1,123.8 1,242.4 1,309.5 1,400.4 1,537.7Raw materials 522.7 519.6 538.3 539.0 634.5Fuels, electricity energy 2,776.6 2,877.1 2,071.7 1,652.3 2,223.0Manufactured goods 7,531.7 8,326.6 9,010.1 9,428.2 10,393.5Machinery, transport equipment 10,208.0 11,160.8 12,419.0 12,911.3 13,813.0Total 22,162.8 24,126.5 25,348.6 25,931.2 28,601.7
BalanceFoods, beverages, tobacco 814.4 733.0 730.7 644.8 705.6Raw materials 215.2 169.7 97.9 106.6 102.2Fuels, electricity energy -1,906.8 -2,004.7 -1,428.2 -1,123.9 -1,446.5Manufactured goods 127.6 -78.4 -316.3 -365.4 -397.5Machinery, transport equipment 2,704.6 3,118.0 3,580.9 3,767.0 3,537.4Total 1,955.0 1,937.5 2,664.9 3,029.2 2,501.3
Source:HungarianCentralStatisticalOffice

70
Commodity group
Exports Imports
at current prices, billion HUF
2016 2017 2016 2017
Live animals 104.5 100.7 63.5 85.0Meat, and edible meat offal 314.3 299.2 134.0 167.4Fish, and aquatic invertebrates 8.9 8.6 17.6 18.5Dairy products, edible products of animal origin 115.3 142.0 112.3 133.9Other animal products 19.3 20.5 13.2 15.1Live trees and other plants 17.1 19.4 31.4 32.2Edible vegetables 86.7 86.9 65.3 67.2Edible fruit and nuts, peel of citrus fruits 40.9 52.1 78.6 86.8Coffee, tea, spices 18.5 15.7 42.5 47.4Cereals 370.6 477.3 53.8 53.8Products of the milling industry 31.0 32.6 22.0 20.0Oil seeds and oleaginous fruits, straw and fodder 176.9 195.3 92.1 81.8Vegetable saps and extracts 0.5 0.3 6.5 6.5Vegetable plaiting materials 1.1 1.2 0.8 0.8Animal or vegetable fats and oils 146.4 172.4 71.5 78.0Preparationsofmeat,andfish 78.4 84.5 67.7 80.4Sugars and sugar confectionery 76.4 78.3 68.4 59.4Cocoa and cocoa preparations 50.8 49.4 75.1 81.9Pastry cooks’ products 61.8 68.5 101.4 112.2Preparations of vegetables and fruit 149.5 158.8 65.2 69.6Other edible preparations 167.9 181.6 147.2 146.1Beverages, spirits and vinegar 183.1 197.9 85.1 92.3Prepared animal fodder 244.6 260.0 131.0 137.7Tobacco and manufactured tobacco substitutes 33.5 47.3 66.2 75.5Total 2,498.0 2,750.6 1,612.3 1,749.6
Source:HungarianCentralStatisticalOffice
5.2. EXTERNAL TRADE BY COMMODITY GROUPS

71
Commodity group2013 2014 2015 2016 2017
million EUR
Live animal 337.4 294.4 306.7 335.6 325.7Meat, and edible meat offal 964.0 969.6 960.2 1,009.7 967.6Fish, and aquatic invertebrates 19.6 24.0 28.0 28.6 27.6Dairy products, edible products of animal origin 393.4 397.3 380.4 370.3 459.3Other animal products 95.3 90.3 66.2 61.9 66.3Live trees and other plants 40.1 42.1 45.8 55.1 62.7Edible vegetables 219.3 241.6 261.3 278.3 281.2Edible fruit and nuts, peel of citrus fruits 141.2 127.1 145.8 131.2 169.0Coffee, tea, spices 86.1 92.6 59.4 59.2 50.9Cereals 1,305.5 1,218.9 1,400.4 1,190.1 1,543.7Products of the milling industry 108.8 97.5 111.7 99.3 105.5Oil seeds and oleaginous fruits, straw and fodder 500.2 508.7 491.4 568.5 631.6Vegetable saps and extracts 1.6 6.3 4.8 1.5 0.9Vegetable plaiting materials 3.5 4.3 4.2 3.7 4.0Animal or vegetable fats and oils 592.0 478.0 477.5 470.6 557.4Preparationsofmeat,andfish 193.5 214.6 221.7 251.7 273.2Sugars and sugar confectionery 355.6 253.8 228.9 245.3 253.4Cocoa and cocoa preparations 133.8 136.9 148.0 163.2 159.6Pastry cooks’ products 190.5 221.7 189.3 198.4 221.3Preparations of vegetables and fruit 508.8 511.6 465.4 480.4 513.3Other edible preparations 420.7 484.1 522.1 539.0 587.5Beverages, spirits and vinegar 500.5 450.6 493.2 587.6 640.1Prepared animal fodder 724.2 763.4 814.1 785.4 840.9Tobacco and manufactured tobacco substitutes 165.4 96.7 86.7 107.7 153.1Total 8,001.3 7,726.3 7,913.4 8,022.3 8,895.9
Source:HungarianCentralStatisticalOffice
5.3. EXPORTS BY COMMODITY GROUPS

72
Commodity group2013 2014 2015 2016 2017
million EUR
Live animals 165.3 174.9 178.5 203.8 275.1Meat, and edible meat offal 431.8 416.4 359.8 430.5 541.3Fish, and aquatic invertebrates 35.8 45.9 53.3 56.4 59.9Dairy products, edible products of animal origin 341.8 365.1 349.4 360.7 432.9Other animal products 56.8 66.7 46.0 42.4 48.9Live trees and other plants 79.5 82.6 85.2 100.8 104.1Edible vegetables 143.7 155.2 187.1 209.5 217.2Edible fruit and nuts, peel of citrus fruits 182.3 191.4 235.7 252.5 280.6Coffee, tea, spices 110.7 140.6 140.0 136.6 153.3Cereals 143.2 171.6 208.1 173.0 173.9Products of the milling industry 65.4 59.9 65.5 70.7 64.6Oil seeds and oleaginous fruits, straw and fodder 289.5 263.5 268.8 296.2 264.3Vegetable saps and extracts 18.2 18.4 21.1 20.7 20.9Vegetable plaiting materials 1.4 1.9 2.8 2.7 2.6Animal or vegetable fats and oils 239.3 209.3 213.4 229.6 252.2Preparationsofmeat,andfish 156.6 175.3 193.4 217.4 259.9Sugars and sugar confectionery 203.1 235.7 178.0 219.9 192.0Cocoa and cocoa preparations 196.3 221.2 222.3 241.3 264.6Pastry cooks’ products 239.2 266.5 299.1 325.6 362.6Preparations of vegetables and fruit 173.2 175.8 191.1 209.3 225.0Other edible preparations 376.4 415.4 443.0 472.7 472.5Beverages, spirits and vinegar 218.9 244.4 253.5 273.3 298.5Prepared animal fodder 428.1 410.6 452.5 420.6 445.2Tobacco and manufactured tobacco substitutes 167.5 162.4 207.6 212.5 244.1Total 4,464.3 4,671.0 4,855.1 5,178.8 5,656.5
Source:HungarianCentralStatisticalOffice
5.4. IMPORTS BY COMMODITY GROUPS

73
Goods2013 2014 2015 2016 2017
million EUR
Meat of bovine animals, fresh or chilled 39 25 29 29 33Pork, fresh, chilled or frozen 317 328 319 326 355Meat and edible offal of poultry, fresh, chilled or frozen 498 516 518 552 470
Wheat and meslin 542 471 367 434 567Maize 649 641 871 640 817Wheatormeslinflour 53 51 56 45 49Barley 96 86 135 97 139Rape seeds 186 204 176 233 303Sunflowerseeds 238 203 202 217 188Sunflower-,safflower-orcotton-seedoil andfractionsthereof,notchemicallymodified 479 384 383 389 447
Sausages and similar products of meat, offal or blood, prepared food based on these products 68 72 77 87 91
Beet-sugar, cane-sugar, saccharose 135 56 40 42 46Vegetables preserved without vinegar, not frozen 254 259 245 251 267Vegetables frozen 77 89 83 88 85Fruit juices (including grape must) and vegetable juices, without alcohol content 94 97 80 93 97
Spring water, mineral water, soft drinks 138 131 131 152 170Wine of grapes 73 80 83 90 104Spirits, liqueurs 8 8 9 9 10Bran, sharps and other milling residues 9 8 9 9 10Prepared animal feed 546 582 608 583 605
Source:HungarianCentralStatisticalOffice
5.5. EXPORTS OF MAIN AGRICULTURAL AND FOOD-INDUSTRIAL PRODUCTS

74
Goods2013 2014 2015 2016 2017
million EUR
Meat of bovine animals, frozen 23 23 22 26 28Pork fresh, chilled or frozen 277 250 219 275 324Milk and cream, not concentrated, without added sugar or other sweetening material 58 66 58 47 59
Potatoes 11 11 12 16 20Bananas, including plantains, fresh or dried 50 42 50 58 70Citrus fruit, fresh or dried 44 45 53 62 55Apples, pears and quinces, fresh 8 9 17 11 14Coffee, coffee husk and skins; coffee substitutes containing coffee in any proportion 81 106 101 101 117
Barley 13 11 12 8 5Rice 10 12 25 25 25Sunflowerseeds,whetherornotbroken 123 106 114 114 97Sunflower-,safflower-orcotton-seedoil andfractionsthereof,notchemicallymodified 29 19 23 22 15
Animal or vegetable fats and oils and their fractions, partly or wholly hydrogenated, whetherornotrefined,butnotfurtherprepared
15 16 16 21 21
Margarine, edible oil for cooking 60 61 59 60 66Fruit juices (including grape must) and vegetable juices; without alcohol content 57 51 55 58 55
Beer made from malt 38 37 40 41 41Productsfrommeatandfish,notforhumanconsumption 47 43 40 36 35
Oil-cake, pellet and other solid residues from the extraction of soya-bean oil 214 190 189 166 151
Oil-cake, pellet and other solid residues fromtheextractionofsunfloweroil 8 5 5 4 3
Prepared animal feed 130 144 192 189 233Raw, unmanufactured tobacco, returns 39 27 53 58 89
Source:HungarianCentralStatisticalOffice
5.6. IMPORTS OF MAIN AGRICULTURAL AND FOOD-INDUSTRIAL PRODUCTS
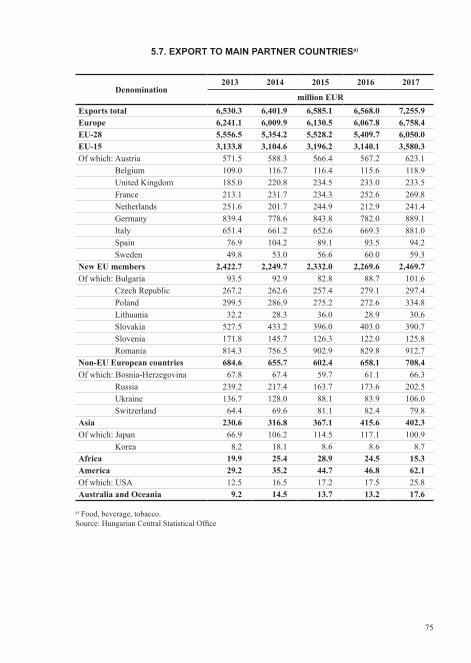
75
Denomination2013 2014 2015 2016 2017
million EURExports total 6,530.3 6,401.9 6,585.1 6,568.0 7,255.9Europe 6,241.1 6,009.9 6,130.5 6,067.8 6,758.4EU-28 5,556.5 5,354.2 5,528.2 5,409.7 6,050.0EU-15 3,133.8 3,104.6 3,196.2 3,140.1 3,580.3Of which: Austria 571.5 588.3 566.4 567.2 623.1
Belgium 109.0 116.7 116.4 115.6 118.9United Kingdom 185.0 220.8 234.5 233.0 233.5France 213.1 231.7 234.3 252.6 269.8Netherlands 251.6 201.7 244.9 212.9 241.4Germany 839.4 778.6 843.8 782.0 889.1Italy 651.4 661.2 652.6 669.3 881.0Spain 76.9 104.2 89.1 93.5 94.2Sweden 49.8 53.0 56.6 60.0 59.3
New EU members 2,422.7 2,249.7 2,332.0 2,269.6 2,469.7Of which: Bulgaria 93.5 92.9 82.8 88.7 101.6
Czech Republic 267.2 262.6 257.4 279.1 297.4Poland 299.5 286.9 275.2 272.6 334.8Lithuania 32.2 28.3 36.0 28.9 30.6Slovakia 527.5 433.2 396.0 403.0 390.7Slovenia 171.8 145.7 126.3 122.0 125.8Romania 814.3 756.5 902.9 829.8 912.7
Non-EU European countries 684.6 655.7 602.4 658.1 708.4Of which: Bosnia-Herzegovina 67.8 67.4 59.7 61.1 66.3
Russia 239.2 217.4 163.7 173.6 202.5Ukraine 136.7 128.0 88.1 83.9 106.0Switzerland 64.4 69.6 81.1 82.4 79.8
Asia 230.6 316.8 367.1 415.6 402.3Of which: Japan 66.9 106.2 114.5 117.1 100.9
Korea 8.2 18.1 8.6 8.6 8.7Africa 19.9 25.4 28.9 24.5 15.3America 29.2 35.2 44.7 46.8 62.1Of which: USA 12.5 16.5 17.2 17.5 25.8Australia and Oceania 9.2 14.5 13.7 13.2 17.6
a) Food, beverage, tobacco. Source:HungarianCentralStatisticalOffice
5.7. EXPORT TO MAIN PARTNER COUNTRIESa)

76
Denomination2013 2014 2015 2016 2017
million EURImports total 3,785.2 4,027.4 4,226.4 4,498.0 4,971.5Europe 3,648.7 3,894.2 4,083.6 4,339.0 4,805.1EU-28 3,546.2 3,793.7 3,970.1 4,222.9 4,625.3EU-15 2,194.2 2,316.6 2,430.0 2,521.7 2,771.4Of which: Austria 338.8 384.4 343.5 379.4 391.0
Belgium 103.2 112.0 114.3 122.0 128.7Denmark 37.1 33.2 27.6 28.6 41.5United Kingdom 97.3 89.3 102.6 87.5 107.0France 165.7 172.9 211.9 186.7 193.6Greece 20.3 16.9 21.4 23.4 27.8Netherlands 295.2 283.8 306.5 315.3 338.5Germany 801.3 874.4 878.2 902.9 1,041.4Italy 195.9 205.0 248.9 267.8 274.6Spain 95.7 104.9 131.3 161.3 179.2Sweden 16.9 17.0 17.3 20.2 20.9
New EU members 1,352.0 1,477.2 1,540.1 1,701.2 1,854.0Of which: Czech Republic 180.2 221.3 232.1 259.4 283.3
Poland 495.6 483.2 504.6 551.2 645.8Slovakia 351.3 408.7 424.0 444.9 491.6Romania 139.5 173.7 160.9 177.6 186.4
Non-EU European countries 102.5 100.4 113.4 116.1 179.8Of which: Turkey 10.9 12.3 14.9 20.9 34.3Asia 47.5 51.6 64.3 68.9 83.0Of which: India 6.2 4.6 5.9 5.9 9.3
Malaysia 11.7 12.1 13.8 13.1 11.8Vietnam 2.6 3.7 4.0 4.4 12.1
Africa 16.8 21.5 10.2 10.3 12.9Of which: Uganda 1.7 1.2 0.8 0.8 0.7
Malawi 0.2 0.3 0.2 0.5 0.5America 67.8 59.4 67.3 79.1 69.9Of which: USA 29.3 31.5 39.2 37.3 39.3
Argentina 1.7 0.9 0.5 0.5 0.8Brazil 18.8 12.7 18.0 21.1 18.6Peru 0.0 0.1 0.1 0.1 0.1
Australia and Oceania 4.5 0.8 1.1 0.7 0.6
a) According to dispacher country. b) Food, beverage, tobacco. Source:HungarianCentralStatisticalOffice
5.8. IMPORT FROM MAINa) PARTNER COUNTRIESb)

6. COUNTY DATA


79
6.1. LAND AREA BY REGIONS 31ST MAY 2016 (1/2)
RegionsArable land Garden Orchard Vineyard Grassland
thousand hectaresPest, Budapest 294.3 7.7 10.5 5.7 59.4
Central Hungary 294.3 7.7 10.5 5.7 59.4Fejér 251.6 5.3 2.7 2.5 23.4Komárom-Esztergom 103.2 2.2 0.6 1.9 19.6Veszprém 138.2 2.2 1.3 4.2 39.7
Central Transdanubia 493.0 9.8 4.7 8.6 82.6Győr-Moson-Sopron 224.5 2.6 2.0 2.1 20.4Vas 147.4 2.6 1.8 0.9 13.6Zala 114.9 2.4 3.4 2.3 31.6
Western Transdanubia 486.8 7.6 7.3 5.3 65.5Baranya 225.6 2.2 1.4 4.2 19.9Somogy 256.0 3.1 2.9 3.7 32.7Tolna 214.9 2.0 2.1 4.7 17.7
Southern Transdanubia 696.5 7.3 6.5 12.6 70.2Borsod-Abaúj-Zemplén 243.0 5.3 7.4 6.5 50.0Heves 144.4 3.5 4.3 10.2 36.3Nógrád 62.4 2.0 2.2 0.3 23.7
Northern Hungary 449.8 10.8 13.8 17.0 110.0Hajdú-Bihar 322.1 4.0 3.7 1.1 111.5Jász-Nagykun-Szolnok 339.0 2.1 1.6 1.2 42.2Szabolcs-Szatmár-Bereg 263.2 3.4 30.0 0.8 64.9
Northern Great Plain 924.4 9.4 35.3 3.1 218.5Bács-Kiskun 349.5 5.4 10.0 21.5 106.2Békés 390.9 4.6 1.0 0.2 34.7Csongrád 247.2 2.4 3.5 1.9 36.1
Southern Great Plain 987.6 12.5 14.5 23.5 177.0Total 4,332.4 65.0 92.6 75.7 783.2
Source:HungarianCentralStatisticalOffice

80
RegionsAgricultural
area Forest Productive land
Unculti-vated land
Land area total
thousand hectaresPest, Budapest 377.4 170.6 566.9 190.5 757.4
Central Hungary 377.4 170.6 566.9 190.5 757.4Fejér 285.5 54.2 345.3 110.6 455.9Komárom-Esztergom 127.6 62.1 191.3 39.6 230.9Veszprém 185.5 134.9 322.6 109.7 432.4
Central Transdanubia 598.7 251.2 859.2 260.0 1,119.2Győr-Moson-Sopron 251.6 80.5 336.5 78.3 414.8Vas 166.3 94.2 260.9 66.0 326.8Zala 154.6 119.9 274.8 91.9 366.7
Western Transdanubia 572.6 294.6 872.2 236.1 1,108.3Baranya 253.2 111.4 367.0 71.4 438.5Somogy 298.4 178.9 485.3 86.0 571.2Tolna 241.5 66.2 311.2 31.0 342.1
Southern Transdanubia 793.1 356.5 1,163.4 188.4 1,351.8Borsod-Abaúj-Zemplén 312.1 211.2 524.2 152.2 676.4Heves 198.7 88.5 287.8 93.2 381.0Nógrád 90.6 99.7 190.5 61.8 252.2
Northern Hungary 601.3 399.4 1,002.4 307.2 1,309.6Hajdú-Bihar 442.5 69.8 526.8 84.4 611.2Jász-Nagykun-Szolnok 386.0 32.8 422.9 171.4 594.3Szabolcs-Szatmár-Bereg 362.3 125.5 491.9 130.6 622.5
Northern Great Plain 1,190.8 228.0 1,441.5 386.4 1,827.9Bács-Kiskun 492.6 176.5 676.4 167.2 843.6Békés 431.5 26.0 459.5 84.5 544.0Csongrád 291.0 37.9 334.5 107.0 441.5
Southern Great Plain 1,215.1 240.3 1,470.4 358.6 1,829.1Total 5,349.0 1,940.7 7,376.2 1,927.2 9,303.4
a)Includingreedsandfish-ponds. Source:HungarianCentralStatisticalOffice
6.1. LAND AREA BY REGIONSa) 31ST MAY 2016 (2/2)

81
RegionsArable land Garden Orchard Vineyard Grassland
thousand hectaresPest, Budapest 299.0 3.7 10.3 4.5 61.2
Central Hungary 299.0 3.7 10.3 4.5 61.2Fejér 251.6 2.9 2.8 2.2 25.6Komárom-Esztergom 103.2 1.8 0.6 1.6 19.6Veszprém 138.2 2.0 1.3 4.2 39.7
Central Transdanubia 493.0 6.7 4.7 8.0 84.9Győr-Moson-Sopron 224.5 2.0 2.0 2.1 20.7Vas 158.9 1.4 1.8 0.7 13.6Zala 114.9 2.2 3.4 2.3 31.6
Western Transdanubia 498.3 5.6 7.3 5.0 65.9Baranya 223.9 1.8 1.3 3.6 20.8Somogy 251.4 2.5 3.4 3.7 32.7Tolna 214.9 2.0 2.1 4.4 17.7
Southern Transdanubia 690.2 6.3 6.9 11.6 71.2Borsod-Abaúj-Zemplén 239.8 3.5 7.4 6.5 59.2Heves 144.4 2.8 5.1 11.8 31.7Nógrád 62.7 1.7 2.2 0.3 23.9
Northern Hungary 446.9 8.0 14.7 18.6 114.9Hajdú-Bihar 322.1 3.5 3.2 0.9 112.4Jász-Nagykun-Szolnok 339.0 1.9 1.6 1.2 47.2Szabolcs-Szatmár-Bereg 256.3 3.1 30.0 0.8 57.2
Northern Great Plain 917.5 8.5 34.8 2.9 216.8Bács-Kiskun 349.5 3.7 10.0 21.0 108.5Békés 396.2 2.9 1.2 0.1 43.0Csongrád 243.7 2.2 3.5 1.7 37.4
Southern Great Plain 989.4 8.7 14.7 22.8 188.9Total 4,334.3 47.3 93.4 73.4 803.8
Source:HungarianCentralStatisticalOffice
6.2. LAND AREA BY REGIONS 31ST MAY 2017 (1/2)

82
RegionsAgricultural
area Forest Productive land
Unculti-vated land
Land area total
thousand hectaresPest, Budapest 378.7 170.7 567.4 189.2 756.6
Central Hungary 378.7 170.7 567.4 189.2 756.6Fejér 285.1 54.1 344.0 111.9 455.9Komárom-Esztergom 126.8 61.8 189.7 41.2 230.9Veszprém 185.3 134.9 322.4 110.0 432.4
Central Transdanubia 597.2 250.8 856.1 263.1 1,119.2Győr-Moson-Sopron 251.3 80.0 334.2 80.6 414.8Vas 176.3 94.2 270.9 67.4 338.3Zala 154.4 119.9 274.6 92.1 366.7
Western Transdanubia 582.1 294.1 879.8 240.0 1,119.8Baranya 251.4 111.4 365.0 71.1 436.1Somogy 293.6 179.0 479.7 87.0 566.6Tolna 241.1 66.2 310.4 31.8 342.1
Southern Transdanubia 786.2 356.6 1,155.1 189.8 1,344.9Borsod-Abaúj-Zemplén 316.4 211.6 528.8 150.2 679.0Heves 195.8 88.6 284.9 93.2 378.1Nógrád 90.9 99.7 190.7 61.5 252.2
Northern Hungary 603.1 399.8 1,004.4 304.8 1,309.3Hajdú-Bihar 442.1 69.8 525.1 86.0 611.2Jász-Nagykun-Szolnok 390.9 32.8 427.7 171.6 599.3Szabolcs-Szatmár-Bereg 347.5 125.6 477.3 130.7 608.0
Northern Great Plain 1,180.5 228.1 1,430.1 388.3 1,818.4Bács-Kiskun 492.6 175.9 674.9 168.5 843.4Békés 443.4 25.9 471.4 82.4 553.8Csongrád 288.4 37.9 331.4 106.6 438.0
Southern Great Plain 1,224.4 239.6 1,477.6 357.5 1,835.1Total 5,352.3 1,939.7 7,370.6 1,932.8 9,303.4
a)Includingreedsandfish-ponds. Source:HungarianCentralStatisticalOffice
6.2. LAND AREA BY REGIONSa) 31ST MAY 2017 (2/2)

83
RegionsHarvested area Total production Average yield
hectares tons kg per hectare
Pest, Budapest 67,324 316,868 4,710Central Hungary 67,324 316,868 4,710
Fejér 65,544 412,736 6,300Komárom-Esztergom 28,347 153,585 5,420Veszprém 34,879 176,887 5,070
Central Transdanubia 128,770 743,208 5,770Győr-Moson-Sopron 64,848 330,741 5,100Vas 44,636 270,661 6,060Zala 30,760 182,742 5,940
Western Transdanubia 140,244 784,144 5,590Baranya 54,886 352,249 6,420Somogy 59,316 366,374 6,180Tolna 50,803 324,562 6,390
Southern Transdanubia 165,005 1,043,185 6,320Borsod-Abaúj-Zemplén 65,699 360,222 5,480Heves 47,038 221,591 4,710Nógrád 17,894 82,366 4,600
Northern Hungary 130,631 664,179 5,080Hajdú-Bihar 56,191 307,542 5,470Jász-Nagykun-Szolnok 102,912 464,860 4,520Szabolcs-Szatmár-Bereg 27,502 133,270 4,850
Northern Great Plain 186,605 905,672 4,850Bács-Kiskun 66,571 360,982 5,420Békés 97,703 489,786 5,010Csongrád 61,461 295,160 4,800
Southern Great Plain 225,735 1,145,928 5,080Total 1,044,314 5,603,184 5,370
Source:HungarianCentralStatisticalOffice
6.3. PRODUCTION OF WHEAT BY REGIONS 2016

84
RegionsHarvested area Total production Average yield
hectares tons kg per hectare
Pest, Budapest 16,263 76,606 4,710Central Hungary 16,263 76,606 4,710
Fejér 21,908 128,233 5,850Komárom-Esztergom 6,147 31,221 5,080Veszprém 12,171 53,527 4,400
Central Transdanubia 40,226 212,980 5,290Győr-Moson-Sopron 25,041 127,500 5,090Vas 17,558 83,421 4,750Zala 8,621 47,214 5,480
Western Transdanubia 51,220 258,135 5,040Baranya 16,043 97,242 6,060Somogy 11,947 70,844 5,930Tolna 15,059 94,814 6,300
Southern Transdanubia 43,049 262,900 6,110Borsod-Abaúj-Zemplén 14,479 71,454 4,940Heves 11,667 56,713 4,860Nógrád 3,363 13,442 4,000
Northern Hungary 29,509 141,609 4,800Hajdú-Bihar 14,811 78,632 5,310Jász-Nagykun-Szolnok 29,880 145,954 4,880Szabolcs-Szatmár-Bereg 2,593 11,642 4,490
Northern Great Plain 47,284 236,229 5,000Bács-Kiskun 34,297 161,167 4,700Békés 29,922 153,434 5,130Csongrád 21,321 91,174 4,280
Southern Great Plain 85,540 405,774 4,740Total 313,091 1,594,233 5,090
Source:HungarianCentralStatisticalOffice
6.4. PRODUCTION OF BARLEY BY REGIONS 2016
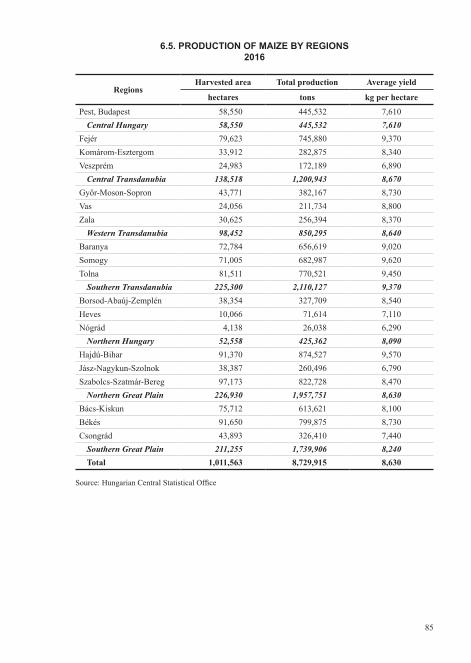
85
RegionsHarvested area Total production Average yield
hectares tons kg per hectare
Pest, Budapest 58,550 445,532 7,610Central Hungary 58,550 445,532 7,610
Fejér 79,623 745,880 9,370Komárom-Esztergom 33,912 282,875 8,340Veszprém 24,983 172,189 6,890
Central Transdanubia 138,518 1,200,943 8,670Győr-Moson-Sopron 43,771 382,167 8,730Vas 24,056 211,734 8,800Zala 30,625 256,394 8,370
Western Transdanubia 98,452 850,295 8,640Baranya 72,784 656,619 9,020Somogy 71,005 682,987 9,620Tolna 81,511 770,521 9,450
Southern Transdanubia 225,300 2,110,127 9,370Borsod-Abaúj-Zemplén 38,354 327,709 8,540Heves 10,066 71,614 7,110Nógrád 4,138 26,038 6,290
Northern Hungary 52,558 425,362 8,090Hajdú-Bihar 91,370 874,527 9,570Jász-Nagykun-Szolnok 38,387 260,496 6,790Szabolcs-Szatmár-Bereg 97,173 822,728 8,470
Northern Great Plain 226,930 1,957,751 8,630Bács-Kiskun 75,712 613,621 8,100Békés 91,650 799,875 8,730Csongrád 43,893 326,410 7,440
Southern Great Plain 211,255 1,739,906 8,240Total 1,011,563 8,729,915 8,630
Source:HungarianCentralStatisticalOffice
6.5. PRODUCTION OF MAIZE BY REGIONS 2016
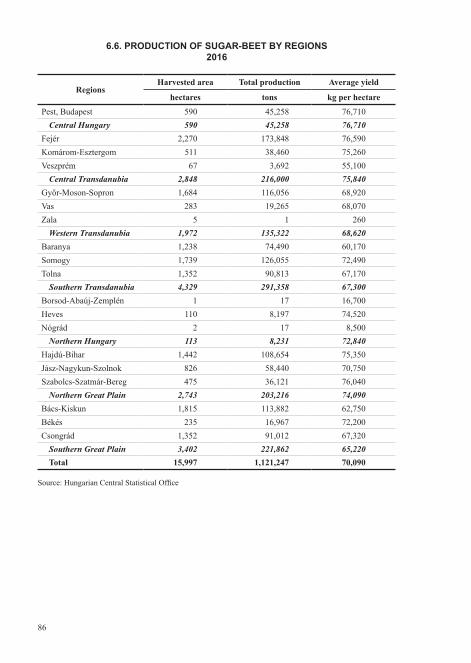
86
RegionsHarvested area Total production Average yield
hectares tons kg per hectare
Pest, Budapest 590 45,258 76,710Central Hungary 590 45,258 76,710
Fejér 2,270 173,848 76,590Komárom-Esztergom 511 38,460 75,260Veszprém 67 3,692 55,100
Central Transdanubia 2,848 216,000 75,840Győr-Moson-Sopron 1,684 116,056 68,920Vas 283 19,265 68,070Zala 5 1 260
Western Transdanubia 1,972 135,322 68,620Baranya 1,238 74,490 60,170Somogy 1,739 126,055 72,490Tolna 1,352 90,813 67,170
Southern Transdanubia 4,329 291,358 67,300Borsod-Abaúj-Zemplén 1 17 16,700Heves 110 8,197 74,520Nógrád 2 17 8,500
Northern Hungary 113 8,231 72,840Hajdú-Bihar 1,442 108,654 75,350Jász-Nagykun-Szolnok 826 58,440 70,750Szabolcs-Szatmár-Bereg 475 36,121 76,040
Northern Great Plain 2,743 203,216 74,090Bács-Kiskun 1,815 113,882 62,750Békés 235 16,967 72,200Csongrád 1,352 91,012 67,320
Southern Great Plain 3,402 221,862 65,220Total 15,997 1,121,247 70,090
Source:HungarianCentralStatisticalOffice
6.6. PRODUCTION OF SUGAR-BEET BY REGIONS 2016

87
RegionsHarvested area Total production Average yield
hectares tons kg per hectare
Pest, Budapest 39,417 122,261 3,100Central Hungary 39,417 122,261 3,100
Fejér 38,666 132,206 3,420Komárom-Esztergom 13,280 42,055 3,170Veszprém 11,297 23,989 2,120
Central Transdanubia 63,243 198,250 3,130Győr-Moson-Sopron 15,934 47,437 2,980Vas 8,648 25,065 2,900Zala 7,328 21,574 2,940
Western Transdanubia 31,910 94,075 2,950Baranya 22,024 61,612 2,800Somogy 30,058 82,522 2,750Tolna 32,798 104,217 3,180
Southern Transdanubia 84,880 248,351 2,930Borsod-Abaúj-Zemplén 42,389 134,435 3,170Heves 29,026 90,412 3,110Nógrád 8,422 21,287 2,530
Northern Hungary 79,837 246,134 3,080Hajdú-Bihar 58,893 189,943 3,230Jász-Nagykun-Szolnok 71,312 186,605 2,620Szabolcs-Szatmár-Bereg 52,498 179,687 3,420
Northern Great Plain 182,703 556,235 3,040Bács-Kiskun 42,205 130,979 3,100Békés 71,298 188,594 2,650Csongrád 34,182 90,534 2,650
Southern Great Plain 147,685 410,107 2,780Total 629,675 1,875,412 2,980
Source:HungarianCentralStatisticalOffice
6.7. PRODUCTION OF SUNFLOWER SEED BY REGIONS 2016
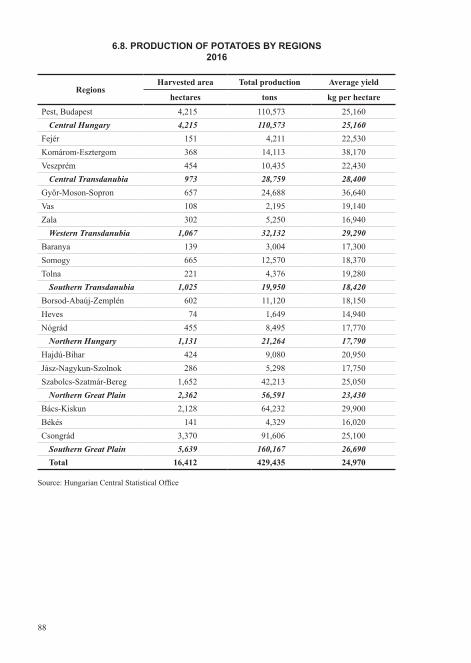
88
RegionsHarvested area Total production Average yield
hectares tons kg per hectare
Pest, Budapest 4,215 110,573 25,160Central Hungary 4,215 110,573 25,160
Fejér 151 4,211 22,530Komárom-Esztergom 368 14,113 38,170Veszprém 454 10,435 22,430
Central Transdanubia 973 28,759 28,400Győr-Moson-Sopron 657 24,688 36,640Vas 108 2,195 19,140Zala 302 5,250 16,940
Western Transdanubia 1,067 32,132 29,290Baranya 139 3,004 17,300Somogy 665 12,570 18,370Tolna 221 4,376 19,280
Southern Transdanubia 1,025 19,950 18,420Borsod-Abaúj-Zemplén 602 11,120 18,150Heves 74 1,649 14,940Nógrád 455 8,495 17,770
Northern Hungary 1,131 21,264 17,790Hajdú-Bihar 424 9,080 20,950Jász-Nagykun-Szolnok 286 5,298 17,750Szabolcs-Szatmár-Bereg 1,652 42,213 25,050
Northern Great Plain 2,362 56,591 23,430Bács-Kiskun 2,128 64,232 29,900Békés 141 4,329 16,020Csongrád 3,370 91,606 25,100
Southern Great Plain 5,639 160,167 26,690Total 16,412 429,435 24,970
Source:HungarianCentralStatisticalOffice
6.8. PRODUCTION OF POTATOES BY REGIONS 2016

89
RegionsHarvested area Total production Average yield
hectares tons kg per hectare
Pest, Budapest 60,935 305,560 5,010Central Hungary 60,935 305,560 5,010
Fejér 66,117 360,047 5,450Komárom-Esztergom 24,118 115,357 4,780Veszprém 34,335 156,346 4,550
Central Transdanubia 124,570 631,749 5,070Győr-Moson-Sopron 60,169 286,943 4,770Vas 42,747 223,124 5,220Zala 28,030 154,268 5,500
Western Transdanubia 130,946 664,334 5,070Baranya 50,778 327,743 6,450Somogy 58,672 324,860 5,540Tolna 50,693 330,032 6,510
Southern Transdanubia 160,143 982,635 6,140Borsod-Abaúj-Zemplén 59,745 338,452 5,660Heves 43,380 222,919 5,140Nógrád 14,916 67,664 4,540
Northern Hungary 118,041 629,035 5,330Hajdú-Bihar 49,423 299,534 6,060Jász-Nagykun-Szolnok 95,302 494,523 5,190Szabolcs-Szatmár-Bereg 23,219 127,252 5,480
Northern Great Plain 167,944 921,308 5,490Bács-Kiskun 59,333 335,195 5,650Békés 86,273 461,465 5,350Csongrád 58,215 314,976 5,410
Southern Great Plain 203,821 1,111,636 5,450Total 966,400 5,246,258 5,430
Source:HungarianCentralStatisticalOffice
6.9. PRODUCTION OF WHEAT BY REGIONS 2017+)

90
RegionsHarvested area Total production Average yield
hectares tons kg per hectare
Pest, Budapest 16,431 79,062 4,810Central Hungary 16,431 79,062 4,810
Fejér 17,685 104,081 5,890Komárom-Esztergom 4,924 24,197 4,910Veszprém 10,961 50,019 4,560
Central Transdanubia 33,570 178,297 5,310Győr-Moson-Sopron 21,453 105,704 4,930Vas 17,637 88,804 5,040Zala 6,138 33,113 5,390
Western Transdanubia 45,228 227,621 5,030Baranya 10,989 70,320 6,400Somogy 11,152 64,446 5,780Tolna 11,607 74,671 6,430
Southern Transdanubia 33,748 209,437 6,210Borsod-Abaúj-Zemplén 13,595 75,174 5,530Heves 8,310 44,397 5,340Nógrád 1,859 7,190 3,870
Northern Hungary 23,764 126,761 5,330Hajdú-Bihar 11,477 64,308 5,600Jász-Nagykun-Szolnok 27,268 148,971 5,460Szabolcs-Szatmár-Bereg 1,754 7,885 4,500
Northern Great Plain 40,499 221,165 5,460Bács-Kiskun 30,479 152,869 5,020Békés 25,676 128,928 5,020Csongrád 18,686 92,237 4,940
Southern Great Plain 74,841 374,034 5,000Total 268,081 1,416,376 5,280
Source:HungarianCentralStatisticalOffice
6.10. PRODUCTION OF BARLEY BY REGIONS 2017+)

91
RegionsHarvested area Total production Average yield
hectares tons kg per hectare
Pest, Budapest 62,296 388,888 6,240Central Hungary 62,296 388,888 6,240
Fejér 70,627 473,522 6,700Komárom-Esztergom 33,702 203,446 6,040Veszprém 25,384 138,525 5,460
Central Transdanubia 129,713 815,492 6,290Győr-Moson-Sopron 43,220 245,340 5,680Vas 27,124 189,748 7,000Zala 27,084 180,703 6,670
Western Transdanubia 97,428 615,791 6,320Baranya 64,038 465,033 7,260Somogy 63,569 504,229 7,930Tolna 73,099 589,095 8,060
Southern Transdanubia 200,706 1,558,357 7,760Borsod-Abaúj-Zemplén 39,089 293,948 7,520Heves 7,186 40,894 5,690Nógrád 4,309 21,017 4,880
Northern Hungary 50,584 355,858 7,030Hajdú-Bihar 101,262 802,767 7,930Jász-Nagykun-Szolnok 44,081 240,983 5,470Szabolcs-Szatmár-Bereg 94,680 752,613 7,950
Northern Great Plain 240,023 1,796,363 7,480Bács-Kiskun 66,099 409,322 6,190Békés 100,767 571,856 5,680Csongrád 41,207 227,259 5,520
Southern Great Plain 208,073 1,208,437 5,810Total 988,823 6,739,186 6,820
Source:HungarianCentralStatisticalOffice
6.11. PRODUCTION OF MAIZE BY REGIONS 2017+)

92
RegionsHarvested area Total production Average yield
hectares tons kg per hectare
Pest, Budapest 445 32,215 72,390Central Hungary 445 32,215 72,390
Fejér 2,949 190,289 64,530Komárom-Esztergom 389 23,568 60,590Veszprém 50 2,004 40,080
Central Transdanubia 3,388 215,861 63,710Győr-Moson-Sopron 2,128 125,461 58,960Vas 1,073 52,566 48,990Zala 110 6,733 61,210
Western Transdanubia 3,311 184,760 55,800Baranya 1,182 77,390 65,470Somogy 1,746 106,038 60,730Tolna 1,593 91,577 57,490
Southern Transdanubia 4,521 275,006 60,830Borsod-Abaúj-Zemplén 8 100 12,460Heves 117 7,735 66,110Nógrád 0 0 0
Northern Hungary 125 7,835 62,680Hajdú-Bihar 1,413 106,596 75,440Jász-Nagykun-Szolnok 612 42,416 69,310Szabolcs-Szatmár-Bereg 573 41,739 72,840
Northern Great Plain 2,598 190,751 73,420Bács-Kiskun 1,865 120,891 64,820Békés 1,079 66,358 61,500Csongrád 1,315 77,826 59,180
Southern Great Plain 4,259 265,075 62,240Total 18,647 1,171,502 62,830
Source:HungarianCentralStatisticalOffice
6.12. PRODUCTION OF SUGAR-BEET BY REGIONS 2017+)

93
RegionsHarvested area Total production Average yield
hectares tons kg per hectare
Pest, Budapest 39,896 109,152 2,740Central Hungary 39,896 109,152 2,740
Fejér 38,855 103,619 2,670Komárom-Esztergom 15,123 41,238 2,730Veszprém 10,188 24,158 2,370
Central Transdanubia 64,166 169,014 2,630Győr-Moson-Sopron 20,059 51,283 2,560Vas 8,544 24,878 2,910Zala 7,680 23,375 3,040
Western Transdanubia 36,283 99,536 2,740Baranya 22,517 65,894 2,930Somogy 36,095 111,627 3,090Tolna 33,122 110,707 3,340
Southern Transdanubia 91,734 288,227 3,140Borsod-Abaúj-Zemplén 45,158 142,606 3,160Heves 36,361 97,316 2,680Nógrád 10,400 28,316 2,720
Northern Hungary 91,919 268,238 2,920Hajdú-Bihar 62,276 200,599 3,220Jász-Nagykun-Szolnok 86,431 247,849 2,870Szabolcs-Szatmár-Bereg 53,665 178,863 3,330
Northern Great Plain 202,372 627,311 3,100Bács-Kiskun 43,868 118,113 2,690Békés 85,744 241,680 2,820Csongrád 38,561 101,061 2,620
Southern Great Plain 168,173 460,855 2,740Total 694,543 2,022,332 2,910
Source:HungarianCentralStatisticalOffice
6.13. PRODUCTION OF SUNFLOWER SEED BY REGIONS 2017+)

94
RegionsHarvested area Total production Average yield
hectares tons kg per hectare
Pest, Budapest 3,827 86,139 20,840Central Hungary 3,827 86,139 20,840
Fejér 56 1,629 14,060Komárom-Esztergom 353 12,511 35,220Veszprém 350 7,690 21,110
Central Transdanubia 759 21,830 27,150Győr-Moson-Sopron 524 17,446 32,120Vas 95 1,604 15,000Zala 226 4,212 17,500
Western Transdanubia 845 23,262 26,280Baranya 99 1,672 9,420Somogy 639 11,095 16,800Tolna 89 1,667 16,690
Southern Transdanubia 827 14,433 15,910Borsod-Abaúj-Zemplén 441 7,561 16,670Heves 88 2,095 17,400Nógrád 296 3,960 13,280
Northern Hungary 825 13,616 15,530Hajdú-Bihar 510 11,783 22,750Jász-Nagykun-Szolnok 169 3,043 16,630Szabolcs-Szatmár-Bereg 1,889 42,024 20,740
Northern Great Plain 2,568 56,851 20,870Bács-Kiskun 1,708 48,671 27,680Békés 398 11,956 20,990Csongrád 2,901 64,294 19,710
Southern Great Plain 5,007 124,920 22,530Total 14,658 341,050 21,490
Source:HungarianCentralStatisticalOffice
6.14. PRODUCTION OF POTATOES BY REGIONS 2017+)

95
Regions
Fruits Grapes
production, tons
2015 2016 2015 2016
Pest, Budapest 75,163 61,991 28,581 28,420Central Hungary 75,163 61,991 28,581 28,420
Fejér 19,763 14,035 14,838 19,940Komárom-Esztergom 4,777 2,604 11,794 10,225Veszprém 10,210 7,133 26,803 21,292
Central Transdanubia 34,750 23,772 53,435 51,457Győr-Moson-Sopron 16,254 13,583 12,472 9,712Vas 17,996 7,159 2,490 2,420Zala 36,336 18,267 14,924 15,810
Western Transdanubia 70,586 39,009 29,886 27,942Baranya 15,199 11,949 26,740 24,672Somogy 15,998 17,231 34,145 27,550Tolna 9,107 9,474 33,085 28,862
Southern Transdanubia 40,304 38,654 93,970 81,084Borsod-Abaúj-Zemplén 69,413 60,780 33,505 29,518Heves 21,781 17,915 82,265 76,923Nógrád 2,622 3,574 845 819
Northern Hungary 93,816 82,269 116,615 107,260Hajdú-Bihar 48,951 49,305 3,254 3,694Jász-Nagykun-Szolnok 7,448 5,772 5,320 4,172Szabolcs-Szatmár-Bereg 332,181 346,471 2,123 3,453
Northern Great Plain 388,580 401,548 10,697 11,319Bács-Kiskun 44,665 76,206 133,661 159,436Békés 8,344 8,288 337 466Csongrád 21,508 23,673 5,166 9,107
Southern Great Plain 74,517 108,167 139,164 169,009Total 777,716 755,410 472,348 476,491
Source:HungarianCentralStatisticalOffice
6.15. PRODUCTION OF FRUIT AND GRAPES BY REGIONS

96
RegionsCattle Of which:
cows PigsOf which: breeding
sowsthousand heads
Pest, Budapest 74 28 193 11Central Hungary 74 28 193 11
Fejér 53 22 67 5Komárom-Esztergom 13 6 141 6Veszprém 45 21 88 7
Central Transdanubia 111 49 296 17Győr-Moson-Sopron 51 22 128 8Vas 34 16 29 1Zala 28 10 76 5
Western Transdanubia 113 48 233 14Baranya 34 18 226 14Somogy 46 20 145 9Tolna 25 12 135 7
Southern Transdanubia 105 50 506 30Borsod-Abaúj-Zemplén 47 24 90 6Heves 15 7 18 2Nógrád 17 8 8 0
Northern Hungary 79 39 116 8Hajdú-Bihar 105 51 374 24Jász-Nagykun-Szolnok 49 23 260 16Szabolcs-Szatmár-Bereg 45 19 138 8
Northern Great Plain 200 92 771 48Bács-Kiskun 74 36 350 22Békés 60 26 256 16Csongrád 37 17 187 12
Southern Great Plain 171 78 793 50Total 852 383 2,907 177
a)Thesumofpartfiguresmaydifferfromthetotal,duetorounding. Source:HungarianCentralStatisticalOffice
6.16. CATTLE AND PIG STOCK BY REGIONSa) 1ST DECEMBER 2016

97
RegionsCattle Of which:
cows PigsOf which: breeding
sowsthousand heads
Pest, Budapest 79 29 211 12Central Hungary 79 29 211 12
Fejér 50 24 72 4Komárom-Esztergom 15 6 136 6Veszprém 47 20 93 7
Central Transdanubia 112 50 301 17Győr-Moson-Sopron 51 23 137 8Vas 36 17 33 2Zala 29 10 72 5
Western Transdanubia 116 50 242 15Baranya 33 18 255 15Somogy 48 21 101 3Tolna 25 10 143 7
Southern Transdanubia 106 49 500 25Borsod-Abaúj-Zemplén 51 26 86 6Heves 15 7 17 1Nógrád 19 9 8 0
Northern Hungary 84 42 110 8Hajdú-Bihar 101 49 352 25Jász-Nagykun-Szolnok 49 23 272 16Szabolcs-Szatmár-Bereg 46 21 128 8
Northern Great Plain 196 92 751 49Bács-Kiskun 77 37 337 19Békés 61 26 244 16Csongrád 39 18 176 11
Southern Great Plain 177 81 757 46Total 870 395 2,870 172
a)Thesumofpartfiguresmaydifferfromthetotal,duetorounding. Source:HungarianCentralStatisticalOffice
6.17. CATTLE AND PIG STOCK BY REGIONSa) 1ST DECEMBER 2017

98
RegionsSheep Of which:
ewes Chicken Of which: laying hens
thousand heads
Pest, Budapest 81 53 3,140 1,338Central Hungary 81 53 3,140 1,338
Fejér 30 19 832 503Komárom-Esztergom 7 6 2,524 1,381Veszprém 47 32 1,245 506
Central Transdanubia 85 57 4,601 2,390Győr-Moson-Sopron 13 3 1,183 741Vas 5 3 1,094 239Zala 9 5 1,506 525
Western Transdanubia 27 11 3,783 1,505Baranya 22 17 1,745 415Somogy 35 25 382 275Tolna 36 24 317 168
Southern Transdanubia 94 67 2,444 859Borsod-Abaúj-Zemplén 57 40 1,435 647Heves 21 16 405 152Nógrád 18 13 216 160
Northern Hungary 96 68 2,055 960Hajdú-Bihar 236 178 4,659 1,150Jász-Nagykun-Szolnok 88 65 760 428Szabolcs-Szatmár-Bereg 130 93 4,393 543
Northern Great Plain 453 336 9,812 2,120Bács-Kiskun 183 134 3,294 1,595Békés 72 46 1,318 506Csongrád 51 30 1,579 168
Southern Great Plain 305 210 6,191 2,269Total 1,141 801 32,027 11,440
a)Thesumofpartfiguresmaydifferfromthetotal,duetorounding. Source:HungarianCentralStatisticalOffice
6.18. SHEEP AND CHICKEN STOCK BY REGIONSa) 1ST DECEMBER 2016

99
RegionsSheep Of which:
ewes Chicken Of which: laying hens
thousand heads
Pest, Budapest 82 57 3,627 1,674Central Hungary 82 57 3,627 1,674
Fejér 30 21 892 550Komárom-Esztergom 9 6 2,231 1,199Veszprém 39 28 1,332 506
Central Transdanubia 77 55 4,454 2,254Győr-Moson-Sopron 9 3 1,243 658Vas 5 2 1,152 226Zala 10 5 1,694 414
Western Transdanubia 23 10 4,089 1,298Baranya 23 18 1,804 501Somogy 36 29 333 252Tolna 36 24 333 136
Southern Transdanubia 95 70 2,471 888Borsod-Abaúj-Zemplén 68 48 1,284 554Heves 22 17 430 111Nógrád 21 14 172 141
Northern Hungary 110 79 1,885 806Hajdú-Bihar 246 186 4,943 1,193Jász-Nagykun-Szolnok 78 52 898 406Szabolcs-Szatmár-Bereg 111 86 2,800 545
Northern Great Plain 436 323 8,642 2,144Bács-Kiskun 198 140 3,789 1,465Békés 73 46 1,339 496Csongrád 52 30 1,550 162
Southern Great Plain 323 217 6,678 2,123Total 1,146 810 31,844 11,188
a)Thesumofpartfiguresmaydifferfromthetotal,duetorounding. Source:HungarianCentralStatisticalOffice
6.19. SHEEP AND CHICKEN STOCK BY REGIONSa) 1ST DECEMBER 2017

100
Regions
Livestock per hundred hectares of agricultural area, head
cattle pigs
2016 2017 2016 2017
Pest, Budapest 20 21 51 56Central Hungary 20 21 51 56
Fejér 18 18 23 25Komárom-Esztergom 10 11 110 108Veszprém 24 25 48 50
Central Transdanubia 19 19 49 50Győr-Moson-Sopron 20 20 51 54Vas 21 21 18 19Zala 18 19 49 47
Western Transdanubia 20 20 41 41Baranya 13 13 89 102Somogy 15 16 49 34Tolna 10 10 56 59
Southern Transdanubia 13 13 64 64Borsod-Abaúj-Zemplén 15 16 29 27Heves 7 8 9 8Nógrád 19 20 9 9
Northern Hungary 13 14 19 18Hajdú-Bihar 24 23 84 80Jász-Nagykun-Szolnok 13 13 67 69Szabolcs-Szatmár-Bereg 12 13 38 37
Northern Great Plain 17 17 65 64Bács-Kiskun 15 16 71 68Békés 14 14 59 55Csongrád 13 13 64 61
Southern Great Plain 14 14 65 62Total 16 16 54 54
a) 1st December. Source:HungarianCentralStatisticalOffice
6.20. LIVESTOCK DENSITYa)

7. INTERNATIONAL DATA

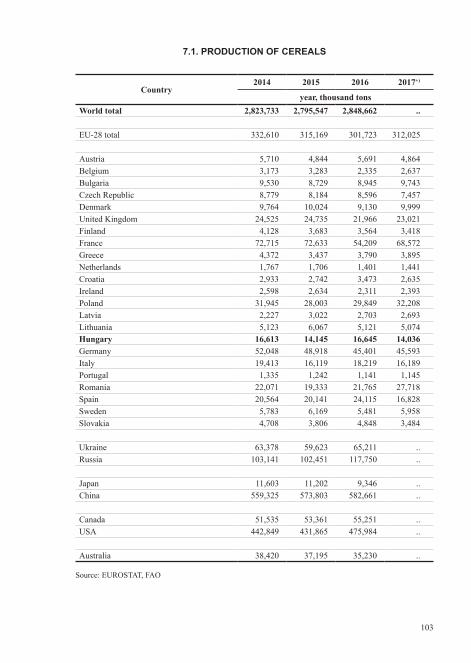
103
7.1. PRODUCTION OF CEREALS
Country2014 2015 2016 2017+)
year, thousand tonsWorld total 2,823,733 2,795,547 2,848,662 ..
EU-28 total 332,610 315,169 301,723 312,025
Austria 5,710 4,844 5,691 4,864Belgium 3,173 3,283 2,335 2,637Bulgaria 9,530 8,729 8,945 9,743Czech Republic 8,779 8,184 8,596 7,457Denmark 9,764 10,024 9,130 9,999United Kingdom 24,525 24,735 21,966 23,021Finland 4,128 3,683 3,564 3,418France 72,715 72,633 54,209 68,572Greece 4,372 3,437 3,790 3,895Netherlands 1,767 1,706 1,401 1,441Croatia 2,933 2,742 3,473 2,635Ireland 2,598 2,634 2,311 2,393Poland 31,945 28,003 29,849 32,208Latvia 2,227 3,022 2,703 2,693Lithuania 5,123 6,067 5,121 5,074Hungary 16,613 14,145 16,645 14,036Germany 52,048 48,918 45,401 45,593Italy 19,413 16,119 18,219 16,189Portugal 1,335 1,242 1,141 1,145Romania 22,071 19,333 21,765 27,718Spain 20,564 20,141 24,115 16,828Sweden 5,783 6,169 5,481 5,958Slovakia 4,708 3,806 4,848 3,484
Ukraine 63,378 59,623 65,211 ..Russia 103,141 102,451 117,750 ..
Japan 11,603 11,202 9,346 ..China 559,325 573,803 582,661 ..
Canada 51,535 53,361 55,251 ..USA 442,849 431,865 475,984 ..
Australia 38,420 37,195 35,230 ..
Source: EUROSTAT, FAO

104
Country2014 2015 2016 2017+)
year, thousand tonsWorld total 733,534 736,985 749,460 ..
EU-28 total 157,071 .. .. 152,156
Austria 1,804 1,726 1,977 1,443Belgium 1,919 2,076 1,447 1,593Bulgaria 5,347 5,140 5,801 6,135Czech Republic 5,442 5,274 5,455 4,718Denmark 5,153 5,030 4,202 4,834France 38,992 42,716 29,254 38,709Greece 1,664 1,140 1,593 1,691Poland 11,629 10,958 10,828 11,643Hungary 5,262 5,331 5,603 5,237United Kingdom 16,606 16,444 14,383 14,837Germany 27,785 26,550 24,464 24,482Italy 7,142 .. 8,038 6,966Romania 7,585 7,962 8,431 9,877Spain 6,471 6,363 7,873 4,948Slovakia 2,072 2,082 .. 1,771
Turkey 19,006 22,605 20,605 21,507Ukraine 24,114 26,532 26,099 ..Russia 59,711 61,786 73,295 ..
India 95,850 86,530 93,500 ..China 126,215 130,192 131,696 ..
Canada 29,419 27,594 30,487 ..USA 55,147 55,840 62,859 ..
Australia 25,303 23,743 22,275 ..
Source: EUROSTAT, FAO
7.2. PRODUCTION OF WHEAT

105
Country2014 2015 2016 2017+)
year, thousand tonsWorld total 144,488 148,456 141,278 ..
EU-28 total 60,808 61,928 60,071 59,169
Austria 846 840 860 782Belgium 400 434 346 375Bulgaria 852 715 709 608Czech Republic 1,967 1,991 1,845 1,712Denmark 3,548 3,856 3,950 3,992United Kingdom 6,911 7,370 6,655 7,169Estonia 458 557 357 426Finland 1,855 1,569 1,581 1,460France 11,775 13,028 10,435 12,085Greece 492 354 363 358Ireland 1,731 1,739 1,480 1,506Poland 3,275 2,961 3,441 3,957Lithuania 1,019 812 545 520Hungary 1,275 1,409 1,594 1,404Germany 11,563 11,630 10,731 10,853Italy 849 955 988 984Romania 1,713 1,626 1,817 2,105Spain 6,983 6,705 9,176 5,863Sweden 1,574 1,672 1,538 1,635Slovakia 676 669 585 545
Turkey 6,300 8,000 6,700 7,100Ukraine 9,046 8,288 9,436 ..Russia 20,444 17,546 17,993 ..
Canada 7,119 8,226 8,704 ..USA 3,953 4,666 4,339 ..
Australia 9,174 8,646 8,992 ..
Source: EUROSTAT, FAO
7.3. PRODUCTION OF BARLEY

106
Country2014 2015 2016 2017+)
year, thousand tonsWorld total 15,249 12,996 12,944 ..
EU-28 total .. .. .. 7,382
Austria 233 171 188 129Bulgaria .. 11 15 30Czech Republic 129 108 104 109Denmark .. 772 577 723France .. 123 98 109Greece 28 22 28 28Poland .. 2,013 2,200 2,750Hungary 96 104 84 85United Kingdom .. 57 49 51Latvia 114 160 141 129Italy 12 .. 13 11Romania 24 24 26 31Spain .. 281 377 130Slovakia .. 42 .. 32
Turkey 300 330 300 320Ukraine 478 391 392 ..Russia 3,281 2,087 2,541 ..
Egypt 90 91 96 ..
Canada 218 226 382 ..USA 183 292 342 ..
Australia 29 30 31 ..
Source: EUROSTAT, FAO
7.4. PRODUCTION OF RYE

107
Country2014 2015 2016 2017+)
year, thousand tonsWorld total 22,829 22,396 22,992 ..
EU-28 total 7,779 7,601 8,159 8,266
Austria 106 96 95 77Belgium 18 22 16 16Bulgaria 27 22 31 32Czech Republic 152 155 132 142Denmark 185 207 278 322United Kingdom 820 799 816 875Estonia 65 68 65 89Finland 1,039 980 1,035 1,014France 444 399 347 544Greece 81 83 118 129Netherlands 10 8 7 7Ireland 150 198 183 205Poland 1,459 1,220 1,358 1,487Latvia 155 160 146 134Lithuania 184 163 155 196Hungary 136 129 104 92Germany 627 566 536 577Italy 241 261 261 229Portugal 67 49 66 53Romania 382 348 381 379Spain 649 781 1,110 872Sweden 666 745 772 676Slovakia 39 43 36 35
Turkey 210 250 225 250Ukraine 612 489 500 ..Russia 5,274 4,536 4,761 ..
China 500 445 446 ..
Chile 610 421 533 ..
Canada 2,979 3,428 3,018 ..USA 1,019 1,300 940 ..
Source: EUROSTAT, FAO
7.5. PRODUCTION OF OATS

108
Country2014 2015 2016 2017+)
year, thousand tonsWorld total 1,038,330 1,010,609 1,060,107 ..
EU-28 total 77,508 58,942 62,836 65,440
Austria 2,334 1,638 2,180 2,076Belgium 779 693 481 598Bulgaria 3,137 2,697 2,226 2,563Czech Republic 832 443 846 588France 18,542 13,738 11,941 14,538Greece 1,824 1,542 1,448 1,424Netherlands 240 171 131 165Poland 4,468 3,156 4,343 3,984Hungary 9,315 6,633 8,730 6,811Germany 5,142 3,973 4,018 4,548Italy 9,250 7,074 6,840 6,049Portugal 897 828 711 778Romania 11,989 9,021 10,746 14,841Spain 4,776 4,564 4,070 3,754Slovakia 1,814 929 1,710 1,066Slovenia 351 339 346 272
Turkey 5,950 6,400 6,400 5,900Ukraine 28,497 23,328 28,075 ..Russia 11,332 13,173 15,310 ..
India 24,170 22,570 26,260 ..China 215,812 224,795 231,837 ..
Egypt 8,056 7,803 8,001 ..
Argentina 33,087 33,818 39,793 ..Brazil 79,882 85,285 64,143 ..Canada 11,487 135,591 123,494 ..Mexico 23,273 24,694 28,251 ..USA 361,091 345,486 384,778 ..
Source: EUROSTAT, FAO
7.6. PRODUCTION OF MAIZE
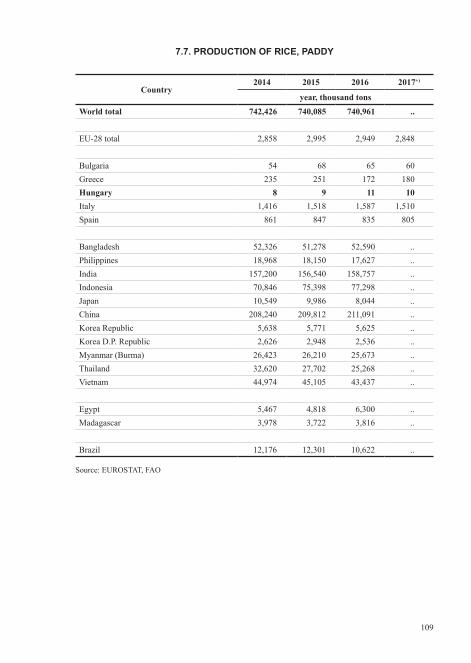
109
Country2014 2015 2016 2017+)
year, thousand tonsWorld total 742,426 740,085 740,961 ..
EU-28 total 2,858 2,995 2,949 2,848
Bulgaria 54 68 65 60Greece 235 251 172 180Hungary 8 9 11 10Italy 1,416 1,518 1,587 1,510Spain 861 847 835 805
Bangladesh 52,326 51,278 52,590 ..Philippines 18,968 18,150 17,627 ..India 157,200 156,540 158,757 ..Indonesia 70,846 75,398 77,298 ..Japan 10,549 9,986 8,044 ..China 208,240 209,812 211,091 ..Korea Republic 5,638 5,771 5,625 ..Korea D.P. Republic 2,626 2,948 2,536 ..Myanmar (Burma) 26,423 26,210 25,673 ..Thailand 32,620 27,702 25,268 ..Vietnam 44,974 45,105 43,437 ..
Egypt 5,467 4,818 6,300 ..Madagascar 3,978 3,722 3,816 ..
Brazil 12,176 12,301 10,622 ..
Source: EUROSTAT, FAO
7.7. PRODUCTION OF RICE, PADDY

110
Country2014 2015 2016 2017+)
year, thousand tonsWorld total 270,252 244,732 277,231 ..
EU-28 total 131,022 101,872 112,404 141,094
Austria 4,244 2,853 3,534 2,994Belgium 5,162 4,454 4,024 5,604Czech Republic 4,425 3,421 4,118 4,400Denmark 2,266 2,429 2,350 2,455France 37,931 33,503 34,644 46,257Netherlands 6,822 4,868 5,502 7,959Poland 13,489 9,365 13,524 14,040Hungary 1,067 911 1,121 1,076United Kingdom 9,310 6,218 5,687 9,000Germany 29,748 22,572 25,497 34,060Italy 3,784 2,184 2,046 2,454Romania 1,399 1,041 1,012 1,115Spain 3,723 3,605 3,014 3,454Sweden 2,518 1,178 1,988 1,964Slovakia 1,550 1,205 1,507 1,231
Turkey 16,573 16,023 19,465 20,828Ukraine 15,734 10,331 14,011 ..Russia 33,513 39,031 51,367 ..
Japan 3,567 3,925 3,189 ..China 8,000 8,032 8,096 ..
USA 28,381 32,088 33,458 ..
Source: EUROSTAT, FAO
7.8. PRODUCTION OF SUGAR-BEET

111
Country2014 2015 2016 2017+)
year, thousand tonsWorld total 42,584 44,369 47,345 ..
EU-28 total 9,287 7,906 8,770 10,415
Bulgaria 2,011 1,699 1,838 2,055France 1,559 1,186 1,183 1,620Hungary 1,597 1,557 1,875 1,893Romania 2,189 1,786 2,032 2,948Spain 953 769 772 888
Turkey 1,638 1,638 1,671 1,964Ukraine 10,134 11,181 13,627 ..Russia 8,475 9,280 11,010 ..
Argentina 2,063 3,158 3,000 ..USA 10,065 13,262 12,042 ..
Source: EUROSTAT, FAO
7.9. PRODUCTION OF SUNFLOWER SEEDS

112
Country2014 2015 2016 2017+)
year, thousand tonsWorld total 74,462 71,171 68,855 ..
EU-28 total 24,127 21,704 20,014 21,855
Austria 198 112 142 117Belgium 53 48 39 45Bulgaria 528 422 509 479Czech Republic 1,537 1,256 1,359 1,146Denmark 709 826 506 742France 5,510 5,307 4,738 5,385Poland 3,276 2,701 2,219 2,700Hungary 700 590 925 882United Kingdom 2,460 2,542 1,775 2,167Germany 6,247 5,017 4,580 4,276Italy 42 28 35 42Romania 1,059 919 1,293 1,672Spain 104 149 225 142Slovakia 449 321 431 449
Turkey 110 120 125 60Ukraine 2,198 1,738 1,154 ..Russia 1,338 1,012 999 ..
Canada 16,410 18,377 18,424 ..USA 1,140 1,306 1,404 ..
Australia 3,832 3,470 2,944 ..
Source: EUROSTAT, FAO
7.10. PRODUCTION OF RAPE SEED

113
Country2014 2015 2016 2017+)
year, thousand tonsWorld total 380,967 376,812 376,827 ..
EU-28 total 59,065 53,238 55,912 61,214
Austria 751 536 767 653Belgium 4,121 3,665 3,405 4,291Czech Republic 698 505 700 689Denmark 965 1,748 1,954 2,171United Kingdom 5,921 5,598 5,373 5,555Finland 600 532 588 612France 8,055 7,114 6,960 8,529Greece 613 560 495 294Netherlands 7,100 6,652 6,534 7,392Ireland 383 360 352 412Poland 7,424 6,152 8,624 9,006Lithuania 461 392 345 232Hungary 567 452 429 403Germany 11,607 10,370 10,772 11,720Italy 1,365 1,355 1,369 1,347Portugal 540 487 451 515Romania 3,519 2,700 2,690 3,128Spain 2,544 2,284 2,246 2,365Sweden 822 803 861 853Slovakia 179 145 177 150
Ukraine 23,693 20,839 21,750 ..Russia 31,501 33,646 31,108 ..
India 46,395 48,009 43,770 ..China 95,571 94,917 99,122 ..Japan 2,456 2,354 2,158 ..
Canada 4,589 4,327 4,324 ..USA 20,057 20,013 19,991 ..
Source: EUROSTAT, FAO
7.11. PRODUCTION OF POTATOES

114
Country2014 2015 2016 2017+)
year, thousand tonsWorld total 1,030,315 1,051,518 1,075,204 ..
EU-28 total .. .. 64,498 ..
Austria 689 560 616 598Bulgaria 390 434 664 555Denmark 308 289 316 333France 5,376 5,297 5,444 5,549Netherlands 4,918 4,923 4,833 5,339Poland 5,639 4,824 5,634 ..Hungary 1,514 1,601 1,609 1,458Germany 3,703 3,392 3,673 3,952Italy .. .. 12,629 ..Romania 2,645 2,491 2,277 2,454Slovakia 108 93 116 96
Turkey 30,419 29,552 30,267 30,826Ukraine 10,812 10,237 16,402 ..Russia 15,466 16,120 16,293 ..
India 125,133 118,045 119,906 ..Japan 9,923 9,935 9,845 ..China 508,400 535,037 543,162 ..
Egypt 16,288 16,370 16,802 ..
Brazil 8,953 8,714 8,973 ..Canada 2,103 2,144 2,315 ..Mexico 12,468 13,235 14,328 ..USA 35,662 34,112 33,119 ..
a) Melons included. Source:EUROSTAT,FAO,HungarianCentralStatisticaloffice
7.12. TOTAL PRODUCTION OF VEGETABLESa)

115
Country2014 2015 2016 2017+)
year, thousand tonsWorld total 85,500 86,222 89,329 ..
EU-28 total 12,896 12,768 12,540 ..
Austria 310 288 102 185Belgium 318 285 234 86Bulgaria 55 58 45 45Czech Republic 128 155 125 105Denmark 35 36 29 21France 1,848 1,968 1,807 1,723Greece 282 294 292 282Netherlands 353 336 317 227Poland 3,195 3,169 3,604 ..Hungary 780 511 486 460Germany 1,116 973 1,033 597Italy 2,474 2,488 2,456 1,912Portugal 274 325 254 329Romania 502 465 457 334Spain 621 598 621 587Slovakia 48 46 21 32Slovenia 71 84 43 14
Turkey 2,480 2,570 2,926 3,032Ukraine 1,085 1,180 1,099 ..Russia 1,624 1,613 1,844 ..
China 40,925 42,614 44,449 ..India 2,498 2,134 2,872 ..
Brazil 1,379 1,265 1,049 ..Argentina 930 950 968 ..
USA 5,359 4,538 4,649 ..
Source: EUROSTAT, FAO
7.13. PRODUCTION OF APPLE

116
Country2014 2015 2016 2017+)
year, thousand tonsWorld total 74,079 76,836 77,439 ..
EU-28 total 24,459 25,576 .. ..
Austria 266 302 260 331Bulgaria 133 262 211 202France 6,205 6,258 6,018 5,422Greece 1,071 1,038 1,024 1,014Hungary 406 472 449 405Italy 6,931 8,050 8,249 7,367Spain 6,222 5,799 6,103 5,387Portugal 819 935 801 896Romania 780 795 733 1,069
Turkey 4,175 3,650 4,000 4,200Ukraine 436 386 378 ..Russia 529 475 552 ..
China 12,628 13,755 14,843 ..India 2,585 2,602 2,590 ..
Egypt 1,596 1,687 1,717 ..
Argentina 2,635 2,416 1,758 ..Brazil 1,454 1,497 984 ..USA 7,153 6,965 7,098 ..
Australia .. .. .. .. Source: EUROSTAT, FAO
7.14. PRODUCTION OF GRAPES

117
Country2014 2015 2016 2017+)
year, thousand piecesWorld total 1,441,981 1,452,464 1,474,888 ..
EU-15 total 75,066 .. 75,541 74,802EU-28 total 88,406 .. 89,134 88,423
Austria 1,961 1,958 1,954 1,943Belgium 2,477 2,503 2,501 2,386Czech Republic 1,373 1,366 1,340 1,366Denmark 1,553 1,566 1,554 1,558France 19,271 19,406 19,004 18,580Netherlands 4,169 4,315 4,294 4,030Ireland 6,243 6,422 6,613 6,674Poland 5,660 5,763 5,970 6,036Hungary 802 821 852 870United Kingdom 9,693 9,816 9,806 9,787Germany 12,742 12,635 12,467 12,281Italy .. .. 6,315 6,350Portugal 1,549 1,606 1,635 1,670Romania 2,069 2,092 2,050 2,011Spain 6,079 6,183 6,318 6,466Slovakia 466 457 446 440
Turkey 14,245 14,128 14,222 16,105Ukraine 4,398 3,884 3,750 ..Russia 19,564 19,264 18,992 ..
India 187,000 185,044 185,987 ..China 80,653 82,266 84,523 ..
Argentina 51,647 51,430 52,637 ..Brazil 212,366 215,221 218,225 ..Canada 12,220 11,925 12,035 ..Mexico 32,940 33,503 33,919 ..USA 88,526 89,143 91,918 ..
Australia 29,103 27,413 24,971 ..
Source: EUROSTAT, FAO
7.15. CATTLE

118
Country2014 2015 2016 2017+)
year, thousand piecesWorld total 987,854 990,507 981,797 ..
EU-15 total 122,837 124,150 122,697 125,093EU-28 total 148,331 148,716 147,188 150,000
Austria 2,868 2,845 2,793 2,820Belgium 6,350 6,364 6,177 6,108Czech Republic 1,607 1,555 1,479 1,532Denmark 12,709 12,702 12,281 12,832France 13,300 13,307 12,791 13,097Netherlands 12,065 12,453 11,881 12,296Poland 11,266 10,590 11,107 11,908Hungary 3,136 3,124 2,907 2,870United Kingdom 4,510 4,422 4,538 4,713Germany 28,339 27,652 27,376 27,578Italy 8,676 8,675 8,478 8,571Romania 5,042 4,927 4,708 4,406Spain 26,568 28,367 29,232 29,971Slovakia 642 633 586 614
Ukraine 7,764 7,351 7,079 ..Russia 19,081 19,546 21,506 ..
Japan 9,537 9,419 9,313 ..India 10,000 9,864 9,085 ..China 480,096 471,550 456,773 ..
Brazil 37,930 39,795 39,950 ..Canada 12,940 13,248 12,770 ..Mexico 16,099 16,364 16,753 ..USA 67,776 67,389 71,500 ..
Source: EUROSTAT, FAO
7.16. PIGS
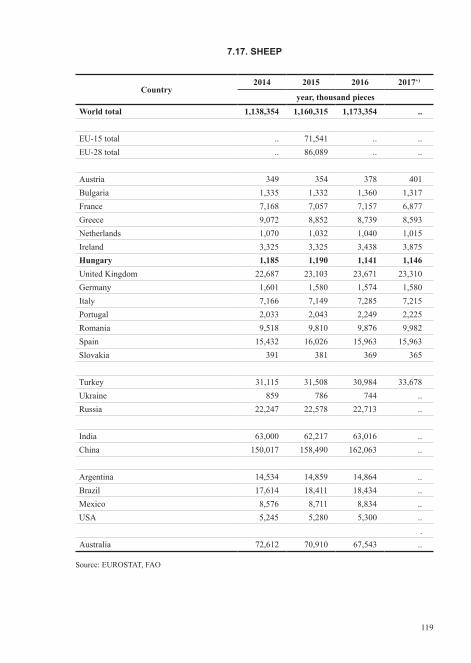
119
Country2014 2015 2016 2017+)
year, thousand piecesWorld total 1,138,354 1,160,315 1,173,354 ..
EU-15 total .. 71,541 .. ..EU-28 total .. 86,089 .. ..
Austria 349 354 378 401Bulgaria 1,335 1,332 1,360 1,317France 7,168 7,057 7,157 6,877Greece 9,072 8,852 8,739 8,593Netherlands 1,070 1,032 1,040 1,015Ireland 3,325 3,325 3,438 3,875Hungary 1,185 1,190 1,141 1,146United Kingdom 22,687 23,103 23,671 23,310Germany 1,601 1,580 1,574 1,580Italy 7,166 7,149 7,285 7,215Portugal 2,033 2,043 2,249 2,225Romania 9,518 9,810 9,876 9,982Spain 15,432 16,026 15,963 15,963Slovakia 391 381 369 365
Turkey 31,115 31,508 30,984 33,678Ukraine 859 786 744 ..Russia 22,247 22,578 22,713 ..
India 63,000 62,217 63,016 ..China 150,017 158,490 162,063 ..
Argentina 14,534 14,859 14,864 ..Brazil 17,614 18,411 18,434 ..Mexico 8,576 8,711 8,834 ..USA 5,245 5,280 5,300 ..
.Australia 72,612 70,910 67,543 ..
Source: EUROSTAT, FAO
7.17. SHEEP

120
Country2014 2015 2016 2017+)
year, thousand tonsWorld total 117,264 117,877 118,169 ..
EU-15 total 19,228 19,852 20,211 20,000EU-28 total 22,357 23,112 23,563 23,362
Austria 526 528 511 505Belgium 1,118 1,124 1,061 1,045Czech Republic 236 228 220 211Denmark 1,594 1,599 1,567 1,530France 2,158 2,163 2,206 2,177Netherlands 1,371 1,456 1,453 1,456Poland 1,838 1,906 1,963 1,990Hungary 369 409 432 435United Kingdom 862 898 919 903Germany 5,507 5,562 5,579 5,455Italy 1,328 1,486 1,544 1,467Spain 3,620 3,855 4,181 4,299
Ukraine 7,426 7,597 7,480 ..Russia 2,974 3,099 3,368 ..
India 350 344 316 ..China 57,662 55,835 55,041 ..
Argentina 442 483 522 ..Brazil 3,193 3,431 3,514 ..Mexico 1,291 1,323 1,376 ..USA 10,368 11,121 11,320 ..
Australia 362 371 377 ..
Source: EUROSTAT, FAO
7.18. PIGMEAT PRODUCTION

121
Country2014 2015 2016 2017+)
year, thousand tonsWorld total 65,283 64,958 65,974 ..
EU-15 total .. 6,808 6,968 6,921EU-28 total .. 7,584 7,801 7,803
Austria 222 229 227 226Belgium 258 268 278 282Czech Republic 66 68 72 68Denmark 126 121 129 124France 1,419 1,453 1,464 1,442Netherlands 376 383 416 439Poland 413 471 501 559Hungary 23 26 28 27United Kingdom 878 883 912 905Germany 1,128 1,124 1,148 1,124Italy 709 788 810 756Spain 579 626 637 644
Ukraine 413 384 376 ..Russia 1,654 1,649 1,619 ..
India 961 923 909 ..China 6,566 66,705 7,012 ..
Argentina 2,674 2,727 2,644 ..Brazil 9,723 9,425 9,284 ..Mexico 1,827 1,845 1,879 ..USA 11,698 10,777 11,470 ..
Australia 2,595 2,662 2,361 ..
Source: EUROSTAT, FAO
7.19. BEEF AND VEAL PRODUCTION

122
Country2013 2014 2015 2016
year, thousand tonsWorld total 656,701 666,761 659,150 ..
EU-28 total 159,716 162,928 162,909 ..
Austria 3,494 3,538 3,628 ..Belgium 3,710 3,826 3,895 4,031Czech Republic 2,933 3,026 3,065 ..Denmark 5,162 5,336 5,436 ..France 25,728 25,820 25,139 25,008Netherlands 12,660 13,522 14,000 ..Poland 12,986 13,236 13,244 13,694Hungary 1,876 1,941 1,918 1,968United Kingdom 15,088 15,457 14,938 ..Germany 32,381 32,671 32,672 ..Italy 11,500 11,426 11,886 12,199Romania 4,101 3,981 3,934 ..Spain 6,780 7,029 7,124 ..Slovakia 931 931 905 ..
Ukraine 10,860 10,359 10,137 ..Russia 30,511 30,522 30,495 ..
Japan 7,334 7,379 7,394 ..China 37,610 37,923 37154 ..
Brazil 35,124 34,610 33,625 ..Canada 8,400 7,450 7,517 ..Mexico 11,130 11,395 11,608 ..USA 93,465 94,618 96,359 ..
a) Cow milk production. Source: EUROSTAT, FAO
7.20. MILK PRODUCTIONa)

123
Country2014 2015 2016 2017+)
year, thousand personsWorld total .. .. .. ..
EU-15 total 4,422 4,338 4,415 4,340EU-28 total 9,291 9,055 8,737 8,615
Austria 172 161 160 145Belgium 51 49 52 50Bulgaria 201 200 196 210Cyprus 14 13 11 8Czech Republic 134 143 144 142Denmark 61 63 63 56United Kingdom 316 286 292 302Estonia 23 24 24 22Finland 93 90 82 82France 719 694 727 670Greece 454 436 424 422Netherlands 157 162 166 162Croatia 133 129 106 103Ireland 87 88 91 88Poland 1,749 1,793 1,655 1,610Latvia 63 67 66 60Lithuania 116 115 101 97Luxembourg 3 2 2 3Hungary 187 203 215 218Malta 2 3 2 2Germany 517 511 496 487Italy 754 786 826 811Portugal 236 206 195 182Romania 2,096 1,900 1,693 1,696Spain 725 725 761 806Slovakia 82 76 71 67Slovenia 69 53 38 44Sweden 77 79 78 75
a)Totalemploymentinagriculture,gamemanagementandfisherysector,agegroup15-64. Source: EUROSTAT
7.21. EMPLOYMENTa)

124
percent change
Member statesCrop products Animal products Total
2016/2015 2017/2016 2016/2015 2017/2016 2016/2015 2017/2016
Belgium 11.5 -3.6 -2.1 12.3 3.3 5.5Bulgaria -4.6 -4.1 -5.8 7.9 -4.9 -0.6Czech Republic -3.0 3.4 -7.1 14.1 -4.9 8.0Denmark -1.9 -2.2 -5.0 13.1 -4.1 8.3Germany 2.7 -2.1 -2.4 16.1 -0.2 8.2Ireland 3.5 -1.8 -5.8 11.3 -4.8 9.8Greece -1.2 1.8 -2.3 -0.5 -1.5 1.1France 2.8 0.6 -1.2 5.8 1.3 2.6Croatia -1.0 5.2 -2.5 3.8 -1.7 4.5Italy -3.3 6.5 -3.8 8.1 -3.5 7.1Cyprus 3.5 17.1 5.0 1.9 3.8 10.3Latvia -1.5 3.0 -0.4 31.3 -0.9 16.8Lithuania -7.3 5.7 -1.1 21.1 -4.0 14.1Luxembourg -0.7 1.2 -1.1 12.4 -1.0 9.7Hungary -5.9 3.1 -0.7 9.2 -4.0 5.4Malta 9.4 -12.2 -1.1 1.7 3.2 -4.3Netherlands 3.8 3.5 -4.6 15.4 0.1 8.6Austria -1.0 5.2 -1.8 10.1 -1.4 8.2Poland 0.3 4.8 0.7 12.0 0.5 8.8Portugal 11.6 0.0 -5.5 7.2 3.3 3.3Romania 0.1 1.8 -2.4 6.5 -0.5 2.9Slovenia 4.0 8.8 -5.6 7.7 -2.3 8.1Slovakia -5.8 4.0 -4.6 5.5 -5.2 4.7Finland 1.9 2.0 -5.9 3.1 -2.8 2.6Sweden 0.2 4.9 2.7 8.6 1.6 7.1United Kingdom 5.4 7.0 -3.7 12.5 0.0 10.1Spain -3.1 7.3 -3.5 9.0 -3.3 8.0
Source: EUROSTAT
7.22. PRODUCER PRICE INDICES, NOMINAL VALUE

125
percent change
Member states Intermediate consumption Capital formation Total
2016/2015 2017/2016 2016/2015 2017/2016 2016/2015 2017/2016
Belgium -1.4 3.3 1.9 3.1 -0.8 3.3Bulgaria -4.6 1.6 5.2 -2.9 -4.2 1.4Czech Republic -4.0 1.5 1.0 1.2 -3.4 1.4Denmark -1.0 1 3.5 5.7 -0.2 1.9Germany -3.4 1.4 1.6 2.3 -2.1 1.5Ireland -3.0 -0.7 0.3 0.5 -2.6 -0.5Greece -2.3 3.1 0.1 1.4 -1.6 2.6France -3.2 0.8 0.6 2.1 -2.3 1.0Croatia -5.7 -0.7 0.1 1.0 -4.9 -0.4Italy -1.1 1.7 1.3 0.7 -0.5 1.5Cyprus -5.3 1.3 4.1 -2.8 -5.2 1.8Latvia -2.3 0.6 0.6 1.5 -1.7 0.8Lithuania -12.8 2.4 4.4 -18.2 -10.1 -1.4Luxembourg -4.1 1.7 1.3 1.8 -1.8 1.8Hungary -2.1 -0.1 1.9 2.7 -1.5 0.3Malta -1.7 0.7 3.2 -0.2 -0.7 0.5Netherlands -5.3 3.8 2.2 1.6 -3.9 3.3Austria -1.1 1.6 1.2 2.1 -0.2 1.9Poland -1.8 2.2 -0.1 1.4 -1.7 2.2Portugal -0.9 -0.3 0.5 1.4 -0.8 -0.1Romania -3.1 1 -6.7 14.7 -3.8 3.1Slovenia -3.3 0.4 1.3 2.1 -1.9 0.9Slovakia -5.4 0.2 1.8 3.8 -4.6 0.5Finland -4.1 2 0.4 0.8 -2.7 1.6Sweden -2.2 2.5 1.7 2.7 -1.3 2.5United Kingdom -2.9 5.7 0.5 1.8 -2.3 5.0Spain -3.3 0.4 -0.8 1.1 -2.9 0.5
Source: EUROSTAT
7.23. INPUT PRICE INDICES, NOMINAL VALUE
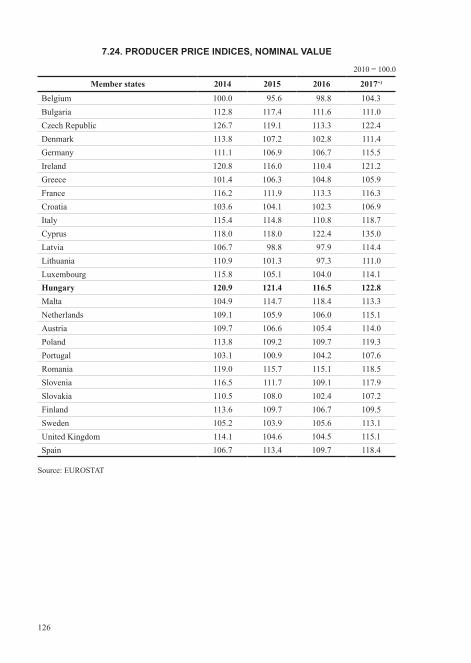
126
2010 = 100.0
Member states 2014 2015 2016 2017+)
Belgium 100.0 95.6 98.8 104.3Bulgaria 112.8 117.4 111.6 111.0Czech Republic 126.7 119.1 113.3 122.4Denmark 113.8 107.2 102.8 111.4Germany 111.1 106.9 106.7 115.5Ireland 120.8 116.0 110.4 121.2Greece 101.4 106.3 104.8 105.9France 116.2 111.9 113.3 116.3Croatia 103.6 104.1 102.3 106.9Italy 115.4 114.8 110.8 118.7Cyprus 118.0 118.0 122.4 135.0Latvia 106.7 98.8 97.9 114.4Lithuania 110.9 101.3 97.3 111.0Luxembourg 115.8 105.1 104.0 114.1Hungary 120.9 121.4 116.5 122.8Malta 104.9 114.7 118.4 113.3Netherlands 109.1 105.9 106.0 115.1Austria 109.7 106.6 105.4 114.0Poland 113.8 109.2 109.7 119.3Portugal 103.1 100.9 104.2 107.6Romania 119.0 115.7 115.1 118.5Slovenia 116.5 111.7 109.1 117.9Slovakia 110.5 108.0 102.4 107.2Finland 113.6 109.7 106.7 109.5Sweden 105.2 103.9 105.6 113.1United Kingdom 114.1 104.6 104.5 115.1Spain 106.7 113.4 109.7 118.4
Source: EUROSTAT
7.24. PRODUCER PRICE INDICES, NOMINAL VALUE

127
2010 = 100.0
Member states 2014 2015 2016 2017+)
Belgium 109.7 107.8 107.0 110.5Bulgaria 110.8 107.0 102.5 103.9Czech Republic 114.1 111.2 107.4 108.9Denmark 118.2 116.4 116.1 118.3Germany 114.2 112.6 110.2 111.9Ireland 113.2 110.8 107.9 107.3Greece 108.0 105.6 103.9 106.6France 111.1 108.8 106.3 107.4Croatia 107.5 103.9 98.8 98.4Italy 112.4 109.1 108.5 110.1Cyprus 114.6 116.0 110.0 112.0Latvia 114.3 112.3 110.4 111.3Lithuania 118.8 121.5 109.2 107.7Luxembourg 112.2 110.1 108.2 110.1Hungary 118.6 117.2 115.4 115.7Malta 112.9 111.5 110.7 111.2Netherlands 110.5 108.7 104.5 108.0Austria 113.2 112.9 112.7 114.8Poland 116.3 112.7 110.7 113.2Portugal 115.0 112.9 112.0 111.9Romania 120.0 115.3 110.9 114.3Slovenia 113.6 110.4 108.3 109.3Slovakia 110.7 104.3 99.5 100.0Finland 116.1 114.2 111.1 112.9Sweden 108.9 109.5 108.1 110.8United Kingdom 112.2 107.1 104.6 109.8Spain 112.6 111.6 108.4 109.0
Source: EUROSTAT
7.25. PURCHASING PRICE INDEX OF AGRICULTURAL GOOD AND SERVICES, NOMINAL VALUE