20161207 BlueSense Infopack
13
BlueSense Behavorial Analytics Solutions
-
Upload
erik-van-den-brom -
Category
Documents
-
view
152 -
download
0
Transcript of 20161207 BlueSense Infopack
BlueSenseBehavorial Analytics Solutions
2© 2016 KPMG N.V., a Dutch limited liability company, is a member firm of the KPMG network of independent member firms affiliated with KPMG International Cooperative (‘KPMG International’), a Swiss entity. All rights reserved.
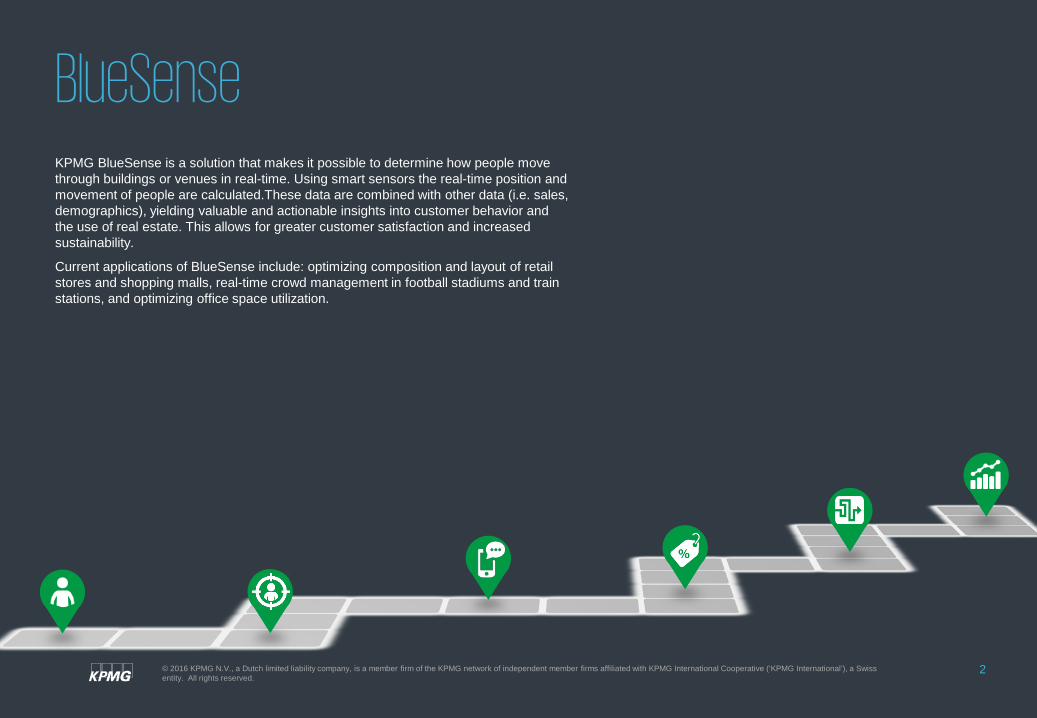
KPMG BlueSense is a solution that makes it possible to determine how people move through buildings or venues in real-time. Using smart sensors the real-time position and movement of people are calculated.These data are combined with other data (i.e. sales, demographics), yielding valuable and actionable insights into customer behavior and the use of real estate. This allows for greater customer satisfaction and increased sustainability.
Current applications of BlueSense include: optimizing composition and layout of retail stores and shopping malls, real-time crowd management in football stadiums and train stations, and optimizing office space utilization.
BlueSense
3© 2016 KPMG N.V., a Dutch limited liability company, is a member firm of the KPMG network of independent member firms affiliated with KPMG International Cooperative (‘KPMG International’), a Swiss entity. All rights reserved.
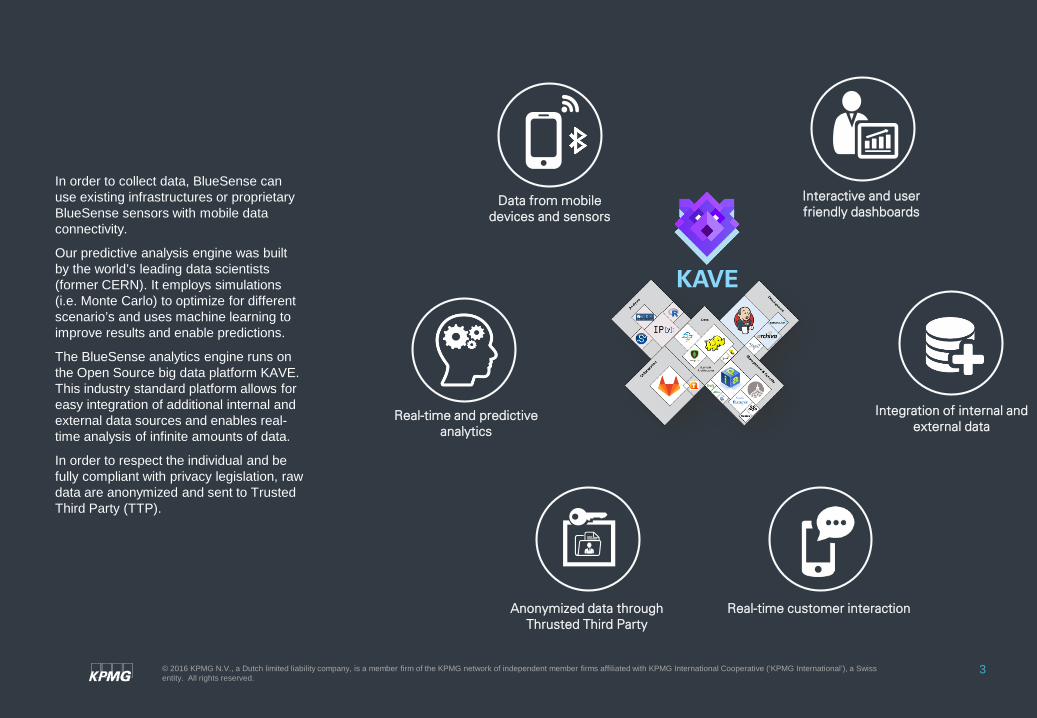
In order to collect data, BlueSense can use existing infrastructures or proprietary BlueSense sensors with mobile data connectivity.
Our predictive analysis engine was built by the world’s leading data scientists (former CERN). It employs simulations (i.e. Monte Carlo) to optimize for different scenario’s and uses machine learning to improve results and enable predictions.
The BlueSense analytics engine runs on the Open Source big data platform KAVE. This industry standard platform allows for easy integration of additional internal and external data sources and enables real-time analysis of infinite amounts of data.
In order to respect the individual and be fully compliant with privacy legislation, raw data are anonymized and sent to Trusted Third Party (TTP).
Integration of internal and external data
Anonymized data through Thrusted Third Party
Interactive and user friendly dashboards
KAVE
Real-time customer interaction
Data from mobile devices and sensors
Real-time and predictive analytics
4© 2016 KPMG N.V., a Dutch limited liability company, is a member firm of the KPMG network of independent member firms affiliated with KPMG International Cooperative (‘KPMG International’), a Swiss entity. All rights reserved.
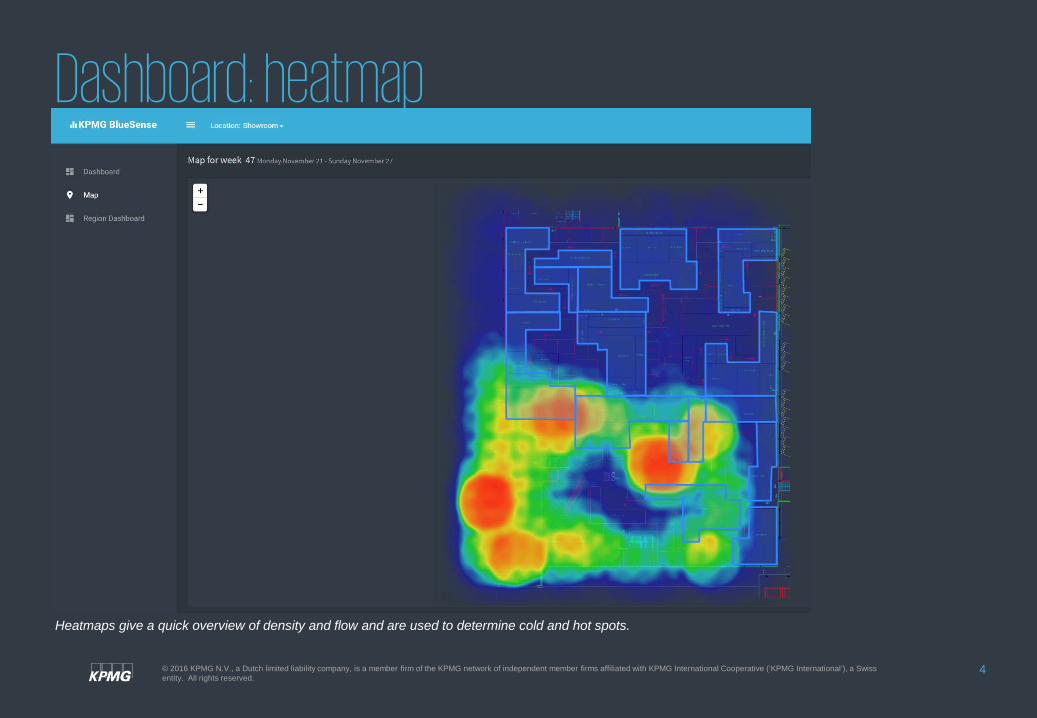
Dashboard: heatmap
Heatmaps give a quick overview of density and flow and are used to determine cold and hot spots.
5© 2016 KPMG N.V., a Dutch limited liability company, is a member firm of the KPMG network of independent member firms affiliated with KPMG International Cooperative (‘KPMG International’), a Swiss entity. All rights reserved.
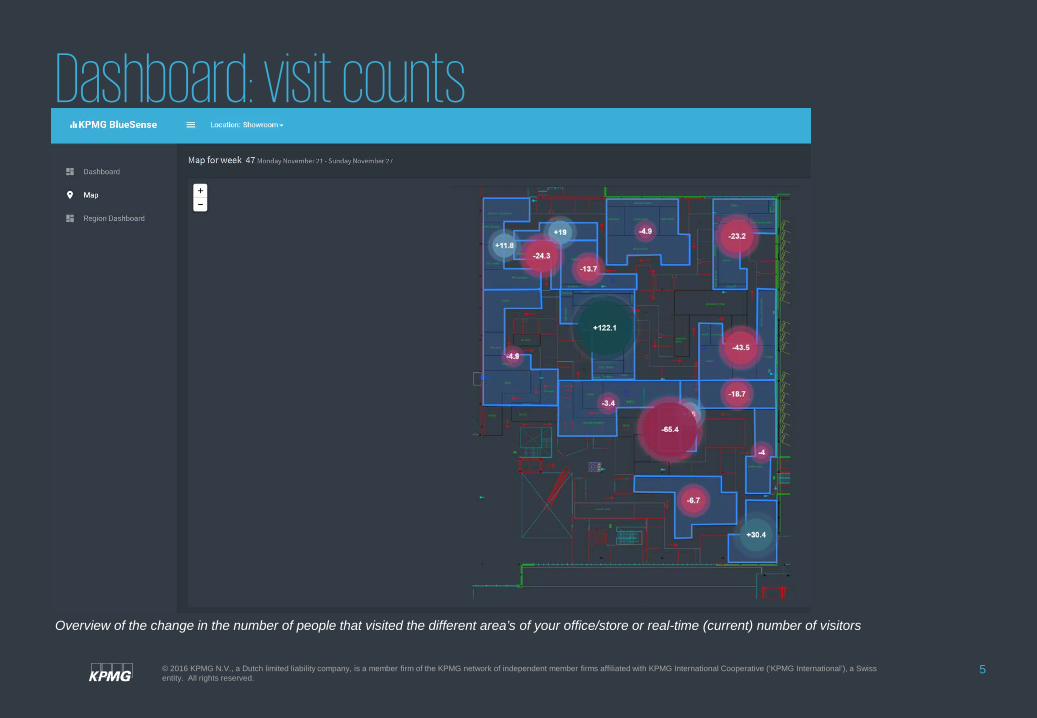
Dashboard: visit counts
Overview of the change in the number of people that visited the different area’s of your office/store or real-time (current) number of visitors
6© 2016 KPMG N.V., a Dutch limited liability company, is a member firm of the KPMG network of independent member firms affiliated with KPMG International Cooperative (‘KPMG International’), a Swiss entity. All rights reserved.
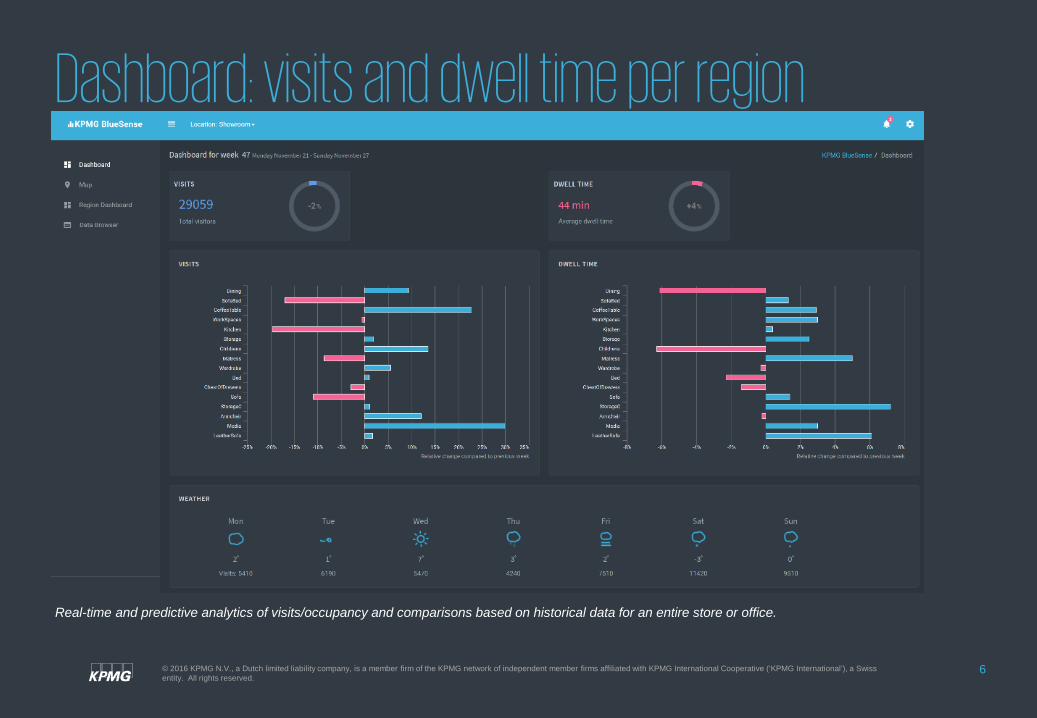
Real-time and predictive analytics of visits/occupancy and comparisons based on historical data for an entire store or office.
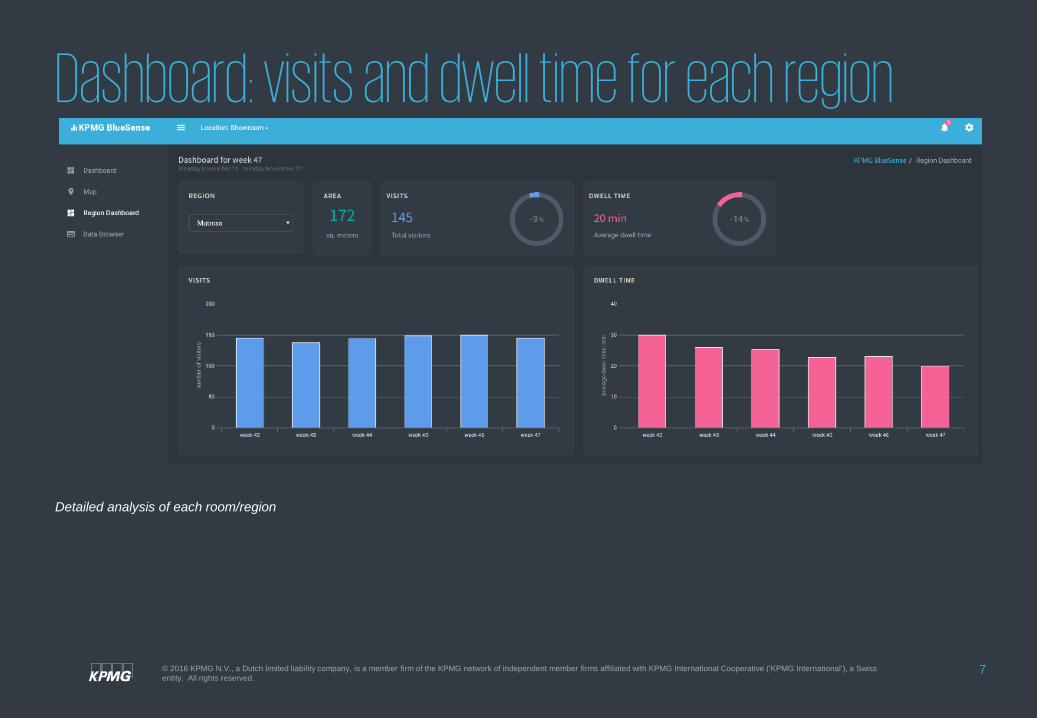
Dashboard: visits and dwell time per region
7© 2016 KPMG N.V., a Dutch limited liability company, is a member firm of the KPMG network of independent member firms affiliated with KPMG International Cooperative (‘KPMG International’), a Swiss entity. All rights reserved.
Detailed analysis of each room/region
Dashboard: visits and dwell time for each region

Credentials
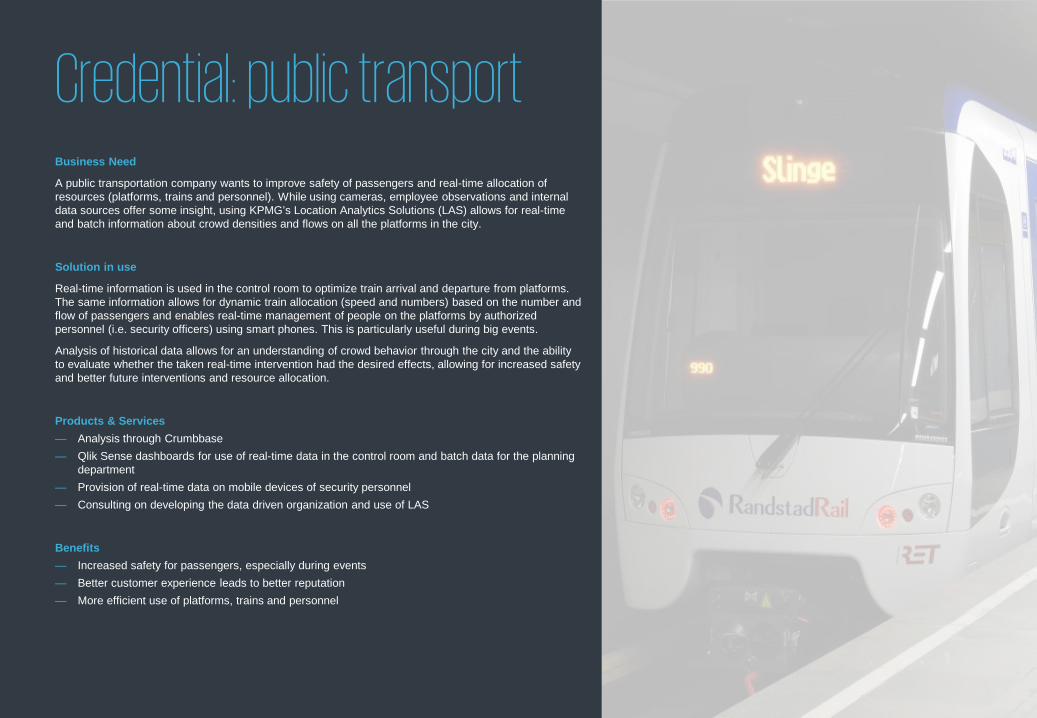
Credential: public transportBusiness Need
A public transportation company wants to improve safety of passengers and real-time allocation of resources (platforms, trains and personnel). While using cameras, employee observations and internal data sources offer some insight, using KPMG’s Location Analytics Solutions (LAS) allows for real-time and batch information about crowd densities and flows on all the platforms in the city.
Solution in use
Real-time information is used in the control room to optimize train arrival and departure from platforms. The same information allows for dynamic train allocation (speed and numbers) based on the number and flow of passengers and enables real-time management of people on the platforms by authorized personnel (i.e. security officers) using smart phones. This is particularly useful during big events.
Analysis of historical data allows for an understanding of crowd behavior through the city and the ability to evaluate whether the taken real-time intervention had the desired effects, allowing for increased safety and better future interventions and resource allocation.
Products & Services— Analysis through Crumbbase— Qlik Sense dashboards for use of real-time data in the control room and batch data for the planning
department— Provision of real-time data on mobile devices of security personnel— Consulting on developing the data driven organization and use of LAS
Benefits— Increased safety for passengers, especially during events— Better customer experience leads to better reputation— More efficient use of platforms, trains and personnel
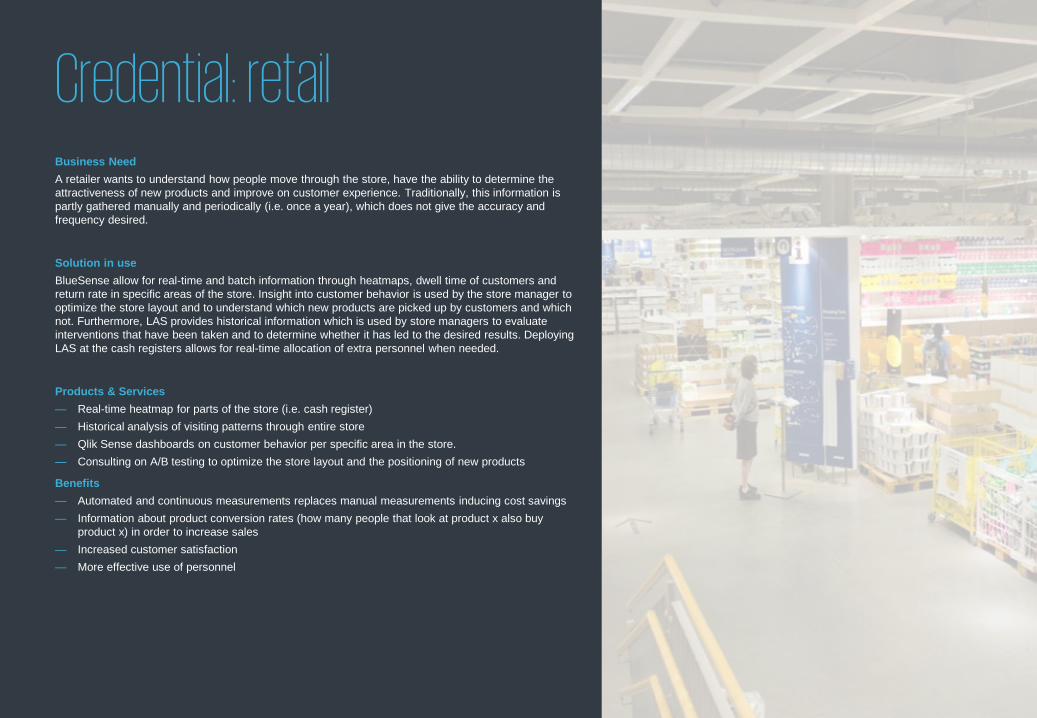
Credential: retailBusiness NeedA retailer wants to understand how people move through the store, have the ability to determine the attractiveness of new products and improve on customer experience. Traditionally, this information is partly gathered manually and periodically (i.e. once a year), which does not give the accuracy and frequency desired.
Solution in useBlueSense allow for real-time and batch information through heatmaps, dwell time of customers and return rate in specific areas of the store. Insight into customer behavior is used by the store manager to optimize the store layout and to understand which new products are picked up by customers and which not. Furthermore, LAS provides historical information which is used by store managers to evaluate interventions that have been taken and to determine whether it has led to the desired results. Deploying LAS at the cash registers allows for real-time allocation of extra personnel when needed.
Products & Services— Real-time heatmap for parts of the store (i.e. cash register)— Historical analysis of visiting patterns through entire store— Qlik Sense dashboards on customer behavior per specific area in the store. — Consulting on A/B testing to optimize the store layout and the positioning of new products
Benefits— Automated and continuous measurements replaces manual measurements inducing cost savings— Information about product conversion rates (how many people that look at product x also buy
product x) in order to increase sales— Increased customer satisfaction— More effective use of personnel
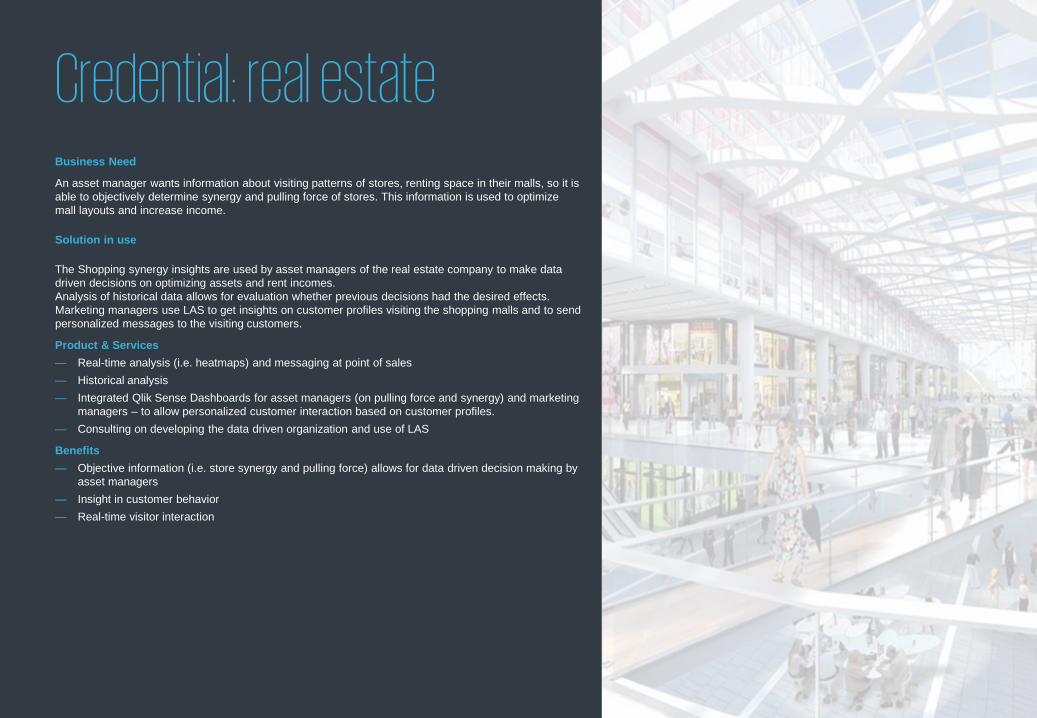
Credential: real estateBusiness Need
An asset manager wants information about visiting patterns of stores, renting space in their malls, so it is able to objectively determine synergy and pulling force of stores. This information is used to optimize mall layouts and increase income.
Solution in use
The Shopping synergy insights are used by asset managers of the real estate company to make data driven decisions on optimizing assets and rent incomes. Analysis of historical data allows for evaluation whether previous decisions had the desired effects. Marketing managers use LAS to get insights on customer profiles visiting the shopping malls and to send personalized messages to the visiting customers.
Product & Services— Real-time analysis (i.e. heatmaps) and messaging at point of sales— Historical analysis— Integrated Qlik Sense Dashboards for asset managers (on pulling force and synergy) and marketing
managers – to allow personalized customer interaction based on customer profiles. — Consulting on developing the data driven organization and use of LAS
Benefits— Objective information (i.e. store synergy and pulling force) allows for data driven decision making by
asset managers — Insight in customer behavior— Real-time visitor interaction
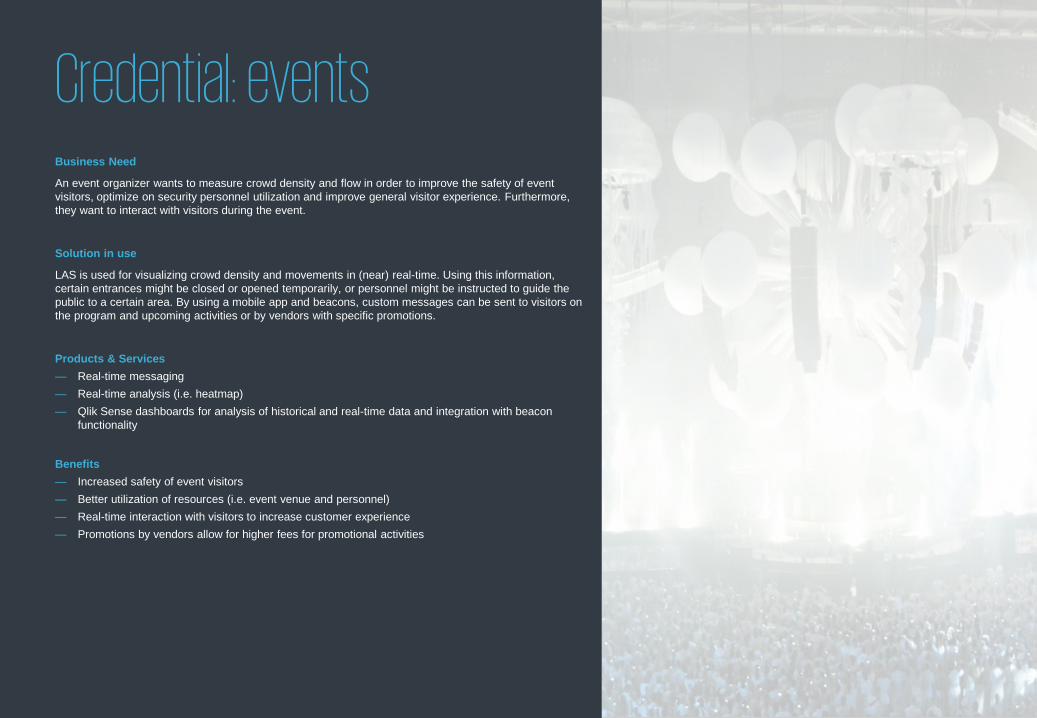
Credential: eventsBusiness Need
An event organizer wants to measure crowd density and flow in order to improve the safety of event visitors, optimize on security personnel utilization and improve general visitor experience. Furthermore, they want to interact with visitors during the event.
Solution in use
LAS is used for visualizing crowd density and movements in (near) real-time. Using this information, certain entrances might be closed or opened temporarily, or personnel might be instructed to guide the public to a certain area. By using a mobile app and beacons, custom messages can be sent to visitors on the program and upcoming activities or by vendors with specific promotions.
Products & Services— Real-time messaging— Real-time analysis (i.e. heatmap) — Qlik Sense dashboards for analysis of historical and real-time data and integration with beacon
functionality
Benefits— Increased safety of event visitors— Better utilization of resources (i.e. event venue and personnel)— Real-time interaction with visitors to increase customer experience— Promotions by vendors allow for higher fees for promotional activities
KPMG on social media KPMG app
© 2016 KPMG Advisory N.V., registered with the trade register in the Netherlands under number 33263682, is a member firm of the KPMG network of independent member firms affiliated with KPMG International Cooperative (‘KPMG International’), a Swiss entity. All rights reserved.
The KPMG name and logo are registered trademarks of KPMG International.


![[IJBC 2013] Infopack 2](https://static.fdocuments.net/doc/165x107/568c0d9b1a28ab955a8d5f76/ijbc-2013-infopack-2.jpg)