20160202 Financial Statement Analysis - MyCourses of Financial Statement Data • Measures period...
70
Financial Statement Analysis for Valuation
Transcript of 20160202 Financial Statement Analysis - MyCourses of Financial Statement Data • Measures period...

Financial Statement Analysis for Valuation

Introduction to Financial
Statements

Financial Statement What and For Whom?
What? A compulsory, public (EU law) and standardized (IFRS, law) report on company financials. For Whom? Shareholders Financial intermediaries Analysts Other companies Investors Regulators

COMPANY´S ECONOMIC ENVIRONMENT
“Main Street” “Wall Street” cash from customers cash to and from owners cash to suppliers cash to and from debt holders
4
Assets (business
operations)
Equity
Debt

Nature of Financial Statement Data
• Measures period results • Relies heavily on historical (vs market) values • Uses accrual (vs cash) accounting which is based on rules
(IFRS, US GAAP, laws) and managerial judgment • Externally audited • Augmented with additional notes and reports • Managers have incentives to manage earnings, e.g. for
executive compensation, loan covenants, share issue, taxes • Quality of accounting depends on management skills and
whether flexibility is used to give “truer” or “non-truer” view

Krishna G. Palepu, Paul M. Healy and Erik Peek, Business Analysis and Valuation: 3rd IFRS Edition © Copyright Cengage Learning EMEA 2013
BUSINESS STRATEGY ANALYSIS

Key Financial Statements Statement of profit or loss
- Revenues, Expenses, Profit (period result) Balance sheet
- Assets, Liabilities, Equity (book value) Statement of cash flows
- Cash Flows (Operating, Investing, Financing) Statement of comprehensive income
- Non-owner changes in equity (not shown in Income Statement)
Statement of changes in equity - detailed changes in components of equity

SIMPLIFIED INCOME STATEMENT (ADOPTED FROM: PWC GUIDE ON IFRS)
Continuing operations Revenue Cost of sales of goods Gross profit Administrative expenses Other Income Operating profit Finance costs – net Profit before income tax Income tax expense Profit from continuing operations Profit from discontinued operation Profit for the period
Profit attributable to owners Profit attributable to Non-controlling interests
8
https://inform.pwc.com/inform2/s/Illustrative_IFRS_consolidated_financial_statements_for_2015_year_ends/informContent/1536293207143629#ic_1536293207143629

SIMPLIFIED BALANCE SHEET, ASSETS (ADOPTED FROM: PWC GUIDE TO IFRS)
ASSETS Non-current assets Property, plant and equipment Intangible assets Deferred tax assets Investments Other non-current assets Current assets Inventories Trade and other receivables Financial assets Cash and cash equivalents Other current assets Total assets
9
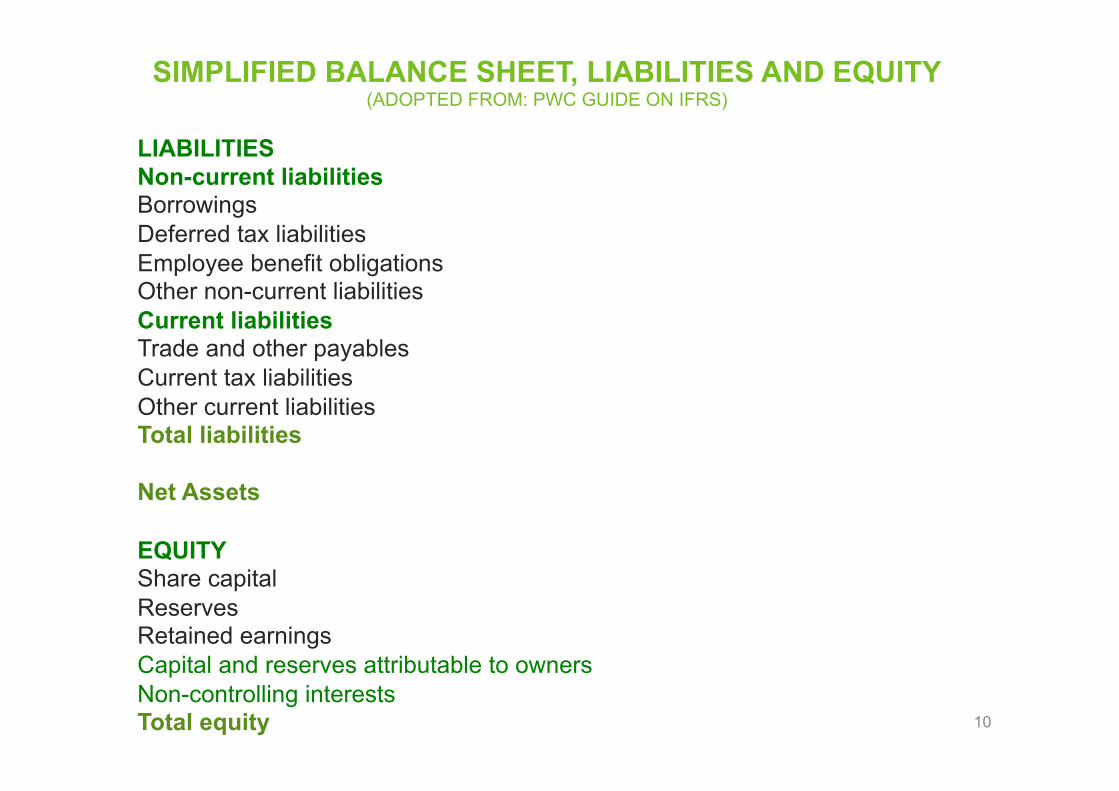
SIMPLIFIED BALANCE SHEET, LIABILITIES AND EQUITY (ADOPTED FROM: PWC GUIDE ON IFRS)
LIABILITIES Non-current liabilities Borrowings Deferred tax liabilities Employee benefit obligations Other non-current liabilities Current liabilities Trade and other payables Current tax liabilities Other current liabilities Total liabilities Net Assets EQUITY Share capital Reserves Retained earnings Capital and reserves attributable to owners Non-controlling interests Total equity
10

SIMPLIFIED STATEMENT OF CASH FLOWS (ADOPTED FROM: PWC GUIDE TO IFRS)
Cash generated from operations Interest paid Income taxes paid Net cash inflow from operating activities Purchases/sale of assets Other investment activities Dividends received Interest received Net cash (outflow) from investing activities Proceeds from issuance of shares Payment for shares bought back Dividends paid Other financing activities Net cash inflow (outflow) from financing activities Net increase (decrease) in cash and cash equivalents 11

Key Concepts of Financial Statement
4.2.16 Laitoksen nimi
12
Revenues (realization principle) Expenses (matching and conservatism principle)
Profit = Revenues – Expenses Assets (produce future benefits) Liabilities (obligations to be met in the future)
Assets = Liabilities + Equity
Ending Equity = Beginning Equity + Comprehensive Income - Amounts Paid to Shareholders + Amounts Received from Shareholders Ending Retained Earnings = Beginning Retained Earnings + Net Income - Dividends

Accounting vs Cash Flow/Market Value Both are needed for getting a complete picture. Differences: Recognition of revenues in time 1. ACCOUNTING CASH 2. CASH ACCOUNTING Recognition of expenses in time 1. ACCOUNTING CASH 2. CASH ACCOUNTING Value of assets or liabilities 1. ACCOUNTING < MARKET 2. MARKET < ACCOUNTING
4.2.16 Laitoksen nimi
13

Accounting Flexibility
In good use: - accrual items are matched to firm’s true economics - recognition and capitalization is based on best estimates
In bad use:
- flexibility in recognition, capitalization, depreciation, fair value etc. is used to manage earnings and balance sheet - accounting policies are changed to change results - future obligations are not reported (off-balance sheet)
4.2.16 Laitoksen nimi
14
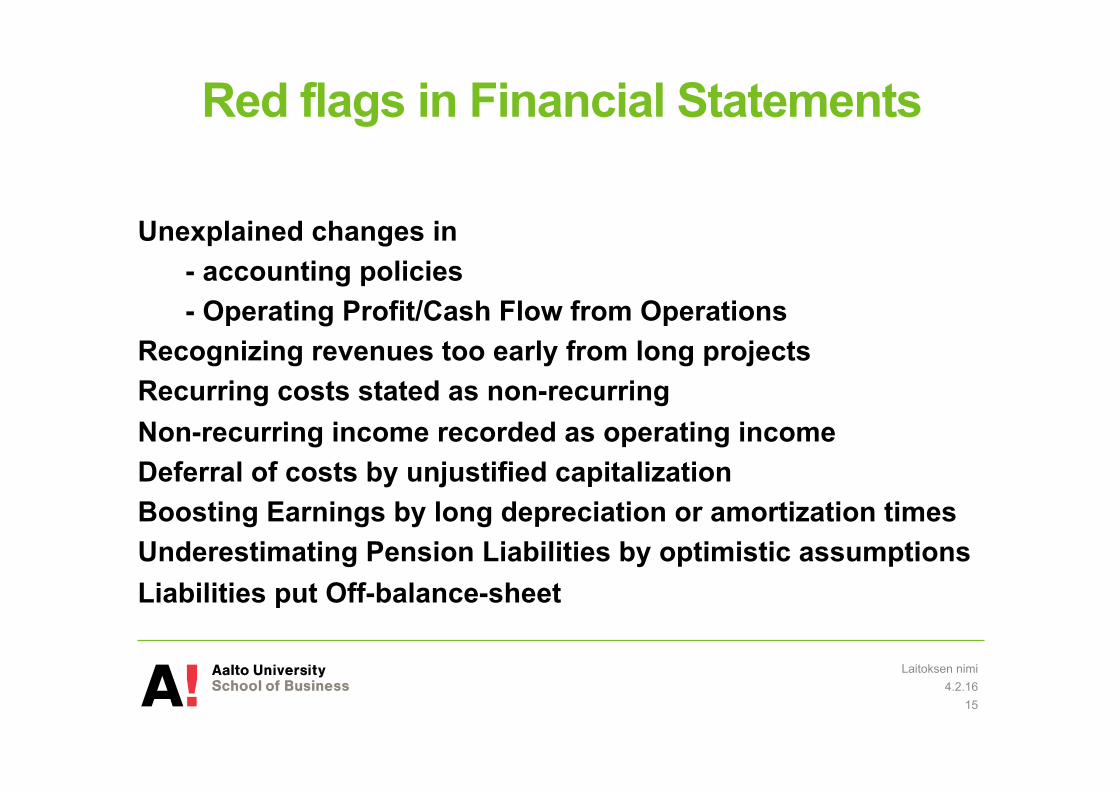
Red flags in Financial Statements
Unexplained changes in - accounting policies - Operating Profit/Cash Flow from Operations
Recognizing revenues too early from long projects Recurring costs stated as non-recurring Non-recurring income recorded as operating income Deferral of costs by unjustified capitalization Boosting Earnings by long depreciation or amortization times Underestimating Pension Liabilities by optimistic assumptions Liabilities put Off-balance-sheet
4.2.16 Laitoksen nimi
15

Standardizing and adjusting Financial
Statements
4.2.16 Laitoksen nimi
16

Why adjustments?
Valuation is based on the concept of “similar companies”:
• Cost of equity, beta, risk-level • After Tax Cost of debt, debt ratings • Price / Earnings • Return on Equity • Debt to Equity • Growth of Sales • Enterprise Value/EBITDA
Need similar concepts and measurement of Equity, Debt, Net Income, Sales, Taxes, EBIT, …
4.2.16 Laitoksen nimi
17

Templates IFRS full model Financial Statement templates, see
https://inform.pwc.com http://www.iasplus.com
In the following we go through our textbook (Palepu et al) template. 1. Using a common template is mostly reorganizing line-items. - e.g. Net Profit and Total Assets do not change 2. Readjustments correct and restate some items.
- accounting items change (e.g. profits, equity, assets) - cash items do not normally change (e.g. cash balance, dividends) 4.2.16
Laitoksen nimi
18

Income Statement Income Statement (by function)
Sales (e.g. revenue, turnover, commissions) Cost of Sales (cost of products sold, depreciation on manufacturing)
Gross profit SG&A (administrative, sales, depreciation on admin. facilities) Other operating income, net of expense ( R&D, start-up costs) Operating profit Investment income (income from associates, dividend income, rental income)
Other Income, Net of Other Expense (forex gains/losses, asset impairments, restructuring) Interest Income Interest Expense Profit before tax Tax expense Profit from continuing operations Net gain/loss from Discontinued Operations Profit after tax Minority interest – Income Statement (profit attributable to non-controlling interests) Net profit to ordinary shareholders
4.2.16 Laitoksen nimi
19
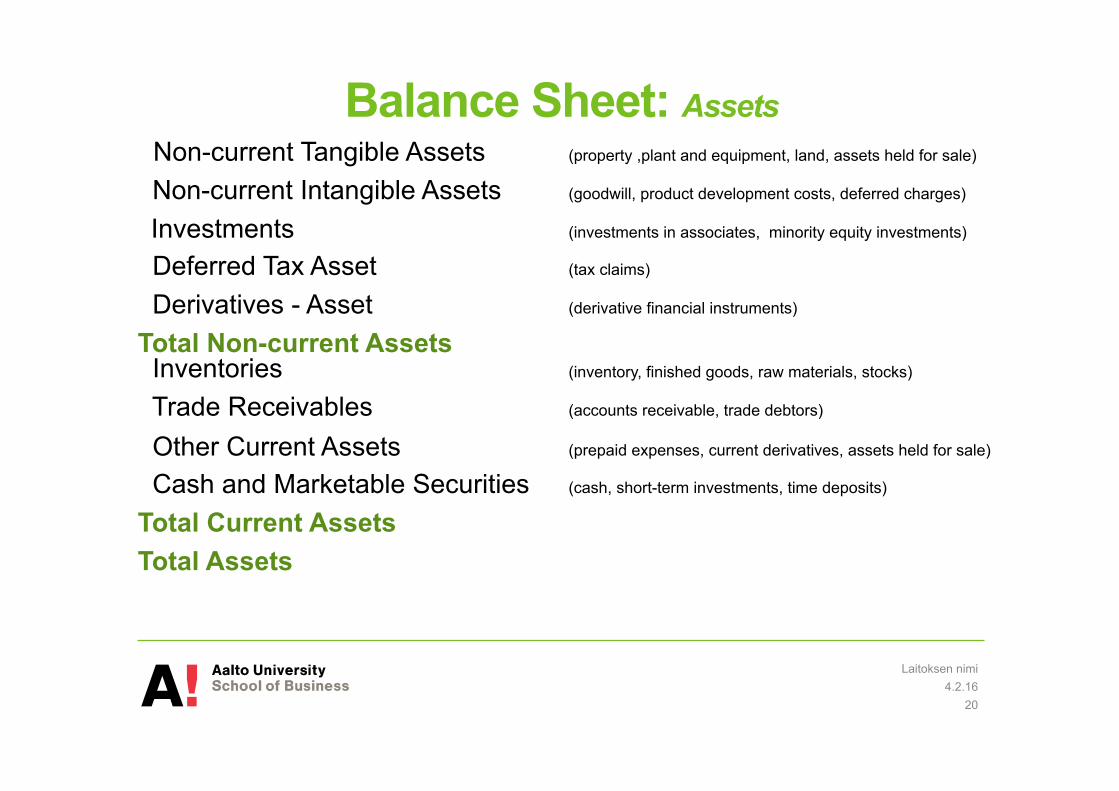
Balance Sheet: Assets Non-current Tangible Assets (property ,plant and equipment, land, assets held for sale)
Non-current Intangible Assets (goodwill, product development costs, deferred charges)
Investments (investments in associates, minority equity investments) Deferred Tax Asset (tax claims) Derivatives - Asset (derivative financial instruments)
Total Non-current Assets Inventories (inventory, finished goods, raw materials, stocks)
Trade Receivables (accounts receivable, trade debtors)
Other Current Assets (prepaid expenses, current derivatives, assets held for sale)
Cash and Marketable Securities (cash, short-term investments, time deposits)
Total Current Assets Total Assets
4.2.16 Laitoksen nimi
20

Balance Sheet: Liabilities and Shareholders’ Equity Ordinary Shareholders’ Equity (share capital, share premium, retained earnings, treasury shares)
Minority Interest – Balance Sheet (non-controlling interest)
Preference Shares (preference shares, convertible preference shares)
Total Equity Non-current Debt (long-term borrowings, finance lease obligations, pension benefits)
Deferred Tax Liability (tax claims against the company)
Derivatives – Liability Other Non-Current Liabilities (non-interest bearing liabilities) Total Non-current Liabilities Trade Payables (accounts payable, trade creditors)
Current Debt (current borrowings, current portion of non-current borrowings)
Other Current Liabilities (accrued expenses, income tax liabilities, dividends payable) Total Current Liabilities Total Liabilities and Shareholders’ Equity
4.2.16 Laitoksen nimi
21

Statement of Cash Flows (Palepu et al) Net Profit (from Income Statement)
Non-Operating Gains (Losses) (gain on disposal of assets, gain on foreign exchange)
Non-Current Operating Accruals (depreciation and amortization, deferred revenues, costs, taxes)
Operating Cash Flow Before Working Capital Investments Net Investments in Working Capital (changes in receivables, payables, inventories, provisions) Operating Cash Flow Before Investment in Non-current Assets Interest received Dividends Received Net Investment in Non-current Operating Assets (R&D, CAPEX, acquisitions) Free Cash Flow Available to Debt and Equity Interest Paid Net Debt (Repayment) or Issuance (principal payments, issuance of debt, net change in borrowings)
Free Cash Flow Available to Equity Dividends (Payments) (cash dividends on ordinary/preferred shares, distributions)
Net Share (Repurchase) or Issuance (issue of shares, repurchase, issue of subsidiary equity)
Net Increase (Decrease) in Cash Balance
4.2.16 Laitoksen nimi
22

Readjustments to Financial
Statements
4.2.16 Laitoksen nimi
23
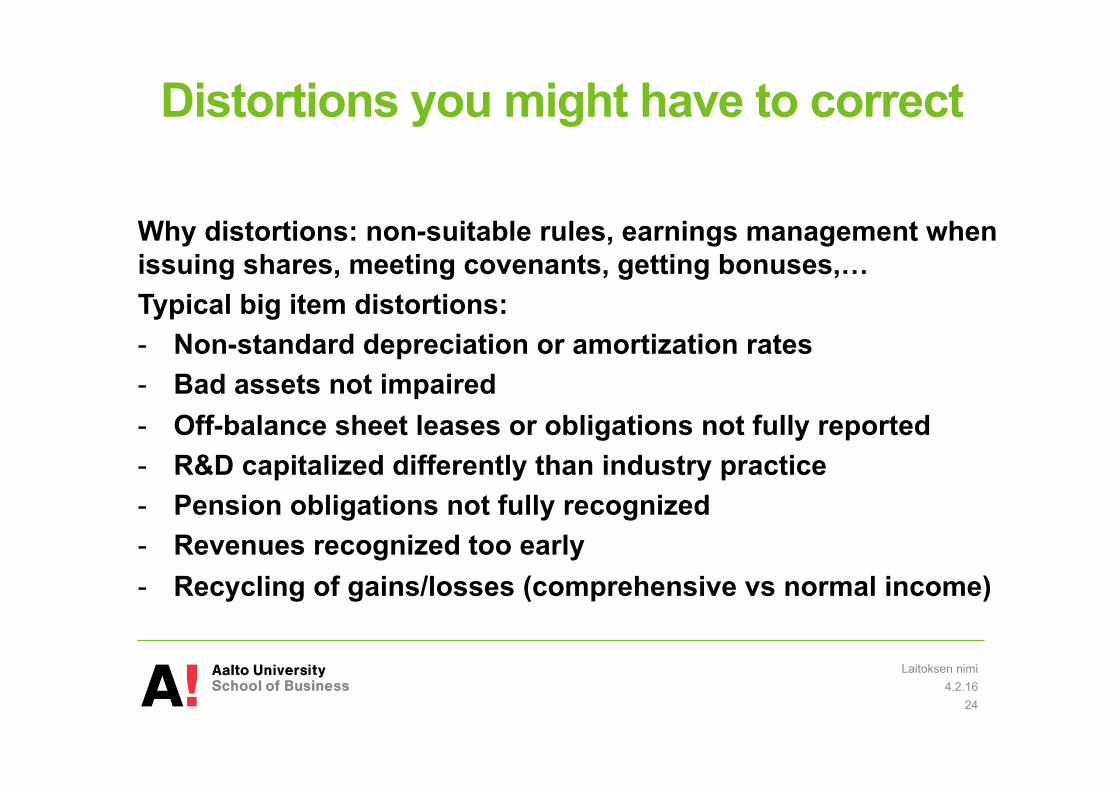
Distortions you might have to correct
Why distortions: non-suitable rules, earnings management when issuing shares, meeting covenants, getting bonuses,… Typical big item distortions: - Non-standard depreciation or amortization rates - Bad assets not impaired - Off-balance sheet leases or obligations not fully reported - R&D capitalized differently than industry practice - Pension obligations not fully recognized - Revenues recognized too early - Recycling of gains/losses (comprehensive vs normal income)
4.2.16 Laitoksen nimi
24

Readjustments, Asset impairment Suppose a company is believed to have overstated fair value of its acquisition, and consequently goodwill. You want to write-down assets that company has not written down (Palepu p.162) The price of acquisition was 129.4M£. Company estimated fair value of net assets to be 79.2M£ and goodwill 50.2M£. Bad asset you want to impair is worth 72.4M£. Tax rate is 28%. Write-down will create the following readjustments Assets will go down by the value of written down asset. Shareholders’ Equity will go down. Deferred Tax Liability will go down. Other Expenses will go up. Tax Expense will go down.
4.2.16 Laitoksen nimi
25

Readjustments, Asset Impairment(2) Needed equations Retained Earnings(t) = Retained Earnings(t-1) + Profits(t) Assets = Liabilities + Shareholders’ Equity Profits = Revenues - Expenses Price = Fair value of Net Assets(to Equity) + Goodwill(to IntangibleAssets) Income Statement ∆Other Expenses = 72.4M£ ∆Tax Expense = TaxRate x ∆Profit = 0.28 x(- 72.4M£) = -20.3M£ ∆Profit = ∆(Revenues – Expenses) = -(72.4M£ + (-20.3M£)) = -52.1M£ Balance Sheet ∆Assets = -72.4M£ ∆DefTaxLiability = TaxRate x ∆(BookAssets-TaxAssets) = 0.28 x (-72.4) = -20.3M£ ∆Shareholders’ Equity = ∆Retained Earnings = ∆Profit = -52.1M£
4.2.16 Laitoksen nimi
26

Operating vs. Financial Lease Payments
4.2.16 Laitoksen nimi
27
Opera&ng lease Asset = 1000, interest rate 10% pa, 5 years
Year 0 Year 1 Year 2 Year 3 Year 4 Year 5 Total Lease Payment PMT= 263.80 263.80 263.80 263.80 263.80 1318.99 Assets= 0.00 0.00 0.00 0.00 0.00 0.00 Debt= 0.00 0.00 0.00 0.00 0.00 0.00 Interest= 0.00 0.00 0.00 0.00 0.00 0.00 Cash Out 263.80 263.80 263.80 263.80 263.80 1318.99
Financial lease Asset = 1000, interest rate 10% pa, 5 years
Year 0 Year 1 Year 2 Year 3 Year 4 Year 5 Total Lease Payment PMT= 0.00 0.00 0.00 0.00 0.00 0.00 Assets= 1000.00 800.00 600.00 400.00 200.00 0.00
Debt, PV of annuiHes = 1000.01 836.21 656.03 457.83 239.82 0.00 Interest payment= 100.00 83.62 65.60 45.78 23.98 318.99 Principal payment = 163.80 180.18 198.19 218.01 239.82 1000.00 Cash Out 263.80 263.80 263.80 263.80 263.80 1318.99
* In Excel, payments from PMT(0.1,5,1000,0,0)

Operating Lease
4.2.16 Laitoksen nimi
28
INCOME STATEMENT
Year 0 Year 1 Year 2 Year 3 Year 4 Year 5 Total
Sales 500.00 500.00 500.00 500.00 500.00 2500.00
leasing costs 263.80 263.80 263.80 263.80 263.80 1319.00
Profit before taxes 236.20 236.20 236.20 236.20 236.20 1181.00
Taxes (50%)= 118.10 118.10 118.10 118.10 118.10 590.50
Net Profit 118.10 118.10 118.10 118.10 118.10 590.50
BALANCE SHEET, Assets
Leasing Assets 0.00 0.00 0.00 0.00 0.00
Other Assets 700.00 700.00 700.00 700.00 700.00
Cash 118.10 236.20 354.30 472.40 590.50
Total Assets 818.10 936.20 1054.30 1172.40 1290.50
BALANCE SHEET, Equity & Liabili&es
Equity 700.00 818.10 936.20 1054.30 1172.40 1290.50 (0% div.)
Debt 0.00 0.00 0.00 0.00 0.00
Equity and Liabili&es 818.10 936.20 1054.30 1172.40 1290.50

Financial Lease INCOME STATEMENT
Year 0 Year 1 Year 2 Year 3 Year 4 Year 5 Total Sales 500.00 500.00 500.00 500.00 500.00 2500.00
deprecia&on 200.00 200.00 200.00 200.00 200.00 1000.00
interest payment 100.00 83.62 65.60 45.78 23.98 318.99
Profit before taxes 200.00 216.38 234.40 254.22 276.02 1181.01
Taxes (50%) 100.00 108.19 117.20 127.11 138.01 590.50
Net Profit 100.00 108.19 117.20 127.11 138.01 590.50
BALANCE SHEET, Assets
Leasing Assets 1000.00 800.00 600.00 400.00 200.00 0.00
Other Assets 700.00 700.00 700.00 700.00 700.00
Cash 0.00 136.20 264.22 383.22 492.31 590.51
Total Assets 1636.20 1564.22 1483.22 1392.31 1290.51
BALANCE SHEET, Equity & Liabili&es
Equity 700.00 800.00 908.19 1025.39 1152.50 1290.50 (0% div.)
Debt 1000.01 836.21 656.03 457.83 239.82 0.00
Equity and Liabili&es 1636.21 1564.22 1483.22 1392.31 1290.50
4.2.16 Laitoksen nimi
29

Financial ratios in operating vs. financial leases
OPERATING LEASE FINANCIAL LEASE
4.2.16 Laitoksen nimi
30
Year 0 Year 1 Year 2 Year 3 Year 4 Year 5 ROA (Net Profit/Total Assets) 0.14 0.13 0.11 0.10 0.09 ROE (Net Profit/Equity) 0.14 0.13 0.11 0.10 0.09 D/E (Debt/Equity) 0.00 0.00 0.00 0.00 0.00
Year 0 Year 1 Year 2 Year 3 Year 4 Year 5 ROA (Net Profit/Total Assets) 0.06 0.07 0.08 0.09 0.11 ROE (Net Profit/Equity) 0.12 0.12 0.11 0.11 0.11 D/E (Debt/Equity) 1.05 0.72 0.45 0.21 0.00

Some formulas for the above example Payment from Excel PMT function (or with NPV formulas) Equity(t) = Equity(t-1) + Net Profit(t) Interest payment(t) = Interest Rate * Ending Debt Balance(t-1) Leasing Debt(t) = Leasing Debt(t-1) – Principal Payment(t) Leasing Payment(t) = Interest Payment(t) + Principal Payment(t) Cash Assets(t), Oper. Lease = Cash Assets(t-1), Oper. Lease + Net Profit(t) Cash Assets(t), Fin. Lease = Cash Assets(t-1), Fin. Lease
+Net Profit(t) + Depreciation(t) – Principal Payment(t)
4.2.16 Laitoksen nimi
31

Adjustments, Leasing
Operating Lease is like rental, Financial Lease is like buy with debt. Analyst may want to capitalize all operating leases to make debt visible. Transforming operating to financial leases causes the following changes. Previous (Beginning) Balance Sheet
- Non-Current Asset is increased - Non-Current Liabilities is increased
Current (Ending) Balance Sheet
- Legacy increase of Non-Current Assets from Previous Balance Sheet - Legacy increase of Non-Current Liabilities from Previous Balance Sheet - Change in Leased Asset Base (new leases – depreciation) - Repayment of Lease Debt - Change in Deferred Tax Liability through change in Taxes - Change in Shareholders’ Equity through change in Net Profit
4.2.16 Laitoksen nimi
32

Adjustments, Leasing(2) Income Statement
Cost of Sales is decreased by lease expense Cost of Sales is increased by depreciation expense Interest Expense is increased by interest on lease capital Tax is increased
Example (Palepu, p. 152, second ed., similar p. 143 third ed. ) Lease Assets = PV(Estimated lease payments for 7 years; cost of debt = 4.7%) (2007) = PV(75.3)+PV(68.5,49.9,45.2,37.0,37.0,11.9; 4.7%) = 71.9+209.7 = 281.6 (2008) = PV(76.1)+PV(54.8,49.0,40.5,24.4,24.4,16.7; 4.7%) = 72.7+176.4 = 249.1 New Leases 2008 deduced from forecasts vs actual
value of 2007 forecast of lease debt for 2008 = 209.7*1.047 = 219.6 actual lease debt in 2008 = 249.1 increase from long term lease debt value = 249.1 – 219.6 = 29.5
4.2.16 Laitoksen nimi
33

Adjustments Leasing (3) forecasted annual lease payments for 2008 = 75.3 actual lease payments for 2008 = 82.6 increase in annual lease payments 2008 = (82.6 – 75.3) = 7.3
total increase in leased assets in 2008 = 29.5 + 7.3 = 36.8 Depreciation expense of leased assets in 2008
Asset at the beginning of 2008 = 281.6 Assets increased in 2008 (in the middle of the year) = 36.8
Depreciation in 2008 = (281.6 + 0.5*36.8)/7 = 42.9 Net Change in (Lease) Assets 2008 = 36.8 – 42.9 = -6.1 Division of lease payment to interest and principal
Interest = 4.7% x (281.6 +0.5 x 36.8) = 14.1 Repayment of Debt = 82.6 – 14.1 = 68.5
4.2.16 Laitoksen nimi
34

Adjustments, Leasing (4) Changes in taxes in financial reporting (not actual taxes)
leasing expenses in original operating lease = 82.6 leasing expenses in financial lease = 42.9 + 14.1 = 57.0
increase in tax(26%) expense = 0.26 * (82.6 – 57.0) = 6.7 increase in Deferred Tax Liability = 6.7 Adjustments to Balance Sheet 2007 (=beginning value for 2008)
Assets: Leased assets +281.6 Liabilities: Lease Debt +281.6
Adjustments to Income Statement 2008 ∆Profit Before Tax = ∆Lease expense -∆Depreciation -∆Interest
= 82.6 - 42.9 - 14.1 = +25.6 ∆Taxes = 26% x 25.6 = +6.7 (Not paid so also ∆Def.TaxLiab. = 6.7) ∆Net Profit = ∆(PBT – Taxes) = ∆PBT - ∆Taxes = +25.6 – 6.7 = +18.9
4.2.16 Laitoksen nimi
35

Adjustments, Leasing (5) Adjustments to Balance Sheet 2008 Assets ∆Non-Current Assets = ∆Beginning Lease Assets + ∆New Lease Assets - ∆Depreciation of Lease Assets = 281.6 + 36.8 – 42.9 = 275.5 Equity and Liabilities ∆Shareholders’ Equity = ∆Net Profit = 18.9 ∆Non-Current Debt = ∆Beginning Lease Debt + ∆New Lease Debt
-∆Repayment of Debt = 281.6 + 36.8 - 68.5 = 249.9 ∆Deferred Tax Liability = ∆Taxes = 6.7 Check:
∆Assets = 275.5 ∆Liabilities + ∆Shareholders’ Equity = 249.9 + 6.7 + 18.9 = 275.5
4.2.16 Laitoksen nimi
36

Adjustments, Pension Liabilities(€€€) Accounting rules give companies flexibility to smooth or defer recognition of pension liabilities from underlying economics. Note: both obligations and assets depend on assumptions! Simplified economics of pension liabilities* Funded Status = Pension Obligation – Plan Assets Change in Funded Status = Change in Obligations (current service costs, interest cost, actuarial gains/losses, benefits paid, other) – Change in Plan Assets (actual returns, contributions, benefits paid, other) Economic period cost = service cost + interest cost (opening obligations) +/- actuarial gains/losses – actual returns on plan assets +/- other IFRS Net Liability = Funded Status – Unrecognized Past Service Cost +/- Unrecognized Actuarial gains/losses (discretionary)
4.2.16 Laitoksen nimi
37
* See Robinson et al: International Financial Statement Analysis p.684

Adjustments, Pension Liabilities (2) Example, Carlsberg 2011, in DKK millions ( see Palepu p 158 third edition and http://www.carlsberggroup.com/Investor/DownloadCentre/Pages/documentlist.aspx p. 91)
Total Obligations = 10339 (no unrecognized actuarial gains/losses or past service costs)
Total Plan Assets = 7099 Funded Status = 3240 ( = here IFRS Net Pension Liability)
Change in Obligations = 1009 ( = Current service cost, 176 + Interest Cost, 376 + Actuarial Gains/Losses, 849 + Benefits paid, -478 + other, 86) Change in Plan Assets = 199 ( = Actual Return, 83 + Contributions, 331 + Benefits paid, -391 + Other 172) Change in Funded Status = 814 ( = 1009 – 199)
4.2.16 Laitoksen nimi

Adjustments, Pension Liabilities (3) Economic Period Cost = 1215 ( = Service Cost, 176 + Interest Cost, 376 + Actuarial Gains/Losses, 849 – Actual Return, 83 – Settlements, 103) Cost in Income Statement = 122 ( = Service Cost, 176 + Interest Cost, 376 – Expected return, 327 – Settlements, 103) Cost in Comprehensive Income = 1093 ( = Actuarial Gains/ Losses, 849 + (Expected Return, 327 – Actual Return, 83)) Note: Economic Period Cost = Recognized Cost in Income Statement + Recognized Cost in Comprehensive Income
+ Unrecognized Costs
4.2.16 Laitoksen nimi
39

Adjustment towards Economic Situation In Carlsberg 2011, no need to adjust Liabilities in Balance Sheet because there are no unrecognized pension items. Net Economic Pension Liability is in Non-Current Liabilities (3263). If the analyst likes to recast Income Statement according to (harsh, non-smoothed) economic situation, then Costs from Comprehensive Income (1093) increase normal Income Statement Personnel Costs (1093) and tax expense has to be lowered according to 24% tax rate (262). Net Income would be lowered by the (after tax) amount of 831 ( = 1093 – 262). Note:The original Net Profit for Carlsberg 2011 is 5692 and this adjustment would lower Net Profit to 4861 – a drop of 14.6%
4.2.16 Laitoksen nimi
40

Adjustment of assumptions in Obligations Simple model: Pension Obligation = NPV(Total Benefit) NPV(Total Benefit) = No. of Retirees(n) * Benefit level(n) / (1 + r)n
Benefit level(n+1) = Benefit level(n)*(1+g) No. of Retirees constant 30 years, then declines in 30 years to 0 Carlsberg assumes (Note 25 p.92): g = 2.9%, r = 3.6% Analyst assumes: g = 2.9%, r = 3.5% In Excel put Benefit(1) = 1, Retirees(1) = 100 and calculate Total Benefit(n) = 1*100*(1+0.029)^n/(1+0.035)^n (n <= 30) Total Benefit(n) = 1*100*(1+0.029)^n*(1-(n-30)/30)/(1+0.035)^n (n > 30) NPV(Total Benefit; 3.5%) = 3892, NPV(Total Benefit: 3.6%) = 3809 Increase in NPV = 2.18% ( = (3892 – 3809)/3809)
4.2.16 Laitoksen nimi
41

Adjustment of assumptions in Obligations (2) The Pension Obligations rose 2.18% when discount rate was lowered 0.1% points. Carlsberg 2011 Pension Obligation is originally 10339. Now it is increased by 225 (=0.0218 * 10339). The total (225) goes into Balance Sheet. Liabilities: Retirement Benefit Obligations changes by 225 Deferred Tax Liability changes (24% tax rate) by -54 Equity: Equity changes by -171 Note: Net change in Total Assets = Equity and Liabilities = 0
4.2.16 Laitoksen nimi
42

Expensing R&D costs R&D EXAMPLE, EXPENSED VS. AMORTIZED (5 YRS.)
INCOME STATEMENT, EXPENSED
1 2 3 4 5 TOTAL Sales 100 100 100 100 100 500 costs 50 50 50 50 50 250 R&D cost 50 0 0 0 0 50 Profit before tax 0 50 50 50 50 200 Taxes(20%) 0 10 10 10 10 40 Net Profit 0 40 40 40 40 160
BALANCE SHEET, EXPENSED
1 2 3 4 5 Cash 0 40 80 120 160 Other Assets 200 200 200 200 200 Total 200 240 280 320 360
Equity 100 140 180 220 260 Liabili&es 100 100 100 100 100 Total 200 240 280 320 360
CASH FLOW STATEMENT, EXPENSED
1 2 3 4 5 TOTAL Cash from opera&ons Sales -‐ Cost -‐ R&D expense 0 50 50 50 50 200 Taxes paid 0 10 10 10 10 40
Cash to investements 0 0 0 0 0 0
Change in Cash 0 40 40 40 40 160
4.2.16 Laitoksen nimi
43

Capitalizing R&D costs
4.2.16 Laitoksen nimi
44
INCOME STATEMENT, AMORTIZED (5 YRS.)
1 2 3 4 5 TOTAL Sales 100 100 100 100 100 500 costs 50 50 50 50 50 250 R&D amor&za&on 10 10 10 10 10 50 Profit before tax 40 40 40 40 40 160 Taxes(20%) 8 8 8 8 8 40 Net Profit 32 32 32 32 32 160
BALANCE SHEET, AMORTIZED (5 YRS.)
1 2 3 4 5 Cash -‐8 34 76 118 160 Other Assets 240 230 220 210 200 Total 232 264 296 328 360
Equity 132 164 196 228 260 Liabili&es 100 100 100 100 100 Total 232 264 296 328 360
CASH FLOW STATEMENT, AMORTIZED (5 YRS.)
1 2 3 4 5 TOTAL
Cash from opera&ons Sales -‐ Cost 50 50 50 50 50 250 Taxes paid 8 8 8 8 8 40
Cash to investements 50 0 0 0 0 0
Change in Cash -‐8 42 42 42 42 160

Adjustment, Capitalizing R&D Astra Zeneca (see Palepu p.146). Amortization schedule (middle of year investment, 5 yrs.): 10%, 20%,20%,20%,20%,10% Year R&D outlay Amortization 2009 Capital left 2009 2009 4.4 0.44 (1 yr. 10%) 3.96 (1 yr. 90%) 2008 5.2 1.04 (2 yr. 20%) 3.64 (2 yr. 70%) 2007 5.2 1.04 (3 yr. 20%) 2.60 (3 yr. 50%) 2006 3.9 0.78 (4 yr. 20%) 1.17 (4 yr. 30%) 2005 3.4 0.68 (5 yr. 20%) 0.34 (5 yr. 10%) 2004 3.5 0.35 (6 yr. 10%) 0.0 (6 yr. 0%) ____ ____ ____ TOTAL 25.6 4.33 11.71
4.2.16
Laitoksen nimi
45

Adjustment, Capitalizing R&D (2) In AstraZeneca analyst wants to recast 2009 financial statements as if R&D had been capitalized (tax rate 28%) Changes in Balance Sheet 2009 Assets: Non-Current Assets +11.7 (Capitalized R&D Asset) Liabilities: Deferred Tax Liability +3.3 (28% * 11.7, in the recast) Equity: Shareholders’ Equity +8.4 (72% * 11.7) Changes in Income Statement 2009 Operating Expenses -4.4 (delete R&D expense) Operating Expenses +4.3 (put in R&D amortization) Tax Expense 0.0 (actual tax not changed) Net Profit +0.1 (Costs decrease by 0.1)
4.2.16
Laitoksen nimi
46

Finally Financial Statement for Valuation
Starting from official (IFRS, USGAAP) Financial Statement and its Attachments, we have now:
- standardized classifications for our own template - made adjustments to correct big item distortions - made adjustments to match industry practice if needed
We are ready to look at
- financial ratios - inputs for valuation models
4.2.16 Laitoksen nimi
47

Financial Ratios and Cash Flows
4.2.16 Laitoksen nimi
48

What are Financial Ratios used for ?
To analyze a company’s financial position and development - profitability - operating efficiency - financial strategy - dividend policy
To compare company ratios with competitors and industry To calculate inputs for valuation formulas
4.2.16 Laitoksen nimi
49

DRIVERS OF PROFITABILITY AND GROWTH

Various return concepts Accounting (book value) based returns Return on Equity (ROE) =
Market based return Holding period (realized or expected) return(t) = Required return = (equilibrium, e.g. CAPM) price of equity ke
4.2.16 Laitoksen nimi
51
Net ProfitShareholders' Equity
(Price(t) - Price(t-1)) + Dividends(t)Price(t-1)

Return on Equity (ROE)
• Counterparty to market return on equity • ROE is return for all equity (common, preferred, minority) • Equity is measured as Average Total Equity during fiscal year (CFA) [but analysts often use ending balance, Palepu
uses beginning balance in Ch 5] • ROE has a tendency to revert to “normal” levels • Maximizing ROE is not the same thing as maximizing value • ROE depends on leverage of the company • ROE changes if interest rates or accounting policies change
4.2.16
Laitoksen nimi
52

Decomposing ROE for analysis DuPont Analysis
Standard decomposition (2) ROE = ROA x Equity Multiplier = Standard decomposition (3) ROE = Profit Margin x Asset Turnover x Equity Multiplier
=
4.2.16 Laitoksen nimi
53
Net ProfitTotal Assets
x Total AssetsShareholders' Equity
Net ProfitSales
x SalesTotal Assets
x Total AssetsShareholders' Equity

Advanced ROE decomposition Problems in standard: operating and financing performance not separated, earnings and asset ownership don’t match. Advanced formula: ROE = Return on Business Assets + Spread x Financial Leverage where Return on Business Assets (ROBA) = Spread = Return on Business Assets – Interest Expense After Tax / Debt Financial Leverage =
Interest Expense After Tax = Interest Expense * (1 – Tax Rate) Net Operating Profit After Taxes (NOPAT) = Net Profit – NIPAT + Interest Expense After Tax Net Investment Profit After Taxes (NIPAT) = (Investment Income + Interest Income) * (1 – Tax Rate)
4.2.16
Laitoksen nimi
54
NOPAT+NIPAT Business Assets
Debt Equity
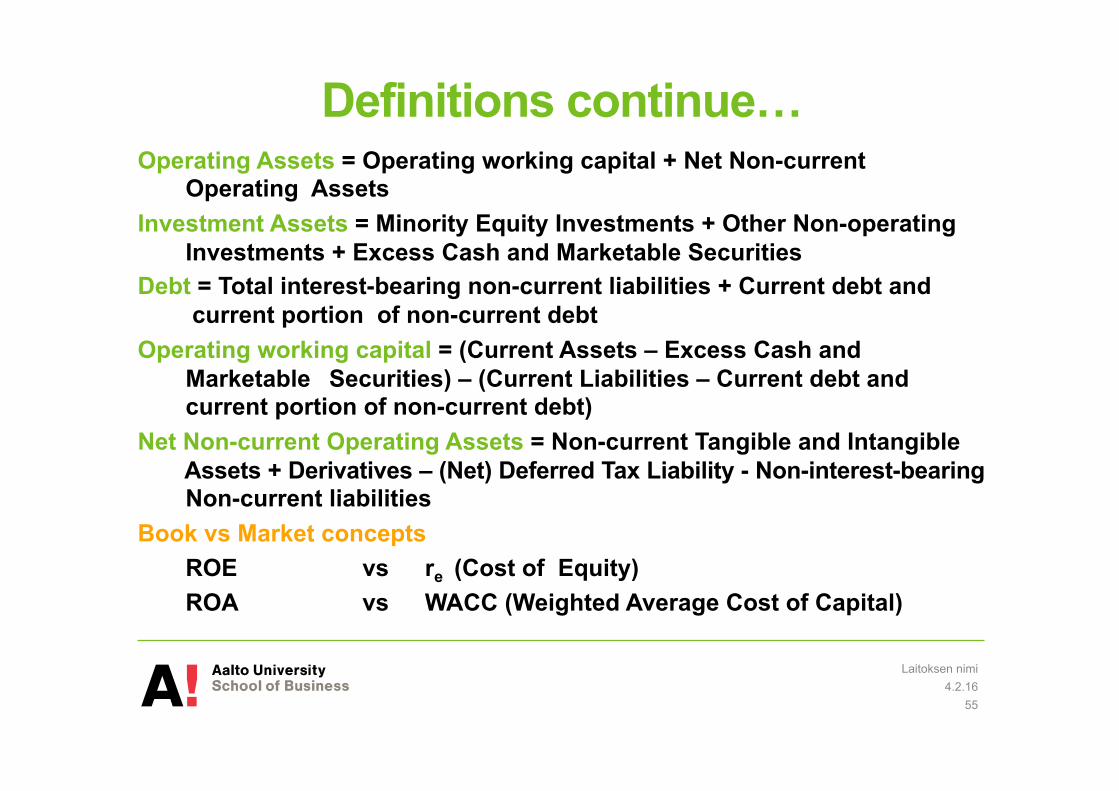
Definitions continue… Operating Assets = Operating working capital + Net Non-current
Operating Assets Investment Assets = Minority Equity Investments + Other Non-operating
Investments + Excess Cash and Marketable Securities Debt = Total interest-bearing non-current liabilities + Current debt and
current portion of non-current debt Operating working capital = (Current Assets – Excess Cash and
Marketable Securities) – (Current Liabilities – Current debt and current portion of non-current debt)
Net Non-current Operating Assets = Non-current Tangible and Intangible Assets + Derivatives – (Net) Deferred Tax Liability - Non-interest-bearing Non-current liabilities
Book vs Market concepts ROE vs re (Cost of Equity) ROA vs WACC (Weighted Average Cost of Capital)
4.2.16 Laitoksen nimi
55

FURTHER ANALYSIS OF RETURN ON BUSINESS ASSETS AND RETURN ON OPERATING ASSETS
assets Businessassets Investmentassets investment on Return
assets Businessassets Operatingassets operating on Return
assets Businessassets Investment
assets InvestmentNIPAT
assets Businessassets Operating
assets OperatingNOPAT
AssetsBusinessNIPAT
AssetsBusinessNOPATROBA
×+
×=
×+×=
+=
assets OperatingSales
SalesNOPATassets operating on Return ×=

H&M VERSUS INDUSTRY PEERS: COMPARISON OF ROE COMPONENTS

Useful Profitability Measures related to ROE first standard component (Net Profit / Sales)
Gross Profit Margin = EBITDA Margin = EBIT Margin = NOPAT Margin =
4.2.16 Laitoksen nimi
58
Sales - Cost of SalesSales
Earnings Before Interest, Taxes, Depreciation and AmortizationSales
Earnings Before Interest and TaxesSales
Net Operating Profit After TaxesSales

Useful Asset Turnover (Efficiency) Measures related to ROE second standard component (Sales / Assets)
Working Capital* Turnover = Sales / Working Capital Oper. Working Capital Turnover = Sales/Oper. Working Capital Fixed Asset Turnover = Sales / Fixed Assets Non-Current Asset Turnover = Sales / Non-Current Assets Total Asset Turnover = Sales / Total Assets Trade Receivables Turnover = Sales / Trade Receivables Trade Payables Turnover = Purchases / Trade Payables Inventories Turnover = Cost of Sales / Inventories Also modified ratios are used, like Days’ Inventories = Inventories / Average Cost of Sales per Day
* Working Capital = (Current Assets – Current Liabilities) 4.2.16
Laitoksen nimi
59
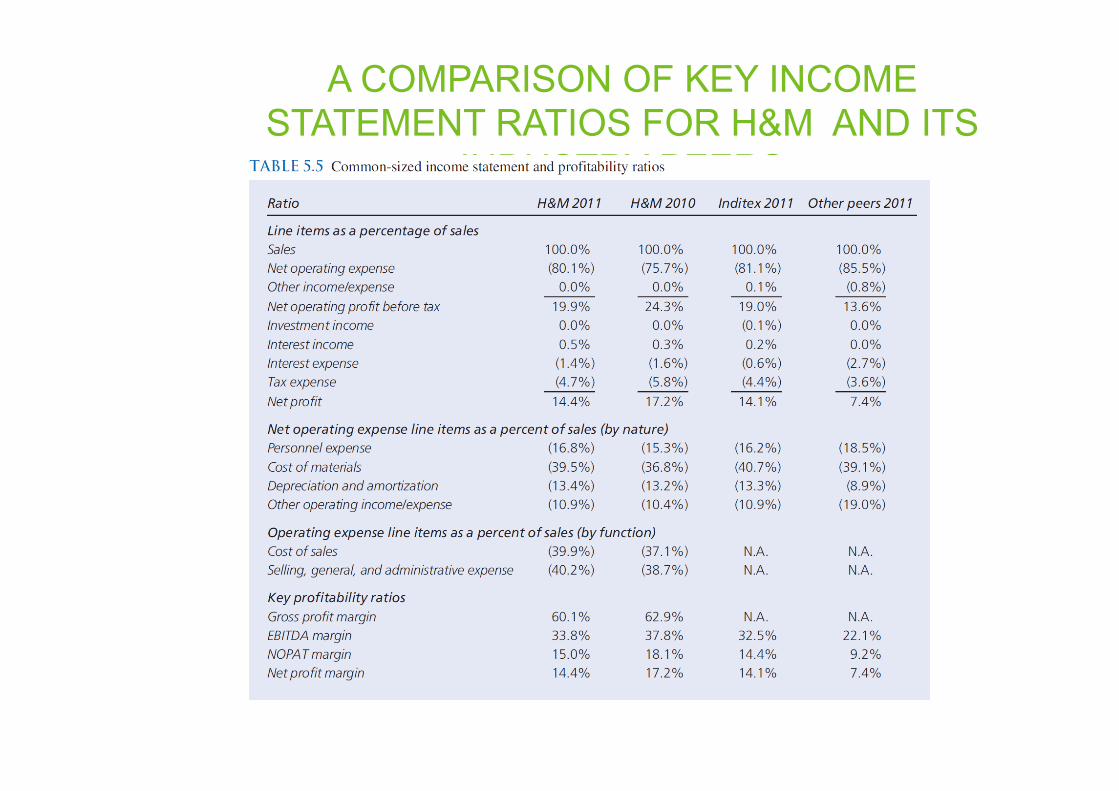
A COMPARISON OF KEY INCOME STATEMENT RATIOS FOR H&M AND ITS
INDUSTRY PEERS

ASSET MANAGEMENT RATIOS FOR H&M AND ITS PEERS

Useful Financial Leverage Ratios related to ROE third standard component (Assets / Equity)
Short-term liquidity Current Ratio = Quick Ratio = Cash Ratio = Operating Cash Flow Ratio =
4.2.16 Laitoksen nimi
62
Current AssetsCurrent Liabilites
Cash and Marketable Securities + Trade ReceivablesCurrent Liabilites
Cash and Marketable Securities Current Liabilites
Cash Flow From OperationsCurrent Liabilities

Useful Financial Leverage Ratios related to ROE third standard component (Assets / Equity)
Long-term (book*) solvency Equity Multiplier = Debt-to-Equity = Debt-to-Capital = * Market based ratios are used in WACC calculations
4.2.16 Laitoksen nimi
63
Current Debt + Non-Current DebtShareholders' Equity
Current Debt + Non-Current DebtCurrent Debt + Non-Current Debt + Shareholders' Equity
Total AssetsTotal Equity

Popular financial riskiness measures (risk and return go together!)
Interest Coverage (Earnings Basis)* = Interest Coverage (Cash Flow Basis) = * CFA defines as EBIT/Interest Expense
4.2.16 Laitoksen nimi
64
Cash Flow From Operations + Interest Expense + Tax ExpenseInterest Expense
Net Profit + Interest Expense + Tax ExpenseInterest Expense

COMPARISON OF H&M AND INDITEX DEBT AND COVERAGE RATIOS

Sustainable (book) growth rate At sustainable growth rate key profitability and solvency ratios remain constant. Sustainable Growth Rate (g*) = ROE x (1 – Dividend Payout Ratio)
Dividend Payout Ratio = Cash Dividends Paid / Net Profit If planned growth (g) > g* then profitability, efficiency or leverage
have to increased or dividend payout lowered
If planned growth (g) < g* then profitability, efficiency or leverage might decrease or dividend payout ratio
should be increased 4.2.16
Laitoksen nimi
66

Sustainable growth rate analysis Two parts: how value is generated and how it is distributed Value generation (different frames):
ROE = Profit Margin x Asset Turnover x Equity Multiplier ROE = Return on Business Assets + Spread x Financial Leverage
Value distribution (to owners immediately or kept inside the firm)
Dividend Payout Ratio = Cash Dividends Paid / Net Profit 4.2.16
Laitoksen nimi
67

SUSTAINABLE GROWTH RATES FOR H&M AND ITS PEERS
Cash Flow Analysis
• Cash (vs accrual) based view on company’s financial situation • How much cash do operations produce? • How much cash is used for working capital and non-current
asset investments? Compared to Depreciation? • Does company finance growth by internal or external funds? • How easily can company pay debt obligations? • Is debt needed to pay out dividends ?
• BASIS FOR STANDARD FCF VALUATION
4.2.16 Laitoksen nimi
69
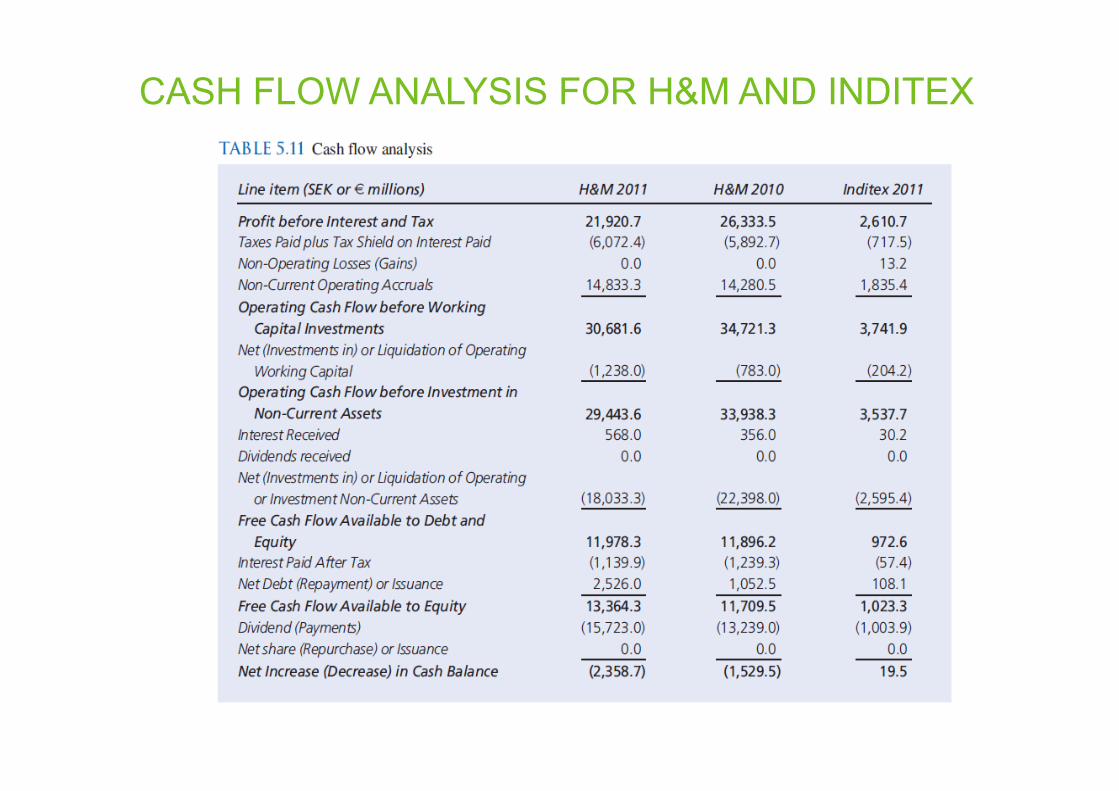
CASH FLOW ANALYSIS FOR H&M AND INDITEX