2016 Transit Servic e Performance Review · Bus Appendix C1 – Bus Rummaries: ... Performance by...
117
-
Upload
phungthuan -
Category
Documents
-
view
217 -
download
0
Transcript of 2016 Transit Servic e Performance Review · Bus Appendix C1 – Bus Rummaries: ... Performance by...


2016 Transit Service Performance Review
Executive Summary
Appendix A – Additional Figures
Appendix B – Report Definitions and Assumptions
Bus
Appendix C1 – Bus Route Summaries: Routes 1-99
Appendix C2 – Bus Route Summaries: Routes 100-299
Appendix C3 – Bus Route Summaries: Routes 300-799
Appendix C4 – Bus Route Summaries: Routes C1-C99
Appendix C5 – Bus Route Summaries: Routes N1-N99
SeaBus, SkyTrain, and West Coast Express
Appendix D – SeaBus Route Summary
Appendix E – SkyTrain and West Coast Express Line Summaries
Appendix F – SkyTrain Station Summaries
Technical Appendices
Appendix G – How to Read Bus Route Summaries
Appendix H – How Bus Route Summaries are Created
Appendix I – How to Read SeaBus and Rail Line Summaries
Appendix J – How SeaBus and Rail Line Summaries are Created
www.translink.ca/tspr
You are here


Key CharacteristicsSub-region of Primary Service:
Predominant Vehicle Type: Bus Depot:
Contributes to FTN: NoAverage One-Way Trip Distance (km):
Cost & Performance2012 2013 2014 2015 2016 Rank (2016)
Annual APC Boardings: 584,000 583,000 596,000 677,000 745,000 89 of 214 Average Daily APC Boardings (Mon-Fri): 2,000 2,000 2,000 2,350 2,600 86 of 213
Average Daily APC Boardings (Sat): 750 800 850 900 900 96 of 174 Average Daily APC Boardings (Sun/Hol): 550 700 750 750 750 95 of 171
Annual Service Cost: $1,661,000 $1,713,000 $1,740,000 $1,762,000 $1,811,000 61 of 216 Annual Revenue Hours: 17,100 17,700 17,900 18,200 18,700 63 of 216
Cost per APC Boarded Passenger: $2.84 $2.94 $3.01 $2.60 $2.43 135 of 214 Average APC Boardings per Rev. Hour: 34 33 33 37 40 125 of 214
Average Peak Passenger Load: 24 36 25 27 27 48 of 210Average Peak Load Factor: 49% 72% 53% 56% 57% 38 of 210
Revenue Hours with Overcrowding: 1% 40% 0% 7% 4% 174 of 209 Average Speed (km/h): 36.4 35.9 35.4 32.9 21 of 206
Service Changes Since December 2010- Spring 2011, Discontinue service after 20hr (Sat, S/H)- Spring 2012, Convert vehicle from conventional 40' bus to Orion Hwy Coach
Cost
Ride
rshi
pU
tiliz
atio
n
Very low sampling in 2012 and 2013
Route 301
Richmond
24.8
Hwy. CoachSurrey
4

2015 2016 2015 2016 2015 2016 2015 2016 2015 2016 2015 2016
2015 2016 2015 2016 2015 2016 2015 2016 2015 2016 2015 2016
2015 2016 2015 2016 2015 2016 2015 2016 2015 2016 2015 2016
/
1 33 44 33 30 $2.68 $2.20 30 /
1 1 32 28 35 23 $2.30 $4.47 19 / 29 29 / 25 Hwy. Coach & Std. Bus
Hwy. Coach
9 Hwy. Coach & Std. Bus
Hwy. Coach
21:00 - 01:00
18 29 / 8 Hwy. Coach & Std. Bus
Hwy. Coach
18:00 - 21:00
241 242 1 1 32 38 30 31 $3.34 $3.36 29 / 10 32
2015 2016
Sund
ay/H
olid
ay
01:00 - 06:00
15:00 - 18:00
302 305 1
TimeAnnual Revenue
HoursAverage Trips per Clock Hour
Average Boardings per Revenue Hour
Average Boardings per Trip
Average Cost per Passenger
Average Peak Passenger LoadVehicle Type(EB / WB)
09:00 - 15:00
586 591 1 1 29 38 29 30 $2.81 $2.97 15 / 24 32 / 17 Hwy. Coach & Std. Bus
Hwy. Coach
06:00 - 09:00
225 225
Hwy. Coach & Std. Bus
Hwy. Coach
21:00 - 01:00
28 $3.19 $3.39 33 / 11 31 / 14
15:00 - 18:00
262 271 1 1 36 38 36
09:00 - 15:00
522 543 1 1 30 35 30 31 $2.99 $2.95 16 / 30 16 / 29 Hwy. Coach & Std. Bus
Hwy. Coach
06:00 - 09:00
194 202 1 1 41 50 46 43 $1.85 $2.41 17 / 46 15 / 50 Hwy. Coach & Std. Bus
Hwy. Coach
2015 2016
Satu
rday
01:00 - 06:00
32 $2.72 $2.98 34
18:00 - 21:00
199 214 1 1 34 36 29
/ 16 38 / 19 Hwy. Coach & Std. Bus
Hwy. Coach
Hwy. Coach & Std. Bus
Time Annual Revenue Hours
Average Trips per Clock Hour
Average Boardings per Revenue Hour
Average Boardings per Trip
Average Cost per Passenger
Average Peak Passenger LoadVehicle Type
(EB / WB)
$2.37 $2.73 24 / 20 / Hwy. Coach & Std. Bus
21:00 - 01:00
188 188 1 1 41 35 31 27
18:00 - 21:00
1,816 1,848 2 2 31 38 26 31 $3.36 $2.81 26 / 14 28 / 18 Hwy. Coach & Std. Bus
Hwy. Coach & Std. Bus
38 / 17 40 / 19 Hwy. Coach & Std. Bus
Hwy. Coach & Std. Bus4,127 3 3 43 43 41 41 $2.60 $2.59
Performance by Day of Week, Route 301 Data collected early Sept. to mid-Dec. of the given year
TimeAnnual Revenue
HoursAverage Trips per Clock Hour
Average Boardings per Revenue Hour
Average Boardings per Trip
Average Cost per Passenger
Average Peak Passenger LoadVehicle Type
(EB / WB)
09:00 - 15:00
5,200 5,370 2 2 35 44 36 38 $2.46 $2.31 23 / 29 22 / 31 Hwy. Coach & Std. Bus
Hwy. Coach & Std. Bus
Hwy. Coach & Std. Bus
Hwy. Coach
06:00 - 09:00
3,484 3,595 3 3 43 46 41 40 $2.27 $2.33 16 / 50 13 / 45 Hwy. Coach & Std. Bus
Hwy. Coach & Std. Bus
2015 2016
Mon
day-
Frid
ay
01:00 - 06:00
934 955 2 2 24 33 21 23 $3.66 $3.70 7 / 25 7 / 28
15:00 - 18:00
4,017
Top 25% of all bus services High 25% of all bus services Low 25% of all bus services Bottom 25% of all bus services Above Guidelines#
5
Key CharacteristicsSub-region of Primary Service:
Predominant Vehicle Type: Bus Depot:
Contributes to FTN: NoAverage One-Way Trip Distance (km):
Cost & Performance2012 2013 2014 2015 2016 Rank (2016)
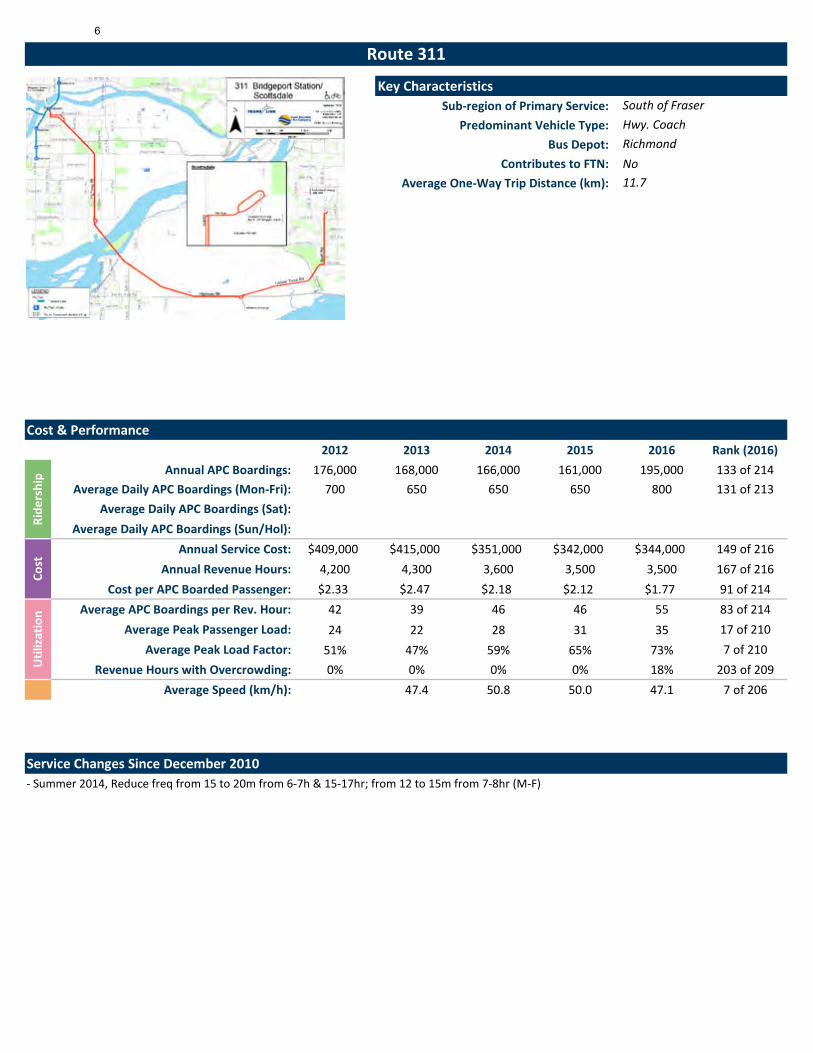
Annual APC Boardings: 176,000 168,000 166,000 161,000 195,000 133 of 214 Average Daily APC Boardings (Mon-Fri): 700 650 650 650 800 131 of 213
Average Daily APC Boardings (Sat): Average Daily APC Boardings (Sun/Hol):
Annual Service Cost: $409,000 $415,000 $351,000 $342,000 $344,000 149 of 216 Annual Revenue Hours: 4,200 4,300 3,600 3,500 3,500 167 of 216
Cost per APC Boarded Passenger: $2.33 $2.47 $2.18 $2.12 $1.77 91 of 214 Average APC Boardings per Rev. Hour: 42 39 46 46 55 83 of 214
Average Peak Passenger Load: 24 22 28 31 35 17 of 210Average Peak Load Factor: 51% 47% 59% 65% 73% 7 of 210
Revenue Hours with Overcrowding: 0% 0% 0% 0% 18% 203 of 209 Average Speed (km/h): 47.4 50.8 50.0 47.1 7 of 206
Service Changes Since December 2010- Summer 2014, Reduce freq from 15 to 20m from 6-7h & 15-17hr; from 12 to 15m from 7-8hr (M-F)
Cost
Ride
rshi
pU
tiliz
atio
nRoute 311
South of Fraser
11.7
Hwy. CoachRichmond
6

2015 2016 2015 2016 2015 2016 2015 2016 2015 2016 2015 2016
2015 2016 2015 2016 2015 2016 2015 2016 2015 2016 2015 2016
2015 2016 2015 2016 2015 2016 2015 2016 2015 2016 2015 2016
21:00 - 01:00
18:00 - 21:00
2015 2016
Sund
ay/H
olid
ay
01:00 - 06:00
15:00 - 18:00
TimeAnnual Revenue
HoursAverage Trips per Clock Hour
Average Boardings per Revenue Hour
Average Boardings per Trip
Average Cost per Passenger
Average Peak Passenger LoadVehicle Type(NB / SB)
09:00 - 15:00
06:00 - 09:00
21:00 - 01:00
15:00 - 18:00
09:00 - 15:00
06:00 - 09:00
2015 2016
Satu
rday
01:00 - 06:00
18:00 - 21:00
Time Annual Revenue Hours
Average Trips per Clock Hour
Average Boardings per Revenue Hour
Average Boardings per Trip
Average Cost per Passenger
Average Peak Passenger LoadVehicle Type
(NB / SB)
21:00 - 01:00
18:00 - 21:00
412 414 2 2 45 52 24 29 $2.32 $1.87 / 21 / 26 Hwy. Coach Hwy. Coach
/ 33 / 35 Hwy. Coach Hwy. Coach1,514 3 3 28 58 37 39 $1.77 $1.69
Performance by Day of Week, Route 311 Data collected early Sept. to mid-Dec. of the given year
TimeAnnual Revenue
HoursAverage Trips per Clock Hour
Average Boardings per Revenue Hour
Average Boardings per Trip
Average Cost per Passenger
Average Peak Passenger LoadVehicle Type
(NB / SB)
09:00 - 15:00
Hwy. Coach Hwy. Coach
06:00 - 09:00
1,129 1,152 2 2 46 67 40 44 $1.57 $1.51 38 / 43 / Hwy. Coach Hwy. Coach
2015 2016
Mon
day-
Frid
ay
01:00 - 06:00
466 469 2 2 19 50 18 23 $2.65 $2.13 17 / 22 /
15:00 - 18:00
1,513
Top 25% of all bus services High 25% of all bus services Low 25% of all bus services Bottom 25% of all bus services Above Guidelines#
7

Key CharacteristicsSub-region of Primary Service:
Predominant Vehicle Type: Bus Depot:
Contributes to FTN: NoAverage One-Way Trip Distance (km):
Cost & Performance2012 2013 2014 2015 2016 Rank (2016)
Annual APC Boardings: 679,000 656,000 645,000 666,000 732,000 91 of 214 Average Daily APC Boardings (Mon-Fri): 2,150 2,100 2,050 2,150 2,350 94 of 213
Average Daily APC Boardings (Sat): 1,250 1,250 1,200 1,250 1,300 86 of 174 Average Daily APC Boardings (Sun/Hol): 1,150 1,000 1,050 1,000 1,150 84 of 171
Annual Service Cost: $1,146,000 $1,161,000 $1,169,000 $1,171,000 $1,179,000 97 of 216 Annual Revenue Hours: 11,800 12,000 12,100 12,100 12,200 102 of 216
Cost per APC Boarded Passenger: $1.69 $1.77 $1.87 $1.76 $1.61 79 of 214 Average APC Boardings per Rev. Hour: 58 55 54 55 60 73 of 214
Average Peak Passenger Load: 21 20 20 21 22 85 of 210Average Peak Load Factor: 42% 41% 40% 41% 43% 87 of 210
Revenue Hours with Overcrowding: 0% 0% 1% 0% 0% 1 of 209 Average Speed (km/h): 27.8 27.8 27.8 26.9 63 of 206
Service Changes Since December 2010- Winter 2010, Reduce freq from 15 to 20m during AM & PM peak (M-F)- Summer 2013, Small route rerouting (1 block) in vicinity of Scottsdale Mall
Cost
Ride
rshi
pU
tiliz
atio
nRoute 312
South of Fraser
10.5
Std. BusSurrey
8

2015 2016 2015 2016 2015 2016 2015 2016 2015 2016 2015 2016
2015 2016 2015 2016 2015 2016 2015 2016 2015 2016 2015 2016
2015 2016 2015 2016 2015 2016 2015 2016 2015 2016 2015 2016
/
2 66 29 $1.55 10 /
1 1 36 43 15 17 $2.59 $2.43 / 11 18 / 8 Std. Bus Std. Bus
30 Std. Bus Std. Bus
21:00 - 01:00
179 179 1 1 51 19 $2.88 7 / 31 Std. Bus Std. Bus
17 12 / 23 Std. Bus Std. Bus
18:00 - 21:00
184 184 1 1 54 69 26 29 $1.90 $1.52 11 / 28 12
2015 2016
Sund
ay/H
olid
ay
01:00 - 06:00
15:00 - 18:00
322 322 2
TimeAnnual Revenue
HoursAverage Trips per Clock Hour
Average Boardings per Revenue Hour
Average Boardings per Trip
Average Cost per Passenger
Average Peak Passenger LoadVehicle Type(NB / SB)
09:00 - 15:00
614 608 2 2 36 59 20 25 $2.15 $1.80 19 / 11 25 / 9 Std. Bus Std. Bus
06:00 - 09:00
51 51
Std. Bus Std. Bus
21:00 - 01:00
193 197 1 1 37 53 19 21 $2.83 $2.38 7 / 24 9 / 24 Std. Bus Std. Bus
29 $1.71 11 / 24 11 / 34
15:00 - 18:00
286 313 2 2 43 56 25
09:00 - 15:00
543 554 2 2 41 54 23 25 $2.11 $1.97 23 / 12 20 / 10 Std. Bus Std. Bus
06:00 - 09:00
87 89 1 1 45 64 22 28 $2.15 $1.91 27 / 10 37 / 8 Std. Bus Std. Bus
2015 2016
Satu
rday
01:00 - 06:00
26 $1.84 $1.88 15
18:00 - 21:00
156 146 1 1 67
/ 17 12 / 24 Std. Bus Std. Bus
Std. Bus
Time Annual Revenue Hours
Average Trips per Clock Hour
Average Boardings per Revenue Hour
Average Boardings per Trip
Average Cost per Passenger
Average Peak Passenger LoadVehicle Type
(NB / SB)
$3.23 7 / 21 7 / 29 Std. Bus21:00 - 01:00
820 824 1 1 32 17
18:00 - 21:00
995 1,005 2 2 64 66 29 30 $1.73 $1.76 10 / 35 8 / 37 Std. Bus Std. Bus
15 / 38 13 / 39 Std. Bus Std. Bus2,217 3 3 56 78 37 41 $1.53 $1.37
Performance by Day of Week, Route 312 Data collected early Sept. to mid-Dec. of the given year
TimeAnnual Revenue
HoursAverage Trips per Clock Hour
Average Boardings per Revenue Hour
Average Boardings per Trip
Average Cost per Passenger
Average Peak Passenger LoadVehicle Type
(NB / SB)
09:00 - 15:00
2,912 2,895 2 2 49 66 29 31 $1.71 $1.57 23 / 14 23 / 13 Std. Bus Std. Bus
Std. Bus Std. Bus
06:00 - 09:00
2,025 2,070 3 3 49 67 33 35 $2.14 $2.14 41 / 12 42 / 12 Std. Bus Std. Bus
2015 2016
Mon
day-
Frid
ay
01:00 - 06:00
500 502 2 2 37 49 16 21 $5.04 $3.55 25 / 3 33 / 4
15:00 - 18:00
2,196
Top 25% of all bus services High 25% of all bus services Low 25% of all bus services Bottom 25% of all bus services Above Guidelines#
9

Key CharacteristicsSub-region of Primary Service:
Predominant Vehicle Type: Bus Depot:
Contributes to FTN: NoAverage One-Way Trip Distance (km):
Cost & Performance2012 2013 2014 2015 2016 Rank (2016)
Annual APC Boardings: 293,000 285,000 310,000 336,000 371,000 119 of 214 Average Daily APC Boardings (Mon-Fri): 1,000 950 1,050 1,100 1,250 117 of 213
Average Daily APC Boardings (Sat): 450 450 500 550 600 112 of 174 Average Daily APC Boardings (Sun/Hol): 350 350 400 450 450 114 of 171
Annual Service Cost: $616,000 $634,000 $664,000 $680,000 $688,000 119 of 216 Annual Revenue Hours: 6,300 6,500 6,800 7,000 7,100 125 of 216
Cost per APC Boarded Passenger: $2.10 $2.23 $2.21 $2.03 $1.86 100 of 214 Average APC Boardings per Rev. Hour: 46 44 45 48 52 92 of 214
Average Peak Passenger Load: 14 15 14 15 18 110 of 210Average Peak Load Factor: 28% 29% 29% 30% 37% 119 of 210
Revenue Hours with Overcrowding: 0% 0% 0% 0% 0% 1 of 209 Average Speed (km/h): 24.3 23.1 22.4 21.9 143 of 206
Service Changes Since December 2010- Fall 2013, Discontinue trips between Sunbury and Scott Road Stn
Cost
Ride
rshi
pU
tiliz
atio
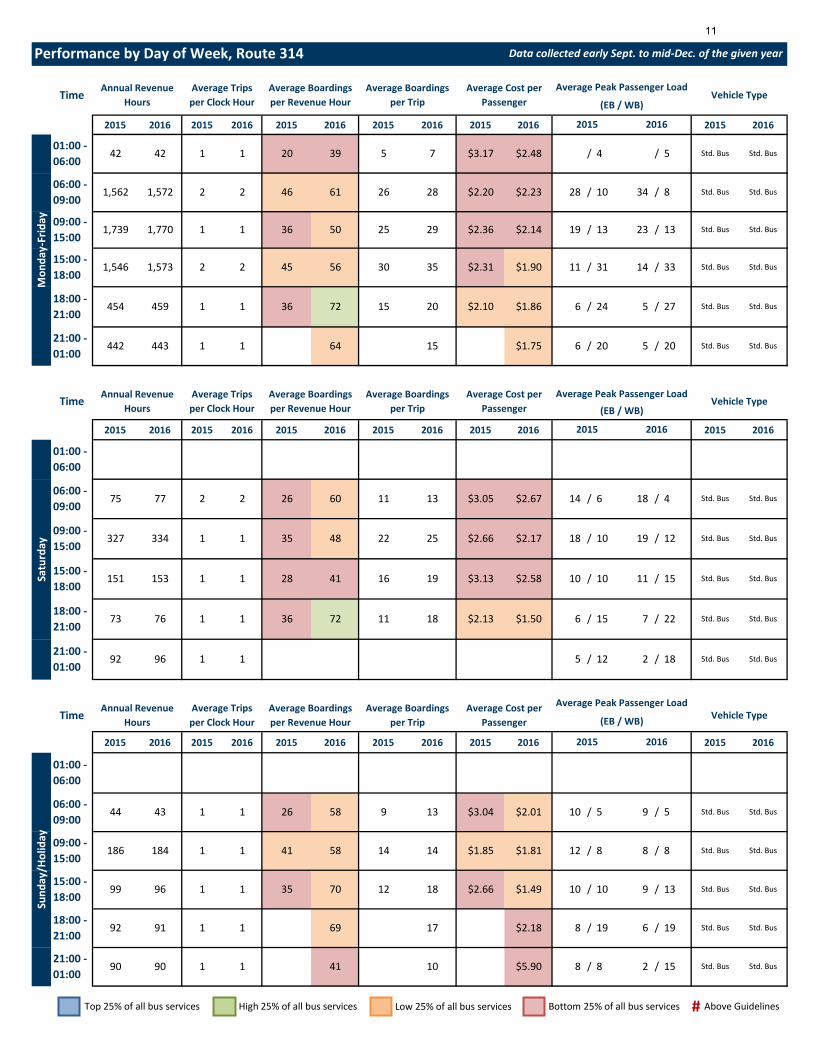
nRoute 314
South of Fraser
8.3
Std. BusSurrey
10
2015 2016 2015 2016 2015 2016 2015 2016 2015 2016 2015 2016
2015 2016 2015 2016 2015 2016 2015 2016 2015 2016 2015 2016
2015 2016 2015 2016 2015 2016 2015 2016 2015 2016 2015 2016
/
1 35 70 12 18 $2.66 $1.49 10 /
1 1 26 58 9 13 $3.04 $2.01 10 / 5 9 / 5 Std. Bus Std. Bus
19 Std. Bus Std. Bus
21:00 - 01:00
90 90 1 1 41 10 $5.90 8 / 8 2 / 15 Std. Bus Std. Bus
10 9 / 13 Std. Bus Std. Bus
18:00 - 21:00
92 91 1 1 69 17 $2.18 8 / 19 6
2015 2016
Sund
ay/H
olid
ay
01:00 - 06:00
15:00 - 18:00
99 96 1
TimeAnnual Revenue
HoursAverage Trips per Clock Hour
Average Boardings per Revenue Hour
Average Boardings per Trip
Average Cost per Passenger
Average Peak Passenger LoadVehicle Type(EB / WB)
09:00 - 15:00
186 184 1 1 41 58 14 14 $1.85 $1.81 12 / 8 8 / 8 Std. Bus Std. Bus
06:00 - 09:00
44 43
Std. Bus Std. Bus
21:00 - 01:00
92 96 1 1 5 / 12 2 / 18 Std. Bus Std. Bus
18 $2.13 $1.50 6 / 15 7 / 22
15:00 - 18:00
151 153 1 1 28 41 16
09:00 - 15:00
327 334 1 1 35 48 22 25 $2.66 $2.17 18 / 10 19 / 12 Std. Bus Std. Bus
06:00 - 09:00
75 77 2 2 26 60 11 13 $3.05 $2.67 14 / 6 18 / 4 Std. Bus Std. Bus
2015 2016
Satu
rday
01:00 - 06:00
19 $3.13 $2.58 10
18:00 - 21:00
73 76 1 1 36 72 11
/ 10 11 / 15 Std. Bus Std. Bus
Std. Bus
Time Annual Revenue Hours
Average Trips per Clock Hour
Average Boardings per Revenue Hour
Average Boardings per Trip
Average Cost per Passenger
Average Peak Passenger LoadVehicle Type
(EB / WB)
$1.75 6 / 20 5 / 20 Std. Bus21:00 - 01:00
442 443 1 1 64 15
18:00 - 21:00
454 459 1 1 36 72 15 20 $2.10 $1.86 6 / 24 5 / 27 Std. Bus Std. Bus
11 / 31 14 / 33 Std. Bus Std. Bus1,573 2 2 45 56 30 35 $2.31 $1.90
Performance by Day of Week, Route 314 Data collected early Sept. to mid-Dec. of the given year
TimeAnnual Revenue
HoursAverage Trips per Clock Hour
Average Boardings per Revenue Hour
Average Boardings per Trip
Average Cost per Passenger
Average Peak Passenger LoadVehicle Type
(EB / WB)
09:00 - 15:00
1,739 1,770 1 1 36 50 25 29 $2.36 $2.14 19 / 13 23 / 13 Std. Bus Std. Bus
Std. Bus Std. Bus
06:00 - 09:00
1,562 1,572 2 2 46 61 26 28 $2.20 $2.23 28 / 10 34 / 8 Std. Bus Std. Bus
2015 2016
Mon
day-
Frid
ay
01:00 - 06:00
42 42 1 1 20 39 5 7 $3.17 $2.48 / 4 / 5
15:00 - 18:00
1,546
Top 25% of all bus services High 25% of all bus services Low 25% of all bus services Bottom 25% of all bus services Above Guidelines#
11

Key CharacteristicsSub-region of Primary Service:
Predominant Vehicle Type: Bus Depot:
Contributes to FTN: NoAverage One-Way Trip Distance (km):
Cost & Performance2012 2013 2014 2015 2016 Rank (2016)
Annual APC Boardings: 522,000 496,000 499,000 530,000 596,000 100 of 214 Average Daily APC Boardings (Mon-Fri): 1,700 1,600 1,600 1,700 1,900 101 of 213
Average Daily APC Boardings (Sat): 1,050 1,000 1,050 1,150 1,250 88 of 174 Average Daily APC Boardings (Sun/Hol): 700 600 650 700 850 91 of 171
Annual Service Cost: $1,052,000 $1,028,000 $1,031,000 $1,031,000 $1,035,000 104 of 216 Annual Revenue Hours: 10,800 10,600 10,600 10,600 10,700 111 of 216
Cost per APC Boarded Passenger: $2.02 $2.07 $2.13 $1.95 $1.74 88 of 214 Average APC Boardings per Rev. Hour: 48 47 47 50 56 81 of 214
Average Peak Passenger Load: 18 17 18 18 20 103 of 210Average Peak Load Factor: 37% 34% 36% 36% 40% 109 of 210
Revenue Hours with Overcrowding: 0% 0% 0% 0% 0% 1 of 209 Average Speed (km/h): 23.7 24.6 24.2 22.8 132 of 206
Service Changes Since December 2010- Summer 2013, Small route rerouting (1 block) in vicinity of Scottsdale Mall
Cost
Ride
rshi
pU
tiliz
atio
nRoute 316
South of Fraser
10.0
Std. BusSurrey
12

2015 2016 2015 2016 2015 2016 2015 2016 2015 2016 2015 2016
2015 2016 2015 2016 2015 2016 2015 2016 2015 2016 2015 2016
2015 2016 2015 2016 2015 2016 2015 2016 2015 2016 2015 2016
/
1 46 67 28 35 $1.88 $1.72 15 /
1 1 19 37 12 19 $4.92 $2.75 13 / 8 17 / 7 Std. Bus Std. Bus
31 Std. Bus Std. Bus
21:00 - 01:00
60 59 1 1 23 40 11 19 $4.26 $2.45 / 8 10 / 18 Std. Bus Std. Bus
25 12 / 33 Std. Bus Std. Bus
18:00 - 21:00
181 178 1 1 24 55 16 27 $3.41 $2.05 10 / 13 10
2015 2016
Sund
ay/H
olid
ay
01:00 - 06:00
15:00 - 18:00
194 191 1
TimeAnnual Revenue
HoursAverage Trips per Clock Hour
Average Boardings per Revenue Hour
Average Boardings per Trip
Average Cost per Passenger
Average Peak Passenger LoadVehicle Type(NB / SB)
09:00 - 15:00
394 388 1 1 40 61 25 32 $2.21 $1.69 17 / 15 22 / 14 Std. Bus Std. Bus
06:00 - 09:00
124 122
Std. Bus Std. Bus
21:00 - 01:00
47 48 1 1 55 50 24 22 $1.76 $1.97 / 21 14 / 16 Std. Bus Std. Bus
26 $2.63 $1.92 10 / 23 9 / 27
15:00 - 18:00
318 324 2 2 41 58 25
09:00 - 15:00
621 632 2 2 36 48 23 24 $2.33 $2.09 19 / 12 19 / 13 Std. Bus Std. Bus
06:00 - 09:00
191 194 1 1 24 42 16 19 $5.04 $2.75 17 / 6 22 / 6 Std. Bus Std. Bus
2015 2016
Satu
rday
01:00 - 06:00
29 $2.05 $1.73 13
18:00 - 21:00
217 221 2 2 30 58 21
/ 24 13 / 27 Std. Bus Std. Bus
Std. Bus
Time Annual Revenue Hours
Average Trips per Clock Hour
Average Boardings per Revenue Hour
Average Boardings per Trip
Average Cost per Passenger
Average Peak Passenger LoadVehicle Type
(NB / SB)
$2.74 $1.69 8 / 23 12 / 34 Std. Bus21:00 - 01:00
229 230 1 1 41 65 19 29
18:00 - 21:00
1,129 1,133 2 2 37 63 25 31 $2.21 $1.75 10 / 26 12 / 33 Std. Bus Std. Bus
18 / 37 17 / 34 Std. Bus Std. Bus1,686 2 2 59 74 38 41 $1.51 $1.39
Performance by Day of Week, Route 316 Data collected early Sept. to mid-Dec. of the given year
TimeAnnual Revenue
HoursAverage Trips per Clock Hour
Average Boardings per Revenue Hour
Average Boardings per Trip
Average Cost per Passenger
Average Peak Passenger LoadVehicle Type
(NB / SB)
09:00 - 15:00
3,305 3,318 2 2 46 59 30 32 $1.83 $1.71 19 / 17 20 / 16 Std. Bus Std. Bus
Std. Bus Std. Bus
06:00 - 09:00
1,588 1,594 2 2 48 62 31 33 $1.95 $1.73 31 / 12 30 / 12 Std. Bus Std. Bus
2015 2016
Mon
day-
Frid
ay
01:00 - 06:00
354 356 2 2 25 40 15 18 $3.79 $2.71 23 / 4 25 / 6
15:00 - 18:00
1,680
Top 25% of all bus services High 25% of all bus services Low 25% of all bus services Bottom 25% of all bus services Above Guidelines#
13

Key CharacteristicsSub-region of Primary Service:
Predominant Vehicle Type: Bus Depot:
Contributes to FTN: YesAverage One-Way Trip Distance (km):
Cost & Performance2012 2013 2014 2015 2016 Rank (2016)
Annual APC Boardings: 3,996,000 3,906,000 4,014,000 4,307,000 4,711,000 16 of 214 Average Daily APC Boardings (Mon-Fri): 12,550 12,400 12,750 13,650 14,800 16 of 213
Average Daily APC Boardings (Sat): 8,250 7,900 8,250 8,550 9,500 18 of 174 Average Daily APC Boardings (Sun/Hol): 6,450 6,200 6,300 7,250 8,000 18 of 171
Annual Service Cost: $4,068,000 $4,164,000 $4,346,000 $4,408,000 $4,491,000 22 of 216 Annual Revenue Hours: 41,900 42,900 44,800 45,400 46,300 22 of 216
Cost per APC Boarded Passenger: $1.02 $1.07 $1.12 $1.02 $0.95 10 of 214 Average APC Boardings per Rev. Hour: 95 91 90 95 102 9 of 214
Average Peak Passenger Load: 30 29 29 30 30 34 of 210Average Peak Load Factor: 60% 58% 58% 60% 59% 34 of 210
Revenue Hours with Overcrowding: 5% 4% 5% 9% 14% 202 of 209 Average Speed (km/h): 23.3 23.3 23.3 22.9 131 of 206
Service Changes Since December 2010- Spring 2011, Increase freq all day from 10 to 7/8m (M-F); increase freq from 30 to 15m late evenings (M-F, Sat)- Spring 2012, Reduce freq from 15 to 20m btw 6-7hr (Sat); btw 6-8hr (S/H); add 25:56 trip to meet N19 downtown- Summer 2012, Add Sat AM trip leaving Newton Exchange at 05:45- Fall 2014, Increase freq from 15 to 10m btw 18-21hr & from 30 to 20m btw 23-24hr (M-F)
Cost
Ride
rshi
pU
tiliz
atio
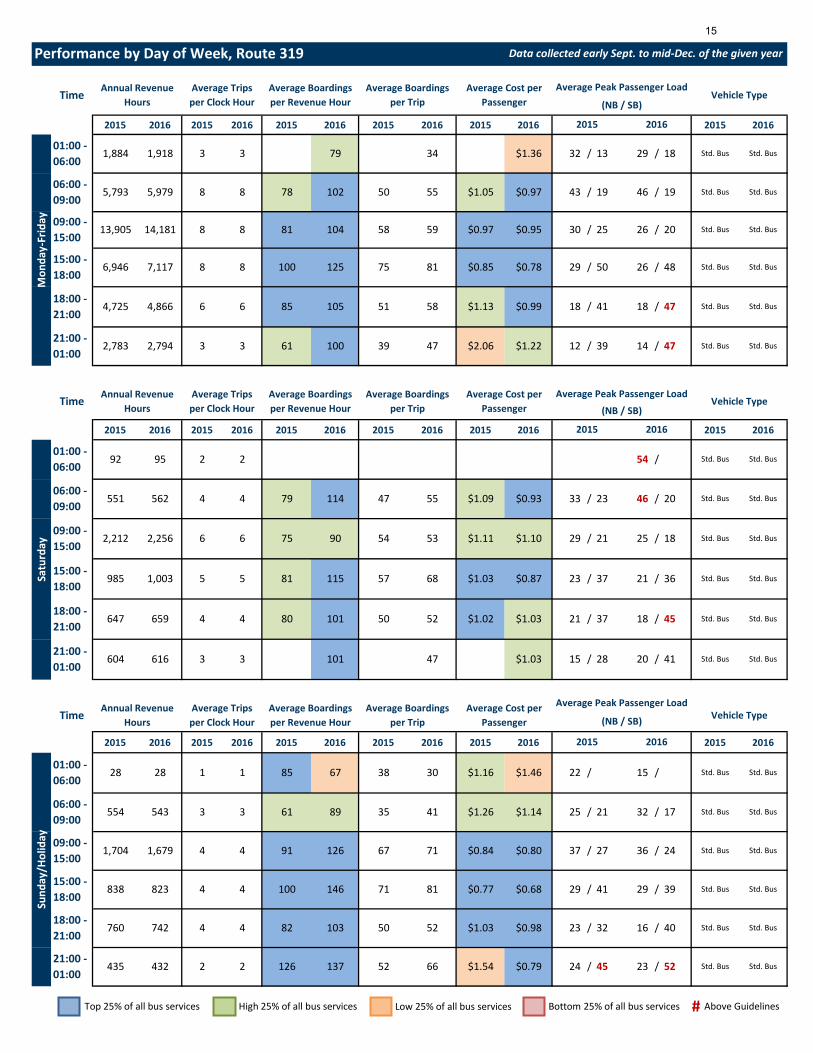
nRoute 319
South of Fraser
10.9
Std. BusSurrey
14
2015 2016 2015 2016 2015 2016 2015 2016 2015 2016 2015 2016
2015 2016 2015 2016 2015 2016 2015 2016 2015 2016 2015 2016
2015 2016 2015 2016 2015 2016 2015 2016 2015 2016 2015 2016
/
4 100 146 71 81 $0.77 $0.68 29 /
3 3 61 89 35 41 $1.26 $1.14 25 / 21 32 / 17 Std. Bus Std. Bus
40 Std. Bus Std. Bus
21:00 - 01:00
435 432 2 2 126 137 52 66 $1.54 $0.79 24 / 45 23 / 52 Std. Bus Std. Bus
41 29 / 39 Std. Bus Std. Bus
18:00 - 21:00
760 742 4 4 82 103 50 52 $1.03 $0.98 23 / 32 16
2015 2016
Sund
ay/H
olid
ay
01:00 - 06:00
28 28 1 1 85 67 38 30 $1.16 $1.46 22 / 15 /
15:00 - 18:00
838 823 4
TimeAnnual Revenue
HoursAverage Trips per Clock Hour
Average Boardings per Revenue Hour
Average Boardings per Trip
Average Cost per Passenger
Average Peak Passenger LoadVehicle Type(NB / SB)
09:00 - 15:00
1,704 1,679 4 4 91 126 67 71 $0.84 $0.80 37 / 27 36 / 24 Std. Bus Std. Bus
Std. Bus Std. Bus
06:00 - 09:00
554 543
Std. Bus Std. Bus
21:00 - 01:00
604 616 3 3 101 47 $1.03 15 / 28 20 / 41 Std. Bus Std. Bus
52 $1.02 $1.03 21 / 37 18 / 45
15:00 - 18:00
985 1,003 5 5 81 115 57
09:00 - 15:00
2,212 2,256 6 6 75 90 54 53 $1.11 $1.10 29 / 21 25 / 18 Std. Bus Std. Bus
Std. Bus Std. Bus
06:00 - 09:00
551 562 4 4 79 114 47 55 $1.09 $0.93 33 / 23 46 / 20 Std. Bus Std. Bus
2015 2016
Satu
rday
01:00 - 06:00
92 95 2 2 54 /
68 $1.03 $0.87 23
18:00 - 21:00
647 659 4 4 80 101 50
/ 37 21 / 36 Std. Bus Std. Bus
Std. Bus
Time Annual Revenue Hours
Average Trips per Clock Hour
Average Boardings per Revenue Hour
Average Boardings per Trip
Average Cost per Passenger
Average Peak Passenger LoadVehicle Type
(NB / SB)
$2.06 $1.22 12 / 39 14 / 47 Std. Bus21:00 - 01:00
2,783 2,794 3 3 61 100 39 47
18:00 - 21:00
4,725 4,866 6 6 85 105 51 58 $1.13 $0.99 18 / 41 18 / 47 Std. Bus Std. Bus
29 / 50 26 / 48 Std. Bus Std. Bus7,117 8 8 100 125 75 81 $0.85 $0.78
Performance by Day of Week, Route 319 Data collected early Sept. to mid-Dec. of the given year
TimeAnnual Revenue
HoursAverage Trips per Clock Hour
Average Boardings per Revenue Hour
Average Boardings per Trip
Average Cost per Passenger
Average Peak Passenger LoadVehicle Type
(NB / SB)
09:00 - 15:00
13,905 14,181 8 8 81 104 58 59 $0.97 $0.95 30 / 25 26 / 20 Std. Bus Std. Bus
Std. Bus Std. Bus
06:00 - 09:00
5,793 5,979 8 8 78 102 50 55 $1.05 $0.97 43 / 19 46 / 19 Std. Bus Std. Bus
2015 2016
Mon
day-
Frid
ay
01:00 - 06:00
1,884 1,918 3 3 79 34 $1.36 32 / 13 29 / 18
15:00 - 18:00
6,946
Top 25% of all bus services High 25% of all bus services Low 25% of all bus services Bottom 25% of all bus services Above Guidelines#
15

Key CharacteristicsSub-region of Primary Service:
Predominant Vehicle Type: Bus Depot:
Contributes to FTN: YesAverage One-Way Trip Distance (km):
Cost & Performance2012 2013 2014 2015 2016 Rank (2016)
Annual APC Boardings: 3,178,000 2,853,000 2,209,000 2,151,000 2,207,000 37 of 214 Average Daily APC Boardings (Mon-Fri): 9,700 8,650 6,550 6,500 6,700 39 of 213
Average Daily APC Boardings (Sat): 6,950 6,550 5,400 5,200 5,000 34 of 174 Average Daily APC Boardings (Sun/Hol): 5,950 5,650 4,600 4,100 4,250 32 of 171
Annual Service Cost: $3,924,000 $3,186,000 $3,224,000 $3,221,000 $3,216,000 38 of 216 Annual Revenue Hours: 40,400 32,800 33,200 33,200 33,200 38 of 216
Cost per APC Boarded Passenger: $1.23 $1.12 $1.50 $1.50 $1.46 69 of 214 Average APC Boardings per Rev. Hour: 79 87 66 65 67 64 of 214
Average Peak Passenger Load: 31 30 26 26 25 63 of 210Average Peak Load Factor: 62% 59% 53% 52% 50% 64 of 210
Revenue Hours with Overcrowding: 6% 7% 4% 4% 0% 1 of 209 Average Speed (km/h): 25.1 25.7 25.5 24.5 100 of 206
Service Changes Since December 2010- Spring 2012, Btw Fleetwood & Surrey Central: add 10 trips WB from 6:30-9:30; add 8 trips EB from 15:30-19hr- Spring 2012, Reduce freq from 15 to 20m btw 6-7hr (Sat); btw 6-8hr (S/H)- Summer 2012, 1:40 AM trip added on Friday & Sat PMs- Fall 2013, Reduce service in conjunction with introduction of 96 B-Line- Fall 2016, Reroute via from 64th Ave to 60th Ave near Cloverdale
Cost
Ride
rshi
pU
tiliz
atio
n
Ridership change potentially influenced by introduction of 96 B-Line
Route 320
South of Fraser
13.0
Std. BusSurrey
16

2015 2016 2015 2016 2015 2016 2015 2016 2015 2016 2015 2016
2015 2016 2015 2016 2015 2016 2015 2016 2015 2016 2015 2016
2015 2016 2015 2016 2015 2016 2015 2016 2015 2016 2015 2016
/
4 57 67 41 41 $1.51 $1.46 26 /
3 3 30 37 24 19 $2.43 $2.99 11 / 19 8 / 15 Std. Bus Std. Bus
15 Std. Bus Std. Bus
21:00 - 01:00
458 453 2 2 55 30 $1.94 23 / 18 26 / 13 Std. Bus Std. Bus
22 20 / 22 Std. Bus Std. Bus
18:00 - 21:00
774 766 4 4 41 54 26 28 $2.09 $1.94 19 / 15 22
2015 2016
Sund
ay/H
olid
ay
01:00 - 06:00
46 45 1 1
15:00 - 18:00
901 840 4
TimeAnnual Revenue
HoursAverage Trips per Clock Hour
Average Boardings per Revenue Hour
Average Boardings per Trip
Average Cost per Passenger
Average Peak Passenger LoadVehicle Type(EB / WB)
09:00 - 15:00
1,942 1,977 4 4 56 60 38 39 $1.69 $1.67 20 / 27 18 / 23 Std. Bus Std. Bus
Std. Bus Std. Bus
06:00 - 09:00
684 672
Std. Bus Std. Bus
21:00 - 01:00
487 496 2 2 31 / 11 Std. Bus Std. Bus
37 $2.10 $1.47 23 / 15 29 / 18
15:00 - 18:00
893 911 4 4 64 66 51
09:00 - 15:00
1,835 1,872 4 4 51 63 47 45 $1.60 $1.59 20 / 33 19 / 26 Std. Bus Std. Bus
Std. Bus Std. Bus
06:00 - 09:00
610 622 4 4 44 50 20 27 $3.13 $2.42 10 / 20 11 / 23 Std. Bus Std. Bus
2015 2016
Satu
rday
01:00 - 06:00
93 95 2 2 32 24 $3.04 21 /
47 $1.41 $1.53 32
18:00 - 21:00
621 633 4 4 46 69 31
/ 28 30 / 20 Std. Bus Std. Bus
Std. Bus
Time Annual Revenue Hours
Average Trips per Clock Hour
Average Boardings per Revenue Hour
Average Boardings per Trip
Average Cost per Passenger
Average Peak Passenger LoadVehicle Type
(EB / WB)
$3.28 $2.73 20 / 12 21 / 12 Std. Bus21:00 - 01:00
2,414 2,368 2 2 37 44 22 24
18:00 - 21:00
3,300 3,253 4 4 49 60 36 35 $1.94 $1.89 34 / 12 30 / 12 Std. Bus Std. Bus
48 / 27 45 / 25 Std. Bus Std. Bus4,562 4 4 73 92 65 67 $1.24 $1.10
Performance by Day of Week, Route 320 Data collected early Sept. to mid-Dec. of the given year
TimeAnnual Revenue
HoursAverage Trips per Clock Hour
Average Boardings per Revenue Hour
Average Boardings per Trip
Average Cost per Passenger
Average Peak Passenger LoadVehicle Type
(EB / WB)
09:00 - 15:00
8,320 8,196 4 4 61 74 49 52 $1.41 $1.35 25 / 30 22 / 26 Std. Bus Std. Bus
Std. Bus Std. Bus
06:00 - 09:00
3,892 3,916 4 4 64 77 45 48 $1.56 $1.36 18 / 43 24 / 41 Std. Bus Std. Bus
2015 2016
Mon
day-
Frid
ay
01:00 - 06:00
1,496 1,478 2 2 42 57 26 29 $2.46 $2.44 16 / 32 16 / 33
15:00 - 18:00
4,438
Top 25% of all bus services High 25% of all bus services Low 25% of all bus services Bottom 25% of all bus services Above Guidelines#
17

Key CharacteristicsSub-region of Primary Service:
Predominant Vehicle Type: Bus Depot:
Contributes to FTN: YesAverage One-Way Trip Distance (km):
Cost & Performance2012 2013 2014 2015 2016 Rank (2016)
Annual APC Boardings: 3,822,000 3,259,000 2,255,000 2,264,000 2,384,000 36 of 214 Average Daily APC Boardings (Mon-Fri): 11,850 10,100 6,900 6,900 7,250 37 of 213
Average Daily APC Boardings (Sat): 8,050 7,150 5,150 5,150 5,300 31 of 174 Average Daily APC Boardings (Sun/Hol): 6,550 5,800 4,150 4,300 4,550 30 of 171
Annual Service Cost: $4,973,000 $3,956,000 $4,141,000 $4,197,000 $4,239,000 27 of 216 Annual Revenue Hours: 51,300 40,800 42,700 43,300 43,700 27 of 216
Cost per APC Boarded Passenger: $1.30 $1.21 $1.89 $1.85 $1.78 92 of 214 Average APC Boardings per Rev. Hour: 75 80 53 52 55 84 of 214
Average Peak Passenger Load: 29 28 26 25 25 60 of 210Average Peak Load Factor: 59% 55% 52% 50% 51% 60 of 210
Revenue Hours with Overcrowding: 1% 4% 0% 0% 0% 1 of 209 Average Speed (km/h): 26.9 27.6 27.1 26.7 65 of 206
Service Changes Since December 2010- Fall 2013, Reduce service in conjunction with introduction of 96 B-Line
Cost
Ride
rshi
pU
tiliz
atio
n
Ridership change potentially influenced by introduction of 96 B-Line
Route 321
South of Fraser
18.5
Std. BusSurrey
18

2015 2016 2015 2016 2015 2016 2015 2016 2015 2016 2015 2016
2015 2016 2015 2016 2015 2016 2015 2016 2015 2016 2015 2016
2015 2016 2015 2016 2015 2016 2015 2016 2015 2016 2015 2016
/
4 46 52 44 42 $1.77 $1.94 23 /
4 4 23 40 18 27 $3.98 $2.48 11 / 11 17 / 16 Std. Bus Std. Bus
16 Std. Bus Std. Bus
21:00 - 01:00
660 649 2 2 33 20 $3.64 16 / 14 7 / 24 Std. Bus Std. Bus
26 19 / 22 Std. Bus Std. Bus
18:00 - 21:00
1,151 1,147 4 4 33 38 29 29 $2.73 $2.61 17 / 18 15
2015 2016
Sund
ay/H
olid
ay
01:00 - 06:00
68 69 1 1 39 40 20 17 $2.21 $3.16 / 16 0 / 26
15:00 - 18:00
1,201 1,165 4
TimeAnnual Revenue
HoursAverage Trips per Clock Hour
Average Boardings per Revenue Hour
Average Boardings per Trip
Average Cost per Passenger
Average Peak Passenger LoadVehicle Type(NB / SB)
09:00 - 15:00
2,351 2,370 4 4 39 47 37 36 $2.08 $2.11 21 / 19 19 / 19 Std. Bus Std. Bus
Std. Bus Std. Bus
06:00 - 09:00
1,035 1,019
Std. Bus Std. Bus
21:00 - 01:00
563 574 2 2 36 23 $3.22 29 / 10 13 / 14 Std. Bus Std. Bus
32 $2.16 $2.45 19 / 22 14 / 19
15:00 - 18:00
1,084 1,105 4 4 46 52 46
09:00 - 15:00
2,120 2,182 4 4 41 51 41 43 $2.00 $1.91 23 / 22 23 / 19 Std. Bus Std. Bus
Std. Bus Std. Bus
06:00 - 09:00
890 909 4 4 30 46 30 36 $2.58 $2.15 18 / 18 23 / 18 Std. Bus Std. Bus
2015 2016
Satu
rday
01:00 - 06:00
207 212 2 2 41 18 $3.08 18 / 7 18 / 15
45 $1.91 $1.92 25
18:00 - 21:00
903 921 4 4 39 41 36
/ 26 20 / 28 Std. Bus Std. Bus
Std. Bus
Time Annual Revenue Hours
Average Trips per Clock Hour
Average Boardings per Revenue Hour
Average Boardings per Trip
Average Cost per Passenger
Average Peak Passenger LoadVehicle Type
(NB / SB)
$3.60 $2.93 14 / 18 13 / 23 Std. Bus21:00 - 01:00
2,654 2,664 2 2 32 42 23 27
18:00 - 21:00
4,767 4,786 4 4 41 53 36 42 $2.28 $1.91 17 / 26 18 / 29 Std. Bus Std. Bus
30 / 42 30 / 42 Std. Bus Std. Bus5,725 4 4 63 74 68 73 $1.41 $1.32
Performance by Day of Week, Route 321 Data collected early Sept. to mid-Dec. of the given year
TimeAnnual Revenue
HoursAverage Trips per Clock Hour
Average Boardings per Revenue Hour
Average Boardings per Trip
Average Cost per Passenger
Average Peak Passenger LoadVehicle Type
(NB / SB)
09:00 - 15:00
10,979 11,059 4 4 49 60 54 55 $1.65 $1.65 29 / 27 26 / 25 Std. Bus Std. Bus
Std. Bus Std. Bus
06:00 - 09:00
5,107 5,093 4 4 51 62 51 54 $1.62 $1.59 35 / 26 36 / 27 Std. Bus Std. Bus
2015 2016
Mon
day-
Frid
ay
01:00 - 06:00
1,871 2,053 2 2 40 55 24 27 $2.13 $2.16 22 / 15 23 / 21
15:00 - 18:00
5,654
Top 25% of all bus services High 25% of all bus services Low 25% of all bus services Bottom 25% of all bus services Above Guidelines#
19

Key CharacteristicsSub-region of Primary Service:
Predominant Vehicle Type: Bus Depot:
Contributes to FTN: NoAverage One-Way Trip Distance (km):
Cost & Performance2012 2013 2014 2015 2016 Rank (2016)
Annual APC Boardings: 1,259,000 1,390,000 1,418,000 1,551,000 1,716,000 46 of 214 Average Daily APC Boardings (Mon-Fri): 3,950 4,350 4,450 4,900 5,350 48 of 213
Average Daily APC Boardings (Sat): 2,500 2,800 2,900 3,100 3,500 45 of 174 Average Daily APC Boardings (Sun/Hol): 2,250 2,450 2,400 2,700 3,100 41 of 171
Annual Service Cost: $1,651,000 $1,660,000 $1,725,000 $1,729,000 $1,756,000 64 of 216 Annual Revenue Hours: 17,000 17,100 17,800 17,800 18,100 65 of 216
Cost per APC Boarded Passenger: $1.31 $1.19 $1.25 $1.11 $1.02 16 of 214 Average APC Boardings per Rev. Hour: 74 81 80 87 95 14 of 214
Average Peak Passenger Load: 26 27 27 29 30 31 of 210Average Peak Load Factor: 52% 55% 55% 57% 60% 28 of 210
Revenue Hours with Overcrowding: 0% 0% 0% 0% 4% 176 of 209 Average Speed (km/h): 22.5 22.8 22.5 21.5 149 of 206
Service Changes Since December 2010- Winter 2010, Improve AM peak freq from 20 to 15m; PM peak from 30 to 20m (M-F)- Summer 2012, Increase freq from 30 to 20m midday and 20 to 15m PM Peak (M-F). Increase midday/PM freq from 30 to 20m (Sat, S/H)
Cost
Ride
rshi
pU
tiliz
atio
nRoute 323
South of Fraser
9.5
Std. BusSurrey
20
2015 2016 2015 2016 2015 2016 2015 2016 2015 2016 2015 2016
2015 2016 2015 2016 2015 2016 2015 2016 2015 2016 2015 2016
2015 2016 2015 2016 2015 2016 2015 2016 2015 2016 2015 2016
/
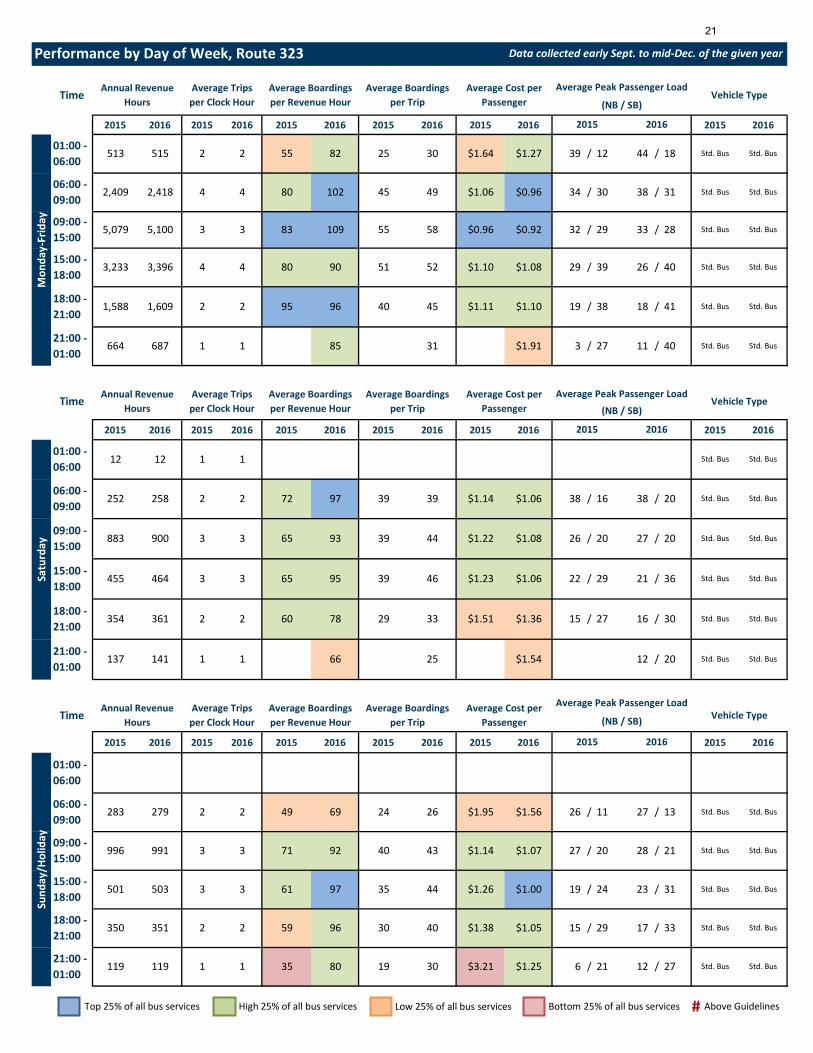
3 61 97 35 44 $1.26 $1.00 19 /
2 2 49 69 24 26 $1.95 $1.56 26 / 11 27 / 13 Std. Bus Std. Bus
33 Std. Bus Std. Bus
21:00 - 01:00
119 119 1 1 35 80 19 30 $3.21 $1.25 6 / 21 12 / 27 Std. Bus Std. Bus
24 23 / 31 Std. Bus Std. Bus
18:00 - 21:00
350 351 2 2 59 96 30 40 $1.38 $1.05 15 / 29 17
2015 2016
Sund
ay/H
olid
ay
01:00 - 06:00
15:00 - 18:00
501 503 3
TimeAnnual Revenue
HoursAverage Trips per Clock Hour
Average Boardings per Revenue Hour
Average Boardings per Trip
Average Cost per Passenger
Average Peak Passenger LoadVehicle Type(NB / SB)
09:00 - 15:00
996 991 3 3 71 92 40 43 $1.14 $1.07 27 / 20 28 / 21 Std. Bus Std. Bus
06:00 - 09:00
283 279
Std. Bus Std. Bus
21:00 - 01:00
137 141 1 1 66 25 $1.54 12 / 20 Std. Bus Std. Bus
33 $1.51 $1.36 15 / 27 16 / 30
15:00 - 18:00
455 464 3 3 65 95 39
09:00 - 15:00
883 900 3 3 65 93 39 44 $1.22 $1.08 26 / 20 27 / 20 Std. Bus Std. Bus
Std. Bus Std. Bus
06:00 - 09:00
252 258 2 2 72 97 39 39 $1.14 $1.06 38 / 16 38 / 20 Std. Bus Std. Bus
2015 2016
Satu
rday
01:00 - 06:00
12 12 1 1
46 $1.23 $1.06 22
18:00 - 21:00
354 361 2 2 60 78 29
/ 29 21 / 36 Std. Bus Std. Bus
Std. Bus
Time Annual Revenue Hours
Average Trips per Clock Hour
Average Boardings per Revenue Hour
Average Boardings per Trip
Average Cost per Passenger
Average Peak Passenger LoadVehicle Type
(NB / SB)
$1.91 3 / 27 11 / 40 Std. Bus21:00 - 01:00
664 687 1 1 85 31
18:00 - 21:00
1,588 1,609 2 2 95 96 40 45 $1.11 $1.10 19 / 38 18 / 41 Std. Bus Std. Bus
29 / 39 26 / 40 Std. Bus Std. Bus3,396 4 4 80 90 51 52 $1.10 $1.08
Performance by Day of Week, Route 323 Data collected early Sept. to mid-Dec. of the given year
TimeAnnual Revenue
HoursAverage Trips per Clock Hour
Average Boardings per Revenue Hour
Average Boardings per Trip
Average Cost per Passenger
Average Peak Passenger LoadVehicle Type
(NB / SB)
09:00 - 15:00
5,079 5,100 3 3 83 109 55 58 $0.96 $0.92 32 / 29 33 / 28 Std. Bus Std. Bus
Std. Bus Std. Bus
06:00 - 09:00
2,409 2,418 4 4 80 102 45 49 $1.06 $0.96 34 / 30 38 / 31 Std. Bus Std. Bus
2015 2016
Mon
day-
Frid
ay
01:00 - 06:00
513 515 2 2 55 82 25 30 $1.64 $1.27 39 / 12 44 / 18
15:00 - 18:00
3,233
Top 25% of all bus services High 25% of all bus services Low 25% of all bus services Bottom 25% of all bus services Above Guidelines#
21

Key CharacteristicsSub-region of Primary Service:
Predominant Vehicle Type: Bus Depot:
Contributes to FTN: NoAverage One-Way Trip Distance (km):
Cost & Performance2012 2013 2014 2015 2016 Rank (2016)
Annual APC Boardings: 738,000 723,000 734,000 759,000 869,000 79 of 214 Average Daily APC Boardings (Mon-Fri): 2,400 2,350 2,400 2,450 2,750 78 of 213
Average Daily APC Boardings (Sat): 1,250 1,300 1,300 1,350 1,650 77 of 174 Average Daily APC Boardings (Sun/Hol): 1,100 1,050 1,100 1,150 1,400 76 of 171
Annual Service Cost: $1,168,000 $1,191,000 $1,206,000 $1,264,000 $1,269,000 92 of 216 Annual Revenue Hours: 12,000 12,300 12,400 13,000 13,100 96 of 216
Cost per APC Boarded Passenger: $1.58 $1.65 $1.69 $1.67 $1.46 70 of 214 Average APC Boardings per Rev. Hour: 61 59 59 58 66 65 of 214
Average Peak Passenger Load: 21 20 20 21 23 79 of 210Average Peak Load Factor: 41% 40% 40% 41% 46% 78 of 210
Revenue Hours with Overcrowding: 0% 0% 0% 0% 0% 1 of 209 Average Speed (km/h): 22.8 23.2 23.3 21.9 143 of 206
Service Changes Since December 2010- Winter 2010, Improve AM peak freq from 20 to 15m; PM peak from 30 to 20m (M-F)
Cost
Ride
rshi
pU
tiliz
atio
nRoute 324
South of Fraser
9.0
Std. BusSurrey
22

2015 2016 2015 2016 2015 2016 2015 2016 2015 2016 2015 2016
2015 2016 2015 2016 2015 2016 2015 2016 2015 2016 2015 2016
2015 2016 2015 2016 2015 2016 2015 2016 2015 2016 2015 2016
20 8 /
2 44 62 22 26 $2.02 $1.63 11 /
2 2 25 40 12 16 $3.59 $2.95 11 / 7 15 / 7 Std. Bus Std. Bus
22 Std. Bus Std. Bus
21:00 - 01:00
99 97 2 2 34 46 15 18 $2.63 $2.14 9 / 15 6 / 14 Std. Bus Std. Bus
19 13 / 19 Std. Bus Std. Bus
18:00 - 21:00
303 297 2 2 40 55 19 22 $2.44 $2.03 8 /
2015 2016
Sund
ay/H
olid
ay
01:00 - 06:00
15:00 - 18:00
315 309 2
TimeAnnual Revenue
HoursAverage Trips per Clock Hour
Average Boardings per Revenue Hour
Average Boardings per Trip
Average Cost per Passenger
Average Peak Passenger LoadVehicle Type(NB / SB)
09:00 - 15:00
624 612 2 2 39 66 21 27 $1.97 $1.54 16 / 9 20 / 11 Std. Bus Std. Bus
06:00 - 09:00
252 248
Std. Bus Std. Bus
21:00 - 01:00
80 81 2 2 38 49 18 19 $2.60 $2.03 10 / 13 10 / 17 Std. Bus Std. Bus
25 $2.26 $1.72 9 / 21 10 / 26
15:00 - 18:00
270 276 2 2 60 76 28
09:00 - 15:00
520 530 2 2 47 66 23 29 $1.91 $1.58 17 / 12 23 / 13 Std. Bus Std. Bus
06:00 - 09:00
271 277 2 2 37 59 19 24 $2.28 $1.96 18 / 10 24 / 12 Std. Bus Std. Bus
2015 2016
Satu
rday
01:00 - 06:00
33 $1.62 $1.32 13
18:00 - 21:00
227 231 2 2 46 62 19
/ 26 16 / 27 Std. Bus Std. Bus
Std. Bus
Time Annual Revenue Hours
Average Trips per Clock Hour
Average Boardings per Revenue Hour
Average Boardings per Trip
Average Cost per Passenger
Average Peak Passenger LoadVehicle Type
(NB / SB)
$1.81 $1.44 8 / 25 8 / 36 Std. Bus21:00 - 01:00
384 385 2 2 60 84 24 34
18:00 - 21:00
1,509 1,514 2 2 49 70 27 31 $1.90 $1.60 9 / 31 11 / 36 Std. Bus Std. Bus
19 / 33 21 / 35 Std. Bus Std. Bus2,537 3 3 55 74 36 42 $1.58 $1.36
Performance by Day of Week, Route 324 Data collected early Sept. to mid-Dec. of the given year
TimeAnnual Revenue
HoursAverage Trips per Clock Hour
Average Boardings per Revenue Hour
Average Boardings per Trip
Average Cost per Passenger
Average Peak Passenger LoadVehicle Type
(NB / SB)
09:00 - 15:00
3,014 3,026 2 2 47 70 31 35 $1.58 $1.42 22 / 17 24 / 18 Std. Bus Std. Bus
Std. Bus Std. Bus
06:00 - 09:00
2,455 2,464 4 4 59 80 34 38 $1.44 $1.25 30 / 19 34 / 20 Std. Bus Std. Bus
2015 2016
Mon
day-
Frid
ay
01:00 - 06:00
196 197 2 2 69 118 36 46 $1.06 $0.82 34 / 41 /
15:00 - 18:00
2,520
Top 25% of all bus services High 25% of all bus services Low 25% of all bus services Bottom 25% of all bus services Above Guidelines#
23
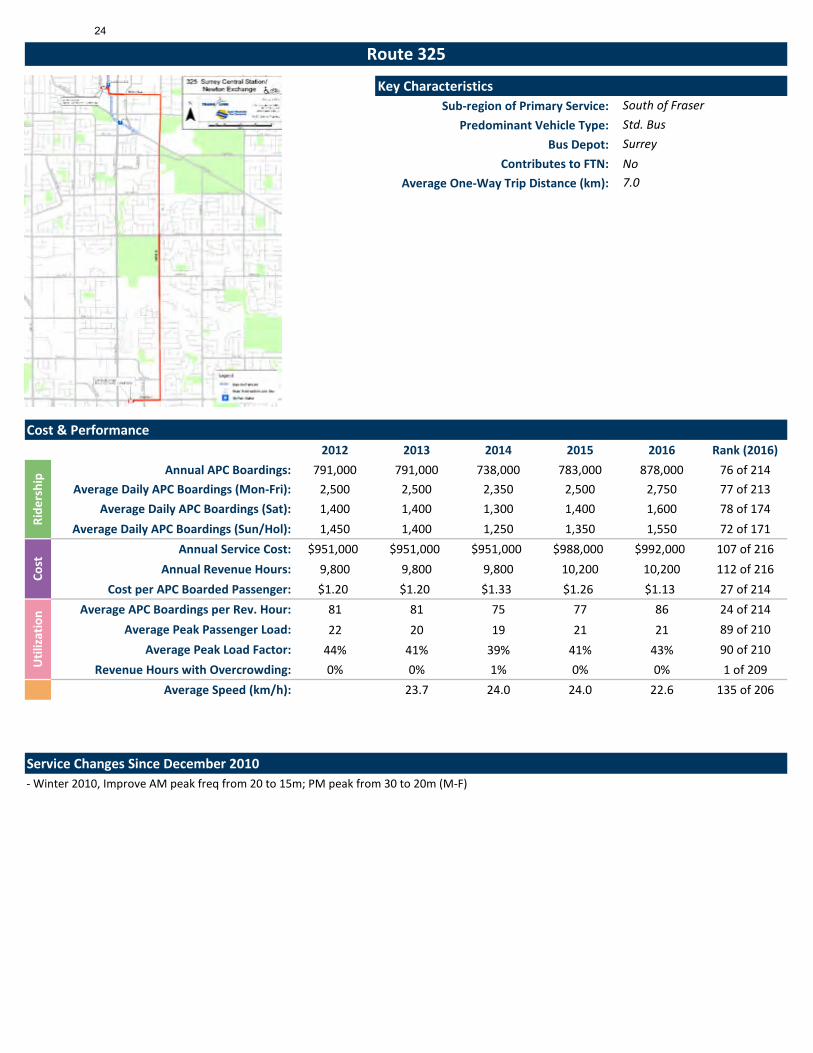
Key CharacteristicsSub-region of Primary Service:
Predominant Vehicle Type: Bus Depot:
Contributes to FTN: NoAverage One-Way Trip Distance (km):
Cost & Performance2012 2013 2014 2015 2016 Rank (2016)
Annual APC Boardings: 791,000 791,000 738,000 783,000 878,000 76 of 214 Average Daily APC Boardings (Mon-Fri): 2,500 2,500 2,350 2,500 2,750 77 of 213
Average Daily APC Boardings (Sat): 1,400 1,400 1,300 1,400 1,600 78 of 174 Average Daily APC Boardings (Sun/Hol): 1,450 1,400 1,250 1,350 1,550 72 of 171
Annual Service Cost: $951,000 $951,000 $951,000 $988,000 $992,000 107 of 216 Annual Revenue Hours: 9,800 9,800 9,800 10,200 10,200 112 of 216
Cost per APC Boarded Passenger: $1.20 $1.20 $1.33 $1.26 $1.13 27 of 214 Average APC Boardings per Rev. Hour: 81 81 75 77 86 24 of 214
Average Peak Passenger Load: 22 20 19 21 21 89 of 210Average Peak Load Factor: 44% 41% 39% 41% 43% 90 of 210
Revenue Hours with Overcrowding: 0% 0% 1% 0% 0% 1 of 209 Average Speed (km/h): 23.7 24.0 24.0 22.6 135 of 206
Service Changes Since December 2010- Winter 2010, Improve AM peak freq from 20 to 15m; PM peak from 30 to 20m (M-F)
Ride
rshi
pCo
stU
tiliz
atio
nRoute 325
South of Fraser
7.0
SurreyStd. Bus
24
2015 2016 2015 2016 2015 2016 2015 2016 2015 2016 2015 2016
2015 2016 2015 2016 2015 2016 2015 2016 2015 2016 2015 2016
2015 2016 2015 2016 2015 2016 2015 2016 2015 2016 2015 2016
22
17 23 9
21:00 - 01:00
78 76 1
18:00 - 21:00
243 239 2 2 41 74 Std. Bus21 Std. Bus
13
23
24 Std. Bus
$1.41
Std. Bus Std. Bus
Std. Bus/1 33 46 $2.26 Std. Bus11$2.47 6 /14 14 15
/ 19 11 /$1.99 $1.42
9
Std. Bus
$2.52 $1.82 / 6 16 / 8 Std. BusStd. Bus
(NB / SB)
Std. Bus
17 10 / 20 Std. Bus
/ 19 11
11 /
8 /
Vehicle Type
1,804 1,811 3 3 77 96 $1.08
Average Cost per Passenger
2 71
$1.07
$1.19301,090
37 39
67 13 21 $2.47
$1.59
Std. Bus
112
224 228 83 30
$1.48
1217 /$1.20 /
73
15 Std. Bus
50 Std. Bus
456 2
$2.27 $2.60
64 $1.2330
$1.46
22
$1.90 $1.78
1 43 73 16
TimeAnnual Revenue
HoursAverage Trips per Clock Hour
Average Boardings per Revenue Hour
Average Boardings per Trip
Average Cost per Passenger
Average Peak Passenger Load
$0.76$0.69
Vehicle Type(NB / SB)
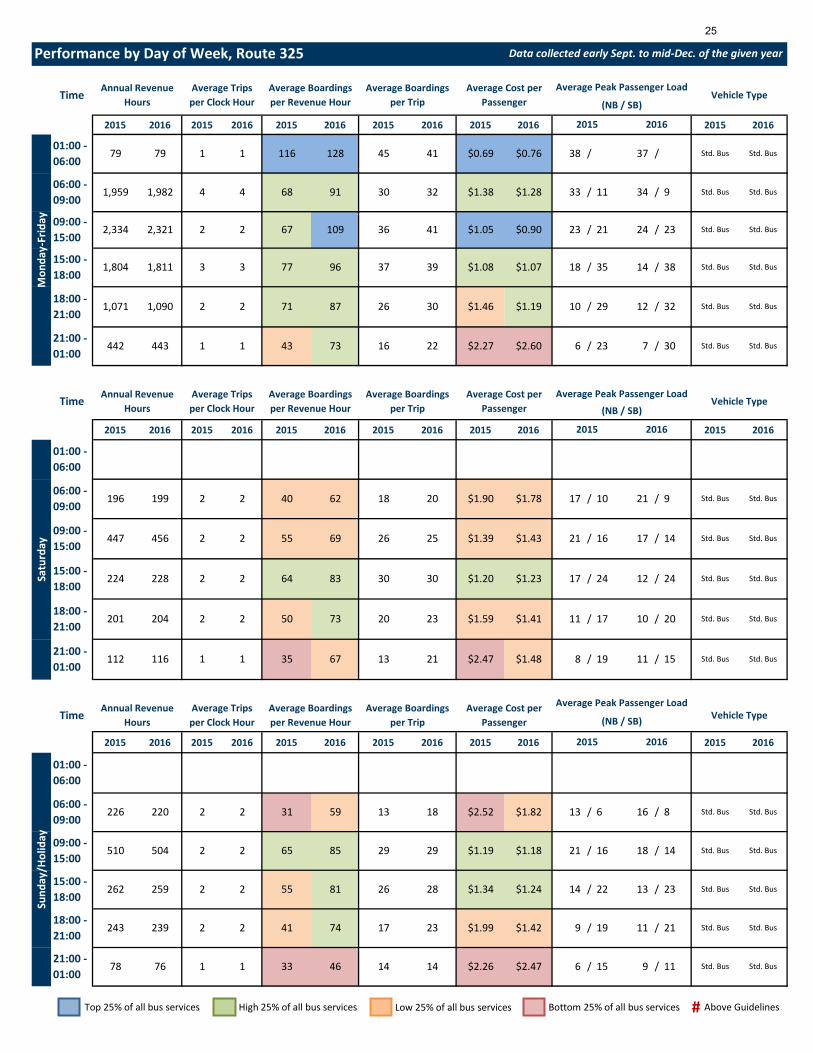
Data collected early Sept. to mid-Dec. of the given yearPerformance by Day of Week, Route 325
79 1 45 41
Mon
day-
Frid
ay
109
68 34
(NB / SB)
2015
Std. Bus
33 /
Std. Bus
30/ Std. Bus6 /
Std. Bus
Std. Bus
Std. Bus/ 23
10
7
36 41 $1.05
128
09:00 - 15:00
2,334
06:00 - 09:00
3291
2,321 2 2
4 4
Std. Bus/ 38 Std. Bus
/ 32 Std. BusStd. Bus29
35 14
2
/
2016
Std. Bus
21 24 /
2015
23
37
11 9 Std. Bus/
38 /1 116
67
29
28 $1.34 $1.24 14
13
196 199 2
2
116 1 1 35
15:00 - 18:00
30
17
$1.28
$0.90
$1.38
Average Peak Passenger Load
12
23
Average Cost per Passenger
Average Peak Passenger Load
9
/
18 /
20162015
15:00 - 18:00
1,071 87 26
21:00 - 01:00
442 443 1
Time Annual Revenue Hours
Average Trips per Clock Hour
Average Boardings per Revenue Hour
Average Boardings per Trip
447
2 40
01:00 - 06:00
06:00 - 09:00
62 18
18:00 - 21:00
1,959
01:00 - 06:00
79
1,982
/
1859 13
26
14 Std. Bus
23 Std. Bus
/ 16 18 /
/
18:00 - 21:00
201 204 2 20
2 2 3106:00 - 09:00
226 220
01:00 - 06:00
Annual Revenue Hours
Average Trips per Clock Hour
Average Boardings per Revenue Hour
$1.39 $1.43 21 / 16 17 / 14 Std. Bus Std. Bus
/ 10 21 /
2016
Satu
rday
Sund
ay/H
olid
ay
Vehicle Type
09:00 - 15:00
2 2
Time
21:00 - 01:00
Average Boardings per Trip
24
2 55 81
20
2 55 69 26 25
Std. Bus
09:00 - 15:00
510 504 2 2 65 85 29
259 215:00 - 18:00
262
$1.19 $1.18 21
Top 25% of all bus services High 25% of all bus services Low 25% of all bus services Bottom 25% of all bus services Above Guidelines#
25

Key CharacteristicsSub-region of Primary Service:
Predominant Vehicle Type: Bus Depot:
Contributes to FTN: NoAverage One-Way Trip Distance (km):
Cost & Performance2012 2013 2014 2015 2016 Rank (2016)
Annual APC Boardings: 316,000 322,000 334,000 342,000 377,000 118 of 214 Average Daily APC Boardings (Mon-Fri): 1,100 1,100 1,150 1,150 1,250 115 of 213
Average Daily APC Boardings (Sat): 400 450 550 550 600 114 of 174 Average Daily APC Boardings (Sun/Hol): 300 350 350 350 450 117 of 171
Annual Service Cost: $634,000 $693,000 $698,000 $723,000 $735,000 117 of 216 Annual Revenue Hours: 6,500 7,100 7,200 7,500 7,600 121 of 216
Cost per APC Boarded Passenger: $2.01 $2.15 $2.15 $2.11 $1.95 110 of 214 Average APC Boardings per Rev. Hour: 48 45 46 46 50 100 of 214
Average Peak Passenger Load: 18 19 18 19 19 106 of 210Average Peak Load Factor: 36% 37% 36% 39% 39% 114 of 210
Revenue Hours with Overcrowding: 0% 0% 0% 0% 0% 1 of 209 Average Speed (km/h): 24.4 23.2 22.8 21.6 148 of 206
Service Changes Since December 2010- No service change between December 2010 and September 2015
Util
izat
ion
Ride
rshi
pCo
st
10.9
Route 326
South of FraserStd. BusSurrey
26
2015 2016 2015 2016 2015 2016 2015 2016 2015 2016 2015 2016
2015 2016 2015 2016 2015 2016 2015 2016 2015 2016 2015 2016
2015 2016 2015 2016 2015 2016 2015 2016 2015 2016 2015 2016
Std. Bus
10 19 / 11 Std. Bus Std. Bus
8 Std. Bus Std. Bus
21:00 - 01:00
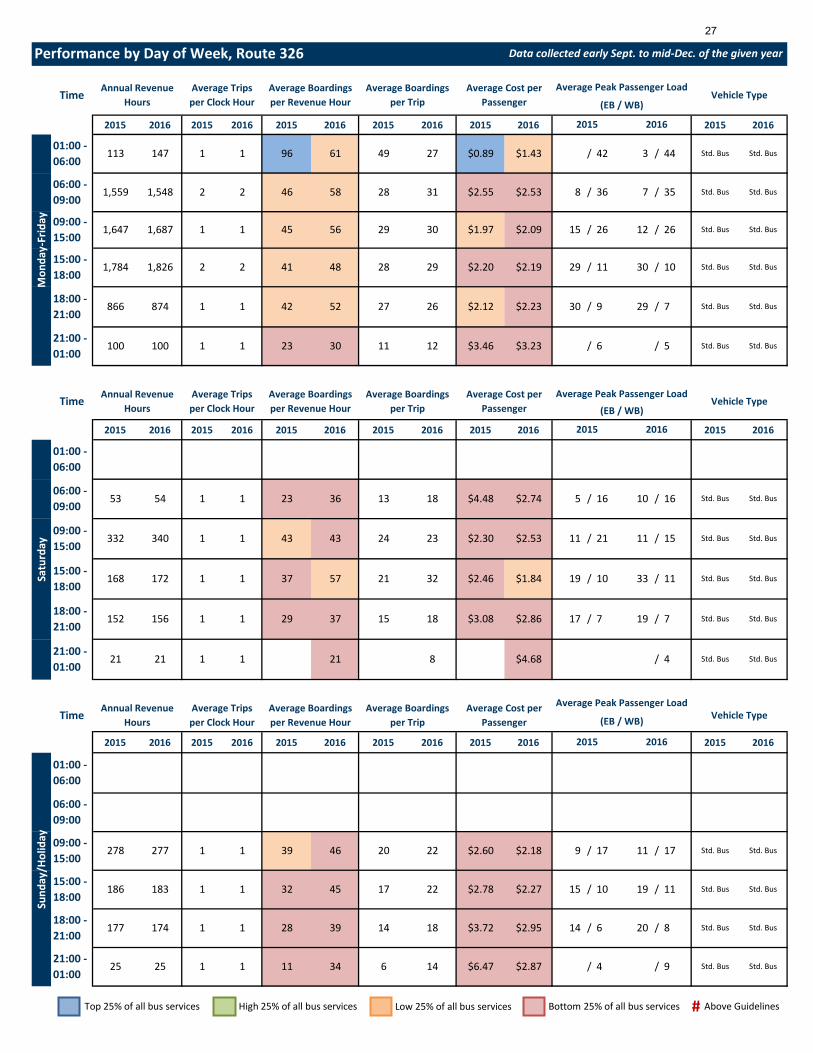
25 25 1 1 11 34 6 14 $6.47 $2.87 / 4 / 9 Std. Bus
1 1 39 46 20 22 $2.60 $2.18 9 / 17 11 / 17 Std. Bus Std. Bus
18:00 - 21:00
177 174 1 1 28 39 14 18 $3.72 $2.95 14 / 6 20 /
1 32 45 17 22 $2.78 $2.27
TimeAnnual Revenue
HoursAverage Trips per Clock Hour
Average Boardings per Revenue Hour
Average Boardings per Trip
Average Cost per Passenger
Average Peak Passenger LoadVehicle Type(EB / WB)
2015 2016
Sund
ay/H
olid
ay
01:00 - 06:00
15:00 - 18:00
186 183 1
06:00 - 09:00
15 /
09:00 - 15:00
278 277
18:00 - 21:00
152 156 1 1 29 37 15 18 $3.08 $2.86 17 / 7 19 / 7 Std. Bus Std. Bus
21:00 - 01:00
21 21 1 1 21 8 $4.68 / 4 Std. Bus Std. Bus
06:00 - 09:00
53 54 1 1 23 36 13 18 $4.48 $2.74 5 / 16 10 / 16 Std. Bus Std. Bus
09:00 - 15:00
332 340 1 1 43 43 24 23 $2.30 $2.53 11 / 21 11 / 15 Std. Bus Std. Bus
15:00 - 18:00
168 172 1 1 37 57 21 / 10 33 / 11 Std. Bus Std. Bus
Time Annual Revenue Hours
Average Trips per Clock Hour
Average Boardings per Revenue Hour
Average Boardings per Trip
Average Cost per Passenger
Average Peak Passenger LoadVehicle Type
(EB / WB)
$3.46 $3.23 / 6 / 5 Std. Bus21:00 - 01:00
2015 2016
Satu
rday
01:00 - 06:00
32 $2.46 $1.84 19
18:00 - 21:00
866 874 1 1 42 52 27 26
100 100 1 1 23 30 11 12
$2.12 $2.23 30 / 9 29 / 7 Std. Bus Std. Bus
Std. Bus
06:00 - 09:00
09:00 - 15:00
1,647 1,687 1 1 45 56 29 30 $1.97 $2.09 15 / 26 12 / 26 Std. Bus Std. Bus
15:00 - 18:00
1,784 1,826 2 2 41 48 28 29 $2.20 $2.19 29 / 11 30 / 10 Std. Bus Std. Bus
1,559 1,548 2 2 46 58 28 31
Performance by Day of Week, Route 326 Data collected early Sept. to mid-Dec. of the given year
TimeAnnual Revenue
HoursAverage Trips per Clock Hour
Average Boardings per Revenue Hour
Average Boardings per Trip
Average Cost per Passenger
Average Peak Passenger LoadVehicle Type
(EB / WB)
2015 2016
Mon
day-
Frid
ay
01:00 - 06:00
113 147 1 1 96 61 Std. Bus Std. Bus
$2.55 $2.53 8 / 36 7 / 35 Std. Bus Std. Bus
49 27 $0.89 $1.43 / 42 3 / 44
Top 25% of all bus services High 25% of all bus services Low 25% of all bus services Bottom 25% of all bus services Above Guidelines#
27

Key CharacteristicsSub-region of Primary Service:
Predominant Vehicle Type: Bus Depot:
Contributes to FTN: NoAverage One-Way Trip Distance (km):
Cost & Performance2012 2013 2014 2015 2016 Rank (2016)
Annual APC Boardings: 114,000 104,000 109,000 115,000 131,000 149 of 214 Average Daily APC Boardings (Mon-Fri): 400 350 400 400 450 148 of 213
Average Daily APC Boardings (Sat): 300 300 250 300 300 129 of 174 Average Daily APC Boardings (Sun/Hol):
Annual Service Cost: $226,000 $228,000 $228,000 $233,000 $237,000 175 of 216 Annual Revenue Hours: 2,300 2,400 2,400 2,400 2,400 186 of 216
Cost per APC Boarded Passenger: $1.99 $2.20 $2.16 $2.03 $1.81 96 of 214 Average APC Boardings per Rev. Hour: 49 44 46 48 54 87 of 214
Average Peak Passenger Load: 15 14 15 15 16 118 of 210Average Peak Load Factor: 30% 28% 29% 30% 32% 135 of 210
Revenue Hours with Overcrowding: 0% 0% 0% 0% 0% 1 of 209 Average Speed (km/h): 23.6 23.9 23.0 22.7 134 of 206
Service Changes Since December 2010- No service change between December 2010 and September 2015
South of FraserStd. BusSurrey
Route 329
9.2
Ride
rshi
pU
tiliz
atio
nCo
st28

2015 2016 2015 2016 2015 2016 2015 2016 2015 2016 2015 2016
2015 2016 2015 2016 2015 2016 2015 2016 2015 2016 2015 2016
2015 2016 2015 2016 2015 2016 2015 2016 2015 2016 2015 2016
(NB / SB)
2015 2016
Mon
day-
Frid
ay
01:00 - 06:00
Performance by Day of Week, Route 329 Data collected early Sept. to mid-Dec. of the given year
TimeAnnual Revenue
HoursAverage Trips per Clock Hour
Average Boardings per Revenue Hour
Average Boardings per Trip
Average Cost per Passenger
Average Peak Passenger LoadVehicle Type
Std. Bus
09:00 - 15:00
1,466 1,481 1 1 44 60 28 29 $1.81 $1.68 20 / 15 21 / 14 Std. Bus Std. Bus
06:00 - 09:00
96 96 2 2 20 47 6 9 $3.03 $2.08 / 5 / 5 Std. Bus
21:00 - 01:00
Std. Bus
18:00 - 21:00
$1.89 $1.70 10 / 27 10 / 33 Std. Bus15:00 - 18:00
409 420 1 1 46 62 18 21
19
06:00 - 09:00
(NB / SB)
2015 2016
Satu
rday
01:00 - 06:00
Time Annual Revenue Hours
Average Trips per Clock Hour
Average Boardings per Revenue Hour
Average Boardings per Trip
Average Cost per Passenger
Average Peak Passenger LoadVehicle Type
18:00 - 21:00
21:00 - 01:00
Std. Bus
15:00 - 18:00
147 149 1 1 40 19 $3.39 7 / 12 8 / 15 Std. Bus Std. Bus
$2.54 13 / 8 12 / 10 Std. Bus09:00 - 15:00
288 298 1 1 39
2015 2016
Sund
ay/H
olid
ay
01:00 - 06:00
15:00 - 18:00
TimeAnnual Revenue
HoursAverage Trips per Clock Hour
Average Boardings per Revenue Hour
Average Boardings per Trip
Average Cost per Passenger
Average Peak Passenger LoadVehicle Type(NB / SB)
09:00 - 15:00
06:00 - 09:00
21:00 - 01:00
18:00 - 21:00
Top 25% of all bus services High 25% of all bus services Low 25% of all bus services Bottom 25% of all bus services Above Guidelines#
29

Key CharacteristicsSub-region of Primary Service:
Predominant Vehicle Type: Bus Depot:
Contributes to FTN: NoAverage One-Way Trip Distance (km):
Cost & Performance2012 2013 2014 2015 2016 Rank (2016)
Annual APC Boardings: 948,000 1,229,000 1,863,000 2,000,000 2,184,000 38 of 214 Average Daily APC Boardings (Mon-Fri): 3,250 4,150 6,200 6,600 7,250 36 of 213
Average Daily APC Boardings (Sat): 1,400 2,000 3,150 3,350 3,450 46 of 174 Average Daily APC Boardings (Sun/Hol): 950 1,450 2,400 2,750 2,900 45 of 171
Annual Service Cost: $1,451,000 $2,389,000 $2,391,000 $2,446,000 $2,471,000 48 of 216 Annual Revenue Hours: 15,000 24,600 24,600 25,200 25,500 49 of 216
Cost per APC Boarded Passenger: $1.53 $1.94 $1.32 $1.22 $1.13 28 of 214 Average APC Boardings per Rev. Hour: 63 50 76 79 86 25 of 214
Average Peak Passenger Load: 27 26 26 27 30 33 of 210Average Peak Load Factor: 55% 52% 53% 54% 60% 31 of 210
Revenue Hours with Overcrowding: 5% 5% 4% 1% 2% 167 of 209 Average Speed (km/h): 24.0 24.6 24.5 23.0 129 of 206
Service Changes Since December 2010- Spring 2011, Increase freq from 30 to 20m during AM & PM peak (M-F); midday from 60 to 30m (M-F, Sat)- Fall 2013, Amalgamate service with route 332 and extended to Newton Exchange- Winter 2013, Add 2 early AM trips from Guilford to Surrey Central (M-F), add 2 late PM trips from Central Surrey to Guilford (M-F, Sat)- Winter 2013, Extend 21hr trip from Guilford to Newton Exchange & add reverse trip at 21hr (M-F, Sat)- Summer 2015, Add two trips departing Surrey Central on the PM peak shoulder (M-F)- Summer 2015, Extend the 2140hr trip from Guildford to Newton Exchange (M-F)
Std. BusSurrey
Route 335
South of Fraser
11.2
From 2013 onward, 335 service includes boardings from 332 service
Ride
rshi
pU
tiliz
atio
nCo
st30

2015 2016 2015 2016 2015 2016 2015 2016 2015 2016 2015 2016
2015 2016 2015 2016 2015 2016 2015 2016 2015 2016 2015 2016
2015 2016 2015 2016 2015 2016 2015 2016 2015 2016 2015 2016
2015 2016
Mon
day-
Frid
ay
01:00 - 06:00
879 888 2 2 46 70 31 31 $2.03 $2.19 13 / 33 16 / 35
15:00 - 18:00
4,987
Performance by Day of Week, Route 335 Data collected early Sept. to mid-Dec. of the given year
TimeAnnual Revenue
HoursAverage Trips per Clock Hour
Average Boardings per Revenue Hour
Average Boardings per Trip
Average Cost per Passenger
Average Peak Passenger LoadVehicle Type
(EB / WB)
09:00 - 15:00
6,587 6,644 4 4 76 94 50 49 $1.03 $1.03 25 / 27 27 / 25 Std. Bus Std. Bus
Std. Bus Std. Bus
06:00 - 09:00
4,346 4,344 6 6 73 89 48 49 $1.19 $1.20 20 / 34 28 / 36 Std. Bus Std. Bus
18:00 - 21:00
2,725 2,750 3 3 61 77 46 50 $1.50 $1.30 42 / 17 42 / 25 Std. Bus Std. Bus
39 / 21 40 / 33 Std. Bus Std. Bus5,102 6 6 84 97 50 55 $1.12 $1.01
Std. Bus
Time Annual Revenue Hours
Average Trips per Clock Hour
Average Boardings per Revenue Hour
Average Boardings per Trip
Average Cost per Passenger
Average Peak Passenger LoadVehicle Type
(EB / WB)
$3.48 $2.65 20 / 6 24 / 8 Std. Bus21:00 - 01:00
1,271 1,318 2 2 38 56 18 22
Std. Bus Std. Bus
06:00 - 09:00
272 275 2 2 55 61 33 26 $1.48 $1.76 15 / 22 13 / 13 Std. Bus Std. Bus
2015 2016
Satu
rday
01:00 - 06:00
13 13 1 1
72 $0.99 $1.05 49
18:00 - 21:00
211 213 2 2 74 81 39
/ 32 42 / 23 Std. Bus Std. Bus15:00 - 18:00
494 499 2 2 85 93 78
09:00 - 15:00
963 977 2 2 77 93 71 71 $1.09 $1.07 24 / 35 27 / 33 Std. Bus Std. Bus
Std. Bus Std. Bus
21:00 - 01:00
216 220 2 2 10 / 14 20 / 12 Std. Bus Std. Bus
32 $1.17 $1.48 35 / 16 30 / 13
2015 2016
Sund
ay/H
olid
ay
01:00 - 06:00
15:00 - 18:00
561 553 2
TimeAnnual Revenue
HoursAverage Trips per Clock Hour
Average Boardings per Revenue Hour
Average Boardings per Trip
Average Cost per Passenger
Average Peak Passenger LoadVehicle Type(EB / WB)
09:00 - 15:00
1,120 1,112 2 2 70 85 57 64 $1.29 $1.17 23 / 29 24 / 30 Std. Bus Std. Bus
06:00 - 09:00
184 181 2 2 57 60 46 43 $1.54 $1.67 22 / 18 17 / 29 Std. Bus Std. Bus
12 Std. Bus Std. Bus
21:00 - 01:00
167 164 2 2 41 39 11 9 $3.61 $2.61 16 / 5 7 / 7 Std. Bus Std. Bus
26 36 / 24 Std. Bus Std. Bus
18:00 - 21:00
225 221 2 2 75 88 31 31 $1.70 $1.29 33 / 9 28 /
2 79 85 64 64 $1.16 $1.16 39 /
Top 25% of all bus services High 25% of all bus services Low 25% of all bus services Bottom 25% of all bus services Above Guidelines#
31
Key CharacteristicsSub-region of Primary Service:
Predominant Vehicle Type: Bus Depot:
Contributes to FTN: NoAverage One-Way Trip Distance (km):
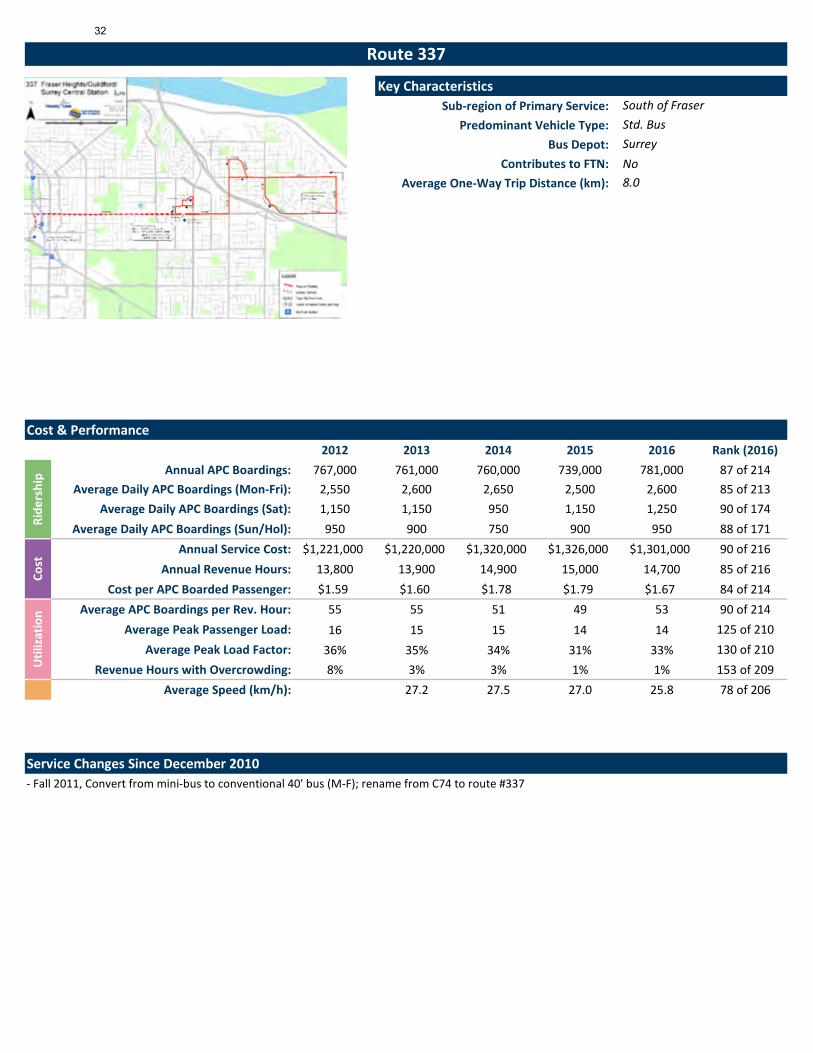
Cost & Performance2012 2013 2014 2015 2016 Rank (2016)
Annual APC Boardings: 767,000 761,000 760,000 739,000 781,000 87 of 214 Average Daily APC Boardings (Mon-Fri): 2,550 2,600 2,650 2,500 2,600 85 of 213
Average Daily APC Boardings (Sat): 1,150 1,150 950 1,150 1,250 90 of 174 Average Daily APC Boardings (Sun/Hol): 950 900 750 900 950 88 of 171
Annual Service Cost: $1,221,000 $1,220,000 $1,320,000 $1,326,000 $1,301,000 90 of 216 Annual Revenue Hours: 13,800 13,900 14,900 15,000 14,700 85 of 216
Cost per APC Boarded Passenger: $1.59 $1.60 $1.78 $1.79 $1.67 84 of 214 Average APC Boardings per Rev. Hour: 55 55 51 49 53 90 of 214
Average Peak Passenger Load: 16 15 15 14 14 125 of 210Average Peak Load Factor: 36% 35% 34% 31% 33% 130 of 210
Revenue Hours with Overcrowding: 8% 3% 3% 1% 1% 153 of 209 Average Speed (km/h): 27.2 27.5 27.0 25.8 78 of 206
Service Changes Since December 2010- Fall 2011, Convert from mini-bus to conventional 40' bus (M-F); rename from C74 to route #337
Std. BusSurrey
Route 337
South of Fraser
8.0
Ride
rshi
pU
tiliz
atio
nCo
st32

2015 2016 2015 2016 2015 2016 2015 2016 2015 2016 2015 2016
2015 2016 2015 2016 2015 2016 2015 2016 2015 2016 2015 2016
2015 2016 2015 2016 2015 2016 2015 2016 2015 2016 2015 2016
2015 2016
Mon
day-
Frid
ay
01:00 - 06:00
417 418 4 4 32 51 13 16 $7.23 $4.10 1 / 22 2 / 24
15:00 - 18:00
2,479
Performance by Day of Week, Route 337 Data collected early Sept. to mid-Dec. of the given year
TimeAnnual Revenue
HoursAverage Trips per Clock Hour
Average Boardings per Revenue Hour
Average Boardings per Trip
Average Cost per Passenger
Average Peak Passenger LoadVehicle Type
(EB / WB)
09:00 - 15:00
3,818 3,883 4 4 42 57 17 19 $2.13 $1.86 9 / 17 10 / 17 Std. Bus Std. Bus
Std. Bus Std. Bus
06:00 - 09:00
2,134 2,141 4 4 59 83 27 31 $2.53 $1.96 7 / 36 9 / 38 Std. Bus Std. Bus
18:00 - 21:00
1,558 1,565 3 3 48 56 17 20 $3.04 $2.72 23 / 3 26 / 2 Std. Bus Std. Bus
28 / 11 25 / 11 Std. Bus Std. Bus2,550 4 4 71 66 30 28 $1.48 $1.56
Std. Bus
Time Annual Revenue Hours
Average Trips per Clock Hour
Average Boardings per Revenue Hour
Average Boardings per Trip
Average Cost per Passenger
Average Peak Passenger LoadVehicle Type
(EB / WB)
$3.76 $2.38 12 / 5 13 / 5 Std. Bus21:00 - 01:00
741 347 2 2 30 36 11 12
06:00 - 09:00
217 213 2 2 21 28 11 9 $3.28 $5.53 4 / 15 3 / 12 Mini-Bus Mini-Bus
2015 2016
Satu
rday
01:00 - 06:00
11 $1.66 $1.84 13
18:00 - 21:00
374 377 4 4 19 30 7
/ 6 16 / 5 Mini-Bus Mini-Bus15:00 - 18:00
387 391 4 4 35 38 13
09:00 - 15:00
750 760 4 4 26 35 11 11 $2.28 $2.07 5 / 11 6 / 11 Mini-Bus Mini-Bus
Mini-Bus Mini-Bus
21:00 - 01:00
171 171 2 2 18 19 7 6 $3.38 $3.87 9 / 4 6 / 3 Mini-Bus Mini-Bus
9 $3.19 $2.76 8 / 2 16 / 1
2015 2016
Sund
ay/H
olid
ay
01:00 - 06:00
15:00 - 18:00
435 431 4
TimeAnnual Revenue
HoursAverage Trips per Clock Hour
Average Boardings per Revenue Hour
Average Boardings per Trip
Average Cost per Passenger
Average Peak Passenger LoadVehicle Type(EB / WB)
09:00 - 15:00
813 802 4 4 21 35 9 10 $2.19 $2.38 6 / 9 5 / 10 Mini-Bus Mini-Bus
06:00 - 09:00
255 246 2 2 12 21 6 6 $2.93 $3.11 2 / 9 2 / 9 Mini-Bus Mini-Bus
2 Mini-Bus Mini-Bus
21:00 - 01:00
14 13 1 1 14 12 3 3 $4.62 $5.55 / 1 / 2 Mini-Bus Mini-Bus
5 15 / 3 Mini-Bus Mini-Bus
18:00 - 21:00
411 403 4 4 18 30 6 8 $3.11 $2.72 7 / 2 13 /
4 25 36 9 10 $2.04 $1.98 9 /
Top 25% of all bus services High 25% of all bus services Low 25% of all bus services Bottom 25% of all bus services Above Guidelines#
33

Key CharacteristicsSub-region of Primary Service:
Predominant Vehicle Type: Bus Depot:
Contributes to FTN: NoAverage One-Way Trip Distance (km):
Cost & Performance2012 2013 2014 2015 2016 Rank (2016)
Annual APC Boardings: 931,000 977,000 918,000 880,000 972,000 70 of 214 Average Daily APC Boardings (Mon-Fri): 2,850 3,050 2,900 2,750 3,100 72 of 213
Average Daily APC Boardings (Sat): 2,050 2,050 1,850 1,750 1,950 72 of 174 Average Daily APC Boardings (Sun/Hol): 1,650 1,750 1,550 1,500 1,450 73 of 171
Annual Service Cost: $1,662,000 $1,653,000 $1,477,000 $1,441,000 $1,457,000 79 of 216 Annual Revenue Hours: 17,100 17,000 15,200 14,900 15,000 82 of 216
Cost per APC Boarded Passenger: $1.78 $1.69 $1.66 $1.64 $1.50 74 of 214 Average APC Boardings per Rev. Hour: 54 57 60 59 65 67 of 214
Average Peak Passenger Load: 21 22 25 24 24 75 of 210Average Peak Load Factor: 42% 45% 50% 48% 47% 74 of 210
Revenue Hours with Overcrowding: 4% 0% 2% 0% 1% 158 of 209 Average Speed (km/h): 39.7 41.0 39.9 37.7 16 of 206
Service Changes Since December 2010- Winter 2010, Reduce freq from 15 to 20m during midday (M-F); reduce freq from 30 to 20m from 7-11hr (Sat, S/H)- Spring 2012, Convert vehicle from conventional 40' bus to Orion Hwy Coach- Winter 2012, Discontinue the use of Hwy Coaches during Monday to Friday service- Spring 2014, Reduce freq from 20 to 30m from 9-15hr (M-F); 11-19hr (Sat, S/H)- Spring 2016, Add one bus from 6-19hr for Pattullo Bridge Rehabilitation (M-F)- Fall 2016, End of Pattullo Bridge Rehabilitation; return to regular service levels (remove one bus from 6-19hr)
Std. BusSurrey
Route 340
South of Fraser
14.4
Ride
rshi
pU
tiliz
atio
nCo
st34

2015 2016 2015 2016 2015 2016 2015 2016 2015 2016 2015 2016
2015 2016 2015 2016 2015 2016 2015 2016 2015 2016 2015 2016
2015 2016 2015 2016 2015 2016 2015 2016 2015 2016 2015 2016
2015 2016
Mon
day-
Frid
ay
01:00 - 06:00
383 385 2 2 29 73 18 28 $2.54 $1.49 8 / 22 14 / 30
15:00 - 18:00
2,958
Performance by Day of Week, Route 340 Data collected early Sept. to mid-Dec. of the given year
TimeAnnual Revenue
HoursAverage Trips per Clock Hour
Average Boardings per Revenue Hour
Average Boardings per Trip
Average Cost per Passenger
Average Peak Passenger LoadVehicle Type
(EB / WB)
09:00 - 15:00
2,737 2,713 2 2 60 79 30 34 $1.54 $1.39 20 / 29 20 / 32 Std. Bus Std. Bus
Std. Bus Std. Bus
06:00 - 09:00
2,892 2,904 4 4 47 61 30 32 $1.82 $1.67 19 / 35 20 / 36 Std. Bus Std. Bus
18:00 - 21:00
1,650 1,640 3 3 49 60 24 25 $2.32 $1.99 33 / 9 34 / 9 Std. Bus Std. Bus
38 / 18 39 / 20 Std. Bus Std. Bus3,140 4 4 53 68 35 37 $1.76 $1.68
Std. Bus
Time Annual Revenue Hours
Average Trips per Clock Hour
Average Boardings per Revenue Hour
Average Boardings per Trip
Average Cost per Passenger
Average Peak Passenger LoadVehicle Type
(EB / WB)
$2.42 $2.44 23 / 9 27 / 9 Std. Bus21:00 - 01:00
1,016 1,020 2 2 41 54 19 21
Std. Bus Std. Bus
06:00 - 09:00
249 255 2 2 45 72 22 29 $2.33 $1.66 11 / 29 13 / 36 Std. Bus Std. Bus
2015 2016
Satu
rday
01:00 - 06:00
21 21 1 1 96 107 48 43 $0.81 $0.91 / 43 / 37
37 $1.54 $1.21 31
18:00 - 21:00
208 212 2 2 45 93 22
/ 19 36 / 21 Std. Bus Std. Bus15:00 - 18:00
270 276 2 2 55 85 30
09:00 - 15:00
488 499 2 2 45 70 23 30 $1.94 $1.50 13 / 24 18 / 28 Std. Bus Std. Bus
Std. Bus Std. Bus
21:00 - 01:00
221 225 2 2 17 / 13 20 / 16 Std. Bus Std. Bus
36 $1.83 $1.32 28 / 15 46 / 15
2015 2016
Sund
ay/H
olid
ay
01:00 - 06:00
25 25 1 1 37 18 $2.15 / 17
15:00 - 18:00
317 313 2
TimeAnnual Revenue
HoursAverage Trips per Clock Hour
Average Boardings per Revenue Hour
Average Boardings per Trip
Average Cost per Passenger
Average Peak Passenger LoadVehicle Type(EB / WB)
09:00 - 15:00
600 589 2 2 51 26 $1.70 15 / 26 Std. Bus Std. Bus
Std. Bus Std. Bus
06:00 - 09:00
305 299 2 2 38 19 $2.19 12 / 19 Std. Bus Std. Bus
Std. Bus Std. Bus
21:00 - 01:00
267 263 2 2 25 12 $3.93 13 / 7 Std. Bus Std. Bus
18 Std. Bus Std. Bus
18:00 - 21:00
250 245 2 2 47 22 $1.84 25 / 15
2 60 31 $1.46 28 /
Top 25% of all bus services High 25% of all bus services Low 25% of all bus services Bottom 25% of all bus services Above Guidelines#
35

Key CharacteristicsSub-region of Primary Service:
Predominant Vehicle Type: Bus Depot:
Contributes to FTN: NoAverage One-Way Trip Distance (km):
Cost & Performance2012 2013 2014 2015 2016 Rank (2016)
Annual APC Boardings: 1,523,000 1,445,000 1,417,000 1,511,000 1,337,000 54 of 214 Average Daily APC Boardings (Mon-Fri): 4,800 4,550 4,500 4,750 4,200 54 of 213
Average Daily APC Boardings (Sat): 2,850 2,850 2,750 3,050 2,600 53 of 174 Average Daily APC Boardings (Sun/Hol): 2,650 2,500 2,450 2,600 2,400 51 of 171
Annual Service Cost: $2,592,000 $2,663,000 $2,741,000 $2,826,000 $2,233,000 53 of 216 Annual Revenue Hours: 26,700 27,500 28,300 29,100 23,000 55 of 216
Cost per APC Boarded Passenger: $1.70 $1.84 $1.99 $1.87 $1.67 85 of 214 Average APC Boardings per Rev. Hour: 57 53 50 52 58 77 of 214
Average Peak Passenger Load: 29 25 25 26 21 96 of 210Average Peak Load Factor: 58% 50% 51% 52% 42% 97 of 210
Revenue Hours with Overcrowding: 0% 0% 0% 0% 0% 1 of 209 Average Speed (km/h): 28.0 28.3 28.2 26.1 72 of 206
Service Changes Since December 2010- Fall 2011, Increase freq from 30 to 20 min during AM & PM peak (M-F)- Fall 2016, Split #341 at Newton Exchange into two separate routes; #341 operates btw Guildford and Newton Exchange
Std. BusSurrey
Route 341
South of Fraser
8.0
Ridership totals after 2015 must be complemented with route 342 due to route split
Ride
rshi
pU
tiliz
atio
nCo
st36

2015 2016 2015 2016 2015 2016 2015 2016 2015 2016 2015 2016
2015 2016 2015 2016 2015 2016 2015 2016 2015 2016 2015 2016
2015 2016 2015 2016 2015 2016 2015 2016 2015 2016 2015 2016
2015 2016
Mon
day-
Frid
ay
01:00 - 06:00
1,200 919 2 2 47 88 50 28 $1.84 $3.64 33 / 25 20 / 26
15:00 - 18:00
5,038
Performance by Day of Week, Route 341 Data collected early Sept. to mid-Dec. of the given year
TimeAnnual Revenue
HoursAverage Trips per Clock Hour
Average Boardings per Revenue Hour
Average Boardings per Trip
Average Cost per Passenger
Average Peak Passenger LoadVehicle Type
(NB / SB)
09:00 - 15:00
7,725 6,056 3 2 59 77 77 32 $1.54 $3.21 31 / 29 17 / 27 Std. Bus Std. Bus
Std. Bus Std. Bus
06:00 - 09:00
4,901 3,846 3 3 51 71 62 28 $1.82 $3.49 28 / 26 13 / 28 Std. Bus Std. Bus
18:00 - 21:00
3,117 2,524 2 2 41 71 47 28 $2.22 $2.96 20 / 22 27 / 14 Std. Bus Std. Bus
30 / 33 31 / 19 Std. Bus Std. Bus3,995 3 3 56 88 78 38 $1.60 $2.60
Std. Bus
Time Annual Revenue Hours
Average Trips per Clock Hour
Average Boardings per Revenue Hour
Average Boardings per Trip
Average Cost per Passenger
Average Peak Passenger LoadVehicle Type
(NB / SB)
$2.13 $1.26 26 / 22 / 8 Std. Bus21:00 - 01:00
246 247 1 2 46 58 45 19
06:00 - 09:00
391 269 2 2 31 66 37 22 $2.62 $3.83 15 / 21 12 / 20 Std. Bus Std. Bus
2015 2016
Satu
rday
01:00 - 06:00
29 $1.67 $3.00 26
18:00 - 21:00
645 521 2 2 41 60 45
/ 22 22 / 15 Std. Bus Std. Bus15:00 - 18:00
685 558 2 2 53 74 65
09:00 - 15:00
1,369 1,114 2 2 49 70 61 28 $1.84 $3.18 22 / 22 17 / 20 Std. Bus Std. Bus
Std. Bus Std. Bus
21:00 - 01:00
55 51 1 2 28 11 $4.28 10 / Std. Bus Std. Bus
21 $2.27 $3.80 16 / 24 19 / 13
2015 2016
Sund
ay/H
olid
ay
01:00 - 06:00
15:00 - 18:00
810 634 2
TimeAnnual Revenue
HoursAverage Trips per Clock Hour
Average Boardings per Revenue Hour
Average Boardings per Trip
Average Cost per Passenger
Average Peak Passenger LoadVehicle Type(NB / SB)
09:00 - 15:00
1,688 1,315 2 2 44 71 52 27 $2.04 $3.18 22 / 21 16 / 21 Std. Bus Std. Bus
06:00 - 09:00
452 338 2 2 26 56 29 16 $3.13 $5.73 18 / 12 9 / 16 Std. Bus Std. Bus
11 Std. Bus Std. Bus
21:00 - 01:00
122 100 1 2 32 54 30 17 $3.13 $3.57 15 / 13 16 / 7 Std. Bus Std. Bus
20 20 / 17 Std. Bus Std. Bus
18:00 - 21:00
688 535 2 2 34 63 38 23 $2.71 $3.76 16 / 22 22 /
2 44 77 51 30 $2.05 $2.81 21 /
Top 25% of all bus services High 25% of all bus services Low 25% of all bus services Bottom 25% of all bus services Above Guidelines#
37

Key CharacteristicsSub-region of Primary Service:
Predominant Vehicle Type: Bus Depot:
Contributes to FTN: NoAverage One-Way Trip Distance (km):
Cost & Performance2012 2013 2014 2015 2016 Rank (2016)
Annual APC Boardings: 834,000 80 of 214 Average Daily APC Boardings (Mon-Fri): 2,700 80 of 213
Average Daily APC Boardings (Sat): 1,350 85 of 174 Average Daily APC Boardings (Sun/Hol): 1,400 77 of 171
Annual Service Cost: $1,932,000 57 of 216 Annual Revenue Hours: 19,900 59 of 216
Cost per APC Boarded Passenger: $2.32 128 of 214 Average APC Boardings per Rev. Hour: 42 121 of 214
Average Peak Passenger Load: 23 77 of 210Average Peak Load Factor: 46% 76 of 210
Revenue Hours with Overcrowding: 0% 1 of 209 Average Speed (km/h): 30.1
Service Changes Since December 2010- Fall 2016, Service introduction; new service to replace southern half of #341 btw Newton Exchange and Langley Ctr
Std. BusSurrey
Route 342
South of Fraser
17.7
2016 annual ridership is an estimate based on Sept-Dec 2016
Ride
rshi
pU
tiliz
atio
nCo
st38

2015 2016 2015 2016 2015 2016 2015 2016 2015 2016 2015 2016
2015 2016 2015 2016 2015 2016 2015 2016 2015 2016 2015 2016
2015 2016 2015 2016 2015 2016 2015 2016 2015 2016 2015 2016
2015 2016
Mon
day-
Frid
ay
01:00 - 06:00
649 2 50 29 $2.31 13 / 31
15:00 - 18:00
Performance by Day of Week, Route 342 Data collected early Sept. to mid-Dec. of the given year
TimeAnnual Revenue
HoursAverage Trips per Clock Hour
Average Boardings per Revenue Hour
Average Boardings per Trip
Average Cost per Passenger
Average Peak Passenger LoadVehicle Type
(EB / WB)
09:00 - 15:00
5,275 2 52 39 $2.17 24 / 30 Std. Bus
Std. Bus
06:00 - 09:00
3,327 3 51 36 $2.24 19 / 28 Std. Bus
18:00 - 21:00
2,123 2 41 26 $3.15 29 / 10 Std. Bus
35 / 23 Std. Bus3,506 3 55 43 $2.08
Std. Bus
Time Annual Revenue Hours
Average Trips per Clock Hour
Average Boardings per Revenue Hour
Average Boardings per Trip
Average Cost per Passenger
Average Peak Passenger LoadVehicle Type
(EB / WB)
$3.63 20 / 821:00 - 01:00
334 1 33 19
06:00 - 09:00
252 2 40 24 $2.76 15 / 19 Std. Bus
2015 2016
Satu
rday
01:00 - 06:00
27 $2.82
18:00 - 21:00
459 2 34
21 / 17 Std. Bus15:00 - 18:00
484 2 40
09:00 - 15:00
938 2 36 23 $3.15 15 / 19 Std. Bus
Std. Bus
21:00 - 01:00
74 1 27 17 $4.04 12 / 12 Std. Bus
21 $3.47 19 / 11
2015 2016
Sund
ay/H
olid
ay
01:00 - 06:00
15:00 - 18:00
524
TimeAnnual Revenue
HoursAverage Trips per Clock Hour
Average Boardings per Revenue Hour
Average Boardings per Trip
Average Cost per Passenger
Average Peak Passenger LoadVehicle Type(EB / WB)
09:00 - 15:00
1,062 2 37 24 $3.11 14 / 21 Std. Bus
06:00 - 09:00
322 2 29 16 $3.94 8 / 14 Std. Bus
13 Std. Bus
21:00 - 01:00
83 1 38 23 $2.92 23 / 12 Std. Bus
22 / 18 Std. Bus
18:00 - 21:00
498 2 41 25 $2.76 26 /
2 46 29 $2.41
Top 25% of all bus services High 25% of all bus services Low 25% of all bus services Bottom 25% of all bus services Above Guidelines#
39
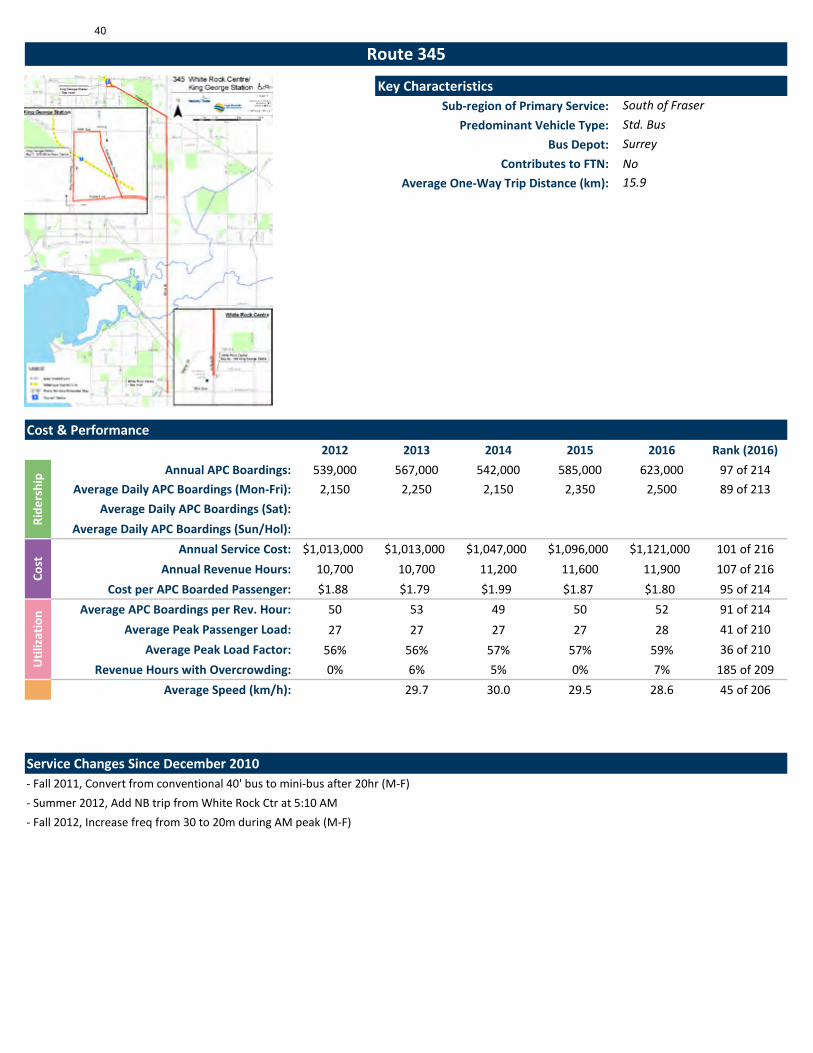
Key CharacteristicsSub-region of Primary Service:
Predominant Vehicle Type: Bus Depot:
Contributes to FTN: NoAverage One-Way Trip Distance (km):
Cost & Performance2012 2013 2014 2015 2016 Rank (2016)
Annual APC Boardings: 539,000 567,000 542,000 585,000 623,000 97 of 214 Average Daily APC Boardings (Mon-Fri): 2,150 2,250 2,150 2,350 2,500 89 of 213
Average Daily APC Boardings (Sat): Average Daily APC Boardings (Sun/Hol):
Annual Service Cost: $1,013,000 $1,013,000 $1,047,000 $1,096,000 $1,121,000 101 of 216 Annual Revenue Hours: 10,700 10,700 11,200 11,600 11,900 107 of 216
Cost per APC Boarded Passenger: $1.88 $1.79 $1.99 $1.87 $1.80 95 of 214 Average APC Boardings per Rev. Hour: 50 53 49 50 52 91 of 214
Average Peak Passenger Load: 27 27 27 27 28 41 of 210Average Peak Load Factor: 56% 56% 57% 57% 59% 36 of 210
Revenue Hours with Overcrowding: 0% 6% 5% 0% 7% 185 of 209 Average Speed (km/h): 29.7 30.0 29.5 28.6 45 of 206
Service Changes Since December 2010- Fall 2011, Convert from conventional 40' bus to mini-bus after 20hr (M-F)- Summer 2012, Add NB trip from White Rock Ctr at 5:10 AM- Fall 2012, Increase freq from 30 to 20m during AM peak (M-F)
Std. BusSurrey
Route 345
South of Fraser
15.9
Ride
rshi
pU
tiliz
atio
nCo
st40

2015 2016 2015 2016 2015 2016 2015 2016 2015 2016 2015 2016
2015 2016 2015 2016 2015 2016 2015 2016 2015 2016 2015 2016
2015 2016 2015 2016 2015 2016 2015 2016 2015 2016 2015 2016
2015 2016
Mon
day-
Frid
ay
01:00 - 06:00
492 494 2 2 43 65 35 43 $1.88 $1.60 38 / 22 47 / 24
15:00 - 18:00
2,408
Performance by Day of Week, Route 345 Data collected early Sept. to mid-Dec. of the given year
TimeAnnual Revenue
HoursAverage Trips per Clock Hour
Average Boardings per Revenue Hour
Average Boardings per Trip
Average Cost per Passenger
Average Peak Passenger LoadVehicle Type
(NB / SB)
09:00 - 15:00
4,266 4,343 2 2 37 49 33 35 $2.29 $2.12 28 / 16 27 / 18 Std. Bus Std. Bus
Std. Bus Std. Bus
06:00 - 09:00
2,491 2,556 3 3 47 64 43 47 $1.75 $1.61 45 / 23 48 / 25 Std. Bus Std. Bus
18:00 - 21:00
1,950 1,999 2 2 32 41 23 26 $2.41 $2.19 13 / 22 11 / 27 Std. Bus & Mini-Bus
Mini-Bus & Std. Bus
29 / 40 27 / 39 Std. Bus Std. Bus2,493 2 2 53 61 48 50 $1.64 $1.63
Time Annual Revenue Hours
Average Trips per Clock Hour
Average Boardings per Revenue Hour
Average Boardings per Trip
Average Cost per Passenger
Average Peak Passenger LoadVehicle Type
(NB / SB)
21:00 - 01:00
06:00 - 09:00
2015 2016
Satu
rday
01:00 - 06:00
18:00 - 21:00
15:00 - 18:00
09:00 - 15:00
21:00 - 01:00
2015 2016
Sund
ay/H
olid
ay
01:00 - 06:00
15:00 - 18:00
TimeAnnual Revenue
HoursAverage Trips per Clock Hour
Average Boardings per Revenue Hour
Average Boardings per Trip
Average Cost per Passenger
Average Peak Passenger LoadVehicle Type(NB / SB)
09:00 - 15:00
06:00 - 09:00
21:00 - 01:00
18:00 - 21:00
Top 25% of all bus services High 25% of all bus services Low 25% of all bus services Bottom 25% of all bus services Above Guidelines#
41

Key CharacteristicsSub-region of Primary Service:
Predominant Vehicle Type: Bus Depot:
Contributes to FTN: YesAverage One-Way Trip Distance (km):
Cost & Performance2012 2013 2014 2015 2016 Rank (2016)
Annual APC Boardings: 1,474,000 1,463,000 1,476,000 1,544,000 1,627,000 47 of 214 Average Daily APC Boardings (Mon-Fri): 4,450 4,400 4,450 4,700 4,950 49 of 213
Average Daily APC Boardings (Sat): 3,250 3,550 3,400 3,400 3,500 43 of 174 Average Daily APC Boardings (Sun/Hol): 3,000 2,900 3,000 3,000 3,100 42 of 171
Annual Service Cost: $4,740,000 $4,869,000 $4,826,000 $4,860,000 $4,898,000 19 of 216 Annual Revenue Hours: 48,900 50,200 49,800 50,100 50,500 19 of 216
Cost per APC Boarded Passenger: $3.22 $3.33 $3.37 $3.15 $3.01 161 of 214 Average APC Boardings per Rev. Hour: 30 29 30 31 32 146 of 214
Average Peak Passenger Load: 21 22 22 24 25 65 of 210Average Peak Load Factor: 46% 46% 47% 51% 52% 55 of 210
Revenue Hours with Overcrowding: 2% 1% 4% 4% 10% 194 of 209 Average Speed (km/h): 48.2 48.9 48.4 47.3 6 of 206
Service Changes Since December 2010- Spring 2011, Increase freq: AM peak from 10 to 7/8m (M-F); PM peak from 15 to 12m (M-F); & late night from 60 to 30m (all days)- Fall 2011, Reduce early AM peak freq btwn Crescent Beach-White Rock Ctr before 6hr from 30 to 15m (M-F)- Summer 2012, Reduce service in Crescent Beach area- Spring 2015, Add one trip departing Bridgeport Station on PM peak shoulder (M-F)- Summer 2015, Terminate two AM peak trips at White Rock Ctr to reduce service in Crescent Beach area (M-F)
Hwy. CoachRichmond
Route 351
South of Fraser
35.7
Ride
rshi
pU
tiliz
atio
nCo
st42

2015 2016 2015 2016 2015 2016 2015 2016 2015 2016 2015 2016
2015 2016 2015 2016 2015 2016 2015 2016 2015 2016 2015 2016
2015 2016 2015 2016 2015 2016 2015 2016 2015 2016 2015 2016
2015 2016
Mon
day-
Frid
ay
01:00 - 06:00
1,834 1,863 2 2 19 28 22 21 $6.30 $6.22 30 / 4 32 / 6
15:00 - 18:00
7,137
Performance by Day of Week, Route 351 Data collected early Sept. to mid-Dec. of the given year
TimeAnnual Revenue
HoursAverage Trips per Clock Hour
Average Boardings per Revenue Hour
Average Boardings per Trip
Average Cost per Passenger
Average Peak Passenger LoadVehicle Type
(NB / SB)
09:00 - 15:00
11,439 11,515 4 4 27 32 31 31 $3.20 $3.44 24 / 19 23 / 19 Hwy. Coach Hwy. Coach
Hwy. Coach Hwy. Coach
06:00 - 09:00
7,625 7,677 6 5 31 38 36 37 $3.27 $3.45 43 / 13 49 / 10 Hwy. Coach Hwy. Coach
18:00 - 21:00
5,579 5,684 4 4 25 31 29 31 $4.32 $4.05 10 / 38 9 / 42 Hwy. Coach Hwy. Coach
21 / 45 18 / 47 Hwy. Coach Hwy. Coach7,159 5 5 36 39 46 45 $2.61 $2.85
Hwy. Coach
Time Annual Revenue Hours
Average Trips per Clock Hour
Average Boardings per Revenue Hour
Average Boardings per Trip
Average Cost per Passenger
Average Peak Passenger LoadVehicle Type
(NB / SB)
$5.85 $6.03 7 / 33 5 / 35 Hwy. Coach21:00 - 01:00
3,059 3,159 2 2 25 26 24 24
Hwy. Coach Hwy. Coach
06:00 - 09:00
942 961 4 4 17 24 18 19 $5.47 $5.22 23 / 7 21 / 6 Hwy. Coach Hwy. Coach
2015 2016
Satu
rday
01:00 - 06:00
251 255 1 1 20 26 19 18 $6.05 $4.55 18 / 14 27 / 15
32 $2.86 $3.05 18
18:00 - 21:00
999 1,018 4 4 25 25 25
/ 33 17 / 33 Hwy. Coach Hwy. Coach15:00 - 18:00
1,099 1,120 4 4 32 37 32
09:00 - 15:00
2,192 2,232 4 4 25 33 28 29 $3.39 $3.06 24 / 16 24 / 17 Hwy. Coach Hwy. Coach
Hwy. Coach Hwy. Coach
21:00 - 01:00
701 715 2 2 21 24 23 22 $4.46 $4.51 10 / 30 9 / 25 Hwy. Coach Hwy. Coach
21 $3.75 $4.75 12 / 26 8 / 24
2015 2016
Sund
ay/H
olid
ay
01:00 - 06:00
243 239 1 1 13 18 12 14 $7.66 $6.45 15 / 4 20 / 6
15:00 - 18:00
1,306 1,286 4
TimeAnnual Revenue
HoursAverage Trips per Clock Hour
Average Boardings per Revenue Hour
Average Boardings per Trip
Average Cost per Passenger
Average Peak Passenger LoadVehicle Type(NB / SB)
09:00 - 15:00
2,516 2,476 4 4 22 30 23 26 $4.14 $3.56 22 / 12 25 / 16 Hwy. Coach Hwy. Coach
Hwy. Coach Hwy. Coach
06:00 - 09:00
1,204 1,185 4 4 14 16 13 12 $6.67 $8.13 14 / 6 16 / 5 Hwy. Coach Hwy. Coach
22 Hwy. Coach Hwy. Coach
21:00 - 01:00
814 800 2 2 12 10 $8.09 7 / 20 8 / 8 Hwy. Coach Hwy. Coach
27 17 / 30 Hwy. Coach Hwy. Coach
18:00 - 21:00
1,171 1,152 4 4 24 23 24 19 $4.04 $4.60 11 / 22 10 /
4 27 36 27 31 $3.48 $3.10 13 /
Top 25% of all bus services High 25% of all bus services Low 25% of all bus services Bottom 25% of all bus services Above Guidelines#
43

Key CharacteristicsSub-region of Primary Service:
Predominant Vehicle Type: Bus Depot:
Contributes to FTN: NoAverage One-Way Trip Distance (km):
Cost & Performance2012 2013 2014 2015 2016 Rank (2016)
Annual APC Boardings: 135,000 124,000 117,000 113,000 138,000 148 of 214 Average Daily APC Boardings (Mon-Fri): 550 500 450 450 550 143 of 213
Average Daily APC Boardings (Sat): Average Daily APC Boardings (Sun/Hol):
Annual Service Cost: $373,000 $363,000 $345,000 $345,000 $344,000 150 of 216 Annual Revenue Hours: 3,800 3,700 3,600 3,600 3,500 168 of 216
Cost per APC Boarded Passenger: $2.75 $2.93 $3.05 $3.06 $2.50 137 of 214 Average APC Boardings per Rev. Hour: 35 33 33 32 39 127 of 214
Average Peak Passenger Load: 30 29 27 31 38 9 of 210Average Peak Load Factor: 64% 61% 57% 65% 82% 3 of 210
Revenue Hours with Overcrowding: 0% 0% 0% 0% 7% 183 of 209 Average Speed (km/h): 51.8 53.2 53.2 50.9 3 of 206
Service Changes Since December 2010- Spring 2011, Reduce AM peak from 10 to 12m 6-7hr (M-F)- Summer 2014, Adjust headways to consistent 15m freq from 6-7hr (M-F)
Hwy. CoachRichmond
Route 352
South of Fraser
20.4
Very low sampling in 2012
Ride
rshi
pU
tiliz
atio
nCo
st44

2015 2016 2015 2016 2015 2016 2015 2016 2015 2016 2015 2016
2015 2016 2015 2016 2015 2016 2015 2016 2015 2016 2015 2016
2015 2016 2015 2016 2015 2016 2015 2016 2015 2016 2015 2016
2015 2016
Mon
day-
Frid
ay
01:00 - 06:00
558 599 2 2 18 44 26 33 $2.99 $2.49 25 / 31 /
15:00 - 18:00
1,926
Performance by Day of Week, Route 352 Data collected early Sept. to mid-Dec. of the given year
TimeAnnual Revenue
HoursAverage Trips per Clock Hour
Average Boardings per Revenue Hour
Average Boardings per Trip
Average Cost per Passenger
Average Peak Passenger LoadVehicle Type
(NB / SB)
09:00 - 15:00
Hwy. Coach Hwy. Coach
06:00 - 09:00
1,075 1,041 3 3 38 49 34 42 $2.44 $1.93 32 / 39 / Hwy. Coach Hwy. Coach
18:00 - 21:00
/ 32 / 40 Hwy. Coach Hwy. Coach1,909 3 3 24 44 35 41 $2.80 $2.30
Time Annual Revenue Hours
Average Trips per Clock Hour
Average Boardings per Revenue Hour
Average Boardings per Trip
Average Cost per Passenger
Average Peak Passenger LoadVehicle Type
(NB / SB)
21:00 - 01:00
06:00 - 09:00
2015 2016
Satu
rday
01:00 - 06:00
18:00 - 21:00
15:00 - 18:00
09:00 - 15:00
21:00 - 01:00
2015 2016
Sund
ay/H
olid
ay
01:00 - 06:00
15:00 - 18:00
TimeAnnual Revenue
HoursAverage Trips per Clock Hour
Average Boardings per Revenue Hour
Average Boardings per Trip
Average Cost per Passenger
Average Peak Passenger LoadVehicle Type(NB / SB)
09:00 - 15:00
06:00 - 09:00
21:00 - 01:00
18:00 - 21:00
Top 25% of all bus services High 25% of all bus services Low 25% of all bus services Bottom 25% of all bus services Above Guidelines#
45

Key CharacteristicsSub-region of Primary Service:
Predominant Vehicle Type: Bus Depot:
Contributes to FTN: NoAverage One-Way Trip Distance (km):
Cost & Performance2012 2013 2014 2015 2016 Rank (2016)
Annual APC Boardings: 167,000 162,000 159,000 173,000 180,000 139 of 214 Average Daily APC Boardings (Mon-Fri): 650 650 650 700 700 132 of 213
Average Daily APC Boardings (Sat): Average Daily APC Boardings (Sun/Hol):
Annual Service Cost: $452,000 $462,000 $467,000 $467,000 $474,000 132 of 216 Annual Revenue Hours: 4,700 4,800 4,800 4,800 4,900 152 of 216
Cost per APC Boarded Passenger: $2.71 $2.85 $3.03 $2.69 $2.63 144 of 214 Average APC Boardings per Rev. Hour: 36 34 33 36 37 132 of 214
Average Peak Passenger Load: 34 35 26 38 41 7 of 210Average Peak Load Factor: 71% 75% 55% 81% 86% 1 of 210
Revenue Hours with Overcrowding: 0% 0% 0% 0% 0% 1 of 209 Average Speed (km/h): 43.6 44.7 44.3 42.9 8 of 206
Service Changes Since December 2010- No service change between December 2010 and September 2015
Hwy. CoachRichmond
Route 354
South of Fraser
18.0
Very low sampling in 2012, 2013 and 2014
Ride
rshi
pU
tiliz
atio
nCo
st46
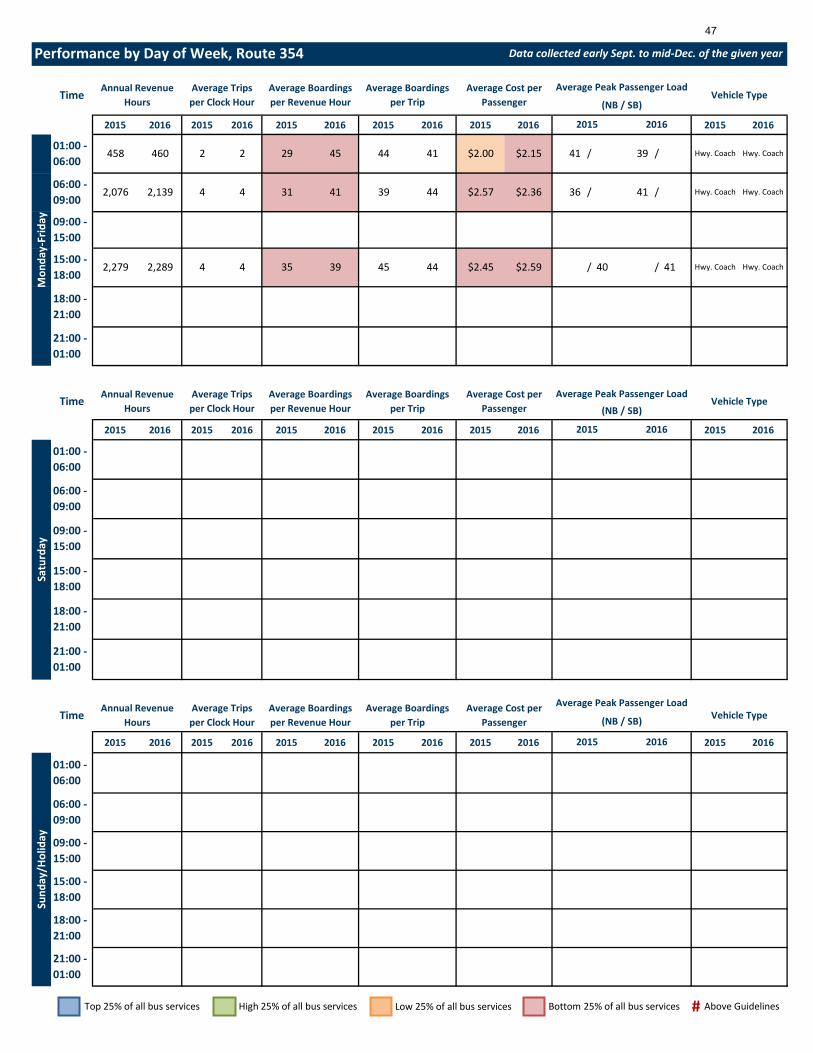
2015 2016 2015 2016 2015 2016 2015 2016 2015 2016 2015 2016
2015 2016 2015 2016 2015 2016 2015 2016 2015 2016 2015 2016
2015 2016 2015 2016 2015 2016 2015 2016 2015 2016 2015 2016
2015 2016
Mon
day-
Frid
ay
01:00 - 06:00
458 460 2 2 29 45 44 41 $2.00 $2.15 41 / 39 /
15:00 - 18:00
2,279
Performance by Day of Week, Route 354 Data collected early Sept. to mid-Dec. of the given year
TimeAnnual Revenue
HoursAverage Trips per Clock Hour
Average Boardings per Revenue Hour
Average Boardings per Trip
Average Cost per Passenger
Average Peak Passenger LoadVehicle Type
(NB / SB)
09:00 - 15:00
Hwy. Coach Hwy. Coach
06:00 - 09:00
2,076 2,139 4 4 31 41 39 44 $2.57 $2.36 36 / 41 / Hwy. Coach Hwy. Coach
18:00 - 21:00
/ 40 / 41 Hwy. Coach Hwy. Coach2,289 4 4 35 39 45 44 $2.45 $2.59
Time Annual Revenue Hours
Average Trips per Clock Hour
Average Boardings per Revenue Hour
Average Boardings per Trip
Average Cost per Passenger
Average Peak Passenger LoadVehicle Type
(NB / SB)
21:00 - 01:00
06:00 - 09:00
2015 2016
Satu
rday
01:00 - 06:00
18:00 - 21:00
15:00 - 18:00
09:00 - 15:00
21:00 - 01:00
2015 2016
Sund
ay/H
olid
ay
01:00 - 06:00
15:00 - 18:00
TimeAnnual Revenue
HoursAverage Trips per Clock Hour
Average Boardings per Revenue Hour
Average Boardings per Trip
Average Cost per Passenger
Average Peak Passenger LoadVehicle Type(NB / SB)
09:00 - 15:00
06:00 - 09:00
21:00 - 01:00
18:00 - 21:00
Top 25% of all bus services High 25% of all bus services Low 25% of all bus services Bottom 25% of all bus services Above Guidelines#
47

Key CharacteristicsSub-region of Primary Service:
Predominant Vehicle Type: Bus Depot:
Contributes to FTN: NoAverage One-Way Trip Distance (km):
Cost & Performance2012 2013 2014 2015 2016 Rank (2016)
Annual APC Boardings: 771,000 773,000 800,000 833,000 910,000 75 of 214 Average Daily APC Boardings (Mon-Fri): 2,350 2,400 2,450 2,600 2,800 76 of 213
Average Daily APC Boardings (Sat): 1,600 1,600 1,650 1,750 1,900 73 of 174 Average Daily APC Boardings (Sun/Hol): 1,450 1,450 1,550 1,500 1,650 68 of 171
Annual Service Cost: $1,507,000 $1,507,000 $1,580,000 $1,590,000 $1,624,000 71 of 216 Annual Revenue Hours: 15,500 15,500 16,300 16,400 16,700 73 of 216
Cost per APC Boarded Passenger: $1.96 $1.95 $2.04 $1.91 $1.78 93 of 214 Average APC Boardings per Rev. Hour: 50 50 49 51 54 85 of 214
Average Peak Passenger Load: 20 21 21 21 21 92 of 210Average Peak Load Factor: 40% 41% 42% 41% 43% 92 of 210
Revenue Hours with Overcrowding: 0% 0% 0% 0% 0% 1 of 209 Average Speed (km/h): 30.5 30.2 29.6 27.9 51 of 206
Service Changes Since December 2010- No service change between December 2010 and September 2015
Std. BusSurrey
Route 364
South of Fraser
17.9
Ride
rshi
pU
tiliz
atio
nCo
st48

2015 2016 2015 2016 2015 2016 2015 2016 2015 2016 2015 2016
2015 2016 2015 2016 2015 2016 2015 2016 2015 2016 2015 2016
2015 2016 2015 2016 2015 2016 2015 2016 2015 2016 2015 2016
2015 2016
Mon
day-
Frid
ay
01:00 - 06:00
296 297 2 2 30 63 25 37 $2.30 $1.54 17 / 23 /
15:00 - 18:00
2,642
Performance by Day of Week, Route 364 Data collected early Sept. to mid-Dec. of the given year
TimeAnnual Revenue
HoursAverage Trips per Clock Hour
Average Boardings per Revenue Hour
Average Boardings per Trip
Average Cost per Passenger
Average Peak Passenger LoadVehicle Type
(EB / WB)
09:00 - 15:00
4,634 4,747 2 2 52 65 48 52 $1.60 $1.50 20 / 25 20 / 24 Std. Bus Std. Bus
Std. Bus Std. Bus
06:00 - 09:00
2,209 2,248 2 2 52 70 46 52 $1.61 $1.42 27 / 21 29 / 24 Std. Bus Std. Bus
18:00 - 21:00
2,050 2,101 2 2 32 39 25 28 $2.86 $2.53 18 / 12 17 / 12 Std. Bus Std. Bus
29 / 25 27 / 29 Std. Bus Std. Bus2,698 2 2 55 66 53 59 $1.63 $1.51
Std. Bus
Time Annual Revenue Hours
Average Trips per Clock Hour
Average Boardings per Revenue Hour
Average Boardings per Trip
Average Cost per Passenger
Average Peak Passenger LoadVehicle Type
(EB / WB)
$3.05 $2.70 12 / 13 8 / 16 Std. Bus21:00 - 01:00
304 311 1 1 33 36 19 22
06:00 - 09:00
324 336 2 2 34 45 27 31 $2.24 $2.42 13 / 18 21 / 13 Std. Bus Std. Bus
2015 2016
Satu
rday
01:00 - 06:00
40 $2.79 $1.94 16
18:00 - 21:00
276 288 2 2 24 37 18
/ 13 19 / 18 Std. Bus Std. Bus15:00 - 18:00
479 496 2 2 33 51 28
09:00 - 15:00
961 996 2 2 45 49 39 38 $1.98 $2.03 17 / 22 17 / 18 Std. Bus Std. Bus
Std. Bus Std. Bus
21:00 - 01:00
26 $5.04 $2.67 8 / 10 15 / 14
2015 2016
Sund
ay/H
olid
ay
01:00 - 06:00
15:00 - 18:00
542 549 2
TimeAnnual Revenue
HoursAverage Trips per Clock Hour
Average Boardings per Revenue Hour
Average Boardings per Trip
Average Cost per Passenger
Average Peak Passenger LoadVehicle Type(EB / WB)
09:00 - 15:00
1,103 1,108 2 2 43 55 37 41 $1.97 $1.82 18 / 19 17 / 20 Std. Bus Std. Bus
06:00 - 09:00
240 269 2 2 29 40 23 27 $2.60 $2.36 14 / 13 16 / 12 Std. Bus Std. Bus
13 Std. Bus Std. Bus
21:00 - 01:00
12 20 / 18 Std. Bus Std. Bus
18:00 - 21:00
334 301 2 2 24 35 20 23 $3.48 $3.08 10 / 13 12 /
2 33 52 27 38 $2.75 $1.88 14 /
Top 25% of all bus services High 25% of all bus services Low 25% of all bus services Bottom 25% of all bus services Above Guidelines#
49
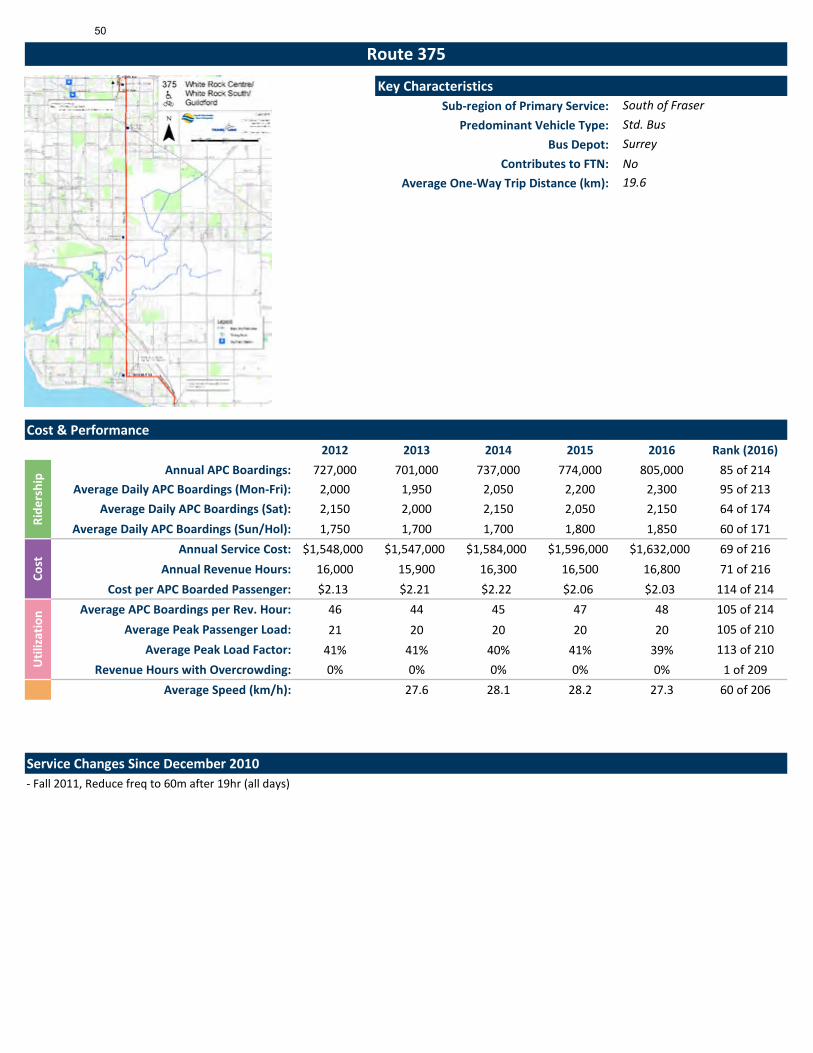
Key CharacteristicsSub-region of Primary Service:
Predominant Vehicle Type: Bus Depot:
Contributes to FTN: NoAverage One-Way Trip Distance (km):
Cost & Performance2012 2013 2014 2015 2016 Rank (2016)
Annual APC Boardings: 727,000 701,000 737,000 774,000 805,000 85 of 214 Average Daily APC Boardings (Mon-Fri): 2,000 1,950 2,050 2,200 2,300 95 of 213
Average Daily APC Boardings (Sat): 2,150 2,000 2,150 2,050 2,150 64 of 174 Average Daily APC Boardings (Sun/Hol): 1,750 1,700 1,700 1,800 1,850 60 of 171
Annual Service Cost: $1,548,000 $1,547,000 $1,584,000 $1,596,000 $1,632,000 69 of 216 Annual Revenue Hours: 16,000 15,900 16,300 16,500 16,800 71 of 216
Cost per APC Boarded Passenger: $2.13 $2.21 $2.22 $2.06 $2.03 114 of 214 Average APC Boardings per Rev. Hour: 46 44 45 47 48 105 of 214
Average Peak Passenger Load: 21 20 20 20 20 105 of 210Average Peak Load Factor: 41% 41% 40% 41% 39% 113 of 210
Revenue Hours with Overcrowding: 0% 0% 0% 0% 0% 1 of 209 Average Speed (km/h): 27.6 28.1 28.2 27.3 60 of 206
Service Changes Since December 2010- Fall 2011, Reduce freq to 60m after 19hr (all days)
Std. BusSurrey
Route 375
South of Fraser
19.6
Ride
rshi
pU
tiliz
atio
nCo
st50

2015 2016 2015 2016 2015 2016 2015 2016 2015 2016 2015 2016
2015 2016 2015 2016 2015 2016 2015 2016 2015 2016 2015 2016
2015 2016 2015 2016 2015 2016 2015 2016 2015 2016 2015 2016
2015 2016
Mon
day-
Frid
ay
01:00 - 06:00
15:00 - 18:00
2,633
Performance by Day of Week, Route 375 Data collected early Sept. to mid-Dec. of the given year
TimeAnnual Revenue
HoursAverage Trips per Clock Hour
Average Boardings per Revenue Hour
Average Boardings per Trip
Average Cost per Passenger
Average Peak Passenger LoadVehicle Type
(NB / SB)
09:00 - 15:00
4,870 5,068 2 2 44 49 41 42 $2.01 $2.10 18 / 20 18 / 17 Std. Bus Std. Bus
06:00 - 09:00
2,338 2,417 2 2 41 51 39 42 $2.13 $2.00 15 / 30 14 / 30 Std. Bus Std. Bus
18:00 - 21:00
1,462 1,477 1 1 28 40 24 30 $2.99 $2.45 12 / 17 11 / 20 Std. Bus Std. Bus
28 / 26 25 / 23 Std. Bus Std. Bus2,705 2 2 54 56 52 51 $1.69 $1.76
Std. Bus
Time Annual Revenue Hours
Average Trips per Clock Hour
Average Boardings per Revenue Hour
Average Boardings per Trip
Average Cost per Passenger
Average Peak Passenger LoadVehicle Type
(NB / SB)
$8.37 / 15 Std. Bus21:00 - 01:00
187 188 1 1 12 9
06:00 - 09:00
450 459 2 2 29 40 30 29 $2.38 $2.48 17 / 24 16 / 17 Std. Bus Std. Bus
2015 2016
Satu
rday
01:00 - 06:00
39 $2.04 $2.13 18
18:00 - 21:00
316 323 1 1 38 52 34
/ 25 19 / 22 Std. Bus Std. Bus15:00 - 18:00
516 526 2 2 41 47 40
09:00 - 15:00
1,001 1,020 2 2 42 51 42 41 $1.94 $1.95 22 / 17 24 / 18 Std. Bus Std. Bus
Std. Bus Std. Bus
21:00 - 01:00
40 $2.20 $1.90 20 / 22 22 / 28
2015 2016
Sund
ay/H
olid
ay
01:00 - 06:00
15:00 - 18:00
616 606 2
TimeAnnual Revenue
HoursAverage Trips per Clock Hour
Average Boardings per Revenue Hour
Average Boardings per Trip
Average Cost per Passenger
Average Peak Passenger LoadVehicle Type(NB / SB)
09:00 - 15:00
1,201 1,179 2 2 39 50 40 40 $1.97 $2.00 23 / 21 23 / 19 Std. Bus Std. Bus
06:00 - 09:00
480 473 2 2 20 29 22 22 $3.55 $3.41 10 / 16 14 / 13 Std. Bus Std. Bus
18 Std. Bus Std. Bus
21:00 - 01:00
23 15 / 23 Std. Bus Std. Bus
18:00 - 21:00
383 377 1 1 35 43 33 32 $2.62 $2.33 16 / 25 15 /
2 35 45 37 36 $2.24 $2.27 18 /
Top 25% of all bus services High 25% of all bus services Low 25% of all bus services Bottom 25% of all bus services Above Guidelines#
51

Key CharacteristicsSub-region of Primary Service:
Predominant Vehicle Type: Bus Depot:
Contributes to FTN: NoAverage One-Way Trip Distance (km):
Cost & Performance2012 2013 2014 2015 2016 Rank (2016)
Annual APC Boardings: 150,000 154,000 166,000 186,000 203,000 131 of 214 Average Daily APC Boardings (Mon-Fri): 600 600 650 750 800 128 of 213
Average Daily APC Boardings (Sat): Average Daily APC Boardings (Sun/Hol):
Annual Service Cost: $496,000 $510,000 $511,000 $547,000 $554,000 124 of 216 Annual Revenue Hours: 7,700 8,000 8,000 8,500 8,600 117 of 216
Cost per APC Boarded Passenger: $3.30 $3.30 $3.08 $2.95 $2.73 151 of 214 Average APC Boardings per Rev. Hour: 19 19 21 22 24 166 of 214
Average Peak Passenger Load: 15 13 12 14 13 132 of 210Average Peak Load Factor: 62% 53% 48% 58% 54% 45 of 210
Revenue Hours with Overcrowding: 21% 0% 0% 0% 6% 181 of 209 Average Speed (km/h): 33.9 34.4 34.1 31.9 27 of 206
Service Changes Since December 2010- Fall 2011, Convert from conventional 40' bus to mini-bus at all times- Winter 2011, Reroute service between 168th & Golden Ears Way- Winter 2012, Extend service to terminate at Carvolth Exchange- Spring 2016, Add one bus during AM & PM peak for Pattullo Bridge Rehabilitation (M-F)- Fall 2016, End of Pattullo Bridge Rehabilitation; return to regular service levels (remove one bus during AM & PM peak)
Mini-BusSurrey
Route 388
South of Fraser
20.4
Very low sampling in 2012, 2013, and 2015
Ride
rshi
pU
tiliz
atio
nCo
st52

2015 2016 2015 2016 2015 2016 2015 2016 2015 2016 2015 2016
2015 2016 2015 2016 2015 2016 2015 2016 2015 2016 2015 2016
2015 2016 2015 2016 2015 2016 2015 2016 2015 2016 2015 2016
2015 2016
Mon
day-
Frid
ay
01:00 - 06:00
692 701 2 2 21 33 25 31 $2.33 $1.96 / 18 18 / 19
15:00 - 18:00
3,237
Performance by Day of Week, Route 388 Data collected early Sept. to mid-Dec. of the given year
TimeAnnual Revenue
HoursAverage Trips per Clock Hour
Average Boardings per Revenue Hour
Average Boardings per Trip
Average Cost per Passenger
Average Peak Passenger LoadVehicle Type
(EB / WB)
09:00 - 15:00
Mini-Bus Mini-Bus
06:00 - 09:00
3,605 3,329 2 2 22 25 24 26 $3.05 $2.91 15 / 14 13 / 13 Mini-Bus Mini-Bus
18:00 - 21:00
921 924 2 2 13 13 13 11 $5.04 $5.71 10 / 4 8 / 4 Mini-Bus Mini-Bus
15 / 14 15 / 11 Mini-Bus Mini-Bus3,613 2 2 22 23 26 26 $2.78 $2.98
Time Annual Revenue Hours
Average Trips per Clock Hour
Average Boardings per Revenue Hour
Average Boardings per Trip
Average Cost per Passenger
Average Peak Passenger LoadVehicle Type
(EB / WB)
21:00 - 01:00
06:00 - 09:00
2015 2016
Satu
rday
01:00 - 06:00
18:00 - 21:00
15:00 - 18:00
09:00 - 15:00
21:00 - 01:00
2015 2016
Sund
ay/H
olid
ay
01:00 - 06:00
15:00 - 18:00
TimeAnnual Revenue
HoursAverage Trips per Clock Hour
Average Boardings per Revenue Hour
Average Boardings per Trip
Average Cost per Passenger
Average Peak Passenger LoadVehicle Type(EB / WB)
09:00 - 15:00
06:00 - 09:00
21:00 - 01:00
18:00 - 21:00
Top 25% of all bus services High 25% of all bus services Low 25% of all bus services Bottom 25% of all bus services Above Guidelines#
53

Key CharacteristicsSub-region of Primary Service:
Predominant Vehicle Type: Bus Depot:
Contributes to FTN: NoAverage One-Way Trip Distance (km):
Cost & Performance2012 2013 2014 2015 2016 Rank (2016)
Annual APC Boardings: 72,000 66,000 75,000 80,000 87,000 165 of 214 Average Daily APC Boardings (Mon-Fri): 300 250 300 300 350 161 of 213
Average Daily APC Boardings (Sat): Average Daily APC Boardings (Sun/Hol):
Annual Service Cost: $110,000 $110,000 $116,000 $120,000 $122,000 203 of 216 Annual Revenue Hours: 1,100 1,100 1,200 1,200 1,300 207 of 216
Cost per APC Boarded Passenger: $1.53 $1.67 $1.60 $1.49 $1.40 61 of 214 Average APC Boardings per Rev. Hour: 63 58 63 65 69 56 of 214
Average Peak Passenger Load: 25 26 27 28 31 28 of 210Average Peak Load Factor: 50% 52% 54% 56% 62% 25 of 210
Revenue Hours with Overcrowding: 0% 0% 0% 0% 0% 1 of 209 Average Speed (km/h): 24.2 25.2 25.4 24.9 88 of 206
Service Changes Since December 2010- No service change between December 2010 and September 2015
Std. BusSurrey
Route 391
South of Fraser
9.0
Ride
rshi
pU
tiliz
atio
nCo
st54

2015 2016 2015 2016 2015 2016 2015 2016 2015 2016 2015 2016
2015 2016 2015 2016 2015 2016 2015 2016 2015 2016 2015 2016
2015 2016 2015 2016 2015 2016 2015 2016 2015 2016 2015 2016
2015 2016
Mon
day-
Frid
ay
01:00 - 06:00
188 191 2 2 57 63 26 24 $1.42 $1.52 24 / 23 /
15:00 - 18:00
467
Performance by Day of Week, Route 391 Data collected early Sept. to mid-Dec. of the given year
TimeAnnual Revenue
HoursAverage Trips per Clock Hour
Average Boardings per Revenue Hour
Average Boardings per Trip
Average Cost per Passenger
Average Peak Passenger LoadVehicle Type
(NB / SB)
09:00 - 15:00
Std. Bus Std. Bus
06:00 - 09:00
458 469 2 2 66 90 38 42 $1.18 $1.09 34 / 37 / Std. Bus Std. Bus
18:00 - 21:00
121 121 1 1 59 66 28 32 $1.70 $1.48 / 24 / 28 Std. Bus Std. Bus
/ 25 / 29 Std. Bus Std. Bus480 1 1 48 75 30 36 $1.56 $1.30
Time Annual Revenue Hours
Average Trips per Clock Hour
Average Boardings per Revenue Hour
Average Boardings per Trip
Average Cost per Passenger
Average Peak Passenger LoadVehicle Type
(NB / SB)
21:00 - 01:00
06:00 - 09:00
2015 2016
Satu
rday
01:00 - 06:00
18:00 - 21:00
15:00 - 18:00
09:00 - 15:00
21:00 - 01:00
2015 2016
Sund
ay/H
olid
ay
01:00 - 06:00
15:00 - 18:00
TimeAnnual Revenue
HoursAverage Trips per Clock Hour
Average Boardings per Revenue Hour
Average Boardings per Trip
Average Cost per Passenger
Average Peak Passenger LoadVehicle Type(NB / SB)
09:00 - 15:00
06:00 - 09:00
21:00 - 01:00
18:00 - 21:00
Top 25% of all bus services High 25% of all bus services Low 25% of all bus services Bottom 25% of all bus services Above Guidelines#
55
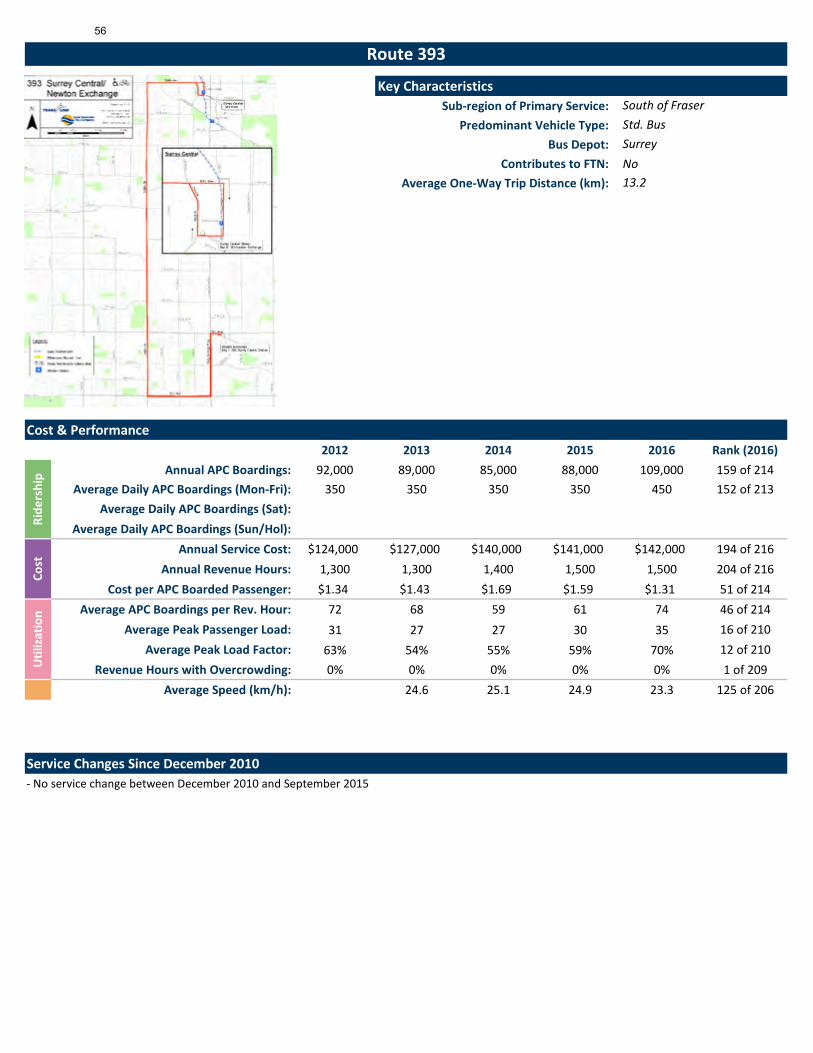
Key CharacteristicsSub-region of Primary Service:
Predominant Vehicle Type: Bus Depot:
Contributes to FTN: NoAverage One-Way Trip Distance (km):
Cost & Performance2012 2013 2014 2015 2016 Rank (2016)
Annual APC Boardings: 92,000 89,000 85,000 88,000 109,000 159 of 214 Average Daily APC Boardings (Mon-Fri): 350 350 350 350 450 152 of 213
Average Daily APC Boardings (Sat): Average Daily APC Boardings (Sun/Hol):
Annual Service Cost: $124,000 $127,000 $140,000 $141,000 $142,000 194 of 216 Annual Revenue Hours: 1,300 1,300 1,400 1,500 1,500 204 of 216
Cost per APC Boarded Passenger: $1.34 $1.43 $1.69 $1.59 $1.31 51 of 214 Average APC Boardings per Rev. Hour: 72 68 59 61 74 46 of 214
Average Peak Passenger Load: 31 27 27 30 35 16 of 210Average Peak Load Factor: 63% 54% 55% 59% 70% 12 of 210
Revenue Hours with Overcrowding: 0% 0% 0% 0% 0% 1 of 209 Average Speed (km/h): 24.6 25.1 24.9 23.3 125 of 206
Service Changes Since December 2010- No service change between December 2010 and September 2015
Std. BusSurrey
Route 393
South of Fraser
13.2
Ride
rshi
pU
tiliz
atio
nCo
st56
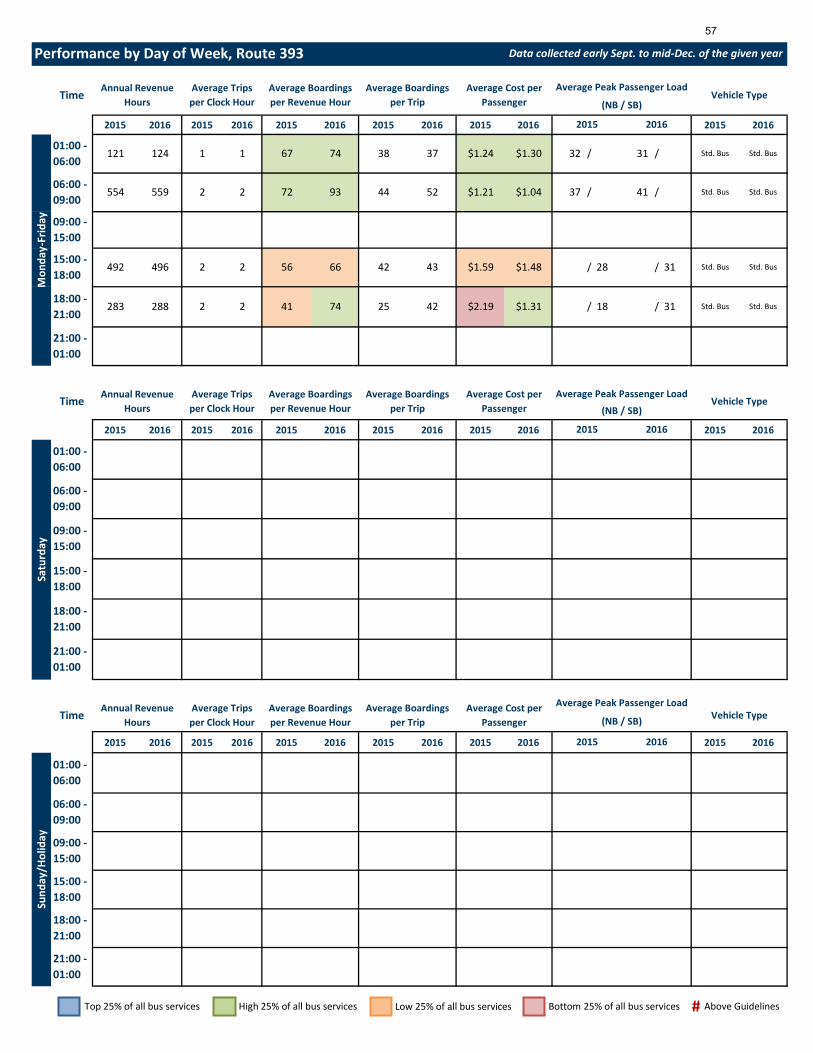
2015 2016 2015 2016 2015 2016 2015 2016 2015 2016 2015 2016
2015 2016 2015 2016 2015 2016 2015 2016 2015 2016 2015 2016
2015 2016 2015 2016 2015 2016 2015 2016 2015 2016 2015 2016
2015 2016
Mon
day-
Frid
ay
01:00 - 06:00
121 124 1 1 67 74 38 37 $1.24 $1.30 32 / 31 /
15:00 - 18:00
492
Performance by Day of Week, Route 393 Data collected early Sept. to mid-Dec. of the given year
TimeAnnual Revenue
HoursAverage Trips per Clock Hour
Average Boardings per Revenue Hour
Average Boardings per Trip
Average Cost per Passenger
Average Peak Passenger LoadVehicle Type
(NB / SB)
09:00 - 15:00
Std. Bus Std. Bus
06:00 - 09:00
554 559 2 2 72 93 44 52 $1.21 $1.04 37 / 41 / Std. Bus Std. Bus
18:00 - 21:00
283 288 2 2 41 74 25 42 $2.19 $1.31 / 18 / 31 Std. Bus Std. Bus
/ 28 / 31 Std. Bus Std. Bus496 2 2 56 66 42 43 $1.59 $1.48
Time Annual Revenue Hours
Average Trips per Clock Hour
Average Boardings per Revenue Hour
Average Boardings per Trip
Average Cost per Passenger
Average Peak Passenger LoadVehicle Type
(NB / SB)
21:00 - 01:00
06:00 - 09:00
2015 2016
Satu
rday
01:00 - 06:00
18:00 - 21:00
15:00 - 18:00
09:00 - 15:00
21:00 - 01:00
2015 2016
Sund
ay/H
olid
ay
01:00 - 06:00
15:00 - 18:00
TimeAnnual Revenue
HoursAverage Trips per Clock Hour
Average Boardings per Revenue Hour
Average Boardings per Trip
Average Cost per Passenger
Average Peak Passenger LoadVehicle Type(NB / SB)
09:00 - 15:00
06:00 - 09:00
21:00 - 01:00
18:00 - 21:00
Top 25% of all bus services High 25% of all bus services Low 25% of all bus services Bottom 25% of all bus services Above Guidelines#
57

Key CharacteristicsSub-region of Primary Service:
Predominant Vehicle Type: Bus Depot:
Contributes to FTN: YesAverage One-Way Trip Distance (km):
Cost & Performance2012 2013 2014 2015 2016 Rank (2016)
Annual APC Boardings: 109,000 111,000 100,000 96,000 112,000 157 of 214 Average Daily APC Boardings (Mon-Fri): 450 450 400 400 450 149 of 213
Average Daily APC Boardings (Sat): Average Daily APC Boardings (Sun/Hol):
Annual Service Cost: $277,000 $279,000 $289,000 $295,000 $298,000 160 of 216 Annual Revenue Hours: 2,900 2,900 3,000 3,000 3,100 173 of 216
Cost per APC Boarded Passenger: $2.53 $2.51 $2.98 $3.07 $2.67 147 of 214 Average APC Boardings per Rev. Hour: 38 39 34 32 36 135 of 214
Average Peak Passenger Load: 24 27 21 22 23 76 of 210Average Peak Load Factor: 48% 53% 42% 44% 48% 71 of 210
Revenue Hours with Overcrowding: 0% 0% 0% 0% 0% 1 of 209 Average Speed (km/h): 29.5 29.9 29.6 29.2 37 of 206
Service Changes Since December 2010- Spring 2012, Convert from conventional 40’ bus to Orion Hwy Coach- Fall 2016, Adjust stopping procedure to make easier to understand and improve travel times
Std. BusSurrey
Route 394
South of Fraser
11.0
Ride
rshi
pU
tiliz
atio
nCo
st58

2015 2016 2015 2016 2015 2016 2015 2016 2015 2016 2015 2016
2015 2016 2015 2016 2015 2016 2015 2016 2015 2016 2015 2016
2015 2016 2015 2016 2015 2016 2015 2016 2015 2016 2015 2016
2015 2016
Mon
day-
Frid
ay
01:00 - 06:00
288 289 2 2 32 56 24 32 $2.38 $1.73 22 / 30 /
15:00 - 18:00
1,567
Performance by Day of Week, Route 394 Data collected early Sept. to mid-Dec. of the given year
TimeAnnual Revenue
HoursAverage Trips per Clock Hour
Average Boardings per Revenue Hour
Average Boardings per Trip
Average Cost per Passenger
Average Peak Passenger LoadVehicle Type
(NB / SB)
09:00 - 15:00
Std. BusHwy. Coach & Std. Bus
06:00 - 09:00
1,008 1,015 2 2 45 44 33 29 $3.23 $3.44 33 / 10 36 / 11 Std. BusHwy. Coach & Std. Bus
18:00 - 21:00
175 176 1 1 30 26 20 19 $3.37 $3.67 / 16 / 15 Std. BusHwy. Coach & Std. Bus
12 / 27 16 / 24 Hwy. Coach & Std. Bus
Hwy. Coach & Std. Bus1,588 2 2 27 35 23 27 $3.52 $2.87
Time Annual Revenue Hours
Average Trips per Clock Hour
Average Boardings per Revenue Hour
Average Boardings per Trip
Average Cost per Passenger
Average Peak Passenger LoadVehicle Type
(NB / SB)
21:00 - 01:00
06:00 - 09:00
2015 2016
Satu
rday
01:00 - 06:00
18:00 - 21:00
15:00 - 18:00
09:00 - 15:00
21:00 - 01:00
2015 2016
Sund
ay/H
olid
ay
01:00 - 06:00
15:00 - 18:00
TimeAnnual Revenue
HoursAverage Trips per Clock Hour
Average Boardings per Revenue Hour
Average Boardings per Trip
Average Cost per Passenger
Average Peak Passenger LoadVehicle Type(NB / SB)
09:00 - 15:00
06:00 - 09:00
21:00 - 01:00
18:00 - 21:00
Top 25% of all bus services High 25% of all bus services Low 25% of all bus services Bottom 25% of all bus services Above Guidelines#
59
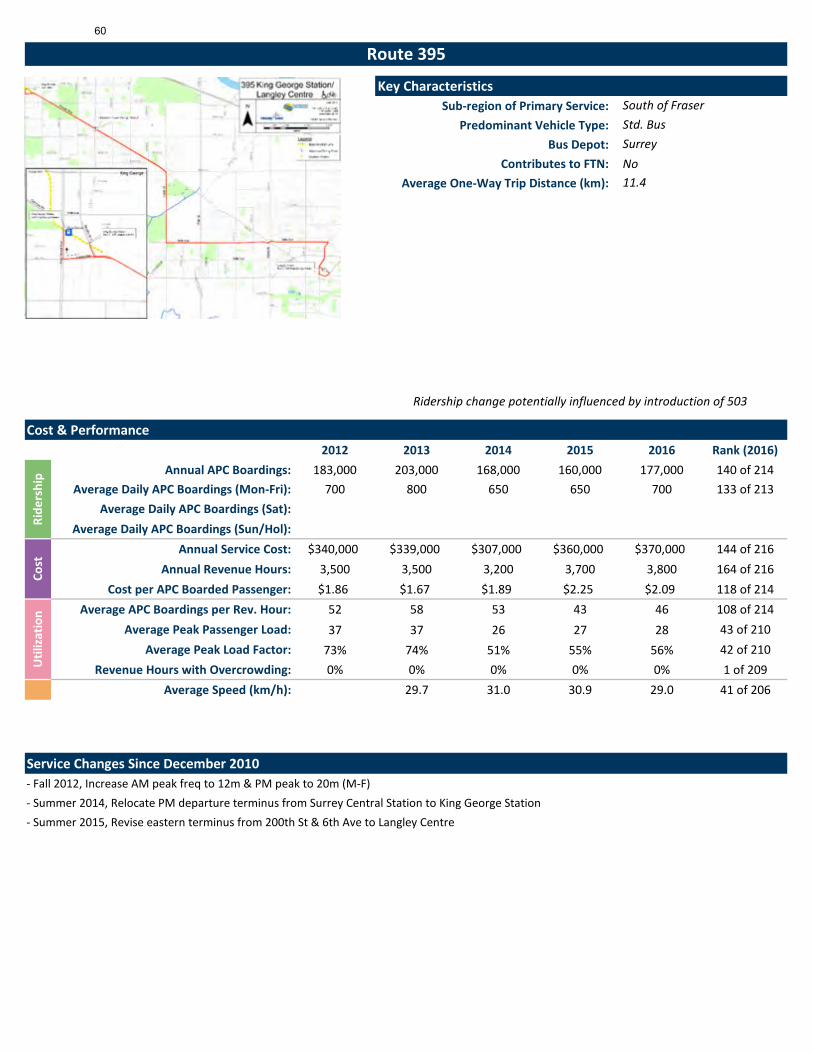
Key CharacteristicsSub-region of Primary Service:
Predominant Vehicle Type: Bus Depot:
Contributes to FTN: NoAverage One-Way Trip Distance (km):
Cost & Performance2012 2013 2014 2015 2016 Rank (2016)
Annual APC Boardings: 183,000 203,000 168,000 160,000 177,000 140 of 214 Average Daily APC Boardings (Mon-Fri): 700 800 650 650 700 133 of 213
Average Daily APC Boardings (Sat): Average Daily APC Boardings (Sun/Hol):
Annual Service Cost: $340,000 $339,000 $307,000 $360,000 $370,000 144 of 216 Annual Revenue Hours: 3,500 3,500 3,200 3,700 3,800 164 of 216
Cost per APC Boarded Passenger: $1.86 $1.67 $1.89 $2.25 $2.09 118 of 214 Average APC Boardings per Rev. Hour: 52 58 53 43 46 108 of 214
Average Peak Passenger Load: 37 37 26 27 28 43 of 210Average Peak Load Factor: 73% 74% 51% 55% 56% 42 of 210
Revenue Hours with Overcrowding: 0% 0% 0% 0% 0% 1 of 209 Average Speed (km/h): 29.7 31.0 30.9 29.0 41 of 206
Service Changes Since December 2010- Fall 2012, Increase AM peak freq to 12m & PM peak to 20m (M-F)- Summer 2014, Relocate PM departure terminus from Surrey Central Station to King George Station- Summer 2015, Revise eastern terminus from 200th St & 6th Ave to Langley Centre
Std. BusSurrey
Route 395
South of Fraser
11.4
Ridership change potentially influenced by introduction of 503
Ride
rshi
pU
tiliz
atio
nCo
st60

2015 2016 2015 2016 2015 2016 2015 2016 2015 2016 2015 2016
2015 2016 2015 2016 2015 2016 2015 2016 2015 2016 2015 2016
2015 2016 2015 2016 2015 2016 2015 2016 2015 2016 2015 2016
2015 2016
Mon
day-
Frid
ay
01:00 - 06:00
454 459 3 3 41 63 34 38 $1.75 $1.54 / 30 / 34
15:00 - 18:00
1,434
Performance by Day of Week, Route 395 Data collected early Sept. to mid-Dec. of the given year
TimeAnnual Revenue
HoursAverage Trips per Clock Hour
Average Boardings per Revenue Hour
Average Boardings per Trip
Average Cost per Passenger
Average Peak Passenger LoadVehicle Type
(EB / WB)
09:00 - 15:00
Std. Bus Std. Bus
06:00 - 09:00
1,092 1,164 4 4 48 61 43 41 $1.43 $1.57 / 39 / 37 Std. Bus Std. Bus
18:00 - 21:00
733 736 2 2 35 37 25 27 $3.04 $2.71 20 / 20 / Std. Bus Std. Bus
22 / 22 / Std. Bus Std. Bus1,450 2 2 34 40 30 33 $2.62 $2.42
Time Annual Revenue Hours
Average Trips per Clock Hour
Average Boardings per Revenue Hour
Average Boardings per Trip
Average Cost per Passenger
Average Peak Passenger LoadVehicle Type
(EB / WB)
21:00 - 01:00
06:00 - 09:00
2015 2016
Satu
rday
01:00 - 06:00
18:00 - 21:00
15:00 - 18:00
09:00 - 15:00
21:00 - 01:00
2015 2016
Sund
ay/H
olid
ay
01:00 - 06:00
15:00 - 18:00
TimeAnnual Revenue
HoursAverage Trips per Clock Hour
Average Boardings per Revenue Hour
Average Boardings per Trip
Average Cost per Passenger
Average Peak Passenger LoadVehicle Type(EB / WB)
09:00 - 15:00
06:00 - 09:00
21:00 - 01:00
18:00 - 21:00
Top 25% of all bus services High 25% of all bus services Low 25% of all bus services Bottom 25% of all bus services Above Guidelines#
61

Key CharacteristicsSub-region of Primary Service:
Predominant Vehicle Type: Bus Depot:
Contributes to FTN: NoAverage One-Way Trip Distance (km):
Cost & Performance2012 2013 2014 2015 2016 Rank (2016)
Annual APC Boardings: 2,787,000 2,880,000 2,854,000 2,891,000 2,926,000 28 of 214 Average Daily APC Boardings (Mon-Fri): 9,150 9,450 9,300 9,550 9,550 26 of 213
Average Daily APC Boardings (Sat): 4,900 5,200 5,350 5,100 5,200 33 of 174 Average Daily APC Boardings (Sun/Hol): 3,650 3,850 3,900 3,900 4,000 34 of 171
Annual Service Cost: $3,658,000 $3,767,000 $3,728,000 $3,716,000 $3,728,000 31 of 216 Annual Revenue Hours: 37,700 38,800 38,400 38,300 38,400 31 of 216
Cost per APC Boarded Passenger: $1.31 $1.31 $1.35 $1.29 $1.27 46 of 214 Average APC Boardings per Rev. Hour: 74 74 74 75 76 42 of 214
Average Peak Passenger Load: 33 33 33 34 31 26 of 210Average Peak Load Factor: 65% 66% 66% 67% 63% 23 of 210
Revenue Hours with Overcrowding: 1% 1% 1% 1% 1% 161 of 209 Average Speed (km/h): 24.7 24.7 24.6 23.7 117 of 206
Service Changes Since December 2010- Summer 2011, Discontinue trips at 04:41 Chatham & 04:39 Riverport (Sat, S/H)
Std. BusRichmond
Route 401
Richmond
14.5
Ride
rshi
pU
tiliz
atio
nCo
st62

2015 2016 2015 2016 2015 2016 2015 2016 2015 2016 2015 2016
2015 2016 2015 2016 2015 2016 2015 2016 2015 2016 2015 2016
2015 2016 2015 2016 2015 2016 2015 2016 2015 2016 2015 2016
2015 2016
Mon
day-
Frid
ay
01:00 - 06:00
1,996 2,010 2 2 24 32 16 16 $3.29 $3.40 11 / 13 12 / 12
15:00 - 18:00
7,774
Performance by Day of Week, Route 401 Data collected early Sept. to mid-Dec. of the given year
TimeAnnual Revenue
HoursAverage Trips per Clock Hour
Average Boardings per Revenue Hour
Average Boardings per Trip
Average Cost per Passenger
Average Peak Passenger LoadVehicle Type
(EB / WB)
09:00 - 15:00
9,554 9,724 4 5 74 84 66 63 $1.11 $1.15 34 / 36 30 / 33 Std. Bus Std. Bus
Std. Bus Std. Bus
06:00 - 09:00
6,663 6,638 7 7 74 90 61 62 $1.19 $1.19 34 / 39 33 / 39 Std. Bus Std. Bus
18:00 - 21:00
3,367 3,386 3 3 66 71 50 50 $1.40 $1.39 35 / 33 34 / 32 Std. Bus Std. Bus
38 / 40 36 / 34 Std. Bus Std. Bus7,671 7 7 72 85 67 65 $1.10 $1.16
Std. Bus
Time Annual Revenue Hours
Average Trips per Clock Hour
Average Boardings per Revenue Hour
Average Boardings per Trip
Average Cost per Passenger
Average Peak Passenger LoadVehicle Type
(EB / WB)
$2.11 $2.47 24 / 22 24 / 20 Std. Bus21:00 - 01:00
1,763 1,776 2 2 45 47 33 29
Std. Bus Std. Bus
06:00 - 09:00
487 507 2 3 49 55 39 36 $1.81 $1.78 22 / 28 27 / 23 Std. Bus Std. Bus
2015 2016
Satu
rday
01:00 - 06:00
182 175 1 1 27 14 $4.84 9 / 13 11 / 9
60 $1.23 $1.31 40
18:00 - 21:00
448 443 2 2 78 80 60
/ 34 34 / 27 Std. Bus Std. Bus15:00 - 18:00
732 761 3 3 68 73 66
09:00 - 15:00
1,576 1,606 3 3 62 71 63 58 $1.27 $1.41 32 / 34 29 / 30 Std. Bus Std. Bus
Std. Bus Std. Bus
21:00 - 01:00
365 373 2 2 39 47 31 31 $2.05 $2.22 22 / 19 21 / 17 Std. Bus Std. Bus
56 $1.21 $1.38 41 / 34 34 / 37
2015 2016
Sund
ay/H
olid
ay
01:00 - 06:00
217 218 1 1 11 21 6 8 $6.87 6 / 6 9 / 7
15:00 - 18:00
593 589 2
TimeAnnual Revenue
HoursAverage Trips per Clock Hour
Average Boardings per Revenue Hour
Average Boardings per Trip
Average Cost per Passenger
Average Peak Passenger LoadVehicle Type(EB / WB)
09:00 - 15:00
1,178 1,184 2 2 80 92 73 71 $1.04 $1.08 39 / 42 36 / 38 Std. Bus Std. Bus
Std. Bus Std. Bus
06:00 - 09:00
526 494 2 2 45 56 36 35 $2.09 $2.28 20 / 24 20 / 23 Std. Bus Std. Bus
33 Std. Bus Std. Bus
21:00 - 01:00
424 418 2 2 41 23 18 / 16 20 / 16 Std. Bus Std. Bus
39 44 / 47 Std. Bus Std. Bus
18:00 - 21:00
464 456 2 2 59 76 47 53 $1.46 $1.45 29 / 33 38 /
2 77 102 71 80 $1.08 $0.97 42 /
Top 25% of all bus services High 25% of all bus services Low 25% of all bus services Bottom 25% of all bus services Above Guidelines#
63

Key CharacteristicsSub-region of Primary Service:
Predominant Vehicle Type: Bus Depot:
Contributes to FTN: NoAverage One-Way Trip Distance (km):
Cost & Performance2012 2013 2014 2015 2016 Rank (2016)
Annual APC Boardings: 980,000 954,000 937,000 924,000 940,000 73 of 214 Average Daily APC Boardings (Mon-Fri): 3,150 3,100 3,000 3,000 3,050 74 of 213
Average Daily APC Boardings (Sat): 1,850 1,750 1,850 1,700 1,700 76 of 174 Average Daily APC Boardings (Sun/Hol): 1,450 1,450 1,450 1,400 1,400 75 of 171
Annual Service Cost: $1,331,000 $1,334,000 $1,324,000 $1,334,000 $1,397,000 82 of 216 Annual Revenue Hours: 13,700 13,700 13,600 13,800 14,400 88 of 216
Cost per APC Boarded Passenger: $1.36 $1.40 $1.46 $1.44 $1.49 72 of 214 Average APC Boardings per Rev. Hour: 71 69 69 67 65 66 of 214
Average Peak Passenger Load: 24 23 23 22 20 100 of 210Average Peak Load Factor: 48% 46% 47% 44% 40% 105 of 210
Revenue Hours with Overcrowding: 2% 0% 2% 0% 0% 1 of 209 Average Speed (km/h): 24.6 24.9 24.6 22.5 137 of 206
Service Changes Since December 2010- Spring 2011, Reduce freq from 10 to 12m during AM peak (M-F) & late night from 30 to 60m after 22hr (all days)- Summer 2012, Reduce AM/PM peak freq from 10 to 12m (M-F)- Spring 2015, Add one trip to Richmond-Brighouse Station on AM peak shoulder (M-F)
Std. BusRichmond
Route 402
Richmond
7.8
Ride
rshi
pU
tiliz
atio
nCo
st64

2015 2016 2015 2016 2015 2016 2015 2016 2015 2016 2015 2016
2015 2016 2015 2016 2015 2016 2015 2016 2015 2016 2015 2016
2015 2016 2015 2016 2015 2016 2015 2016 2015 2016 2015 2016
2015 2016
Mon
day-
Frid
ay
01:00 - 06:00
529 548 1 1 19 6 $3.77 11 / 2 9 / 3
15:00 - 18:00
2,971
Performance by Day of Week, Route 402 Data collected early Sept. to mid-Dec. of the given year
TimeAnnual Revenue
HoursAverage Trips per Clock Hour
Average Boardings per Revenue Hour
Average Boardings per Trip
Average Cost per Passenger
Average Peak Passenger LoadVehicle Type
(NB / SB)
09:00 - 15:00
2,962 3,018 3 3 64 75 32 31 $1.21 $1.45 30 / 24 24 / 22 Std. Bus Std. Bus
Std. Bus Std. Bus
06:00 - 09:00
2,471 2,617 5 5 54 61 24 24 $2.14 $2.17 34 / 9 34 / 8 Std. Bus Std. Bus
18:00 - 21:00
1,425 1,510 3 3 54 52 22 21 $2.24 $2.35 8 / 32 7 / 28 Std. Bus Std. Bus
13 / 32 14 / 33 Std. Bus Std. Bus3,128 5 5 47 67 27 30 $1.65 $1.52
Std. Bus
Time Annual Revenue Hours
Average Trips per Clock Hour
Average Boardings per Revenue Hour
Average Boardings per Trip
Average Cost per Passenger
Average Peak Passenger LoadVehicle Type
(NB / SB)
$4.12 $4.05 4 / 18 3 / 15 Std. Bus21:00 - 01:00
775 819 2 2 28 32 12 12
06:00 - 09:00
144 153 2 2 32 66 17 24 $2.10 $1.57 21 / 9 28 / 10 Std. Bus Std. Bus
2015 2016
Satu
rday
01:00 - 06:00
27 $1.22 $1.63 24
18:00 - 21:00
211 225 2 2 34 54 18
/ 33 15 / 27 Std. Bus Std. Bus15:00 - 18:00
245 260 2 2 53 62 33
09:00 - 15:00
472 502 2 2 55 66 33 28 $1.19 $1.56 32 / 24 29 / 16 Std. Bus Std. Bus
Std. Bus Std. Bus
21:00 - 01:00
167 180 2 2 28 31 14 10 $2.58 $3.49 6 / 16 6 / 11 Std. Bus Std. Bus
21 $2.07 $1.89 10 / 21 12 / 23
2015 2016
Sund
ay/H
olid
ay
01:00 - 06:00
15:00 - 18:00
274 286 2
TimeAnnual Revenue
HoursAverage Trips per Clock Hour
Average Boardings per Revenue Hour
Average Boardings per Trip
Average Cost per Passenger
Average Peak Passenger LoadVehicle Type(NB / SB)
09:00 - 15:00
532 553 2 2 54 66 27 27 $1.40 $1.47 29 / 17 28 / 15 Std. Bus Std. Bus
06:00 - 09:00
120 138 1 1 34 37 16 14 $2.52 $2.61 19 / 8 15 / 10 Std. Bus Std. Bus
21 Std. Bus Std. Bus
21:00 - 01:00
205 211 2 2 17 27 8 10 $4.65 $5.28 5 / 10 4 / 9 Std. Bus Std. Bus
29 15 / 29 Std. Bus Std. Bus
18:00 - 21:00
246 254 2 2 27 45 16 17 $2.41 $4.25 8 / 21 7 /
2 54 63 28 27 $1.38 $2.02 18 /
Top 25% of all bus services High 25% of all bus services Low 25% of all bus services Bottom 25% of all bus services Above Guidelines#
65

Key CharacteristicsSub-region of Primary Service:
Predominant Vehicle Type: Bus Depot:
Contributes to FTN: NoAverage One-Way Trip Distance (km):
Cost & Performance2012 2013 2014 2015 2016 Rank (2016)
Annual APC Boardings: 1,922,000 1,757,000 1,760,000 1,719,000 1,839,000 44 of 214 Average Daily APC Boardings (Mon-Fri): 5,800 5,250 5,250 5,150 5,450 47 of 213
Average Daily APC Boardings (Sat): 4,250 4,200 4,250 4,100 4,550 36 of 174 Average Daily APC Boardings (Sun/Hol): 3,800 3,550 3,500 3,400 3,600 36 of 171
Annual Service Cost: $2,559,000 $2,702,000 $2,571,000 $2,654,000 $2,633,000 45 of 216 Annual Revenue Hours: 26,400 27,900 26,500 27,400 27,100 46 of 216
Cost per APC Boarded Passenger: $1.33 $1.54 $1.51 $1.54 $1.43 64 of 214 Average APC Boardings per Rev. Hour: 73 63 66 63 68 58 of 214
Average Peak Passenger Load: 29 29 29 29 28 45 of 210Average Peak Load Factor: 54% 48% 53% 56% 55% 44 of 210
Revenue Hours with Overcrowding: 4% 1% 3% 2% 3% 170 of 209 Average Speed (km/h): 22.7 22.7 22.8 21.9 143 of 206
Service Changes Since December 2010- Winter 2010, Reduce freq from 12 to 15m from 8-9:30hr & 15-18hr (Sat)- Spring 2011, Reduce freq AM peak SB/PM peak NB from 10 to 15m (M-F)- Summer 2011, Discontinue 03:56 & 04:29 trips (all days)- Summer 2012, Reduce freq to reflect demand (all days)- Spring 2014, Reduce freq from 20 to 30m from 20-22hr (M-F, Sat); 5-8hr (Sat, S/H); 19-22hr (S/H)- Fall 2015, Increase freq from 20 to 15m Sat 9-18hr; convert from articulated 60' bus to standard 40' bus Sat all-day
Std. BusRichmond
Route 403
Richmond
11.1
Ride
rshi
pU
tiliz
atio
nCo
st66
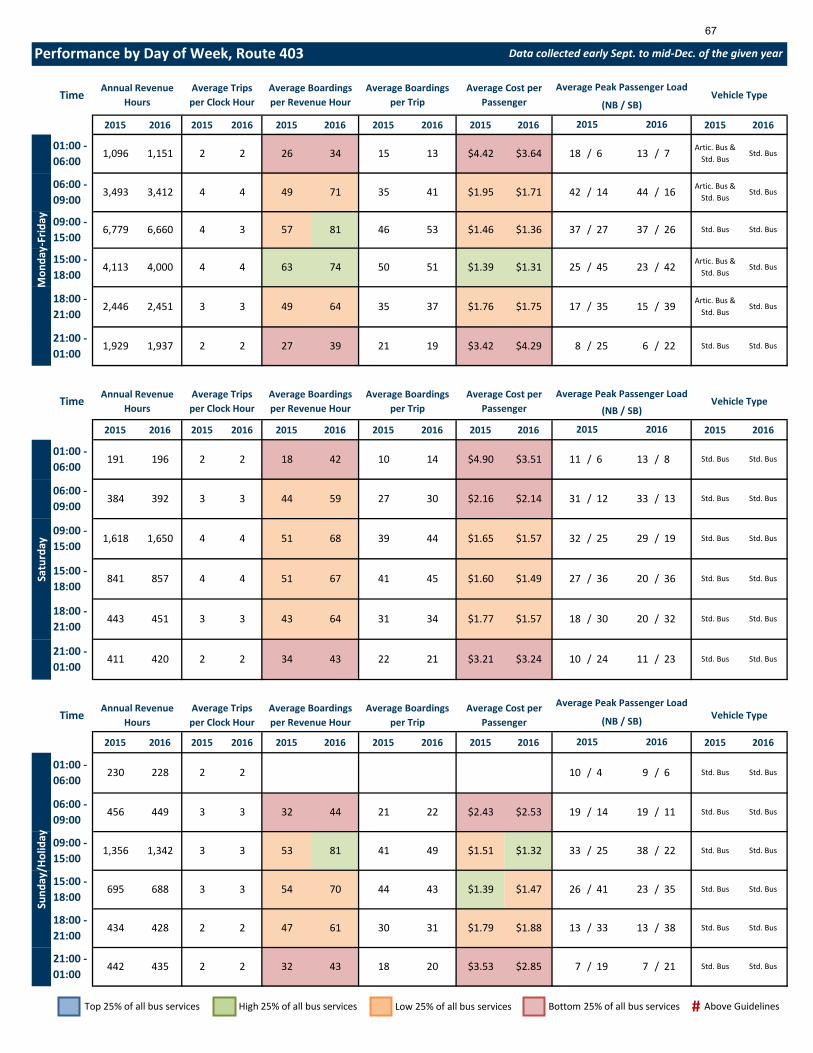
2015 2016 2015 2016 2015 2016 2015 2016 2015 2016 2015 2016
2015 2016 2015 2016 2015 2016 2015 2016 2015 2016 2015 2016
2015 2016 2015 2016 2015 2016 2015 2016 2015 2016 2015 2016
2015 2016
Mon
day-
Frid
ay
01:00 - 06:00
1,096 1,151 2 2 26 34 15 13 $4.42 $3.64 18 / 6 13 / 7
15:00 - 18:00
4,113
Performance by Day of Week, Route 403 Data collected early Sept. to mid-Dec. of the given year
TimeAnnual Revenue
HoursAverage Trips per Clock Hour
Average Boardings per Revenue Hour
Average Boardings per Trip
Average Cost per Passenger
Average Peak Passenger LoadVehicle Type
(NB / SB)
09:00 - 15:00
6,779 6,660 4 3 57 81 46 53 $1.46 $1.36 37 / 27 37 / 26 Std. Bus Std. Bus
Artic. Bus & Std. Bus
Std. Bus
06:00 - 09:00
3,493 3,412 4 4 49 71 35 41 $1.95 $1.71 42 / 14 44 / 16 Artic. Bus & Std. Bus
Std. Bus
18:00 - 21:00
2,446 2,451 3 3 49 64 35 37 $1.76 $1.75 17 / 35 15 / 39 Artic. Bus & Std. Bus
Std. Bus
25 / 45 23 / 42 Artic. Bus & Std. Bus
Std. Bus4,000 4 4 63 74 50 51 $1.39 $1.31
Std. Bus
Time Annual Revenue Hours
Average Trips per Clock Hour
Average Boardings per Revenue Hour
Average Boardings per Trip
Average Cost per Passenger
Average Peak Passenger LoadVehicle Type
(NB / SB)
$3.42 $4.29 8 / 25 6 / 22 Std. Bus21:00 - 01:00
1,929 1,937 2 2 27 39 21 19
Std. Bus Std. Bus
06:00 - 09:00
384 392 3 3 44 59 27 30 $2.16 $2.14 31 / 12 33 / 13 Std. Bus Std. Bus
2015 2016
Satu
rday
01:00 - 06:00
191 196 2 2 18 42 10 14 $4.90 $3.51 11 / 6 13 / 8
45 $1.60 $1.49 27
18:00 - 21:00
443 451 3 3 43 64 31
/ 36 20 / 36 Std. Bus Std. Bus15:00 - 18:00
841 857 4 4 51 67 41
09:00 - 15:00
1,618 1,650 4 4 51 68 39 44 $1.65 $1.57 32 / 25 29 / 19 Std. Bus Std. Bus
Std. Bus Std. Bus
21:00 - 01:00
411 420 2 2 34 43 22 21 $3.21 $3.24 10 / 24 11 / 23 Std. Bus Std. Bus
34 $1.77 $1.57 18 / 30 20 / 32
2015 2016
Sund
ay/H
olid
ay
01:00 - 06:00
230 228 2 2 10 / 4 9 / 6
15:00 - 18:00
695 688 3
TimeAnnual Revenue
HoursAverage Trips per Clock Hour
Average Boardings per Revenue Hour
Average Boardings per Trip
Average Cost per Passenger
Average Peak Passenger LoadVehicle Type(NB / SB)
09:00 - 15:00
1,356 1,342 3 3 53 81 41 49 $1.51 $1.32 33 / 25 38 / 22 Std. Bus Std. Bus
Std. Bus Std. Bus
06:00 - 09:00
456 449 3 3 32 44 21 22 $2.43 $2.53 19 / 14 19 / 11 Std. Bus Std. Bus
38 Std. Bus Std. Bus
21:00 - 01:00
442 435 2 2 32 43 18 20 $3.53 $2.85 7 / 19 7 / 21 Std. Bus Std. Bus
41 23 / 35 Std. Bus Std. Bus
18:00 - 21:00
434 428 2 2 47 61 30 31 $1.79 $1.88 13 / 33 13 /
3 54 70 44 43 $1.39 $1.47 26 /
Top 25% of all bus services High 25% of all bus services Low 25% of all bus services Bottom 25% of all bus services Above Guidelines#
67
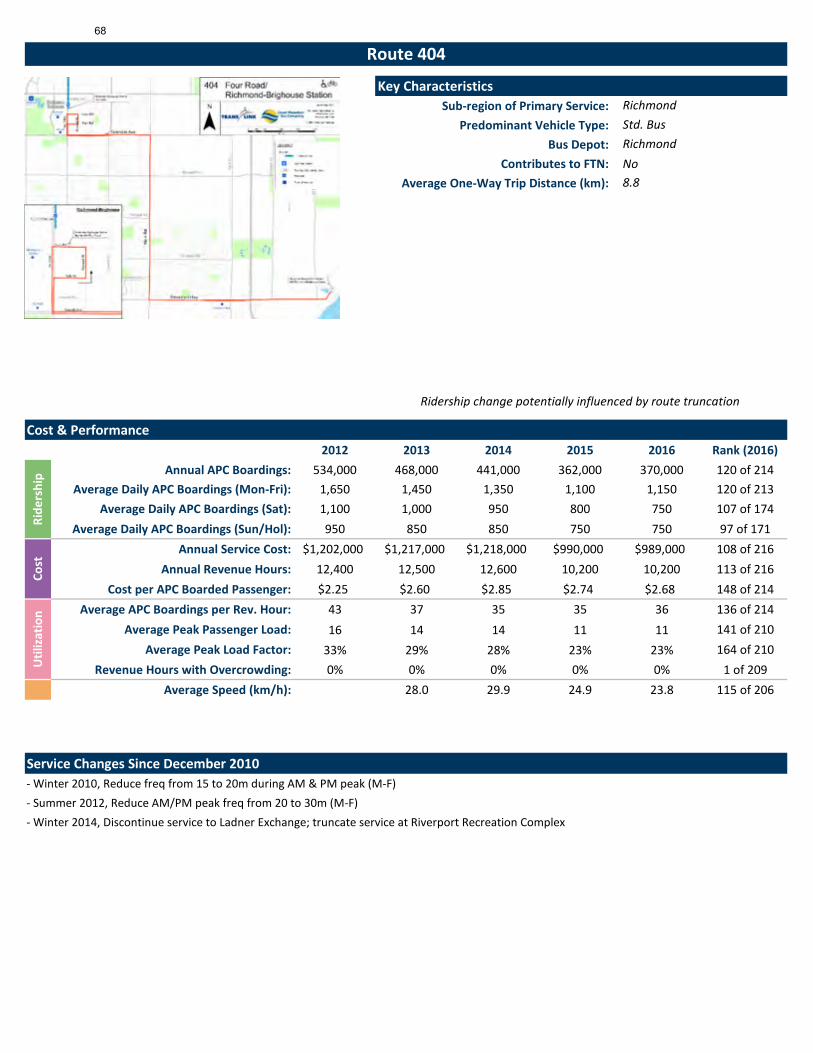
Key CharacteristicsSub-region of Primary Service:
Predominant Vehicle Type: Bus Depot:
Contributes to FTN: NoAverage One-Way Trip Distance (km):
Cost & Performance2012 2013 2014 2015 2016 Rank (2016)
Annual APC Boardings: 534,000 468,000 441,000 362,000 370,000 120 of 214 Average Daily APC Boardings (Mon-Fri): 1,650 1,450 1,350 1,100 1,150 120 of 213
Average Daily APC Boardings (Sat): 1,100 1,000 950 800 750 107 of 174 Average Daily APC Boardings (Sun/Hol): 950 850 850 750 750 97 of 171
Annual Service Cost: $1,202,000 $1,217,000 $1,218,000 $990,000 $989,000 108 of 216 Annual Revenue Hours: 12,400 12,500 12,600 10,200 10,200 113 of 216
Cost per APC Boarded Passenger: $2.25 $2.60 $2.85 $2.74 $2.68 148 of 214 Average APC Boardings per Rev. Hour: 43 37 35 35 36 136 of 214
Average Peak Passenger Load: 16 14 14 11 11 141 of 210Average Peak Load Factor: 33% 29% 28% 23% 23% 164 of 210
Revenue Hours with Overcrowding: 0% 0% 0% 0% 0% 1 of 209 Average Speed (km/h): 28.0 29.9 24.9 23.8 115 of 206
Service Changes Since December 2010- Winter 2010, Reduce freq from 15 to 20m during AM & PM peak (M-F)- Summer 2012, Reduce AM/PM peak freq from 20 to 30m (M-F)- Winter 2014, Discontinue service to Ladner Exchange; truncate service at Riverport Recreation Complex
Std. BusRichmond
Route 404
Richmond
8.8
Ridership change potentially influenced by route truncation
Ride
rshi
pU
tiliz
atio
nCo
st68

2015 2016 2015 2016 2015 2016 2015 2016 2015 2016 2015 2016
2015 2016 2015 2016 2015 2016 2015 2016 2015 2016 2015 2016
2015 2016 2015 2016 2015 2016 2015 2016 2015 2016 2015 2016
2015 2016
Mon
day-
Frid
ay
01:00 - 06:00
238 241 1 1 15 20 4 4 $5.06 $5.05 2 / 5 3 / 4
15:00 - 18:00
1,401
Performance by Day of Week, Route 404 Data collected early Sept. to mid-Dec. of the given year
TimeAnnual Revenue
HoursAverage Trips per Clock Hour
Average Boardings per Revenue Hour
Average Boardings per Trip
Average Cost per Passenger
Average Peak Passenger LoadVehicle Type
(EB / WB)
09:00 - 15:00
2,587 2,595 2 2 29 39 15 16 $2.89 $2.71 10 / 14 10 / 15 Std. Bus Std. Bus
Std. Bus Std. Bus
06:00 - 09:00
1,184 1,190 2 2 29 51 15 20 $2.93 $2.73 8 / 17 10 / 19 Std. Bus Std. Bus
18:00 - 21:00
1,263 1,234 2 2 20 35 12 14 $4.47 $4.03 16 / 5 15 / 5 Std. Bus Std. Bus
25 / 14 21 / 13 Std. Bus Std. Bus1,379 2 2 40 52 23 23 $2.28 $2.17
Std. Bus
Time Annual Revenue Hours
Average Trips per Clock Hour
Average Boardings per Revenue Hour
Average Boardings per Trip
Average Cost per Passenger
Average Peak Passenger LoadVehicle Type
(EB / WB)
$5.56 $5.45 7 / 3 8 / 4 Std. Bus21:00 - 01:00
741 773 1 1 16 21 8 7
Std. Bus Std. Bus
06:00 - 09:00
203 206 2 2 14 20 8 7 $4.48 $5.20 5 / 8 5 / 8 Std. Bus Std. Bus
2015 2016
Satu
rday
01:00 - 06:00
37 38 2 2 5 16 3 4 $9.83 $6.06 1 / 2 4 / 3
10 $2.87 $3.97 13
18:00 - 21:00
234 233 2 2 22 41 11
/ 9 10 / 8 Std. Bus Std. Bus15:00 - 18:00
251 257 2 2 29 25 14
09:00 - 15:00
475 481 2 2 25 25 13 10 $3.12 $5.02 9 / 13 4 / 11 Std. Bus Std. Bus
Std. Bus Std. Bus
21:00 - 01:00
128 137 1 1 16 22 7 7 $5.19 $5.30 6 / 4 6 / 5 Std. Bus Std. Bus
14 $3.28 $2.80 11 / 7 14 / 10
2015 2016
Sund
ay/H
olid
ay
01:00 - 06:00
24 24 1 1 7 2 $14.55 2 /
15:00 - 18:00
283 278 2
TimeAnnual Revenue
HoursAverage Trips per Clock Hour
Average Boardings per Revenue Hour
Average Boardings per Trip
Average Cost per Passenger
Average Peak Passenger LoadVehicle Type(EB / WB)
09:00 - 15:00
540 534 2 2 23 37 13 13 $3.16 $2.82 7 / 13 9 / 13 Std. Bus Std. Bus
Std. Bus Std. Bus
06:00 - 09:00
190 188 2 2 8 26 4 8 $5.36 2 / 6 3 / 10 Std. Bus Std. Bus
7 Std. Bus Std. Bus
21:00 - 01:00
171 157 1 2 16 21 9 7 $3.81 $4.56 7 / 8 6 / 4 Std. Bus Std. Bus
9 14 / 9 Std. Bus Std. Bus
18:00 - 21:00
256 253 2 2 21 28 13 10 $2.93 $4.58 14 / 7 9 /
2 24 41 14 15 $2.83 $2.86 14 /
Top 25% of all bus services High 25% of all bus services Low 25% of all bus services Bottom 25% of all bus services Above Guidelines#
69
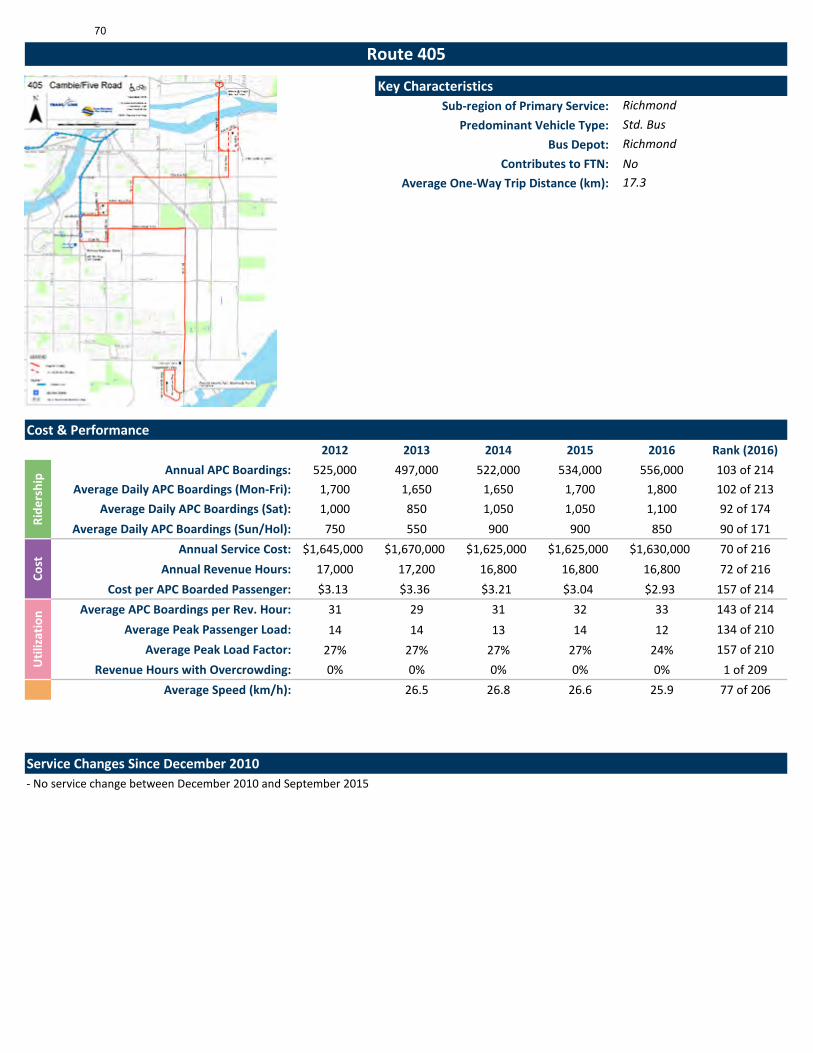
Key CharacteristicsSub-region of Primary Service:
Predominant Vehicle Type: Bus Depot:
Contributes to FTN: NoAverage One-Way Trip Distance (km):
Cost & Performance2012 2013 2014 2015 2016 Rank (2016)
Annual APC Boardings: 525,000 497,000 522,000 534,000 556,000 103 of 214 Average Daily APC Boardings (Mon-Fri): 1,700 1,650 1,650 1,700 1,800 102 of 213
Average Daily APC Boardings (Sat): 1,000 850 1,050 1,050 1,100 92 of 174 Average Daily APC Boardings (Sun/Hol): 750 550 900 900 850 90 of 171
Annual Service Cost: $1,645,000 $1,670,000 $1,625,000 $1,625,000 $1,630,000 70 of 216 Annual Revenue Hours: 17,000 17,200 16,800 16,800 16,800 72 of 216
Cost per APC Boarded Passenger: $3.13 $3.36 $3.21 $3.04 $2.93 157 of 214 Average APC Boardings per Rev. Hour: 31 29 31 32 33 143 of 214
Average Peak Passenger Load: 14 14 13 14 12 134 of 210Average Peak Load Factor: 27% 27% 27% 27% 24% 157 of 210
Revenue Hours with Overcrowding: 0% 0% 0% 0% 0% 1 of 209 Average Speed (km/h): 26.5 26.8 26.6 25.9 77 of 206
Service Changes Since December 2010- No service change between December 2010 and September 2015
Std. BusRichmond
Route 405
Richmond
17.3
Ride
rshi
pU
tiliz
atio
nCo
st70

2015 2016 2015 2016 2015 2016 2015 2016 2015 2016 2015 2016
2015 2016 2015 2016 2015 2016 2015 2016 2015 2016 2015 2016
2015 2016 2015 2016 2015 2016 2015 2016 2015 2016 2015 2016
2015 2016
Mon
day-
Frid
ay
01:00 - 06:00
350 351 2 2 21 27 21 19 $3.20 $3.54 12 / 11 /
15:00 - 18:00
2,729
Performance by Day of Week, Route 405 Data collected early Sept. to mid-Dec. of the given year
TimeAnnual Revenue
HoursAverage Trips per Clock Hour
Average Boardings per Revenue Hour
Average Boardings per Trip
Average Cost per Passenger
Average Peak Passenger LoadVehicle Type
(NB / SB)
09:00 - 15:00
4,679 4,698 2 2 27 36 27 28 $2.79 $2.86 13 / 14 12 / 12 Std. Bus Std. Bus
Std. Bus Std. Bus
06:00 - 09:00
2,563 2,568 2 2 37 48 36 37 $2.30 $2.11 16 / 21 15 / 20 Std. Bus Std. Bus
18:00 - 21:00
1,679 1,686 2 2 20 21 16 13 $4.23 $5.21 9 / 9 6 / 7 Std. Bus Std. Bus
17 / 20 16 / 17 Std. Bus Std. Bus2,740 2 2 36 45 38 40 $2.34 $2.21
Std. Bus
Time Annual Revenue Hours
Average Trips per Clock Hour
Average Boardings per Revenue Hour
Average Boardings per Trip
Average Cost per Passenger
Average Peak Passenger LoadVehicle Type
(NB / SB)
$5.05 $5.33 7 / 4 5 / 4 Std. Bus21:00 - 01:00
667 669 1 1 14 18 7 6
06:00 - 09:00
242 245 2 2 23 27 18 16 $3.82 $3.70 9 / 10 7 / 9 Std. Bus Std. Bus
2015 2016
Satu
rday
01:00 - 06:00
24 $3.65 $3.39 10
18:00 - 21:00
302 308 2 2 14 24 11
/ 11 8 / 15 Std. Bus Std. Bus15:00 - 18:00
506 504 2 2 22 32 21
09:00 - 15:00
888 916 2 2 22 32 21 23 $3.42 $3.08 11 / 12 11 / 12 Std. Bus Std. Bus
Std. Bus Std. Bus
21:00 - 01:00
98 100 1 1 12 16 7 4 $5.67 $8.56 6 / 3 6 / 1 Std. Bus Std. Bus
13 $5.49 $4.20 6 / 7 6 / 7
2015 2016
Sund
ay/H
olid
ay
01:00 - 06:00
15:00 - 18:00
529 522 2
TimeAnnual Revenue
HoursAverage Trips per Clock Hour
Average Boardings per Revenue Hour
Average Boardings per Trip
Average Cost per Passenger
Average Peak Passenger LoadVehicle Type(NB / SB)
09:00 - 15:00
988 971 2 2 24 29 23 20 $3.02 $3.51 15 / 12 10 / 10 Std. Bus Std. Bus
06:00 - 09:00
156 153 2 2 22 28 15 16 $3.77 $4.05 9 / 7 6 / 13 Std. Bus Std. Bus
3 Std. Bus Std. Bus
21:00 - 01:00
120 117 1 1 9 5 $7.16 5 / 4 7 / Std. Bus Std. Bus
11 8 / 2 Std. Bus Std. Bus
18:00 - 21:00
257 253 1 1 16 18 11 9 $5.56 $6.78 7 / 5 7 /
2 16 19 17 14 $4.16 $8.10 9 /
Top 25% of all bus services High 25% of all bus services Low 25% of all bus services Bottom 25% of all bus services Above Guidelines#
71
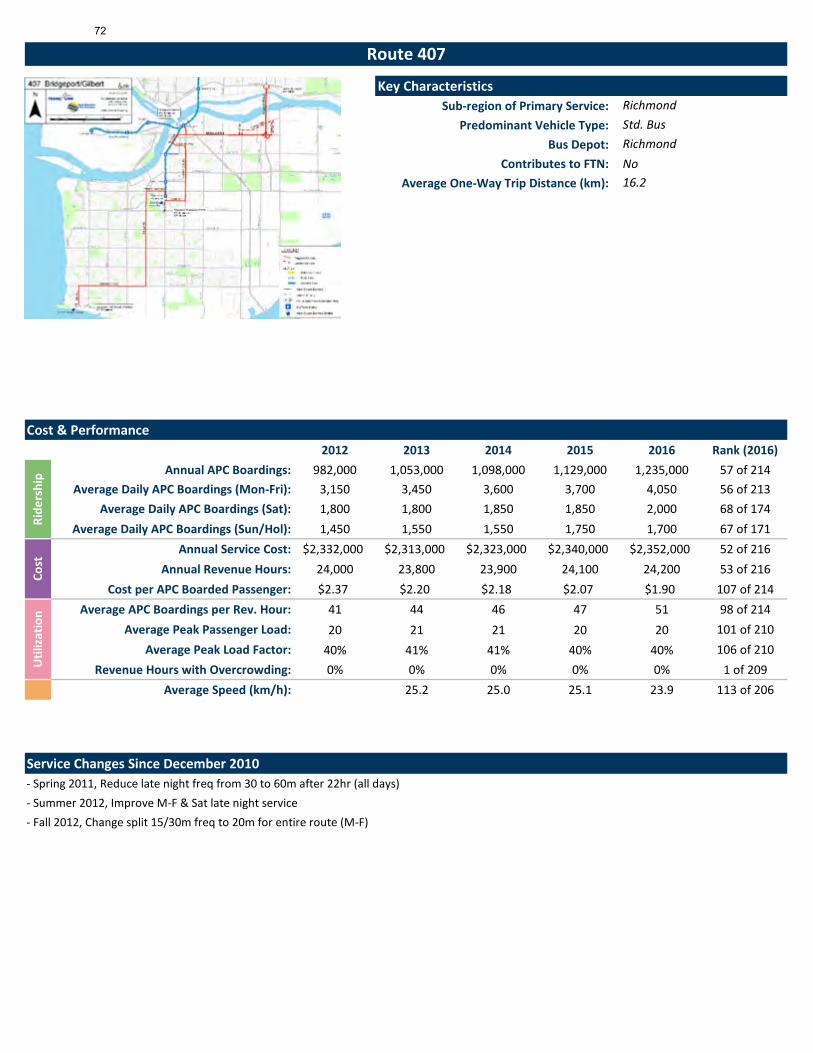
Key CharacteristicsSub-region of Primary Service:
Predominant Vehicle Type: Bus Depot:
Contributes to FTN: NoAverage One-Way Trip Distance (km):
Cost & Performance2012 2013 2014 2015 2016 Rank (2016)
Annual APC Boardings: 982,000 1,053,000 1,098,000 1,129,000 1,235,000 57 of 214 Average Daily APC Boardings (Mon-Fri): 3,150 3,450 3,600 3,700 4,050 56 of 213
Average Daily APC Boardings (Sat): 1,800 1,800 1,850 1,850 2,000 68 of 174 Average Daily APC Boardings (Sun/Hol): 1,450 1,550 1,550 1,750 1,700 67 of 171
Annual Service Cost: $2,332,000 $2,313,000 $2,323,000 $2,340,000 $2,352,000 52 of 216 Annual Revenue Hours: 24,000 23,800 23,900 24,100 24,200 53 of 216
Cost per APC Boarded Passenger: $2.37 $2.20 $2.18 $2.07 $1.90 107 of 214 Average APC Boardings per Rev. Hour: 41 44 46 47 51 98 of 214
Average Peak Passenger Load: 20 21 21 20 20 101 of 210Average Peak Load Factor: 40% 41% 41% 40% 40% 106 of 210
Revenue Hours with Overcrowding: 0% 0% 0% 0% 0% 1 of 209 Average Speed (km/h): 25.2 25.0 25.1 23.9 113 of 206
Service Changes Since December 2010- Spring 2011, Reduce late night freq from 30 to 60m after 22hr (all days)- Summer 2012, Improve M-F & Sat late night service- Fall 2012, Change split 15/30m freq to 20m for entire route (M-F)
Std. BusRichmond
Route 407
Richmond
16.2
Ride
rshi
pU
tiliz
atio
nCo
st72

2015 2016 2015 2016 2015 2016 2015 2016 2015 2016 2015 2016
2015 2016 2015 2016 2015 2016 2015 2016 2015 2016 2015 2016
2015 2016 2015 2016 2015 2016 2015 2016 2015 2016 2015 2016
2015 2016
Mon
day-
Frid
ay
01:00 - 06:00
725 791 1 2 13 26 10 14 $8.74 $5.43 11 / 2 20 / 4
15:00 - 18:00
4,605
Performance by Day of Week, Route 407 Data collected early Sept. to mid-Dec. of the given year
TimeAnnual Revenue
HoursAverage Trips per Clock Hour
Average Boardings per Revenue Hour
Average Boardings per Trip
Average Cost per Passenger
Average Peak Passenger LoadVehicle Type
(NB / SB)
09:00 - 15:00
5,031 5,033 2 2 42 54 39 41 $1.90 $1.85 23 / 21 22 / 18 Hwy. Coach & Std. Bus
Std. Bus
Std. Bus Std. Bus
06:00 - 09:00
4,108 4,023 3 3 50 72 53 62 $1.65 $1.48 30 / 18 31 / 18 Std. Bus Std. Bus
18:00 - 21:00
2,609 2,621 2 2 36 47 33 37 $2.54 $2.17 10 / 24 11 / 26 Std. Bus Std. Bus
22 / 31 21 / 32 Std. Bus Std. Bus4,685 3 3 49 64 58 66 $1.83 $1.56
Std. Bus
Time Annual Revenue Hours
Average Trips per Clock Hour
Average Boardings per Revenue Hour
Average Boardings per Trip
Average Cost per Passenger
Average Peak Passenger LoadVehicle Type
(NB / SB)
$3.85 $3.46 8 / 16 8 / 13 Std. Bus21:00 - 01:00
2,108 2,116 2 2 27 33 22 23
Std. Bus Std. Bus
06:00 - 09:00
249 255 2 2 25 36 19 21 $3.12 $3.05 14 / 8 12 / 8 Std. Bus Std. Bus
2015 2016
Satu
rday
01:00 - 06:00
19 19 1 1
29 $2.55 $2.27 12
18:00 - 21:00
405 414 2 2 27 43 20
/ 19 16 / 18 Std. Bus Std. Bus15:00 - 18:00
412 420 2 2 31 45 27
09:00 - 15:00
831 842 2 2 32 48 29 32 $2.35 $2.21 19 / 15 24 / 13 Std. Bus Std. Bus
Std. Bus Std. Bus
21:00 - 01:00
428 438 2 2 24 32 20 22 $3.72 $3.82 8 / 14 7 / 15 Std. Bus Std. Bus
28 $3.23 $2.42 9 / 17 12 / 21
2015 2016
Sund
ay/H
olid
ay
01:00 - 06:00
23 23 1 1
15:00 - 18:00
472 508 2
TimeAnnual Revenue
HoursAverage Trips per Clock Hour
Average Boardings per Revenue Hour
Average Boardings per Trip
Average Cost per Passenger
Average Peak Passenger LoadVehicle Type(NB / SB)
09:00 - 15:00
893 868 2 2 43 46 32 29 $1.94 $2.27 21 / 19 20 / 13 Std. Bus Std. Bus
Std. Bus Std. Bus
06:00 - 09:00
192 190 1 1 28 45 27 24 $2.37 $3.70 24 / 10 22 / 8 Std. Bus Std. Bus
17 Std. Bus Std. Bus
21:00 - 01:00
506 485 2 2 21 17 $3.71 6 / 12 10 / 14 Std. Bus Std. Bus
25 12 / 15 Std. Bus Std. Bus
18:00 - 21:00
513 517 2 2 29 37 22 27 $3.34 $2.71 8 / 20 8 /
2 37 42 30 28 $2.40 $2.07 11 /
Top 25% of all bus services High 25% of all bus services Low 25% of all bus services Bottom 25% of all bus services Above Guidelines#
73

Key CharacteristicsSub-region of Primary Service:
Predominant Vehicle Type: Bus Depot:
Contributes to FTN: YesAverage One-Way Trip Distance (km):
Cost & Performance2012 2013 2014 2015 2016 Rank (2016)
Annual APC Boardings: 5,375,000 5,690,000 5,838,000 5,982,000 5,847,000 11 of 214 Average Daily APC Boardings (Mon-Fri): 16,600 17,600 18,200 18,550 18,000 11 of 213
Average Daily APC Boardings (Sat): 11,100 12,400 12,700 12,900 12,600 13 of 174 Average Daily APC Boardings (Sun/Hol): 9,900 10,150 10,050 10,800 10,700 12 of 171
Annual Service Cost: $7,777,000 $8,053,000 $8,063,000 $8,334,000 $8,461,000 4 of 216 Annual Revenue Hours: 80,200 83,000 83,100 85,900 87,200 4 of 216
Cost per APC Boarded Passenger: $1.45 $1.42 $1.42 $1.39 $1.45 67 of 214 Average APC Boardings per Rev. Hour: 67 69 70 70 67 62 of 214
Average Peak Passenger Load: 37 37 39 37 32 24 of 210Average Peak Load Factor: 73% 74% 77% 73% 63% 19 of 210
Revenue Hours with Overcrowding: 5% 5% 13% 4% 1% 160 of 209 Average Speed (km/h): 29.0 28.9 28.6 27.6 55 of 206
Service Changes Since December 2010- Spring 2012, Increase AM & midday freq: WB from 7-8 to 6-7m; EB from 12 to 10m (M-F)- Spring 2012, Reduce AM freq from 15 to 20m from 6-7hr (Sat) & 6-8hr (S/H)- Summer 2012, Improve AM & PM peak freq; adjust WB to service Fraserwood in the PM peak (M-F)- Winter 2012, Increase freq from 12 to 10m from 9-15hr (M-F)- Winter 2014, Increase freq from 12 to 10m from 10-19hr (Sat) & 9-19hr (S/H)- Spring 2015, Add one trip departing 22nd St. Station on PM peak shoulder (M-F)- Spring 2016, Add one bus during AM & PM peak for Pattullo Bridge Rehabilitation (M-F)- Fall 2016, End of Pattullo Bridge Rehabilitation; return to regular service levels (remove one bus during AM & PM peak)
Std. Bus
24.8
Hamilton
Route 410
Richmond
Ride
rshi
pCo
stU
tiliz
atio
n74

2015 2016 2015 2016 2015 2016 2015 2016 2015 2016 2015 2016
2015 2016 2015 2016 2015 2016 2015 2016 2015 2016 2015 2016
2015 2016 2015 2016 2015 2016 2015 2016 2015 2016 2015 2016
$1.37 $1.43 35 / 38 33 / 36 Std. Bus Std. Bus
$4.10 9$3.62
/ 32 31 /
2016
Satu
rday
Sund
ay/H
olid
ay
Vehicle Type
09:00 - 15:00
6 6
Time
21:00 - 01:00
Average Boardings per Trip
12 /12 / 16
39
6 51 73
62
6 62 70 80 80
Std. Bus
09:00 - 15:00
4,529 4,449 6 6 61 65 73
2,307 615:00 - 18:00
2,375
$1.40 $1.48 33
4,161
19
4 56
201:00 - 06:00
06:00 - 09:00
70 59
18:00 - 21:00
16,480
01:00 - 06:00
3,204
15,628
/
4553 51
15
62
29 Std. Bus
34 Std. Bus
/ 32 28 /
/
8 /
18:00 - 21:00
1,150 1,194 4 63
4
2 2 26
4 4806:00 - 09:00
1,122 1,107
01:00 - 06:00
305 317 18
Annual Revenue Hours
Average Trips per Clock Hour
Average Boardings per Revenue Hour
2016
Std. Bus
36 31 /
2015
38
21
37 34 Std. Bus/
28 / 145 38
66
68
77 $1.65 $1.35 28
20
23
1,116 1,141 4
4
214
751 2 3 54
15:00 - 18:00
74
30
$1.49
$1.33
$1.47
$3.47
Average Peak Passenger Load
28
28
Average Cost per Passenger
Average Peak Passenger Load
30
/
46 /
20162015
15:00 - 18:00
6,270 56 67
21:00 - 01:00
3,221 3,307 2
Time
Std. Bus
Std. Bus/ 31
36
23
86 81 $1.31
34
09:00 - 15:00
22,025
06:00 - 09:00
6765
22,271 6 7
10 11
Std. Bus/ 37 Std. Bus
/ 29 Std. BusStd. Bus38
45 36
4
19/
Annual Revenue Hours
Average Trips per Clock Hour
Average Boardings per Revenue Hour
Average Boardings per Trip
$1.49 /
61
27 Std. Bus
56 Std. Bus
4,300 6
18
$2.27 $2.26
61 $1.3982
$1.49
40
$1.50 $1.42
3 46 49 45
TimeAnnual Revenue
HoursAverage Trips per Clock Hour
Average Boardings per Revenue Hour
Average Boardings per Trip
Average Cost per Passenger
Average Peak Passenger Load
$2.92$2.59
Vehicle Type(EB / WB)
Data collected early Sept. to mid-Dec. of the given yearPerformance by Day of Week, Route 410
3,734 3 37 22
Mon
day-
Frid
ay
71
61 35
(EB / WB)
2015
Std. Bus
40 /
Std. Bus
27/ Std. Bus24 /
Std. Bus
Std. Bus
(EB / WB)
Std. Bus
31 30 / 27 Std. Bus
/ 31 25
30 /
27 /
Vehicle Type
Std. Bus Std. Bus
14,854 15,421 8 9 73 69 $1.24
241 1 24 27
Average Cost per Passenger
6 60
$1.36
$1.52546,809
103 90
52 48 44 $1.93
$1.49
Std. Bus
712
1,964 2,027 72 74
$1.94
3731 /
Std. Bus/3 38 42 $2.83 Std. Bus22$2.65 24 /33 31 18
/ 26 43 /$1.91 $1.37
24
28
48 68 25
21:00 - 01:00
780 807 2
18:00 - 21:00
1,436 1,417 4 4 49 73 Std. Bus30 Std. Bus
28
60
32 Std. Bus
$1.56
Std. Bus Std. Bus
Std. Bus
$1.77 $1.98 / 29 18 / 24
Std. Bus11 14 / 11 Std. Bus
Std. Bus
Top 25% of all bus services High 25% of all bus services Low 25% of all bus services Bottom 25% of all bus services Above Guidelines#
75

Key CharacteristicsSub-region of Primary Service:
Predominant Vehicle Type: Bus Depot:
Contributes to FTN: NoAverage One-Way Trip Distance (km):
Cost & Performance2012 2013 2014 2015 2016 Rank (2016)
Annual APC Boardings: 1,243,000 1,222,000 1,216,000 1,273,000 1,462,000 52 of 214 Average Daily APC Boardings (Mon-Fri): 3,750 3,700 3,750 3,950 4,550 52 of 213
Average Daily APC Boardings (Sat): 2,850 2,850 2,800 2,900 3,050 49 of 174 Average Daily APC Boardings (Sun/Hol): 2,500 2,350 2,100 2,200 2,550 49 of 171
Annual Service Cost: $1,951,000 $1,935,000 $1,940,000 $1,942,000 $1,955,000 56 of 216 Annual Revenue Hours: 20,100 19,900 20,000 20,000 20,200 58 of 216
Cost per APC Boarded Passenger: $1.57 $1.58 $1.64 $1.53 $1.34 56 of 214 Average APC Boardings per Rev. Hour: 62 61 61 64 73 51 of 214
Average Peak Passenger Load: 31 32 32 34 35 15 of 210Average Peak Load Factor: 61% 63% 65% 69% 70% 11 of 210
Revenue Hours with Overcrowding: 1% 1% 1% 1% 9% 191 of 209 Average Speed (km/h): 23.8 24.1 23.7 21.8 146 of 206
Service Changes Since December 2010- No service change between December 2010 and September 2015
Std. BusHamilton
Route 430
Richmond
15.2
Ride
rshi
pCo
stU
tiliz
atio
n76

2015 2016 2015 2016 2015 2016 2015 2016 2015 2016 2015 2016
2015 2016 2015 2016 2015 2016 2015 2016 2015 2016 2015 2016
2015 2016 2015 2016 2015 2016 2015 2016 2015 2016 2015 2016
2015 2016
Mon
day-
Frid
ay
01:00 - 06:00
163 163 1 1 59 128 Std. Bus Std. Bus
$1.20 $1.13 33 / 51 31 / 56 Std. Bus Std. Bus
53 83 $1.19 $0.75 / 44 / 60
Performance by Day of Week, Route 430 Data collected early Sept. to mid-Dec. of the given year
TimeAnnual Revenue
HoursAverage Trips per Clock Hour
Average Boardings per Revenue Hour
Average Boardings per Trip
Average Cost per Passenger
Average Peak Passenger LoadVehicle Type
(EB / WB)
06:00 - 09:00
09:00 - 15:00
5,439 5,457 3 3 53 73 54 58 $1.46 $1.37 32 / 35 31 / 32 Std. Bus Std. Bus
15:00 - 18:00
4,008 4,074 3 3 62 75 66 67 $1.32 $1.31 43 / 38 42 / 39 Std. Bus Std. Bus
2,992 3,014 3 3 64 89 62 65
18:00 - 21:00
2,392 2,383 2 2 47 62 41 45
346 364 1 2 37 57 27 33
$1.82 $1.73 29 / 26 26 / 30 Std. Bus Std. Bus
Std. Bus
Time Annual Revenue Hours
Average Trips per Clock Hour
Average Boardings per Revenue Hour
Average Boardings per Trip
Average Cost per Passenger
Average Peak Passenger LoadVehicle Type
(EB / WB)
$2.55 $1.55 21 / 16 25 / 26 Std. Bus21:00 - 01:00
2015 2016
Satu
rday
01:00 - 06:00
59 $1.50 $1.47 37
06:00 - 09:00
304 310 2 2 41 62 36 39 $1.86 $1.62 20 / 34 21 / 36 Std. Bus Std. Bus
09:00 - 15:00
954 990 2 2 53 67 54 53 $1.46 $1.51 35 / 37 35 / 34 Std. Bus Std. Bus
15:00 - 18:00
554 554 2 2 59 71 54 / 35 38 / 36 Std. Bus Std. Bus
18:00 - 21:00
431 439 2 2 37 59 34 40 $1.99 $1.82 22 / 27 25 / 27 Std. Bus Std. Bus
21:00 - 01:00
32 33 1 1 49 31 $1.96 / 25 Std. Bus Std. Bus
TimeAnnual Revenue
HoursAverage Trips per Clock Hour
Average Boardings per Revenue Hour
Average Boardings per Trip
Average Cost per Passenger
Average Peak Passenger LoadVehicle Type(EB / WB)
2015 2016
Sund
ay/H
olid
ay
01:00 - 06:00
15:00 - 18:00
574 565 2
06:00 - 09:00
244 240 2 2 35 70 32 45 $2.13 $1.40 15 / 30 28 / 31 Std. Bus Std. Bus
34 /
09:00 - 15:00
1,132 1,114 2 2 49 71 45 53 $1.68 $1.41 30 / 27 31 / 33 Std. Bus Std. Bus
18:00 - 21:00
457 449 2 2 37 65 33 42 $2.03 $1.84 20 / 29 20 /
2 58 72 51 54 $1.46 $1.38 33 34 / 39 Std. Bus Std. Bus
38 Std. Bus Std. Bus
21:00 - 01:00
Top 25% of all bus services High 25% of all bus services Low 25% of all bus services Bottom 25% of all bus services Above Guidelines#
77

Key CharacteristicsSub-region of Primary Service:
Predominant Vehicle Type: Bus Depot:
Contributes to FTN: NoAverage One-Way Trip Distance (km):
Cost & Performance2012 2013 2014 2015 2016 Rank (2016)
Annual APC Boardings: 1,076,000 1,031,000 1,035,000 975,000 956,000 72 of 214 Average Daily APC Boardings (Mon-Fri): 4,250 4,100 4,150 3,900 3,800 60 of 213
Average Daily APC Boardings (Sat): Average Daily APC Boardings (Sun/Hol):
Annual Service Cost: $2,036,000 $2,107,000 $2,107,000 $2,107,000 $1,716,000 66 of 216 Annual Revenue Hours: 21,000 21,700 21,700 21,700 17,700 68 of 216
Cost per APC Boarded Passenger: $1.89 $2.04 $2.10 $2.16 $1.79 94 of 214 Average APC Boardings per Rev. Hour: 51 47 48 45 54 86 of 214
Average Peak Passenger Load: 39 35 36 33 29 40 of 210Average Peak Load Factor: 51% 47% 50% 49% 49% 66 of 210
Revenue Hours with Overcrowding: 0% 7% 7% 5% 0% 1 of 209 Average Speed (km/h): 30.3 29.9 29.5 28.9 43 of 206
Service Changes Since December 2010- Spring 2011, Terminate all trips at Bridgeport Stn- Summer 2016, Adjust stopping procedure to make consistent with #43 and improve travel times
Cost
Ride
rshi
p
Decrease in Annual Revenue Hours in 2016 due to revised methodology, which better reflects seasonal service adjustments
Util
izat
ion
14.7
RichmondStd. BusRichmond
Route 48078

2015 2016 2015 2016 2015 2016 2015 2016 2015 2016 2015 2016
2015 2016 2015 2016 2015 2016 2015 2016 2015 2016 2015 2016
2015 2016 2015 2016 2015 2016 2015 2016 2015 2016 2015 2016
21:00 - 01:00
18:00 - 21:00
06:00 - 09:00
2015 2016
Sund
ay/H
olid
ay
01:00 - 06:00
15:00 - 18:00
TimeAnnual Revenue
HoursAverage Trips per Clock Hour
Average Boardings per Revenue Hour
Average Boardings per Trip
Average Cost per Passenger
Average Peak Passenger LoadVehicle Type(EB / WB)
09:00 - 15:00
21:00 - 01:00
15:00 - 18:00
09:00 - 15:00
06:00 - 09:00
(EB / WB)
2015 2016
Satu
rday
01:00 - 06:00
Time Annual Revenue Hours
Average Trips per Clock Hour
Average Boardings per Revenue Hour
Average Boardings per Trip
Average Cost per Passenger
Average Peak Passenger LoadVehicle Type
18:00 - 21:00
18:00 - 21:00
2,446 1,888 3 3 40 42 28 25 $3.09 $2.47 35 / 8 30 / 7 Artic. Bus & Std. Bus
Std. Bus & Artic. Bus
$2.48 $2.11 48 / 11 40 / 11 Artic. Bus & Std. Bus
15:00 - 18:00
5,676 4,546 6 6 41 47 39 34
06:00 - 09:00
4,300 3,360 5 4 47 56 42 37 $2.60 $2.31 10 / 60 10 / 49 Artic. Bus & Std. Bus
21:00 - 01:00
275 163 2 2 64 50 35 27 $1.52 $1.15 29 / 23 / Artic. Bus & Std. Bus
Std. Bus
Std. Bus & Artic. Bus
(EB / WB)
2015 2016
Mon
day-
Frid
ay
01:00 - 06:00
Performance by Day of Week, Route 480 Data collected early Sept. to mid-Dec. of the given year
TimeAnnual Revenue
HoursAverage Trips per Clock Hour
Average Boardings per Revenue Hour
Average Boardings per Trip
Average Cost per Passenger
Average Peak Passenger LoadVehicle Type
Std. Bus & Artic. Bus
09:00 - 15:00
9,020 7,730 5 5 43 50 35 33 $2.22 $2.10 21 / 33 20 / 31 Artic. Bus & Std. Bus
Std. Bus & Artic. Bus
Top 25% of all bus services High 25% of all bus services Low 25% of all bus services Bottom 25% of all bus services Above Guidelines#
79
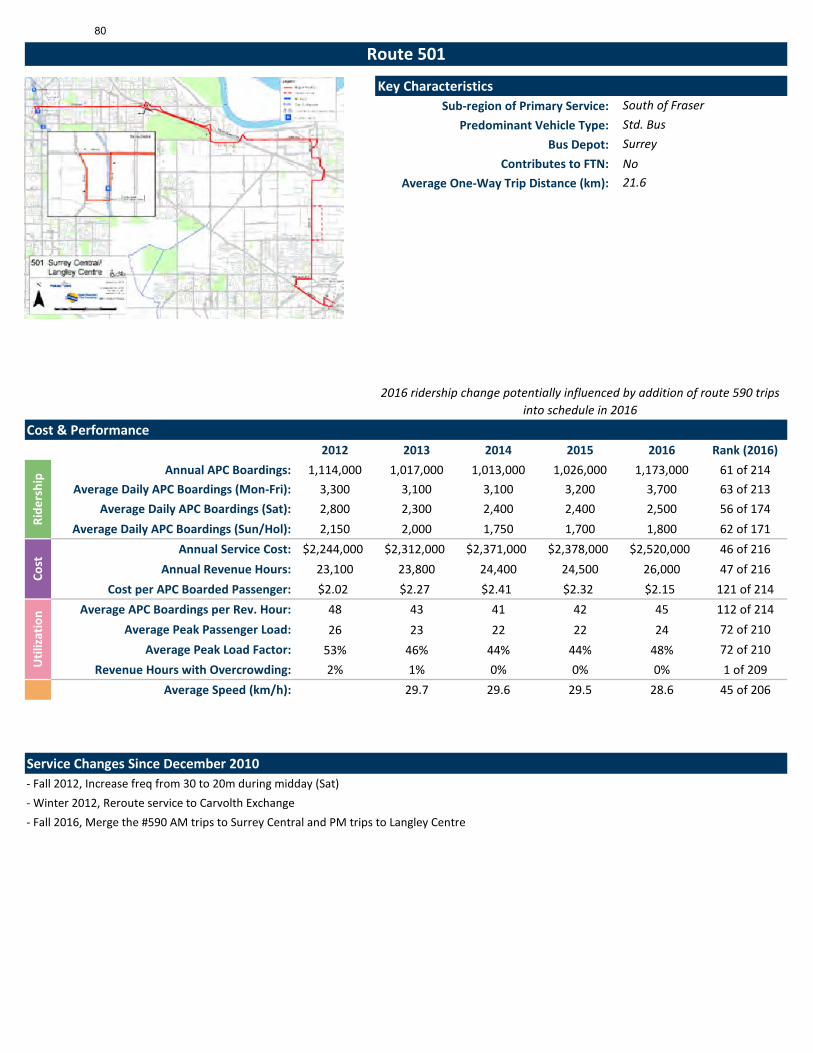
Key CharacteristicsSub-region of Primary Service:
Predominant Vehicle Type: Bus Depot:
Contributes to FTN: NoAverage One-Way Trip Distance (km):
Cost & Performance2012 2013 2014 2015 2016 Rank (2016)
Annual APC Boardings: 1,114,000 1,017,000 1,013,000 1,026,000 1,173,000 61 of 214 Average Daily APC Boardings (Mon-Fri): 3,300 3,100 3,100 3,200 3,700 63 of 213
Average Daily APC Boardings (Sat): 2,800 2,300 2,400 2,400 2,500 56 of 174 Average Daily APC Boardings (Sun/Hol): 2,150 2,000 1,750 1,700 1,800 62 of 171
Annual Service Cost: $2,244,000 $2,312,000 $2,371,000 $2,378,000 $2,520,000 46 of 216 Annual Revenue Hours: 23,100 23,800 24,400 24,500 26,000 47 of 216
Cost per APC Boarded Passenger: $2.02 $2.27 $2.41 $2.32 $2.15 121 of 214 Average APC Boardings per Rev. Hour: 48 43 41 42 45 112 of 214
Average Peak Passenger Load: 26 23 22 22 24 72 of 210Average Peak Load Factor: 53% 46% 44% 44% 48% 72 of 210
Revenue Hours with Overcrowding: 2% 1% 0% 0% 0% 1 of 209 Average Speed (km/h): 29.7 29.6 29.5 28.6 45 of 206
Service Changes Since December 2010- Fall 2012, Increase freq from 30 to 20m during midday (Sat)- Winter 2012, Reroute service to Carvolth Exchange- Fall 2016, Merge the #590 AM trips to Surrey Central and PM trips to Langley Centre
Cost
Ride
rshi
pU
tiliz
atio
n
2016 ridership change potentially influenced by addition of route 590 trips into schedule in 2016
21.6
Std. BusSurrey
Route 501
South of Fraser
80
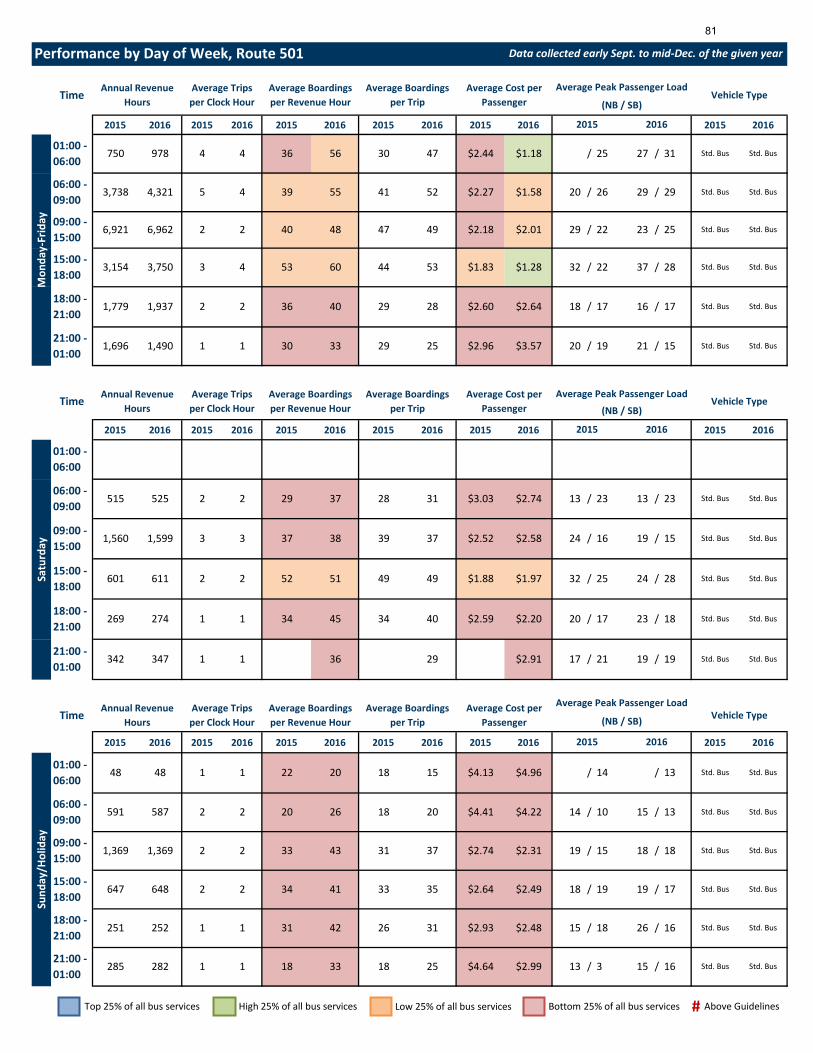
2015 2016 2015 2016 2015 2016 2015 2016 2015 2016 2015 2016
2015 2016 2015 2016 2015 2016 2015 2016 2015 2016 2015 2016
2015 2016 2015 2016 2015 2016 2015 2016 2015 2016 2015 2016
/
2 34 41 33 35 $2.64 $2.49 18 /
2 2 20 26 18 20 $4.41 $4.22 14 / 10 15 / 13 Std. Bus Std. Bus
16 Std. Bus Std. Bus
21:00 - 01:00
285 282 1 1 18 33 18 25 $4.64 $2.99 13 / 3 15 / 16 Std. Bus Std. Bus
19 19 / 17 Std. Bus Std. Bus
18:00 - 21:00
251 252 1 1 31 42 26 31 $2.93 $2.48 15 / 18 26
2015 2016
Sund
ay/H
olid
ay
01:00 - 06:00
48 48 1 1 22 20 18 15 $4.13 $4.96 / 14 / 13
15:00 - 18:00
647 648 2
TimeAnnual Revenue
HoursAverage Trips per Clock Hour
Average Boardings per Revenue Hour
Average Boardings per Trip
Average Cost per Passenger
Average Peak Passenger LoadVehicle Type(NB / SB)
09:00 - 15:00
1,369 1,369 2 2 33 43 31 37 $2.74 $2.31 19 / 15 18 / 18 Std. Bus Std. Bus
Std. Bus Std. Bus
06:00 - 09:00
591 587
Std. Bus Std. Bus
21:00 - 01:00
342 347 1 1 36 29 $2.91 17 / 21 19 / 19 Std. Bus Std. Bus
40 $2.59 $2.20 20 / 17 23 / 18
15:00 - 18:00
601 611 2 2 52 51 49
09:00 - 15:00
1,560 1,599 3 3 37 38 39 37 $2.52 $2.58 24 / 16 19 / 15 Std. Bus Std. Bus
06:00 - 09:00
515 525 2 2 29 37 28 31 $3.03 $2.74 13 / 23 13 / 23 Std. Bus Std. Bus
2015 2016
Satu
rday
01:00 - 06:00
49 $1.88 $1.97 32
18:00 - 21:00
269 274 1 1 34 45 34
/ 25 24 / 28 Std. Bus Std. Bus
Std. Bus
Time Annual Revenue Hours
Average Trips per Clock Hour
Average Boardings per Revenue Hour
Average Boardings per Trip
Average Cost per Passenger
Average Peak Passenger LoadVehicle Type
(NB / SB)
$2.96 $3.57 20 / 19 21 / 15 Std. Bus21:00 - 01:00
1,696 1,490 1 1 30 33 29 25
Std. Bus
06:00 - 09:00
3,738 4,321 5 4 39 55 41 52 $2.27 $1.58 20 / 26 29 / 29 Std. Bus Std. Bus
18:00 - 21:00
1,779 1,937 2 2 36 40 29 28 $2.60 $2.64 18 / 17 16 / 17 Std. Bus Std. Bus
32 / 22 37 / 28 Std. Bus Std. Bus3,750 3 4 53 60 44 53 $1.83 $1.28
2015 2016
Mon
day-
Frid
ay
01:00 - 06:00
750 978 4 4 36 56 30 47 $2.44 $1.18 / 25 27 / 31
15:00 - 18:00
3,154
Performance by Day of Week, Route 501 Data collected early Sept. to mid-Dec. of the given year
TimeAnnual Revenue
HoursAverage Trips per Clock Hour
Average Boardings per Revenue Hour
Average Boardings per Trip
Average Cost per Passenger
Average Peak Passenger LoadVehicle Type
(NB / SB)
09:00 - 15:00
6,921 6,962 2 2 40 48 47 49 $2.18 $2.01 29 / 22 23 / 25 Std. Bus Std. Bus
Std. Bus
Top 25% of all bus services High 25% of all bus services Low 25% of all bus services Bottom 25% of all bus services Above Guidelines#
81
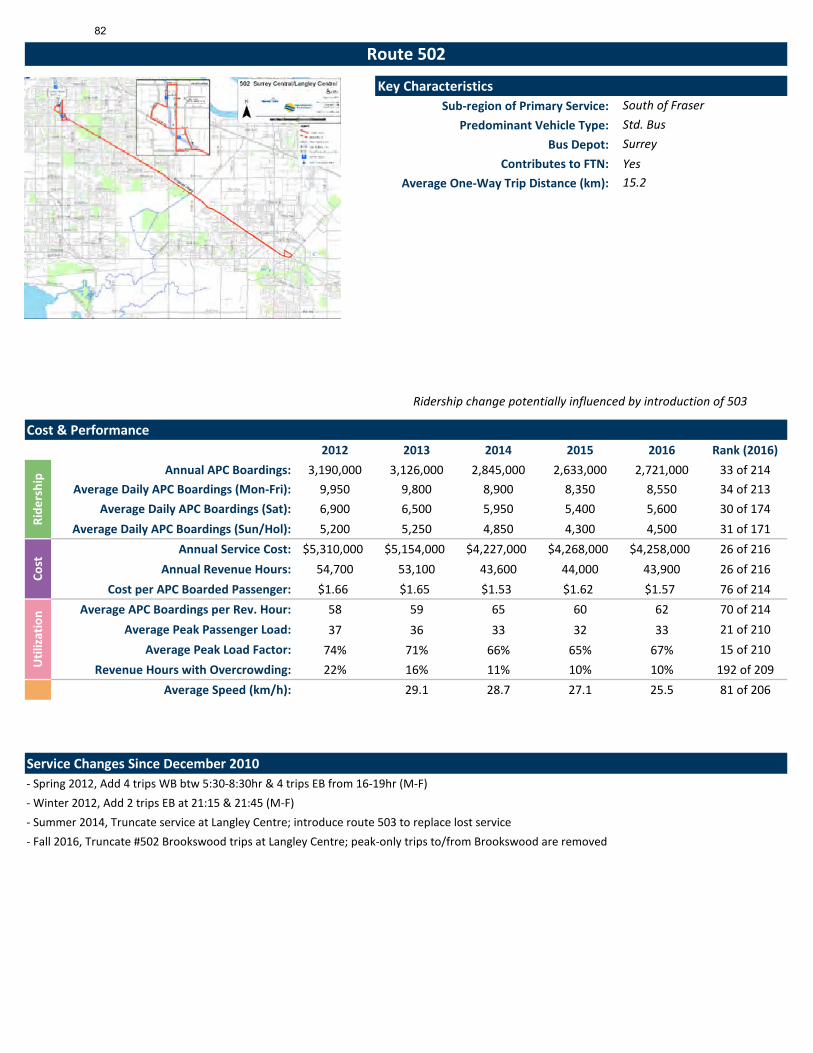
Key CharacteristicsSub-region of Primary Service:
Predominant Vehicle Type: Bus Depot:
Contributes to FTN: YesAverage One-Way Trip Distance (km):
Cost & Performance2012 2013 2014 2015 2016 Rank (2016)
Annual APC Boardings: 3,190,000 3,126,000 2,845,000 2,633,000 2,721,000 33 of 214 Average Daily APC Boardings (Mon-Fri): 9,950 9,800 8,900 8,350 8,550 34 of 213
Average Daily APC Boardings (Sat): 6,900 6,500 5,950 5,400 5,600 30 of 174 Average Daily APC Boardings (Sun/Hol): 5,200 5,250 4,850 4,300 4,500 31 of 171
Annual Service Cost: $5,310,000 $5,154,000 $4,227,000 $4,268,000 $4,258,000 26 of 216 Annual Revenue Hours: 54,700 53,100 43,600 44,000 43,900 26 of 216
Cost per APC Boarded Passenger: $1.66 $1.65 $1.53 $1.62 $1.57 76 of 214 Average APC Boardings per Rev. Hour: 58 59 65 60 62 70 of 214
Average Peak Passenger Load: 37 36 33 32 33 21 of 210Average Peak Load Factor: 74% 71% 66% 65% 67% 15 of 210
Revenue Hours with Overcrowding: 22% 16% 11% 10% 10% 192 of 209 Average Speed (km/h): 29.1 28.7 27.1 25.5 81 of 206
Service Changes Since December 2010- Spring 2012, Add 4 trips WB btw 5:30-8:30hr & 4 trips EB from 16-19hr (M-F)- Winter 2012, Add 2 trips EB at 21:15 & 21:45 (M-F)- Summer 2014, Truncate service at Langley Centre; introduce route 503 to replace lost service- Fall 2016, Truncate #502 Brookswood trips at Langley Centre; peak-only trips to/from Brookswood are removed
Cost
Ride
rshi
pU
tiliz
atio
n
Ridership change potentially influenced by introduction of 503
Route 502
South of Fraser
15.2
Std. BusSurrey
82
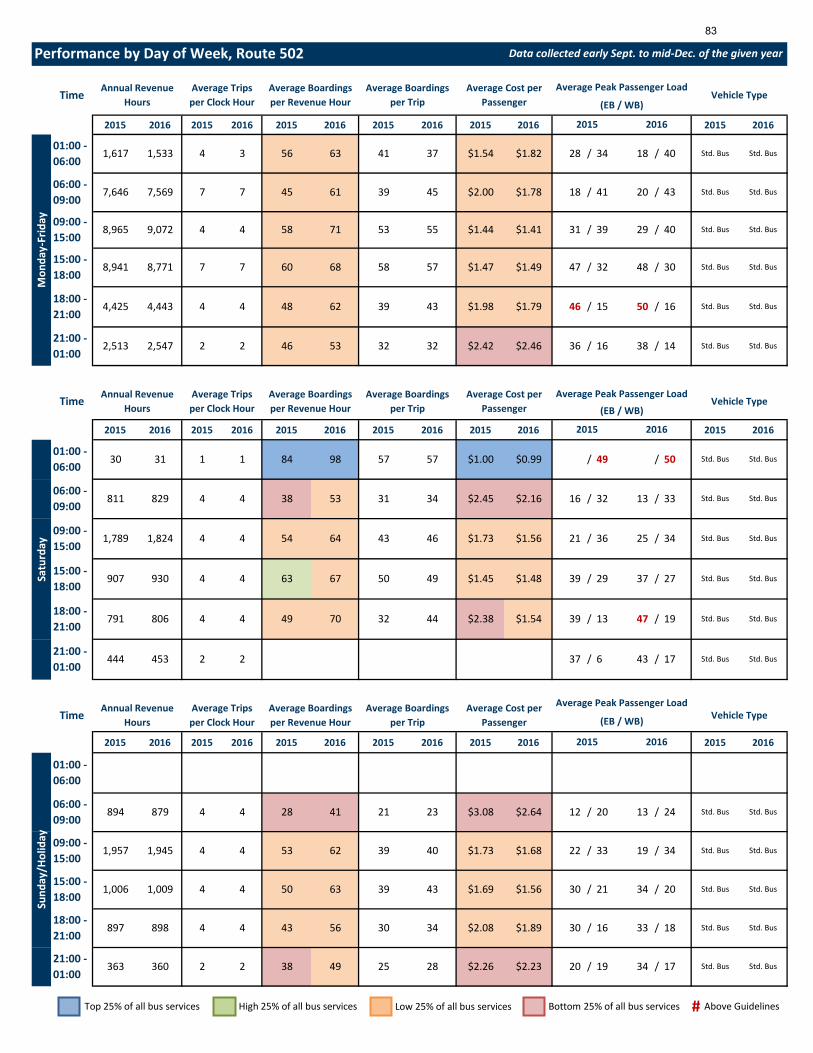
2015 2016 2015 2016 2015 2016 2015 2016 2015 2016 2015 2016
2015 2016 2015 2016 2015 2016 2015 2016 2015 2016 2015 2016
2015 2016 2015 2016 2015 2016 2015 2016 2015 2016 2015 2016
/
4 50 63 39 43 $1.69 $1.56 30 /
4 4 28 41 21 23 $3.08 $2.64 12 / 20 13 / 24 Std. Bus Std. Bus
18 Std. Bus Std. Bus
21:00 - 01:00
363 360 2 2 38 49 25 28 $2.26 $2.23 20 / 19 34 / 17 Std. Bus Std. Bus
21 34 / 20 Std. Bus Std. Bus
18:00 - 21:00
897 898 4 4 43 56 30 34 $2.08 $1.89 30 / 16 33
2015 2016
Sund
ay/H
olid
ay
01:00 - 06:00
15:00 - 18:00
1,006 1,009 4
TimeAnnual Revenue
HoursAverage Trips per Clock Hour
Average Boardings per Revenue Hour
Average Boardings per Trip
Average Cost per Passenger
Average Peak Passenger LoadVehicle Type(EB / WB)
09:00 - 15:00
1,957 1,945 4 4 53 62 39 40 $1.73 $1.68 22 / 33 19 / 34 Std. Bus Std. Bus
06:00 - 09:00
894 879
Std. Bus Std. Bus
21:00 - 01:00
444 453 2 2 37 / 6 43 / 17 Std. Bus Std. Bus
44 $2.38 $1.54 39 / 13 47 / 19
15:00 - 18:00
907 930 4 4 63 67 50
09:00 - 15:00
1,789 1,824 4 4 54 64 43 46 $1.73 $1.56 21 / 36 25 / 34 Std. Bus Std. Bus
Std. Bus Std. Bus
06:00 - 09:00
811 829 4 4 38 53 31 34 $2.45 $2.16 16 / 32 13 / 33 Std. Bus Std. Bus
2015 2016
Satu
rday
01:00 - 06:00
30 31 1 1 84 98 57 57 $1.00 $0.99 / 49 / 50
49 $1.45 $1.48 39
18:00 - 21:00
791 806 4 4 49 70 32
/ 29 37 / 27 Std. Bus Std. Bus
Std. Bus
Time Annual Revenue Hours
Average Trips per Clock Hour
Average Boardings per Revenue Hour
Average Boardings per Trip
Average Cost per Passenger
Average Peak Passenger LoadVehicle Type
(EB / WB)
$2.42 $2.46 36 / 16 38 / 14 Std. Bus21:00 - 01:00
2,513 2,547 2 2 46 53 32 32
18:00 - 21:00
4,425 4,443 4 4 48 62 39 43 $1.98 $1.79 46 / 15 50 / 16 Std. Bus Std. Bus
47 / 32 48 / 30 Std. Bus Std. Bus8,771 7 7 60 68 58 57 $1.47 $1.49
Performance by Day of Week, Route 502 Data collected early Sept. to mid-Dec. of the given year
TimeAnnual Revenue
HoursAverage Trips per Clock Hour
Average Boardings per Revenue Hour
Average Boardings per Trip
Average Cost per Passenger
Average Peak Passenger LoadVehicle Type
(EB / WB)
09:00 - 15:00
8,965 9,072 4 4 58 71 53 55 $1.44 $1.41 31 / 39 29 / 40 Std. Bus Std. Bus
Std. Bus Std. Bus
06:00 - 09:00
7,646 7,569 7 7 45 61 39 45 $2.00 $1.78 18 / 41 20 / 43 Std. Bus Std. Bus
2015 2016
Mon
day-
Frid
ay
01:00 - 06:00
1,617 1,533 4 3 56 63 41 37 $1.54 $1.82 28 / 34 18 / 40
15:00 - 18:00
8,941
Top 25% of all bus services High 25% of all bus services Low 25% of all bus services Bottom 25% of all bus services Above Guidelines#
83
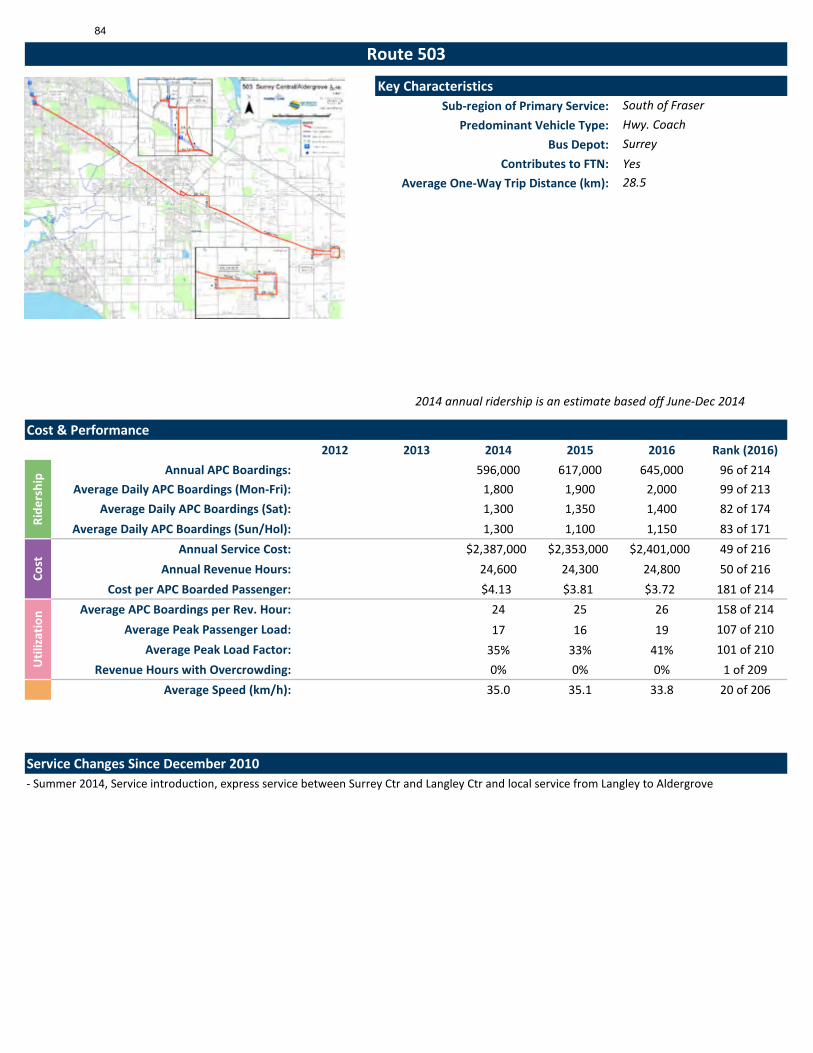
Key CharacteristicsSub-region of Primary Service:
Predominant Vehicle Type: Bus Depot:
Contributes to FTN: YesAverage One-Way Trip Distance (km):
Cost & Performance2012 2013 2014 2015 2016 Rank (2016)
Annual APC Boardings: 596,000 617,000 645,000 96 of 214 Average Daily APC Boardings (Mon-Fri): 1,800 1,900 2,000 99 of 213
Average Daily APC Boardings (Sat): 1,300 1,350 1,400 82 of 174 Average Daily APC Boardings (Sun/Hol): 1,300 1,100 1,150 83 of 171
Annual Service Cost: $2,387,000 $2,353,000 $2,401,000 49 of 216 Annual Revenue Hours: 24,600 24,300 24,800 50 of 216
Cost per APC Boarded Passenger: $4.13 $3.81 $3.72 181 of 214 Average APC Boardings per Rev. Hour: 24 25 26 158 of 214
Average Peak Passenger Load: 17 16 19 107 of 210Average Peak Load Factor: 35% 33% 41% 101 of 210
Revenue Hours with Overcrowding: 0% 0% 0% 1 of 209 Average Speed (km/h): 35.0 35.1 33.8 20 of 206
Service Changes Since December 2010- Summer 2014, Service introduction, express service between Surrey Ctr and Langley Ctr and local service from Langley to Aldergrove
Cost
Ride
rshi
pU
tiliz
atio
n
2014 annual ridership is an estimate based off June-Dec 2014
Route 503
South of Fraser
28.5
Hwy. CoachSurrey
84

2015 2016 2015 2016 2015 2016 2015 2016 2015 2016 2015 2016
2015 2016 2015 2016 2015 2016 2015 2016 2015 2016 2015 2016
2015 2016 2015 2016 2015 2016 2015 2016 2015 2016 2015 2016
/
2 15 27 17 27 $6.12 $4.23 13 /
2 2 11 17 14 15 $6.53 $6.51 10 / 10 9 / 13 Hwy. Coach Hwy. Coach
12 Hwy. Coach Hwy. Coach
21:00 - 01:00
219 215 2 2 23 22 24 17 $8.28 $5.07 24 / 6 17 / 11 Hwy. Coach Hwy. Coach
12 17 / 23 Hwy. Coach Hwy. Coach
18:00 - 21:00
506 497 2 2 22 20 $5.12 / 3 20
2015 2016
Sund
ay/H
olid
ay
01:00 - 06:00
25 25 1 1 8 3 $12.93 3 /
15:00 - 18:00
760 748 2
TimeAnnual Revenue
HoursAverage Trips per Clock Hour
Average Boardings per Revenue Hour
Average Boardings per Trip
Average Cost per Passenger
Average Peak Passenger LoadVehicle Type(EB / WB)
09:00 - 15:00
1,478 1,456 2 2 19 18 $5.42 14 / 16 12 / 16 Hwy. Coach Hwy. Coach
Hwy. Coach Hwy. Coach
06:00 - 09:00
456 449
Hwy. Coach Hwy. Coach
21:00 - 01:00
296 302 1 1 17 16 $6.49 18 / 8 Hwy. Coach Hwy. Coach
20 $4.66 16 / 15
15:00 - 18:00
686 702 2 2 23
09:00 - 15:00
1,265 1,311 2 2 28 29 $3.68 18 / 24 Hwy. Coach Hwy. Coach
Hwy. Coach Hwy. Coach
06:00 - 09:00
382 392 2 2 25 24 $4.09 13 / 19 Hwy. Coach Hwy. Coach
2015 2016
Satu
rday
01:00 - 06:00
21 21 1 1 6 3 $15.52 3 /
24 $4.43
18:00 - 21:00
437 450 2 2 23
18 / 14 Hwy. Coach Hwy. Coach
Hwy. Coach
Time Annual Revenue Hours
Average Trips per Clock Hour
Average Boardings per Revenue Hour
Average Boardings per Trip
Average Cost per Passenger
Average Peak Passenger LoadVehicle Type
(EB / WB)
$9.74 $6.07 16 / 5 13 / 11 Hwy. Coach & Std. Bus
21:00 - 01:00
1,616 1,607 2 2 11 19 12 16
18:00 - 21:00
2,300 2,287 2 2 20 21 21 19 $5.38 $5.57 20 / 9 16 / 8 Hwy. Coach & Std. Bus
Hwy. Coach
26 / 28 24 / 21 Hwy. Coach & Std. Bus
Hwy. Coach3,809 2 3 32 32 41 35 $2.80 $3.07
Performance by Day of Week, Route 503 Data collected early Sept. to mid-Dec. of the given year
TimeAnnual Revenue
HoursAverage Trips per Clock Hour
Average Boardings per Revenue Hour
Average Boardings per Trip
Average Cost per Passenger
Average Peak Passenger LoadVehicle Type
(EB / WB)
09:00 - 15:00
6,000 6,065 2 2 25 32 30 32 $3.43 $3.18 17 / 23 18 / 24 Hwy. Coach & Std. Bus
Hwy. Coach
Hwy. Coach Hwy. Coach
06:00 - 09:00
3,492 3,524 2 2 29 35 35 38 $2.97 $2.92 25 / 25 26 / 27 Hwy. Coach & Std. Bus
Hwy. Coach
2015 2016
Mon
day-
Frid
ay
01:00 - 06:00
892 896 2 2 18 25 17 19 $2.97 $3.69 11 / 25 17 / 37
15:00 - 18:00
3,421
Top 25% of all bus services High 25% of all bus services Low 25% of all bus services Bottom 25% of all bus services Above Guidelines#
85
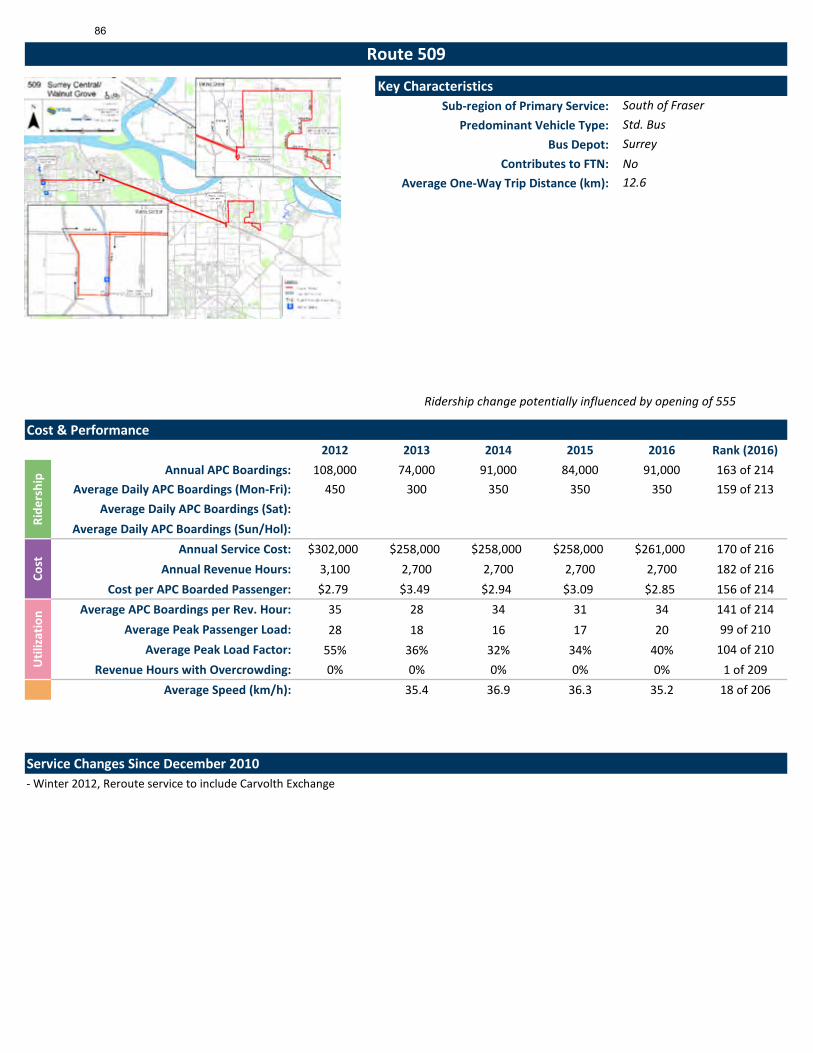
Key CharacteristicsSub-region of Primary Service:
Predominant Vehicle Type: Bus Depot:
Contributes to FTN: NoAverage One-Way Trip Distance (km):
Cost & Performance2012 2013 2014 2015 2016 Rank (2016)
Annual APC Boardings: 108,000 74,000 91,000 84,000 91,000 163 of 214 Average Daily APC Boardings (Mon-Fri): 450 300 350 350 350 159 of 213
Average Daily APC Boardings (Sat): Average Daily APC Boardings (Sun/Hol):
Annual Service Cost: $302,000 $258,000 $258,000 $258,000 $261,000 170 of 216 Annual Revenue Hours: 3,100 2,700 2,700 2,700 2,700 182 of 216
Cost per APC Boarded Passenger: $2.79 $3.49 $2.94 $3.09 $2.85 156 of 214 Average APC Boardings per Rev. Hour: 35 28 34 31 34 141 of 214
Average Peak Passenger Load: 28 18 16 17 20 99 of 210Average Peak Load Factor: 55% 36% 32% 34% 40% 104 of 210
Revenue Hours with Overcrowding: 0% 0% 0% 0% 0% 1 of 209 Average Speed (km/h): 35.4 36.9 36.3 35.2 18 of 206
Service Changes Since December 2010- Winter 2012, Reroute service to include Carvolth Exchange
Cost
Ride
rshi
pU
tiliz
atio
n
Ridership change potentially influenced by opening of 555
Route 509
South of Fraser
12.6
Std. BusSurrey
86

2015 2016 2015 2016 2015 2016 2015 2016 2015 2016 2015 2016
2015 2016 2015 2016 2015 2016 2015 2016 2015 2016 2015 2016
2015 2016 2015 2016 2015 2016 2015 2016 2015 2016 2015 2016
21:00 - 01:00
18:00 - 21:00
2015 2016
Sund
ay/H
olid
ay
01:00 - 06:00
15:00 - 18:00
TimeAnnual Revenue
HoursAverage Trips per Clock Hour
Average Boardings per Revenue Hour
Average Boardings per Trip
Average Cost per Passenger
Average Peak Passenger LoadVehicle Type(EB / WB)
09:00 - 15:00
06:00 - 09:00
21:00 - 01:00
15:00 - 18:00
09:00 - 15:00
06:00 - 09:00
2015 2016
Satu
rday
01:00 - 06:00
18:00 - 21:00
Time Annual Revenue Hours
Average Trips per Clock Hour
Average Boardings per Revenue Hour
Average Boardings per Trip
Average Cost per Passenger
Average Peak Passenger LoadVehicle Type
(EB / WB)
21:00 - 01:00
18:00 - 21:00
183 184 1 1 31 33 21 24 $3.39 $2.96 16 / 15 / Std. Bus Std. Bus
16 / 15 / Std. Bus Std. Bus1,376 2 2 15 29 21 23 $3.67 $3.40
Performance by Day of Week, Route 509 Data collected early Sept. to mid-Dec. of the given year
TimeAnnual Revenue
HoursAverage Trips per Clock Hour
Average Boardings per Revenue Hour
Average Boardings per Trip
Average Cost per Passenger
Average Peak Passenger LoadVehicle Type
(EB / WB)
09:00 - 15:00
Std. Bus Std. Bus
06:00 - 09:00
792 813 3 3 46 60 36 39 $1.71 $1.66 / 28 / 30 Std. Bus Std. Bus
2015 2016
Mon
day-
Frid
ay
01:00 - 06:00
317 318 2 2 18 40 16 26 $3.85 $2.41 / 13 / 18
15:00 - 18:00
1,371
Top 25% of all bus services High 25% of all bus services Low 25% of all bus services Bottom 25% of all bus services Above Guidelines#
87

Key CharacteristicsSub-region of Primary Service:
Predominant Vehicle Type: Bus Depot:
Contributes to FTN: NoAverage One-Way Trip Distance (km):
Cost & Performance2012 2013 2014 2015 2016 Rank (2016)
Annual APC Boardings: 266,000 336,000 374,000 433,000 492,000 107 of 214 Average Daily APC Boardings (Mon-Fri): 800 1,050 1,200 1,400 1,600 107 of 213
Average Daily APC Boardings (Sat): 550 750 700 800 900 95 of 174 Average Daily APC Boardings (Sun/Hol): 550 650 550 650 700 100 of 171
Annual Service Cost: $1,696,000 $1,432,000 $1,267,000 $1,284,000 $1,340,000 87 of 216 Annual Revenue Hours: 17,500 14,800 14,500 14,700 15,400 77 of 216
Cost per APC Boarded Passenger: $6.38 $4.26 $3.47 $2.96 $2.72 150 of 214 Average APC Boardings per Rev. Hour: 15 23 26 29 32 147 of 214
Average Peak Passenger Load: 10 11 12 13 14 127 of 210Average Peak Load Factor: 19% 22% 30% 30% 33% 132 of 210
Revenue Hours with Overcrowding: 0% 0% 0% 0% 0% 1 of 209 Average Speed (km/h): 33.0 33.0 32.1 30.9 30 of 206
Service Changes Since December 2010- Spring 2012, #531 service introduced between White Rock Centre and Willowbrook- Winter 2013, Convert vehicle from conventional 40' bus to mini-bus (Sat, S/H)- Fall 2016, Add two NB trips starting at 40th Ave & 204th St at 5hr (M-F)- Fall 2016, Revise route to serve Langley Centre via 64th Ave and 56th Ave
Cost
Ride
rshi
pU
tiliz
atio
n
2012 ridership is an estimate based on Apr-Dec 2012; 2016 ridership change potentially influenced by route realignment in 2016
Route 531
South of Fraser
20.2
Std. BusSurrey
88
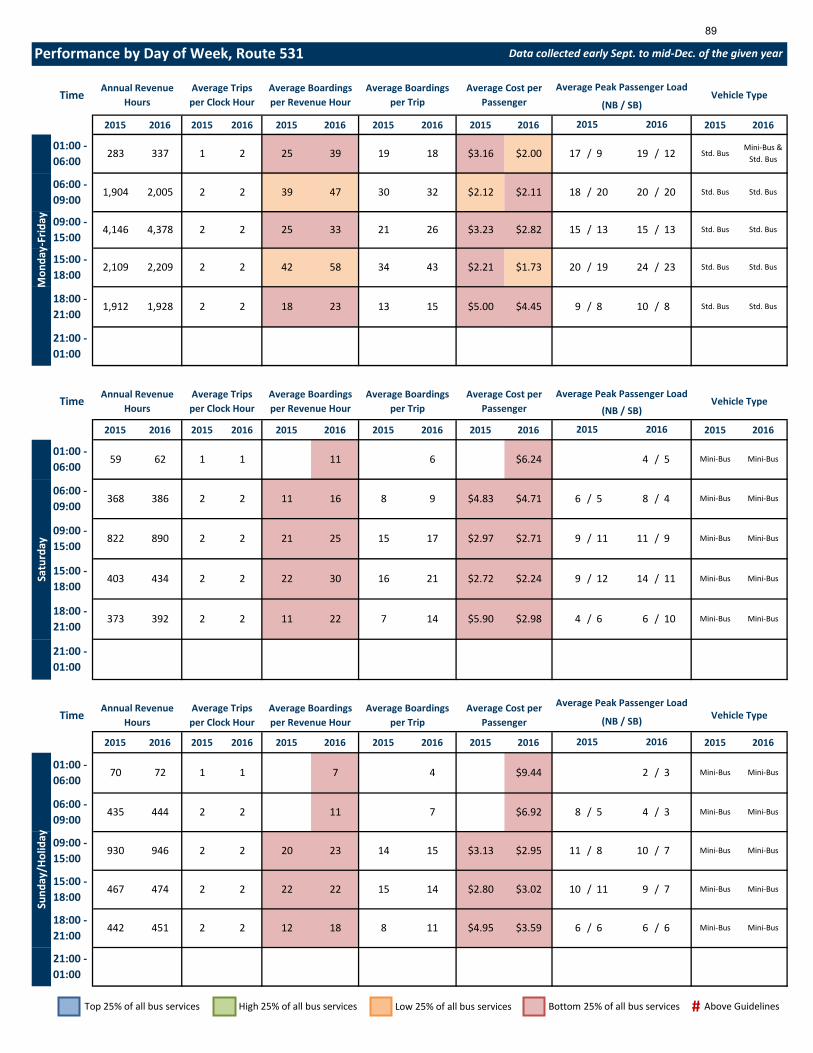
2015 2016 2015 2016 2015 2016 2015 2016 2015 2016 2015 2016
2015 2016 2015 2016 2015 2016 2015 2016 2015 2016 2015 2016
2015 2016 2015 2016 2015 2016 2015 2016 2015 2016 2015 2016
/
2 22 22 15 14 $2.80 $3.02 10 /
2 2 11 7 $6.92 8 / 5 4 / 3 Mini-Bus Mini-Bus
6 Mini-Bus Mini-Bus
21:00 - 01:00
11 9 / 7 Mini-Bus Mini-Bus
18:00 - 21:00
442 451 2 2 12 18 8 11 $4.95 $3.59 6 / 6 6
2015 2016
Sund
ay/H
olid
ay
01:00 - 06:00
70 72 1 1 7 4 $9.44 2 / 3
15:00 - 18:00
467 474 2
TimeAnnual Revenue
HoursAverage Trips per Clock Hour
Average Boardings per Revenue Hour
Average Boardings per Trip
Average Cost per Passenger
Average Peak Passenger LoadVehicle Type(NB / SB)
09:00 - 15:00
930 946 2 2 20 23 14 15 $3.13 $2.95 11 / 8 10 / 7 Mini-Bus Mini-Bus
Mini-Bus Mini-Bus
06:00 - 09:00
435 444
Mini-Bus Mini-Bus
21:00 - 01:00
14 $5.90 $2.98 4 / 6 6 / 10
15:00 - 18:00
403 434 2 2 22 30 16
09:00 - 15:00
822 890 2 2 21 25 15 17 $2.97 $2.71 9 / 11 11 / 9 Mini-Bus Mini-Bus
Mini-Bus Mini-Bus
06:00 - 09:00
368 386 2 2 11 16 8 9 $4.83 $4.71 6 / 5 8 / 4 Mini-Bus Mini-Bus
2015 2016
Satu
rday
01:00 - 06:00
59 62 1 1 11 6 $6.24 4 / 5
21 $2.72 $2.24 9
18:00 - 21:00
373 392 2 2 11 22 7
/ 12 14 / 11 Mini-Bus Mini-Bus
Time Annual Revenue Hours
Average Trips per Clock Hour
Average Boardings per Revenue Hour
Average Boardings per Trip
Average Cost per Passenger
Average Peak Passenger LoadVehicle Type
(NB / SB)
21:00 - 01:00
18:00 - 21:00
1,912 1,928 2 2 18 23 13 15 $5.00 $4.45 9 / 8 10 / 8 Std. Bus Std. Bus
20 / 19 24 / 23 Std. Bus Std. Bus2,209 2 2 42 58 34 43 $2.21 $1.73
Performance by Day of Week, Route 531 Data collected early Sept. to mid-Dec. of the given year
TimeAnnual Revenue
HoursAverage Trips per Clock Hour
Average Boardings per Revenue Hour
Average Boardings per Trip
Average Cost per Passenger
Average Peak Passenger LoadVehicle Type
(NB / SB)
09:00 - 15:00
4,146 4,378 2 2 25 33 21 26 $3.23 $2.82 15 / 13 15 / 13 Std. Bus Std. Bus
Std. BusMini-Bus &
Std. Bus
06:00 - 09:00
1,904 2,005 2 2 39 47 30 32 $2.12 $2.11 18 / 20 20 / 20 Std. Bus Std. Bus
2015 2016
Mon
day-
Frid
ay
01:00 - 06:00
283 337 1 2 25 39 19 18 $3.16 $2.00 17 / 9 19 / 12
15:00 - 18:00
2,109
Top 25% of all bus services High 25% of all bus services Low 25% of all bus services Bottom 25% of all bus services Above Guidelines#
89

Key CharacteristicsSub-region of Primary Service:
Predominant Vehicle Type: Bus Depot:
Contributes to FTN: NoAverage One-Way Trip Distance (km):
Cost & Performance2012 2013 2014 2015 2016 Rank (2016)
Annual APC Boardings: 565,000 713,000 868,000 1,068,000 65 of 214 Average Daily APC Boardings (Mon-Fri): 2,000 2,500 3,050 3,750 62 of 213
Average Daily APC Boardings (Sat): 700 900 1,100 1,250 89 of 174 Average Daily APC Boardings (Sun/Hol): 500 700 750 1,000 87 of 171
Annual Service Cost: $1,193,000 $1,078,000 $1,290,000 $1,292,000 91 of 216 Annual Revenue Hours: 12,300 11,100 13,300 13,300 95 of 216
Cost per APC Boarded Passenger: $2.11 $1.56 $1.49 $1.21 39 of 214 Average APC Boardings per Rev. Hour: 46 64 65 80 36 of 214
Average Peak Passenger Load: 19 21 25 28 44 of 210Average Peak Load Factor: 40% 43% 53% 59% 32 of 210
Revenue Hours with Overcrowding: 4% 6% 15% 30% 208 of 209 Average Speed (km/h): 75.6 76.6 72.5 68.4 1 of 206
Service Changes Since December 2010- Winter 2012, #555 service introduced between Carvolth Exchange and Braid Station- Fall 2014, Add in 5 trips between 6-8hr (M-F); reroute to serve new stop at 156th Street.- Winter 2014, Add in two trips between 15-16hr (M-F)- Summer 2015, Add two trips from 22-23hr (all days)- Summer 2015, Revise western terminus from Braid to Lougheed Town Centre
Cost
Ride
rshi
pU
tiliz
atio
nRoute 555
South of Fraser
18.9
Hwy. CoachPort Coquitlam
90
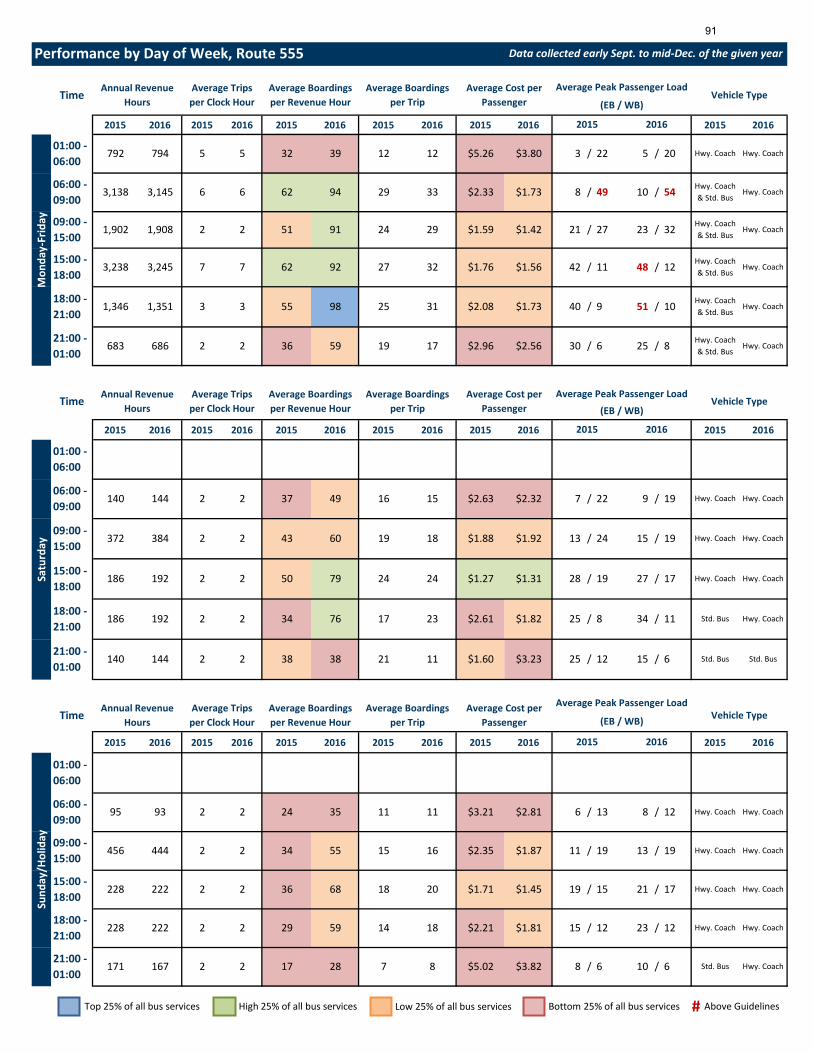
2015 2016 2015 2016 2015 2016 2015 2016 2015 2016 2015 2016
2015 2016 2015 2016 2015 2016 2015 2016 2015 2016 2015 2016
2015 2016 2015 2016 2015 2016 2015 2016 2015 2016 2015 2016
/
2 36 68 18 20 $1.71 $1.45 19 /
2 2 24 35 11 11 $3.21 $2.81 6 / 13 8 / 12 Hwy. Coach Hwy. Coach
12 Hwy. Coach Hwy. Coach
21:00 - 01:00
171 167 2 2 17 28 7 8 $5.02 $3.82 8 / 6 10 / 6 Std. Bus Hwy. Coach
15 21 / 17 Hwy. Coach Hwy. Coach
18:00 - 21:00
228 222 2 2 29 59 14 18 $2.21 $1.81 15 / 12 23
2015 2016
Sund
ay/H
olid
ay
01:00 - 06:00
15:00 - 18:00
228 222 2
TimeAnnual Revenue
HoursAverage Trips per Clock Hour
Average Boardings per Revenue Hour
Average Boardings per Trip
Average Cost per Passenger
Average Peak Passenger LoadVehicle Type(EB / WB)
09:00 - 15:00
456 444 2 2 34 55 15 16 $2.35 $1.87 11 / 19 13 / 19 Hwy. Coach Hwy. Coach
06:00 - 09:00
95 93
Std. Bus Hwy. Coach
21:00 - 01:00
140 144 2 2 38 38 21 11 $1.60 $3.23 25 / 12 15 / 6 Std. Bus Std. Bus
23 $2.61 $1.82 25 / 8 34 / 11
15:00 - 18:00
186 192 2 2 50 79 24
09:00 - 15:00
372 384 2 2 43 60 19 18 $1.88 $1.92 13 / 24 15 / 19 Hwy. Coach Hwy. Coach
06:00 - 09:00
140 144 2 2 37 49 16 15 $2.63 $2.32 7 / 22 9 / 19 Hwy. Coach Hwy. Coach
2015 2016
Satu
rday
01:00 - 06:00
24 $1.27 $1.31 28
18:00 - 21:00
186 192 2 2 34 76 17
/ 19 27 / 17 Hwy. Coach Hwy. Coach
Hwy. Coach
Time Annual Revenue Hours
Average Trips per Clock Hour
Average Boardings per Revenue Hour
Average Boardings per Trip
Average Cost per Passenger
Average Peak Passenger LoadVehicle Type
(EB / WB)
$2.96 $2.56 30 / 6 25 / 8 Hwy. Coach & Std. Bus
21:00 - 01:00
683 686 2 2 36 59 19 17
18:00 - 21:00
1,346 1,351 3 3 55 98 25 31 $2.08 $1.73 40 / 9 51 / 10 Hwy. Coach & Std. Bus
Hwy. Coach
42 / 11 48 / 12 Hwy. Coach & Std. Bus
Hwy. Coach3,245 7 7 62 92 27 32 $1.76 $1.56
Performance by Day of Week, Route 555 Data collected early Sept. to mid-Dec. of the given year
TimeAnnual Revenue
HoursAverage Trips per Clock Hour
Average Boardings per Revenue Hour
Average Boardings per Trip
Average Cost per Passenger
Average Peak Passenger LoadVehicle Type
(EB / WB)
09:00 - 15:00
1,902 1,908 2 2 51 91 24 29 $1.59 $1.42 21 / 27 23 / 32 Hwy. Coach & Std. Bus
Hwy. Coach
Hwy. Coach Hwy. Coach
06:00 - 09:00
3,138 3,145 6 6 62 94 29 33 $2.33 $1.73 8 / 49 10 / 54 Hwy. Coach & Std. Bus
Hwy. Coach
2015 2016
Mon
day-
Frid
ay
01:00 - 06:00
792 794 5 5 32 39 12 12 $5.26 $3.80 3 / 22 5 / 20
15:00 - 18:00
3,238
Top 25% of all bus services High 25% of all bus services Low 25% of all bus services Bottom 25% of all bus services Above Guidelines#
91

Key CharacteristicsSub-region of Primary Service:
Predominant Vehicle Type: Bus Depot:
Contributes to FTN: NoAverage One-Way Trip Distance (km):
Cost & Performance2012 2013 2014 2015 2016 Rank (2016)
Annual APC Boardings: 192,000 178,000 186,000 182,000 139,000 147 of 214 Average Daily APC Boardings (Mon-Fri): 750 700 750 750 550 142 of 213
Average Daily APC Boardings (Sat): Average Daily APC Boardings (Sun/Hol):
Annual Service Cost: $502,000 $513,000 $504,000 $504,000 $132,000 197 of 216 Annual Revenue Hours: 5,200 5,300 5,200 5,200 2,100 190 of 216
Cost per APC Boarded Passenger: $2.62 $2.88 $2.79 $2.76 $0.95 9 of 214 Average APC Boardings per Rev. Hour: 37 34 36 35 67 61 of 214
Average Peak Passenger Load: 27 22 24 23 3 194 of 210Average Peak Load Factor: 53% 44% 47% 45% 13% 190 of 210
Revenue Hours with Overcrowding: 0% 0% 0% 0% 0% 1 of 209 Average Speed (km/h): 28.4 29.1 29.3 29.2 37 of 206
Service Changes Since December 2010- Winter 2012, Reroute service to utilize Carvolth Exchange- Fall 2016, Discontinue trips between Brookswood and Surrey Central- Fall 2016, Discontinue PM peak trips between Surrey Central and Brookswood; maintain AM peak trips, only between Brookswood and Langley Centre
Cost
Ride
rshi
pU
tiliz
atio
n
Ridership change potentially influenced by route truncation in 2016
Route 590
South of Fraser
3.6
Mini-BusSurrey
92

2015 2016 2015 2016 2015 2016 2015 2016 2015 2016 2015 2016
2015 2016 2015 2016 2015 2016 2015 2016 2015 2016 2015 2016
2015 2016 2015 2016 2015 2016 2015 2016 2015 2016 2015 2016
21:00 - 01:00
18:00 - 21:00
2015 2016
Sund
ay/H
olid
ay
01:00 - 06:00
15:00 - 18:00
TimeAnnual Revenue
HoursAverage Trips per Clock Hour
Average Boardings per Revenue Hour
Average Boardings per Trip
Average Cost per Passenger
Average Peak Passenger LoadVehicle Type(NB / SB)
09:00 - 15:00
06:00 - 09:00
21:00 - 01:00
15:00 - 18:00
09:00 - 15:00
06:00 - 09:00
2015 2016
Satu
rday
01:00 - 06:00
18:00 - 21:00
Time Annual Revenue Hours
Average Trips per Clock Hour
Average Boardings per Revenue Hour
Average Boardings per Trip
Average Cost per Passenger
Average Peak Passenger LoadVehicle Type
(NB / SB)
21:00 - 01:00
18:00 - 21:00
229 1 26 24 $3.75 / 14 Std. Bus
/ 23 Std. Bus2 35 44 $2.67
Performance by Day of Week, Route 590 Data collected early Sept. to mid-Dec. of the given year
TimeAnnual Revenue
HoursAverage Trips per Clock Hour
Average Boardings per Revenue Hour
Average Boardings per Trip
Average Cost per Passenger
Average Peak Passenger LoadVehicle Type
(NB / SB)
09:00 - 15:00
300 1 22 32 $3.64 / 16 Std. Bus
Std. Bus Mini-Bus
06:00 - 09:00
2,066 1,474 4 2 37 15 49 3 $2.37 $22.44 25 / 3 / Std. Bus Mini-Bus
2015 2016
Mon
day-
Frid
ay
01:00 - 06:00
787 588 2 2 34 14 40 3 $2.55 $14.15 22 / 3 /
15:00 - 18:00
1,808
Top 25% of all bus services High 25% of all bus services Low 25% of all bus services Bottom 25% of all bus services Above Guidelines#
93

Key CharacteristicsSub-region of Primary Service:
Predominant Vehicle Type: Bus Depot:
Contributes to FTN: NoAverage One-Way Trip Distance (km):
Cost & Performance2012 2013 2014 2015 2016 Rank (2016)
Annual APC Boardings: 414,000 408,000 435,000 433,000 451,000 108 of 214 Average Daily APC Boardings (Mon-Fri): 1,350 1,350 1,400 1,400 1,450 110 of 213
Average Daily APC Boardings (Sat): 700 700 750 750 800 103 of 174 Average Daily APC Boardings (Sun/Hol): 650 600 650 600 650 102 of 171
Annual Service Cost: $976,000 $1,056,000 $1,135,000 $1,138,000 $1,191,000 95 of 216 Annual Revenue Hours: 10,100 10,900 11,700 11,800 12,300 100 of 216
Cost per APC Boarded Passenger: $2.36 $2.59 $2.69 $2.63 $2.64 145 of 214 Average APC Boardings per Rev. Hour: 41 37 37 37 37 133 of 214
Average Peak Passenger Load: 13 13 14 14 12 139 of 210Average Peak Load Factor: 26% 26% 27% 27% 24% 161 of 210
Revenue Hours with Overcrowding: 0% 1% 0% 0% 0% 1 of 209 Average Speed (km/h): 35.0 34.6 34.8 32.0 26 of 206
Service Changes Since December 2010- Fall 2012, Truncate route at Maple Meadows Stn no longer serving Haney Place- Winter 2012, Reroute service to utilize Carvolth Exchange- Fall 2016, Reroute from 200th St to 208th St btw Langley Centre and Carvolth Exchange
Cost
Ride
rshi
pU
tiliz
atio
nRoute 595
South of Fraser
13.8
Std. BusSurrey
94

2015 2016 2015 2016 2015 2016 2015 2016 2015 2016 2015 2016
2015 2016 2015 2016 2015 2016 2015 2016 2015 2016 2015 2016
2015 2016 2015 2016 2015 2016 2015 2016 2015 2016 2015 2016
/
2 18 26 10 13 $4.38 $3.56 7 /
2 2 12 13 7 6 $6.24 $7.87 5 / 5 5 / 4 Std. Bus Std. Bus
11 Std. Bus Std. Bus
21:00 - 01:00
25 25 1 1 14 24 8 11 $4.85 $3.79 / 6 / 8 Std. Bus Std. Bus
10 8 / 9 Std. Bus Std. Bus
18:00 - 21:00
322 331 2 2 19 26 10 12 $4.49 $4.19 6 / 7 6
2015 2016
Sund
ay/H
olid
ay
01:00 - 06:00
15:00 - 18:00
346 353 2
TimeAnnual Revenue
HoursAverage Trips per Clock Hour
Average Boardings per Revenue Hour
Average Boardings per Trip
Average Cost per Passenger
Average Peak Passenger LoadVehicle Type(NB / SB)
09:00 - 15:00
696 711 2 2 20 23 12 12 $3.94 $4.07 8 / 8 8 / 6 Std. Bus Std. Bus
06:00 - 09:00
299 307
Std. Bus Std. Bus
21:00 - 01:00
21 21 1 1 34 14 $2.84 / 10 Std. Bus Std. Bus
10 $3.88 $4.98 6 / 9 6 / 8
15:00 - 18:00
321 327 2 2 25 33 14
09:00 - 15:00
621 638 2 2 22 25 13 13 $4.16 $4.02 9 / 8 7 / 7 Std. Bus Std. Bus
06:00 - 09:00
251 256 2 2 13 27 8 12 $5.49 $3.73 7 / 5 11 / 7 Std. Bus Std. Bus
2015 2016
Satu
rday
01:00 - 06:00
17 $4.11 $3.13 7
18:00 - 21:00
272 280 2 2 20 22 11
/ 10 9 / 13 Std. Bus Std. Bus
Std. Bus
Time Annual Revenue Hours
Average Trips per Clock Hour
Average Boardings per Revenue Hour
Average Boardings per Trip
Average Cost per Passenger
Average Peak Passenger LoadVehicle Type
(NB / SB)
$3.37 $4.26 10 / 9 8 / 7 Std. Bus21:00 - 01:00
333 347 2 2 29 21 13 11
18:00 - 21:00
1,604 1,640 3 2 25 26 15 13 $3.14 $3.91 10 / 11 7 / 9 Std. Bus Std. Bus
25 / 33 18 / 26 Std. Bus Std. Bus1,599 2 2 67 56 43 37 $1.39 $1.55
Performance by Day of Week, Route 595 Data collected early Sept. to mid-Dec. of the given year
TimeAnnual Revenue
HoursAverage Trips per Clock Hour
Average Boardings per Revenue Hour
Average Boardings per Trip
Average Cost per Passenger
Average Peak Passenger LoadVehicle Type
(NB / SB)
09:00 - 15:00
3,139 3,280 2 2 32 27 19 16 $2.71 $3.47 13 / 13 9 / 10 Std. Bus Std. Bus
Std. Bus Std. Bus
06:00 - 09:00
1,487 1,589 2 2 50 55 29 32 $1.75 $1.77 18 / 23 19 / 22 Std. Bus Std. Bus
2015 2016
Mon
day-
Frid
ay
01:00 - 06:00
546 580 2 2 20 27 11 12 $3.84 $4.28 8 / 10 9 / 11
15:00 - 18:00
1,467
Top 25% of all bus services High 25% of all bus services Low 25% of all bus services Bottom 25% of all bus services Above Guidelines#
95

Key CharacteristicsSub-region of Primary Service:
Predominant Vehicle Type: Bus Depot:
Contributes to FTN: NoAverage One-Way Trip Distance (km):
Cost & Performance2012 2013 2014 2015 2016 Rank (2016)
Annual APC Boardings: 997,000 1,004,000 998,000 1,060,000 1,152,000 63 of 214 Average Daily APC Boardings (Mon-Fri): 3,100 3,150 3,100 3,300 3,600 65 of 213
Average Daily APC Boardings (Sat): 2,100 2,100 2,150 2,300 2,400 59 of 174 Average Daily APC Boardings (Sun/Hol): 1,800 1,650 1,750 1,800 2,050 54 of 171
Annual Service Cost: $2,632,000 $2,677,000 $2,655,000 $2,646,000 $2,712,000 43 of 216 Annual Revenue Hours: 27,100 27,600 27,400 27,300 28,000 44 of 216
Cost per APC Boarded Passenger: $2.64 $2.67 $2.74 $2.50 $2.35 130 of 214 Average APC Boardings per Rev. Hour: 37 36 36 39 41 123 of 214
Average Peak Passenger Load: 21 21 20 22 25 64 of 210Average Peak Load Factor: 44% 44% 43% 46% 52% 53 of 210
Revenue Hours with Overcrowding: 1% 0% 0% 0% 0% 1 of 209 Average Speed (km/h): 38.8 39.1 38.9 37.6 17 of 206
Service Changes Since December 2010- Spring 2011, Reduce freq from 30 to 60 min from 4-7hr (Sat, S/H)- Fall 2011, Increase freq from 30 to 20m between 19-21hr (M-F)- Fall 2016, Reroute from 56th St to 52nd St to serve new Tsawwassen shopping mall- Fall 2016, Convert one regular pattern trip to a Boundary Bay pattern trip at 8hr to address gap in coverage (M-F)
Cost
Ride
rshi
pU
tiliz
atio
n
Ridership change potentially influenced by route realignment in 2016
Route 601
Ladner/South Delta/Tsaww.
22.4
Hwy. CoachRichmond
96

2015 2016 2015 2016 2015 2016 2015 2016 2015 2016 2015 2016
2015 2016 2015 2016 2015 2016 2015 2016 2015 2016 2015 2016
2015 2016 2015 2016 2015 2016 2015 2016 2015 2016 2015 2016
/
2 41 62 39 48 $2.19 $1.60 20 /
2 2 16 26 15 18 $5.60 $5.56 15 / 7 40 / 12 Hwy. Coach Hwy. Coach
25 Hwy. Coach Hwy. Coach
21:00 - 01:00
387 381 2 2 25 30 19 20 $3.64 $3.91 9 / 22 10 / 17 Hwy. Coach Hwy. Coach
39 28 / 39 Hwy. Coach Hwy. Coach
18:00 - 21:00
550 542 2 2 24 46 21 34 $3.77 $2.22 11 / 21 24
2015 2016
Sund
ay/H
olid
ay
01:00 - 06:00
201 198 1 1 16 6 8 / 0 15 /
15:00 - 18:00
586 577 2
TimeAnnual Revenue
HoursAverage Trips per Clock Hour
Average Boardings per Revenue Hour
Average Boardings per Trip
Average Cost per Passenger
Average Peak Passenger LoadVehicle Type(NB / SB)
09:00 - 15:00
1,150 1,132 2 2 32 55 31 42 $2.75 $1.85 28 / 15 27 / 29 Hwy. Coach Hwy. Coach
Hwy. Coach Std. Bus
06:00 - 09:00
495 487
Hwy. Coach Hwy. Coach
21:00 - 01:00
334 340 2 2 23 49 17 33 $4.61 $2.46 7 / 32 23 / 31 Hwy. Coach Hwy. Coach
37 $2.69 $2.11 15 / 31 22 / 34
15:00 - 18:00
501 510 2 2 48 58 45
09:00 - 15:00
987 1,005 2 2 40 54 39 43 $2.06 $1.87 33 / 22 34 / 25 Hwy. Coach Hwy. Coach
Hwy. Coach Hwy. Coach
06:00 - 09:00
414 422 2 2 17 44 16 32 $6.39 $2.26 20 / 7 25 / 24 Hwy. Coach Hwy. Coach
2015 2016
Satu
rday
01:00 - 06:00
170 181 1 1 17 22 11 13 $8.27 $6.54 8 / 15 7 / 20
47 $1.78 $1.69 30
18:00 - 21:00
473 482 2 2 35 49 31
/ 36 28 / 38 Hwy. Coach Hwy. Coach
Hwy. Coach
Time Annual Revenue Hours
Average Trips per Clock Hour
Average Boardings per Revenue Hour
Average Boardings per Trip
Average Cost per Passenger
Average Peak Passenger LoadVehicle Type
(NB / SB)
$4.77 $3.26 8 / 26 15 / 29 Hwy. Coach21:00 - 01:00
1,705 1,574 2 2 27 40 22 27
18:00 - 21:00
3,422 3,427 3 3 27 35 24 27 $3.77 $2.98 8 / 29 12 / 27 Hwy. Coach Hwy. Coach
21 / 35 21 / 39 Hwy. Coach Hwy. Coach4,430 4 4 48 63 39 45 $1.97 $1.79
Performance by Day of Week, Route 601 Data collected early Sept. to mid-Dec. of the given year
TimeAnnual Revenue
HoursAverage Trips per Clock Hour
Average Boardings per Revenue Hour
Average Boardings per Trip
Average Cost per Passenger
Average Peak Passenger LoadVehicle Type
(NB / SB)
09:00 - 15:00
5,812 6,133 3 3 38 48 36 39 $2.34 $2.10 25 / 22 24 / 26 Hwy. Coach Hwy. Coach
Hwy. Coach Hwy. Coach
06:00 - 09:00
4,671 4,805 5 5 33 47 26 30 $2.68 $2.20 24 / 17 27 / 18 Hwy. Coach Hwy. Coach
2015 2016
Mon
day-
Frid
ay
01:00 - 06:00
1,175 1,328 2 2 26 32 20 22 $2.20 $4.62 20 / 6 22 / 3
15:00 - 18:00
4,246
Top 25% of all bus services High 25% of all bus services Low 25% of all bus services Bottom 25% of all bus services Above Guidelines#
97

Key CharacteristicsSub-region of Primary Service:
Predominant Vehicle Type: Bus Depot:
Contributes to FTN: NoAverage One-Way Trip Distance (km):
Cost & Performance2012 2013 2014 2015 2016 Rank (2016)
Annual APC Boardings: 120,000 112,000 106,000 112,000 121,000 155 of 214 Average Daily APC Boardings (Mon-Fri): 450 450 450 450 500 147 of 213
Average Daily APC Boardings (Sat): Average Daily APC Boardings (Sun/Hol):
Annual Service Cost: $267,000 $271,000 $272,000 $272,000 $275,000 164 of 216 Annual Revenue Hours: 2,800 2,800 2,800 2,800 2,800 177 of 216
Cost per APC Boarded Passenger: $2.23 $2.43 $2.64 $2.43 $2.28 125 of 214 Average APC Boardings per Rev. Hour: 44 40 38 40 43 119 of 214
Average Peak Passenger Load: 26 24 25 25 27 52 of 210Average Peak Load Factor: 55% 52% 53% 54% 57% 40 of 210
Revenue Hours with Overcrowding: 0% 0% 0% 0% 0% 1 of 209 Average Speed (km/h): 42.9 43.3 42.5 41.8 9 of 206
Service Changes Since December 2010- Winter 2010, Reduce freq of SB trips from 20 to 30m during PM peak (M-F)- Summer 2011, headway adjustment btw 602, 603 & 604 in AM & PM peak
Cost
Ride
rshi
pU
tiliz
atio
nRoute 602
Ladner/South Delta/Tsaww.
15.4
Hwy. CoachRichmond
98

2015 2016 2015 2016 2015 2016 2015 2016 2015 2016 2015 2016
2015 2016 2015 2016 2015 2016 2015 2016 2015 2016 2015 2016
2015 2016 2015 2016 2015 2016 2015 2016 2015 2016 2015 2016
21:00 - 01:00
18:00 - 21:00
2015 2016
Sund
ay/H
olid
ay
01:00 - 06:00
15:00 - 18:00
TimeAnnual Revenue
HoursAverage Trips per Clock Hour
Average Boardings per Revenue Hour
Average Boardings per Trip
Average Cost per Passenger
Average Peak Passenger LoadVehicle Type(NB / SB)
09:00 - 15:00
06:00 - 09:00
21:00 - 01:00
15:00 - 18:00
09:00 - 15:00
06:00 - 09:00
2015 2016
Satu
rday
01:00 - 06:00
18:00 - 21:00
Time Annual Revenue Hours
Average Trips per Clock Hour
Average Boardings per Revenue Hour
Average Boardings per Trip
Average Cost per Passenger
Average Peak Passenger LoadVehicle Type
(NB / SB)
21:00 - 01:00
18:00 - 21:00
154 155 1 1 49 67 33 41 $1.83 $1.45 / 31 / 37 Hwy. Coach Hwy. Coach
/ 29 / 28 Hwy. Coach Hwy. Coach1,128 2 2 35 49 33 32 $1.91 $1.98
Performance by Day of Week, Route 602 Data collected early Sept. to mid-Dec. of the given year
TimeAnnual Revenue
HoursAverage Trips per Clock Hour
Average Boardings per Revenue Hour
Average Boardings per Trip
Average Cost per Passenger
Average Peak Passenger LoadVehicle Type
(NB / SB)
09:00 - 15:00
475 318 2 2 20 34 21 22 $2.95 $2.85 / 18 / 19 Hwy. Coach Hwy. Coach
Hwy. Coach Hwy. Coach
06:00 - 09:00
1,079 1,091 2 2 31 42 26 26 $2.50 $2.44 24 / 26 / Hwy. Coach Hwy. Coach
2015 2016
Mon
day-
Frid
ay
01:00 - 06:00
146 146 1 1 34 60 31 35 $1.81 $1.62 29 / 32 /
15:00 - 18:00
954
Top 25% of all bus services High 25% of all bus services Low 25% of all bus services Bottom 25% of all bus services Above Guidelines#
99

Key CharacteristicsSub-region of Primary Service:
Predominant Vehicle Type: Bus Depot:
Contributes to FTN: NoAverage One-Way Trip Distance (km):
Cost & Performance2012 2013 2014 2015 2016 Rank (2016)
Annual APC Boardings: 66,000 71,000 64,000 68,000 70,000 172 of 214 Average Daily APC Boardings (Mon-Fri): 250 300 250 250 300 168 of 213
Average Daily APC Boardings (Sat): Average Daily APC Boardings (Sun/Hol):
Annual Service Cost: $237,000 $240,000 $240,000 $240,000 $241,000 174 of 216 Annual Revenue Hours: 2,400 2,500 2,500 2,500 2,500 185 of 216
Cost per APC Boarded Passenger: $3.59 $3.40 $3.84 $3.53 $3.43 172 of 214 Average APC Boardings per Rev. Hour: 27 29 26 27 28 153 of 214
Average Peak Passenger Load: 16 16 14 15 16 122 of 210Average Peak Load Factor: 33% 34% 31% 32% 33% 131 of 210
Revenue Hours with Overcrowding: 0% 0% 0% 0% 0% 1 of 209 Average Speed (km/h): 41.3 41.4 40.9 40.4 12 of 206
Service Changes Since December 2010- Winter 2010, Reduce freq from 20 to 30m during AM & PM peak (M-F)- Summer 2011, headway adjustment btw 602, 603 & 604 in AM & PM peak
Cost
Ride
rshi
pU
tiliz
atio
n
Very low sampling in 2012
Route 603
Ladner/South Delta/Tsaww.
10.0
Hwy. CoachRichmond
100
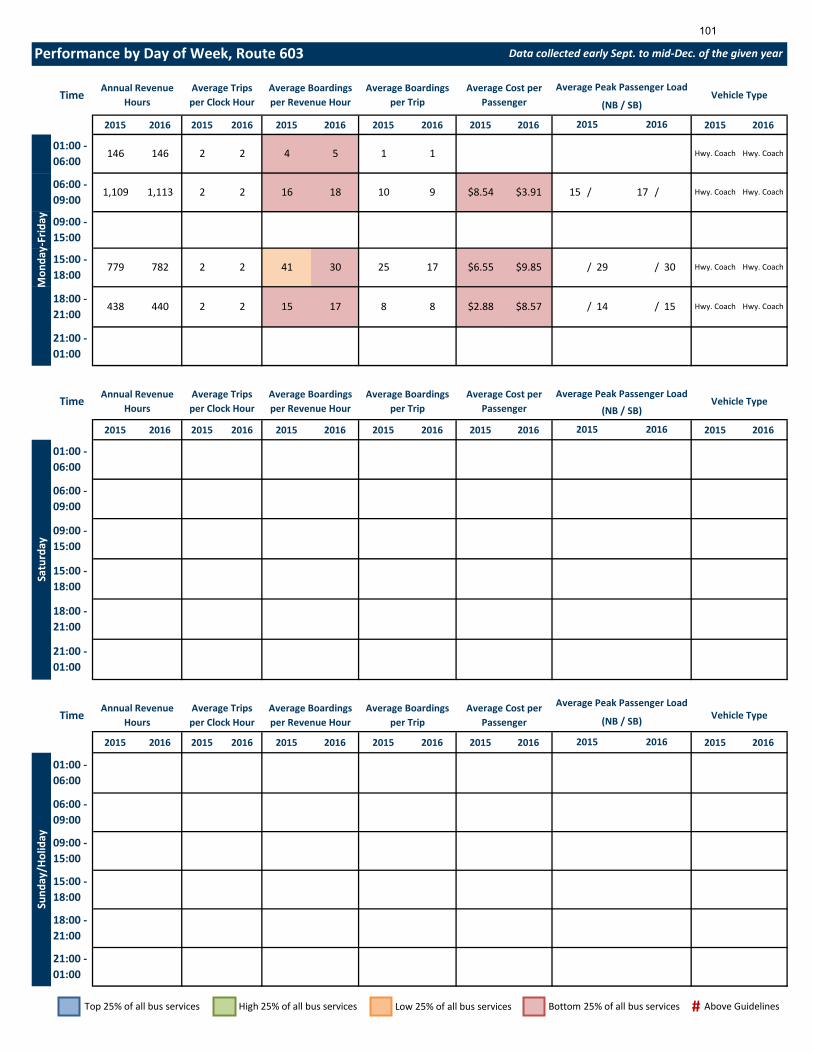
2015 2016 2015 2016 2015 2016 2015 2016 2015 2016 2015 2016
2015 2016 2015 2016 2015 2016 2015 2016 2015 2016 2015 2016
2015 2016 2015 2016 2015 2016 2015 2016 2015 2016 2015 2016
21:00 - 01:00
18:00 - 21:00
2015 2016
Sund
ay/H
olid
ay
01:00 - 06:00
15:00 - 18:00
TimeAnnual Revenue
HoursAverage Trips per Clock Hour
Average Boardings per Revenue Hour
Average Boardings per Trip
Average Cost per Passenger
Average Peak Passenger LoadVehicle Type(NB / SB)
09:00 - 15:00
06:00 - 09:00
21:00 - 01:00
15:00 - 18:00
09:00 - 15:00
06:00 - 09:00
2015 2016
Satu
rday
01:00 - 06:00
18:00 - 21:00
Time Annual Revenue Hours
Average Trips per Clock Hour
Average Boardings per Revenue Hour
Average Boardings per Trip
Average Cost per Passenger
Average Peak Passenger LoadVehicle Type
(NB / SB)
21:00 - 01:00
18:00 - 21:00
438 440 2 2 15 17 8 8 $2.88 $8.57 / 14 / 15 Hwy. Coach Hwy. Coach
/ 29 / 30 Hwy. Coach Hwy. Coach782 2 2 41 30 25 17 $6.55 $9.85
Performance by Day of Week, Route 603 Data collected early Sept. to mid-Dec. of the given year
TimeAnnual Revenue
HoursAverage Trips per Clock Hour
Average Boardings per Revenue Hour
Average Boardings per Trip
Average Cost per Passenger
Average Peak Passenger LoadVehicle Type
(NB / SB)
09:00 - 15:00
Hwy. Coach Hwy. Coach
06:00 - 09:00
1,109 1,113 2 2 16 18 10 9 $8.54 $3.91 15 / 17 / Hwy. Coach Hwy. Coach
2015 2016
Mon
day-
Frid
ay
01:00 - 06:00
146 146 2 2 4 5 1 1
15:00 - 18:00
779
Top 25% of all bus services High 25% of all bus services Low 25% of all bus services Bottom 25% of all bus services Above Guidelines#
101
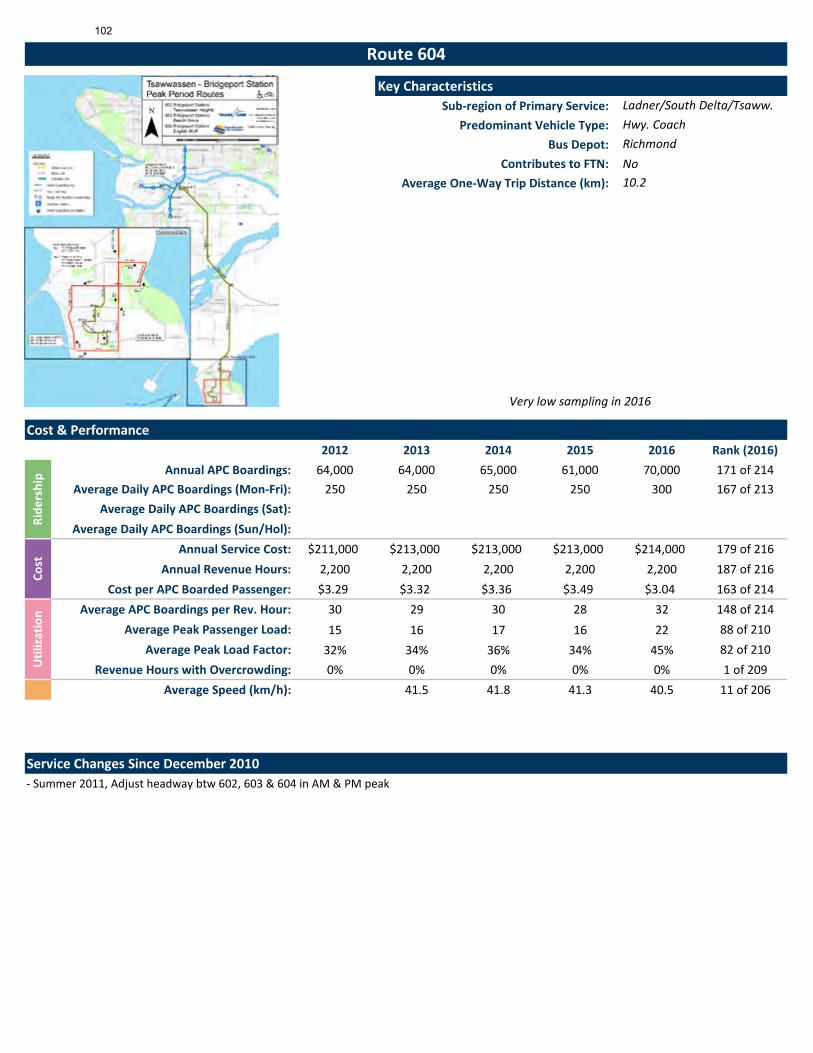
Key CharacteristicsSub-region of Primary Service:
Predominant Vehicle Type: Bus Depot:
Contributes to FTN: NoAverage One-Way Trip Distance (km):
Cost & Performance2012 2013 2014 2015 2016 Rank (2016)
Annual APC Boardings: 64,000 64,000 65,000 61,000 70,000 171 of 214 Average Daily APC Boardings (Mon-Fri): 250 250 250 250 300 167 of 213
Average Daily APC Boardings (Sat): Average Daily APC Boardings (Sun/Hol):
Annual Service Cost: $211,000 $213,000 $213,000 $213,000 $214,000 179 of 216 Annual Revenue Hours: 2,200 2,200 2,200 2,200 2,200 187 of 216
Cost per APC Boarded Passenger: $3.29 $3.32 $3.36 $3.49 $3.04 163 of 214 Average APC Boardings per Rev. Hour: 30 29 30 28 32 148 of 214
Average Peak Passenger Load: 15 16 17 16 22 88 of 210Average Peak Load Factor: 32% 34% 36% 34% 45% 82 of 210
Revenue Hours with Overcrowding: 0% 0% 0% 0% 0% 1 of 209 Average Speed (km/h): 41.5 41.8 41.3 40.5 11 of 206
Service Changes Since December 2010- Summer 2011, Adjust headway btw 602, 603 & 604 in AM & PM peak
Cost
Ride
rshi
pU
tiliz
atio
n
Very low sampling in 2016
Route 604
Ladner/South Delta/Tsaww.
10.2
Hwy. CoachRichmond
102

2015 2016 2015 2016 2015 2016 2015 2016 2015 2016 2015 2016
2015 2016 2015 2016 2015 2016 2015 2016 2015 2016 2015 2016
2015 2016 2015 2016 2015 2016 2015 2016 2015 2016 2015 2016
21:00 - 01:00
18:00 - 21:00
2015 2016
Sund
ay/H
olid
ay
01:00 - 06:00
15:00 - 18:00
TimeAnnual Revenue
HoursAverage Trips per Clock Hour
Average Boardings per Revenue Hour
Average Boardings per Trip
Average Cost per Passenger
Average Peak Passenger LoadVehicle Type(NB / SB)
09:00 - 15:00
06:00 - 09:00
21:00 - 01:00
15:00 - 18:00
09:00 - 15:00
06:00 - 09:00
2015 2016
Satu
rday
01:00 - 06:00
18:00 - 21:00
Time Annual Revenue Hours
Average Trips per Clock Hour
Average Boardings per Revenue Hour
Average Boardings per Trip
Average Cost per Passenger
Average Peak Passenger LoadVehicle Type
(NB / SB)
21:00 - 01:00
18:00 - 21:00
434 435 2 2 19 18 10 9 $11.29 $3.22 / 18 / 22 Hwy. Coach Hwy. Coach
/ 19 / 33 Hwy. Coach Hwy. Coach669 2 2 20 31 10 15 $6.25 $5.87
Performance by Day of Week, Route 604 Data collected early Sept. to mid-Dec. of the given year
TimeAnnual Revenue
HoursAverage Trips per Clock Hour
Average Boardings per Revenue Hour
Average Boardings per Trip
Average Cost per Passenger
Average Peak Passenger LoadVehicle Type
(NB / SB)
09:00 - 15:00
06:00 - 09:00
1,097 1,100 2 2 25 31 15 15 $5.23 $5.97 23 / 29 / Hwy. CoachHwy. Coach & Std. Bus
2015 2016
Mon
day-
Frid
ay
01:00 - 06:00
15:00 - 18:00
667
Top 25% of all bus services High 25% of all bus services Low 25% of all bus services Bottom 25% of all bus services Above Guidelines#
103

Key CharacteristicsSub-region of Primary Service:
Predominant Vehicle Type: Bus Depot:
Contributes to FTN: NoAverage One-Way Trip Distance (km):
Cost & Performance2012 2013 2014 2015 2016 Rank (2016)
Annual APC Boardings: 8,000 6,000 5,000 4,000 6,000 213 of 214 Average Daily APC Boardings (Mon-Fri): 30 30 20 20 20 212 of 213
Average Daily APC Boardings (Sat): Average Daily APC Boardings (Sun/Hol):
Annual Service Cost: $58,000 $65,000 $65,000 $65,000 $62,000 211 of 216 Annual Revenue Hours: 600 700 700 700 600 212 of 216
Cost per APC Boarded Passenger: $7.39 $10.13 $13.32 $15.97 $11.12 212 of 214 Average APC Boardings per Rev. Hour: 13 10 8 6 9 208 of 214
Average Peak Passenger Load: 5 5 6 6 6 171 of 210Average Peak Load Factor: 12% 11% 12% 13% 12% 194 of 210
Revenue Hours with Overcrowding: 0% 0% 0% 0% 0% 1 of 209 Average Speed (km/h): 25.8 27.5 28.0 27.6 55 of 206
Service Changes Since December 2010- No service change between December 2010 and September 2015
Cost
Ride
rshi
pU
tiliz
atio
n
Very low sampling in 2015
Route 606
Ladner/South Delta/Tsaww.
3.8
Hwy. CoachRichmond
104

2015 2016 2015 2016 2015 2016 2015 2016 2015 2016 2015 2016
2015 2016 2015 2016 2015 2016 2015 2016 2015 2016 2015 2016
2015 2016 2015 2016 2015 2016 2015 2016 2015 2016 2015 2016
21:00 - 01:00
18:00 - 21:00
2015 2016
Sund
ay/H
olid
ay
01:00 - 06:00
15:00 - 18:00
TimeAnnual Revenue
HoursAverage Trips per Clock Hour
Average Boardings per Revenue Hour
Average Boardings per Trip
Average Cost per Passenger
Average Peak Passenger LoadVehicle Type(EB / WB)
09:00 - 15:00
06:00 - 09:00
21:00 - 01:00
15:00 - 18:00
09:00 - 15:00
06:00 - 09:00
2015 2016
Satu
rday
01:00 - 06:00
18:00 - 21:00
Time Annual Revenue Hours
Average Trips per Clock Hour
Average Boardings per Revenue Hour
Average Boardings per Trip
Average Cost per Passenger
Average Peak Passenger LoadVehicle Type
(EB / WB)
21:00 - 01:00
18:00 - 21:00
204 205 1 1 9 23 2 2 $3.41 $2.75 9 / 7 4 / 9 Hwy. Coach Hwy. Coach
8 / 12 3 / 15 Hwy. Coach Hwy. Coach411 1 1 8 16 1 2 $5.26 $2.76
Performance by Day of Week, Route 606 Data collected early Sept. to mid-Dec. of the given year
TimeAnnual Revenue
HoursAverage Trips per Clock Hour
Average Boardings per Revenue Hour
Average Boardings per Trip
Average Cost per Passenger
Average Peak Passenger LoadVehicle Type
(EB / WB)
09:00 - 15:00
38 28 1 1 28 4 $2.53 / 11 Hwy. Coach Hwy. Coach
06:00 - 09:00
2015 2016
Mon
day-
Frid
ay
01:00 - 06:00
15:00 - 18:00
433
Top 25% of all bus services High 25% of all bus services Low 25% of all bus services Bottom 25% of all bus services Above Guidelines#
105

Key CharacteristicsSub-region of Primary Service:
Predominant Vehicle Type: Bus Depot:
Contributes to FTN: NoAverage One-Way Trip Distance (km):
Cost & Performance2012 2013 2014 2015 2016 Rank (2016)
Annual APC Boardings: 14,000 14,000 12,000 11,000 12,000 210 of 214 Average Daily APC Boardings (Mon-Fri): 50 50 50 40 50 208 of 213
Average Daily APC Boardings (Sat): Average Daily APC Boardings (Sun/Hol):
Annual Service Cost: $48,000 $56,000 $56,000 $56,000 $56,000 213 of 216 Annual Revenue Hours: 500 600 600 600 600 213 of 216
Cost per APC Boarded Passenger: $3.50 $4.12 $4.95 $5.17 $4.50 191 of 214 Average APC Boardings per Rev. Hour: 28 24 20 19 22 172 of 214
Average Peak Passenger Load: 7 6 5 6 5 175 of 210Average Peak Load Factor: 14% 13% 11% 12% 11% 197 of 210
Revenue Hours with Overcrowding: 0% 0% 0% 0% 0% 1 of 209 Average Speed (km/h): 27.5 27.9 29.1 27.7 54 of 206
Service Changes Since December 2010- No service change between December 2010 and September 2015
Cost
Ride
rshi
pU
tiliz
atio
nRoute 608
Ladner/South Delta/Tsaww.
4.2
Hwy. CoachRichmond
106
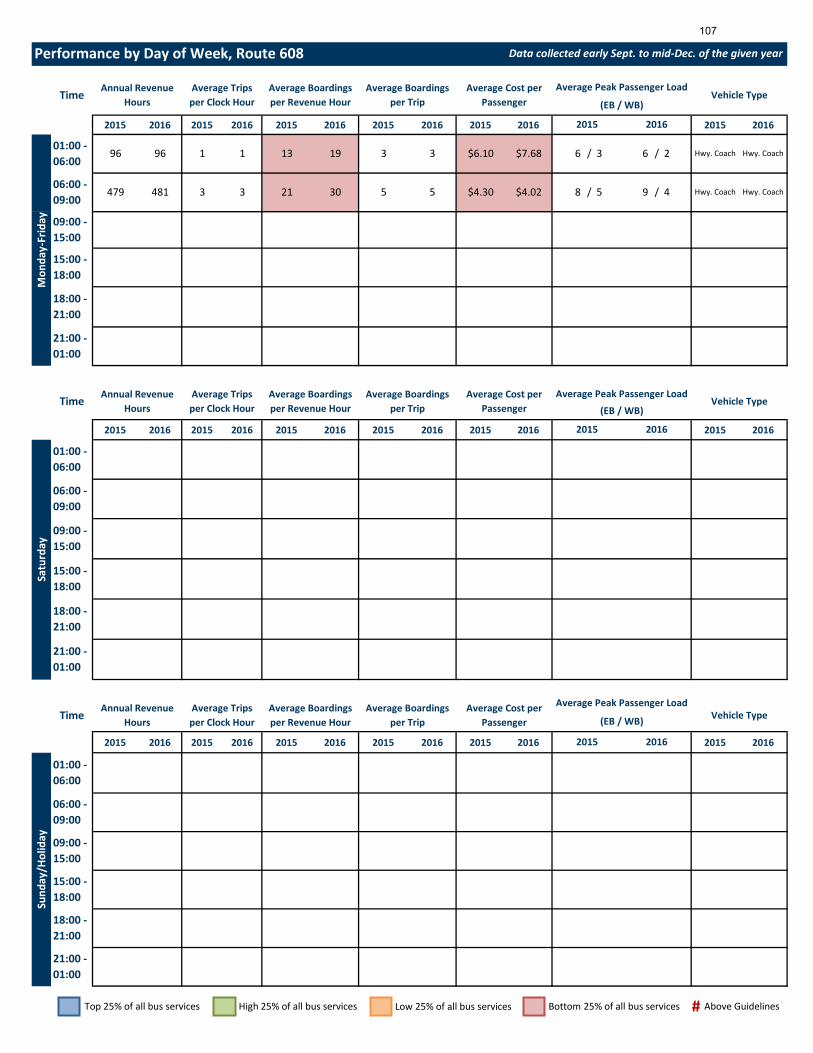
2015 2016 2015 2016 2015 2016 2015 2016 2015 2016 2015 2016
2015 2016 2015 2016 2015 2016 2015 2016 2015 2016 2015 2016
2015 2016 2015 2016 2015 2016 2015 2016 2015 2016 2015 2016
21:00 - 01:00
18:00 - 21:00
2015 2016
Sund
ay/H
olid
ay
01:00 - 06:00
15:00 - 18:00
TimeAnnual Revenue
HoursAverage Trips per Clock Hour
Average Boardings per Revenue Hour
Average Boardings per Trip
Average Cost per Passenger
Average Peak Passenger LoadVehicle Type(EB / WB)
09:00 - 15:00
06:00 - 09:00
21:00 - 01:00
15:00 - 18:00
09:00 - 15:00
06:00 - 09:00
2015 2016
Satu
rday
01:00 - 06:00
18:00 - 21:00
Time Annual Revenue Hours
Average Trips per Clock Hour
Average Boardings per Revenue Hour
Average Boardings per Trip
Average Cost per Passenger
Average Peak Passenger LoadVehicle Type
(EB / WB)
21:00 - 01:00
18:00 - 21:00
Performance by Day of Week, Route 608 Data collected early Sept. to mid-Dec. of the given year
TimeAnnual Revenue
HoursAverage Trips per Clock Hour
Average Boardings per Revenue Hour
Average Boardings per Trip
Average Cost per Passenger
Average Peak Passenger LoadVehicle Type
(EB / WB)
09:00 - 15:00
Hwy. Coach Hwy. Coach
06:00 - 09:00
479 481 3 3 21 30 5 5 $4.30 $4.02 8 / 5 9 / 4 Hwy. Coach Hwy. Coach
2015 2016
Mon
day-
Frid
ay
01:00 - 06:00
96 96 1 1 13 19 3 3 $6.10 $7.68 6 / 3 6 / 2
15:00 - 18:00
Top 25% of all bus services High 25% of all bus services Low 25% of all bus services Bottom 25% of all bus services Above Guidelines#
107

Key CharacteristicsSub-region of Primary Service:
Predominant Vehicle Type: Bus Depot:
Contributes to FTN: NoAverage One-Way Trip Distance (km):
Cost & Performance2012 2013 2014 2015 2016 Rank (2016)
Annual APC Boardings: 25,000 199 of 214 Average Daily APC Boardings (Mon-Fri): 100 199 of 213
Average Daily APC Boardings (Sat): Average Daily APC Boardings (Sun/Hol):
Annual Service Cost: $252,000 $252,000 $252,000 $252,000 $252,000 172 of 216 Annual Revenue Hours: 3,900 3,900 3,900 3,900 3,900 161 of 216
Cost per APC Boarded Passenger: $10.19 211 of 214 Average APC Boardings per Rev. Hour: 6 213 of 214
Average Peak Passenger Load: 1 2 209 of 210Average Peak Load Factor: 3% 7% 208 of 210
Revenue Hours with Overcrowding: Average Speed (km/h):
Service Changes Since December 2010- Fall 2016, Reroute via Canoe Pass Way & Salish Sea Dr to serve new Tsawwassen shopping mall
Cost
Ride
rshi
pU
tiliz
atio
n
No sampling in 2012, 2013, and 2014; very low sampling in 2015 and 2016; 2016 ridership potentially influenced by route realignment in 2016
Route 609
Ladner/South Delta/Tsaww.Mini-BusContracted
108
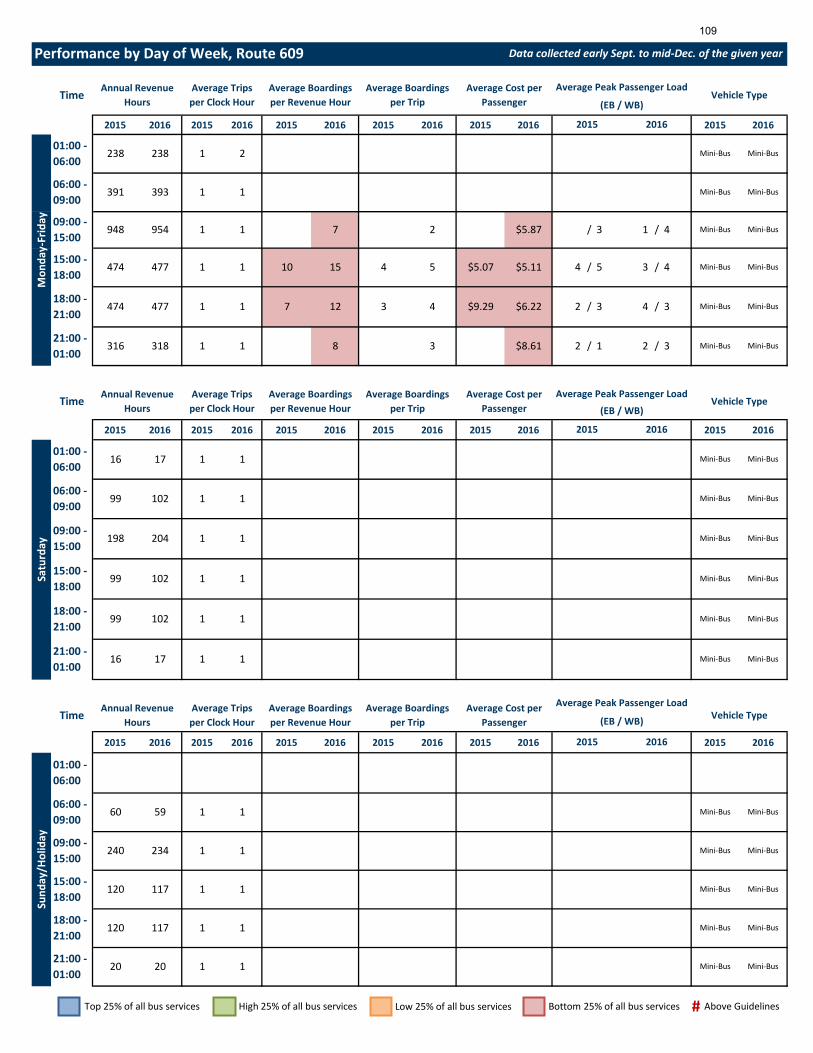
2015 2016 2015 2016 2015 2016 2015 2016 2015 2016 2015 2016
2015 2016 2015 2016 2015 2016 2015 2016 2015 2016 2015 2016
2015 2016 2015 2016 2015 2016 2015 2016 2015 2016 2015 2016
1
1 1 Mini-Bus Mini-Bus
Mini-Bus Mini-Bus
21:00 - 01:00
20 20 1 1 Mini-Bus Mini-Bus
Mini-Bus Mini-Bus
18:00 - 21:00
120 117 1 1
2015 2016
Sund
ay/H
olid
ay
01:00 - 06:00
15:00 - 18:00
120 117 1
TimeAnnual Revenue
HoursAverage Trips per Clock Hour
Average Boardings per Revenue Hour
Average Boardings per Trip
Average Cost per Passenger
Average Peak Passenger LoadVehicle Type(EB / WB)
09:00 - 15:00
240 234 1 1 Mini-Bus Mini-Bus
06:00 - 09:00
60 59
Mini-Bus Mini-Bus
21:00 - 01:00
16 17 1 1 Mini-Bus Mini-Bus
15:00 - 18:00
99 102 1 1
09:00 - 15:00
198 204 1 1 Mini-Bus Mini-Bus
Mini-Bus Mini-Bus
06:00 - 09:00
99 102 1 1 Mini-Bus Mini-Bus
2015 2016
Satu
rday
01:00 - 06:00
16 17 1 1
18:00 - 21:00
99 102 1 1
Mini-Bus Mini-Bus
Mini-Bus
Time Annual Revenue Hours
Average Trips per Clock Hour
Average Boardings per Revenue Hour
Average Boardings per Trip
Average Cost per Passenger
Average Peak Passenger LoadVehicle Type
(EB / WB)
$8.61 2 / 1 2 / 3 Mini-Bus21:00 - 01:00
316 318 1 1 8 3
18:00 - 21:00
474 477 1 1 7 12 3 4 $9.29 $6.22 2 / 3 4 / 3 Mini-Bus Mini-Bus
4 / 5 3 / 4 Mini-Bus Mini-Bus477 1 1 10 15 4 5 $5.07 $5.11
Performance by Day of Week, Route 609 Data collected early Sept. to mid-Dec. of the given year
TimeAnnual Revenue
HoursAverage Trips per Clock Hour
Average Boardings per Revenue Hour
Average Boardings per Trip
Average Cost per Passenger
Average Peak Passenger LoadVehicle Type
(EB / WB)
09:00 - 15:00
948 954 1 1 7 2 $5.87 / 3 1 / 4 Mini-Bus Mini-Bus
Mini-Bus Mini-Bus
06:00 - 09:00
391 393 1 1 Mini-Bus Mini-Bus
2015 2016
Mon
day-
Frid
ay
01:00 - 06:00
238 238 1 2
15:00 - 18:00
474
Top 25% of all bus services High 25% of all bus services Low 25% of all bus services Bottom 25% of all bus services Above Guidelines#
109

Key CharacteristicsSub-region of Primary Service:
Predominant Vehicle Type: Bus Depot:
Contributes to FTN: NoAverage One-Way Trip Distance (km):
Cost & Performance2012 2013 2014 2015 2016 Rank (2016)
Annual APC Boardings: 615,000 616,000 838,000 857,000 818,000 83 of 214 Average Daily APC Boardings (Mon-Fri): 1,750 1,750 2,300 2,200 2,100 96 of 213
Average Daily APC Boardings (Sat): 1,550 1,400 2,000 2,450 2,300 62 of 174 Average Daily APC Boardings (Sun/Hol): 1,550 1,600 2,550 2,850 2,800 48 of 171
Annual Service Cost: $814,000 $807,000 $1,020,000 $986,000 $957,000 110 of 216 Annual Revenue Hours: 8,400 8,300 10,500 10,200 9,900 116 of 216
Cost per APC Boarded Passenger: $1.32 $1.31 $1.26 $1.15 $1.17 33 of 214 Average APC Boardings per Rev. Hour: 73 74 80 84 83 30 of 214
Average Peak Passenger Load: 44 42 45 49Average Peak Load Factor: 58% 56% 60% 66%
Revenue Hours with Overcrowding: 16% 15% 16% 18% Average Speed (km/h): 48.5 49.7 49.1 50.6
Service Changes Since December 2010- Winter 2010, Reroute trips via Ladner Exchange - adding additional trips- Winter 2013, Permanent scheduling change throughout the week to match Victoria Sailings- Fall 2016, Adjust stopping procedure to provide a more direct and faster service btwn Bridgeport and Tsawwassen Ferry
Cost
Ride
rshi
pU
tiliz
atio
n
High number of special-event trips not sampled prior to 2014; no APC sampling in September 2016 sheet
Route 620
Ladner/South Delta/Tsaww.
24.0
Artic. BusRichmond
110

2015 2016 2015 2016 2015 2016 2015 2016 2015 2016 2015 2016
2015 2016 2015 2016 2015 2016 2015 2016 2015 2016 2015 2016
2015 2016 2015 2016 2015 2016 2015 2016 2015 2016 2015 2016
2 65 61 $0.98 55 /
2 2 30 28 $2.00 36 / 25 Artic. Bus Artic. Bus
Artic. Bus Artic. Bus
21:00 - 01:00
208 203 1 1 55 39 $5.10 57 / 5 Artic. Bus Artic. Bus
62 Artic. Bus Artic. Bus
18:00 - 21:00
329 309 2 2 58 56 $1.38 79 / 27
2015 2016
Sund
ay/H
olid
ay
01:00 - 06:00
15:00 - 18:00
478 387 3
TimeAnnual Revenue
HoursAverage Trips per Clock Hour
Average Boardings per Revenue Hour
Average Boardings per Trip
Average Cost per Passenger
Average Peak Passenger LoadVehicle Type(NB / SB)
09:00 - 15:00
689 732 2 2 57 55 $1.41 54 / 51 Artic. Bus Artic. Bus
06:00 - 09:00
209 219
Artic. Bus Artic. Bus
21:00 - 01:00
167 170 1 1 6 5 $10.14 4 / 5 Artic. Bus Artic. Bus
$2.11 20 / 30
15:00 - 18:00
279 321 2 2 29 30
09:00 - 15:00
554 639 2 2 59 57 $1.17 62 / 47 Artic. Bus Artic. Bus
06:00 - 09:00
172 186 2 2 50 46 $1.26 76 / 37 Artic. Bus Artic. Bus
2015 2016
Satu
rday
01:00 - 06:00
$3.08 16
18:00 - 21:00
237 254 2 2 26 27
/ 47 Artic. Bus Artic. Bus
Artic. Bus
Time Annual Revenue Hours
Average Trips per Clock Hour
Average Boardings per Revenue Hour
Average Boardings per Trip
Average Cost per Passenger
Average Peak Passenger LoadVehicle Type
(NB / SB)
$2.28 30 / 10 Artic. Bus21:00 - 01:00
513 442 1 2 46 26
18:00 - 21:00
1,537 1,034 2 2 53 44 $1.93 54 / 29 Artic. Bus Artic. Bus
59 / 64 Artic. Bus Artic. Bus1,271 2 3 64 65 $0.97
Performance by Day of Week, Route 620 Data collected early Sept. to mid-Dec. of the given year
TimeAnnual Revenue
HoursAverage Trips per Clock Hour
Average Boardings per Revenue Hour
Average Boardings per Trip
Average Cost per Passenger
Average Peak Passenger LoadVehicle Type
(NB / SB)
09:00 - 15:00
2,330 2,750 2 2 53 50 $1.09 45 / 46 Artic. Bus Artic. Bus
Artic. Bus
06:00 - 09:00
691 847 2 2 37 35 $1.29 29 / 34 Artic. Bus Artic. Bus
2015 2016
Mon
day-
Frid
ay
01:00 - 06:00
97 1
15:00 - 18:00
1,780
Top 25% of all bus services High 25% of all bus services Low 25% of all bus services Bottom 25% of all bus services Above Guidelines#
111
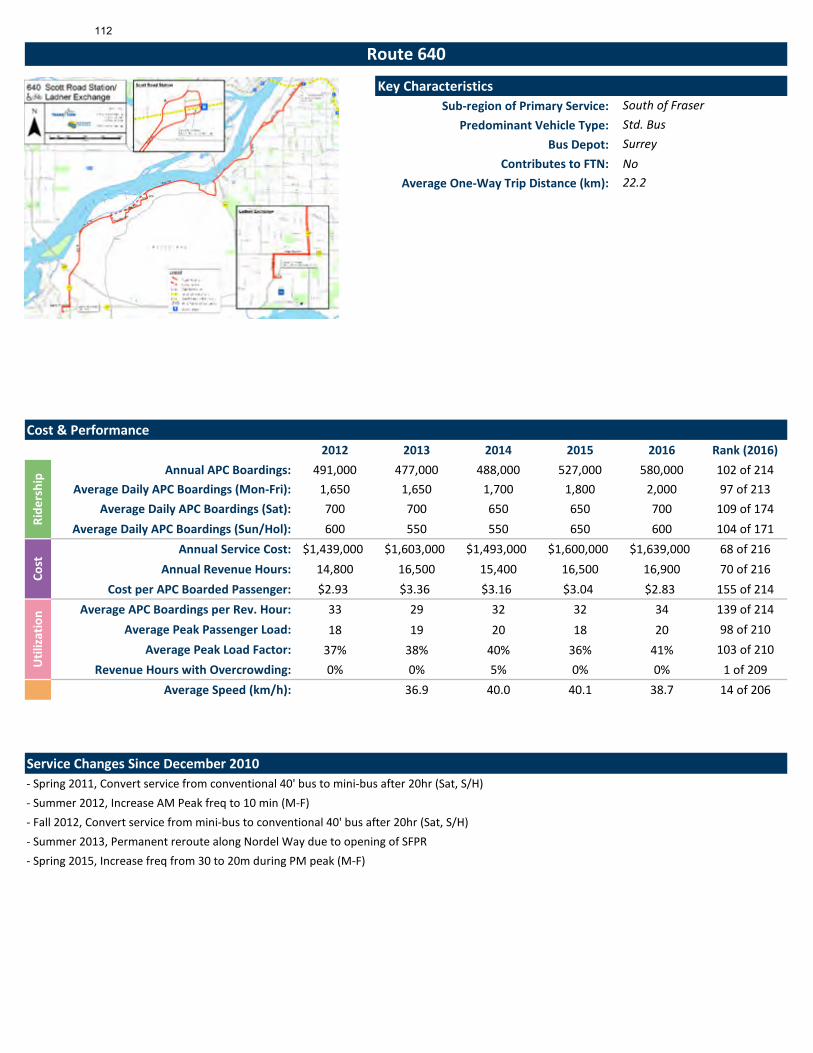
Key CharacteristicsSub-region of Primary Service:
Predominant Vehicle Type: Bus Depot:
Contributes to FTN: NoAverage One-Way Trip Distance (km):
Cost & Performance2012 2013 2014 2015 2016 Rank (2016)
Annual APC Boardings: 491,000 477,000 488,000 527,000 580,000 102 of 214 Average Daily APC Boardings (Mon-Fri): 1,650 1,650 1,700 1,800 2,000 97 of 213
Average Daily APC Boardings (Sat): 700 700 650 650 700 109 of 174 Average Daily APC Boardings (Sun/Hol): 600 550 550 650 600 104 of 171
Annual Service Cost: $1,439,000 $1,603,000 $1,493,000 $1,600,000 $1,639,000 68 of 216 Annual Revenue Hours: 14,800 16,500 15,400 16,500 16,900 70 of 216
Cost per APC Boarded Passenger: $2.93 $3.36 $3.16 $3.04 $2.83 155 of 214 Average APC Boardings per Rev. Hour: 33 29 32 32 34 139 of 214
Average Peak Passenger Load: 18 19 20 18 20 98 of 210Average Peak Load Factor: 37% 38% 40% 36% 41% 103 of 210
Revenue Hours with Overcrowding: 0% 0% 5% 0% 0% 1 of 209 Average Speed (km/h): 36.9 40.0 40.1 38.7 14 of 206
Service Changes Since December 2010- Spring 2011, Convert service from conventional 40' bus to mini-bus after 20hr (Sat, S/H)- Summer 2012, Increase AM Peak freq to 10 min (M-F)- Fall 2012, Convert service from mini-bus to conventional 40' bus after 20hr (Sat, S/H)- Summer 2013, Permanent reroute along Nordel Way due to opening of SFPR- Spring 2015, Increase freq from 30 to 20m during PM peak (M-F)
Cost
Ride
rshi
pU
tiliz
atio
nRoute 640
South of Fraser
22.2
Std. BusSurrey
112

2015 2016 2015 2016 2015 2016 2015 2016 2015 2016 2015 2016
2015 2016 2015 2016 2015 2016 2015 2016 2015 2016 2015 2016
2015 2016 2015 2016 2015 2016 2015 2016 2015 2016 2015 2016
/
2 17 21 10 11 $5.83 $5.04 9 /
1 1 23 40 15 20 $3.32 $2.71 10 / 16 10 / 23 Std. Bus Std. Bus
8 Std. Bus Std. Bus
21:00 - 01:00
158 156 1 1 51 17 28 8 $2.00 $6.65 14 / 33 10 / 4 Std. Bus Std. Bus
10 11 / 8 Std. Bus Std. Bus
18:00 - 21:00
316 318 2 2 22 11 $4.89 11 / 10 14
2015 2016
Sund
ay/H
olid
ay
01:00 - 06:00
15:00 - 18:00
389 392 2
TimeAnnual Revenue
HoursAverage Trips per Clock Hour
Average Boardings per Revenue Hour
Average Boardings per Trip
Average Cost per Passenger
Average Peak Passenger LoadVehicle Type(NB / SB)
09:00 - 15:00
707 712 2 2 17 23 10 12 $6.02 $4.49 9 / 7 11 / 10 Std. Bus Std. Bus
06:00 - 09:00
160 159
Std. Bus Std. Bus
21:00 - 01:00
130 140 1 1 16 42 10 24 $5.61 $2.86 12 / 8 22 / 16 Std. Bus Std. Bus
10 $7.96 $5.41 6 / 6 7 / 10
15:00 - 18:00
330 345 2 2 16 30 11
09:00 - 15:00
604 634 2 2 16 22 11 12 $5.01 $4.65 10 / 9 11 / 11 Std. Bus Std. Bus
06:00 - 09:00
134 140 1 1 36 53 27 33 $1.86 $2.14 26 / 25 17 / 30 Std. Bus Std. Bus
2015 2016
Satu
rday
01:00 - 06:00
16 $5.07 $3.91 12
18:00 - 21:00
262 279 2 2 10 19 7
/ 9 20 / 9 Std. Bus Std. Bus
Std. Bus
Time Annual Revenue Hours
Average Trips per Clock Hour
Average Boardings per Revenue Hour
Average Boardings per Trip
Average Cost per Passenger
Average Peak Passenger LoadVehicle Type
(NB / SB)
$2.60 $2.94 21 / 22 20 / 21 Std. Bus21:00 - 01:00
738 758 1 1 33 38 26 22
18:00 - 21:00
1,480 1,530 2 2 18 28 14 17 $4.67 $3.59 9 / 14 12 / 17 Std. Bus Std. Bus
36 / 16 37 / 18 Std. Bus Std. Bus2,816 3 3 40 49 30 34 $2.51 $2.15
Performance by Day of Week, Route 640 Data collected early Sept. to mid-Dec. of the given year
TimeAnnual Revenue
HoursAverage Trips per Clock Hour
Average Boardings per Revenue Hour
Average Boardings per Trip
Average Cost per Passenger
Average Peak Passenger LoadVehicle Type
(NB / SB)
09:00 - 15:00
3,999 4,050 2 2 24 31 18 21 $4.08 $3.50 16 / 16 19 / 16 Std. Bus Std. Bus
Std. Bus Std. Bus
06:00 - 09:00
3,683 3,832 4 4 32 46 28 32 $2.76 $2.28 14 / 33 15 / 35 Std. Bus Std. Bus
2015 2016
Mon
day-
Frid
ay
01:00 - 06:00
612 633 4 4 36 49 29 31 $2.08 $1.97 / 27 / 29
15:00 - 18:00
2,796
Top 25% of all bus services High 25% of all bus services Low 25% of all bus services Bottom 25% of all bus services Above Guidelines#
113

Key CharacteristicsSub-region of Primary Service:
Predominant Vehicle Type: Bus Depot:
Contributes to FTN: YesAverage One-Way Trip Distance (km):
Cost & Performance2012 2013 2014 2015 2016 Rank (2016)
Annual APC Boardings: 2,023,000 2,058,000 2,019,000 1,977,000 2,085,000 40 of 214 Average Daily APC Boardings (Mon-Fri): 6,000 6,150 6,000 5,900 6,150 43 of 213
Average Daily APC Boardings (Sat): 5,000 5,100 5,100 5,050 5,300 32 of 174 Average Daily APC Boardings (Sun/Hol): 4,000 4,100 4,100 3,900 4,150 33 of 171
Annual Service Cost: $3,848,000 $3,848,000 $3,848,000 $3,872,000 $3,906,000 30 of 216 Annual Revenue Hours: 39,700 39,700 39,700 39,900 40,300 30 of 216
Cost per APC Boarded Passenger: $1.90 $1.87 $1.97 $1.96 $1.87 102 of 214 Average APC Boardings per Rev. Hour: 51 52 51 50 52 94 of 214
Average Peak Passenger Load: 24 24 23 24 22 84 of 210Average Peak Load Factor: 48% 46% 44% 43% 42% 94 of 210
Revenue Hours with Overcrowding: 1% 0% 0% 0% 0% 1 of 209 Average Speed (km/h): 29.4 29.7 28.9 26.2 70 of 206
Service Changes Since December 2010- Fall 2011, Schedule adjustments to meet demand increase & maximize connectivity with #595 all days- Summer 2012, Extend PM peak trip to Maple Ridge East- Fall 2012, Extend 13:47 trip from Haney Place to Male Ridge East
Cost
Ride
rshi
pU
tiliz
atio
nRoute 701
Maple Ridge/Pitt Meadows
19.9
Std. BusPort Coquitlam
114

2015 2016 2015 2016 2015 2016 2015 2016 2015 2016 2015 2016
2015 2016 2015 2016 2015 2016 2015 2016 2015 2016 2015 2016
2015 2016 2015 2016 2015 2016 2015 2016 2015 2016 2015 2016
/
4 51 59 42 42 $1.71 $1.73 28 /
3 3 26 36 22 22 $3.00 $3.34 9 / 19 6 / 18 Artic. Bus & Std. Bus
Std. Bus
11 Artic. Bus & Std. Bus
Std. Bus
21:00 - 01:00
582 575 2 2 26 36 20 24 $4.04 $3.54 17 / 9 17 / 8 Artic. Bus & Std. Bus
Std. Bus
19 26 / 15 Artic. Bus & Std. Bus
Std. Bus
18:00 - 21:00
985 963 4 4 37 44 29 29 $2.35 $2.35 24 / 13 19
2015 2016
Sund
ay/H
olid
ay
01:00 - 06:00
27 27 1 1 28 20 12 9 $3.58 $4.78 10 / 7 /
15:00 - 18:00
1,092 1,071 4
TimeAnnual Revenue
HoursAverage Trips per Clock Hour
Average Boardings per Revenue Hour
Average Boardings per Trip
Average Cost per Passenger
Average Peak Passenger LoadVehicle Type(EB / WB)
09:00 - 15:00
2,240 2,194 4 4 39 52 35 38 $2.10 $1.92 17 / 24 15 / 22 Artic. Bus & Std. Bus
Std. Bus
Std. Bus Std. Bus
06:00 - 09:00
659 648
Artic. Bus & Std. Bus
Std. Bus
21:00 - 01:00
513 526 2 2 45 32 $2.52 23 / 16 23 / 12 Artic. Bus & Std. Bus
Std. Bus
35 $2.07 $2.09 27 / 14 27 / 12
15:00 - 18:00
963 998 4 4 50 66 47
09:00 - 15:00
1,993 2,052 4 4 48 57 45 45 $1.71 $1.76 22 / 29 18 / 27 Artic. Bus & Std. Bus
Std. Bus
Std. Bus Std. Bus
06:00 - 09:00
737 750 4 4 31 41 26 28 $2.81 $2.59 11 / 22 9 / 21 Artic. Bus & Std. Bus
Std. Bus
2015 2016
Satu
rday
01:00 - 06:00
52 53 2 2 37 37 18 19 $2.77 $2.59 11 / 13 /
52 $1.62 $1.49 31
18:00 - 21:00
741 755 4 4 41 52 34
/ 24 32 / 21 Artic. Bus & Std. Bus
Std. Bus
Std. Bus
Time Annual Revenue Hours
Average Trips per Clock Hour
Average Boardings per Revenue Hour
Average Boardings per Trip
Average Cost per Passenger
Average Peak Passenger LoadVehicle Type
(EB / WB)
$2.82 $2.95 28 / 13 26 / 11 Artic. Bus & Std. Bus
21:00 - 01:00
2,568 2,608 2 2 34 43 32 32
18:00 - 21:00
4,605 4,624 4 4 33 43 31 35 $2.59 $2.37 22 / 15 24 / 12 Artic. Bus & Std. Bus
Std. Bus
35 / 27 34 / 27 Artic. Bus & Std. Bus
Std. Bus6,164 4 4 56 66 62 65 $1.62 $1.60
Performance by Day of Week, Route 701 Data collected early Sept. to mid-Dec. of the given year
TimeAnnual Revenue
HoursAverage Trips per Clock Hour
Average Boardings per Revenue Hour
Average Boardings per Trip
Average Cost per Passenger
Average Peak Passenger LoadVehicle Type
(EB / WB)
09:00 - 15:00
10,250 10,248 4 4 49 58 49 49 $1.71 $1.71 23 / 26 19 / 23 Artic. Bus & Std. Bus
Std. Bus
Artic. Bus & Std. Bus
Std. Bus
06:00 - 09:00
4,645 4,737 4 4 49 57 48 48 $1.73 $1.73 25 / 25 20 / 23 Artic. Bus & Std. Bus
Std. Bus
2015 2016
Mon
day-
Frid
ay
01:00 - 06:00
1,271 1,280 2 2 28 37 19 22 $3.31 $2.98 12 / 15 11 / 17
15:00 - 18:00
5,992
Top 25% of all bus services High 25% of all bus services Low 25% of all bus services Bottom 25% of all bus services Above Guidelines#
115

Key CharacteristicsSub-region of Primary Service:
Predominant Vehicle Type: Bus Depot:
Contributes to FTN: NoAverage One-Way Trip Distance (km):
Cost & Performance2012 2013 2014 2015 2016 Rank (2016)
Annual APC Boardings: 594,000 619,000 628,000 633,000 688,000 95 of 214 Average Daily APC Boardings (Mon-Fri): 2,350 2,500 2,500 2,550 2,750 79 of 213
Average Daily APC Boardings (Sat): Average Daily APC Boardings (Sun/Hol):
Annual Service Cost: $1,519,000 $1,378,000 $1,368,000 $1,394,000 $1,428,000 80 of 216 Annual Revenue Hours: 15,700 14,200 14,100 14,400 14,700 84 of 216
Cost per APC Boarded Passenger: $2.56 $2.23 $2.25 $2.20 $2.07 117 of 214 Average APC Boardings per Rev. Hour: 38 44 45 44 47 107 of 214
Average Peak Passenger Load: 29 28 28 29 27 49 of 210Average Peak Load Factor: 58% 56% 56% 57% 54% 48 of 210
Revenue Hours with Overcrowding: 8% 0% 0% 0% 0% 1 of 209 Average Speed (km/h): 34.0 34.1 33.8 32.6 24 of 206
Service Changes Since December 2010- Winter 2010, Improve freq to 20m during AM & PM peak (M-F)
Cost
Ride
rshi
pU
tiliz
atio
nRoute 791
Maple Ridge/Pitt Meadows
21.6
Std. BusPort Coquitlam
116
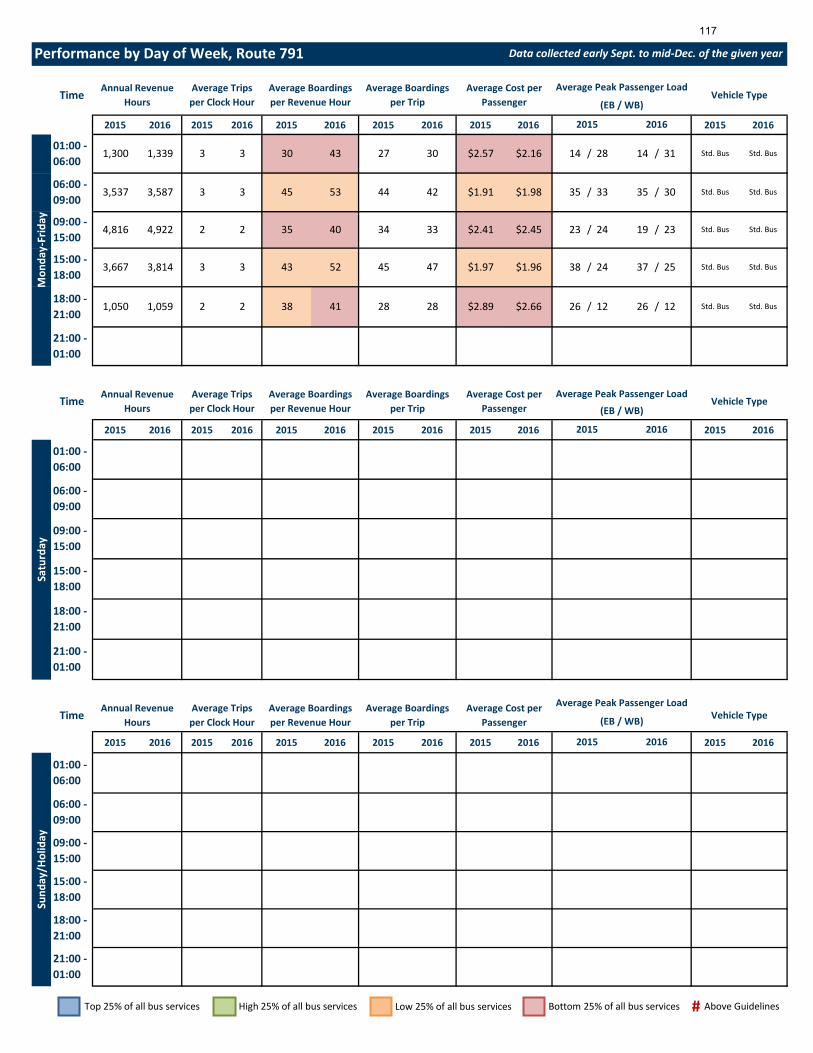
2015 2016 2015 2016 2015 2016 2015 2016 2015 2016 2015 2016
2015 2016 2015 2016 2015 2016 2015 2016 2015 2016 2015 2016
2015 2016 2015 2016 2015 2016 2015 2016 2015 2016 2015 2016
21:00 - 01:00
18:00 - 21:00
2015 2016
Sund
ay/H
olid
ay
01:00 - 06:00
15:00 - 18:00
TimeAnnual Revenue
HoursAverage Trips per Clock Hour
Average Boardings per Revenue Hour
Average Boardings per Trip
Average Cost per Passenger
Average Peak Passenger LoadVehicle Type(EB / WB)
09:00 - 15:00
06:00 - 09:00
21:00 - 01:00
15:00 - 18:00
09:00 - 15:00
06:00 - 09:00
2015 2016
Satu
rday
01:00 - 06:00
18:00 - 21:00
Time Annual Revenue Hours
Average Trips per Clock Hour
Average Boardings per Revenue Hour
Average Boardings per Trip
Average Cost per Passenger
Average Peak Passenger LoadVehicle Type
(EB / WB)
21:00 - 01:00
18:00 - 21:00
1,050 1,059 2 2 38 41 28 28 $2.89 $2.66 26 / 12 26 / 12 Std. Bus Std. Bus
38 / 24 37 / 25 Std. Bus Std. Bus3,814 3 3 43 52 45 47 $1.97 $1.96
Performance by Day of Week, Route 791 Data collected early Sept. to mid-Dec. of the given year
TimeAnnual Revenue
HoursAverage Trips per Clock Hour
Average Boardings per Revenue Hour
Average Boardings per Trip
Average Cost per Passenger
Average Peak Passenger LoadVehicle Type
(EB / WB)
09:00 - 15:00
4,816 4,922 2 2 35 40 34 33 $2.41 $2.45 23 / 24 19 / 23 Std. Bus Std. Bus
Std. Bus Std. Bus
06:00 - 09:00
3,537 3,587 3 3 45 53 44 42 $1.91 $1.98 35 / 33 35 / 30 Std. Bus Std. Bus
2015 2016
Mon
day-
Frid
ay
01:00 - 06:00
1,300 1,339 3 3 30 43 27 30 $2.57 $2.16 14 / 28 14 / 31
15:00 - 18:00
3,667
Top 25% of all bus services High 25% of all bus services Low 25% of all bus services Bottom 25% of all bus services Above Guidelines#
117


