Mobility Irregularity Detection with Smart Transit Card Data

Transit Mobility Report
Report to the Legislature
December 22, 2016
For more information, contact: Don Chartock, Project Delivery Manager WSDOT Public Transportation Division (360)705-7928; [email protected]

Mobility Transit Report 2016
2
Title VI Notice to Public It is the Washington State Department of Transportation’s (WSDOT) policy to assure that no person shall, on the grounds of race, color, national origin or sex, as provided by Title VI of the Civil Rights Act of 1964, be excluded from participation in, be denied the benefits of, or be otherwise discriminated against under any of its federally funded programs and activities. Any person who believes his/her Title VI protection has been violated, may file a complaint with WSDOT’s Office of Equal Opportunity (OEO). For additional information regarding Title VI complaint procedures and/or information regarding our non-discrimination obligations, please contact OEO’s Title VI Coordinator at (360) 705-7082.
Americans with Disabilities Act (ADA) Information This material can be made available in an alternate format by emailing the Office of Equal Opportunity at [email protected] or by calling toll free, 855-362-4ADA(4232). Persons who are deaf or hard of hearing may make a request by calling the Washington State Relay at 711.
Notificación de Titulo VI al Público Es la póliza de el Departamento de Transportes del Estado de Washington de asegurar que ninguna persona sea excluida de participación o sea negado los beneficios, o sea discriminado bajo cualquiera de sus programas y actividades financiado con fondos federales sobre la base de raza, color, origen nacional o sexo, como proveído por el Título VI de el Acto de Derechos Civiles de 1964. Cualquier persona que cree que sus protecciones de Titulo VI han sido violadas, puede hacer una queja con la Oficina de Igualdad de Oportunidades (OEO). Para información adicional con respecto a procedimientos de quejas de Titulo VI y/o información con respecto a nuestras obligaciones sin discriminación, por favor de comunicarse con el Coordinador de Titulo VI de la Oficina de Igualdad de Oportunidades (OEO) (360) 705-7082.
Información del Acta Americans with Disabilities Act (ADA) Este material es disponible en un formato alternative. Envie su petición por correo electrónico al equipo de Oficina de Igualdad de Oportunidades (OEO) en [email protected] o llamando gratis, 855-362-4ADA (4232). Personas sordas o con problemas de audición pueden solicitar llamando el relé de estado de Washington al 711.
Solduc River Road, Clallam County – now Highway 101

Mobility Transit Report 2016
3
Table of Contents – Reports to the Legislature
Introduction and Purpose
4
Public Transportation Division Overview
4
Office of Transit Mobility - (RCW 47.01.330)
5
Regional Mobility Grant Program - (RCW 47.66.030)
10
RMG Performance Measures by Project
12
Rural Mobility Grant Program – (RCW 47.66.100)
14

Mobility Transit Report 2016
4
Introduction and Purpose More and more, people in Washington are using alternatives to driving alone in order to gain access to jobs, goods, services, schools, and community activities. These alternatives are supported by public and private partners including local governments and transit agencies, intercity bus service providers, community transportation providers, transportation network companies, and state and federal agencies.
The purpose of this report is to provide updates on several public transportation mobility initiatives and to fulfill reporting requirements identified in the following state statutes:
RCW 47.01.330 – Office of Transit Mobility
RCW 47.66.030 – Regional Mobility Grants program
RCW 47.66.100 – Rural Mobility Grant program
Public Transportation Division Overview The Public Transportation Division (Division) in the Washington State Department of Transportation (WSDOT) provides leadership,
support, and technical expertise to the statewide network of public transportation agencies and providers. Through the use of policy
and planning, community engagement, grant management, and compliance oversight, the Division supports the safety and
effectiveness of the public transportation system. The Division uses performance measures and data and evaluation to monitor
trends, guide local and regional project development, and help determine future needs in public transportation.
Kittitas Park and Ride (I90 – exit 78) Completed October 2016

Mobility Transit Report 2016
5
Office of Transit Mobility - (RCW 47.01.330) State legislation in 2005 called for WSDOT to develop an Office of Transit Mobility (Office) to facilitate connection and
coordination of transit services and planning, and to maximize opportunities to use public transportation to improve the
efficiency of transportation corridors. The Division incorporated these goals into its ongoing work within its existing structures.
The Division is focused on incorporation of multimodal integration across offices and divisions, such as how public
transportation and transportation demand management are part of initial project planning through the design process. The
statutorily mandated duties are identified in bold below.
Develop a statewide strategic plan that creates common goals for transit agencies and reduces competing plans for cross-
jurisdictional service
Following an extensive planning and community engagement effort the Division published the Washington State Public
Transportation Plan (WSPTP) in June of 2016. This plan, developed by WSDOT along with transportation agencies and
service providers throughout Washington, is a blueprint to help guide decisions and integrate all modes of public
transportation to better meet our needs over the next 20 years. The plan identifies the following five goals, each with
strategies and near term actions:
i. THRIVING COMMUNITIES – Cultivate thriving communities by supporting health, equity, prosperous
economies, energy conservation, and a sustainable environment through transportation.
ii. ACCESS – Provide and sustain transportation that allows people of all ages, abilities, and geographic
locations to access jobs, goods, services, schools, and community activities.
iii. ADAPTIVE TRANSPORTATION CAPACITY - Use new technologies and partnerships to make better use
of existing transportation assets and meet changing customer needs.
iv. CUSTOMER EXPERIENCE – Enhance everyone’s transportation experience by providing public
transportation that is safe, seamless, pleasant, convenient, reliable, relevant, and understandable.
v. TRANSPORTATION SYSTEM GUARDIANSHIP – Protect, conserve and manage Washington’s
transportation assets in a manner that maximizes and sustains their value to the public, public
transportation, and the statewide transportation system.
WSDOT and partners are now developing action plans to implement the near-term actions identified in the plan.
Develop a Park and Ride program
WSDOT’s park and ride program is multifaceted and includes compiling and sharing information, funding construction
of new park and ride lots (through grants), entering into maintenance and operations agreements with local agencies
(for WSDOT owned park and ride lots), and in some instances, constructing, managing, and maintaining the park and
ride lots. The Division maintains a map and list of park and ride lots across the state, and a more detailed map of park
and ride lots in the greater Seattle area, including average occupancy rates. As demand grows for use of these lots,
there is a need to further address the capacity of existing lots and how they are managed. Several options are being
actively considered and pilot projects have explored the viability of certain strategies. For example, Sound Transit is
implementing a permit program at their most popular park and ride lots to provide people that carpool with priority
parking. As described below, WSDOT grants have funded a number of new park and ride lots across the state. Many
transit agencies, along with WSDOT, are building partnerships to add new park and rides and increase capacity at
existing lots. From asking churches and community centers to share lot space to working with developers and property
owners to include park and rides under new residential and retail buildings, innovation is expanding the use of this
demand management strategy.
Mobility Transit Report 2016
6
Encourage long-range transit planning
Each transit agency is required by law to complete a Transit Development Plans (TDPs - RCW 35.58.2795). These plans
cover a 6-year period of time and are to be updated every year. In the Central Puget Sound area, transit agencies
coordinate their plans through the Puget Sound Regional Council (PSRC) – a coordinating and planning agency focused
in the areas of transportation, economic development, and growth management. Transit agencies within this regional
area contribute to PSRC’s transportation planning efforts as well as creating their own plans, in order to best meet the
needs of their individual service patrons. All TDPs are required to be filed with WSDOT.
Links to all the transit agencies’ transit development plans are listed for each agency here.
Local Coordinated Public Transit - Human Services Transportation Plans (CTP-HSTPs) identify the transportation needs
of people with disabilities, older adults, and people with low incomes in a particular area. These plans list unmet human
transportation needs and service gaps (unserved and underserved areas), and identify strategies for filling the gaps. The
plans focus on coordinating services among the public and human service transportation providers to maximize the use
of limited transportation resources. CTP-HSTPs are updated every four years and are used to help prioritize needs.
WSDOT prepares a statewide HSTP to identify statewide human services transportation gaps, investigate best practices
for planning and service delivery, and develop common strategies for improving access and enhancing mobility for
target populations. These plans provide useful information for WSDOT planners including who provides transportation
services in a given area, what human services transportation needs and gaps exist, and what strategies local
communities have identified to address the greatest needs in their area.
Provide public transportation expertise to improve linkages between regional transportation planning organizations and
transit agencies
Transit agencies and other public transportation providers work closely with their Regional Transportation Planning
Organization (RTPO), Metropolitan Planning Organization (MPO), and other planning organizations in order to have a
coordinated service area, make sure services are getting to those in need, and to reduce duplication. The assistance
provided by RTPOs, especially with small agencies with limited staff and planning resources, is invaluable. One example
of this coordination is in the development of Human Services Transportation Plans (described above), which are
prepared by the RTPOs, with the participation of relevant transit agencies. The RTPOs also have a role in prioritizing
public transportation grant applications, often submitted by these local transit agencies. Per WSDOT policy, these grant
applications must serve to meet a need identified in the HSTP prepared by the RTPO. These planning and project
development requirements are one way that WSDOT promotes linkages between these entities. Another example is
through the Commute Trip Reduction (CTR) program, where local jurisdictions, often in collaboration with the local
transit agencies, develop their local CTR program, which must then be approved by the RTPO.
Public Transportation Division staff work regionally with transit agencies, community transportation providers, and
other transportation partners to support and encourage linkages between agencies and their local or regional planning
agencies. The relationships among all three entities helps accomplish short term projects and develop long-range plans
on a local and regional basis.
Strengthen policies for inclusion of transit and transportation demand management strategies in route development,
corridor plan standards, and budget proposals

Mobility Transit Report 2016
7
There are many opportunities to strengthen policies for the inclusion of transit and transportation demand
management within the transportation system. Below are several examples where this is done.
Practical Solutions: WSDOT delivers transportation plans, projects, and services using an approach called Practical
Solutions. This approach focuses on the performance gaps that need to be addressed early in the planning process.
There are eight stages in the lifecycle of transportation system development and the Practical Solutions approach
applies throughout. Each stage has opportunities for the public to engage. Below is a visualization of the “process
map.” WSDOT’s 2016 update to the Community Engagement Plan (currently available for public comment) explains
how the public and agencies can most effectively engage during each of the stages along this continuum.
For example, during the “Identify Needs” and “Assess Alternative Strategies” periods of planning, transit providers and
freight haulers who participate in the corridor level studies can help WSDOT identify current and future needs, and
brainstorm solutions that work on and off network.
Corridor Sketch: The Division is one of many partners across WSDOT actively working to integrate investments that lead
to better planning and programming throughout transportation corridors, where demand management, operational
improvements, and highway capital investments are strategically part of the solution.
Secretary’s Executive Order E1096.00: On July 15, 2015, the Secretary of Transportation issued this executive order to
direct and lead the agency toward being “…the best in providing a sustainable and integrated multimodal system.1” The
purpose of this order is to provide clear guidance and expectations to employees in carrying out WSDOT transportation
services, programs and projects in the implementation of WSDOT’s budget and strategic plan. In E1096.00, there are
directions and expected behaviors linking to integrated and customer-focused outcomes. Within this policy, are specific
directions on engaging partners and the community, to exercise Practical Solutions processes, reinforcing safety
practices and promoting Washington small businesses.
Update to WSDOT Design Manual Chapter 1100: WSDOT updated the Design Manual to align with practical design and
community engagement priorities as identified in the strategic plan Results WSDOT. Design Manual Chapter 1100
directs project managers to use performance-based approaches and engage with partner agencies, communities, and
stakeholders. It also identifies how transit agencies and transit and freight operational issues are to be included in the
scoping and project development process.
Examples of how the Division supports efforts related to Transportation Demand Management (TDM) in practice:
Regional Mobility Grant projects – listed later in this report – demonstrate many ways TDM concepts, policies,
and financial commitments are part of the budgetary and programmatic efforts supported by the Division.
Many of the projects recommended to the state legislature for funding are specifically for TDM (Interstate 90,
1 WSDOT Secretary’s Executive Order E1096.00, July 15, 2015. Introduction.
Mobility Transit Report 2016
8
for example), while others are focused on having corridors that focus on increasing people throughput (C-
TRAN’s Fourth Plain and Community Transit’s Swift II Bus Rapid Transit projects). King County Metro’s (KCM)
Park and Ride Efficiency and Access project looks at how the park and ride services can better support
utilization and access for transit riders.
Another example is the TDM work of KCM during the Alaskan Way Viaduct Program project. To keep people
and goods moving during construction of the Alaskan Way Viaduct, WSDOT investments enhance transit and
water taxi service, improve bus monitoring equipment, and provide transportation demand management
(TDM) services.
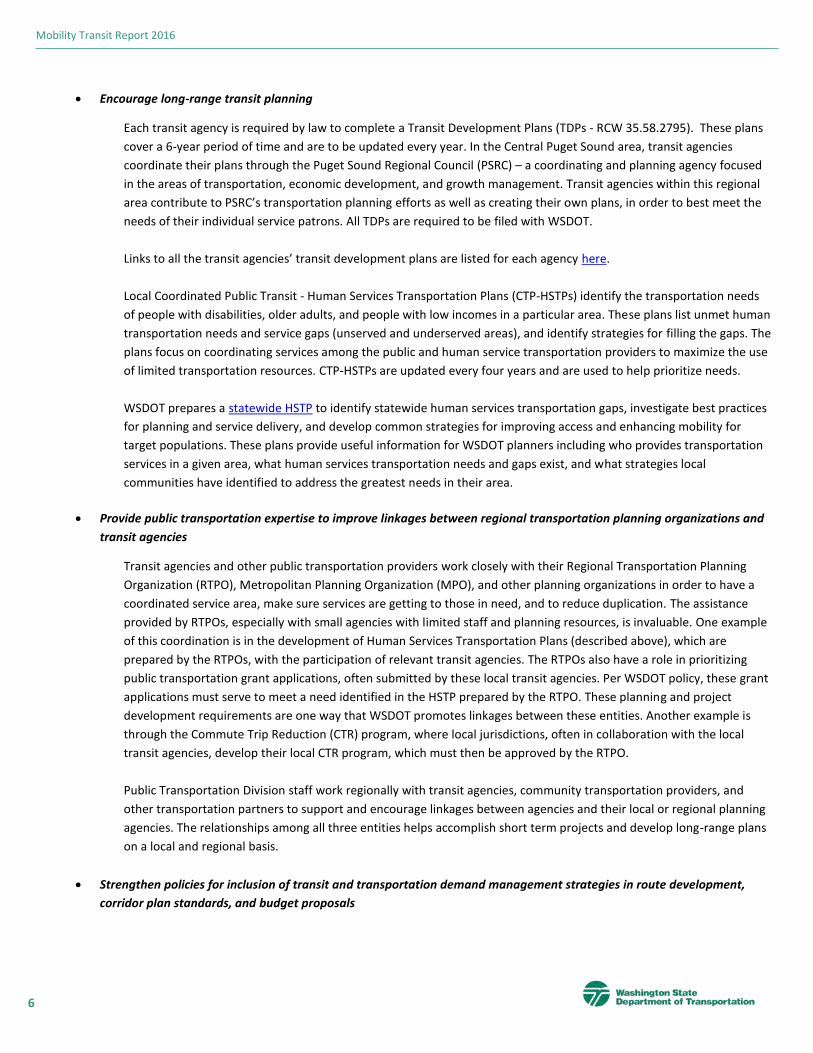
Traffic mitigation techniques include a variety of strategies – such as signage, media announcements, social
media promotion, increasing transit availability, promoting programs like Uber and Lyft, and other initiatives -
a well-coordinated effort helps alleviate the traffic stress in areas with construction projects. Performance is
gauged on a variety of factors, including ridership, utilization, capacity, and travel time.
Burlington Construction June 2016

Mobility Transit Report 2016
9
Recommend best practices to integrate transit and demand management strategies with regional and local land use
plans in order to reduce traffic and improve mobility and access
As described above, the Practical Solutions process brings into play consideration and integration of a strong
multimodal transportation system. The Division – and its partners – are fully engaged in these processes at the state,
regional, and local levels, supporting a transit orientation to development. An example of this is the work of the Division
in support of Sound Transit. Division staff work closely with Sound Transit planners, Puget Sound Regional Council, and
other partners to ensure land use regulations are followed and in alignment with regional plans.
Local Commute Trip Reduction (CTR) plans also must describe the link between CTR and land use, as exhibited in
Washington Administrative Code (WAC) 468-63-040, requiring such plans. These plans are required when new CTR
programs are put in place, or if changes are made to the current plan. The plans are reviewed by the CTR Board.
Produce recommendations for the public transportation section of the Washington transportation plan
The next Washington Transportation Plan will be finalized by December 2017. The Division has been actively involved
in its development. Information gathered during an extensive community engagement process with the Division’s plan
informs recommendations made to the Washington Transportation Plan. Division staff are currently helping identify
areas of alignment between the two plans.
Participate in corridor planning, including freight, ferry system, and passenger rail planning
A recent letter was sent to all transit agencies from the Division’s director, Brian Lagerberg, identifying upcoming
projects that transit agencies should be aware of in order to identify opportunities for engagement in early planning
stages. The Division will continue this practice into the future. Other examples of this work include the efforts of
Division staff to help in light rail station planning with Sound Transit, Division staff working with King County Metro to
mitigate transit impacts during construction of the Alaska Way Viaduct and Seawall –including coordination and transit
planning with Washington State Ferries, and service planning with the Travel Washington transportation providers,
enabling connections to interstate transportation options including Amtrak, Northwest Trailways, Greyhound bus lines,
SeaTac International Airport.
Develop performance objectives related to initiatives in relation to overall goals of the office of transit mobility
The Division incorporates performance objectives throughout many of its initiatives. Two examples include:
1. Regional Mobility Grant performance measures – Grant applicants are required to estimate the annual
reduction in vehicle miles traveled (VMT) and vehicle trips (VT) that will result from their project when they
submit their application for a grant. Division staff work with grantees who are awarded funds for their project
to more fully delineate the measures and methodology of measuring performance. Grantees must then
measure and report these for four years post completion of their project.
2. Summary of Public Transportation – This annual report presents a great deal of individual transit agency and
statewide data related to VMT, VT, ridership, costs, revenues, and service information. The document is useful
for seeing state-wide trends and system performance, giving the ability to identify service needs.

Mobility Transit Report 2016
10
Regional Mobility Grant Program - (RCW 47.66.030)
The purpose of the Regional Mobility Grant program is to deliver mobility projects that are cost-effective, reduce travel delay for
people and goods, improve connectivity between counties and regional population centers, and are consistent with local and
regional transportation and land use plans. In the 2015-2017 biennium, over $66 million in grants were provided to support 39
projects.
Awarded projects for 2015-2017
Organization Project Title Award
Ben Franklin Transit Tulip Lane Park and Ride $200,000
City of Fife Bus Shelter Installation $75,000
City of Kent Kent Transit Center 1st Ave N Parking $272,000
City of Seattle Rainier/Jackson Transit Priority Corridor Improvements $450,000
City of Shoreline N 192nd St. to N 205th St BAT Lanes $200,000
City of Tacoma Tacoma Link Expansion Phase 1 $2,500,000
City of Tukwila Urban Center Pedestrian Bridge $6,270,000
Community Transit Mukilteo Park and Ride Plus $3,480,000
Community Transit Seaway Transit Center Swift II BRT $3,000,000
C-TRAN Fisher's Landing Transit Center South Parking Expansion $2,849,000
C-TRAN Fourth Plain Bus Rapid Transit $2,700,000
Grant Transit Authority GTA Multimodal Transit Center $1,598,000
Grays Harbor Transit Run Cutting Software Purchase $56,000
Intercity Transit Tumwater-DuPont-Lakewood Express Bus $1,375,000
Intercity Transit Olympia-Seattle Express Bus $640,000
Jefferson Transit Authority SR 20/Four Corners Road Park and Ride $1,040,000
King County Metro I-405 Corridor Managing Demand $1,456,000
King County Metro Rapid Ride F Line Service $1,547,000
King County Metro I-90 Manage Demand $2,880,000
King County Metro Route 245 Corridor Speed and Reliability Improvement $2,192,000
King County Metro SR 522 and I-5 Operating $1,737,000
King County Metro Park and Ride Efficiency and Access Project $1,040,000
Kitsap Transit Poulsbo SR 305/3 Park and Ride $200,000

Mobility Transit Report 2016
11
Organization Project Title Award
Kitsap Transit SR 305 Interchange Imp. $2,025,000
Kittitas County I-90 Exit 78 Park and Ride $223,000
Link Transit Wenatchee Riverfront Shuttle $1,260,000
Mason County Transportation
Authority
Regional Express Commuter Bus Service $1,317,000
Mason County Transportation
Authority
Park and Ride Development $2,250,000
Pierce Transit Route 1 Connections/Route 4 122th Street Peak Hour Service $2,321,000
Pierce Transit SR 7/Pacific Avenue Peak Hour Service Expansion $1,264,000
Pullman Transit Two, 40-foot Electric Hybrid Buses to Increase Capacity $1,056,000
Seattle DOT Broadway Streetcar Extension $4,000,000
Seattle DOT 23rd Avenue Transit Improvements $700,000
Sound Transit High Capacity Double Decker Bus Project $4,000,000
Sound Transit Sumner Station Access Improvements $3,000,000
Spokane Transit Authority West Plains Transit Center $1,740,000
Spokane Transit Authority Central City Line $1,950,000
Town of Concrete Silo Park and Superior Avenue Park and Ride Improvement $477,000
WSDOT SR 525 Pedestrian Improvements $527,000
Rounding to the nearest thousandth $383,000
Total $66,250,000
Performance Measures of Regional Mobility Grants
The Division has strengthened its focus on data, evaluation, and performance, creating a team with specific skills to
help public transportation agencies and programs better evaluate and measure project benefits. This allows the
Division, as well as our partners to develop tools for evaluation, determine benchmarks, and use results to better
support program decisions.
Starting with the 2009/2011 biennium, each recipient of Regional Mobility funds has/had a requirement to report on
the performance of their project for four years after project completion. The following table shows the annual VMT and
VT reductions realized as a result of the completion of each project. Those projects that are still being developed, built,
or are underway -but not completed - do not have to report their performance measure progress at this time. They will
be conveyed in future reports.

Mobility Transit Report 2016
12
Performance of Regional Mobility Projects
Biennium Originally Funded
Grantee Name Project Name Grant
Amount
Estimated Total Project
Cost
Completion Date
Reduction in Vehicle Miles Traveled -
Estimates Reduction in Vehicle Miles Traveled - Actuals
Reduction in Vehicle Trips -
Estimates Reduction in Vehicle Trips - Actuals
Year 1 Year 4 Year 1 Year 2 Year 3 Year 4 Year 1 Year 4 Year 1 Year 2 Year 3 Year 4
2007-2009 Link Transit North Wenatchee Park & Ride $752,400 $836,000 7/11/2008 392,700 84,150
2007-2009 City of Kenmore SR-522 Multi-Modal Corridor Project - Phase II $1,800,000 $23,112,168 12/3/2008 5,092,698 425,100
2007-2009 Skagit Transit/Island Transit Skagit / Island Commuter Express Connector Service to Everett Station $1,440,000 $1,600,000 7/1/2009 5,030,955 143,403
2007-2009 Community Transit Swift Bus Rapid Transit - Transit Station $2,383,001 $27,644,189 7/2/2009 4,243,430 8,036,800 4,572,638 6,698,710 6,729,816 6,709,181 642,944 803,680 692,824 1,014,956 1,121,636 1,118,197
2007-2009 C-Tran I-5 Commuter Service Augmentation $590,000 $759,000 7/15/2009 2,036,980 140,660
2007-2009 Everett Transit Swift Bus Rapid Transit - Northern Terminal at Everett Station $1,989,823 $2,235,756 1/12/2010 8,036,800 803,680
2007-2009 Kitsap Transit Harper Park & Ride Expansion $2,400,000 $6,936,865 6/30/2010 15,288,000 16,653,000 7,061,600 7,848,540 7,848,540 6,042,400 218,400 273,000 50,440 56,160 56,160 43,160
2007-2009 Sound Transit Expand Commuter Rail Parking in Tacoma-Seattle Corridor $3,700,000 $4,200,000 2/17/2011 4,772,040 7,283,640 4,638,088 5,492,032 6,446,440 6,814,808 148,200 226,200 144,040 170,560 200,200 211,640
2007-2009 Sound Transit Construct Mountlake Terrace Freeway Station $5,000,000 $30,545,000 3/17/2011 5,992,896 7,491,120 4,324,320 4,586,400 6,231,680 6,377,280 428,064 535,080 308,880 327,600 445,120 455,520
2007-2009 City of Seattle Pike-Pine / Westlake Hub Regional Transit Corridor Improvements $3,230,000 $3,650,000 6/30/2011 488,750 32,583
2007-2009 Skagit Transit Chuckanut Park & Ride $2,000,000 $5,200,000 9/8/2011 2,821,000 5,642,000 1,696,630 1,997,537 1,914,250 2,216,500 91,000 182,000 54,730 64,437 61,750 71,500
2007-2009 City of Shoreline Aurora Avenue N, N 165th Street to N 185th Street Business Access and Transit (BAT) Lanes $2,500,000 $42,804,000 12/1/2011 1,420,000 171,500
2007-2009 King County Metro Pacific Highway South Transit Speed and Reliability Improvements $2,300,000 $2,750,000 8/7/2013
2009-2011 Skagit Transit Systems South Mount Vernon Park & Ride $750,000 $5,253,000 8/6/2010 2,886,600 5,772,000 1,539,200 2,058,680 2,289,560 2,789,800 78,000 156,000 40,040 55,640 61,880 75,400
2009-2011 City of Seattle Rainier/Jackson Transit Priority Corridor Improvements $4,000,000 $4,000,000 10/1/2010 861,193 803,054 861,193 803,054 1,410,834 1,781,475 366,501 323,006 366,501 323,006 571,188 721,245
2009-2011 Sound Transit Sound Transit Express Bus Expansion - Snohomish to King County $4,496,768 $8,348,109 1/26/2011 10,666,771 12,968,876 8,967,807 14,822,243 10,140,225 17,281,559 622,136 751,660 505,902 836,169 594,847 1,036,146
2009-2011 Community Transit Double Decker Buses $2,880,000 $19,204,000 6/30/2011 4,753,320 4,753,320 246,432 1,518,523 2,014,628 2,635,541 216,060 216,060 9,460 73,455 104,373 120,377
2009-2011 C-Tran I-5 Express Commuter Service Augmentation (continuation) $578,496 $784,996 6/30/2011 1,325,469 2,079,969 1,772,749 1,577,465 1,297,112 1,348,231 91,780 143,780 116,922 112,054 96,079 96,079
2009-2011 Island Transit The Everett Connector* $1,624,000 $2,030,000 6/30/2011 NA NA 1,250,014 1,333,066 1,416,986 1,375,277 NA NA 41,104 43,835 46,595 45,233
2009-2011 Clark County Salmon Creek Interchange Park & Ride and Traffic Signal Coordination $3,400,000 $8,700,000 12/31/2011 2,936,762 3,719,899 2,873,241 2,844,303 3,020,730 184,470 233,662 180,707 178,887 189,983
2009-2011 City of Federal Way Pacific Highway South HOV Lanes Phase IV (South 312th St to Dash Point Road) $1,300,000 $21,280,000 12/31/2011 3,654,300 8,790,600 5,077,780 4,817,800 10,030,800 9,984,000 365,430 879,060 507,780 481,780 1,003,080 988,400
2009-2011 Everett Transit Evergreen Swift Stations and TSP $3,630,000 $4,537,000 1/31/2012 536,520 1,176,800 53,652 117,680
2009-2011 Pierce Transit Pacific Avenue Corridor Transit Signal Priority (TSP) Improvements $1,803,650 $4,359,650 2/27/2012 486,576 1,081,779 486,576 52,275 116,220 52,275
2009-2011 Sound Transit Lakewood-Tacoma Commuter Rail (D to M Street New Track and Signal) $8,000,000 $151,000,000 9/24/2012 12,376,000 20,332,000 3,633,240 3,879,552 5,454,280 5,887,440 364,000 598,000 106,860 114,104 160,420 173,160
2009-2011 City of Shoreline Aurora Avenue N, N 185th St to N 192nd St Business Access and Transit Lanes $1,000,000 $9,221,000 1/3/2013 Project was continued under “N 192nd St to N 205th St BAT Lanes” in 2011-2014 biennium below. Performance will be reported under that project.
2009-2011 Intercity Transit Hawks Prairie Park & Ride Lot $3,526,892 $8,207,095 1/25/2013 5,205,900 5,467,200 1,098,331 2,158,137 155,400 163,200 32,786 64,422

Mobility Transit Report 2016
13
Biennium Originally Funded
Grantee Name Project Name Grant
Amount
Estimated Total Project
Cost
Completion Date
Reduction in Vehicle Miles Traveled -
Estimates Reduction in Vehicle Miles Traveled - Actuals
Reduction in Vehicle Trips -
Estimates Reduction in Vehicle Trips - Actuals
Year 1 Year 4 Year 1 Year 2 Year 3 Year 4 Year 1 Year 4 Year 1 Year 2 Year 3 Year 4
2009-2011 Community Transit Swift Bus Rapid Transit Operations $5,000,000 $20,822,900 6/30/2013 3,219,200 0 8,523,810 9,352,686 321,920 0 1,420,635 1,558,781
2009-2011 City of Bothell SR 522 West City Limits to NE 180th Stage 2A (91st Ave NE to West of 96th Ave NE) $2,100,000 $6,000,000 4/29/2014 406,412 573,016 106,853 22,834 32,195 6,529
2009-2011 King County Metro Route 120 Transit Enhancement for Delridge Way/Ambaum Boulevard Corridor $2,233,699 $6,780,000 8/26/2014 282,906 746,980 473,337 830,102 43,524 114,920 78,890 138,350
2009-2011 King County Metro Central Eastside Transit Service Improvement $4,173,187 $5,216,484 466,180 953,500 1,001,941 57,200 117,000 257,270
2009-2011 King County Metro Southeast King County Connectors $4,194,340 $6,048,928 777,904 1,555,808 101,009 202,018
2011-2013 Seattle DOT Northwest Market/45th St. Transit Priority Corridor Improvements $4,000,000 $8,870,600 11/27/2012 638,260 657,600 574,671 598,487 626,954 800,077 206,336 206,336 279,712 300,837 319,241 436,562
2011-2013 Seattle DOT King Street Station Restoration Project $1,250,000 $2,825,632 4/24/2013 62,647 62,647 2,253,605 1,239,079 397 397 14,263 7,842
2011-2013 City of Lakewood Lakewood Station Connection $1,500,000 $3,800,000 8/7/2013 1,770,000 1,930,000 172,321 44,200 48,300 4,680
2011-2013 King County Metro South Kirkland Park and Ride $1,025,000 $7,275,000 9/17/2013 1,175,455 1,369,000 1,571,503 178,099 207,424 202,983
2011-2013 Spokane Transit Plaza Improvements - Wall Street Reconfiguration $1,233,006 $1,690,000 10/25/2013 1,020,000 1,148,000 693,749 342,371 221,000 249,000 150,815 74,428
2011-2013 City of Renton Rainier Ave. S. Bus Access Transit Lanes $1,500,000 $42,980,000 12/19/2013 339,686 367,175 44,115 47,685
2011-2013 Skagit Transit Alger Park and Ride $1,115,084 $1,496,450 3/3/2014 120,120 240,240 283,920 8,580 17,160 20,280
2011-2013 City of Tukwila Tukwila Urban Center $4,735,000 $7,527,000 6/29/2015 194,818 584,454 604,664 33,020 99,060 102,486
2011-2013 Pierce Transit 112th and Pacific/SR 7 Transit Access Improvements $1,816,869 $1,816,869 7/27/2015 506,977 728,384 126,744 182,096
2011-2013 City of Shoreline N 192nd St to N 205th St BAT Lanes $6,357,839 $6,357,839 1,349,920 1,727,440 122,720 157,040
2013-2015 Island Transit Everett Connector* $439,210 $709,563 9/1/2014 NA NA 1,177,727 Service discontinued NA NA 38,727 Service discontinued
2013-2015 Skagit Transit Everett Connector* $500,790 $633,800 9/1/2014 Funding was provided to two agencies to support connected service. Island Transit is reporting performance metrics for both projects.
2013-2015 Yakima Transit Firing Center Park and Ride $222,543 $302,000 9/22/2014 1,297,468 1,652,735 28,600 38,480
2013-2015 City of Ridgefield Ridgefield Park and Ride $1,295,000 $1,685,000 10/14/2014 835,244 1,044,056 36,608 45,760
2013-2015 Sound Transit Clean Green Fleet Replacement $5,000,000 $7,000,000 1/29/2015 2,756,397 3,190,874 1,728,521 284,238 329,041 103,646
2013-2015 Island Transit Tri -County Connector* $1,613,200 $2,584,345 NA NA 3,721,996 1,479,830 NA NA 148,428 88,116
2013-2015 Skagit Transit Tri -County Connector* $322,641 $475,200 Funding was provided to three agencies to support connected service. Island Transit is reporting performance metrics for both projects.
2013-2015 Whatcom Transit Tri -County Connector* $364,159 $510,272 Funding was provided to three agencies to support connected service. Island Transit is reporting performance metrics for both projects.
The current requirement for post project reporting was fully implemented in the 2009-2011 biennium. Green highlighted cells represent projects that are up-to-date, with performance figures being due in the future. *These projects were directly appropriated funding by the state legislature outside of the application process and did not submit year 1 and year 4 estimates.
Mobility Transit Report 2016
14
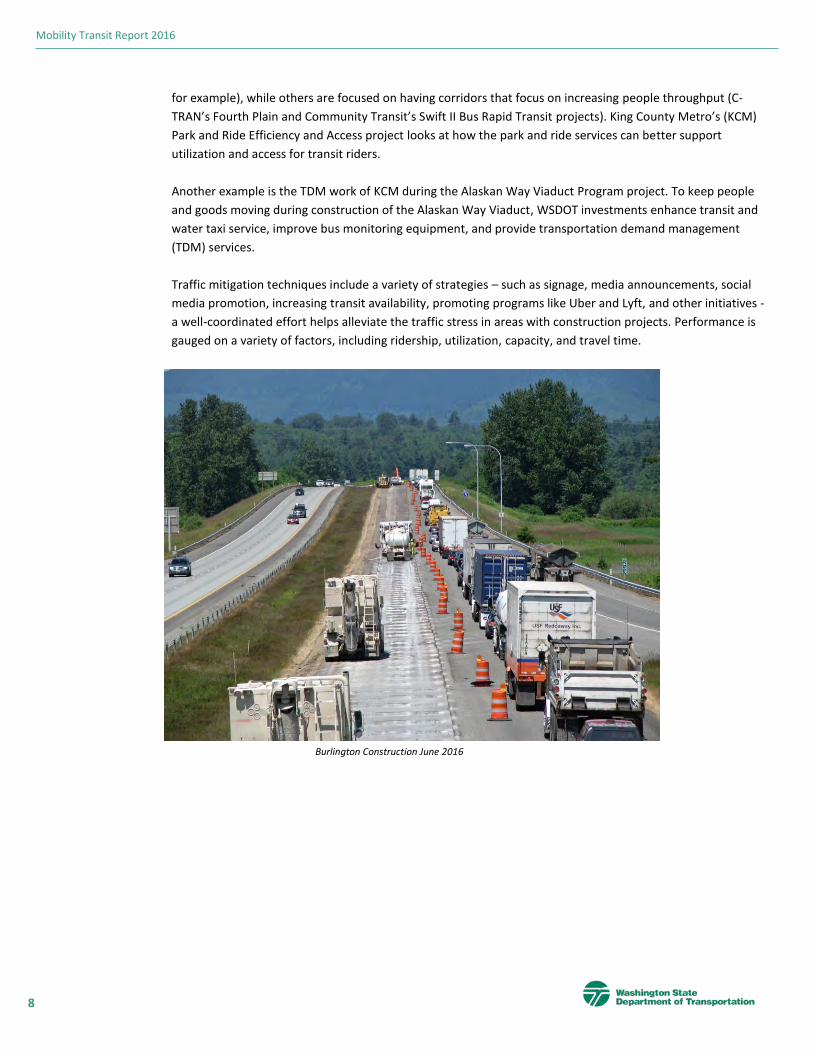
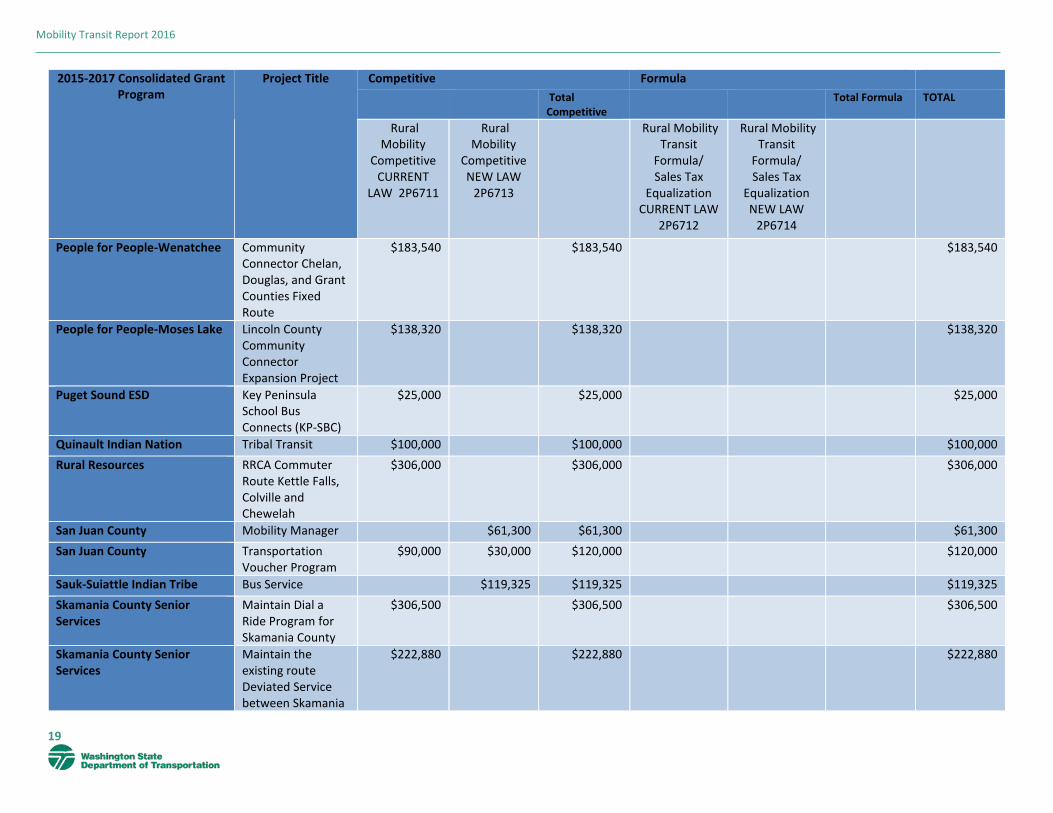
Rural Mobility Grant Program – (RCW 47.66.100) The purpose of the Rural Mobility Grant program is to aid small cities and rural areas through the support of transit systems. The support is provided for areas not served, or underserved, by transit agencies. Fifty percent of the funds are non-competitive and the other fifty percent are competitively awarded.
Below is a breakdown of all recipients of Rural Mobility Grant funds whether they have been awarded non-competitive or competitive funding. A brief descriptive title of the project is also provided. The majority of the funding supports operations.
Tribal transit service is supported by the Rural Mobility Grant program. Ten tribes are funded for almost $2.5 million for the current biennium (2015-2017).

Mobility Transit Report 2016
15
2015-2017 Consolidated Grant Program
Project Title Competitive Formula
Total Competitive
Total Formula TOTAL
Rural Mobility
Competitive CURRENT
LAW 2P6711
Rural Mobility
Competitive NEW LAW
2P6713
Rural Mobility
Transit Formula/ Sales Tax
Equalization CURRENT LAW
2P6712
Rural Mobility Transit
Formula/ Sales Tax
Equalization NEW LAW
2P6714
Asotin County PTBA Asotin Operating $18,767 $37,389 $56,156 $56,156
Clallam Transit System Replace Paratransit ADA-compliant Vehicles with consideration for Alternative Fuels
$163,000 $163,000 $40,750 $40,750 $203,750
Clallam Transit System Vehicles & Equipment Purchases
$297,408 $36,185 $333,593 $333,593
Coastal CAP Driven to Opportunity
$460,386 $460,386 $460,386
Columbia County Public Transportation
Operating Funds to Sustain Existing Demand Response Service
$273,715 $273,715 $273,715
Cowlitz Indian Tribe Rural Demand Response
$250,000 $84,453 $334,453 $334,453
Frontier Behavioral Health Care Cars $95,592 $95,592 $95,592
Garfield County Transit Commuter, Medicaid/ shopper, local and weekend service
$280,467 $280,467 $280,467
Grays Harbor Trans. Authority Sustain current levels of Fixed Route and Door to Door service and restore discontinued service.
$460,266 $460,266 $1,301,365 $125,239 $1,426,604 $1,886,870

Mobility Transit Report 2016
16
2015-2017 Consolidated Grant Program
Project Title Competitive Formula
Total Competitive
Total Formula TOTAL
Rural Mobility
Competitive CURRENT
LAW 2P6711
Rural Mobility
Competitive NEW LAW
2P6713
Rural Mobility
Transit Formula/ Sales Tax
Equalization CURRENT LAW
2P6712
Rural Mobility Transit
Formula/ Sales Tax
Equalization NEW LAW
2P6714
Island Transit Sustain fixed route and complimentary DAR service
$2,980,000 $261,980 $3,241,980 $3,241,980
Jamestown S'Klallam Preserve Existing Jamestown Campus Route #50
$138,432 $138,432 $138,432
Jefferson Transit Operating Assistance-Project A: East Jefferson County Service
$210,083 $298,213 $508,296 $508,296
Jefferson Transit Operating Assistance-Project B: West Jefferson Olympic Connection
$13,649 $12,864 $26,513 $26,513
Kalispel Tribe Preservation - Kalispel Reservation-to-Spokane and Ione (KRSI)
$46,174 $201,013 $247,187 $247,187
Kitsap Transit Construction of North Base & Viking Way P&R
$1,759,386 $162,795 $1,922,181 $1,922,181
Klickitat County Senior Services
Continue to provide Klickitat County with existing Dial-a-Ride Service
$78,000 $78,000 $78,000

Mobility Transit Report 2016
17
2015-2017 Consolidated Grant Program
Project Title Competitive Formula
Total Competitive
Total Formula TOTAL
Rural Mobility
Competitive CURRENT
LAW 2P6711
Rural Mobility
Competitive NEW LAW
2P6713
Rural Mobility
Transit Formula/ Sales Tax
Equalization CURRENT LAW
2P6712
Rural Mobility Transit
Formula/ Sales Tax
Equalization NEW LAW
2P6714
Klickitat County Senior Services
Vehicle Replacement
$56,000 $56,000 $56,000
Link Transit Continuation of Upper Valley Demand Response Service
$10,802 $10,802 $10,802
Lower Columbia Community Action Council
Connecting the I-5 Corridor: Vancouver to Longview to Castle Rock
$269,059 $269,059 $269,059
Lummi Tribe Lummi Nation Bus Stops (Capital)
$48,000 $48,000 $48,000
Lummi Tribe Lummi Transit Operation
$450,000 $450,000 $450,000
Makah Tribe Makah Operating Assistance
$143,655 $143,655 $143,655
Makah Tribe-2013-15 Belated Claim
n/a $24,742 $24,742 $24,742
Mason Transit Authority Sustained Demand Response
$420,978 $420,978 $351,355 $351,355 $772,333
Mason Transit Authority Sustain Regional Coordination
$1,050,851 $629,303 $1,680,154 $1,680,154
Mason Transit Authority Sustain Zone and Fixed Route Deviated Service
$84,035 $84,035 $84,035
NEW RTPO Regional Mobility Management/
$155,618 $155,618 $155,618

Mobility Transit Report 2016
18
2015-2017 Consolidated Grant Program
Project Title Competitive Formula
Total Competitive
Total Formula TOTAL
Rural Mobility
Competitive CURRENT
LAW 2P6711
Rural Mobility
Competitive NEW LAW
2P6713
Rural Mobility
Transit Formula/ Sales Tax
Equalization CURRENT LAW
2P6712
Rural Mobility Transit
Formula/ Sales Tax
Equalization NEW LAW
2P6714
Veterans Coordination
Okanogan County Transit Authority
Dispatch Hardware and Software
$149,082 $149,082 $149,082
Okanogan County Transit Authority
Bus Stop Signage & Shelters
$57,734 $57,734 $57,734
Okanogan County Transit Authority
General Operating Assistance
$218,022 $218,022 $218,022
Okanogan County Transportation & Nutrition
Okanogan Commuter Routes
$152,808 $152,808 $152,808
Okanogan County Transportation & Nutrition
Preserve Okanogan County Door-to-Door Demand Response
$120,000 $120,000 $120,000
Olympic CAP Olympia CAP JARC Service
$99,200 $99,200 $99,200
Pacific Transit Rural Public Transportation Service-Fixed and Demand Response
$149,096 $250,000 $399,096 $168,834 $12,812 $181,646 $580,742
Pacific Transit Vehicle replacement Project to preserve existing services
$52,987 $52,987 $52,987
People for People-Moses Lake Adams, Grant & Lincoln Counties - Preservation of Rural Special Needs Transportation
$114,688 $114,688 $114,688
Mobility Transit Report 2016
19
2015-2017 Consolidated Grant Program
Project Title Competitive Formula
Total Competitive
Total Formula TOTAL
Rural Mobility
Competitive CURRENT
LAW 2P6711
Rural Mobility
Competitive NEW LAW
2P6713
Rural Mobility
Transit Formula/ Sales Tax
Equalization CURRENT LAW
2P6712
Rural Mobility Transit
Formula/ Sales Tax
Equalization NEW LAW
2P6714
People for People-Wenatchee Community Connector Chelan, Douglas, and Grant Counties Fixed Route
$183,540 $183,540 $183,540
People for People-Moses Lake Lincoln County Community Connector Expansion Project
$138,320 $138,320 $138,320
Puget Sound ESD Key Peninsula School Bus Connects (KP-SBC)
$25,000 $25,000 $25,000
Quinault Indian Nation Tribal Transit $100,000 $100,000 $100,000
Rural Resources RRCA Commuter Route Kettle Falls, Colville and Chewelah
$306,000 $306,000 $306,000
San Juan County Mobility Manager $61,300 $61,300 $61,300
San Juan County Transportation Voucher Program
$90,000 $30,000 $120,000 $120,000
Sauk-Suiattle Indian Tribe Bus Service $119,325 $119,325 $119,325
Skamania County Senior Services
Maintain Dial a Ride Program for Skamania County
$306,500 $306,500 $306,500
Skamania County Senior Services
Maintain the existing route Deviated Service between Skamania
$222,880 $222,880 $222,880

Mobility Transit Report 2016
20
2015-2017 Consolidated Grant Program
Project Title Competitive Formula
Total Competitive
Total Formula TOTAL
Rural Mobility
Competitive CURRENT
LAW 2P6711
Rural Mobility
Competitive NEW LAW
2P6713
Rural Mobility
Transit Formula/ Sales Tax
Equalization CURRENT LAW
2P6712
Rural Mobility Transit
Formula/ Sales Tax
Equalization NEW LAW
2P6714
County and Fisher's Landing
Special Mobility Services Purchase one replacement and one expansion light-duty, cutaway bus to expand Deviated Fixed Route between Davenport and Spokane.
$162,000 $162,000 $162,000
Special Mobility Services Sustain North Spokane County Dial-a-Ride Service
$370,000 $370,000 $370,000
Special Mobility Services Continue Deviated Fixed Route between Newport and Spokane
$195,000 $195,000 $195,000
Special Mobility Services Continue Deviated Fixed Route Service between Davenport & Spokane & Ritzville & Spokane
$324,153 $324,153 $324,153
Spokane Tribe Acquisition of a new paratransit vehicle
$41,249 $41,249 $41,249

Mobility Transit Report 2016
21
2015-2017 Consolidated Grant Program
Project Title Competitive Formula
Total Competitive
Total Formula TOTAL
Rural Mobility
Competitive CURRENT
LAW 2P6711
Rural Mobility
Competitive NEW LAW
2P6713
Rural Mobility
Transit Formula/ Sales Tax
Equalization CURRENT LAW
2P6712
Rural Mobility Transit
Formula/ Sales Tax
Equalization NEW LAW
2P6714
Spokane Tribe Moccasin Express Continued General Operations
$529,500 $529,500
$529,500
Spokane Tribe Moccasin Express Downtown Spokane Route
$140,000 $140,000 $140,000
Squaxin Tribe Operating Assistance for Squaxin Transit
$31,909 $31,909 $31,909
Stillaguamish Transit Demand Response Vehicle Replacement
$52,000 $52,000 $52,000
Thurston Regional Planning Council
Rural & Tribal Transportation Program (RT)
$450,075 $71,000 $521,075 $521,075
Twin Transit Capital assistance to purchase two (2) replacement light-duty gas-powered buses for ADA complementary paratransit service.
$92,500 $92,500 $92,500

Mobility Transit Report 2016
22
2015-2017 Consolidated Grant Program
Project Title Competitive Formula
Total Competitive
Total Formula TOTAL
Rural Mobility
Competitive CURRENT
LAW 2P6711
Rural Mobility
Competitive NEW LAW
2P6713
Rural Mobility
Transit Formula/ Sales Tax
Equalization CURRENT LAW
2P6712
Rural Mobility Transit
Formula/ Sales Tax
Equalization NEW LAW
2P6714
Twin Transit General operating assistance to preserve existing Fixed Route and paratransit service in and around Centralia/ Chehalis.
$100,000 $100,000 $100,000
Valley Transit Demand Response and Route Deviated Transportation
$103,179 $155,084 $258,263 $258,263
Wahkiakum County Health & Human Services
Operations Grant $404,766 $404,766 $404,766
Yakima Transit Yakima Transit - Yakima-Ellensburg Commuter Existing Project
$68,994 $68,994 $68,994
Lummi Tribe-Placeholder for prior biennium invoice
Lummi Transit Operation
$226,110 $226,110 $226,110
$8,507,789 $1,700,827 $10,208,616 $8,500,000 $1,719,000 $10,219,000 $20,427,616

Mobility Transit Report 2016
23