2016 Stakeholders Report - National Weather Service
28
Welcome to the second edition of the National Weather Service (NWS) Paducah, Kentucky Stakeholders’ Report. Hardly a day goes by that weather does not play some factor in a person’s life. The staff of the Weather Service Forecast Office in Paducah, KY takes this responsibility very seriously. We operate 24 hours a day, 365 days a year, to readily serve a four state - 58 county area - over portions of southeast Missouri, southern Illinois, western Kentucky, and southwest Indiana. While weather means many things to many people, 2016 will likely go down in the record book highlighting January snows, a warm and wet start to spring that lingered through the wet summer – followed by an abrupt dryness during the fall and early winter which became pronounced. In fact, following record amounts of rain in mid-summer, a significant 2016 Stakeholders’ Report National Weather Service 8250 Kentucky Highway 3520 West Paducah, Kentucky 42086 Phone: 270-744-6440 Fax: 270-744-3828 E-mail: [email protected] http://www.weather.gov/pah ► A Message from Our Meteorologist - in - Charge . . . drought had set up over the area by mid fall and remained in many locations through the year’s end. Not only was it dry, but it was warm as 2016 drew to a close. Remember, many locations recorded Christmas Day temperatures around 70 degrees!
Transcript of 2016 Stakeholders Report - National Weather Service

Welcome to the second edition of the National Weather
Service (NWS) Paducah, Kentucky Stakeholders’ Report.
Hardly a day goes by that weather does not play some factor
in a person’s life. The staff of the Weather Service Forecast
Office in Paducah, KY takes this responsibility very seriously.
We operate 24 hours a day, 365 days a year, to readily serve a
four state - 58 county area - over portions of southeast
Missouri, southern Illinois, western Kentucky, and southwest
Indiana.
While weather means many things to many people, 2016 will
likely go down in the record book highlighting January
snows, a warm and wet start to spring that lingered through
the wet summer – followed by an abrupt dryness during the
fall and early winter which became pronounced. In fact,
following record amounts of rain in mid-summer, a significant
2016
Stakeholders’
Report
National Weather Service 8250 Kentucky Highway 3520 West Paducah, Kentucky 42086
Phone: 270-744-6440 Fax: 270-744-3828 E-mail: [email protected] http://www.weather.gov/pah
► A Message from Our Meteorologist-in-Charge . . .
drought had set up over the area by mid fall and remained in many locations through the
year’s end. Not only was it dry, but it was warm as 2016 drew to a close. Remember, many
locations recorded Christmas Day temperatures around 70 degrees!
Let’s talk money for a few moments. How do we get to do, what we do, for you? Well, if you
took the NWS total budget for 2016 and divided it by every American citizen, you would find
the annual cost of what an individual pays per year for the National Weather Service’s
expertise and assistance is around $3.84 per person. It is my job to make sure that you
continue to feel you are getting your money’s worth from the NWS Paducah Team.
Our NWS team, which is 26 members strong at Paducah, works around the clock for you to be
weather prepared at all times. During this past year, we have once again expanded our
capabilities in technology and operational procedures - and, in doing that, we have kept your
safety, at our forefront, 24 hours a day. It is important that you know – we are there for you –
in an ever present watch on weather that could affect you, or those you are responsible for.
In you offering up your $3.84 for us to continue what we do – it is my hope you understand –
whether it be an ice storm, snow storm, severe thunderstorm, tornado, hail, strong winds,
flooding rains, or simply a bright sunny day – the NWS in Paducah has got this!
Inside this edition of the Stakeholders’ Report, you will find some of our main focuses of
2016. Know that we are always interested in your suggestions and comments as to how we
can better serve you. And, most importantly, as a direct Stakeholder of the services NWS
Paducah provides, we hope your expectations continue to not only be met, but exceeded.
Sincerely,
Beverly A. Poole, Meteorologist-in-Charge (MIC)
National Weather Service 8250 Kentucky Highway 3520 West Paducah, Kentucky 42086
Phone: 270-744-6440 Fax: 270-744-3828 E-mail: [email protected] http://www.weather.gov/pah
► A Message from Our Meteorologist-in-Charge . . .

► You Don’t Mess with Water . . . by Mary Lamm – Service Hydrologist
Every year it seems we need to talk about flood safety. This year is no exception. 2015 saw 6
flood-related deaths across our county warning area. There were two in 2016. Both of these
were directly attributed to someone making the conscious decision to try to drive into flooded
areas. Across the United States, there were around 150 flood-related deaths in 2016. Half of
these occurred due to decisions while driving.
The Centers for Disease Control and Prevention reports that over half of all flood-related
drownings occur when a vehicle is driven into hazardous flood water. The next highest
percentage of flood-related deaths is due to walking into or near flood waters. People
underestimate the force and power of water. Many of the deaths occur in automobiles as they
are swept downstream. Of these drownings, many are preventable, but too many people
continue to drive around the barriers that warn you the road is flooded. A mere 6 inches of
fast-moving flood water can knock over an adult. It takes just 12 inches of rushing water to
carry away a small car, while 2 feet of rushing water can carry away most vehicles. It is
NEVER safe to drive or walk into flood waters.
At this year’s Winter Weather Workshops for our media and emergency management
partners, we discussed ways to emphasize the dangers of flood waters and to get people to
Turn Around, Don’t Drown. There were several great ideas including:
For more information regarding flood safety, please visit www.floodsafety.noaa.gov
o Stronger wording in NWS products to emphasize the
consequences of driving into flood waters
o Early education – prepare short educational pieces that
can be presented in elementary schools
o Ensuring driving and flood dangers are included in
drivers education courses and driving school materials
o Increased use of social media (eg. Twitter, Facebook) to
highlight the dangers of flood waters
o The introduction of fines when people drive around
barricades and have to be rescued (Check out Arizona’s
“Stupid Motorist Law”)
► Building a Weather-Ready Nation . . . by Rick Shanklin – Warning Coordination Meteorologist
In conjunction with its partners, the NWS conducts hazardous weather preparedness
campaigns for each of the hazardous weather events that impact our region. These
campaigns consist of the annual severe thunderstorm and flood safety awareness weeks,
which are conducted prior to the spring severe weather season, along with an annual
lightning safety campaign. There is a summer weather safety campaign for heat and other
summer weather, and an annual winter weather preparedness campaign.
The objective of each campaign is to educate everyone about the dangers of hazardous
weather and what they can do to better plan and respond when those dangers arise. The
campaigns are typically conducted at a state level. For the severe thunderstorm campaigns,
each state conducts a tornado drill. The tornado drill provides a focused opportunity for
everyone to exercise and review their sheltering plans and to ensure their weather radio or
other warning reception methods are fully functional. Information on each of the state level
campaigns will be provided via WFO Paducah’s web site and through its social media
streams. The listing of the various state hazardous weather campaigns and their dates can
be found at www.nws.noaa.gov/om/severeweather/severewxcal.shtml
In addition to the state level campaigns, there are also national level and seasonal
campaigns. For example, the lightning safety campaign, which is usually conducted the third
full week of June, consists of a repository of preparedness and other information at
www.lightningsafety.noaa.gov The flood safety web site is www.floodsafety.noaa.gov
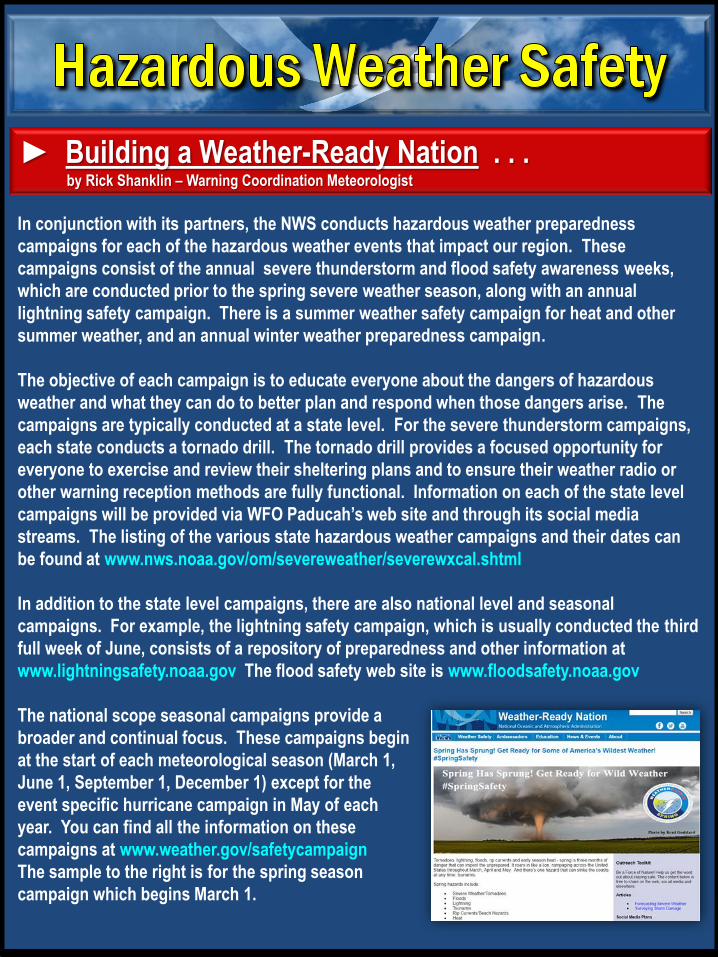
The national scope seasonal campaigns provide a
broader and continual focus. These campaigns begin
at the start of each meteorological season (March 1,
June 1, September 1, December 1) except for the
event specific hurricane campaign in May of each
year. You can find all the information on these
campaigns at www.weather.gov/safetycampaign
The sample to the right is for the spring season
campaign which begins March 1.
► Our Provision of Core Partner Workshops . . . by Rick Shanklin – Warning Coordination Meteorologist
Staple events conducted by the NWS in Paducah include its round of annual workshops for
hazardous weather preparation. Each spring, a Severe Weather Workshop is conducted to
concentrate on preparation ahead of the spring severe weather season. These workshops
include an array of severe weather topics from public severe weather preparedness to
observation, and detection methodologies of radar and other technologies to communication
capabilities and strategies. Workshop participants include emergency management,
broadcast and print media, law enforcement, transportation, storm spotters, government
partners, academia, and a host of other entities key during hazardous weather events. The
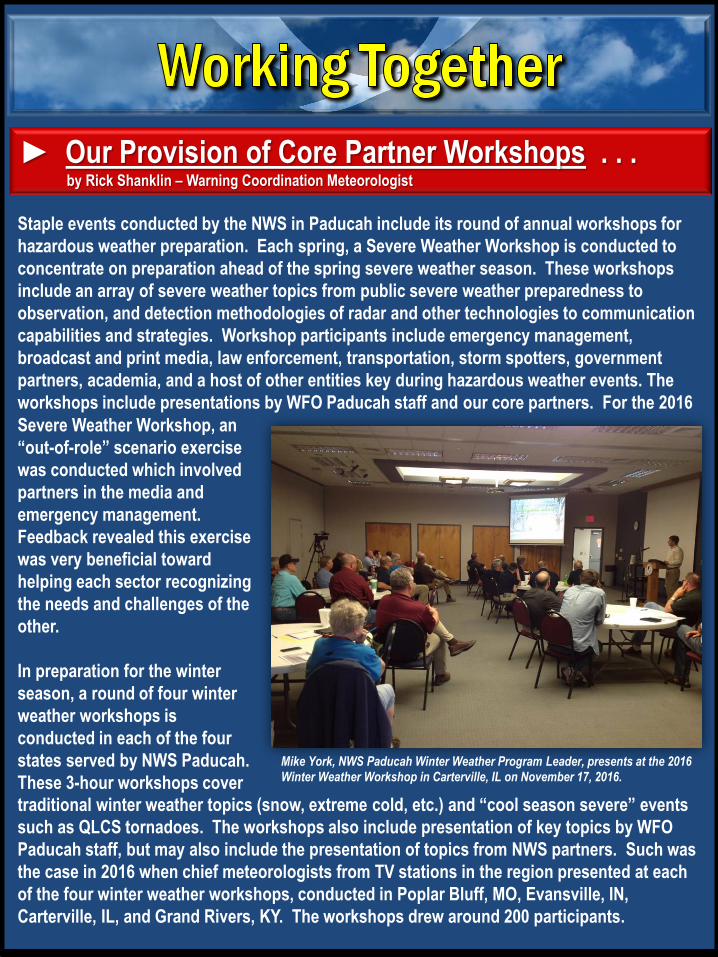
workshops include presentations by WFO Paducah staff and our core partners. For the 2016
traditional winter weather topics (snow, extreme cold, etc.) and “cool season severe” events
such as QLCS tornadoes. The workshops also include presentation of key topics by WFO
Paducah staff, but may also include the presentation of topics from NWS partners. Such was
the case in 2016 when chief meteorologists from TV stations in the region presented at each
of the four winter weather workshops, conducted in Poplar Bluff, MO, Evansville, IN,
Carterville, IL, and Grand Rivers, KY. The workshops drew around 200 participants.
Severe Weather Workshop, an
“out-of-role” scenario exercise
was conducted which involved
partners in the media and
emergency management.
Feedback revealed this exercise
was very beneficial toward
helping each sector recognizing
the needs and challenges of the
other.
In preparation for the winter
season, a round of four winter
weather workshops is
conducted in each of the four
states served by NWS Paducah.
These 3-hour workshops cover
Mike York, NWS Paducah Winter Weather Program Leader, presents at the 2016 Winter Weather Workshop in Carterville, IL on November 17, 2016.

► How Can We Better Serve You? . . . by Rick Shanklin – Warning Coordination Meteorologist
The NWS in Paducah has developed Integrated Warning Teams (IWT) in each of the four
states within its County Warning Area. Out of a brainstorming session with the IWT for
western Kentucky, a plan was developed to hold an out-of-role exercise of a past severe
weather event whereby each IWT primary component (media, emergency management, and
NWS) would participate in the exercise as a member of a profession other than their own.
The objective of the exercise, conducted at our annual Severe Weather Workshop on March
18 at the Murray State University Paducah campus, was to foster greater understanding of the
operational environment and related challenges of each profession during severe weather.
The ultimate goal was improved overall performance during actual severe weather events.
The two hour exercise required extensive logistical preparations, given it was conducted in
four different rooms. In addition to the general session room, each of the three major IWT
component rooms required an array of A/V communication between the rooms to simulate as
Going forward, IWTs plan to meet on a routine basis, as well as following major events in our
region. For example, a special IWT meeting was held in Mayfield, Kentucky following the May
10, 2016 EF3 tornado that caused 10 injuries. These special IWT meetings provide a great
opportunity to review the performance of the IWT for a particular event. The findings gained
from the meetings can lead to the implementation of practical changes to further improve our
ability to help protect those in harm’s way during hazardous weather events.
closely as possible an actual severe
weather operational environment. Each
IWT room was led by two primary
experts, along with several other
assistants, to coordinate the exercise
and communicate information between
the groups. Midway into the exercise,
participants rotated to their other out-of-
role room to maximize their exposure to
a work environment outside of their own
profession. Participants of the out-of-role exercise were briefed via an NWS
conference call with graphics to kick off the exercise.

► Working to Improve Our Forecasts . . . by Pat Spoden – Science & Operations Officer
We constantly strive to improve our forecasts every day. You often hear of the “European”
model and the “American” model and how one is doing better than the other with a particular
weather system. It actually goes much deeper.
The NWS runs numerous models several times per cycle. Each run of the model is slightly
different, since we do not know exactly how the atmosphere works. We then put them
together and look for commonalities and areas where the models differ. We call this
Ensemble Forecasting.
The idea with ensemble forecasting is that you will be able to determine a most likely forecast
(the average of all of the models), and you should be able to come up with extremes on both
ends. This does not work all of the time, but overall, this method produces a pretty good
forecast.
Below is an example of ensemble forecasting. The image on the left is the mean, or average,
of numerous runs of the same model. On the right is a look at the actual values, or what is
commonly referred to as a “spaghetti” plot. I think you can see why.
With all of these potential solutions, we can create many statistics and probabilities. What
you see above is just one small example. We create ensemble forecasts for just about
everything we forecast, including high temperatures, low temperatures, humidity, snowfall,
and rainfall forecasts, just to name a few.

► Weather Radars to Get Upgrade . . . by Dan Spaeth – Senior Meteorologist
office operations and will be delayed if hazardous weather is forecast. During each outage,
coverage will be provided by surrounding radars.
The signal processor is the “brains” of the radar that collects and processes the data. The
hardware being replaced is over 20 years old and has become obsolete, as some of the
pieces will no longer be supported by the manufacturer after 2017. The upgrade will result in
faster and more precise data processing, paving the way for new radar technologies and
algorithms in future software builds. The upgrade will cost approximately $55,000 per site.
This is the first of a series of four upgrades, known as service life extension projects, planned
over the next five years to replace and refurbish major components of the aging radars. The
total cost of the four upgrades for all of the radars across the country is $150M. This
investment is expected to keep the radars operational into the 2030s.
The National Weather Service Doppler
Radars at Paducah, Kentucky (KPAH)
and Owensville, Indiana (KVWX), and
the Department of Defense Radar at
Trenton, KY (KHPX) will get a much
needed upgrade this year. The radars
will be taken down for 2 to 3 days each
for technicians to install a new signal
processor. KPAH and KVWX are
scheduled to be done in February
2017, while KHPX will be done in April
2017. The work has been scheduled to
minimize any potential impacts to

► The Next Generation of Weather Data . . . by Brittany Peterson – Meteorologist Intern
Weather satellites are incredibly valuable to meteorologists because they provide a complete
and continuous picture of atmospheric conditions. For the first time, GOES-R will allow us to
monitor the Earth with near real-time satellite data from 22,000 miles above us. GOES-R will
provide faster, more accurate data for environmental phenomena (like severe storms, fog,
snow, and fires) that directly impact public safety, protection of property, and our nation’s
economic health and prosperity. In fact, it can gather weather data every 30 seconds – faster
than a weather radar!
One special feature we are excited about is the GOES-R lightning mapper. This instrument
collects information such as the frequency, location, and extent of lightning and will allow
forecasters to focus on developing severe storms much earlier than we can now. GOES-R
data is expected to yield other great benefits such as:
GOES-R is set to launch in Winter 2016-2017 with operational data available in late 2017. For
more details on the GOES-R launch, science of the satellite, and sample images of the neat
data we will receive, visit www.goes-r.gov
• Increased thunderstorm
and tornado warning lead
time
• Improved hurricane track
and intensity forecasts
• Earlier warning of ground
lightning strike hazards
• Better detection of heavy
rainfall and flash flood risks
• Improved aviation flight
route planning
• Improved solar flare
warnings for
communications and
navigation disruptions

► How Bad Is It Going to Get? . . . by Mike York – Meteorologist
Winter storms are not uncommon in our area. Most of us are familiar with terms such as
“Winter Storm Warning” and “Ice Storm Warning.” Not as many of us know the difference
between “Winter Weather Advisory” and “Winter Storm Warning.” The NWS is aware of this
communication gap, and it has been working on ideas to overcome it.
One such idea is the experimental “Winter Storm Severity Index (WSSI).” Similar to the EF
scale for tornadoes and the Saffir-Simpson scale for hurricanes, the WSSI categorizes winter
storms based on their intensity. The WSSI was developed by the NWS office in Burlington,
Vermont and then applied to the rest of the country. Your NWS office in Paducah participated
in an internal test of the WSSI last winter. The WSSI appeared to perform very well in our
area.
What exactly is the WSSI and how does it work? It categorizes winter storms based on more
than just the total snow or ice amount. We all know that the impact of a winter storm depends
on more than just the final snow or ice accumulation. It depends on the snowfall rate, the
historical rarity of the event, and the wind speed, among other things. Take the following 3-
inch snowstorm and decide which has a greater impact:
• Event 1 (3 inch snowstorm): Occurs over a 6-hour period in Detroit, MI with light winds
• Event 2 (3 inch snowstorm): Occurs over a 2-hour period in Nashville, TN with 30 mph
winds
Obviously, Event 2 will have a much higher severity rating on the WSSI for a number of
reasons. The most obvious reason is that Nashville is poorly equipped to deal with such a
storm. Detroit has the resources and the experience to deal with the storm much more
efficiently. A second reason is the rate of snowfall. Road crews can keep up with the slower
snowfall rates occurring at Detroit. Finally, the 30-mph winds in the Nashville storm will
reduce visibility and cause blowing and drifting of snow across roads.
The graphic on the following page shows the experimental WSSI for the February 16, 2015
winter storm that crippled our area:

► How Bad Is It Going to Get? . . . by Mike York – Meteorologist
The NWS in Paducah is participating in an operational test of the WSSI this winter. Offices
that are part of the test will share the WSSI graphics on their websites. The eventual goal of
the test is to refine the WSSI for implementation across the nation in future winters.
A second experiment that NWS Paducah is part of this winter is probabilistic snowfall
forecasting. Instead of producing just a single snowfall-amount forecast, the office will also
produce a “worst case” and a “best case” forecast. If you don’t feel comfortable with these
probabilistic forecasts, you can continue to rely solely on the deterministic forecast you have
always been accustomed to.
Many planners have voiced a preference for the full range of possibilities. For example, an
emergency manager can draw up a contingency plan for 12 inches of snow if that scenario is
a reasonable possibility. If the emergency manager is not aware of the worst case scenario,
the planning for such an event will suffer. Some NWS offices in the eastern U.S. recently
started producing probabilistic snowfall forecasts, and the feedback was encouraging.
The NWS office in Paducah will publicly share the probabilistic snowfall maps on its website
this winter. We hope the added information from the Winter Storm Severity Index and the
Probabilistic Snowfall Maps will assist you with your preparedness efforts this winter.

► Providing More Detailed Forecasts to Aviators . . . by David Blanchard – Meteorologist
The aviation forecasting program at the NWS in Paducah consists of highly detailed weather
forecasts primarily for four airports in our forecast area: Cape Girardeau, MO; Paducah, KY;
Evansville, IN; Owensboro, KY. These coded forecasts, called Terminal Aerodrome Forecasts
(TAFs), contain predictions of weather phenomena 24 hours into the future for an area within
ten statute miles of each airport, and are used by a variety of commercial, private, and
military aviation customers. TAFs are issued four times a day, and are amended if they
become unrepresentative of weather conditions or if the forecast changes.
There is a 4-phase plan at the Paducah office to transition to a new method of developing
aviation forecasts. The timeline is tentative, but our goal is to make the change over to
digital, graphical aviation forecasts by the summer or fall of 2017. These graphical forecasts
will be made available alongside the traditional TAFs, in addition to un-amended, “virtual”
TAFs for additional locations around our region.
Phase 1 of the plan consists of exploring computer model data and automatically generated
digital graphics to see how well they correlate. Phase 2 consists of actually using the digital
graphics as a starting point to generate TAFs through a formatter, editing both as necessary.
In Phase 3, automation is turned off, and forecasters begin to import model data into and edit
the digital graphics, and then generate TAFs through the formatter (still editing TAFs when
necessary). Phase 4 occurs when TAFs are generated only from the edited digital graphics
through the formatter (with minimal editing of TAFs). We are currently in Phase 1, and will
very soon move to Phase 2. The ultimate goal of this new process is to improve efficiency
and accuracy of the aviation forecast process.
Here is an example of a partial TAF for Cape Girardeau, MO: TAF
This 24 hour TAF, issued at 1730 GMT (or Zulu time) on the KCGI 141730Z 1418/1518 35012G22KT P6SM –SHRA SCT035 OVC060
14th day of the month, describes the following weather: TEMPO 1421/1422 6SM TSRA BR BKN035CB…
From 1800 GMT (or Zulu), winds will blow from 350 degrees at 12 nautical miles per hour with gusts to 22. Visibility will be more
than 6 statute miles in light rain, with scattered clouds at 3500 feet above ground level and an overcast cloud ceiling1 at 6000 feet
above ground level. However, between 2100 and 2200 GMT, visibility will intermittently drop to 6 statute miles in moderate rain and
fog, with thunderstorm activity. A broken2 cumulonimbus3 cloud ceiling will intermittently drop to 3500 feet above ground level.
1 Ceiling = lowest cloud layer that covers more than half the sky 2 Broken = describes a ceiling with 5/8 to 7/8 coverage of the sky 3 Cumulonimbus = dense, vertically developed cloud, usually associated with a thunderstorm

► Serving as a Senior Forecaster in the NWS . . . by Jim Packett – Senior Meteorologist
administrative decisions in the absence of station management. The Senior Forecaster is
ultimately responsible for the assignment of duties on each shift—making sure all products
are disseminated properly and that all duties are performed. During times of inclement
weather or the expectation thereof, all Forecasters are responsible for issuing hazardous
weather products (watches, warnings, advisories, etc.), but the final decision is ultimately at
the Senior Forecaster’s discretion.
The Senior Forecaster also provides advice and guidance to state and local emergency
managers and ensures adequate access of weather information to the general public and
other special interests. Our responsibilities also include the granting of leave and making
sure all positions are filled on each shift in times of sickness and/or unexpected emergencies.
During times of after-hours equipment outages, the Senior Forecaster has to determine
whether maintenance personnel need to be called in to fix the problem so that the flow of
information can resume. All in all, the position of Senior Forecaster can be very challenging
at times. However, the rewards far outweigh the challenges.
Editor’s Note: Congratulations are in order as Jim will be retiring this year after 45 ½ years of
government service. We all wish Jim and his family the very best as he embarks upon his
much-deserved retirement. Jim’s leadership will be greatly missed at WFO Paducah!
At the time of this writing, I have been a Senior Forecaster in
the National Weather Service a little over 18 years. In a
nutshell, a Senior Forecaster provides direction and guidance
to operational staff during their assigned shifts, and with
some exception, the total responsibility of a given shift rests
with them. Although somewhat different, a Senior Forecaster
can be compared to a first-line supervisor position in the
corporate world. The main difference is that as a Senior
Forecaster, I share approximately half the workload on each
shift versus just ensuring my subordinates are completing all
assigned tasks.
The Senior Forecaster routinely makes operational and
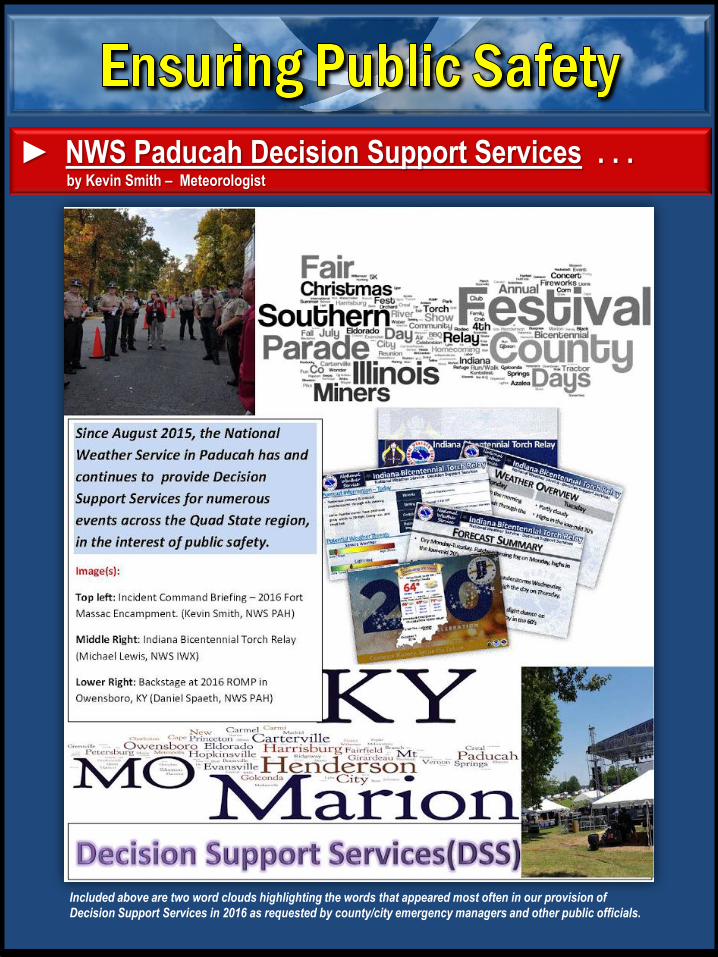
► NWS Paducah Decision Support Services . . . by Kevin Smith – Meteorologist
Included above are two word clouds highlighting the words that appeared most often in our provision of Decision Support Services in 2016 as requested by county/city emergency managers and other public officials.

► Recent Assignment with the NWS Communications Office . . . by Brittany Peterson – Meteorologist Intern
NOAA’s Rotational Assignment Program (NRAP) provides professional development
opportunities for a participant to broaden his/her skillset in a competitive, short-term
assignment with another office in the agency. In 2016, I was selected to be a NRAP
participant with the NWS Communications Office located in Silver Springs, Maryland.
During the six-month assignment, I performed my regular duties at WFO Paducah, KY while
collaborating remotely on several projects with the NWS Communications Office via phone,
chat, and email. Our collaborative efforts focused on development of educational materials
related to protecting the environment and preparing for hazardous weather through the
official websites and social media accounts of the NWS and the NWS mascot, Owlie Skywarn.
The NWS Communications and Outreach programs are continually working on new ways to
reach our youth – a crucial component of building a Weather-Ready Nation. Owlie Skywarn’s
website has a wealth of educational content related to hazardous weather science, safety, and
preparedness, including:
Blog posts for Owlie’s Journal
Hands-on weather activities for kids, teens, parents, and teachers
Interactive online activities for kids on careers in meteorology
“The Adventures of Owlie Skywarn and Sanctuary Sam” educational PDF book
Learn more by visiting
www.weather.gov/owlie.
Follow Owlie on Twitter
(@NWSOwlieSkywarn)
and Facebook
(www.facebook.com/
NWSOwlie).

► NWS Paducah Participates In Local STEM Event . . . by Christine Wielgos – Meteorologist
On November 10th, 2016, I attended the Kentucky Girls STEM Collaborative event held on the
campus of West Kentucky Community and Technical College in the Emerging Tech Center in
Paducah, KY.
Girls ranging from fifth grade through high school were invited to learn more about STEM
(science, technology, engineering and mathematics) careers through hands-on activities,
demonstrations and talks presented by area professionals.
I was joined by several other women in careers such as ophthalmology, chemical
engineering, mechanical engineering, pharmacy, radiology and many more. I gave three 30-
minute talks to these girls and provided a brief overview of the life of a meteorologist
including job duties, describing what shift work is like, how to manage being a woman in a
male dominated field, and being a working mother. I was delighted to hear about all the
wonderful careers these young women were looking forward to pursuing. They offered up
very thoughtful questions related to STEM careers as well.

► Recognizing the Need for Change . . . by Ryan Presley – Meteorologist
Built in 1994, the brick building that sits on Old U.S. Highway 60 adjacent to Barkley Regional
Airport in West Paducah, Kentucky has served as the home of the National Weather Service in
Paducah for over 20 years. During this time, the facilities have served our needs quite well,
including the operations area where our primary mission to serve and protect the public is
carried out around the clock via forecast and warning production. Other than the intermittent
replacement of outdated computer equipment, the operations area has maintained the same
general format. This format consisted of 5 AWIPS Workstations—each paired with a PC—
outlining the operations area in a square-shaped configuration. Situated at the core of this
arrangement was a “quad” table that contained computer equipment for the communicator
during severe weather events and a couple of additional PCs. A situation awareness display
with one large monitor and multiple small monitors was situated at the back of the room.
Cubicles for office managers and program leaders flanked both sides of the operations area.
As time passed, it became increasingly apparent that this legacy arrangement could use a
makeover. One problem was the outward-facing orientation of the AWIPS workstations,
which resulted in operational staff sitting with their backs to each other. Some also had their
backs to the situation awareness display, while those closest to the display were so close
that their viewing ability was less than optimal. Information on the display was not always the
most legible given the small size of the monitors. The need for a redesign was also
necessitated by 3 additional AWIPS workstations that were slated to arrive sometime in 2016
or early 2017. The old operations layout was just not built for that many workstations.

► Working Together to Find the Right Plan . . . by Ryan Presley – Meteorologist
Recognizing the need for a complete makeover, the management team embarked upon a
strategy to move to a new operations area configuration by soliciting input on a redesign
from local staff in the spring of 2015. Many ideas were tossed around, but none of the initial
concepts were accepted as the benefits were not so obvious to justify such a radical change.
The issue was tabled for several months before it was brought back to the forefront in early
2016. A number of new concepts were presented, and those were eventually whittled down to
about 3 favorites. After much analysis and discussion, a majority of the staff rallied behind
one plan that we considered to be far above and beyond the others. Once this concept
received enough votes, it was given final approval by local management. From there, the
layout evolved as necessary, but the core of the original plan remained in tact.
The electronics staff was largely responsible for the implementation of the new floor
configuration during the months of April and May. The remodel was executed in multiple
phases to minimize impact on operations. The bulk of the remodel was completed in May, but
periodic improvements to the workspace area continued for several more months as
additional equipment and furniture arrived.
Cubicles once occupied this area where the first phase of the
remodel was completed To the left is the old CRS system.
The operations area began to look less and less like its former
layout as the reorganization progressed.

► Welcome to Your New NWS Paducah! . . . by Ryan Presley – Meteorologist
The new operations floor plan has numerous advantages over the legacy plan. The first is the
added space for more workstations. The new operations floor configuration allows for 8
AWIPS II workstations—each collocated with a PC. This provides an obvious advantage
during shift change and even more so during episodes of severe weather when over half the
staff can be working in the operations area at the height of an event. Another advantage to
the new floor arrangement is that each workstation is oriented inward to facilitate better
communication. The workstations are also oriented so that each person has a clear view of
the situation awareness display to maintain a more consistent watch of important operations
critical information. The situation awareness display has been expanded to include 8 large
monitors for improved viewing from a greater distance. The new operations area also
accommodates 2 communicators during severe weather events. Overall, the new operations
floor design represents a substantial improvement over the former layout in that it achieves
the primary goals of improved communication and situation awareness while accommodating
more workspace for mission-critical hazardous weather support.
The remodeled NWS Paducah operations area looking toward the situation awareness display from the conference room

► The Voice of the NWS—Yesterday and Today . . . by Deanna Lindstrom – Operations Program Leader, and Rachel Trevino – Meteorologist
From the introduction of NOAA Weather Radio until the late 1990s, nearly all the voices heard in
the broadcasts were those of the staff at local NWS offices. The messages were manually
recorded, first on tape cartridges and later digitally. To manage the increasing number of
transmitters for each office and to speed the overall delivery of warning messages to the
public, the Console Replacement System (CRS) was deployed at NWS Weather Forecast Offices
in the late 1990s. CRS introduced a computerized voice nicknamed “Paul” using a text-to-
speech system. Between 2000 and 2003, the automated voices were improved in a couple
phases. For nearly 15 years, “Tom” and “Donna” became the familiar voices of the NWS for
NOAA Weather Radio listeners.
The Broadcast Message Handler, or BMH, brought a new voice to NOAA Weather Radio in late
2016. This system took the weather radio broadcast from its own separate computer system
and integrated it into the computer system that we use to develop our forecasts. This upgrade
makes it much easier to develop and monitor the broadcast from any work station, and also
makes it easier to troubleshoot problems as they occur. The system has had very few technical
problems, and it is a great improvement for consistent broadcasts and our work environment.
The new voice, again named “Paul”, had a lot to learn about how to pronounce cities, counties,
and many words in our region. Extensive work was done to the computer dictionary to improve
pronunciations. Paul is doing much better, but we and the public still discover a word now and
then that needs to be changed in our dictionary. Despite some incorrectly pronounced words,
our new “employee” Paul has been a great addition to our staff!
BMH user interface showing the broadcast cycle for the NOAA Weather Radio transmitter in Marion/Goreville, IL
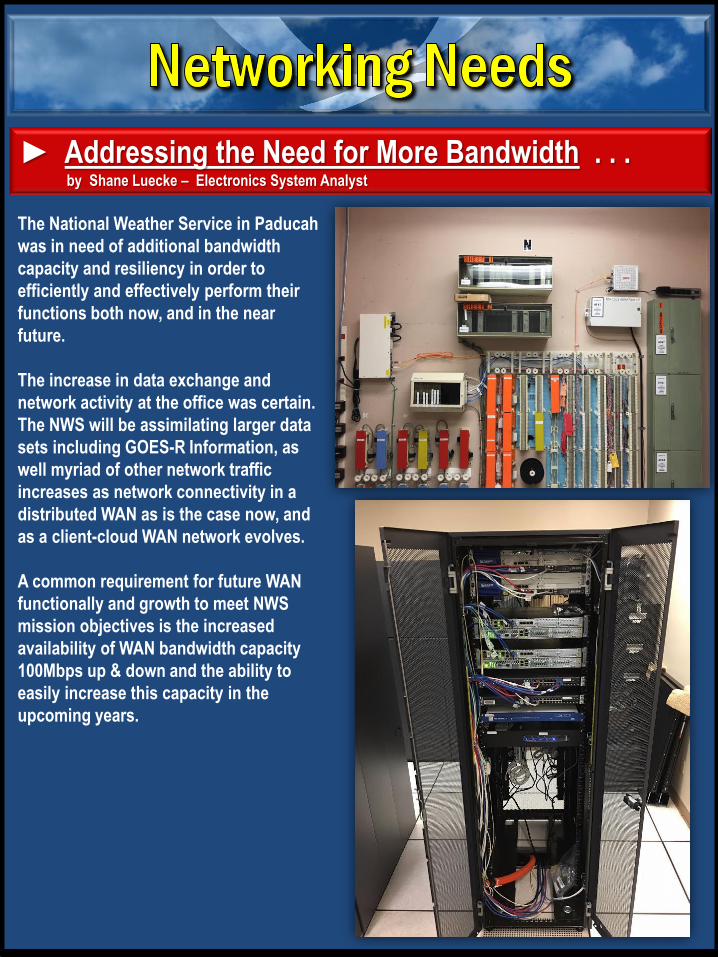
► Addressing the Need for More Bandwidth . . . by Shane Luecke – Electronics System Analyst
The National Weather Service in Paducah
was in need of additional bandwidth
capacity and resiliency in order to
efficiently and effectively perform their
functions both now, and in the near
future.
The increase in data exchange and
network activity at the office was certain.
The NWS will be assimilating larger data
sets including GOES-R Information, as
well myriad of other network traffic
increases as network connectivity in a
distributed WAN as is the case now, and
as a client-cloud WAN network evolves.
A common requirement for future WAN
functionally and growth to meet NWS
mission objectives is the increased
availability of WAN bandwidth capacity
100Mbps up & down and the ability to
easily increase this capacity in the
upcoming years.

► Snowy January Followed by Fairly Active Spring . . . by Sean Poulos – Meteorologist Intern
The calendar year started off snowy in the Quad-State region, with several impactful snow
events. The biggest event was on January 22nd, when much of western KY saw 6-10 inches of
snow. Paducah, KY and Evansville, IN both finished as their 6th snowiest January’s on
record, with 8.4” and 10.9” respectively.
It was a warm start to spring with March ending up as the 9th warmest on record in Paducah
and 6th warmest in Cape Girardeau, MO. It was also very wet in some parts of the area
including Paducah where we finished over 5 inches above normal for the month, ending as
the 4th wettest March on record. After a lackluster 2015 spring severe weather season, it was
fairly active in 2016. We had several notable events and numerous tornado touchdowns,
including the Quad-State’s first EF3 or stronger tornado since the November 17th 2013
Brookport, IL tornado. On May 10th, an EF3 tornado went through northern portions of
Mayfield, KY and continued through Graves County into Marshall County Kentucky.
Mayfield Tornado (courtesy of Paducah
Area Development District)
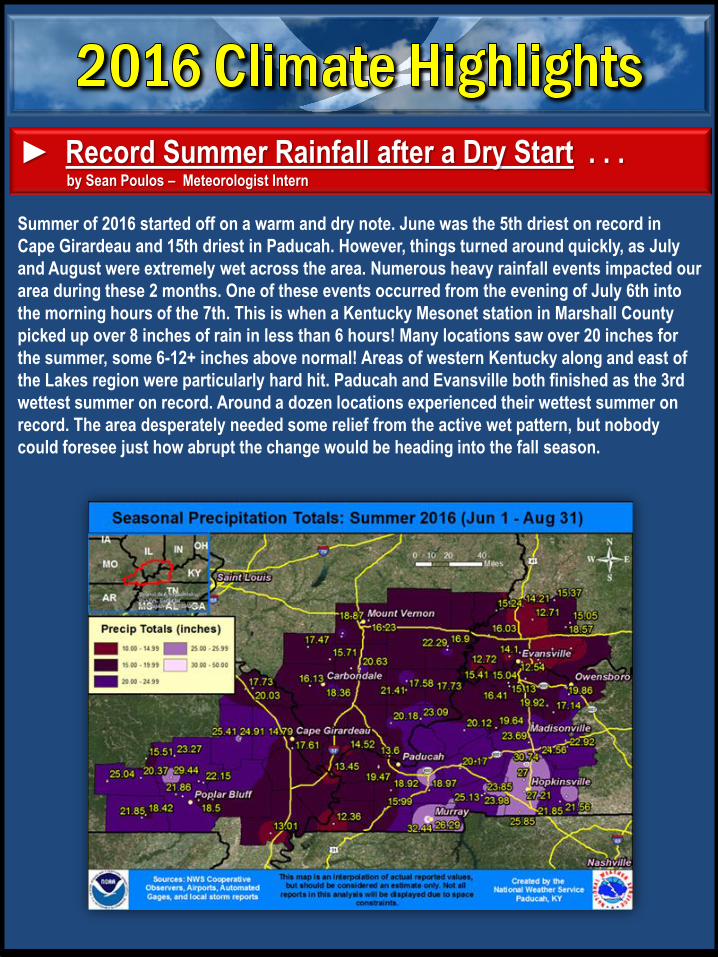
► Record Summer Rainfall after a Dry Start . . . by Sean Poulos – Meteorologist Intern
Summer of 2016 started off on a warm and dry note. June was the 5th driest on record in
Cape Girardeau and 15th driest in Paducah. However, things turned around quickly, as July
and August were extremely wet across the area. Numerous heavy rainfall events impacted our
area during these 2 months. One of these events occurred from the evening of July 6th into
the morning hours of the 7th. This is when a Kentucky Mesonet station in Marshall County
picked up over 8 inches of rain in less than 6 hours! Many locations saw over 20 inches for
the summer, some 6-12+ inches above normal! Areas of western Kentucky along and east of
the Lakes region were particularly hard hit. Paducah and Evansville both finished as the 3rd
wettest summer on record. Around a dozen locations experienced their wettest summer on
record. The area desperately needed some relief from the active wet pattern, but nobody
could foresee just how abrupt the change would be heading into the fall season.

► Exceptionally Dry and Warm Fall Season . . . by Sean Poulos – Meteorologist Intern
The faucet essentially turned off as we neared the final few days of August and turned the
calendar to September. The dramatic reversal in the weather pattern across our area was
quite astounding! Paducah, KY barely picked up 2” of rain in a 3 month period from late
August to Thanksgiving. The normal rainfall for this period is over 10 inches! Drought
conditions expanded across the whole state of Kentucky by the end of October and
conditions deteriorated further heading into November. In fact, by mid November severe
drought conditions had spread across nearly all of Kentucky, with the wet summer being a
distant memory. The overall weather pattern didn’t allow much cold air to penetrate into the
area. This resulted in a very late first freeze. Most locations saw their 1st freeze on November
10th, some 2 to 3 weeks later than normal. In fact, this was only 3 days before the latest 1st
freeze on record in Paducah and Cape Girardeau. These 2 locations finished as their warmest
fall season on record. Evansville checked in as the 2nd warmest fall. This capped off a very
warm year across the middle of the nation. In Paducah and Evansville, temperatures were at
or above normal in every month in 2016 except for May. Paducah, Cape Girardeau, and
Evansville finished as the 3rd, 5th, and 7th warmest year on record respectively.
December provided us with wild
temperature swings, most noteworthy
being highs in the 70s on the 17th,
plummeting to lows in the teens by the
evening of the 18th, a drop of 55 to 65
degrees! Also, Paducah experienced
the warmest Christmas Day on record
with temperatures soaring to 71
degrees. Some drought relief also
came with a few beneficial rain events
from late November into December.
However, portions of southeast
Missouri, western Kentucky, and
southwest Indiana remained in
moderate drought conditions during
the final week of the year.
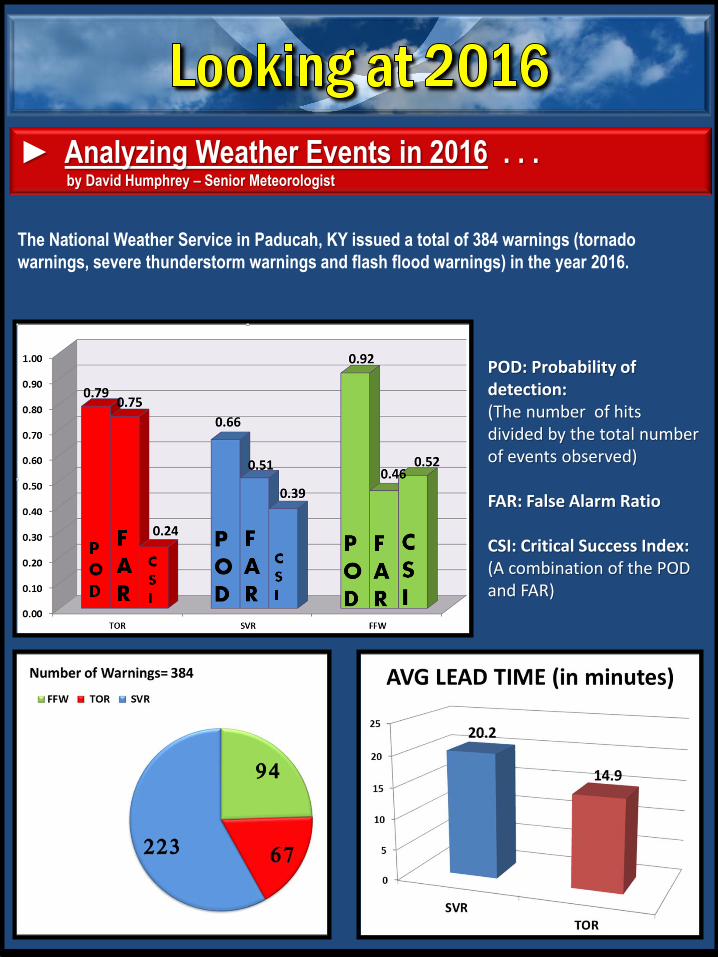
► Analyzing Weather Events in 2016 . . . by David Humphrey – Senior Meteorologist
The National Weather Service in Paducah, KY issued a total of 384 warnings (tornado
warnings, severe thunderstorm warnings and flash flood warnings) in the year 2016.
POD: Probability of detection: (The number of hits divided by the total number of events observed) FAR: False Alarm Ratio CSI: Critical Success Index: (A combination of the POD and FAR)

(1.) January 1-3 Record River Flooding:
Widespread heavy rainfall in late December
led to record flooding along the Mississippi
River. Record crests occurred at Cape
Girardeau, MO and Thebes, IL. Below is a
photo of the Len Small Levee breach captured
by the Illinois State Police on January 2.
(2.) January 22 Winter Storm & Heavy Snow:
Mixed precipitation changed to snow early in
the morning of Friday, January 22. Snowfall
totals ranged from a trace up to 10+ inches.
The heaviest snow fell across western
Kentucky. The photo below was taken in
northeast Trigg County by Tommy Hanberry.
► A Summary of Our Top Ten Weather Events in 2016 . . . by Ryan Presley – Meteorologist
(3.) April 26 Severe Weather (mainly IL/IN):
Scattered reports of wind damage and hail
occurred during the late afternoon and early
evening hours of April 26. An EF-1 tornado
touched down in Evansville, IN as well. The
picture below was taken in Evansville during
a NWS storm survey.
(4.) April 27 Severe Weather (mainly KY):
Numerous thunderstorms developed in the
late afternoon and early evening of April 27.
Most of the damage occurred in Kentucky
where damaging winds, hail, and a few
tornadoes were reported. Josh Stirsman
captured this wall cloud in Central City, KY.

(5.) May 10 Mayfield, KY EF-3 Tornado:
Supercells formed during the afternoon and
evening hours of May 10. The strongest and
longest-lived tornado of the day occurred in
Graves and Marshall Counties in Kentucky.
Below is an image of the tornado captured by
Bobby Hamilton in the Mayfield area.
(6.) May 11 Severe Weather (mainly IL/IN):
A couple rounds of thunderstorms with hail,
damaging winds, flooding, and at least one
confirmed tornado impacted portions of
southern Illinois and Indiana and northwest
Kentucky. This shelf cloud near Harrisburg
was photographed by the Saline County EMA.
► A Summary of Our Top Ten Weather Events in 2016 . . . by Ryan Presley – Meteorologist
(7.) July 6 Severe Weather (mainly MO/KY):
A line of severe thunderstorms with gusts of
60 to 70 mph pushed across the southern half
of the area from midday into mid afternoon. A
couple of EF-1 tornadoes also touched down
in Metropolis, IL and north of Kevil, KY.
Below is radar reflectivity around 1:30 p.m.
(8.) July 6-7 Flash Flooding (KY):
Significant flash flooding occurred from the
late evening of July 6 through the early
morning of July 7 as a slow-moving storm
complex trained across portions of southern
Illinois and western Kentucky. Pictured below
is flooding on I-69 in Marshall County.
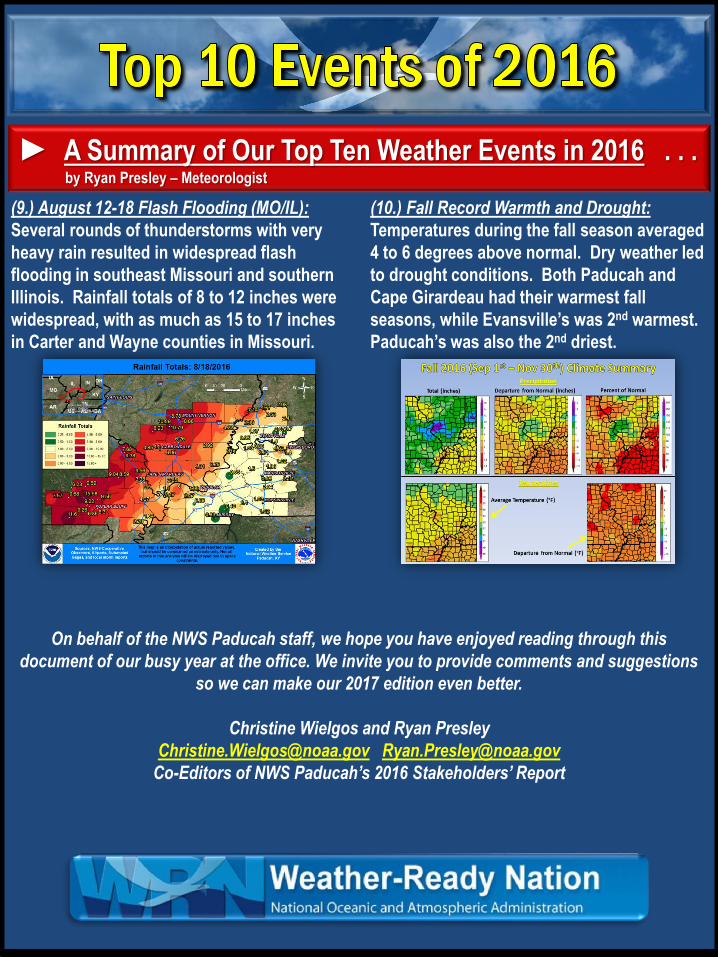
(9.) August 12-18 Flash Flooding (MO/IL):
Several rounds of thunderstorms with very
heavy rain resulted in widespread flash
flooding in southeast Missouri and southern
Illinois. Rainfall totals of 8 to 12 inches were
widespread, with as much as 15 to 17 inches
in Carter and Wayne counties in Missouri.
(10.) Fall Record Warmth and Drought:
Temperatures during the fall season averaged
4 to 6 degrees above normal. Dry weather led
to drought conditions. Both Paducah and
Cape Girardeau had their warmest fall
seasons, while Evansville’s was 2nd warmest.
Paducah’s was also the 2nd driest.
On behalf of the NWS Paducah staff, we hope you have enjoyed reading through this
document of our busy year at the office. We invite you to provide comments and suggestions
so we can make our 2017 edition even better.
Christine Wielgos and Ryan Presley
[email protected] [email protected]
Co-Editors of NWS Paducah’s 2016 Stakeholders’ Report
► A Summary of Our Top Ten Weather Events in 2016 . . . by Ryan Presley – Meteorologist