2016 Simulation CAHPS Commercial Adult 5.0H Final … · Survey Vendor, was selected by UMP ... Any...
311
UMP UW MEDICINE ACCOUNTABLE CARE NETWORK Project Number(s): 1113020 1965 Evergreen Boulevard Suite 100, Duluth, Georgia 30096 2016 Simulation CAHPS ® Commercial Adult 5.0H Final Report PPO
Transcript of 2016 Simulation CAHPS Commercial Adult 5.0H Final … · Survey Vendor, was selected by UMP ... Any...
SPH Analytics Medicaid Adult Survey 1
UMP UW MEDICINE ACCOUNTABLE CARE NETWORK
Project Number(s): 1113020
1965 Evergreen Boulevard Suite 100, Duluth, Georgia 30096
2016 Simulation CAHPS® Commercial Adult 5.0H Final Report
PPO

2016 Final Report for UMP UW MEDICINE ACCOUNTABLE CARE NETWORK Consumer Assessment of Healthcare Providers and Systems (CAHPS®) Survey
SPH Analytics Commercial Adult Survey – 2016 i
Introduction Your Sales Executive for this project is Sheryl Savage (678-689-0312), and your Account Project Manager is Dana Sadlo (770-978-3173, ext. 1336). Should you have any questions or comments regarding any aspect of the survey or reporting process, please feel free to call either your Sales Executive or your Account Project Manager.
New in 2016
The following changes, which are also reported in the Healthcare Effectiveness Data and Information Set (HEDIS®)1 2016 Volume Three Technical Update Specifications, have been implemented for administration of the 2016 Consumer Assessment of Healthcare Providers and Systems (CAHPS®)2 5.0H survey.
Sampling Procedures
Prior to 2016, NCQA guidelines specified that plans may oversample in increments of 5%. In 2016, NCQA removed the restriction on oversampling rates. Additionally, organizations cannot remove disenrollees after the validated sample frame is generated.
Definition of a Complete and Valid Survey
Although there were no changes to the 2016 survey tool, NCQA redefined the criteria for a “complete and valid survey.” For a member to meet the Commercial Adult eligibility requirements for inclusion in your survey results, three of the following five questions must be answered:
• Q3. In the last 12 months, did you have an illness, injury, or condition that needed care right away in a clinic, emergency room, or doctor’s office?
• Q15. A personal doctor is the one you would see if you need a check-up, want advice about a health problem, or get sick or hurt. Do you have a personal doctor?
• Q24. Specialists are doctors like surgeons, heart doctors, allergy doctors, skin doctors, and other doctors who specialize in one area of health care. In the last 12 months, did you make any appointments to see a specialist?
• Q28. In the last 12 months, did you look for any information in written materials or on the Internet about how your health plan works?
• Q42. Using any number from 0 to 10, where 0 is the worst health plan possible and 10 is the best health plan possible, what number would you use to rate your health plan?
Throughout this report, information essential for understanding the report and suggestions for a course of action for developing quality initiatives are identified by this symbol.
1 HEDIS® is a registered trademark of the National Committee for Quality Assurance (NCQA). 2 CAHPS® is a registered trademark of the Agency for Healthcare Research and Quality (AHRQ).
2016 Final Report for UMP UW MEDICINE ACCOUNTABLE CARE NETWORK Consumer Assessment of Healthcare Providers and Systems (CAHPS®) Survey
SPH Analytics Commercial Adult Survey – 2016 ii
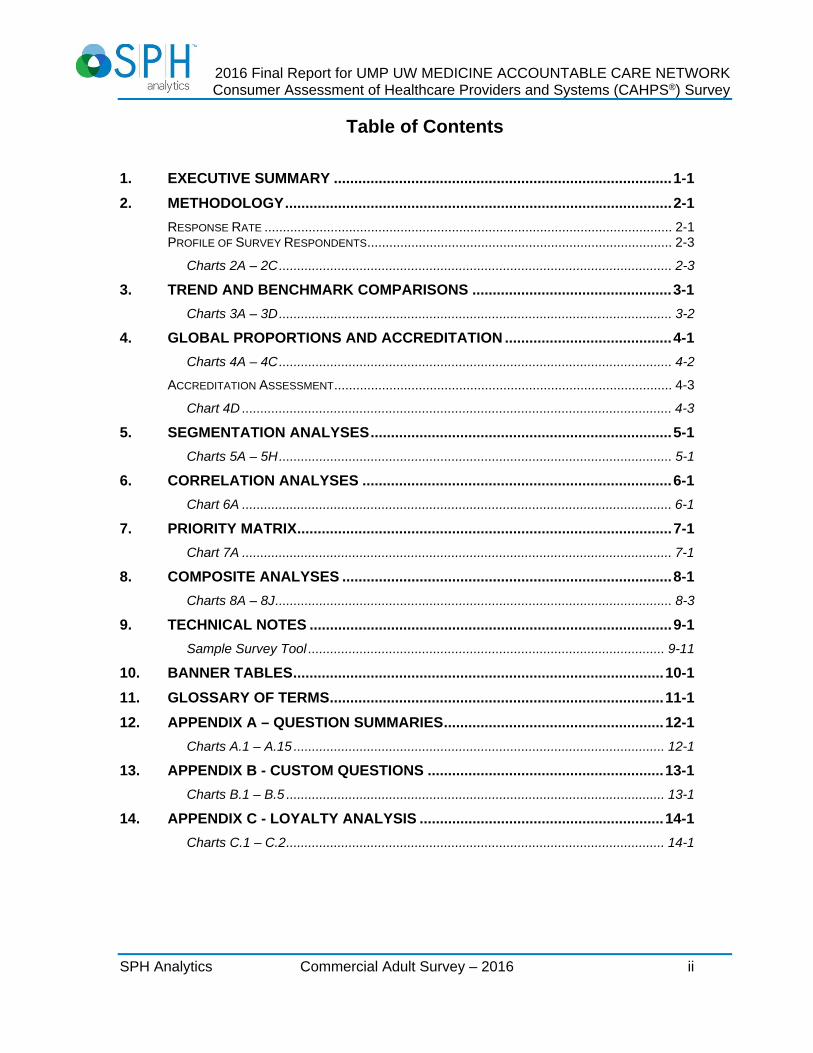
Table of Contents
1. EXECUTIVE SUMMARY ................................................................................... 1-1
2. METHODOLOGY ............................................................................................... 2-1
RESPONSE RATE ............................................................................................................... 2-1 PROFILE OF SURVEY RESPONDENTS ................................................................................... 2-3
Charts 2A – 2C ........................................................................................................... 2-3
3. TREND AND BENCHMARK COMPARISONS ................................................. 3-1
Charts 3A – 3D ........................................................................................................... 3-2
4. GLOBAL PROPORTIONS AND ACCREDITATION ......................................... 4-1
Charts 4A – 4C ........................................................................................................... 4-2
ACCREDITATION ASSESSMENT ............................................................................................ 4-3
Chart 4D ..................................................................................................................... 4-3
5. SEGMENTATION ANALYSES .......................................................................... 5-1
Charts 5A – 5H ........................................................................................................... 5-1
6. CORRELATION ANALYSES ............................................................................ 6-1
Chart 6A ..................................................................................................................... 6-1
7. PRIORITY MATRIX ............................................................................................ 7-1
Chart 7A ..................................................................................................................... 7-1
8. COMPOSITE ANALYSES ................................................................................. 8-1
Charts 8A – 8J ............................................................................................................ 8-3
9. TECHNICAL NOTES ......................................................................................... 9-1
Sample Survey Tool ................................................................................................. 9-11
10. BANNER TABLES ........................................................................................... 10-1
11. GLOSSARY OF TERMS .................................................................................. 11-1
12. APPENDIX A – QUESTION SUMMARIES ...................................................... 12-1
Charts A.1 – A.15 ..................................................................................................... 12-1
13. APPENDIX B - CUSTOM QUESTIONS .......................................................... 13-1
Charts B.1 – B.5 ....................................................................................................... 13-1
14. APPENDIX C - LOYALTY ANALYSIS ............................................................ 14-1
Charts C.1 – C.2 ....................................................................................................... 14-1

2016 Final Report for UMP UW MEDICINE ACCOUNTABLE CARE NETWORK Consumer Assessment of Healthcare Providers and Systems (CAHPS®) Survey
SPH Analytics Commercial Adult Survey – 2016 1-1
1. Executive Summary SPH Analytics (SPHA), a National Committee for Quality Assurance (NCQA) certified HEDIS® Survey Vendor, was selected by UMP UW MEDICINE ACCOUNTABLE CARE NETWORK to conduct its 2016 CAHPS® 5.0H Commercial Adult Member Satisfaction Survey. NCQA requires health plans to submit CAHPS survey results in compliance with HEDIS® accreditation requirements. The overall objective of the CAHPS® study is to capture accurate and complete information about consumer-reported experiences with health care. Specifically, the survey aims to measure how well plans are meeting their members’ expectations and goals; to determine which areas of service have the greatest effect on members’ overall satisfaction; and to identify areas of opportunity for improvement, which could aid plans in increasing the quality of provided care. Using a mixed (mail and phone) survey methodology, per NCQA protocol,3 SPH Analytics collected 176 valid surveys from the eligible member population, yielding a response rate of 16.7%.4 This report summarizes results derived from the CAHPS® 5.0H Commercial Adult Survey as applied to a sample of your health plan members and presents the findings by plan service area (composite) and by each individual question (attribute). In general, satisfaction is presented by Summary Rates, which represent the percent of respondents who chose the most positive question responses as specified by NCQA. 5
Overview of Summary Rate Comparisons The tables beginning on the following page present composite, measure, and rating Summary Rate Scores for the Health Plan domain, the Health Care domain, and for the Effectiveness of Care measures. Included in each table are your plan’s current scores compared to trend data (if applicable), the 2016 PPO SPH Analytics Commercial Adult Book of Business benchmark, and the 2016 PPO Commercial Adult Quality Compass® All Plans 6 benchmark. Significance testing is provided for all comparisons, while percentile rankings7 are provided for benchmark comparisons.
3 Please note that the CAHPS® survey is eligible to be conducted from January through May 2016. 4 Please refer to Section 2 - Methodology for the calculation used to determine the response rate. 5 Select Summary Rates are defined by NCQA in its HEDIS® 2016 CAHPS® 5.0H guidelines and generally represent the most favorable response percentages. Other Summary Rates were selected by SPH Analytics to facilitate comparisons. 6 The source for data contained in this publication is Quality Compass® All Plans 2016. It is used with the permission of the National Committee for Quality Assurance (NCQA). Any analysis, interpretation, or conclusion based on these data is solely that of the authors, and NCQA specifically disclaims responsibility for any such analysis, interpretation, or conclusion. Quality Compass® is a registered trademark of NCQA. 7 Your plan's approximate percentile rankings in relation to the Quality Compass® All Plans benchmark were calculated by SPH Analytics using information derived from the NCQA 1-100 Benchmark. Your percentile rank indicates where your plan’s Summary Rate falls relative to the NCQA 1-100 Benchmark.

2016 Final Report for UMP UW MEDICINE ACCOUNTABLE CARE NETWORK Consumer Assessment of Healthcare Providers and Systems (CAHPS®) Survey
SPH Analytics Commercial Adult Survey – 2016 1-2
Health Plan Domain
Composites, Measures, & Ratings
2016 Summary
Rate (SR)
2015 Trend Comparisons
2016 PPO SPH Analytics
Benchmark Comparisons
2016 PPO Quality Compass®
All Plans Benchmark Comparisons
SR ** SR Percentile
Rank* ** SR
Percentile Rank*
**
8-10 Rating of Health Plan (Q42) 68.2% NA 60.8% 80th 59.5% 85th
9-10 Rating of Health Plan (Q42) 43.8% NA 36.3% 74th 34.7% 86th
Getting Needed Care 85.8% NA 88.0% <10th 87.9% 18th Customer Service 88.6%*** NA 86.7% 60th 87.5% 60th Claims Processing 92.7%*** NA 87.9% 89th 87.8% 91st Plan Information on Costs 64.6%*** NA 57.8% 88th 60.7% 79th Providing Needed Information (Q29) 71.0% NA 62.7% 94th 65.6% 80th
Ease of Filling Out Forms (Q38) 94.3% NA 95.4% 21st 95.2% 20th
* Indicates where your plan's Summary Rate ranks when compared to all other plans in the benchmark. ** Indicates a significant difference ( or ) when your plan’s Summary Rate is compared to trend and/or benchmark data.*** Indicates this measure received less than 100 completed responses and will, therefore, receive an NA in the NCQA submission report.
Health Care Domain
Composites, Measures, & Ratings
2016 Summary
Rate (SR)
2015 Trend Comparisons
2016 PPO SPH Analytics
Benchmark Comparisons
2016 PPO Quality Compass®
All Plans Benchmark Comparisons
SR ** SR Percentile
Rank* ** SR
Percentile Rank*
**
8-10 Rating of Health Care (Q13) 78.5% NA 76.8% 66th 76.5% 69th
9-10 Rating of Health Care (Q13) 52.8% NA 49.8% 64th 48.7% 80th
Getting Care Quickly 84.4% NA 86.2% 17th 85.8% 27th How Well Doctors Communicate 94.6% NA 95.6% 35th 95.6% 27th
Shared Decision Making 84.1%*** NA 82.5% 72nd 82.0% 75th Health Promotion and Education (Q8) 82.2% NA 74.4% 99th 74.6% 98th
Coordination of Care (Q22) 84.8% NA 80.3% 90th 81.3% 77th 8-10 Rating of Personal Doctor (Q23) 88.9% NA 84.1% 95th 84.4% 94th
9-10 Rating of Personal Doctor (Q23) 70.4% NA 65.6% 87th 65.5% 89th
8-10 Rating of Specialist (Q27) 84.2% NA 83.5% 60th 83.3% 61st 9-10 Rating of Specialist (Q27) 63.2% NA 65.5% 26th 64.9% 33rd
* Indicates where your plan's Summary Rate ranks when compared to all other plans in the benchmark. ** Indicates a significant difference ( or ) when your plan’s Summary Rate is compared to trend and/or benchmark data. *** Indicates this measure received less than 100 completed responses and will, therefore, receive an NA in the NCQA submission report.

2016 Final Report for UMP UW MEDICINE ACCOUNTABLE CARE NETWORK Consumer Assessment of Healthcare Providers and Systems (CAHPS®) Survey
SPH Analytics Commercial Adult Survey – 2016 1-3
Effectiveness of Care Measures8
Measures
2016 Summary
Rate (SR)
2015 Trend Comparisons
2016 PPO SPH Analytics
Benchmark Comparisons
2016 PPO Quality Compass®
All Plans Benchmark Comparisons
SR ** SR Percentile
Rank* ** SR
Percentile Rank*
**
Flu Vaccinations (Adults 18-64)
79.5% NA 46.3% 99th 46.6% 99th
Advising Smokers and Tobacco Users to Quit
50.0%*** NA 71.3% <10th 72.2% <10th
Discussing Cessation Medications 75.0%*** NA 44.9% 99th 44.8% 99th
Discussing Cessation Strategies 25.0%*** NA 39.5% <10th 39.2% <10th
Aspirin Use 43.5%*** NA 38.0% 80th 40.6% 63rd Discussing Aspirin Risks and Benefits 41.8%*** NA 44.7% 31st NA NA
* Indicates where your plan's Summary Rate ranks when compared to all other plans in the benchmark. ** Indicates a significant difference ( or ) when your plan’s Summary Rate is compared to trend and/or benchmark data.*** Indicates this measure received less than 100 completed responses and will, therefore, receive an NA in the NCQA submission report.
8 The Summary Rates for Effectiveness of Care Measures (with the exception of the Flu Vaccinations (Adults 18-64) measure) are calculated on a two-year rolling average due to anticipated small denominators. Please note that Quality Compass® All Plans benchmarking is not available for the Effectiveness of Care measures.

2016 Final Report for UMP UW MEDICINE ACCOUNTABLE CARE NETWORK Consumer Assessment of Healthcare Providers and Systems (CAHPS®) Survey
SPH Analytics Commercial Adult Survey – 2016 1-4
Key Driver and Opportunity Analyses Members set standards for performance whether consciously or subconsciously. Standards are usually set higher for those plan services that are deemed important to each member. These important services are the Key Drivers of Satisfaction. Multiple linear regression analyses were run on the 2016 PPO SPH Analytics Commercial Adult Book of Business to discover which composites were Key Drivers of Rating of Health Plan (Q42), Rating of Health Care (Q13), and Rating of Personal Doctor (Q23). The Summary Rates of these Key Drivers are compared to the Summary Rates of all other plans in the 2016 PPO SPH Analytics Commercial Adult Book of Business benchmark in the tables below. Depending on how these composite scores rank they are placed into one of the three following action categories: Plan Strength (Market & Maintain): A Key Driver of Satisfaction and Summary Rates
are at or above the 75th percentile when compared to the 2016 PPO SPH Analytics Commercial Adult Book of Business benchmark.
Plan Opportunity (Investigate & Improve): A Key Driver of Satisfaction, but Summary Rates
are below the 50th percentile when compared to the 2016 PPO SPH Analytics Commercial Adult Book of Business benchmark.
Area to Monitor: A Key Driver of Satisfaction, but Summary Rates
are between the 50th and 75th percentiles when compared to the 2016 PPO SPH Analytics Commercial Adult Book of Business benchmark. These Key Drivers could become strengths or opportunities depending on the plan’s success in these areas.
Rating of Health Plan Opportunity Analysis Respondents were asked to provide an overall rating of health plan satisfaction (Q42), with “0” representing worst and “10” representing best. The NCQA defined Summary Rate for this measure is the percentage of respondents who rated their health plan an “8,” “9,” or “10.” Members’ ratings of their health plan is an important gauge of plan quality and is also the most heavily weighted CAHPS® measure in the accreditation process. The following composites have been identified as Key Drivers of health plan rating based on the regression analysis:
Key Drivers of Health Plan Rating
Beta Coefficient (β)9
Percentile Ranking
Opportunity Analysis
Claims Processing 1.342 89th Strength
Customer Service 0.800 60th Monitor
Getting Needed Care 0.339 <10th Opportunity
9 Numbers shown are beta coefficients. See “Regression Analysis” in Technical Notes for more information.

2016 Final Report for UMP UW MEDICINE ACCOUNTABLE CARE NETWORK Consumer Assessment of Healthcare Providers and Systems (CAHPS®) Survey
SPH Analytics Commercial Adult Survey – 2016 1-5
Rating of Health Care Opportunity Analysis Rating of Health Care (Q13) gives members an opportunity to rate all of the health care they have received in the last twelve months. This rating provides feedback to health plans to help improve their members’ quality of care. The following composites have been identified as the Key Drivers of health care satisfaction based on regression analysis:
Key Drivers of Health Care Rating
Beta Coefficient (β)
Percentile Ranking
Opportunity Analysis
How Well Doctors Communicate
0.741 35th Opportunity
Getting Needed Care 0.733 <10th Opportunity
Customer Service 0.290 60th Monitor Additionally, Rating of Health Care is highly correlated with the Rating of Personal Doctor. Rating of Personal Doctor Opportunity Analysis Question 23 gives members an opportunity to rate their personal doctor. A high rating indicates members rate their personal doctors positively. A positive relationship between personal doctor and patient is an important part of health care. The following composites have been identified as the Key Drivers of health care satisfaction based on regression analysis:
Key Drivers of Personal Doctor Rating
Beta Coefficient (β)
Percentile Ranking
Opportunity Analysis
How Well Doctors Communicate
1.904 35th Opportunity
Coordination of Care 0.307 90th Strength
Additionally, Rating of Personal Doctor is highly correlated with the Rating of Health Care.

2016 Final Report for UMP UW MEDICINE ACCOUNTABLE CARE NETWORK Consumer Assessment of Healthcare Providers and Systems (CAHPS®) Survey
SPH Analytics Commercial Adult Survey – 2016 1-6
Accreditation for 2016 Scoring NCQA requires health plans seeking accreditation to submit specified HEDIS® measures and HEDIS®/CAHPS® 5.0H survey results. NCQA determines the CAHPS® 5.0H portion of the score by comparing the plan’s results to a national benchmark (the 90th percentile) and to national thresholds (the 75th, 50th, and 25th percentiles). The HEDIS® measure portion of the score is ascertained by comparing the plan’s results to a national benchmark (the 90th percentile) and to regional and national thresholds (the 75th, 50th, and 25th percentiles). NCQA does not take into account regional thresholds for CAHPS® measures due to the fact that variations in the data are not significant by region. The Rating of Health Plan survey item receives double the points of other CAHPS® measures. To receive points toward accreditation scoring, measures submitted by the organization must receive a Reportable (R) rate from an NCQA-Certified HEDIS® Compliance auditor. If the audited rate for a measure has a denominator that is too small to report a valid rate (NA) or if the organization did not offer the health benefit required by the measure (NB), then the points for that measure are redistributed among the remaining required measures. NCQA provides an accreditation status for each health plan entity reviewed.10 Accreditation status is valid for a maximum of 36 months from the date of the final results for the First and Renewal Evaluation options and is subject to revision resulting from annual reevaluation of HEDIS®/CAHPS® results (if applicable). Conversely, an interim evaluation status is valid for a maximum of eighteen months. The table below shows the results for your plan. The second column represents the approximate percentile threshold your plan achieved when compared to the benchmark. The third, fourth, and fifth columns show the point distribution.11
Note: If a plan receives an NA (indicating the denominator was less than 100) the points for that measure are redistributed among the remaining required measures. An organization that has more than four CAHPS® NAs, or which exceed ten NA or NB results between HEDIS and CAHPS® for each product line, are scored based on the standards score only and the accreditation status is capped at Commendable.
10 Please note that health plan accreditation status provided by NCQA depends on the Evaluation Option that the plan has selected. For more information, please refer to NCQA’s Standards and Guidelines for the Accreditation of Health Plans (2016) document. 11 Please note that the CAHPS® How Well Doctors Communicate measure was retired from 2015 accreditation scoring, however, organizations accredited on the 2014 standard will still be scored using the organization's submitted rate for this measure. Furthermore, the CAHPS® Coordination of Care measure was introduced into 2016 accreditation scoring. Organizations accredited on the 2014 and 2015 standards will not be scored using the organization's submitted rate for this measure.
Composite/Rating Item Approximate Plan Percentile
Threshold Points Awarded per Accreditation Year
2016 2015 2014
Getting Needed Care <25th 0.325 0.371 0.325
Getting Care Quickly <25th 0.325 0.371 0.325
How Well Doctors Communicate 90th 1.625
Customer Service NA - - -
Claims Processing NA - - -
Coordination of Care 50th 1.105
Rating of Health Care (Q13) 50th 1.105 1.263 1.105
Rating of Personal Doctor (Q23) 90th 1.625 1.857 1.625
Rating of Specialist (Q27) 50th 1.105 1.263 1.105
Rating of Health Plan (Q42) 50th 2.210 2.526 2.210
Approximate Points Earned (Out of possible 13.000 in 2014, 2015, and 2016)
7.800 7.651 8.320

2016 Final Report for UMP UW MEDICINE ACCOUNTABLE CARE NETWORK Consumer Assessment of Healthcare Providers and Systems (CAHPS®) Survey
SPH Analytics Commercial Adult Survey – 2016 1-7
NCQA assigns points based upon a plan’s ability to meet or exceed thresholds and is calculated to the thousandth. The thresholds shown on Page 4D (and made available to the public) are shown only to the hundredth and do not represent the final threshold used to determine the distribution of points for accreditation. Therefore, plan percentile thresholds, as well as points earned, are approximations only.

2016 Final Report for UMP UW MEDICINE ACCOUNTABLE CARE NETWORK Consumer Assessment of Healthcare Providers and Systems (CAHPS®) Survey
SPH Analytics Commercial Adult Survey – 2016 2-1
2. Methodology UMP UW MEDICINE ACCOUNTABLE CARE NETWORK chose a mixed (mail and phone) survey administration methodology.
Response Rate Your plan’s sample size is 1,100. SPH Analytics collected 176 valid surveys (176 Mail and 0 Telephone) from the eligible member population.12 After adjusting for ineligible members, your survey response rate is 16.7%. A response rate is only calculated for those members who were eligible and able to respond. According to NCQA protocol, ineligible members include those who are deceased, do not meet the eligible population criteria, have a language barrier, or are either mentally or physically incapacitated. Non-respondents include those members who have refused to participate in the survey, could not be reached due to a bad address or telephone number, or members that reached a maximum attempt threshold and were unable to be contacted during the survey time period. The table on the following page shows the total number of members in the sample that fell into each of the various disposition categories. A disposition category is the final status assignment given to a member record within the sample. The category signifies both the survey administration protocol used to complete the survey (M=Mail, T=Phone, and I=Internet, if applicable) and the status of the record (for example, M21=mail, did not meet eligibility criteria; T22=phone, language barrier). Depending upon the survey protocol, some of the groupings on the following page may not apply.
12 Please note that the CAHPS® survey is eligible to be conducted from January through May 2016.

2016 Final Report for UMP UW MEDICINE ACCOUNTABLE CARE NETWORK Consumer Assessment of Healthcare Providers and Systems (CAHPS®) Survey
SPH Analytics Commercial Adult Survey – 2016 2-2
Disposition Group Disposition Category N
Ineligible
Deceased (M20/T20) 0
Does not meet eligibility criteria (M21/T21) 47
Language barrier (M22/T22) 0
Mentally/physically incapacitated (M24/T24) 1
Duplicate Household of Sampled Adult Member (ID1)
0
Duplicate Household of Sampled Child Member (ID2)
0
Total Ineligible 48
Non-response
Bad address/phone (M23/T23) 9
Refusal (M32/T32) 5
Maximum attempts made (M33/T33) 858
Total Non-response 876
Ineligible members are subtracted from the sample size when computing a response rate as shown below.
Completed surveys = Response Rate
Sample size – Ineligible members Using the final figures from your Commercial Adult Survey, the numerator and denominator used to compute your response rate are presented below.
176 (Mail) + 0 (Phone) =
176 = 16.7%
1,100 (Sample) – 48 (Ineligible) 1,052 Please refer to the Technical Notes for the protocol used to calculate the response rate and administer the survey.

2016 Final Report for UMP UW MEDICINE ACCOUNTABLE CARE NETWORK Consumer Assessment of Healthcare Providers and Systems (CAHPS®) Survey
SPH Analytics Commercial Adult Survey – 2016 2-3
Profile of Survey Respondents The demographic characteristics of respondents surveyed should be representative of your member population. SPH Analytics follows NCQA protocol to help achieve a representative sample of your plan’s member population. Pages 2A – 2B show the percentages of respondents by demographic category (Health Status, Mental/Emotional Health Status, Age, Gender, Education, Ethnicity, and Race) from your current survey (displayed in blue), compared to trend data (displayed in light blue, if applicable), the 2016 PPO SPH Analytics Commercial Adult Book of Business benchmark (displayed in green), and the 2016 PPO Commercial Adult Public Report13 benchmark (displayed in light green, where applicable). The demographic makeup of your plan’s member base may not mirror the “average” plan; therefore, caution is recommended when making comparisons to benchmark data. To help you identify how your plan’s population compares to other plans and to previous data, statistically significant differences are highlighted. Refer to the Technical Notes for more information on this topic. Through years of experience and analysis of our books of business, SPH Analytics has observed that the demographics of a response group may have an effect on overall satisfaction results. For example, higher satisfaction ratings are usually given by members who are older and report better health status. In contrast, members who are more educated tend to give lower ratings of overall satisfaction. A comprehensive detail of demographic results for your plan is presented in Segmentation Analyses – Section 5. Page 2C shows a segmentation of the Rating of Health Plan (Q42) results by demographic categories. Across the top of the table are scores “0-3,” “4-7,” “8-10,” and “9-10.” Down the far left column are the different demographic categories. The numbers in the table represent the percentage of respondents from each demographic category that rated the health plan either “0 to 3,” “4 to 7,” “8 to 10,” or “9 to 10.” For example, in the table below, the percentages represent the respondents with a high school education or less. The interpretation would be “Of the respondents with a high school education or less, 10% rated their plan ‘0 to 3;’ 30% rated their plan ‘4 to 7;’ 60% rated their plan ‘8 to 10,’ and 40% rated their plan ‘9 to 10.’”
Segment Rated Plan “0-3”
Rated Plan “4-7”
Rated Plan “8-10”
Rated Plan “9-10”
High School Graduate or less
10% 30% 60% 40%
Charts 2A – 2C
13 The 2016 Public Report benchmark is derived from NCQA’s Quality Compass® benchmark and is calculated by SPH Analytics. The 2016 Public Report benchmark consists of 152 Commercial Adult Survey results, which were submitted to NCQA in 2016. Please note that any analyses, interpretations, or conclusions based upon the Public Report benchmark are solely that of the author (SPH Analytics) and NCQA specifically disclaims responsibility for any such analyses, interpretations, or conclusions. Quality Compass® 2016 is used with the permission of the National Committee for Quality Assurance (NCQA). Quality Compass® is a registered trademark of NCQA.

Profile of Survey RespondentsSurvey Demographics Commercial Adult CAHPS® Simulation
176 Total Respondents
KEY:
* Health Status and Mental/Emotional Health Status are defined by the member.
UMP UW MEDICINE ACCOUNTABLE CARE NETWORK
Note 2: Significance Testing - "↓" denotes a significantly lower percentage when compared to the current year data. "↑" denotes a significantly higher percentage when compared to the current year data. No arrow denotes that there was no significant difference between the percentages or that there was insufficient sample size to conduct the statistical test. All significance testing is performed at the 95% significance level.
Note 1: The 2016 SPH Analytics Book of Business consists of 29 commercial adult, PPO samples that conducted surveys with SPH Analytics in 2016 and submitted data to NCQA. The 2016 Public Report benchmark is derived from NCQA's Quality Compass® benchmark and is calculated by SPH Analytics. The Public Report benchmark is the mean of 152 PPO, plan-specific samples that submitted to NCQA in 2016.
Your Plan's 2016 Rate
Your Plan's 2015 Rate
2016 PPO SPH Analytics Benchmark
2016 PPO Public Report Benchmark
45.3%
23.8%
14.2%
16.6%
47.0%
23.3%
13.4%
16.2%
NA
NA
NA
NA
49.1%
19.4%
16.6%
14.9%
0
0.1
0.2
0.3
0.4
0.5
0.6
55or older
45 - 54
35 - 44
18 - 34
0% 20% 40% 60% 80% 100% 120%
AGE (Q59)
7.9%
31.0%
61.1%
7.7%
30.8%
61.5%
NA
NA
NA
8.0%
31.3%
60.8%
0
0.1
0.2
0.3
0.4
0.5
0.6
Fair/Poor
Good
Excellent/Very good
0% 20% 40% 60% 80% 100% 120%
HEALTH STATUS (Q43)*
5.3%
20.1%
74.6%
4.8%
19.8%
75.4%
NA
NA
NA
5.7%
20.1%
74.1%
0
0.1
0.2
0.3
0.4
0.5
0.6
Fair/Poor
Good
Excellent/Very good
0% 20% 40% 60% 80% 100% 120%
MENTAL/EMOTIONAL HEALTH STATUS (Q44)*
56.2%
43.8%
55.7%
44.3%
NA
NA
65.9%
34.1%
0
0.1
0.2
0.3
0.4
0.5
0.6
Female
Male
0% 20% 40% 60% 80% 100% 120%
GENDER (Q60)
Research on CAHPS® survey results indicates that…
- Respondents reporting better health statuses tend to give higher ratings of health plan
- Older respondents tend to give higher ratings of health plan
- Respondents with less education tend to give higher ratings of health plan
68.2%
NA
60.8% 60.1%
0 0.1 0.2 0.3 0.4 0.5 0.6 0.7 0.8 0.9 1
0
0.1
0.2
0.3
0.4
0.5
0.6
0%
20%
40%
60%
80%
100%
120%
Rating of 8, 9, or 10
RATING OF HEALTH PLAN (Q42)
SPH Analytics Commercial Adult Survey—2016 2A

Profile of Survey RespondentsSurvey Demographics (Continued) Commercial Adult CAHPS® Simulation
176 Total Respondents
KEY:
UMP UW MEDICINE ACCOUNTABLE CARE NETWORK
Note 2: Significance Testing - "↓" denotes a significantly lower percentage when compared to the current year data. "↑" denotes a significantly higher percentage when compared to the current year data. No arrow denotes that there was no significant difference between the percentages or that there was insufficient sample size to conduct the statistical test. All significance testing is performed at the 95% significance level.
Note 1: The 2016 SPH Analytics Book of Business consists of 29 commercial adult, PPO samples that conducted surveys with SPH Analytics in 2016 and submitted data to NCQA. The 2016 Public Report benchmark is derived from NCQA's Quality Compass® benchmark and is calculated by SPH Analytics. The Public Report benchmark is the mean of 152 PPO, plan-specific samples that submitted to NCQA in 2016.
Your Plan's 2016 Rate
2016 PPO Public Report Benchmark
2016 PPO SPH Analytics Benchmark
Your Plan's 2015 Rate
93.3%
6.7%
94.9%
5.1%
NA
NA
94.7%
5.3%
0
0.1
0.2
0.3
0.4
0.5
0.6
NotHispanic/
Latino
Hispanic/Latino
0% 20% 40% 60% 80% 100% 120%
ETHNICITY (Q62)
4.0%
1.9%
0.5%
4.3%
6.2%
83.4%
3.5%
1.8%
1.1%
5.9%
4.6%
88.5%
NA
NA
NA
NA
NA
NA
2.9%
3.5%
0.6%
15.8%
3.5%
80.1%
0
0.1
0.2
0.3
0.4
0.5
0.6
Other
AmericanIndian/Alaskan
Hawaiian/Pacific
Islander
Asian
Black/African-
American
White
0% 20% 40% 60% 80% 100% 120%
RACE (Q63)
43.0%
32.8%
24.2%
42.5%
31.4%
26.1%
NA
NA
NA
73.1%
22.9%
4.0%
0
0.1
0.2
0.3
0.4
0.5
0.6
Collegegraduateor more
Somecollege
Highschool
graduateor less
0% 20% 40% 60% 80% 100% 120%
EDUCATION (Q61)
Research on CAHPS® survey results indicates that…
- Respondents reporting better health statuses tend to give higher ratings of health plan
- Older respondents tend to give higher ratings of health plan
- Respondents with less education tend to give higher ratings of health plan
68.2%
NA
60.8% 60.1%
0 0.1 0.2 0.3 0.4 0.5 0.6 0.7 0.8 0.9 1
0
0.1
0.2
0.3
0.4
0.5
0.6
0%
20%
40%
60%
80%
100%
120%
Rating of 8, 9, or 10
RATING OF HEALTH PLAN (Q42)
SPH Analytics Commercial Adult Survey—2016 2B

Segmentation Analysis UMP UW MEDICINE ACCOUNTABLE CARE NETWORK
Commercial Adult CAHPS® Simulation
176 Total Respondents
Valid n* % Valid n* % Valid n* % Valid n* %
Excellent/Very good 1 0.9% 26 24.3% 80 74.8% 54 50.5%
Good 0 0.0% 21 38.2% 34 61.8% 19 34.5%
Fair/Poor 5 35.7% 3 21.4% 6 42.9% 4 28.6%
Excellent/Very good 4 3.1% 36 27.9% 89 69.0% 58 45.0%
Good 0 0.0% 10 28.6% 25 71.4% 16 45.7%
Fair/Poor 2 20.0% 3 30.0% 5 50.0% 3 30.0%
18 - 34 1 3.8% 6 23.1% 19 73.1% 12 46.2%
35 - 44 1 3.4% 13 44.8% 15 51.7% 8 27.6%
45 - 54 1 2.9% 10 29.4% 23 67.6% 12 35.3%
55 or older 3 3.5% 20 23.3% 63 73.3% 45 52.3%
Male 4 6.7% 23 38.3% 33 55.0% 24 40.0%
Female 2 1.7% 27 23.3% 87 75.0% 53 45.7%
High school graduate or less
0 0.0% 2 28.6% 5 71.4% 4 57.1%
Some college or more 6 3.6% 48 28.6% 114 67.9% 72 42.9%
Hispanic/Latino 1 11.1% 3 33.3% 5 55.6% 2 22.2%
Not Hispanic/Latino 5 3.1% 45 28.1% 110 68.8% 73 45.6%
White 4 2.9% 42 30.7% 91 66.4% 60 43.8%
Black/African American
1 16.7% 1 16.7% 4 66.7% 3 50.0%
Other*** 2 5.1% 9 23.1% 28 71.8% 16 41.0%
Mail 6 3.4% 50 28.4% 120 68.2% 77 43.8%
Phone 0 0.0% 0 0.0% 0 0.0% 0 0.0%
Survey Item 8-10
AGE (Q59)
HEALTH STATUS (Q43)**
MENTAL/EMOTIONAL HEALTH STATUS (Q44)**
Rating of Health Plan (Q42)
Note: Your plan's survey wasn't administered using an Internet data collection methodology.
Rating of Health Plan (Q42) by Respondent Demographics
0-3 4-7
GENDER (Q60)
** Health Status and Mental/Emotional Health Status are defined by the member.* Valid n refers to total number of respondents answering the response item within the subgroup under the column heading.
EDUCATION (Q61)
ETHNICITY (Q62)
RACE (Q63)
DATA COLLECTION MODE
*** "Other" includes respondents who selected "Asian," "Native Hawaiian or other Pacific Islander," "American Indian or Alaska Native," or "Other" in Q63.
9-10
SPH Analytics Commercial Adult Survey—2016 2C

2016 Final Report for UMP UW MEDICINE ACCOUNTABLE CARE NETWORK Consumer Assessment of Healthcare Providers and Systems (CAHPS®) Survey
SPH Analytics Commercial Adult Survey – 2016 3-1
3. Trend and Benchmark Comparisons The CAHPS® 5.0H survey is designed to use composite scores to facilitate the aggregation of information and the communication of results. Questions are combined into composite categories comprising a particular service area managed by your plan. These composites, the questions that make up composites (attributes), additional measures, and rating questions are shown on the following pages. Page 3A Summary of Trend and Benchmark Comparisons
Shows how your plan’s composite and key question Summary Rates compare to scores from the previous years’ results (if applicable) and scores from the 2016 PPO SPH Analytics Commercial Adult Book of Business, 2016 PPO Commercial Adult Public Report, and 2016 PPO Commercial Adult Quality Compass® All Plans benchmarks. To help you identify how your plan’s population compares to other plans and to previous data, statistically significant differences are highlighted.
Page 3B 2016 PPO SPH Analytics Commercial Adult Book of Business Mean and Percentiles Shows how your health plan’s composite and key question Summary Rates compare to the mean and percentile (25th, 50th, 75th, and 90th) scores generated from the 2016 PPO SPH Analytics Commercial Adult Book of Business benchmark. This benchmark contains data from 29 plan-specific commercial adult samples contracted with SPH Analytics to administer the CAHPS® 5.0H survey and to submit data to NCQA in 2016. Your plan’s percentile ranking is shown beside each score.
Page 3C 2016 PPO Commercial Adult Public Report Mean and Percentiles Shows how your health plan’s composite and key question Summary Rates compare to the mean and percentile (25th, 50th, 75th, and 90th) scores generated from the 2016 PPO Commercial Adult Public Report benchmark. This benchmark contains data from 152 plan-specific commercial adult samples nationwide who chose to report their plan-level scores publicly. Your plan’s percentile ranking is shown beside each score.
Page 3D 2016 PPO Commercial Adult Quality Compass® All Plans Mean and Percentiles Shows your health plan’s composite and key question Summary Rates alongside the mean and percentile (25th, 50th, 75th, and 90th) scores generated from the 2016 PPO Commercial Adult Quality Compass® All Plans benchmark. This benchmark includes approximately 211 samples of commercial adult plans that submitted to NCQA. Your plan’s approximate percentile ranking14 in relation to the Quality Compass® All Plans benchmark is displayed next to each score.
14 Your plan's approximate percentile rankings in relation to the Quality Compass® All Plans benchmark were calculated by SPH Analytics using information derived from the NCQA 1-100 Benchmark. Your percentile rank indicates where your plan’s Summary Rate falls relative to the NCQA 1-100 Benchmark.

2016 Final Report for UMP UW MEDICINE ACCOUNTABLE CARE NETWORK Consumer Assessment of Healthcare Providers and Systems (CAHPS®) Survey
SPH Analytics Commercial Adult Survey – 2016 3-2
A brief description of each benchmark, as well as its pros and cons are shown in the table below.
Benchmark Definition # of Plans Pros Cons
2016 Public Report
The Public Report benchmark is derived from NCQA’s Quality Compass® benchmark and is calculated by SPH Analytics. The benchmark is a collection of commercial, PPO, adult samples that submitted data to NCQA in 2016 and allowed their data to be publicly reported.
152
* Provides the most up-to-date benchmark reflecting the 2016 survey results15 * Provides a benchmark for each question from the survey * Permits precise percentile ranking of plan compared to benchmark
* Contains fewer plans than All Plans benchmark * Does not contain benchmarking for some Effectiveness of Care measures
2016 Quality Compass® All Plans Report
Includes all commercial, PPO, adult samples that submitted data to NCQA in 2016.
211
* Contains more plans than Public Report * Is presented in NCQA’s The State of Health Care Quality
* Only contains benchmarks for certain key questions, composites, and rating questions * Does not contain benchmarking for Effectiveness of Care measures
2016 NCQA 1-100 Benchmark
A percentile benchmark (with values ranging from the first through the one hundredth percentile) calculated by NCQA and derived from commercial PPO adult data collected by NCQA in 2016.
211
* Utilized by SPH Analytics to calculate approximate percentile ranking of plan scores in relation to the Quality Compass® All Plans benchmark
* Only contains benchmarks for certain key questions, composites, and rating questions * Does not contain benchmarking for Effectiveness of Care measures
2016 SPH Analytics Book of Business
Includes all the commercial adult samples (PPO) that contracted with SPH Analytics to administer the 2016 CAHPS 5.0H survey and submitted data to NCQA.
29
* Provides a benchmark for each question from the survey * Permits precise percentile ranking of plan compared to benchmark
* Contains fewer plans than the Public Report16 and the Quality Compass® All Plans benchmarks
Please refer to the Technical Notes for additional information regarding these benchmarks. Charts 3A – 3D
15 The 2016 Quality Compass® will be available in late Summer of 2016. 16 Historically the SPH Analytics Book of Business benchmark has varied by less than 1% from the Public Report benchmark.

Composites, Attributes, Key Questions, and Ratings of Member Satisfaction Commercial Adult CAHPS® Simulation
176 Total Respondents
2015 2014
Getting Needed Care 162 85.8% NA NA 88.0% 87.5% 87.9%
Q14. Ease of getting care, tests, or treatment needed 162 92.6% NA NA 90.5% 90.3% 90.6%
Q25. Obtained appointment with specialist as soon as needed 114 78.9% NA NA 85.6% 84.9% 85.2%
Getting Care Quickly 149 84.4% NA NA 86.2% 85.7% 85.8%
Q4. Obtained needed care right away 72 88.9% NA NA 88.8% 88.3% 88.5%
Q6. Obtained appointment for care as soon as needed 149 79.9% NA NA 83.5% 82.9% 83.1%
How Well Doctors Communicate 149 94.6% NA NA 95.6% 95.5% 95.6%
Q17. Doctors explained things in an understandable way 149 96.0% NA NA 96.7% 96.8% 96.8%
Q18. Doctors listened carefully to you 149 94.0% NA NA 95.5% 95.4% 95.4%
Q19. Doctors showed respect for what you had to say 149 96.6% NA NA 96.5% 96.4% 96.5%
Q20. Doctors spent enough time with you 149 91.9% NA NA 93.9% 93.5% 93.5%
Customer Service 66 88.6% NA NA 86.7% 87.7% 87.5%
Q35. Getting information/help from customer service 66 83.3% NA NA 78.9% 80.9% 80.5%
Q36. Treated with courtesy and respect by customer service staff 65 93.8% NA NA 94.5% 94.5% 94.4%
Claims Processing 90 92.7% NA NA 87.9% 88.0% 87.8%
Q40. Claims handled quickly 88 89.8% NA NA 86.0% 86.3% 86.1%
Q41. Claims handled correctly 90 95.6% NA NA 89.9% 89.7% 89.5%
Shared Decision Making 92 84.1% NA 82.5% 81.8% 82.0%
Q10.Doctor/health provider talked about reasons you might want to take a medicine
92 92.4% NA 94.1% 94.4% 94.6%
Q11.Doctor/health provider talked about reasons you might not want to take a medicine
92 78.3% NA 74.9% 74.0% 74.1%
Q12.Doctor/health provider asked you what you thought was best when talking about starting or stopping a prescription medicine
92 81.5% NA NA 78.4% 77.2% 77.4%
Plan Information on Costs 68 64.6% NA NA 57.8% 60.7% 60.7%
Q31.Able to find out from health plan cost of health care service or equipment
68 63.2% NA NA 57.5% 58.9% 58.7%
Q33. Able to find out from health plan cost of prescription medicines 47 66.0% NA NA 58.2% 62.4% 62.8%
163 82.2% NA NA 74.4% 74.3% 74.6%
105 84.8% NA NA 80.3% 80.8% 81.3%
124 71.0% NA NA 62.7% 65.9% 65.6%
175 94.3% NA NA 95.4% 95.1% 95.2%
Rating of Health Care (Q13) 163 78.5% NA NA 76.8% 76.7% 76.5%
Rating of Personal Doctor (Q23) 162 88.9% NA NA 84.1% 84.6% 84.4%
Rating of Specialist (Q27) 114 84.2% NA NA 83.5% 83.2% 83.3%
Rating of Health Plan (Q42) 176 68.2% NA NA 60.8% 60.1% 59.5%
Rating of Health Care (Q13) 163 52.8% NA NA 49.8% 49.0% 48.7%
Rating of Personal Doctor (Q23) 162 70.4% NA NA 65.6% 65.9% 65.5%
Rating of Specialist (Q27) 114 63.2% NA NA 65.5% 65.1% 64.9%
Rating of Health Plan (Q42) 176 43.8% NA NA 36.3% 35.1% 34.7%
Flu Vaccinations (Adults 18-64) 161 79.5% NA NA 46.3% Not Available 46.6%
Advising Smokers and Tobacco Users to Quit 4 50.0% NA NA 71.3% 72.1% 72.2%
Discussing Cessation Medications 4 75.0% NA NA 44.9% 44.4% 44.8%
Discussing Cessation Strategies 4 25.0% NA NA 39.5% 39.3% 39.2%
Aspirin Use 23 43.5% NA NA 38.0% 40.6%
Discussing Aspirin Risks and Benefits 79 41.8% NA NA 44.7% Not Available
2016 SPH Analytics Book
of Business (PPO)**
2016 Public Report (PPO)**
Summary of Trend and Benchmark Comparisons
UMP UW MEDICINE ACCOUNTABLE CARE NETWORK
Providing Needed Information (Q29)
Valid n and Summary Rate*
Summary Rate*
Summary Rate*
2016
Coordination of Care (Q22)
Health Promotion and Education (Q8)
Composites, Attributes, and Key Questions
NA
Ease of Filling Out Forms (Q38)
Rating Items (Summary Rate = 8 + 9 + 10)
Rating Items (Summary Rate = 9 + 10)
Effectiveness of Care Measures
* Summary Rates are defined by NCQA in its HEDIS 2016 CAHPS® 5.0H guidelines and generally represent the most favorable response percentages. The Summary Rates for Plan Information on Costs, Q31, Q33, and Effectiveness of Care Measures (with the exception of the Flu Vaccinations (Adults 18-64) measure) are calculated on a two-year rolling average due to anticipated small denominators. Please see the Question Summaries for more information about the calculation of rolling averages.
** The 2016 SPH Analytics Book of Business consists of 29 commercial adult, PPO samples that conducted surveys with SPH Analytics in 2016 and submitted data to NCQA. The 2016 Public Report benchmark is derived from NCQA's Quality Compass® benchmark and is calculated by SPH Analytics. The Public Report benchmark is the mean of 152 PPO, plan-specific samples that submitted to NCQA in 2016. The 2016 Quality Compass® All Plans benchmark is the mean summary rate from the PPO commercial adult plans that submitted to NCQA in 2016 (211 plan-specific samples).
Note: Significance Testing - Cells highlighted in red denote the current year score is significantly lower when compared to trend and/or benchmark data; Cells highlighted in green denote the current year score is significantly higher when compared to trend and/or benchmark data; No shading denotes that there was no significant difference between the scores or that there was insufficient sample size to conduct the statistical test. All significance testing is performed at the 95% significance level.
Not Available
2016 Quality Compass® All
Plans (PPO)**
SPH Analytics Commercial Adult Survey—2016 3A

Benchmark Comparisons UMP UW MEDICINE ACCOUNTABLE CARE NETWORK2016 SPH Analytics Book of Business (PPO) Mean and Percentiles Commercial Adult CAHPS® Simulation
176 Total Respondents
Mean 25th 50th 75th 90th
Getting Needed Care 85.8% <10th 88.0% 87.1% 87.9% 89.3% 90.4%
Q14. Ease of getting care, tests, or treatment needed 92.6% 80th 90.5% 89.0% 90.8% 92.5% 93.2%
Q25. Obtained appointment with specialist as soon as needed 78.9% <10th 85.6% 84.0% 85.2% 87.6% 89.5%
Getting Care Quickly 84.4% 17th 86.2% 84.7% 86.0% 87.9% 89.2%
Q4. Obtained needed care right away 88.9% 47th 88.8% 87.0% 89.2% 91.4% 92.5%
Q6. Obtained appointment for care as soon as needed 79.9% 18th 83.5% 80.8% 84.2% 85.5% 87.2%
How Well Doctors Communicate 94.6% 35th 95.6% 94.3% 96.3% 96.8% 97.4%
Q17. Doctors explained things in an understandable way 96.0% 29th 96.7% 95.3% 97.3% 97.7% 98.6%
Q18. Doctors listened carefully to you 94.0% 21st 95.5% 94.1% 95.8% 97.2% 97.5%
Q19. Doctors showed respect for what you had to say 96.6% 40th 96.5% 95.3% 96.9% 97.6% 98.0%
Q20. Doctors spent enough time with you 91.9% 23rd 93.9% 92.0% 94.3% 95.6% 96.4%
Customer Service 88.6% 60th 86.7% 84.6% 86.6% 89.6% 91.4%
Q35. Getting information/help from customer service 83.3% 75th 78.9% 76.5% 79.5% 83.3% 86.0%
Q36. Treated with courtesy and respect by customer service staff
93.8% 50th 94.5% 92.5% 93.7% 97.0% 97.9%
Claims Processing 92.7% 89th 87.9% 85.4% 88.2% 91.0% 92.8%
Q40. Claims handled quickly 89.8% 83rd 86.0% 82.7% 86.7% 88.9% 90.9%
Q41. Claims handled correctly 95.6% 99th 89.9% 86.6% 90.3% 92.7% 94.6%
Shared Decision Making 84.1% 72nd 82.5% 80.5% 82.9% 84.5% 86.1%
Q10.Doctor/health provider talked about reasons you might want to take a medicine
92.4% 30th 94.1% 92.0% 94.0% 96.6% 97.1%
Q11.Doctor/health provider talked about reasons you might not want to take a medicine
78.3% 72nd 74.9% 71.4% 76.1% 78.6% 81.1%
Q12.Doctor/health provider asked you what you thought was best when talking about starting or stopping a prescription medicine
81.5% 82nd 78.4% 76.2% 77.3% 80.4% 83.8%
Plan Information on Costs 64.6% 88th 57.8% 53.2% 57.4% 61.8% 65.8%
Q31.Able to find out from health plan cost of health care service or equipment
63.2% 83rd 57.5% 54.1% 57.4% 61.7% 67.8%
Q33.Able to find out from health plan cost of prescription medicines
66.0% 73rd 58.2% 51.1% 57.5% 66.7% 68.2%
82.2% 99th 74.4% 72.1% 74.8% 77.0% 78.3%
84.8% 90th 80.3% 78.3% 81.0% 82.6% 84.5%
71.0% 94th 62.7% 57.0% 63.4% 66.4% 69.5%
94.3% 21st 95.4% 94.7% 95.2% 96.5% 97.2%
Rating of Health Care (Q13) 78.5% 66th 76.8% 74.4% 76.5% 79.9% 81.9%
Rating of Personal Doctor (Q23) 88.9% 95th 84.1% 81.1% 84.7% 86.7% 87.9%
Rating of Specialist (Q27) 84.2% 60th 83.5% 81.8% 83.2% 86.1% 87.4%
Rating of Health Plan (Q42) 68.2% 80th 60.8% 54.7% 61.3% 65.8% 71.5%
Rating of Health Care (Q13) 52.8% 64th 49.8% 46.5% 48.7% 53.2% 58.0%
Rating of Personal Doctor (Q23) 70.4% 87th 65.6% 62.7% 65.4% 68.3% 71.3%
Rating of Specialist (Q27) 63.2% 26th 65.5% 63.0% 65.7% 68.0% 70.9%
Rating of Health Plan (Q42) 43.8% 74th 36.3% 29.3% 34.7% 43.8% 48.1%
Flu Vaccinations (Adults 18-64) 79.5% 99th 46.3% 41.2% 44.5% 52.2% 55.6%
50.0% <10th 71.3% 64.7% 72.4% 77.3% 84.9%
Discussing Cessation Medications 75.0% 99th 44.9% 40.8% 45.0% 52.4% 55.1%
Discussing Cessation Strategies 25.0% <10th 39.5% 30.3% 37.1% 49.1% 53.7%
Aspirin Use 43.5% 80th 38.0% 30.9% 37.7% 42.2% 50.0%
Discussing Aspirin Risks and Benefits 41.8% 31st 44.7% 41.6% 45.5% 47.9% 51.1%
Summary Rate at or above the 90th percentile.
Summary Rate at or above the 75th percentile, but below the 90th percentile.
Summary Rate at or above the 50th percentile, but below the 75th percentile.
Summary Rate at or above the 25th percentile, but below the 50th percentile.
Summary Rate below the 25th percentile.
Composites, Attributes, and Key QuestionsYour Plan
Summary Rate*
2016 SPH Analytics (PPO) Book of Business Mean & Percentiles***Your Plan's
Ranking**
*** The 2016 SPH Analytics Book of Business consists of 29 commercial adult, PPO samples that conducted surveys with SPH Analytics in 2016 and submitted data to NCQA.
Health Promotion and Education (Q8)
Coordination of Care (Q22)
Advising Smokers and Tobacco Users to Quit
Providing Needed Information (Q29)
Ease of Filling Out Forms (Q38)
** Ranking indicates where your plan's Summary Rate ranks when compared to all other commercial adult PPO plans that submitted data to NCQA through SPH Analytics in 2016. Summary Rates that are below the 10th percentile are shown as '<10th.'
* Summary Rates are defined by NCQA in its HEDIS 2016 CAHPS® 5.0H guidelines and generally represent the most favorable response percentages. The Summary Rates for Plan Information on Costs, Q31, Q33, and Effectiveness of Care Measures (with the exception of the Flu Vaccinations (Adults 18-64) measure) are calculated on a two-year rolling average due to anticipated small denominators. Please see the Question Summaries for more information about the calculation of rolling averages.
Effectiveness of Care Measures
Rating Items (Summary Rate = 9 + 10)
Rating Items (Summary Rate = 8 + 9 + 10)
SPH Analytics Commercial Adult Survey—2016 3B

Benchmark Comparisons UMP UW MEDICINE ACCOUNTABLE CARE NETWORK2016 Public Report (PPO) Mean and Percentiles Commercial Adult CAHPS® Simulation
176 Total Respondents
Mean 25th 50th 75th 90th
Getting Needed Care 85.8% 22nd 87.5% 86.3% 88.0% 89.2% 90.5%
Q14. Ease of getting care, tests, or treatment needed 92.6% 77th 90.3% 89.0% 90.7% 92.4% 93.5%
Q25. Obtained appointment with specialist as soon as needed 78.9% <10th 84.9% 82.9% 85.0% 87.1% 88.4%
Getting Care Quickly 84.4% 30th 85.7% 84.1% 86.0% 87.7% 88.9%
Q4. Obtained needed care right away 88.9% 51st 88.3% 86.2% 88.6% 90.8% 92.3%
Q6. Obtained appointment for care as soon as needed 79.9% 19th 82.9% 80.6% 83.4% 85.2% 87.2%
How Well Doctors Communicate 94.6% 25th 95.5% 94.6% 95.7% 96.6% 97.3%
Q17. Doctors explained things in an understandable way 96.0% 25th 96.8% 96.0% 96.8% 98.0% 98.5%
Q18. Doctors listened carefully to you 94.0% 19th 95.4% 94.1% 95.6% 96.8% 97.6%
Q19. Doctors showed respect for what you had to say 96.6% 50th 96.4% 95.2% 96.6% 97.6% 98.2%
Q20. Doctors spent enough time with you 91.9% 19th 93.5% 92.2% 93.5% 95.0% 95.9%
Customer Service 88.6% 54th 87.7% 85.8% 88.4% 90.2% 92.1%
Q35. Getting information/help from customer service 83.3% 64th 80.9% 78.7% 80.7% 84.6% 86.3%
Q36. Treated with courtesy and respect by customer service staff
93.8% 40th 94.5% 92.6% 95.2% 96.2% 97.3%
Claims Processing 92.7% 89th 88.0% 86.0% 88.2% 90.6% 92.7%
Q40. Claims handled quickly 89.8% 78th 86.3% 83.7% 86.5% 89.2% 91.5%
Q41. Claims handled correctly 95.6% 94th 89.7% 87.2% 89.8% 92.5% 95.0%
Shared Decision Making 84.1% 78th 81.8% 80.0% 81.9% 83.8% 85.8%
Q10.Doctor/health provider talked about reasons you might want to take a medicine
92.4% 17th 94.4% 93.1% 94.4% 95.7% 97.0%
Q11.Doctor/health provider talked about reasons you might not want to take a medicine
78.3% 82nd 74.0% 70.2% 74.3% 77.5% 79.9%
Q12.Doctor/health provider asked you what you thought was best when talking about starting or stopping a prescription medicine
81.5% 82nd 77.2% 74.2% 77.0% 79.7% 83.5%
Plan Information on Costs 64.6% 80th 60.7% 57.9% 60.7% 63.6% 66.0%
Q31.Able to find out from health plan cost of health care service or equipment
63.2% 77th 58.9% 55.6% 58.7% 62.8% 65.8%
Q33.Able to find out from health plan cost of prescription medicines
66.0% 74th 62.4% 58.7% 62.9% 66.0% 69.0%
82.2% 99th 74.3% 71.8% 74.8% 77.1% 79.1%
84.8% 79th 80.8% 78.0% 81.3% 84.1% 86.1%
71.0% 77th 65.9% 61.4% 66.4% 70.7% 73.6%
94.3% 21st 95.1% 94.5% 95.2% 96.1% 96.9%
Rating of Health Care (Q13) 78.5% 65th 76.7% 74.5% 76.9% 79.1% 81.3%
Rating of Personal Doctor (Q23) 88.9% 95th 84.6% 82.2% 85.0% 86.7% 88.2%
Rating of Specialist (Q27) 84.2% 60th 83.2% 81.4% 83.5% 85.7% 87.6%
Rating of Health Plan (Q42) 68.2% 83rd 60.1% 55.0% 60.4% 65.3% 71.2%
Rating of Health Care (Q13) 52.8% 77th 49.0% 45.8% 48.7% 52.6% 55.0%
Rating of Personal Doctor (Q23) 70.4% 88th 65.9% 63.3% 65.8% 69.0% 70.8%
Rating of Specialist (Q27) 63.2% 29th 65.1% 62.3% 65.3% 68.2% 70.9%
Rating of Health Plan (Q42) 43.8% 84th 35.1% 29.9% 34.8% 40.8% 45.4%
Flu Vaccinations (Adults 18-64) 79.5% NA
50.0% <10th 72.1% 66.7% 73.0% 79.3% 83.9%
Discussing Cessation Medications 75.0% 99th 44.4% 37.8% 43.8% 52.0% 58.8%
Discussing Cessation Strategies 25.0% <10th 39.3% 31.3% 40.0% 46.6% 51.0%
Aspirin Use 43.5%
Discussing Aspirin Risks and Benefits 41.8%
Summary Rate at or above the 90th percentile.
Summary Rate at or above the 75th percentile, but below the 90th percentile.
Summary Rate at or above the 50th percentile, but below the 75th percentile.
Summary Rate at or above the 25th percentile, but below the 50th percentile.
Summary Rate below the 25th percentile.
Composites, Attributes, and Key QuestionsYour Plan
Summary Rate*
2016 Public Report (PPO) Mean & Percentiles***Your Plan's
Ranking**
Health Promotion and Education (Q8)
** Ranking indicates where your plan's Summary Rate ranks when compared to all other commercial adult PPO plans that publicly reported their Summary Rates as is shown in the 2016 Public Report benchmark. Summary Rates that are below the 10th percentile are shown as '<10th.'
* Summary Rates are defined by NCQA in its HEDIS 2016 CAHPS® 5.0H guidelines and generally represent the most favorable response percentages. The Summary Rates for Plan Information on Costs, Q31, Q33, and Effectiveness of Care Measures (with the exception of the Flu Vaccinations (Adults 18-64) measure) are calculated on a two-year rolling average due to anticipated small denominators. Please see the Question Summaries for more information about the calculation of rolling averages.
*** The 2016 Public Report benchmark is derived from NCQA's Quality Compass® benchmark and is calculated by SPH Analytics. The Public Report benchmark is the mean of 152 PPO, plan-specific samples that submitted to NCQA in 2016.
Coordination of Care (Q22)
Advising Smokers and Tobacco Users to Quit
Providing Needed Information (Q29)
Ease of Filling Out Forms (Q38)
Effectiveness of Care Measures
Rating Items (Summary Rate = 9 + 10)
Rating Items (Summary Rate = 8 + 9 + 10)
Not Available
NA Not Available
SPH Analytics Commercial Adult Survey—2016 3C

Benchmark Comparisons UMP UW MEDICINE ACCOUNTABLE CARE NETWORK2016 Quality Compass® All Plans (PPO) Mean and Percentiles Commercial Adult CAHPS® Simulation 176 Total Respondents
Mean 25th 50th 75th 90th
Getting Needed Care 85.8% 18th 87.9% 86.4% 88.2% 89.6% 91.0%
Q14. Ease of getting care, tests, or treatment needed 92.6% 76th 90.6% 89.0% 90.9% 92.5% 93.6%
Q25. Obtained appointment with specialist as soon as needed 78.9% <10th 85.2% 83.1% 85.4% 87.4% 89.5%
Getting Care Quickly 84.4% 27th 85.8% 84.1% 86.2% 87.8% 89.2%
Q4. Obtained needed care right away 88.9% 47th 88.5% 86.2% 89.1% 91.0% 92.4%
Q6. Obtained appointment for care as soon as needed 79.9% 18th 83.1% 80.7% 83.5% 85.2% 87.1%
How Well Doctors Communicate 94.6% 27th 95.6% 94.5% 95.8% 96.6% 97.3%
Q17. Doctors explained things in an understandable way 96.0% 26th 96.8% 95.9% 96.9% 98.0% 98.5%
Q18. Doctors listened carefully to you 94.0% 19th 95.4% 94.1% 95.6% 96.8% 97.8%
Q19. Doctors showed respect for what you had to say 96.6% 49th 96.5% 95.4% 96.7% 97.6% 98.3%
Q20. Doctors spent enough time with you 91.9% 22nd 93.5% 92.1% 93.5% 95.0% 95.9%
Customer Service 88.6% 60th 87.5% 85.6% 87.6% 90.0% 92.3%
Q35. Getting information/help from customer service 83.3% 68th 80.5% 78.2% 79.7% 84.6% 87.4%
Q36. Treated with courtesy and respect by customer service staff
93.8% 39th 94.4% 92.6% 95.0% 96.1% 97.3%
Claims Processing 92.7% 91st 87.8% 85.6% 88.1% 90.4% 92.5%
Q40. Claims handled quickly 89.8% 81st 86.1% 83.7% 86.4% 88.9% 91.2%
Q41. Claims handled correctly 95.6% 95th 89.5% 87.1% 89.8% 92.1% 94.6%
Shared Decision Making 84.1% 75th 82.0% 80.1% 82.2% 84.0% 86.0%
Q10.Doctor/health provider talked about reasons you might want to take a medicine
92.4% 13th 94.6% 93.3% 94.6% 96.0% 97.2%
Q11.Doctor/health provider talked about reasons you might not want to take a medicine
78.3% 80th 74.1% 70.3% 74.3% 77.7% 80.4%
Q12.Doctor/health provider asked you what you thought was best when talking about starting or stopping a prescription medicine
81.5% 82nd 77.4% 74.7% 77.2% 79.8% 83.5%
Plan Information on Costs 64.6% 79th 60.7% 58.0% 60.9% 63.9% 66.8%
Q31.Able to find out from health plan cost of health care service or equipment
63.2% 77th 58.7% 55.2% 58.7% 62.8% 66.2%
Q33.Able to find out from health plan cost of prescription medicines
66.0% 68th 62.8% 58.6% 63.1% 66.9% 70.1%
82.2% 98th 74.6% 72.1% 74.8% 77.3% 79.9%
84.8% 77th 81.3% 78.3% 81.6% 84.4% 86.4%
71.0% 80th 65.6% 61.3% 66.0% 69.4% 73.3%
94.3% 20th 95.2% 94.5% 95.3% 96.2% 96.9%
Rating of Health Care (Q13) 78.5% 69th 76.5% 74.4% 76.8% 78.9% 81.2%
Rating of Personal Doctor (Q23) 88.9% 94th 84.4% 82.1% 84.8% 86.6% 88.2%
Rating of Specialist (Q27) 84.2% 61st 83.3% 81.1% 83.3% 85.6% 87.9%
Rating of Health Plan (Q42) 68.2% 85th 59.5% 54.9% 59.8% 65.0% 70.3%
Rating of Health Care (Q13) 52.8% 80th 48.7% 45.1% 48.5% 52.4% 54.8%
Rating of Personal Doctor (Q23) 70.4% 89th 65.5% 62.1% 65.3% 68.8% 70.7%
Rating of Specialist (Q27) 63.2% 33rd 64.9% 61.9% 65.1% 68.1% 71.0%
Rating of Health Plan (Q42) 43.8% 86th 34.7% 30.0% 34.6% 40.1% 45.1%
Flu Vaccinations (Adults 18-64) 79.5% 99th 46.6% 42.3% 46.9% 51.1% 55.5%
50.0% <10th 72.2% 67.2% 72.3% 76.8% 81.2%
Discussing Cessation Medications 75.0% 99th 44.8% 41.7% 44.0% 48.1% 51.4%
Discussing Cessation Strategies 25.0% <10th 39.2% 35.0% 39.6% 42.6% 50.0%
Aspirin Use 43.5% 63rd 40.6% 36.7% 40.3% 45.3% 47.5%
Discussing Aspirin Risks and Benefits 41.8% NA
Summary Rate at or above the 90th percentile.
Summary Rate at or above the 75th percentile, but below the 90th percentile.
Summary Rate at or above the 50th percentile, but below the 75th percentile.
Summary Rate at or above the 25th percentile, but below the 50th percentile.
Summary Rate below the 25th percentile.
Your Plan's Ranking**
2016 Quality Compass® All Plans (PPO) Mean & Percentiles***
Health Promotion and Education (Q8)
Coordination of Care (Q22)
Composites, Attributes, and Key QuestionsYour Plan
Summary Rate*
*** The 2016 Quality Compass® All Plans benchmark is the mean summary rate from the PPO commercial adult plans that submitted to NCQA in 2016 (211 plan-specific samples).
Advising Smokers and Tobacco Users to Quit
Providing Needed Information (Q29)
Ease of Filling Out Forms (Q38)
** Your plan's approximate percentile rankings in relation to the Quality Compass® All Plans benchmark were calculated by SPH Analytics using information derived from the 2016 NCQA 1-100 Benchmark (comprised of 211 plan-specific PPO samples). Rankings indicate where your plan’s Summary Rates fall relative to the NCQA 1-100 Benchmark. Summary Rates that are below the 10th percentile are shown as '<10th.'
* Summary Rates are defined by NCQA in its HEDIS 2016 CAHPS® 5.0H guidelines and generally represent the most favorable response percentages.
Effectiveness of Care Measures
Rating Items (Summary Rate = 9 + 10)
Rating Items (Summary Rate = 8 + 9 + 10)
Not Available
SPH Analytics Commercial Adult Survey—2016 3D

2016 Final Report for UMP UW MEDICINE ACCOUNTABLE CARE NETWORK Consumer Assessment of Healthcare Providers and Systems (CAHPS®) Survey
SPH Analytics Commercial Adult Survey – 2016 4-1
4. Global Proportions and Accreditation Pages 4A – 4C show a graphical presentation of the percentage of members who answered each response choice, organized by composite category, attributes contained within each composite, additional single question measures, and each of the four global rating questions. Summary Rates alone are not a complete indication of performance as they only address the most favorable responses. Global Proportions are a useful tool for understanding how dissatisfied, or even neutral, respondents are when they rate a particular question or composite area. Beside each chart is the equivalent Three-Point Score calculation. Example: Summary Rate – 75% (Always and Usually) By focusing on all the response categories of a question, a high Summary Rate becomes less telling as: (1) a relatively large percentage of members are found to be very satisfied (“Always”) or (2) a large proportion of the Summary Rate responses are “Usually” responses, rather than the more favorable response of “Always.” As an example, the first case would show a higher average rating than the second, even though the Summary Rates are equal.
Summary Rate Always Usually Sometimes/Never
Case 1. 65% 10% 25% Case 2. 15% 60% 25%
Global Proportions are the basis of Three-Point Scores. In Three-Point scoring, a value of 1, 2, or 3 is assigned to each question response category and then a numeric average is computed based upon the valid responses for each question. The Three-Point values are assigned to response option categories as follows:
Scale 1 Score Value
Scale 2
Score Value
Scale 3
Score Value
Never 1 No 1 0 – 6 1
Sometimes 1 Yes 3 7 & 8 2
Usually 2 9 & 10 3
Always 3

2016 Final Report for UMP UW MEDICINE ACCOUNTABLE CARE NETWORK Consumer Assessment of Healthcare Providers and Systems (CAHPS®) Survey
SPH Analytics Commercial Adult Survey – 2016 4-2
Pages 4A – 4B display measures used in CAHPS® accreditation. The graphical presentation and Three-Point Score for composites and rating questions are shown on these pages. In addition, the measure’s percentile threshold when compared to the accreditation benchmark and the 90th percentile benchmark is shown. The 90th percentile is the standard for achieving the maximum points possible for a particular CAHPS® accreditation measure. How to interpret the following charts:
Note: In the event that fewer than 100 completes were collected, an NA will be displayed in the “Percentile Threshold” columns. Page 4C displays Global Proportions and Three-Point Score calculations for CAHPS® measures that are not included in accreditation calculations. Three-Point score benchmarks are not available for these measures.
Please refer to the Technical Notes for additional information about global proportions and accreditation.
Charts 4A – 4C
Three-Point Score calculation at composite and question levels
Minimum score necessary to receive full accreditation points for that CAHPS®
measure
Graphical presentation of response distribution
Percentile threshold plan score
meets/exceeds, relative to benchmark

Global Proportions/Three-Point Scores UMP UW MEDICINE ACCOUNTABLE CARE NETWORK
Composite/Attribute Response Distributions of Accreditation Measures Commercial Adult CAHPS® Simulation
176 Total Respondents
3 PT Score*Percentile Threshold
Benchmark 90th Percentile**
3 PT Score*Percentile Threshold
Benchmark 90th Percentile**
3 PT Score*Percentile Threshold
Benchmark 90th Percentile**
** 90th percentile represents the minimum score needed to obtain full accreditation points for this measure.
2.7047
How Well Doctors Communicate
6
Obtained needed care right away4
Doctors listened carefully to you
Doctors explained things in an understandable way
18
17 2.7383
Note 1: If a plan receives an NA (indicating the denominator was less than 100) the points for that measure are redistributed among the remaining required measures. An organization that
has more than four CAHPS® NAs, or which exceed ten NA or NB results between HEDIS and CAHPS® for each product line, are scored based on the standards score only and the accreditation status is capped at Commendable.
20
149Doctors showed respect for what you had to say
Doctors spent enough time with you
19
* Three-Point Score is the sum of three scores: the percent in orange has a score of 1, the percent in light blue has a score of 2, and the percent in blue has a score of 3. The composite Three-Point Score is the average of its attributes' Three-Point Scores.
149 2.6242
Q# Getting Needed Care2.3376
Q# Getting Care Quickly
162Ease of getting care, tests, or treatment needed
2.4012
14
25Obtained appointment with specialist as soon as needed
<25th
114
Valid n
2.4383
2.2368
2.56
Valid n
2.53 <25th
Benchmarks apply to the composite score only.
Note 2: Please note that the CAHPS® How Well Doctors Communicat e measure was retired from 2015 accreditation scoring, however, organizations accredited on the 2014 standards will still be scored using the organization's submitted rate for this measure.Note 3: Percentages may not add to 100% due to rounding.
72
149
Valid n
2.7148
149
149
2.7919
2.7090th
2.5139
2.2886
Benchmarks apply to the composite score only.
Benchmarks apply to the composite score only.
Obtained appointment for care as soon as needed
Q#
14%
7%
21%
38%
41%
34%
48%
51%
45%
Never/Sometimes Usually Always
16%
11%
20%
29%
26%
31%
56%
63%
49%
Never/Sometimes Usually Always
5%
4%
6%
3%
8%
18%
18%
17%
14%
21%
77%
78%
77%
83%
70%
Never/Sometimes Usually Always
SPH Analytics Commercial Adult Survey—2016 4A

Global Proportions/Three-Point Scores UMP UW MEDICINE ACCOUNTABLE CARE NETWORK
Composite/Attribute/Rating Response Distributions of Accreditation Measures Commercial Adult CAHPS® Simulation
176 Total Respondents
3 PT Score*Percentile Threshold
Benchmark 90th Percentile**
3 PT Score*Percentile Threshold
Benchmark 90th Percentile**
** 90th percentile represents the minimum score needed to obtain full accreditation points for this measure.
2.4356
Note 2: Please note that the CAHPS® Coordination of Care measure was introduced into 2016 accreditation scoring. Organizations accredited on the 2014 and 2015 standards will not be scored using the organization's submitted rate for this measure.Note 3: Percentages may not add to 100% due to rounding.
22
Coordination of Care - Doctor seemed informed/up-to-date about the care received from other doctors/health providers
Q# Additional Measure Valid n
105
3 PT Score**
2.3524
Percentile Threshold
Benchmark 90th Percentile**
50th 2.27
Note 1: If a plan receives an NA (indicating the denominator was less than 100) the points for that measure are redistributed among the remaining required measures. An organization
that has more than four CAHPS® NAs, or which exceed ten NA or NB results between HEDIS and CAHPS® for each product line, are scored based on the standards score only and the accreditation status is capped at Commendable.
* Three-Point Score is the sum of three scores: the percent in orange has a score of 1, the percent in light blue has a score of 2, and the percent in blue has a score of 3. The composite Three-Point Score is the average of its attributes' Three-Point Scores.
2.5614 50th
Rating of Health Care
2.61
50th 2.38
27 Rating of Specialist 114 2.64
2.2500Rating of Health Plan
13 2.5050th
66
2.63
3 PT Score*Benchmark 90th
Percentile**
2.5739
Percentile Threshold
Benchmarks apply to the composite score only.
Benchmarks apply to the composite score only.
2.53NA
2.7538
NA
2.3939
2.6222
90th
Claims handled correctly
2.6420
Q# Customer Service Valid n
2.4929
2.363640 Claims handled quickly 88
Valid n
35Getting information/help from customer service
Q# Claims Processing
42 176
90
65
41
23
36Treated with courtesy and respect by customer service staff
Rating of Personal Doctor 162
163
Q# Rating Questions Valid n
11%
17%
6%
20%
27%
12%
69%
56%
82%
Never/Sometimes Usually Always
7%
10%
4%
36%
43%
29%
57%
47%
67%
Never/Sometimes Usually Always
9%
6%
7%
19%
38%
23%
30%
38%
53%
70%
63%
44%
0-6 7-8 9-10
15% 34% 50%
Never/Sometimes Usually Always
SPH Analytics Commercial Adult Survey—2016 4B

Global Proportions/Three-Point Scores UMP UW MEDICINE ACCOUNTABLE CARE NETWORK
Composite/Attribute/Additional Measure Response Distributions of Non-Accreditation Measures Commercial Adult CAHPS® Simulation
176 Total Respondents
Note: Percentages may not add to 100% due to rounding.
10
11
Health Promotion and Education - Doctor/health provider discussed specific things to do to prevent illnesses
Doctor/health provider talked about reasons you might not want to take a medicine
Doctor/health provider talked about reasons you might want to take a medicine
Q#
2.8478
Doctor/health provider asked you what you thought was best when talking about starting or stopping a prescription medicine
92 2.6304
92
3 PT Score**
2.0213
1.8971
* Plan Information on Costs and the questions which comprise it are calculated on a rolling average methodology over a period of two years because of anticipated small denominators. Please see the Question Summaries for more information about the calculation of rolling averages.
47
68
Able to find out from health plan cost of prescription medicines
Valid nShared Decision Making2.6812
Q#
** Three-Point Score is the sum of three scores: the percent in orange has a score of 1, the percent in light blue has a score of 2, and the percent in blue has a score of 3. The composite Three-Point Score is the average of its attributes' Three-Point Scores.
92
8
Additional Measure Valid n
2.5652
2.6442
3 PT Score**
163
12
1.9592
31Able to find out from health plan cost of health care service or equipment
Q# Valid nPlan Information on Costs*
33
3 PT Score**
35%
37%
34%
33%
37%
30%
31%
26%
36%
Never/Sometimes Usually Always
16%
8%
22%
18%
84%
92%
78%
82%
No Yes
18% 82%
No Yes
SPH Analytics Commercial Adult Survey—2016 4C

2016 Final Report for UMP UW MEDICINE ACCOUNTABLE CARE NETWORK Consumer Assessment of Healthcare Providers and Systems (CAHPS®) Survey
SPH Analytics Commercial Adult Survey – 2016 4-3
Accreditation Assessment CAHPS® Measures For accreditation purposes, NCQA converts certain CAHPS® 5.0H results into Three-Point Scores as described in the previous section. The four rating questions (Health Care, Personal Doctor, Specialist, and Health Plan), the Coordination of Care measure, and the following composites are evaluated: Getting Needed Care, Getting Care Quickly, How Well Doctors Communicate,17 Customer Service, and Claims Processing. Results are then compared against NCQA Three-Point percentile thresholds. Thresholds are based on HEDIS®/CAHPS® benchmark data from other commercial adult survey results. NCQA will compare the plan’s CAHPS® 5.0H survey results by product line to a national benchmark (the 90th percentile) and to national thresholds (the 75th, 50th, and 25th percentiles), which are published each year. Points are distributed according to how the plan meets or exceeds the percentile scores. The Rating of Health Plan survey item receives twice as many points as the other measures. An accreditation assessment analysis utilizing your plan’s unadjusted Three-Point Scores is displayed on Page 4D. The section labeled “Approximate Plan Percentile Threshold” represents the approximate threshold your plan achieved, which is based upon your organization’s Three-Point Score when compared to the benchmark (located in the 2016 HEDIS®/CAHPS® Percentiles18 column). The last three columns show the point distribution for each year in the current three-year accreditation cycle (2016 as well as 2014 and 2015, respectively).19 Please refer to the Technical Notes for additional information about accreditation. Chart 4D
17 Please note that the CAHPS® How Well Doctors Communicate measure was retired from 2015 accreditation scoring, however, organizations accredited on the 2014 standard will still be scored using the organization's submitted rate for this measure. Furthermore, the CAHPS® Coordination of Care measure was introduced into 2016 accreditation scoring. Organizations accredited on the 2014 and 2015 standards will not be scored using the organization's submitted rate for this measure. 18 Each year NCQA publishes accreditation benchmarks and thresholds. Benchmarks and thresholds displayed in this report are found in the Accreditation Benchmarks and Thresholds (2016) document, which includes all commercial adult plan data to calculate a single set of benchmarks and thresholds. 19 Please note that the CAHPS® How Well Doctors Communicate measure was retired from 2015 accreditation scoring, however, organizations accredited on the 2014 standard will still be scored using the organization's submitted rate for this measure. Furthermore, the CAHPS® Coordination of Care measure was introduced into 2016 accreditation scoring. Organizations accredited on the 2014 and 2015 standards will not be scored using the organization's submitted rate for this measure.

Accreditation Assessment UMP UW MEDICINE ACCOUNTABLE CARE NETWORK
HEDIS/CAHPS® Three-Point Scores Commercial Adult CAHPS® Simulation
176 Total Respondents
2.39 2.45 2.48 2.53 2.3376 <25th 0.325 0.371 0.325
2.41 2.46 2.51 2.56 2.4012 <25th 0.325 0.371 0.325
2.59 2.64 2.67 2.70 2.7148 90th 1.625
2.44 2.51 2.57 2.63 NA NA - - -
2.35 2.41 2.48 2.53 NA NA - - -
2.27 2.32 2.39 2.43 2.3524 50th 1.105
2.35 2.40 2.45 2.50 2.4356 50th 1.105 1.263 1.105
2.47 2.52 2.57 2.61 2.6420 90th 1.625 1.857 1.625
2.49 2.53 2.58 2.64 2.5614 50th 1.105 1.263 1.105
2.06 2.15 2.26 2.38 2.2500 50th 2.210 2.526 2.210
Approximate Points Earned (13.000 available in 2014, 2015, and 2016) 7.800 7.651 8.320
Note: If a plan receives an NA (indicating the denominator was less than 100) the points for that measure are redistributed among the remaining required measures. An organization that has more than four CAHPS® NAs, or which exceed ten NA or NB results between HEDIS and CAHPS® for each product line, are scored based on the standards score only and the accreditation status is capped at Commendable.
* Benchmark thresholds are accurate as of the date of this report production. The source for the HEDIS/CAHPS® Percentile benchmarks and thresholds is: NCQA>Programs>Accreditation>Policy Updates
and Supporting Documents>Trending and Benchmarks>Learn More>Benchmarks and Thresholds: 2016 Accreditation. Please note that the CAHPS® How Well Doctors Communicate measure was retired
from 2015 accreditation scoring, however, organizations accredited on the 2014 standards will still be scored using the organization's submitted rate for this measure. Furthermore, the CAHPS® Coordination of Care measure was added to 2016 accreditation score. In keeping, organizations accredited using 2016 standards will be scored using the organization's submitted rate for this measure.
Rating of Specialist (Q27)
25th 50th 75th 90th 2015
Rating of Personal Doctor (Q23)
Plan Three-Point Score
Getting Needed Care
Rating of Health Plan (Q42)
Claims Processing
Getting Care Quickly
How Well Doctors Communicate
Rating of Health Care (Q13)
Customer Service
2014
Coordination of Care (Q22)
Approximate Plan Percentile Threshold
Approximate Points Awarded Based on Accreditation Year
2016
2016 HEDIS/CAHPS Percentiles*
Composite/Rating Item
SPH Analytics Commercial Adult Survey—2016 4D
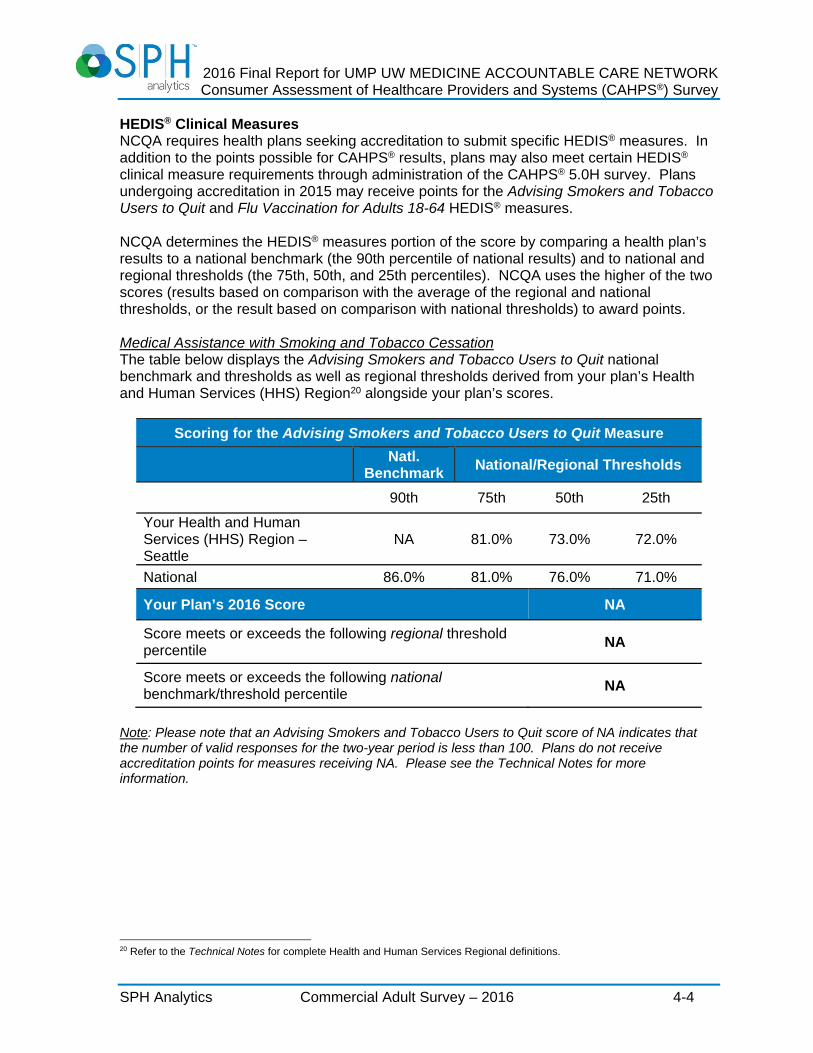
2016 Final Report for UMP UW MEDICINE ACCOUNTABLE CARE NETWORK Consumer Assessment of Healthcare Providers and Systems (CAHPS®) Survey
SPH Analytics Commercial Adult Survey – 2016 4-4
HEDIS® Clinical Measures NCQA requires health plans seeking accreditation to submit specific HEDIS® measures. In addition to the points possible for CAHPS® results, plans may also meet certain HEDIS® clinical measure requirements through administration of the CAHPS® 5.0H survey. Plans undergoing accreditation in 2015 may receive points for the Advising Smokers and Tobacco Users to Quit and Flu Vaccination for Adults 18-64 HEDIS® measures. NCQA determines the HEDIS® measures portion of the score by comparing a health plan’s results to a national benchmark (the 90th percentile of national results) and to national and regional thresholds (the 75th, 50th, and 25th percentiles). NCQA uses the higher of the two scores (results based on comparison with the average of the regional and national thresholds, or the result based on comparison with national thresholds) to award points. Medical Assistance with Smoking and Tobacco Cessation The table below displays the Advising Smokers and Tobacco Users to Quit national benchmark and thresholds as well as regional thresholds derived from your plan’s Health and Human Services (HHS) Region20 alongside your plan’s scores.
Scoring for the Advising Smokers and Tobacco Users to Quit Measure
Natl.
Benchmark National/Regional Thresholds
90th 75th 50th 25th
Your Health and Human Services (HHS) Region – Seattle
NA 81.0% 73.0% 72.0%
National 86.0% 81.0% 76.0% 71.0%
Your Plan’s 2016 Score NA
Score meets or exceeds the following regional threshold percentile
NA
Score meets or exceeds the following national benchmark/threshold percentile
NA
Note: Please note that an Advising Smokers and Tobacco Users to Quit score of NA indicates that the number of valid responses for the two-year period is less than 100. Plans do not receive accreditation points for measures receiving NA. Please see the Technical Notes for more information.
20 Refer to the Technical Notes for complete Health and Human Services Regional definitions.

2016 Final Report for UMP UW MEDICINE ACCOUNTABLE CARE NETWORK Consumer Assessment of Healthcare Providers and Systems (CAHPS®) Survey
SPH Analytics Commercial Adult Survey – 2016 4-5
Flu Vaccination for Adults Ages 18-64 The table below displays the Flu Vaccination for Adults 18-64 national benchmark and thresholds as well as regional thresholds derived from your plan’s Health and Human Services (HHS) Region21 alongside your plan’s scores.
Scoring for the Flu Vaccination for Adults 18-64 Measure
Natl.
Benchmark National/Regional Thresholds
90th 75th 50th 25th
Your Health and Human Services (HHS) Region – Seattle
NA 52.0% 48.0% 41.0%
National 59.0% 54.0% 49.0% 44.0%
Your Plan’s 2016 Score 79.5%
Score meets or exceeds the following regional threshold percentile
75th
Score meets or exceeds the following national threshold percentile
90th
Note: Please note that a Flu Vaccination for Adults 18-64 score of NA indicates that the number of valid responses for the current survey administration period is less than 100. Plans do not receive accreditation points for measures receiving NA. Please see the Technical Notes for more information. Please refer to NCQA’s Standards and Guidelines for the Accreditation of Health Plans (2016) and Accreditation Benchmarks and Thresholds (2016) documents for further details about HEDIS® scoring, benchmarks, and thresholds.
21 Refer to the Technical Notes for complete Health and Human Services Regional definitions.

2016 Final Report for UMP UW MEDICINE ACCOUNTABLE CARE NETWORK Consumer Assessment of Healthcare Providers and Systems (CAHPS®) Survey
SPH Analytics Commercial Adult Survey – 2016 5-1
5. Segmentation Analyses The CAHPS® 5.0H survey asks demographic questions about the respondent. This information allows for a market segmentation of your members. Reviewing the set of measures across the assortment of demographic categories may indicate a health plan’s overall ability to meet the needs of a varied population. Pages 5A – 5H present Summary Rates22 for attributes, ratings, and composite scores organized across the following:
Respondent’s Age (Q59)
Respondent’s Education (Q61)
Respondent’s Ethnicity (Q62)
Respondent’s Race (Q63)
Respondent’s Health Status (Q43)
Respondent’s Mental/Emotional Health Status (Q44)
Number of Doctor/Clinic Visits (Q7)
Data Collection Mode The percentages represent the Summary Rate for each segment of a particular category. For example, in the table below, the Summary Rate for the Rating of Health Plan is the percentage of respondents who rated their health plan an “8,” “9,” or “10.” The interpretation of this example would be, “Of the respondents with a high school education or less, 63% gave their health plan a rating of ‘8,’ ‘9,’ or ‘10.’ And, of the respondents with some college education or more, 58% gave their health plan a rating of ‘8,’ ‘9,’ or ‘10.’”
High School or Less Some College or More
Q42. Rating of Health Plan 63% 58%
Charts 5A – 5H
22 Refer to “Summary Rate” in the Technical Notes for the Summary Rate definition for each composite and attribute.

Segmentation Analysis UMP UW MEDICINE ACCOUNTABLE CARE NETWORK
Plan Summary Rates by Respondent's Age (Q59) Commercial Adult CAHPS® Simulation
176 Total Respondents
Valid n** % Valid n** % Valid n** % Valid n** %
4 Obtained needed care right away 11 100.0% 10 90.0% 16 75.0% 35 91.4% NA
6 Obtained appointment for care as soon as needed 23 82.6% 24 75.0% 28 67.9% 73 84.9% NA
10Doctor/health provider talked about reasons you might want to take a medicine
15 100.0% 12 100.0% 17 82.4% 48 91.7% NA
11Doctor/health provider talked about reasons you might not want to take a medicine
15 86.7% 12 83.3% 17 64.7% 48 79.2% NA
12Doctor/health provider asked you what you thought was best when talking about starting or stopping a prescription medicine
15 86.7% 12 75.0% 17 76.5% 48 83.3% NA
14 Ease of getting care, tests, or treatment needed 24 91.7% 27 96.3% 30 86.7% 80 93.8% NA
17 Doctors explained things in an understandable way 23 91.3% 22 100.0% 25 100.0% 78 94.9% NA
18 Doctors listened carefully to you 23 95.7% 22 95.5% 25 100.0% 78 91.0% NA
19 Doctors showed respect for what you had to say 23 95.7% 22 100.0% 25 100.0% 78 94.9% NA
20 Doctors spent enough time with you 23 82.6% 22 100.0% 25 100.0% 78 89.7% NA
25 Obtained appointment with specialist as soon as needed 16 75.0% 18 88.9% 23 69.6% 57 80.7% NA
31Able to find out from health plan cost of health care service or equipment
14 78.6% 12 66.7% 17 52.9% 25 60.0% NA
33Able to find out from health plan cost of prescription medicines
9 44.4% 6 50.0% 11 54.5% 21 85.7% NA
35 Getting information/help from customer service 13 76.9% 9 66.7% 14 71.4% 30 96.7% NA
36Treated with courtesy and respect by customer service staff
13 92.3% 9 88.9% 14 85.7% 29 100.0% NA
40 Claims handled quickly 15 80.0% 18 94.4% 18 83.3% 36 94.4% NA
41 Claims handled correctly 17 94.1% 16 93.8% 17 88.2% 39 100.0% NA
Q# Composites & Key Questions
Getting Needed Care 83.3% 92.6% 78.1% 87.2% NA
Getting Care Quickly 91.3% 82.5% 71.4% 88.2% NA
How Well Doctors Communicate 91.3% 98.9% 100.0% 92.6% NA
Customer Service 84.6% 77.8% 78.6% 98.3% NA
Claims Processing 87.1% 94.1% 85.8% 97.2% NA
Shared Decision Making 91.1% 86.1% 74.5% 84.7% NA
Plan Information on Costs 61.5% 58.3% 53.7% 72.9% NA
8 Health Promotion and Education 24 87.5% 28 71.4% 31 90.3% 79 81.0% NA
22 Coordination of Care 18 77.8% 15 86.7% 17 100.0% 55 81.8% NA
29 Providing Needed Information 20 70.0% 28 60.7% 23 78.3% 52 73.1% NA
38 Ease of Filling Out Forms 26 96.2% 29 89.7% 34 91.2% 85 96.5% NA
Q# Rating Items (Summary Rate = 8 + 9 + 10)
13 Rating of Health Care 24 66.7% 28 78.6% 31 71.0% 79 84.8% NA
23 Rating of Personal Doctor 23 87.0% 25 84.0% 32 90.6% 81 90.1% NA
27 Rating of Specialist 16 68.8% 18 88.9% 23 78.3% 57 89.5% NA
42 Rating of Health Plan 26 73.1% 29 51.7% 34 67.6% 86 73.3% NA
Q# Rating Items (Summary Rate = 9 + 10)
13 Rating of Health Care 24 33.3% 28 46.4% 31 45.2% 79 64.6% NA
23 Rating of Personal Doctor 23 52.2% 25 60.0% 32 65.6% 81 80.2% NA
27 Rating of Specialist 16 50.0% 18 55.6% 23 43.5% 57 77.2% NA
42 Rating of Health Plan 26 46.2% 29 27.6% 34 35.3% 86 52.3% NA
AttributesQ# Range*
Note: Select Summary Rates are defined by NCQA in its HEDIS 2016 CAHPS® 5.0H guidelines and generally represent the most favorable response percentages. The Summary Rates shown for Plan Information on Costs, Q31, and Q33 represent 2016 data only.
** Valid n refers to total number of respondents answering the item within the subgroup under the column heading.
55 or older18 - 34 35 - 44 45 - 54
* Range is the difference between Summary Rates shown. Due to the small number of respondents aged 18-34, 35-44, or 45-54, range calculations are not included.
SPH Analytics Commercial Adult Survey—2016 5A

Segmentation Analysis UMP UW MEDICINE ACCOUNTABLE CARE NETWORK
Plan Summary Rates by Respondent's Education (Q61) Commercial Adult CAHPS® Simulation
176 Total Respondents
Valid n** % Valid n** %
4 Obtained needed care right away 3 100.0% 68 88.2% NA
6 Obtained appointment for care as soon as needed 6 100.0% 142 78.9% NA
10Doctor/health provider talked about reasons you might want to take a medicine
5 100.0% 87 92.0% NA
11Doctor/health provider talked about reasons you might not want to take a medicine
5 80.0% 87 78.2% NA
12Doctor/health provider asked you what you thought was best when talking about starting or stopping a prescription medicine
5 60.0% 87 82.8% NA
14 Ease of getting care, tests, or treatment needed 7 85.7% 154 92.9% NA
17 Doctors explained things in an understandable way 6 100.0% 142 95.8% NA
18 Doctors listened carefully to you 6 100.0% 142 93.7% NA
19 Doctors showed respect for what you had to say 6 100.0% 142 96.5% NA
20 Doctors spent enough time with you 6 100.0% 142 91.5% NA
25 Obtained appointment with specialist as soon as needed 6 83.3% 107 78.5% NA
31Able to find out from health plan cost of health care service or equipment
1 100.0% 67 62.7% NA
33 Able to find out from health plan cost of prescription medicines 1 100.0% 46 65.2% NA
35 Getting information/help from customer service 2 100.0% 63 82.5% NA
36 Treated with courtesy and respect by customer service staff 2 100.0% 62 93.5% NA
40 Claims handled quickly 2 100.0% 85 90.6% NA
41 Claims handled correctly 1 100.0% 88 96.6% NA
Q# Composites & Key Questions
Getting Needed Care 84.5% 85.7% NA
Getting Care Quickly 100.0% 83.6% NA
How Well Doctors Communicate 100.0% 94.4% NA
Customer Service 100.0% 88.0% NA
Claims Processing 100.0% 93.6% NA
Shared Decision Making 80.0% 84.3% NA
Plan Information on Costs 100.0% 64.0% NA
8 Health Promotion and Education 7 85.7% 155 81.9% NA
22 Coordination of Care 5 100.0% 99 83.8% NA
29 Providing Needed Information 2 100.0% 122 70.5% NA
38 Ease of Filling Out Forms 7 100.0% 167 94.0% NA
Q# Rating Items (Summary Rate = 8 + 9 + 10)
13 Rating of Health Care 7 71.4% 155 78.7% NA
23 Rating of Personal Doctor 7 100.0% 154 88.3% NA
27 Rating of Specialist 6 83.3% 107 84.1% NA
42 Rating of Health Plan 7 71.4% 168 67.9% NA
Q# Rating Items (Summary Rate = 9 + 10)
13 Rating of Health Care 7 42.9% 155 52.9% NA
23 Rating of Personal Doctor 7 85.7% 154 69.5% NA
27 Rating of Specialist 6 83.3% 107 62.6% NA
42 Rating of Health Plan 7 57.1% 168 42.9% NA
Range*
Note: Select Summary Rates are defined by NCQA in its HEDIS 2016 CAHPS® 5.0H guidelines and generally represent the most favorable response percentages. The Summary Rates shown for Plan Information on Costs, Q31, and Q33 represent 2016 data only.
* Range is the difference between Summary Rates shown. Due to the small number of respondents with a "High school graduate or less" education level, range calculations are not included.
High School Graduate or less
Some College or moreQ# Attributes
** Valid n refers to total number of respondents answering the item within the subgroup under the column heading.
SPH Analytics Commercial Adult Survey—2016 5B

Segmentation Analysis UMP UW MEDICINE ACCOUNTABLE CARE NETWORK
Plan Summary Rates by Respondent's Ethnicity (Q62) Commercial Adult CAHPS® Simulation
176 Total Respondents
Valid n** % Valid n** %
4 Obtained needed care right away 5 80.0% 65 89.2% NA
6 Obtained appointment for care as soon as needed 9 88.9% 133 78.9% NA
10Doctor/health provider talked about reasons you might want to take a medicine
6 100.0% 81 91.4% NA
11Doctor/health provider talked about reasons you might not want to take a medicine
6 83.3% 81 79.0% NA
12Doctor/health provider asked you what you thought was best when talking about starting or stopping a prescription medicine
6 83.3% 81 82.7% NA
14 Ease of getting care, tests, or treatment needed 9 100.0% 146 91.8% NA
17 Doctors explained things in an understandable way 8 75.0% 135 97.0% NA
18 Doctors listened carefully to you 8 75.0% 135 94.8% NA
19 Doctors showed respect for what you had to say 8 87.5% 135 97.0% NA
20 Doctors spent enough time with you 8 75.0% 135 93.3% NA
25 Obtained appointment with specialist as soon as needed 5 100.0% 104 78.8% NA
31Able to find out from health plan cost of health care service or equipment
4 0.0% 63 68.3% NA
33 Able to find out from health plan cost of prescription medicines 3 33.3% 42 66.7% NA
35 Getting information/help from customer service 3 100.0% 59 81.4% NA
36 Treated with courtesy and respect by customer service staff 3 100.0% 58 93.1% NA
40 Claims handled quickly 3 66.7% 83 90.4% NA
41 Claims handled correctly 3 66.7% 84 96.4% NA
Q# Composites & Key Questions
Getting Needed Care 100.0% 85.3% NA
Getting Care Quickly 84.4% 84.1% NA
How Well Doctors Communicate 78.1% 95.6% NA
Customer Service 100.0% 87.2% NA
Claims Processing 66.7% 93.4% NA
Shared Decision Making 88.9% 84.4% NA
Plan Information on Costs 16.7% 67.5% NA
8 Health Promotion and Education 8 87.5% 148 82.4% NA
22 Coordination of Care 6 83.3% 95 84.2% NA
29 Providing Needed Information 6 66.7% 115 72.2% NA
38 Ease of Filling Out Forms 8 87.5% 160 95.6% NA
Q# Rating Items (Summary Rate = 8 + 9 + 10)
13 Rating of Health Care 9 77.8% 147 78.2% NA
23 Rating of Personal Doctor 8 75.0% 148 89.2% NA
27 Rating of Specialist 5 100.0% 104 83.7% NA
42 Rating of Health Plan 9 55.6% 160 68.8% NA
Q# Rating Items (Summary Rate = 9 + 10)
13 Rating of Health Care 9 44.4% 147 53.7% NA
23 Rating of Personal Doctor 8 75.0% 148 68.9% NA
27 Rating of Specialist 5 80.0% 104 61.5% NA
42 Rating of Health Plan 9 22.2% 160 45.6% NA
* Range is the difference between Summary Rates shown. Due to the small number of Hispanic/Latino respondents, range calculations are not included.
** Valid n refers to total number of respondents answering the item within the subgroup under the column heading.
Note: Select Summary Rates are defined by NCQA in its HEDIS 2016 CAHPS® 5.0H guidelines and generally represent the most favorable response percentages. The Summary Rates shown for Plan Information on Costs, Q31, and Q33 represent 2016 data only.
Q# AttributesHispanic/Latino Not Hispanic/Latino
Range*
SPH Analytics Commercial Adult Survey—2016 5C

Segmentation Analysis UMP UW MEDICINE ACCOUNTABLE CARE NETWORK
Plan Summary Rates by Respondent's Race (Q63) Commercial Adult CAHPS® Simulation
176 Total Respondents
Valid n*** % Valid n*** % Valid n*** %
4 Obtained needed care right away 59 93.2% 1 0.0% 13 84.6% NA
6 Obtained appointment for care as soon as needed 114 83.3% 6 83.3% 33 75.8% NA
10Doctor/health provider talked about reasons you might want to take a medicine
75 93.3% 5 100.0% 16 87.5% NA
11Doctor/health provider talked about reasons you might not want to take a medicine
75 88.0% 5 40.0% 16 50.0% NA
12Doctor/health provider asked you what you thought was best when talking about starting or stopping a prescription medicine
75 84.0% 5 80.0% 16 68.8% NA
14 Ease of getting care, tests, or treatment needed 126 91.3% 6 83.3% 35 100.0% NA
17 Doctors explained things in an understandable way 117 96.6% 6 100.0% 29 93.1% NA
18 Doctors listened carefully to you 117 93.2% 6 100.0% 29 96.6% NA
19 Doctors showed respect for what you had to say 117 95.7% 6 100.0% 29 100.0% NA
20 Doctors spent enough time with you 117 91.5% 6 100.0% 29 93.1% NA
25 Obtained appointment with specialist as soon as needed 88 80.7% 5 80.0% 23 73.9% NA
31Able to find out from health plan cost of health care service or equipment
55 65.5% 0 0.0% 13 53.8% NA
33 Able to find out from health plan cost of prescription medicines 36 72.2% 2 50.0% 10 40.0% NA
35 Getting information/help from customer service 53 83.0% 2 50.0% 12 75.0% NA
36 Treated with courtesy and respect by customer service staff 52 96.2% 2 100.0% 12 83.3% NA
40 Claims handled quickly 72 91.7% 2 100.0% 15 80.0% NA
41 Claims handled correctly 75 97.3% 0 0.0% 17 88.2% NA
Q# Composites & Key Questions
Getting Needed Care 86.0% 81.7% 87.0% NA
Getting Care Quickly 88.3% 41.7% 80.2% NA
How Well Doctors Communicate 94.2% 100.0% 95.7% NA
Customer Service 89.6% 75.0% 79.2% NA
Claims Processing 94.5% 50.0% 84.1% NA
Shared Decision Making 88.4% 73.3% 68.8% NA
Plan Information on Costs 68.8% 25.0% 46.9% NA
8 Health Promotion and Education 127 80.3% 6 66.7% 35 82.9% NA
22 Coordination of Care 82 82.9% 5 100.0% 20 85.0% NA
29 Providing Needed Information 100 72.0% 4 25.0% 26 61.5% NA
38 Ease of Filling Out Forms 137 94.2% 6 100.0% 38 97.4% NA
Q# Rating Items (Summary Rate = 8 + 9 + 10)
13 Rating of Health Care 128 77.3% 6 66.7% 34 79.4% NA
23 Rating of Personal Doctor 126 87.3% 6 100.0% 33 93.9% NA
27 Rating of Specialist 88 85.2% 5 80.0% 23 82.6% NA
42 Rating of Health Plan 137 66.4% 6 66.7% 39 71.8% NA
Q# Rating Items (Summary Rate = 9 + 10)
13 Rating of Health Care 128 54.7% 6 16.7% 34 44.1% NA
23 Rating of Personal Doctor 126 69.8% 6 50.0% 33 69.7% NA
27 Rating of Specialist 88 68.2% 5 40.0% 23 43.5% NA
42 Rating of Health Plan 137 43.8% 6 50.0% 39 41.0% NA
* "Other" includes Asian, Native Hawaiian or other Pacific Islander, American Indian or Alaska Native, and respondents who answered "Other."
** Range is the difference between Summary Rates shown. Due to the small number of respondents falling into the "Other" race category or indicating their race is Black or African American, range calculations are not included.
Note: Select Summary Rates are defined by NCQA in its HEDIS 2016 CAHPS® 5.0H guidelines and generally represent the most favorable response percentages. The Summary Rates shown for Plan Information on Costs, Q31, and Q33 represent 2016 data only.
Range**Other*White
Black or African-American
*** Valid n refers to total number of respondents answering the item within the subgroup under the column heading.
Q# Attributes
SPH Analytics Commercial Adult Survey—2016 5D

Segmentation Analysis UMP UW MEDICINE ACCOUNTABLE CARE NETWORK
Plan Summary Rates by Respondent's Health Status (Q43) Commercial Adult CAHPS® Simulation
176 Total Respondents
Valid n** % Valid n** % Valid n** %
4 Obtained needed care right away 41 92.7% 23 87.0% 8 75.0% 5.7%
6 Obtained appointment for care as soon as needed 89 82.0% 48 77.1% 12 75.0% 4.9%
10Doctor/health provider talked about reasons you might want to take a medicine
48 91.7% 36 94.4% 8 87.5% 2.8%
11Doctor/health provider talked about reasons you might not want to take a medicine
48 85.4% 36 72.2% 8 62.5% 13.2%
12Doctor/health provider asked you what you thought was best when talking about starting or stopping a prescription medicine
48 83.3% 36 83.3% 8 62.5% 0.0%
14 Ease of getting care, tests, or treatment needed 96 94.8% 53 92.5% 13 76.9% 2.3%
17 Doctors explained things in an understandable way 87 97.7% 49 95.9% 13 84.6% 1.8%
18 Doctors listened carefully to you 87 96.6% 49 91.8% 13 84.6% 4.7%
19 Doctors showed respect for what you had to say 87 98.9% 49 95.9% 13 84.6% 2.9%
20 Doctors spent enough time with you 87 94.3% 49 87.8% 13 92.3% 6.5%
25 Obtained appointment with specialist as soon as needed 66 83.3% 38 76.3% 10 60.0% 7.0%
31Able to find out from health plan cost of health care service or equipment
43 69.8% 20 55.0% 5 40.0% 14.8%
33Able to find out from health plan cost of prescription medicines
23 69.6% 18 55.6% 6 83.3% 14.0%
35 Getting information/help from customer service 43 93.0% 18 66.7% 5 60.0% 26.4%
36 Treated with courtesy and respect by customer service staff 42 100.0% 18 77.8% 5 100.0% 22.2%
40 Claims handled quickly 52 94.2% 32 84.4% 4 75.0% 9.9%
41 Claims handled correctly 58 98.3% 28 92.9% 4 75.0% 5.4%
Q# Composites & Key Questions
Getting Needed Care 89.1% 84.4% 68.5% 4.7%
Getting Care Quickly 87.4% 82.0% 75.0% 5.3%
How Well Doctors Communicate 96.8% 92.9% 86.5% 4.0%
Customer Service 96.5% 72.2% 80.0% 24.3%
Claims Processing 96.3% 88.6% 75.0% 7.6%
Shared Decision Making 86.8% 83.3% 70.8% 3.5%
Plan Information on Costs 69.7% 55.3% 61.7% 14.4%
8 Health Promotion and Education 97 83.5% 53 81.1% 13 76.9% 2.4%
22 Coordination of Care 59 83.1% 36 86.1% 10 90.0% 3.1%
29 Providing Needed Information 80 72.5% 35 68.6% 9 66.7% 3.9%
38 Ease of Filling Out Forms 107 93.5% 54 94.4% 14 100.0% 1.0%
Q# Rating Items (Summary Rate = 8 + 9 + 10)
13 Rating of Health Care 97 83.5% 53 73.6% 13 61.5% 9.9%
23 Rating of Personal Doctor 94 89.4% 55 89.1% 13 84.6% 0.3%
27 Rating of Specialist 66 83.3% 38 92.1% 10 60.0% 8.8%
42 Rating of Health Plan 107 74.8% 55 61.8% 14 42.9% 12.9%
Q# Rating Items (Summary Rate = 9 + 10)
13 Rating of Health Care 97 58.8% 53 41.5% 13 53.8% 17.3%
23 Rating of Personal Doctor 94 75.5% 55 61.8% 13 69.2% 13.7%
27 Rating of Specialist 66 69.7% 38 60.5% 10 30.0% 9.2%
42 Rating of Health Plan 107 50.5% 55 34.5% 14 28.6% 15.9%
** Valid n refers to total number of respondents answering the item within the subgroup under the column heading.
Q# AttributesExcellent/Very
goodGood Fair/Poor
Range*
Note: Select Summary Rates are defined by NCQA in its HEDIS 2016 CAHPS® 5.0H guidelines and generally represent the most favorable response percentages. The Summary Rates shown for Plan Information on Costs, Q31, and Q33 represent 2016 data only.
* Range is the difference between Summary Rates shown. Due to the small number of respondents indicating their health is "Fair" or "Poor," this segment is not included in range calculations.
SPH Analytics Commercial Adult Survey—2016 5E

Segmentation Analysis UMP UW MEDICINE ACCOUNTABLE CARE NETWORK
Plan Summary Rates by Respondent's Mental/Emotional Health Status (Q44) Commercial Adult CAHPS® Simulation
176 Total Respondents
Valid n** % Valid n** % Valid n** %
4 Obtained needed care right away 51 88.2% 15 93.3% 5 80.0% 5.1%
6 Obtained appointment for care as soon as needed 106 80.2% 32 75.0% 10 90.0% 5.2%
10Doctor/health provider talked about reasons you might want to take a medicine
64 90.6% 20 95.0% 7 100.0% 4.4%
11Doctor/health provider talked about reasons you might not want to take a medicine
64 82.8% 20 70.0% 7 57.1% 12.8%
12Doctor/health provider asked you what you thought was best when talking about starting or stopping a prescription medicine
64 81.3% 20 90.0% 7 57.1% 8.8%
14 Ease of getting care, tests, or treatment needed 117 91.5% 34 97.1% 10 90.0% 5.6%
17 Doctors explained things in an understandable way 106 97.2% 31 93.5% 10 90.0% 3.6%
18 Doctors listened carefully to you 106 95.3% 31 96.8% 10 80.0% 1.5%
19 Doctors showed respect for what you had to say 106 97.2% 31 100.0% 10 80.0% 2.8%
20 Doctors spent enough time with you 106 95.3% 31 87.1% 10 80.0% 8.2%
25 Obtained appointment with specialist as soon as needed 81 82.7% 24 70.8% 8 75.0% 11.9%
31Able to find out from health plan cost of health care service or equipment
49 59.2% 16 81.3% 3 33.3% 22.1%
33Able to find out from health plan cost of prescription medicines
29 72.4% 14 57.1% 4 50.0% 15.3%
35 Getting information/help from customer service 52 86.5% 12 83.3% 2 0.0% 3.2%
36 Treated with courtesy and respect by customer service staff 51 96.1% 12 83.3% 2 100.0% 12.7%
40 Claims handled quickly 60 91.7% 24 87.5% 4 75.0% 4.2%
41 Claims handled correctly 65 96.9% 23 95.7% 2 50.0% 1.3%
Q# Composites & Key Questions
Getting Needed Care 87.1% 83.9% 82.5% 3.1%
Getting Care Quickly 84.2% 84.2% 85.0% 0.0%
How Well Doctors Communicate 96.2% 94.4% 82.5% 1.9%
Customer Service 91.3% 83.3% 50.0% 8.0%
Claims Processing 94.3% 91.6% 62.5% 2.7%
Shared Decision Making 84.9% 85.0% 71.4% 0.1%
Plan Information on Costs 65.8% 69.2% 41.7% 3.4%
8 Health Promotion and Education 117 85.5% 34 79.4% 10 60.0% 6.1%
22 Coordination of Care 72 83.3% 23 91.3% 9 77.8% 8.0%
29 Providing Needed Information 95 71.6% 23 69.6% 5 60.0% 2.0%
38 Ease of Filling Out Forms 128 94.5% 35 91.4% 10 100.0% 3.1%
Q# Rating Items (Summary Rate = 8 + 9 + 10)
13 Rating of Health Care 118 79.7% 33 78.8% 10 70.0% 0.9%
23 Rating of Personal Doctor 115 90.4% 35 88.6% 10 80.0% 1.9%
27 Rating of Specialist 81 82.7% 24 91.7% 8 75.0% 9.0%
42 Rating of Health Plan 129 69.0% 35 71.4% 10 50.0% 2.4%
Q# Rating Items (Summary Rate = 9 + 10)
13 Rating of Health Care 118 53.4% 33 57.6% 10 40.0% 4.2%
23 Rating of Personal Doctor 115 73.0% 35 65.7% 10 60.0% 7.3%
27 Rating of Specialist 81 64.2% 24 66.7% 8 37.5% 2.5%
42 Rating of Health Plan 129 45.0% 35 45.7% 10 30.0% 0.8%
Note: Select Summary Rates are defined by NCQA in its HEDIS 2016 CAHPS® 5.0H guidelines and generally represent the most favorable response percentages. The Summary Rates shown for Plan Information on Costs, Q31, and Q33 represent 2016 data only.
* Range is the difference between Summary Rates shown. Due to the small number of respondents indicating their mental/emotional health is "Fair" or "Poor," this segment is not included in range calculations.
** Valid n refers to total number of respondents answering the item within the subgroup under the column heading.
Q# AttributesExcellent/Very
goodGood Fair/Poor
Range*
SPH Analytics Commercial Adult Survey—2016 5F

Segmentation Analysis UMP UW MEDICINE ACCOUNTABLE CARE NETWORK
Plan Summary Rates by Number of Doctor/Clinic Visits (Q7) Commercial Adult CAHPS® Simulation
176 Total Respondents
Valid n** % Valid n** %
4 Obtained needed care right away 21 85.7% 50 90.0% 4.3%
6 Obtained appointment for care as soon as needed 57 84.2% 91 78.0% 6.2%
10Doctor/health provider talked about reasons you might want to take a medicine
28 92.9% 64 92.2% 0.7%
11Doctor/health provider talked about reasons you might not want to take a medicine
28 64.3% 64 84.4% 20.1%
12Doctor/health provider asked you what you thought was best when talking about starting or stopping a prescription medicine
28 71.4% 64 85.9% 14.5%
14 Ease of getting care, tests, or treatment needed 62 98.4% 100 89.0% 9.4%
17 Doctors explained things in an understandable way 59 98.3% 89 95.5% 2.8%
18 Doctors listened carefully to you 59 94.9% 89 94.4% 0.5%
19 Doctors showed respect for what you had to say 59 98.3% 89 96.6% 1.7%
20 Doctors spent enough time with you 59 94.9% 89 89.9% 5.0%
25 Obtained appointment with specialist as soon as needed 30 76.7% 82 79.3% 2.6%
31Able to find out from health plan cost of health care service or equipment
24 66.7% 43 60.5% 6.2%
33 Able to find out from health plan cost of prescription medicines 15 86.7% 30 56.7% 30.0%
35 Getting information/help from customer service 22 86.4% 43 83.7% 2.6%
36 Treated with courtesy and respect by customer service staff 22 95.5% 42 95.2% 0.2%
40 Claims handled quickly 26 92.3% 60 88.3% 4.0%
41 Claims handled correctly 28 96.4% 60 96.7% 0.2%
Q# Composites & Key Questions
Getting Needed Care 87.5% 84.1% 3.4%
Getting Care Quickly 85.0% 84.0% 1.0%
How Well Doctors Communicate 96.6% 94.1% 2.5%
Customer Service 90.9% 89.5% 1.4%
Claims Processing 94.4% 92.5% 1.9%
Shared Decision Making 76.2% 87.5% 11.3%
Plan Information on Costs 76.7% 58.6% 18.1%
8 Health Promotion and Education 64 76.6% 99 85.9% 9.3%
22 Coordination of Care 24 91.7% 81 82.7% 9.0%
29 Providing Needed Information 48 75.0% 75 68.0% 7.0%
38 Ease of Filling Out Forms 74 95.9% 99 92.9% 3.0%
Q# Rating Items (Summary Rate = 8 + 9 + 10)
13 Rating of Health Care 64 76.6% 99 79.8% 3.2%
23 Rating of Personal Doctor 68 89.7% 92 89.1% 0.6%
27 Rating of Specialist 30 83.3% 82 84.1% 0.8%
42 Rating of Health Plan 74 68.9% 100 68.0% 0.9%
Q# Rating Items (Summary Rate = 9 + 10)
13 Rating of Health Care 64 48.4% 99 55.6% 7.1%
23 Rating of Personal Doctor 68 69.1% 92 72.8% 3.7%
27 Rating of Specialist 30 70.0% 82 61.0% 9.0%
42 Rating of Health Plan 74 39.2% 100 48.0% 8.8%
* Range is the difference between Summary Rates shown. The larger the number, the greater the difference in Summary Rates between segment groups for any given question/composite.
** Valid n refers to total number of respondents answering the item within the subgroup under the column heading.
Note: Select Summary Rates are defined by NCQA in its HEDIS 2016 CAHPS® 5.0H guidelines and generally represent the most favorable response percentages. The Summary Rates shown for Plan Information on Costs, Q31, and Q33 represent 2016 data only.
Q# AttributesLess than three visits Three or more visits
Range*
SPH Analytics Commercial Adult Survey—2016 5G

Segmentation Analysis UMP UW MEDICINE ACCOUNTABLE CARE NETWORK
Plan Summary Rates by Data Collection Mode Commercial Adult CAHPS® Simulation
176 Total Respondents
Valid n** % Valid n** %
4 Obtained needed care right away 72 88.9% 0 0.0% NA
6 Obtained appointment for care as soon as needed 149 79.9% 0 0.0% NA
10Doctor/health provider talked about reasons you might want to take a medicine
92 92.4% 0 0.0% NA
11Doctor/health provider talked about reasons you might not want to take a medicine
92 78.3% 0 0.0% NA
12Doctor/health provider asked you what you thought was best when talking about starting or stopping a prescription medicine
92 81.5% 0 0.0% NA
14 Ease of getting care, tests, or treatment needed 162 92.6% 0 0.0% NA
17 Doctors explained things in an understandable way 149 96.0% 0 0.0% NA
18 Doctors listened carefully to you 149 94.0% 0 0.0% NA
19 Doctors showed respect for what you had to say 149 96.6% 0 0.0% NA
20 Doctors spent enough time with you 149 91.9% 0 0.0% NA
25 Obtained appointment with specialist as soon as needed 114 78.9% 0 0.0% NA
31Able to find out from health plan cost of health care service or equipment
68 63.2% 0 0.0% NA
33 Able to find out from health plan cost of prescription medicines 47 66.0% 0 0.0% NA
35 Getting information/help from customer service 66 83.3% 0 0.0% NA
36 Treated with courtesy and respect by customer service staff 65 93.8% 0 0.0% NA
40 Claims handled quickly 88 89.8% 0 0.0% NA
41 Claims handled correctly 90 95.6% 0 0.0% NA
Q# Composites & Key Questions
Getting Needed Care 85.8% 0.0% NA
Getting Care Quickly 84.4% 0.0% NA
How Well Doctors Communicate 94.6% 0.0% NA
Customer Service 88.6% 0.0% NA
Claims Processing 92.7% 0.0% NA
Shared Decision Making 84.1% 0.0% NA
Plan Information on Costs 64.6% 0.0% NA
8 Health Promotion and Education 163 82.2% 0 0.0% NA
22 Coordination of Care 105 84.8% 0 0.0% NA
29 Providing Needed Information 124 71.0% 0 0.0% NA
38 Ease of Filling Out Forms 175 94.3% 0 0.0% NA
Q# Rating Items (Summary Rate = 8 + 9 + 10)
13 Rating of Health Care 163 78.5% 0 0.0% NA
23 Rating of Personal Doctor 162 88.9% 0 0.0% NA
27 Rating of Specialist 114 84.2% 0 0.0% NA
42 Rating of Health Plan 176 68.2% 0 0.0% NA
Q# Rating Items (Summary Rate = 9 + 10)
13 Rating of Health Care 163 52.8% 0 0.0% NA
23 Rating of Personal Doctor 162 70.4% 0 0.0% NA
27 Rating of Specialist 114 63.2% 0 0.0% NA
42 Rating of Health Plan 176 43.8% 0 0.0% NA
Q# AttributesMail Phone
Range*
* Range is the difference between Summary Rates shown. This survey wasn't administered using an Internet data collection methodology. In keeping, the Internet segment is not included in range calculations.
** Valid n refers to total number of respondents answering the item within the subgroup under the column heading.
Note: Select Summary Rates are defined by NCQA in its HEDIS 2016 CAHPS® 5.0H guidelines and generally represent the most favorable response percentages. The Summary Rates shown for Plan Information on Costs, Q31, and Q33 represent 2016 data only.
SPH Analytics Commercial Adult Survey—2016 5H

2016 Final Report for UMP UW MEDICINE ACCOUNTABLE CARE NETWORK Consumer Assessment of Healthcare Providers and Systems (CAHPS®) Survey
SPH Analytics Commercial Adult Survey – 2016 6-1
6. Correlation Analyses Page 6A provides attribute correlations with Rating of Health Plan (Q42), Rating of Health Care (Q13), and Rating of Personal Doctor (Q23). The correlations show the strength of the linear relationship between the individual attribute and the rating question. The correlation value can range from –1 to +1 with values close to +1 indicating a strong positive relationship. For example, a question that is highly correlated with Rating of Health Plan indicates that a low Summary Rate for that question is associated with a low Summary Rate for Rating of Health Plan, and a high Summary Rate for that question is associated with a high Summary Rate for Rating of Health Plan. Attributes considered to be highly correlated with the rating measures are shaded blue (r > 0.400). Comparisons to the 2016 PPO Commercial Adult Quality Compass® All Plans benchmark are also shown with significance testing. Please refer to the Technical Notes for additional information about Correlation Analyses. Chart 6A

Correlation Analysis UMP UW MEDICINE ACCOUNTABLE CARE NETWORK
Attribute Correlations with Key Rating Questions Commercial Adult CAHPS® Simulation
176 Total Respondents
Attributes, Key Questions, and Rating Itemswith Q42 -
Health Planwith Q13 -
Health Care
with Q23 - Personal Doctor
Plan Summary Rate
2016 Quality Compass, All
Plans (PPO)**
Q14. Ease of getting care, tests, or treatment needed 0.563 0.573 0.370 92.6% 90.6%
Q25. Obtained appointment with specialist as soon as needed
0.382 0.473 0.193 78.9% 85.2%
Q4. Obtained needed care right away 0.569 0.653 0.344 88.9% 88.5%
Q6. Obtained appointment for care as soon as needed 0.458 0.535 0.357 79.9% 83.1%
Q17. Doctors explained things in an understandable way 0.238 0.413 0.571 96.0% 96.8%
Q18. Doctors listened carefully to you 0.253 0.401 0.692 94.0% 95.4%
Q19. Doctors showed respect for what you had to say 0.230 0.415 0.740 96.6% 96.5%
Q20. Doctors spent enough time with you 0.228 0.439 0.629 91.9% 93.5%
Q35. Getting information/help from customer service 0.375 0.325 0.314 83.3% 80.5%
Q36. Treated with courtesy and respect by customer service staff
0.179 0.208 0.152 93.8% 94.4%
Q40. Claims handled quickly 0.371 0.249 0.286 89.8% 86.1%
Q41. Claims handled correctly 0.165 0.077 0.100 95.6% 89.5%
Q31. Able to find out from health plan cost of health care service or equipment
0.298 0.332 0.143 63.2% 58.7%
Q33. Able to find out from health plan cost of prescription medicines
0.217 0.279 0.444 66.0% 62.8%
Q22. Coordination of Care 0.274 0.433 0.596 84.8% 81.3%
Q29. Providing Needed Information 0.308 0.294 0.108 71.0% 65.6%
Q38. Ease of Filling Out Forms 0.162 0.115 0.178 94.3% 95.2%
Q13. Rating of Health Care 0.755 NA 0.544 78.5% 76.5%
Q23. Rating of Personal Doctor 0.344 0.544 NA 88.9% 84.4%
Q27. Rating of Specialist 0.355 0.460 0.254 84.2% 83.3%
Q42. Rating of Health Plan NA 0.755 0.344 68.2% 59.5%
Note 2: Summary Rates are defined by NCQA in its HEDIS 2016 CAHPS® 5.0H guidelines and generally represent the most favorable response percentages. The Summary Rates for Plan Information on Costs, Q31, and Q33, are calculated on a two-year rolling average due to anticipated small denominators. Please see the Question Summaries for more information about the calculation of rolling averages.
Note 1: Significance Testing - Cells highlighted in red denote the current year score is significantly lower when compared to benchmark data; Cells highlighted in green denote the current year score is significantly higher when compared to benchmark data; No shading denotes that there was no significant difference between the scores or that there was insufficient sample size to conduct the statistical test. All significance testing is performed at the 95% significance level.
** The 2016 Quality Compass® All Plans benchmark is the mean summary rate from the PPO commercial adult plans that submitted to NCQA in 2016 (211 plan-specific samples).
Correlation Coefficients*
Ge
ttin
g
Ne
ed
ed
C
are
Ge
ttin
g
Ca
re
Qu
ick
ly
Ho
w W
ell
Do
cto
rs
Co
mm
un
ica
teC
us
tom
er
Se
rvic
eC
laim
s
Pro
ce
ss
ing
Pla
n I
nfo
. o
n C
os
ts
Ra
tin
g I
tem
s
(Su
mm
ary
Ra
te =
8 +
9 +
10
)
* As the correlation coefficient approaches a value of 1.000, the association of the attribute with overall satisfaction is increased. Cells shaded dark blue have a correlation coefficient of equal to or greater than r = 0.400.
Ad
dit
ion
al
Me
as
ure
s
SPH Analytics Commercial Adult Survey—2016 6A

2016 Final Report for UMP UW MEDICINE ACCOUNTABLE CARE NETWORK Consumer Assessment of Healthcare Providers and Systems (CAHPS®) Survey
SPH Analytics Commercial Adult Survey – 2016 7-1
7. Priority Matrix SPH Analytics offers a graphical display of relative performance of survey composites and key measures, along with their relative ‘importance’ as it relates to Rating of Health Plan (Q42). The matrix on page 7A is divided into four sections. Composites and key measures are placed on the Priority Matrix according to the interaction between their correlation coefficient and percentile ranking within the 2016 Commercial Adult PPO SPH Analytics Book of Business. Composites and measures with moderate to strong correlations with Rating of Health Plan (Q42) and ranking at or above the 75th percentile are considered plan Strengths and are placed in the top right quadrant. Composites with moderate to strong correlations with Rating of Health Plan (Q42) and ranking below the 75th percentile are considered Top Priorities and are placed in the top left quadrant. Composites and measures to Monitor and Maintain are weakly correlated with Rating of Health Plan (Q42) and rank at or above the 75th percentile and are placed in the bottom right quadrant. Composites that are weakly correlated with Rating of Health Plan (Q42) and rank below the 75th percentile are considered Medium Priorities and are placed in the bottom left quadrant. Chart 7A

Priority Matrix UMP UW MEDICINE ACCOUNTABLE CARE NETWORKComposite and Key Measure Correlations with Rating of Health Plan (Q42) and Percentile Rankings Commercial Adult CAHPS® Simulation
Note 1: The 2016 SPH Analytics Book of Business consists of 29 commercial adult, PPO samples that conducted surveys with SPH Analytics in 2016 and submitted data to NCQA.
Plan Summary Rate < 75th Percentile
Percentile Ranking
Health Care Domain Composites and Key Measure
CC Coordination of Care (Q22)
denoted above with
HWDC How Well Doctors CommunicateGetting Needed Care
Customer Service
denoted above with
Abbreviation Definition
GCQ Getting Care QuicklyGNCCSCP
PIOC
Health Plan Domain Composites
Abbreviation Definition
Mo
der
ate
- S
tro
ng
Rel
atio
nsh
ipW
eak
Rel
atio
nsh
ip
Mo
derate - S
tron
g R
elation
ship
Weak R
elation
ship
Note 2: Ranking indicates where your plan's Summary Rate ranks when compared to all other commercial adult PPO plans that submitted data to NCQA through SPH Analytics in 2016. Summary Rates that are below the 10th percentile are shown as '<10th.'
Plan Summary Rate ≥ 75th Percentile
Plan Summary Rate < 75th Percentile Plan Summary Rate ≥ 75th Percentile
Strengths
Monitor & MaintainMedium Priorities
Top PrioritiesC
orr
elat
ion
wit
h R
atin
g o
f H
ealt
h P
lan
(Q
42)
Claims ProcessingPlan Information on Costs
GNC,<10th Percentile GCQ,
17th Percentile
HWDC,35th Percentile
CS,60th Percentile
CP,89th Percentile
PIOC,88th Percentile
CC,90th Percentile
0.000
0.100
0.200
0.300
0.400
0.500
0.600
0.700
0.800
0.900
1.000
0 5 10 15 20 25 30 35 40 45 50 55 60 65 70 75 80 85 90 95 100
SPH Analytics Commercial Adult Survey—2016 7A

2016 Final Report for UMP UW MEDICINE ACCOUNTABLE CARE NETWORK Consumer Assessment of Healthcare Providers and Systems (CAHPS®) Survey
SPH Analytics Commercial Adult Survey – 2016 8-1
8. Composite Analyses The CAHPS® 5.0H survey is designed to use composite scores to facilitate the aggregation of information and the communication of results. Questions are combined into composite categories comprising a particular service area managed by your plan. Pages 8A – 8J present composite-level analyses for the CAHPS® measures used in accreditation scoring, which include the following:
Getting Needed Care
Getting Care Quickly
How Well Doctors Communicate
Customer Service
Claims Processing
Coordination of Care (Q22)
Rating of Health Care (Q13)
Rating of Personal Doctor (Q23)
Rating of Specialist (Q27)
Rating of Health Plan (Q42) Summary Rate Trend Comparisons This section compares your plan’s current composite and attribute Summary Rates to trend results (if applicable). Significance testing is applied to determine whether an observed difference is too large to have occurred by chance alone. Cells highlighted in red denote the current year score is significantly lower when compared to trend data, cells highlighted in green denote the current year score is significantly higher when compared to trend data, no shading denotes that there was no significant difference between the scores or that there was insufficient sample size to conduct the statistical test. All significance testing is performed at the 95% significance level. Correlation with Rating Questions In this section, attribute correlations are displayed as they relate to the Rating of Health Plan (Q42), Rating of Health Care (Q13), and Rating of Personal Doctor (Q23). Attributes considered to be highly correlated with the rating measures are shaded blue (r > 0.400). Drill Down of Summary Rate Comparisons This section shows a graphical representation of year-to-year comparisons of response options for the composite of interest. Response options are broken down according to three-point score groupings. Benchmark Summary Rate Comparisons This section compares your plan’s current and trend scores (if applicable) to the current and trend scores from the Quality Compass® All Plans and SPH Analytics Book of Business benchmarks. The SPH Analytics Book of Business consists of commercial adult (PPO) samples that conducted surveys with SPH Analytics in 2016 and submitted data to NCQA. The Quality Compass® All Plans benchmark is the mean of plan-specific samples (PPO) that submitted to NCQA in 2016.

2016 Final Report for UMP UW MEDICINE ACCOUNTABLE CARE NETWORK Consumer Assessment of Healthcare Providers and Systems (CAHPS®) Survey
SPH Analytics Commercial Adult Survey – 2016 8-2
Benchmark Percentile Rankings This section displays your health plan’s composite and key question Summary Rates alongside the mean and percentile (25th, 50th, 75th, and 90th) scores generated from the 2016 PPO Commercial Adult Quality Compass® All Plans benchmark. Your plan's approximate percentile rankings in relation to the Quality Compass® All Plans benchmark were calculated by SPH Analytics using information derived from the NCQA 1-100 Benchmark. Your percentile rank indicates where your plan’s Summary Rate falls relative to the NCQA 1-100 Benchmark. Summary Rates that are below the 10th percentile are shown as "<10th." The Summary Rates for attributes at or above the 90th percentile are shaded dark green, while Summary Rates at or above the 75th percentile but below the 90th percentile are shaded light green, and Summary Rates at or above the 50th percentile but below the 75th are shaded beige. Additionally, attributes with Summary Rates at or above the 25th percentile but below the 50th percentile are shaded light orange and Summary Rates below the 25th percentile are shaded dark orange.
Three-Point Score Trend Comparisons and Percentile Thresholds23 This section compares your plan’s current Three-Point Scores to trend Three-Point Scores (if applicable).24 This section also compares your current Three-Point Scores to the NCQA percentile benchmark thresholds. Rankings indicate where your plan's score falls relative to the benchmark percentiles. Scores that are below the 25th percentile threshold are shown as "<25th." The Three-Point Scores for items at or above the 90th percentile are shaded dark green, while Three-Point Scores at or above the 75th percentile but below the 90th percentile are shaded light green, and Three-Point Scores at or above the 50th percentile but below the 75th are shaded beige. Additionally, items with Three-Point Scores at or above the 25th percentile but below the 50th percentile are shaded light orange and Three-Point Scores below the 25th percentile are shaded dark orange.
Benchmark thresholds are accurate as of the date of this report production. The source for the HEDIS®/CAHPS® Percentile benchmarks and thresholds is: NCQA>Programs>Accreditation>Policy Updates and Supporting Documents>Trending and Benchmarks>Learn More>Benchmarks and Thresholds: 2016 Accreditation.
If a plan receives an NA (indicating the denominator was less than 100) the points for that measure are redistributed among the remaining required measures. An organization that has more than four CAHPS® NAs, or that exceeds ten NA or NB results between HEDIS® and CAHPS® for each product line, is scored based on the standards score only. Commendable is the highest status awarded to an organization scored on standards only.
Global Proportions and Three-Point Scores This section shows a graphical presentation of the percentage of members who answered each response choice. Global Proportions are a useful tool for understanding how dissatisfied, or even neutral, respondents are when they rate a particular question or composite area. Beside each chart is the equivalent, Three-Point Score calculation.
23 Please note that the CAHPS® How Well Doctors Communicate measure was retired from 2015 accreditation scoring, however, organizations accredited on the 2014 standard will still be scored using the organization's submitted rate for this measure. Furthermore, the CAHPS® Coordination of Care measure was introduced into 2016 accreditation scoring. Organizations accredited on the 2014 and 2015 standards will not be scored using the organization's submitted rate for this measure. 24 From 2015 forward, NCQA will use unadjusted HEDIS® and CAHPS® results to score organizations at the time of their survey and at annual rescoring.

2016 Final Report for UMP UW MEDICINE ACCOUNTABLE CARE NETWORK Consumer Assessment of Healthcare Providers and Systems (CAHPS®) Survey
SPH Analytics Commercial Adult Survey – 2016 8-3
Three-Point Score Trend Comparisons This section displays your plan’s current Three-Point Scores and compares them to trend scores (if applicable).25 NCQA’s adjustment rates are displayed for ease of interpretation.
Please refer to the individual report sections for additional information regarding the topics displayed on these pages. Charts 8A – 8J
25 From 2015 forward, NCQA will use unadjusted HEDIS® and CAHPS® results to score organizations at the time of their survey and at annual rescoring. In keeping, your plan's 2016 unadjusted and adjusted three-point scores are the same.

HEDIS/CAHPS® Composite Analysis UMP UW MEDICINE ACCOUNTABLE CARE NETWORK
Getting Needed Care Composite Commercial Adult CAHPS® Simulation
Summary Rate Trend Comparisons
85.8% 0 0 NA
Q14. 92.6% NA NA NA
Q25. 78.9% NA NA NA
Correlation with Rating Questionswith Q13 -
Health Carewith Q23 -
Personal Dr.
Q14. 0.573 0.370
Q25. 0.473 0.193
Drill Down of Summary Rate Comparisons Benchmark Summary Rate Comparisons
Benchmark Percentile Rankings
Mean 25th 75th 90th
Getting Needed Care 87.9% 86.4% 89.6% 91.0%
Q14. 90.6% 89.0% 92.5% 93.6%
Q25. 85.2% 83.1% 87.4% 89.5%
Summary Rate at or above the 90th percentile. Summary Rate at or above the 25th percentile, but below the 50th percentile.
Summary Rate at or above the 75th percentile, but below the 90th percentile. Summary Rate below the 25th percentile.
Summary Rate at or above the 50th percentile, but below the 75th percentile.
Three-Point Score Trend Comparisons and Percentile Thresholds
25th 75th 90th
2016 <25th 2.39 2.48 2.53
2015 NA 2.36 2.46 2.50
2014 NA 2.36 2.46 2.49
Three-Point Score at or above the 90th percentile threshold. Three-Point Score at or above the 25th, but below the 50th percentile threshold.
Three-Point Score at or above the 75th, but below the 90th percentile threshold. Three-Point Score below the 25th percentile threshold.
Three-Point Score at or above the 50th, but below the 75th percentile threshold.
Global Proportions and Three-Point Scores Three-Point Score Trend Comparisons
Three-Point Scores are displayed as "NA" if a minimum average of 100 responses was not met for the composite or attribute. Adjustments and benchmarks apply to the composite score only.
2.2368
2.4383
NA
NA
Q25
.Q
14.
2.3376
2.3376
3-Pt Score
NA
NA
Thresholds indicate where your plan's Three-Point Score ranks relative to the benchmark percentiles. Three-Point Scores that are below the 25th percentile threshold are shown as "<25th."
2.41
2.41
2.45
GN
C
Com
p.
2016
2.3376
Plan Adjusted Three-Point Score
85.8%
Your Plan's Summary Rate and Percentile Ranking
76th
18th
Approximate Plan
Percentile Threshold
Getting Needed Care
Getting Needed Care
Ease of getting care, tests, or treatment needed
92.6%
162
162
<10th
Composite
NA
NA
NA
85.4%
90.9%
88.2%
50th
Attributes considered highly correlated with the rating measures (those with coefficients greater than or equal to
r = 0.400) are shaded blue.
20142015
Composite and Attributes2016 Quality Compass, All Plans (PPO) Mean & Percentiles
Obtained appointment with specialist as soon as needed
Ease of getting care, tests, or treatment needed
Getting Needed Care
Composite and Attributes
114Significance testing is identified by shading: Cells highlighted in red denote the current year score is significantly lower when compared to trend data; Cells highlighted in green denote the current year score is significantly higher when compared to trend data; No shading denotes that there was no significant difference between the scores or that there was insufficient sample size to conduct the statistical test. All significance testing is performed at the 95% significance level.
Ease of getting care, tests, or treatment needed
Obtained appointment with specialist as soon as needed
Your Plan's Summary Rates and Significance Testing
0.382
0.563
with Q42 - Health Plan
Plan Unadjusted Three-Point Score
Obtained appointment with specialist as soon as needed
78.9%
Your plan's approximate percentile rankings in relation to the Quality Compass® All Plans benchmark were calculated by SPH Analytics using information derived from the NCQA 1-100 Benchmark. Rankings indicate where your plan’s Summary Rate falls relative to the NCQA 1-100 Benchmark. Summary Rates that are below the 10th percentile are shown as "<10th."
Year
50th
Commercial Adult CAHPS® Percentiles
48.0%
NA NA
37.8%
NA NA
14.2%
NA NA0%
20%
40%
60%
80%
100%
2016 2015 2014
Getting Needed Care
Never/Sometimes Usually Always
2.3376
NA NA
2.3376
NA NA0.00
1.00
2.00
3.00
2016(+0.000 adjustment)
2015(+0.000 adjustment)
2014(+0.010 adjustment)
Getting Needed Care
Plan Unadjusted Three-Point Scores Plan Adjusted Three-Point Scores
21%
7%
14%
34%
41%
38%
45%
51%
48%
0% 20% 40% 60% 80% 100%
Getting Needed Care
Never/Sometimes Usually Always
86%
NA NA
88% 88% 88%88% 88% 89%
0%
20%
40%
60%
80%
100%
2016 2015 2014
Getting Needed Care
Your Plan
PPO Quality Compass, All Plans Benchmark
PPO SPH Analytics Benchmark
SPH Analytics Commercial Adult Survey—2016 8A

HEDIS/CAHPS® Composite Analysis UMP UW MEDICINE ACCOUNTABLE CARE NETWORK
Getting Care Quickly Composite Commercial Adult CAHPS® Simulation
Summary Rate Trend Comparisons
84.4% 0 0 NA
Q4. 88.9% NA NA NA
Q6. 79.9% NA NA NA
Correlation with Rating Questionswith Q13 -
Health Carewith Q23 -
Personal Dr.
Q4. 0.653 0.344
Q6. 0.535 0.357
Drill Down of Summary Rate Comparisons Benchmark Summary Rate Comparisons
Benchmark Percentile Rankings
Mean 25th 75th 90th
Getting Care Quickly 85.8% 84.1% 87.8% 89.2%
Q4. 88.5% 86.2% 91.0% 92.4%
Q6. 83.1% 80.7% 85.2% 87.1%
Summary Rate at or above the 90th percentile. Summary Rate at or above the 25th percentile, but below the 50th percentile.
Summary Rate at or above the 75th percentile, but below the 90th percentile. Summary Rate below the 25th percentile.
Summary Rate at or above the 50th percentile, but below the 75th percentile.
Three-Point Score Trend Comparisons and Percentile Thresholds
25th 75th 90th
2016 <25th 2.41 2.51 2.56
2015 NA 2.41 2.50 2.55
2014 NA 2.41 2.50 2.55
Three-Point Score at or above the 90th percentile threshold. Three-Point Score at or above the 25th, but below the 50th percentile threshold.
Three-Point Score at or above the 75th, but below the 90th percentile threshold. Three-Point Score below the 25th percentile threshold.
Three-Point Score at or above the 50th, but below the 75th percentile threshold.
Global Proportions and Three-Point Scores Three-Point Score Trend Comparisons
Three-Point Scores are displayed as "NA" if a minimum average of 100 responses was not met for the composite or attribute. Adjustments and benchmarks apply to the composite score only.
Getting Care Quickly 149 NA
Composite and AttributesYour Plan's Summary Rates and Significance Testing
2016 2015 2014
Obtained needed care right away 72 NA
Obtained appointment for care as soon as needed 149 NASignificance testing is identified by shading: Cells highlighted in red denote the current year score is significantly lower when compared to trend data; Cells highlighted in green denote the current year score is significantly higher when compared to trend data; No shading denotes that there was no significant difference between the scores or that there was insufficient sample size to conduct the statistical test. All significance testing is performed at the 95% significance level.
Getting Care Quicklywith Q42 -
Health Plan Attributes considered highly correlated with the rating measures (those with coefficients greater than or equal to
r = 0.400) are shaded blue.Obtained needed care right away 0.569
Obtained appointment for care as soon as needed 0.458
Composite and AttributesYour Plan's Summary Rate
and Percentile Ranking
2016 Quality Compass, All Plans (PPO) Mean & Percentiles
50th
84.4% 27th 86.2%
Obtained needed care right away 88.9% 47th 89.1%
Obtained appointment for care as soon as needed
79.9% 18th 83.5%
Your plan's approximate percentile rankings in relation to the Quality Compass® All Plans benchmark were calculated by SPH Analytics using information derived from the NCQA 1-100 Benchmark. Rankings indicate where your plan’s Summary Rate falls relative to the NCQA 1-100 Benchmark. Summary Rates that are below the 10th percentile are shown as "<10th."
Composite YearPlan Unadjusted
Three-Point ScorePlan Adjusted
Three-Point Score
Approximate Plan
Percentile Threshold
Commercial Adult CAHPS® Percentiles
50th
Getting Care Quickly
2.4012 2.4012 2.46
NA NA 2.46
NA NA 2.45
Q6.
2.2886
Thresholds indicate where your plan's Three-Point Score ranks relative to the benchmark percentiles. Three-Point Scores that are below the 25th percentile threshold are shown as "<25th."
3-Pt Score
GC
Q
Com
p.
2.4012
Q4.
NA
55.7%
NA NA
28.6%
NA NA
15.6%
NA NA0%
20%
40%
60%
80%
100%
2016 2015 2014
Getting Care Quickly
Never/Sometimes Usually Always
2.4012
NA NA
2.4012
NA NA0.00
1.00
2.00
3.00
2016(+0.000 adjustment)
2015(+0.000 adjustment)
2014(+0.010 adjustment)
Getting Care Quickly
Plan Unadjusted Three-Point Scores Plan Adjusted Three-Point Scores
20%
11%
16%
31%
26%
29%
49%
63%
56%
0% 20% 40% 60% 80% 100%
Getting Care Quickly
Never/Sometimes Usually Always
84%
NA NA
86% 86% 87%86% 86% 86%
0%
20%
40%
60%
80%
100%
2016 2015 2014
Getting Care Quickly
Your PlanPPO Quality Compass, All Plans BenchmarkPPO SPH Analytics Benchmark
SPH Analytics Commercial Adult Survey—2016 8B

HEDIS/CAHPS® Composite Analysis UMP UW MEDICINE ACCOUNTABLE CARE NETWORK
How Well Doctors Communicate Composite Commercial Adult CAHPS® Simulation
Summary Rate Trend Comparisons
94.6% 0 0 NA
Q17. 96.0% NA NA NA
Q18. 94.0% NA NA NA
Q19. 96.6% NA NA NA
Q20. 91.9% NA NA NA
Correlation with Rating Questionswith Q13 -
Health Carewith Q23 -
Personal Dr.
Q17. 0.413 0.571
Q18. 0.401 0.692
Q19. 0.415 0.740
Q20. 0.439 0.629
Drill Down of Summary Rate Comparisons Benchmark Summary Rate Comparisons
Benchmark Percentile Rankings
Mean 25th 75th 90th
How Well Doctors Communicate 95.6% 94.5% 96.6% 97.3%
Q17. 96.8% 95.9% 98.0% 98.5%
Q18. 95.4% 94.1% 96.8% 97.8%
Q19. 96.5% 95.4% 97.6% 98.3%
Q20. 93.5% 92.1% 95.0% 95.9%
Summary Rate at or above the 90th percentile. Summary Rate at or above the 25th percentile, but below the 50th percentile.
Summary Rate at or above the 75th percentile, but below the 90th percentile. Summary Rate below the 25th percentile.
Summary Rate at or above the 50th percentile, but below the 75th percentile.
Three-Point Score Trend Comparisons and Percentile Thresholds
25th 75th 90th
2016 90th 2.59 2.67 2.70
2015 NA 2.59 2.67 2.70
2014 NA 2.59 2.67 2.70
Three-Point Score at or above the 90th percentile threshold. Three-Point Score at or above the 25th, but below the 50th percentile threshold.
Three-Point Score at or above the 75th, but below the 90th percentile threshold. Three-Point Score below the 25th percentile threshold.
Three-Point Score at or above the 50th, but below the 75th percentile threshold.
Global Proportions and Three-Point Scores Three-Point Score Trend Comparisons3-Pt
Score
2.7148
Q1
8.
2.7047
2.7919
Q2
0.
2.6242
Please note that the CAHPS® How Well Doctors Communicate measure was retired from 2015 accreditation scoring, however, organizations accredited on the 2014 standards will still be scored using the organization's submitted rate for this measure.Three-Point Scores are displayed as "NA" if a minimum average of 100 responses was not met for the composite or attribute. Adjustments and benchmarks apply to the composite score only.
How Well Doctors Communicate 149 NA
Q1
9.
Doctors showed respect for what you had to say 149 NA
Doctors spent enough time with you 149 NASignificance testing is identified by shading: Cells highlighted in red denote the current year score is significantly lower when compared to trend data; Cells highlighted in green denote the current year score is significantly higher when compared to trend data; No shading denotes that there was no significant difference between the scores or that there was insufficient sample size to conduct the statistical test. All significance testing is performed at the 95% significance level.
How Well Doctors Communicatewith Q42 -
Health PlanAttributes considered highly correlated with the rating
measures (those with coefficients greater than or equal to r = 0.400) are shaded blue.
Doctors showed respect for what you had to say
Composite and AttributesYour Plan's Summary Rates and Significance Testing
2016 2015 2014
Doctors explained things in an understandable way 0.238
Composite and AttributesYour Plan's Summary Rate
and Percentile Ranking
2016 Quality Compass, All Plans (PPO) Mean & Percentiles
50th
0.230
Doctors spent enough time with you 0.228
Doctors listened carefully to you 0.253
94.6% 27th 95.8%
Commercial Adult CAHPS® Percentiles
50th
Your plan's approximate percentile rankings in relation to the Quality Compass® All Plans benchmark were calculated by SPH Analytics using information derived from the NCQA 1-100 Benchmark. Rankings indicate where your plan’s Summary Rate falls relative to the NCQA 1-100 Benchmark. Summary Rates that are below the 10th percentile are shown as "<10th."
Doctors explained things in an understandable way
96.0% 26th 96.9%
Doctors listened carefully to you 94.0% 19th 95.6%
Doctors showed respect for what you had to say 96.6% 49th 96.7%
Doctors spent enough time with you 91.9% 22nd 93.5%
Composite YearPlan Unadjusted
Three-Point ScorePlan Adjusted
Three-Point Score
Approximate Plan
Percentile Threshold
Please note that the CAHPS® How Well Doctors Communicate measure was retired from 2015 accreditation scoring, however, organizations accredited on the 2014 standards will still be scored using the organization's submitted rate for this measure.Thresholds indicate where your plan's Three-Point Score ranks relative to the benchmark percentiles. Three-Point Scores that are below the 25th percentile threshold are shown as "<25th."
Q1
7.
2.7383
How Well Doctors Communicate
2.7148 2.7148 2.64
NA NA 2.64
NA NA 2.64
Doctors explained things in an understandable way 149 NA
Doctors listened carefully to you 149 NA
76.8%
NA NA
17.8%
NA NA
5.4%
NA NA0%
20%
40%
60%
80%
100%
2016 2015 2014
How Well Doctors Communicate
Never/Sometimes Usually Always
2.7148
NA NA
2.7148
NA NA0.00
1.00
2.00
3.00
2016(+0.000 adjustment)
2015(+0.000 adjustment)
2014(+0.010 adjustment)
How Well Doctors Communicate
Plan Unadjusted Three-Point Scores Plan Adjusted Three-Point Scores
8%
3%
6%
4%
5%
21%
14%
17%
18%
18%
70%
83%
77%
78%
77%
0% 20% 40% 60% 80% 100%
How Well Doctors Communicate
Never/Sometimes Usually Always
95%
NA NA
96% 95% 95%96% 96% 95%
0%
20%
40%
60%
80%
100%
2016 2015 2014
How Well Doctors Communicate
Your Plan PPO Quality Compass, All Plans Benchmark PPO SPH Analytics Benchmark
HW
DC
C
om
p.
SPH Analytics Commercial Adult Survey—2016 8C

HEDIS/CAHPS® Composite Analysis UMP UW MEDICINE ACCOUNTABLE CARE NETWORK
Customer Service Composite Commercial Adult CAHPS® Simulation
Summary Rate Trend Comparisons
88.6% 0 0 NA
Q35. 83.3% NA NA NA
Q36. 93.8% NA NA NA
Correlation with Rating Questionswith Q13 -
Health Carewith Q23 -
Personal Dr.
Q35. 0.325 0.314
Q36. 0.208 0.152
Drill Down of Summary Rate Comparisons Benchmark Summary Rate Comparisons
Benchmark Percentile Rankings
Mean 25th 75th 90th
Customer Service 87.5% 85.6% 90.0% 92.3%
Q35. 80.5% 78.2% 84.6% 87.4%
Q36. 94.4% 92.6% 96.1% 97.3%
Summary Rate at or above the 90th percentile. Summary Rate at or above the 25th percentile, but below the 50th percentile.
Summary Rate at or above the 75th percentile, but below the 90th percentile. Summary Rate below the 25th percentile.
Summary Rate at or above the 50th percentile, but below the 75th percentile.
Three-Point Score Trend Comparisons and Percentile Thresholds
25th 75th 90th
2016 NA 2.44 2.57 2.63
2015 NA 2.35 2.50 2.59
2014 NA 2.33 2.49 2.59
Three-Point Score at or above the 90th percentile threshold. Three-Point Score at or above the 25th, but below the 50th percentile threshold.
Three-Point Score at or above the 75th, but below the 90th percentile threshold. Three-Point Score below the 25th percentile threshold.
Three-Point Score at or above the 50th, but below the 75th percentile threshold.
Global Proportions and Three-Point Scores Three-Point Score Trend Comparisons
Three-Point Scores are displayed as "NA" if a minimum average of 100 responses was not met for the composite or attribute. Adjustments and benchmarks apply to the composite score only.
Customer Service 66 NA
Composite and AttributesYour Plan's Summary Rates and Significance Testing
2016 2015 2014
Getting information/help from customer service 66 NA
Treated with courtesy and respect by customer service staff 65 NA
Significance testing is identified by shading: Cells highlighted in red denote the current year score is significantly lower when compared to trend data; Cells highlighted in green denote the current year score is significantly higher when compared to trend data; No shading denotes that there was no significant difference between the scores or that there was insufficient sample size to conduct the statistical test. All significance testing is performed at the 95% significance level.
Customer Servicewith Q42 -
Health PlanAttributes considered highly correlated with the rating
measures (those with coefficients greater than or equal to r = 0.400) are shaded blue.
Getting information/help from customer service 0.375
Treated with courtesy and respect by customer service staff 0.179
Composite and AttributesYour Plan's Summary Rate
and Percentile Ranking
2016 Quality Compass, All Plans (PPO) Mean & Percentiles
50th
88.6% 60th 87.6%
Getting information/help from customer service
83.3% 68th 79.7%
Treated with courtesy and respect by customer service staff
93.8% 39th 95.0%
Your plan's approximate percentile rankings in relation to the Quality Compass® All Plans benchmark were calculated by SPH Analytics using information derived from the NCQA 1-100 Benchmark. Rankings indicate where your plan’s Summary Rate falls relative to the NCQA 1-100 Benchmark. Summary Rates that are below the 10th percentile are shown as "<10th."
Composite YearPlan Unadjusted
Three-Point ScorePlan Adjusted
Three-Point Score
Approximate Plan
Percentile Threshold
Commercial Adult CAHPS® Percentiles
50th
Customer Service
NA NA 2.51
NA NA 2.42
NA NA 2.42
Q36
.
NA
Thresholds indicate where your plan's Three-Point Score ranks relative to the benchmark percentiles. Three-Point Scores that are below the 25th percentile threshold are shown as "<25th."
3-Pt Score
CS
C
omp.
NA
Q35
.
NA
68.8%
NA NA
19.8%
NA NA
11.4%
NA NA0%
20%
40%
60%
80%
100%
2016 2015 2014
Customer Service
Never/Sometimes Usually Always
NA NA NANA NA NA0.00
1.00
2.00
3.00
2016(+0.000 adjustment)
2015(+0.000 adjustment)
2014(+0.014 adjustment)
Customer Service
Plan Unadjusted Three-Point Scores Plan Adjusted Three-Point Scores
6%
17%
11%
12%
27%
20%
82%
56%
69%
0% 20% 40% 60% 80% 100%
Customer Service
Never/Sometimes Usually Always
89%
NA NA
88% 86% 86%87% 87% 88%
0%
20%
40%
60%
80%
100%
2016 2015 2014
Customer Service
Your PlanPPO Quality Compass, All Plans BenchmarkPPO SPH Analytics Benchmark
SPH Analytics Commercial Adult Survey—2016 8D

HEDIS/CAHPS® Composite Analysis UMP UW MEDICINE ACCOUNTABLE CARE NETWORK
Claims Processing Composite Commercial Adult CAHPS® Simulation
Summary Rate Trend Comparisons
92.7% 0 0 NA
Q40. 89.8% NA NA NA
Q41. 95.6% NA NA NA
Correlation with Rating Questionswith Q13 -
Health Carewith Q23 -
Personal Dr.
Q40. 0.249 0.286
Q41. 0.077 0.100
Drill Down of Summary Rate Comparisons Benchmark Summary Rate Comparisons
Benchmark Percentile Rankings
Mean 25th 75th 90th
Claims Processing 87.8% 85.6% 90.4% 92.5%
Q40. 86.1% 83.7% 88.9% 91.2%
Q41. 89.5% 87.1% 92.1% 94.6%
Summary Rate at or above the 90th percentile. Summary Rate at or above the 25th percentile, but below the 50th percentile.
Summary Rate at or above the 75th percentile, but below the 90th percentile. Summary Rate below the 25th percentile.
Summary Rate at or above the 50th percentile, but below the 75th percentile.
Three-Point Score Trend Comparisons and Percentile Thresholds
25th 75th 90th
2016 NA 2.35 2.48 2.53
2015 NA 2.35 2.49 2.56
2014 NA 2.35 2.49 2.56
Three-Point Score at or above the 90th percentile threshold. Three-Point Score at or above the 25th, but below the 50th percentile threshold.
Three-Point Score at or above the 75th, but below the 90th percentile threshold. Three-Point Score below the 25th percentile threshold.
Three-Point Score at or above the 50th, but below the 75th percentile threshold.
Global Proportions and Three-Point Scores Three-Point Score Trend Comparisons
Three-Point Scores are displayed as "NA" if a minimum average of 100 responses was not met for the composite or attribute. Adjustments and benchmarks apply to the composite score only.
Claims Processing 90 NA
Composite and AttributesYour Plan's Summary Rates and Significance Testing
2016 2015 2014
Claims handled quickly 88 NA
Claims handled correctly 90 NASignificance testing is identified by shading: Cells highlighted in red denote the current year score is significantly lower when compared to trend data; Cells highlighted in green denote the current year score is significantly higher when compared to trend data; No shading denotes that there was no significant difference between the scores or that there was insufficient sample size to conduct the statistical test. All significance testing is performed at the 95% significance level.
Claims Processingwith Q42 -
Health Plan Attributes considered highly correlated with the rating measures (those with coefficients greater than or equal to
r = 0.400) are shaded blue.Claims handled quickly 0.371
Claims handled correctly 0.165
Composite and AttributesYour Plan's Summary Rate
and Percentile Ranking
2016 Quality Compass, All Plans (PPO) Mean & Percentiles
50th
92.7% 91st 88.1%
Claims handled quickly 89.8% 81st 86.4%
Claims handled correctly 95.6% 95th 89.8%
Your plan's approximate percentile rankings in relation to the Quality Compass® All Plans benchmark were calculated by SPH Analytics using information derived from the NCQA 1-100 Benchmark. Rankings indicate where your plan’s Summary Rate falls relative to the NCQA 1-100 Benchmark. Summary Rates that are below the 10th percentile are shown as "<10th."
Composite YearPlan Unadjusted
Three-Point ScorePlan Adjusted
Three-Point Score
Approximate Plan
Percentile Threshold
Commercial Adult CAHPS® Percentiles
50th
Claims Processing
NA NA 2.41
NA NA 2.41
NA NA 2.41
Q41
.
NA
Thresholds indicate where your plan's Three-Point Score ranks relative to the benchmark percentiles. Three-Point Scores that are below the 25th percentile threshold are shown as "<25th."
3-Pt Score
CP
C
omp.
NA
Q40
.
NA
56.6%
NA NA
36.0%
NA NA
7.3%
NA NA0%
20%
40%
60%
80%
100%
2016 2015 2014
Claims Processing
Never/Sometimes Usually Always
NA NA NANA NA NA0.00
1.00
2.00
3.00
2016(+0.000 adjustment)
2015(+0.000 adjustment)
2014(+0.014 adjustment)
Claims Processing
Plan Unadjusted Three-Point Scores Plan Adjusted Three-Point Scores
4%
10%
7%
29%
43%
36%
67%
47%
57%
0% 20% 40% 60% 80% 100%
Claims Processing
Never/Sometimes Usually Always
93%
NA NA
88% 88% 88%88% 89% 89%
0%
20%
40%
60%
80%
100%
2016 2015 2014
Claims Processing
Your PlanPPO Quality Compass, All Plans BenchmarkPPO SPH Analytics Benchmark
SPH Analytics Commercial Adult Survey—2016 8E

HEDIS/CAHPS® Composite Analysis UMP UW MEDICINE ACCOUNTABLE CARE NETWORK
Coordination of Care (Q22) Commercial Adult CAHPS® Simulation
Summary Rate Trend Comparisons
Q22. 84.8% NA NA NA
Correlation with Rating Questionswith Q13 -
Health Carewith Q23 -
Personal Dr.
Q22. 0.433 0.596
Drill Down of Summary Rate Comparisons Benchmark Summary Rate Comparisons (8-10)
Benchmark Percentile Rankings
Mean 25th 75th 90th
Q22. 81.3% 78.3% 84.4% 86.4%
Summary Rate at or above the 90th percentile. Summary Rate at or above the 25th percentile, but below the 50th percentile.Summary Rate at or above the 75th percentile, but below the 90th percentile. Summary Rate below the 25th percentile.Summary Rate at or above the 50th percentile, but below the 75th percentile.
Three-Point Score Trend Comparisons and Percentile Thresholds
25th 75th 90th
2016 25th 2.35 2.45 2.50
2015 NA NA NA NA
2014 NA NA NA NA
Three-Point Score at or above the 90th percentile threshold. Three-Point Score at or above the 25th, but below the 50th percentile threshold.Three-Point Score at or above the 75th, but below the 90th percentile threshold. Three-Point Score below the 25th percentile threshold.Three-Point Score at or above the 50th, but below the 75th percentile threshold.
Global Proportions and Three-Point Score Three-Point Score Trend Comparisons
Coordination of Care 105 NA
AttributeYour Plan's Summary Rates and Significance Testing
2016 2015 2014
Significance testing is identified by shading: Cells highlighted in red denote the current year score is significantly lower when compared to trend data; Cells highlighted in green denote the current year score is significantly higher when compared to trend data; No shading denotes that there was no significant difference between the scores or that there was insufficient sample size to conduct the statistical test. All significance testing is performed at the 95% significance level.
Coordination of Carewith Q42 -
Health Plan Attributes considered highly correlated with the rating measures (those with coefficients greater than or equal
to r = 0.400) are shaded blue.Coordination of Care 0.274
AttributeYour Plan's Summary Rate
and Percentile Ranking
2016 Quality Compass, All Plans (PPO) Mean & Percentiles
50th
Coordination of Care 84.8% 77th 81.6%
Your plan's approximate percentile rankings in relation to the Quality Compass® All Plans benchmark were calculated by SPH Analytics using information derived from the NCQA 1-100 Benchmark. Rankings indicate where your plan’s Summary Rate falls relative to the NCQA 1-100 Benchmark. Summary Rates that are below the 10th percentile are shown as "<10th."
Attribute YearPlan Unadjusted
Three-Point ScorePlan Adjusted
Three-Point Score
Approximate Plan
Percentile Threshold
Commercial Adult CAHPS® Percentiles
50th
NCQA added the Coordination of Care CAHPS® measure to Accreditation 2016 scoring.Three-Point Scores are displayed as "NA" if a minimum average of 100 responses was not met for the composite or attribute. Adjustments and benchmarks apply to the composite score only.
NA NA
NCQA added the Coordination of Care CAHPS® measure to Accreditation 2016 scoring.Thresholds indicate where your plan's Three-Point Score ranks relative to the benchmark percentiles. Three-Point Scores that are below the 25th percentile threshold are shown as "<25th."
3-Pt Score
Coo
rdin
atio
n of
Car
e (Q
22)
2.3524
Coordination of Care (Q22)
2.3524 2.3524 2.40
NA NA NA
NA
15.2%NA NA
34.3%
NA NA
50.5%
NA NA0%
20%
40%
60%
80%
100%
2016 2015 2014
Coordination of Care (Q22)
Always Usually Never/Sometimes
2.3524
NA NA
2.3524
NA NA0.00
1.00
2.00
3.00
2016(+0.000 adjustment)
2015(+0.000 adjustment)
2014(+0.014 adjustment)
Coordination of Care (Q22)
Plan Unadjusted Three-Point Scores Plan Adjusted Three-Point Scores
15% 34% 50%
0% 20% 40% 60% 80% 100%
Coordination of Care (Q22)
Never/Sometimes Usually Always
85%
NA NA
81% 81% 80%80% 81% 79%
0%
20%
40%
60%
80%
100%
2016 2015 2014
Coordination of Care (Q22)
Your PlanPPO Quality Compass, All Plans BenchmarkPPO SPH Analytics Benchmark
SPH Analytics Commercial Adult Survey - 2016 8F

HEDIS/CAHPS® Composite Analysis UMP UW MEDICINE ACCOUNTABLE CARE NETWORK
Rating of Health Care (Q13) Commercial Adult CAHPS® Simulation
Summary Rate Trend Comparisons
Q13. 78.5% NA NA NA
Q13. 52.8% NA NA NA
Correlation with Rating Questionswith Q13 -
Health Carewith Q23 -
Personal Dr.
Q13. NA 0.544
Drill Down of Summary Rate Comparisons Benchmark Summary Rate Comparisons (8-10)
Benchmark Percentile Rankings
Mean 25th 75th 90th
Q13. 76.5% 74.4% 78.9% 81.2%
Q13. 48.7% 45.1% 52.4% 54.8%
Summary Rate at or above the 90th percentile. Summary Rate at or above the 25th percentile, but below the 50th percentile.
Summary Rate at or above the 75th percentile, but below the 90th percentile. Summary Rate below the 25th percentile.
Summary Rate at or above the 50th percentile, but below the 75th percentile.
Three-Point Score Trend Comparisons and Percentile Thresholds
25th 75th 90th
2016 50th 2.35 2.45 2.50
2015 NA 2.34 2.44 2.50
2014 NA 2.32 2.43 2.49
Three-Point Score at or above the 90th percentile threshold. Three-Point Score at or above the 25th, but below the 50th percentile threshold.
Three-Point Score at or above the 75th, but below the 90th percentile threshold. Three-Point Score below the 25th percentile threshold.
Three-Point Score at or above the 50th, but below the 75th percentile threshold.
Global Proportions and Three-Point Score Three-Point Score Trend Comparisons
Three-Point Scores are displayed as "NA" if a minimum average of 100 responses was not met for the composite or attribute. Adjustments and benchmarks apply to the composite score only.
NA163Rating of Health Care (9-10)
Attributes considered highly correlated with the rating measures (those with coefficients greater than or equal
to r = 0.400) are shaded blue.
Ra
ting
of H
ea
lth C
are
(Q
13
)
2.4356
Thresholds indicate where your plan's Three-Point Score ranks relative to the benchmark percentiles. Three-Point Scores that are below the 25th percentile threshold are shown as "<25th."
3-Pt Score
Rating of Health Care (Q13)
2.4356 2.4356 2.40
NA NA 2.39
NA NA 2.38
Your plan's approximate percentile rankings in relation to the Quality Compass® All Plans benchmark were calculated by SPH Analytics using information derived from the NCQA 1-100 Benchmark. Rankings indicate where your plan’s Summary Rate falls relative to the NCQA 1-100 Benchmark. Summary Rates that are below the 10th percentile are shown as "<10th."
Rating Item YearPlan Unadjusted
Three-Point ScorePlan Adjusted
Three-Point Score
Approximate Plan
Percentile Threshold
Commercial Adult CAHPS® Percentiles
50th
Rating of Health Care (8-10) 78.5% 69th 76.8%
Rating of Health Care (9-10) 52.8% 80th 48.5%
Rating ItemYour Plan's Summary Rate
and Percentile Ranking
2016 Quality Compass, All Plans (PPO) Mean & Percentiles
50th
Significance testing is identified by shading: Cells highlighted in red denote the current year score is significantly lower when compared to trend data; Cells highlighted in green denote the current year score is significantly higher when compared to trend data; No shading denotes that there was no significant difference between the scores or that there was insufficient sample size to conduct the statistical test. All significance testing is performed at the 95% significance level.
Rating of Health Carewith Q42 - Health Plan
Rating of Health Care (8-10) 0.755
Rating of Health Care (8-10) 163 NA
Rating ItemYour Plan's Summary Rates and Significance Testing
2016 2015 2014
52.8%
NA NA
38.0%
NA NA
9.2%
NA NA0%
20%
40%
60%
80%
100%
2016 2015 2014
Rating of Health Care (Q13)
0-6 7-8 9-10
2.4356
NA NA
2.4356
NA NA0.00
1.00
2.00
3.00
2016(+0.000 adjustment)
2015(+0.000 adjustment)
2014(+0.014 adjustment)
Rating of Health Care (Q13)
Plan Unadjusted Three-Point Scores Plan Adjusted Three-Point Scores
9% 38% 53%
0% 20% 40% 60% 80% 100%
Rating of Health Care (Q13)
0-6 7-8 9-10
79%
NA NA
77% 77% 77%77% 78% 78%
0%
20%
40%
60%
80%
100%
2016 2015 2014
Rating of Health Care (Q13)
Your PlanPPO Quality Compass, All Plans BenchmarkPPO SPH Analytics Benchmark
SPH Analytics Commercial Adult Survey—2016 8G

HEDIS/CAHPS® Composite Analysis UMP UW MEDICINE ACCOUNTABLE CARE NETWORK
Rating of Personal Doctor (Q23) Commercial Adult CAHPS® Simulation
Summary Rate Trend Comparisons
Q23. 88.9% NA NA NA
Q23. 70.4% NA NA NA
Correlation with Rating Questionswith Q13 -
Health Carewith Q23 -
Personal Dr.
Q23. 0.544 NA
Drill Down of Summary Rate Comparisons Benchmark Summary Rate Comparisons (8-10)
Benchmark Percentile Rankings
Mean 25th 75th 90th
Q23. 84.4% 82.1% 86.6% 88.2%
Q23. 65.5% 62.1% 68.8% 70.7%
Summary Rate at or above the 90th percentile. Summary Rate at or above the 25th percentile, but below the 50th percentile.
Summary Rate at or above the 75th percentile, but below the 90th percentile. Summary Rate below the 25th percentile.
Summary Rate at or above the 50th percentile, but below the 75th percentile.
Three-Point Score Trend Comparisons and Percentile Thresholds
25th 75th 90th
2016 90th 2.47 2.57 2.61
2015 NA 2.47 2.57 2.61
2014 NA 2.47 2.57 2.61
Three-Point Score at or above the 90th percentile threshold. Three-Point Score at or above the 25th, but below the 50th percentile threshold.
Three-Point Score at or above the 75th, but below the 90th percentile threshold. Three-Point Score below the 25th percentile threshold.
Three-Point Score at or above the 50th, but below the 75th percentile threshold.
Global Proportions and Three-Point Score Three-Point Score Trend Comparisons
Three-Point Scores are displayed as "NA" if a minimum average of 100 responses was not met for the composite or attribute. Adjustments and benchmarks apply to the composite score only.
2.52
Thresholds indicate where your plan's Three-Point Score ranks relative to the benchmark percentiles. Three-Point Scores that are below the 25th percentile threshold are shown as "<25th."
3-Pt Score
Ra
ting
of P
ers
on
al
Do
cto
r (Q
23
)
2.6420
Commercial Adult CAHPS® Percentiles
50th
Rating of Personal Doctor (Q23)
2.6420 2.6420 2.52
NA NA 2.52
NA
Rating Item YearPlan Unadjusted
Three-Point ScorePlan Adjusted
Three-Point Score
Approximate Plan
Percentile Threshold
NA
Rating of Personal Doctor (9-10) 70.4% 89th 65.3%
Your plan's approximate percentile rankings in relation to the Quality Compass® All Plans benchmark were calculated by SPH Analytics using information derived from the NCQA 1-100 Benchmark. Rankings indicate where your plan’s Summary Rate falls relative to the NCQA 1-100 Benchmark. Summary Rates that are below the 10th percentile are shown as "<10th."
Rating ItemYour Plan's Summary Rate
and Percentile Ranking
2016 Quality Compass, All Plans (PPO) Mean & Percentiles
50th
Rating of Personal Doctor (8-10) 88.9% 94th 84.8%
Rating of Personal Doctor (9-10) 162 NA
Significance testing is identified by shading: Cells highlighted in red denote the current year score is significantly lower when compared to trend data; Cells highlighted in green denote the current year score is significantly higher when compared to trend data; No shading denotes that there was no significant difference between the scores or that there was insufficient sample size to conduct the statistical test. All significance testing is performed at the 95% significance level.
Rating of Personal Doctorwith Q42 - Health Plan Attributes considered highly correlated with the rating
measures (those with coefficients greater than or equal to r = 0.400) are shaded blue.Rating of Personal Doctor (8-10) 0.344
Rating of Personal Doctor (8-10) 162 NA
Rating ItemYour Plan's Summary Rates and Significance Testing
2016 2015 2014
70.4%
NA NA
23.5%
NA NA
6.2%
NA NA0%
20%
40%
60%
80%
100%
2016 2015 2014
Rating of Personal Doctor (Q23)
0-6 7-8 9-10
2.6420
NA NA
2.6420
NA NA0.00
1.00
2.00
3.00
2016(+0.000 adjustment)
2015(+0.000 adjustment)
2014(+0.014 adjustment)
Rating of Personal Doctor (Q23)
Plan Unadjusted Three-Point Scores Plan Adjusted Three-Point Scores
6% 23% 70%
0% 20% 40% 60% 80% 100%
Rating of Personal Doctor (Q23)
0-6 7-8 9-10
89%
NA NA
85% 85% 85%84% 85% 86%
0%
20%
40%
60%
80%
100%
2016 2015 2014
Rating of Personal Doctor (Q23)
Your PlanPPO Quality Compass, All Plans BenchmarkPPO SPH Analytics Benchmark
SPH Analytics Commercial Adult Survey—2016 8H

HEDIS/CAHPS® Composite Analysis UMP UW MEDICINE ACCOUNTABLE CARE NETWORK
Rating of Specialist (Q27) Commercial Adult CAHPS® Simulation
Summary Rate Trend Comparisons
Q27. 84.2% NA NA NA
Q27. 63.2% NA NA NA
Correlation with Rating Questionswith Q13 -
Health Carewith Q23 -
Personal Dr.
Q27. 0.460 0.254
Drill Down of Summary Rate Comparisons Benchmark Summary Rate Comparisons (8-10)
Benchmark Percentile Rankings
Mean 25th 75th 90th
Q27. 83.3% 81.1% 85.6% 87.9%
Q27. 64.9% 61.9% 68.1% 71.0%
Summary Rate at or above the 90th percentile. Summary Rate at or above the 25th percentile, but below the 50th percentile.
Summary Rate at or above the 75th percentile, but below the 90th percentile. Summary Rate below the 25th percentile.
Summary Rate at or above the 50th percentile, but below the 75th percentile.
Three-Point Score Trend Comparisons and Percentile Thresholds
25th 75th 90th
2016 50th 2.49 2.58 2.64
2015 NA 2.49 2.58 2.64
2014 NA 2.49 2.58 2.64
Three-Point Score at or above the 90th percentile threshold. Summary Rate at or above the 25th percentile, but below the 50th percentile.
Three-Point Score at or above the 75th, but below the 90th percentile threshold. Summary Rate below the 25th percentile.
Three-Point Score at or above the 50th, but below the 75th percentile threshold.
Global Proportions and Three-Point Score Three-Point Score Trend Comparisons
Three-Point Scores are displayed as "NA" if a minimum average of 100 responses was not met for the composite or attribute. Adjustments and benchmarks apply to the composite score only.
2.53
Thresholds indicate where your plan's Three-Point Score ranks relative to the benchmark percentiles. Three-Point Scores that are below the 25th percentile threshold are shown as "<25th."
3-Pt Score
Ra
ting
of S
pe
cia
list
(Q2
7)
2.5614
Commercial Adult CAHPS® Percentiles
50th
Rating of Specialist (Q27)
2.5614 2.5614 2.53
NA NA 2.53
NA
Rating Item YearPlan Unadjusted
Three-Point ScorePlan Adjusted
Three-Point Score
Approximate Plan
Percentile Threshold
NA
Rating of Specialist (9-10) 63.2% 33rd 65.1%
Your plan's approximate percentile rankings in relation to the Quality Compass® All Plans benchmark were calculated by SPH Analytics using information derived from the NCQA 1-100 Benchmark. Rankings indicate where your plan’s Summary Rate falls relative to the NCQA 1-100 Benchmark. Summary Rates that are below the 10th percentile are shown as "<10th."
Rating ItemYour Plan's Summary Rate
and Percentile Ranking
2016 Quality Compass, All Plans (PPO) Mean & Percentiles
50th
Rating of Specialist (8-10) 84.2% 61st 83.3%
Rating of Specialist (9-10) 114 NA
Significance testing is identified by shading: Cells highlighted in red denote the current year score is significantly lower when compared to trend data; Cells highlighted in green denote the current year score is significantly higher when compared to trend data; No shading denotes that there was no significant difference between the scores or that there was insufficient sample size to conduct the statistical test. All significance testing is performed at the 95% significance level.
Rating of Specialistwith Q42 - Health Plan Attributes considered highly correlated with the rating
measures (those with coefficients greater than or equal to r = 0.400) are shaded blue.Rating of Specialist (8-10) 0.355
Rating of Specialist (8-10) 114 NA
Rating ItemYour Plan's Summary Rates and Significance Testing
2016 2015 2014
63.2%
NA NA
29.8%
NA NA
7.0%
NA NA0%
20%
40%
60%
80%
100%
2016 2015 2014
Rating of Specialist (Q27)
0-6 7-8 9-10
2.5614
NA NA
2.5614
NA NA0.00
1.00
2.00
3.00
2016(+0.000 adjustment)
2015(+0.000 adjustment)
2014(+0.014 adjustment)
Rating of Specialist (Q27)
Plan Unadjusted Three-Point Scores Plan Adjusted Three-Point Scores
7% 30% 63%
0% 20% 40% 60% 80% 100%
Rating of Specialist (Q27)
0-6 7-8 9-10
84%
NA NA
83% 84% 84%83% 85% 86%
0%
20%
40%
60%
80%
100%
2016 2015 2014
Rating of Specialist (Q27)
Your PlanPPO Quality Compass, All Plans BenchmarkPPO SPH Analytics Benchmark
SPH Analytics Commercial Adult Survey—2016 8I

HEDIS/CAHPS® Composite Analysis UMP UW MEDICINE ACCOUNTABLE CARE NETWORK
Rating of Health Plan (Q42) Commercial Adult CAHPS® Simulation
Summary Rate Trend Comparisons
Q42. 68.2% NA NA NA
Q42. 43.8% NA NA NA
Correlation with Rating Questionswith Q13 -
Health Carewith Q23 -
Personal Dr.
Q42. 0.755 0.344
Drill Down of Summary Rate Comparisons Benchmark Summary Rate Comparisons (8-10)
Benchmark Percentile Rankings
Mean 25th 75th 90th
Q42. 59.5% 54.9% 65.0% 70.3%
Q42. 34.7% 30.0% 40.1% 45.1%
Summary Rate at or above the 90th percentile. Summary Rate at or above the 25th percentile, but below the 50th percentile.
Summary Rate at or above the 75th percentile, but below the 90th percentile. Summary Rate below the 25th percentile.
Summary Rate at or above the 50th percentile, but below the 75th percentile.
Three-Point Score Trend Comparisons and Percentile Thresholds
25th 75th 90th
2016 50th 2.06 2.26 2.38
2015 NA 2.05 2.25 2.41
2014 NA 2.05 2.25 2.40
Three-Point Score at or above the 90th percentile threshold. Summary Rate at or above the 25th percentile, but below the 50th percentile.
Three-Point Score at or above the 75th, but below the 90th percentile threshold. Summary Rate below the 25th percentile.
Three-Point Score at or above the 50th, but below the 75th percentile threshold.
Global Proportions and Unadjusted Three-Point Score Three-Point Score Trend Comparisons
Three-Point Scores are displayed as "NA" if a minimum average of 100 responses was not met for the composite or attribute. Adjustments and benchmarks apply to the composite score only.
2.16
Thresholds indicate where your plan's Three-Point Score ranks relative to the benchmark percentiles. Three-Point Scores that are below the 25th percentile threshold are shown as "<25th."
3-Pt Score
Ra
ting
of H
ea
lth P
lan
(Q
42
)
2.2500
Commercial Adult CAHPS® Percentiles
50th
Rating of Health Plan (Q42)
2.2500 2.2500 2.15
NA NA 2.16
NA
Rating Item YearPlan Unadjusted
Three-Point ScorePlan Adjusted
Three-Point Score
Approximate Plan
Percentile Threshold
NA
Rating of Health Plan (9-10) 43.8% 86th 34.6%
Your plan's approximate percentile rankings in relation to the Quality Compass® All Plans benchmark were calculated by SPH Analytics using information derived from the NCQA 1-100 Benchmark. Rankings indicate where your plan’s Summary Rate falls relative to the NCQA 1-100 Benchmark. Summary Rates that are below the 10th percentile are shown as "<10th."
Rating ItemYour Plan's Summary Rate
and Percentile Ranking
2016 Quality Compass, All Plans (PPO) Mean & Percentiles
50th
Rating of Health Plan (8-10) 68.2% 85th 59.8%
Rating of Health Plan (9-10) 176 NA
Significance testing is identified by shading: Cells highlighted in red denote the current year score is significantly lower when compared to trend data; Cells highlighted in green denote the current year score is significantly higher when compared to trend data; No shading denotes that there was no significant difference between the scores or that there was insufficient sample size to conduct the statistical test. All significance testing is performed at the 95% significance level.
Rating of Health Planwith Q42 - Health Plan Attributes considered highly correlated with the rating
measures (those with coefficients greater than or equal to r = 0.400) are shaded blue.Rating of Health Plan (8-10) NA
Rating of Health Plan (8-10) 176 NA
Rating ItemYour Plan's Summary Rates and Significance Testing
2016 2015 2014
43.8%
NA NA
37.5%
NA NA
18.8%
NA NA0%
20%
40%
60%
80%
100%
2016 2015 2014
Rating of Health Plan (Q42)
0-6 7-8 9-10
2.2500
NA NA
2.2500
NA NA0.00
1.00
2.00
3.00
2016(+0.000 adjustment)
2015(+0.000 adjustment)
2014(+0.014 adjustment)
Rating of Health Plan (Q42)
Plan Unadjusted Three-Point Scores Plan Adjusted Three-Point Scores
19% 38% 44%
0% 20% 40% 60% 80% 100%
Rating of Health Plan (Q42)
0-6 7-8 9-10
68%
NA NA
60% 60% 60%61% 65% 65%
0%
20%
40%
60%
80%
100%
2016 2015 2014
Rating of Health Plan (Q42)
Your PlanPPO Quality Compass, All Plans BenchmarkPPO SPH Analytics Benchmark
SPH Analytics Commercial Adult Survey—2015 8J

2016 Final Report for UMP UW MEDICINE ACCOUNTABLE CARE NETWORK Consumer Assessment of Healthcare Providers and Systems (CAHPS®) Survey
SPH Analytics Commercial Adult Survey – 2016 9-1
9. Technical Notes Presented alphabetically by subject area Composite Categories The NCQA core survey includes seven composite categories. Each composite category represents an overall aspect of plan quality and is comprised of similar questions. For each composite, an overall score is computed. NCQA defines the composite score as the average of the Summary Rates or Three-Point scores of the questions comprising a composite. For example, the Getting Needed Care composite is the average of the Summary Rates or Three-Point Scores of Q14 and Q25. Correlation Analysis Correlation Analysis is run between attributes and the overall satisfaction variable as measured by Question 42, Rating of Health Plan, as well as between attributes and Questions 13 and 23, Rating of Health Care and Rating of Personal Doctor, respectively. The Pearson’s product moment correlation coefficient, r, is used to measure the strength of the linear association between each attribute and the overall satisfaction variables. The correlation value can range from –1 to +1 with values close to +1 indicating a strong positive correlation. This analysis is shown on Page 6A. Demographic Categories SPH Analytics collapses the age, race/ethnicity, and education group categories into fewer segments than those defined by the CAHPS® 5.0H survey. The consolidation of the demographic categories with small samples allows for more valid between-group statistical comparisons.
Age Education CAHPS® SPH Analytics CAHPS® SPH Analytics
18 – 24 18 – 34
8th grade or less High school
graduate/GED or less
25 – 34 Some high school
35 – 44 35 – 44 High school graduate/GED
45 – 54 45 – 54 Some college/2-year degree Some college/2-
year degree
55 – 64
55 or older
4-year college degree College graduate or
more 65 – 74 More than 4-year college
degree 75 or older
Race/Ethnicity
CAHPS® SPH Analytics
White White
Black/African-American Black/African-
American
Asian
Other (In segmentation
and banners)
Native Hawaiian/Pacific Islander
American Indian/Alaska Native
Other
Hispanic/Latino Hispanic/Latino

2016 Final Report for UMP UW MEDICINE ACCOUNTABLE CARE NETWORK Consumer Assessment of Healthcare Providers and Systems (CAHPS®) Survey
SPH Analytics Commercial Adult Survey – 2016 9-2
Effectiveness of Care Measures (Aspirin Use and Discussion ASP) The Aspirin Use and Discussing Aspirin Risks and Benefits Effectiveness of Care Measures were created to assess the various facets of managing aspirin use for the prevention of heart disease. While the Aspirin Use Measure represents the percentage of members who are currently taking aspirin, the Discussing Aspirin Risks and Benefits Measure indicates the proportion of members who discuss the risks and benefits of using aspirin with a doctor or other health provider. In order for a member to be considered eligible for inclusion in the calculation of the Aspirin Use Effectiveness of Care Measure, the following conditions must be met: Conversely, in order for a member to be considered eligible for inclusion in the calculation of the Discussing Aspirin Risks and Benefits Effectiveness of Care Measure, the following conditions must be met:
Member has not selected any of the following cardiovascular conditions listed in Q54, "Has a doctor ever told you that you have any of the following conditions? Mark one or more."
A heart attack
Angina or coronary heart disease
A stroke Any kind of
diabetes or high blood sugar
1. Member is female, is between 55 to 79 years of age, and has at least two cardiovascular risk factors.
Member answers "No" to Q51, indicating that he or she does not have a health problem or take medication that makes taking aspirin unsafe.
or
and and2. Member is male, is between 45 to 64 years of age, and has at least one cardiovascular risk factor.
and Member answers “Yes” or “No” to Q50, “Do you take aspirin daily or every other day?”
or
3. Member is a male between 65 to 79 years of age.
Member has not selected any of the following cardiovascular conditions listed in Q54, "Has a doctor ever told you that you have any of the following conditions? Mark one or more."
A heart attack Angina or
coronary heart disease
A stroke Any kind of
diabetes or high blood sugar
1. Member is female and is between 55 to 79 years of age.Member answers
“Yes” or “No” to Q52, “Has a doctor or health provider ever discussed with you the risks and benefits of aspirin to prevent heart attack or stroke?”
or
and2. Member is male and is between 45 to 64 years of age.
and
or
3. Member is male and is between 65 to 79 years of age.

2016 Final Report for UMP UW MEDICINE ACCOUNTABLE CARE NETWORK Consumer Assessment of Healthcare Providers and Systems (CAHPS®) Survey
SPH Analytics Commercial Adult Survey – 2016 9-3
Cardiovascular risk factors are determined based upon members’ responses to the following questions:
Health and Human Services (HHS) Regions:
Chicago – Indiana, Illinois, Michigan, Minnesota, Wisconsin, Ohio New York – New York, New Jersey, Puerto Rico, Virgin Islands Philadelphia – Delaware, District of Columbia, Maryland, Pennsylvania, Virginia, West Virginia Denver – Colorado, Montana, North Dakota, South Dakota, Utah, Wyoming Boston – Connecticut, Maine, Massachusetts, New Hampshire, Rhode Island, Vermont Seattle – Alaska, Idaho, Washington, Oregon Atlanta – Alabama, Florida, Georgia, Kentucky, Mississippi, North Carolina, South Carolina,
Tennessee Dallas – Arkansas, Louisiana, Oklahoma, New Mexico, Texas Kansas City – Iowa, Missouri, Nebraska, Kansas San Francisco – American Samoa, Arizona, California, Guam, Hawaii, Nevada
NCQA 1 – 100 Benchmark is a percentile benchmark (with values ranging from the first through the one hundredth percentile) calculated by NCQA and derived from PPO commercial adult data collected by NCQA in 2016. SPH Analytics utilizes this benchmark to calculate your plan's approximate percentile rankings in relation to the Quality Compass® All Plans benchmark. In keeping, the percentile ranks displayed on page 3D and in Section 8 – Composite Analysis indicate where your plan’s Summary Rates fall relative to the NCQA 1-100 Benchmark. Opportunity Analysis (see Regression Analysis) Public Report (2016) benchmark is derived from NCQA’s Quality Compass® benchmark and is calculated by SPH Analytics. The benchmark is a collection of CAHPS® 5.0H mean summary ratings for those commercial adult plans (152 PPO samples with at least 100 valid responses per question item) choosing to report their scores publicly, in addition to submitting their scores to be compiled anonymously into a Quality Compass® aggregate, or national summary. The scores shown in this report reflect the mean Summary Rates from these plan means. Quality Compass® 2016 (All Plans) data benchmark is a collection of CAHPS® 5.0H mean summary ratings (211 samples – PPO) for those commercial adult plans (samples with at least 100 valid responses per question item) allowing NCQA to use their data to be compiled into an aggregate, or national summary, without releasing their plan-level scores.
Q46. Do you now smoke cigarettes or use tobacco every day, some days, or not at all?
Q53. Are you aware that you have any of the following conditions? Mark one or more. and
oror Every day Some days
High cholesterol
Parent or sibling with heart attack before the age of 60
High blood pressure
or

2016 Final Report for UMP UW MEDICINE ACCOUNTABLE CARE NETWORK Consumer Assessment of Healthcare Providers and Systems (CAHPS®) Survey
SPH Analytics Commercial Adult Survey – 2016 9-4
Question Scoring NCQA Summary Rate & Three-Point Categories for Composite Questions
Composites/ Response choices
Summary Rate
Three-Point
Questions/Attributes
Getting Needed Care Never/Sometimes 1 Q14 – In the last 12 months, how often was it easy to get the
care, tests, or treatment you needed? Q25 – In the last 12 months, how often did you get an appointment to see a specialist as soon as you needed?
Usually Summary
Rate 2
Always Summary
Rate 3
Getting Care Quickly Never/Sometimes 1 Q4 – In the last 12 months, when you needed care right away,
how often did you get care as soon as you needed? Q6 – In the last 12 months, how often did you get an appointment for a check-up or routine care at a doctor’s office or clinic as soon as you needed?
Usually Summary
Rate 2
Always Summary
Rate 3
How Well Doctors Communicate Never/Sometimes 1 Q17 – In the last 12 months, how often did your personal doctor
explain things in a way that was easy to understand? Q18 – In the last 12 months, how often did your personal doctor listen carefully to you? Q19 – In the last 12 months, how often did your personal doctor show respect for what you had to say? Q20 - In the last 12 months, how often did your personal doctor spend enough time with you?
Usually Summary
Rate 2
Always Summary
Rate 3
Customer Service Never/Sometimes 1
Q35 – In the last 12 months, how often did your health plan’s customer service give you the information or help you needed? Q36 – In the last 12 months, how often did your health plan’s customer service staff treat you with courtesy and respect?
Usually Summary
Rate 2
Always Summary
Rate 3
Claims Processing Never/Sometimes 1 Q40 – In the last 12 months, how often did your health plan
handle your claims quickly? Q41 – In the last 12 months, how often did your health plan handle your claims correctly?
Usually Summary
Rate 2
Always Summary
Rate 3
Shared Decision Making No 1 Q10 – Did you and a doctor or other health provider talk about
the reasons you might want to take a medicine? Q11 – Did you and a doctor or other health provider talk about the reasons you might not want to take a medicine? Q12 – When you talked about starting or stopping a prescription medicine, did a doctor or other health provider ask you what you thought was best for you?
Yes Summary
Rate 3

2016 Final Report for UMP UW MEDICINE ACCOUNTABLE CARE NETWORK Consumer Assessment of Healthcare Providers and Systems (CAHPS®) Survey
SPH Analytics Commercial Adult Survey – 2016 9-5
Composites/ Response choices
Summary Rate
Three-Point
Questions/Attributes
Plan Information on Costs* Never/Sometimes 1 Q31 – In the last 12 months, how often were you able to find out
from your health plan how much you would have to pay for a health care service or equipment? Q33 – In the last 12 months, how often were you able to find out from your health plan how much you would have to pay for specific prescription medicines?
Usually Summary
Rate 2
Always Summary
Rate 3
*Results for Plan Information on Costs are calculated using rolling average methodology. Rating Questions There are four questions with responses scaled 0 to 10 in the CAHPS® 5.0H survey: Rating of Health Care (Q13), Rating of Personal Doctor (Q23), Rating of Specialist (Q27), and Rating of Health Plan (Q42), where zero represents “worst possible” and ten represents “best possible.” . Regression Analysis Regression estimates are measures of association between independent variables (composites) and a dependent variable (overall satisfaction rating), while controlling for the effect of other variables through the use of a statistical model. Three backward elimination, respondent-level, multiple linear regression models were fitted to the 2016 SPH Analytics Commercial Adult Book of Business benchmark. The SPH Analytics Book of Business consists of the 2016 commercial adult data from each of the 29 PPO health plans that submitted to NCQA. The dependent variables in the models are measured by Question 42 (“What number would you use to rate your health plan?”), Question 13 (“What number would you use to rate your health care?”), as well as Question 23 (“What number would you use to rate your personal doctor?), all of which are scaled from 0 to 10 (“Worst possible” to “Best possible”). All composite questions are evaluated as potential independent variables in the analysis. These questions are scaled from 0 to 3 (0, 1, 2, and 3) for four-point scales in the direction of least favorable response to most favorable response. Those composite variables found to have a significant positive influence (as found by testing individual beta coefficients with a 0.05 level of significance) on Overall Satisfaction are reported as Key Drivers of overall satisfaction. The numbers reported alongside each composite, shown in Section 1 – Executive Summary, are beta coefficients. These coefficients indicate the amount of change that takes place in the dependent variable for a one-unit change in the respondent level composite independent variable in the rescaled 0-3 units (with all other independent variables unchanged). Within the context of the model, the higher the beta score, the larger the effect the composite has on overall satisfaction, with all other composites held constant. Using the results of the regression analysis, SPH Analytics has developed the following Opportunity Analysis: if the composite Summary Rate is equal to or greater than the 75th percentile of the 2016 SPH Analytics Commercial Adult Book of Business benchmark Summary Rate, and the composite is determined to be a Key Driver by the multiple linear regression analysis, the composite is considered a plan Strength. If the composite is a Key Driver and the Summary Rate below the 50th percentile when compared to the 2016 SPH Analytics Commercial Adult Book of Business benchmark Summary Rates, the composite is considered a plan Opportunity. If a Key Driver has a Summary Rate that falls between the 50th and 75th

2016 Final Report for UMP UW MEDICINE ACCOUNTABLE CARE NETWORK Consumer Assessment of Healthcare Providers and Systems (CAHPS®) Survey
SPH Analytics Commercial Adult Survey – 2016 9-6
percentiles when compared to the 2016 SPH Analytics Commercial Adult Book of Business benchmark Summary Rates, it is suggested that the composite be monitored as it could become a Strength or Opportunity in the future, depending on the plan’s success in that area. Report Sections Profile of Survey Respondents
Health Status and Mental/Emotional Health Status are defined by member. Segmentation Analysis (Rating of Health Plan (Q42) by Respondent Demographics)
Health Status and Mental/Emotional Health Status are defined by member. “Other” includes respondents who selected “Asian”, “Native Hawaiian or other Pacific
Islander”, “American Indian or Alaska Native”, or “Other” in Question 63. Benchmark Comparisons
Ranking indicates where your plan’s Summary Rate Score ranks when compared to the specified benchmark. Summary Rates that are below the 10th percentile are shown as ‘<10th.’
Global Proportions Three-Point Score is the sum of the three scores: the percent in orange has a score of 1,
the percent in light blue has a score of 2, and the percent in blue has a score of 3. The composite Three-Point Score is the average if its attributes’ Three-Point Scores.
90th percentile represents the minimum score needed to obtain full accreditation points for this measure.
If a plan receives and NA (indicating the denominator was less than 100) the points for that measure are redistributed among the remaining required measures. An organization that has more than four CAHPS® NAs, or which exceed ten NA or NB results between HEDIS and CAHPS® for each product line, are scored based on the standards score only and the accreditation status is capped at commendable.
Accreditation Assessment Benchmark thresholds are accurate as of the date of this report production. The source
for the HEDIS/CAHPS® Percentile benchmarks and thresholds is: NCQA>Programs>Accreditation>Policy Updates and Supporting Documents>Benchmarks and Thresholds >Learn More>Benchmarks and Thresholds: 2016 Accreditation.
Segmentation Range is the difference between Summary Rates shown. The larger the number, the
greater the difference in Summary Rates between segment groups for any given question/composite.
For the Segmentation pages, the Summary Rates shown for Plan Information on Costs, Q31, and Q33 represent 2016 data only, rather than the Rolling Average.
For reporting purposes, “Other” on page 5D includes Asian, Native Hawaiian or other Pacific Islander, American Indian or Alaska Native, and respondents who answered “Other.”
Correlations As the correlation coefficient approaches a value of 1.000, the association of the
attribute with overall satisfaction is increased. Cells shaded dark blue have a correlation coefficient of equal to or greater than r = 0.400.
Question Summaries For the rolling average methodology, a score can be obtained one of two ways: (1) If at
least 100 responses were achieved by combining 2015 scores and 2016 scores, the rolling average score is the average of the 2015 and 2016 scores. (2) If there were no

2016 Final Report for UMP UW MEDICINE ACCOUNTABLE CARE NETWORK Consumer Assessment of Healthcare Providers and Systems (CAHPS®) Survey
SPH Analytics Commercial Adult Survey – 2016 9-7
scores for 2015 but there were at least 100 responses for 2016, the rolling average is the 2016 score. If the combined responses for 2015 and 2016 do not achieve at least 100 responses, then the measure will receive an “NA” by NCQA.
Members who respond “No” to Question 37 are included in “Always” of Question 38, per NCQA, Volume 3, HEDIS 2016 guidelines.
Members eligible for inclusion in the Aspirin Use measure are as follows” (1) Women 55-79 years of age with at least two risk factors for cardiovascular disease, (2) Men 45-64 years of age with at least one risk factor for cardiovascular disease, and (3) Men 65-79 years of age, regardless of risk factors.
Members eligible for inclusion in the Discussing Aspirin Risks and Benefits measure are as follows: (1) Women 55-79 years of age, and (2) Men 45-79 years of age.
The base for Questions 63 and 65 is the total number of respondents. Members were allowed to choose more than one response option; therefore, the sum of all figures may equal more than 100%.
Response Rate The sample size for adult commercial health plans is 1,100 in accordance with NCQA protocol, although plans may choose to over-sample if necessary. Please refer to the Glossary of Terms for more information on over-samples. The overall NCQA target number of complete responses is 411. Ineligible members include those who are deceased, members who do not meet the eligible population criteria, members with a language barrier, and members who are mentally or physically incapacitated. Non-responses include those members who have refused to participate in the survey, could not be reached due to a bad address or telephone number, or members that reached a maximum attempt threshold and were unable to be contacted during the survey time period. The formula for determining the response rate is the following:
Completed mail, telephone, and Internet (if applicable) surveys = Response rate
Final sample size – Ineligible surveys Sampling Error Sampling error can be thought of as the extent to which survey results may differ from what would be obtained if every eligible member in the sample had been surveyed. The size of such error depends largely on the percentage distributions (i.e., the number of respondents selecting each answer category) and the number of members surveyed. The more disproportionate the percentage distributions or the larger the sample size is, the smaller the error. The tables on the following page may be used in estimating approximate sampling error. The first table shows the range (plus or minus the figure shown) within which the population percentage could be expected to lay 95* out of 100 times a sample of that size and percentage distribution would be selected. The second table shows the range (plus or minus the figure shown) within which the population percentage could be expected to lay 90** out of 100 times a sample of that size and percentage distribution would be selected.

2016 Final Report for UMP UW MEDICINE ACCOUNTABLE CARE NETWORK Consumer Assessment of Healthcare Providers and Systems (CAHPS®) Survey
SPH Analytics Commercial Adult Survey – 2016 9-8
Valid Responses
Percentage Distribution
50/50 60/40 70/30 80/20 90/10 50 13.9 13.6 12.7 11.1 8.3
100 9.8 9.6 9.0 7.8 5.9
200 6.9 6.8 6.4 5.5 4.2
300 5.7 5.5 5.2 4.5 3.4
400 4.9 4.8 4.5 3.9 2.9
500 4.4 4.3 4.0 3.5 2.6
750 3.6 3.5 3.3 2.9 2.1
850 3.4 3.3 3.1 2.7 2.0
*95% confidence interval
Valid Responses
Percentage Distribution
50/50 60/40 70/30 80/20 90/10 50 11.6 11.4 10.7 9.3 7.0
100 8.2 8.1 7.5 6.6 4.9
200 5.8 5.7 5.3 4.7 3.5
300 4.7 4.7 4.4 3.8 2.8
400 4.1 4.0 3.8 3.3 2.5
500 3.7 3.6 3.4 2.9 2.2
750 3.0 2.9 2.8 2.4 1.8
850 2.8 2.8 2.6 2.3 1.7
**90% confidence interval The sampling error table is used in the following manner: assume that “overall rating of health plan” received a Summary Rate of seventy percent (70.0%) from a sample of 500 valid responses. For a 95% confidence interval, look at the table where the sample size of 500 intersects the percentage distribution of 70/30. The margin of error for this sample size is four percentage points (4.0%). Therefore, on average, in 95 out of 100 similar samples, the 95% confidence interval (e.g., 66.0% to 74.0%) will span the true unknown population percentage. SPH Analytics Book of Business The SPH Analytics Book of Business (calculated on a plan-level) consists of all commercial adult samples (PPO) that were conducted by SPH Analytics and submitted to NCQA. In 2016, there were 29 samples included in the Book of Business. This benchmark is shown throughout the report. The 2015 SPH Analytics Book of Business consists of PPO samples that were submitted to NCQA in 2015, and is used for Custom Question benchmarks and correlation coefficients and Loyalty benchmarks (if applicable). Statistical Significance A statistically significant hypothesis testing result means that based on the sample(s), conditions/assumptions, and level of significance, there is sufficient evidence to conclude the alternate hypothesis. For example, when testing for a difference between a sample Summary Rate and a set constant score (e.g., Quality Compass® All Plans benchmark), statistical significance would mean that there is sufficient support for the statement that there is a difference between the sample Summary Rate and the set constant score. As another example, when testing to see if there is a difference between last year’s sample Summary Rate

2016 Final Report for UMP UW MEDICINE ACCOUNTABLE CARE NETWORK Consumer Assessment of Healthcare Providers and Systems (CAHPS®) Survey
SPH Analytics Commercial Adult Survey – 2016 9-9
and this year’s sample Summary Rate, statistical significance would mean that there is sufficient evidence for the statement that the sample Summary Rates are different. Summary Rate Summary Rates are single statistics generated for a survey question as specified by NCQA. In general, Summary Rates represent the percentage of respondents who chose the most favorable response option(s) (“Always” and “Usually;” “Yes;” or “8” to “10”). Not all questions are assigned a Summary Rate by NCQA. Summary Rate categories for the rating questions represent respondents who answered “8,” “9,” or “10.” In addition to the traditional NCQA defined Summary Rate calculation for rating questions (responses “8,” “9,” and “10”), Top Box Scores are also calculated using “9” and “10.” Members who respond “No” to Q37 are recoded as “Always” in Q38 and are, therefore, included in the Summary Rate of Q38. The Summary Rate for each composite category and additional measure is as follows: Getting Needed Care; Getting Care Quickly; How Well Doctors Communicate; Customer Service; Claims Processing; Plan Information on Cost; Coordination of Care, Providing Needed Information; and Ease of Filling Out Forms: Summary Rate represents the percentage of members who responded “Always” or “Usually.” Health Promotion and Education: Summary Rate represents the percentage of members who responded “Yes.” Shared Decision Making: Summary Rate represents the percentage of members who responded “Yes.” Plan Information on Costs is calculated using rolling average methodology. Three-Point Scores Three-Point scoring assigns a value of 1, 2, or 3 to each question response category and then computes a numerical average based upon the valid responses for each question. The Three-Point values are assigned to response option categories as follows:
Response Choice 1
Score Value
Response Choice
2 Score Value
Response Choice 3
Score Value
Never 1 No 1 0 – 6 1
Sometimes 1 Yes 3 7 & 8 2
Usually 2 9 & 10 3
Always 3
The “mean of means” method is used in computing the Three-Point composite score. Each question is weighted equally within a composite regardless of the number of valid responses. These composite scores may be in slight variance to the scores shown elsewhere in the report

2016 Final Report for UMP UW MEDICINE ACCOUNTABLE CARE NETWORK Consumer Assessment of Healthcare Providers and Systems (CAHPS®) Survey
SPH Analytics Commercial Adult Survey – 2016 9-10
(comparisons by member age, gender, etc.) where scores are calculated as weighted means based on the actual number of respondents answering each question. Unanswered Questions CAHPS® 5.0H prescribes that if a respondent answered a question by marking more than one response (not including Q53, Q54, Q63, and Q65), that response is considered a “multiple mark.” A missing/multiple mark response is NOT assigned any value or used to calculate satisfaction scores. Z-Test To test for true differences in population score(s), statistical inference methods are applied. In particular, hypothesis testing is done to draw conclusions about differences in scores between a population and a set constant (e.g., a Summary Rate versus the Quality Compass® All Plans benchmark) or between different populations (e.g., a Summary Rate for this year versus a Summary Rate for last year). The hypothesis of no difference is rejected if the absolute value of the test statistic exceeds a critical value corresponding to a level of significance. The test statistic used depends on which of these types of hypothesis tests are performed.
When checking for a statistically significant difference between a Summary Rate for a population and a set constant score (e.g., the Quality Compass® All Plans benchmark)—with various conditions/assumptions—SPH Analytics uses the statistical test that follows:
n
qp
ppz
00
0ˆ
where
p̂ = Summary Rate from the sample
0p = Set constant score for comparison
0q = 1 – (Set constant score) = )1( 0p
n = Sample size
For hypothesis testing of composites, n equals the maximum denominator of the composite questions. With a large sample size ( 5ˆ11 pn , 5)ˆ1( 11 pn , 5ˆ 22 pn , and 5)ˆ1( 22 pn ), the z-statistic has a distribution that can be treated as the standard normal distribution. Thus, the hypothesis that the population “Summary Rate” equals the set constant score is rejected at a 0.05 level of significance when the absolute value of the z-statistic exceeds 1.96 (obtained from cumulative standard normal distribution table).
The second hypothesis-testing situation involves testing for statistically significant differences between two population percents (or proportions), e.g., two population Summary Rates. When comparing the population percentages (or proportions)—with various conditions/ assumptions—the appropriate test statistic is the z-statistic as follows:
21
21
11ˆˆ
ˆˆ
nnqp
ppz
where

2016 Final Report for UMP UW MEDICINE ACCOUNTABLE CARE NETWORK Consumer Assessment of Healthcare Providers and Systems (CAHPS®) Survey
SPH Analytics Commercial Adult Survey – 2016 9-11
1p̂ = Summary Rate from the 1st sample
2p̂ = Summary Rate from the 2nd sample
1n = Size of the sample from the 1st population
2n = Size of the sample from the 2nd population
p̂ = Pooled Summary Rate,
21
2211 ˆˆˆ
nn
pnpnp
q̂ = 1 – (Pooled Summary Rate)
For hypothesis testing of composites, n equals the maximum denominator of the composite questions. With large sample sizes ( 5ˆ11 pn , 5)ˆ1( 11 pn , 5ˆ 22 pn , and 5)ˆ1( 22 pn ), the z-statistic has a distribution that can be treated as the standard normal distribution. Thus, the hypothesis that the populations under comparison have equal population Summary Rates is rejected at a 0.05 level of significance when the absolute value of the z-statistic exceeds 1.96 (obtained from the cumulative standard normal distribution table).
Sample Survey Tool

18 Please continue on the next page.
1. Our records show that you are now in
Is that right?
1 Yes If Yes, Go to Question 32 No
2. What is the name of your health plan? (Please print)
______________________________________________
YOUR HEALTH CARE IN THE LAST 12 MONTHSThese questions ask about your own health care. Do notinclude care you got when you stayed overnight in ahospital. Do not include the times you went for dental carevisits.
3. In the last 12 months, did you have an illness, injury,or condition that needed care right away in a clinic,emergency room, or doctor’s office?
1 Yes2 No If No, Go to Question 5
4. In the last 12 months, when you needed care rightaway, how often did you get care as soon as youneeded?
1 Never2 Sometimes3 Usually4 Always
5. In the last 12 months, did you make any appointmentsfor a check-up or routine care at a doctor's office orclinic?
1 Yes2 No If No, Go to Question 7
6. In the last 12 months, how often did you get anappointment for a check-up or routine care at adoctor's office or clinic as soon as you needed?
1 Never2 Sometimes3 Usually4 Always
7. In the last 12 months, not counting the times you wentto an emergency room, how many times did you go toa doctor’s office or clinic to get health care foryourself?
1 None If None, Go to Question 152 1 time3 24 35 46 5 to 97 10 or more times
8. In the last 12 months, did you and a doctor or otherhealth provider talk about specific things you coulddo to prevent illness?
1 Yes2 No
9. In the last 12 months, did you and a doctor or otherhealth provider talk about starting or stopping aprescription medicine?
1 Yes2 No If No, Go to Question 13
10. Did you and a doctor or other health provider talkabout the reasons you might want to take a medicine?
1 Yes2 No
11. Did you and a doctor or other health provider talkabout the reasons you might not want to take amedicine?
1 Yes2 No
12. When you talked about starting or stopping aprescription medicine, did a doctor or other healthprovider ask you what you thought was best for you?
1 Yes2 No
13. Using any number from 0 to 10, where 0 is the worsthealth care possible and 10 is the best health carepossible, what number would you use to rate all yourhealth care in the last 12 months?Worst health care Best health carepossible possible0 1 2 3 4 5 6 7 8 9 10
UMP Plus.
Form approved: OMB No. 3206-0236
• Answer each question by marking the box to the left of your answer.• You are sometimes told to skip over some questions in this survey. When this happens you will see an arrow with a notethat tells you what question to answer next, like this:
Yes If Yes, Go to Question 1No
You may choose to answer this survey or not. If you choose not to, this will not affect the benefits you get. You maynotice a number on the cover of this survey. This number is ONLY used to let us know if you returned your survey so wedon’t have to send you reminders. If you want to know more about this study, please call 1-877-476-7538.
Thank you. Please return the completed survey inthe postage-paid envelope.
SPH AnalyticsAttn: Survey Processing DepartmentPO Box 100072, Duluth, GA 30096-9876Toll-Free: 1-877-499-2538
1113019, 1113020
This information collection has been approved by the U.S. Office of Management and Budget (Control Number 3206-0236) and is in compliance with the Paperwork Reduction Act of 1995. We estimate that it will take an average of 20minutes to complete, including the time to read instructions and to gather necessary information. You may send commentsabout our estimate or any suggestions for minimizing respondent burden, reducing completion time or any other aspectof this information collection to the U.S. Office of Personnel Management (OPM), Reports and Forms Officer (OMBNumber 3206-0236), Washington, DC 20415-7900. Your participation in this information collection is voluntary. The OMBNumber, 3206-0236, is currently valid. OPM may not collect this information, and you are not required to respond, unlessthis number is displayed.

72
14. In the last 12 months, how often was it easy to get thecare, tests, or treatment you needed?
1 Never2 Sometimes3 Usually4 Always
YOUR PERSONAL DOCTOR15. A personal doctor is the one you would see if you
need a check-up, want advice about a health problem,or get sick or hurt. Do you have a personal doctor?
1 Yes2 No If No, Go to Question 24
16. In the last 12 months, how many times did you visityour personal doctor to get care for yourself?
1 None If None, Go to Question 232 1 time3 24 35 46 5 to 97 10 or more times
17. In the last 12 months, how often did your personaldoctor explain things in a way that was easy tounderstand?
1 Never2 Sometimes3 Usually4 Always
18. In the last 12 months, how often did your personaldoctor listen carefully to you?
1 Never2 Sometimes3 Usually4 Always
19. In the last 12 months, how often did your personaldoctor show respect for what you had to say?
1 Never2 Sometimes3 Usually4 Always
20. In the last 12 months, how often did your personaldoctor spend enough time with you?
1 Never2 Sometimes3 Usually4 Always
21. In the last 12 months, did you get care from a doctoror other health provider besides your personaldoctor?
1 Yes2 No If No, Go to Question 23
22. In the last 12 months, how often did your personaldoctor seem informed and up-to-date about the careyou got from these doctors or other health providers?
1 Never2 Sometimes3 Usually4 Always
23. Using any number from 0 to 10, where 0 is the worstpersonal doctor possible and 10 is the best personaldoctor possible, what number would you use to rateyour personal doctor?Worst personal doctor Best personal doctorpossible possible0 1 2 3 4 5 6 7 8 9 10
GETTING HEALTH CARE FROM SPECIALISTSWhen you answer the next questions, do not include dentalvisits or care you got when you stayed overnight in ahospital.
24. Specialists are doctors like surgeons, heart doctors,allergy doctors, skin doctors, and other doctors whospecialize in one area of health care.
In the last 12 months, did you make any appointmentsto see a specialist?
1 Yes2 No If No, Go to Question 28
25. In the last 12 months, how often did you get anappointment to see a specialist as soon as youneeded?
1 Never2 Sometimes3 Usually4 Always
26. How many specialists have you seen in the last 12months?
1 None If None, Go to Question 282 1 specialist3 24 35 46 5 or more specialists
27. We want to know your rating of the specialist you sawmost often in the last 12 months. Using any numberfrom 0 to 10, where 0 is the worst specialist possibleand 10 is the best specialist possible, what numberwould you use to rate that specialist?Worst specialist Best specialistpossible possible0 1 2 3 4 5 6 7 8 9 10
YOUR HEALTH PLANThe next questions ask about your experience with yourhealth plan.
28. In the last 12 months, did you look for any informationin written materials or on the Internet about how yourhealth plan works?
1 Yes2 No If No, Go to Question 30
Please continue on the next page.
This page was intentionally left blank.

36
74. The following statements are about your health carecoverage and the policies and procedures of UMPPlus. Please state to what extent you agree ordisagree with each statement as I read each one.a) I know how to choose or find a doctor in my plan’s
network.1 Strongly Agree2 Agree3 Neither Agree nor Disagree4 Disagree5 Strongly Disagree6 Don’t know
b) I know what to do when I or a family member needsurgent or emergency care.
1 Strongly Agree2 Agree3 Neither Agree nor Disagree4 Disagree5 Strongly Disagree6 Don’t know
c) I understand what services are covered and notcovered in my plan.
1 Strongly Agree2 Agree3 Neither Agree nor Disagree4 Disagree5 Strongly Disagree6 Don’t know
d) I understand when I need a referral to a specialist1 Strongly Agree2 Agree3 Neither Agree nor Disagree4 Disagree5 Strongly Disagree6 Don’t know
e) I know how much I have to pay (co-pay) at thedoctor’s office for a preventive care visit.
1 Strongly Agree2 Agree3 Neither Agree nor Disagree4 Disagree5 Strongly Disagree6 Don’t know
f) I know which services are subject to a deductibleunder my coverage plan.
1 Strongly Agree2 Agree3 Neither Agree nor Disagree4 Disagree5 Strongly Disagree6 Don’t know
g) I understand my right to appeal a claims or coveragedecision.
1 Strongly Agree2 Agree3 Neither Agree nor Disagree4 Disagree5 Strongly Disagree6 Don’t know
h) I understand my plan’s prescription drug coverage (ifyou have it).
1 Strongly Agree2 Agree3 Neither Agree nor Disagree4 Disagree5 Strongly Disagree6 Don’t know
i) I understand my health care rights for privacy andconfidentiality
1 Strongly Agree2 Agree3 Neither Agree nor Disagree4 Disagree5 Strongly Disagree6 Don’t know
29. In the last 12 months, how often did the writtenmaterials or the Internet provide the information youneeded about how your health plan works?
1 Never2 Sometimes3 Usually4 Always
30. Sometimes people need services or equipmentbeyond what is provided in a regular or routine officevisit, such as care from a specialist, physical therapy,a hearing aid, or oxygen.
In the last 12 months, did you look for informationfrom your health plan on how much you would haveto pay for a health care service or equipment?
1 Yes2 No If No, Go to Question 32
31. In the last 12 months, how often were you able to findout from your health plan how much you would haveto pay for a health care service or equipment?
1 Never2 Sometimes3 Usually4 Always
32. In some health plans the amount you pay for aprescription medicine can be different for differentmedicines, or can be different for prescriptions filledby mail instead of at the pharmacy.
In the last 12 months, did you look for informationfrom your health plan on how much you would haveto pay for specific prescription medicines?
1 Yes2 No If No, Go to Question 34
33. In the last 12 months, how often were you able to findout from your health plan how much you would haveto pay for specific prescription medicines?
1 Never2 Sometimes3 Usually4 Always
34. In the last 12 months, did you get information or helpfrom your health plan’s customer service?
1 Yes2 No If No, Go to Question 37
35. In the last 12 months, how often did your health plan’scustomer service give you the information or help youneeded?
1 Never2 Sometimes3 Usually4 Always
36. In the last 12 months, how often did your health plan’scustomer service staff treat you with courtesy andrespect?
1 Never2 Sometimes3 Usually4 Always
37. In the last 12 months, did your health plan give youany forms to fill out?
1 Yes2 No If No, Go to Question 39
38. In the last 12 months, how often were the forms fromyour health plan easy to fill out?
1 Never2 Sometimes3 Usually4 Always
39. Claims are sent to a health plan for payment. You maysend in the claims yourself, or doctors, hospitals, orothers may do this for you. In the last 12 months, didyou or anyone else send in any claims for your care toyour health plan?
1 Yes2 No If No, Go to Question 423 Don’t know If Don’t know, Go to Question 42
40. In the last 12 months, how often did your health planhandle your claims quickly?
1 Never2 Sometimes3 Usually4 Always5 Don’t know
41. In the last 12 months, how often did your health planhandle your claims correctly?
1 Never2 Sometimes3 Usually4 Always5 Don’t know
42. Using any number from 0 to 10, where 0 is the worsthealth plan possible and 10 is the best health planpossible, what number would you use to rate yourhealth plan?Worst health plan Best health planpossible possible0 1 2 3 4 5 6 7 8 9 10
ABOUT YOU43. In general, how would you rate your overall health?
1 Excellent2 Very good3 Good4 Fair5 Poor
44. In general, how would you rate your overall mental oremotional health?
1 Excellent2 Very good3 Good4 Fair5 Poor
45. Have you had either a flu shot or flu spray in the nosesince July 1, 2015?
1 Yes2 No3 Don’t know
Please continue on the next page.

54
46. Do you now smoke cigarettes or use tobacco everyday, some days, or not at all?
1 Every day2 Some days3 Not at all If Not at all, Go to Question 504 Don’t know If Don’t know, Go to Question 50
47. In the last 12 months, how often were you advised toquit smoking or using tobacco by a doctor or otherhealth provider in your plan?
1 Never2 Sometimes3 Usually4 Always
48. In the last 12 months, how often was medicationrecommended or discussed by a doctor or healthprovider to assist you with quitting smoking or usingtobacco? Examples of medication are: nicotine gum,patch, nasal spray, inhaler, or prescriptionmedication.
1 Never2 Sometimes3 Usually4 Always
49. In the last 12 months, how often did your doctor orhealth provider discuss or provide methods andstrategies other than medication to assist you withquitting smoking or using tobacco? Examples ofmethods and strategies are: telephone helpline,individual or group counseling, or cessation program.
1 Never2 Sometimes3 Usually4 Always
50. Do you take aspirin daily or every other day?1 Yes2 No3 Don’t know
51. Do you have a health problem or take medication thatmakes taking aspirin unsafe for you?
1 Yes2 No3 Don’t know
52. Has a doctor or health provider ever discussed withyou the risks and benefits of aspirin to prevent heartattack or stroke?
1 Yes2 No
53. Are you aware that you have any of the followingconditions? Mark one or more.
A High cholesterolB High blood pressureC Parent or sibling with heart attack before the age of 60
54. Has a doctor ever told you that you have any of thefollowing conditions? Mark one or more.
A A heart attackB Angina or coronary heart diseaseC A strokeD Any kind of diabetes or high blood sugar
55. In the last 12 months, did you get health care 3 ormore times for the same condition or problem?
1 Yes2 No If No, Go to Question 57
56. Is this a condition or problem that has lasted for atleast 3 months? Do not include pregnancy ormenopause.
1 Yes2 No
57. Do you now need or take medicine prescribed by adoctor? Do not include birth control.
1 Yes2 No If No, Go to Question 59
58. Is this medicine to treat a condition that has lasted forat least 3 months? Do not include pregnancy ormenopause.
1 Yes2 No
59. What is your age?1 18 to 242 25 to 343 35 to 444 45 to 545 55 to 646 65 to 747 75 or older
60. Are you male or female?1 Male2 Female
61. What is the highest grade or level of school that youhave completed?
1 8th grade or less2 Some high school, but did not graduate3 High school graduate or GED4 Some college or 2-year degree5 4-year college graduate6 More than 4-year college degree
62. Are you of Hispanic or Latino origin or descent?1 Yes, Hispanic or Latino2 No, Not Hispanic or Latino
63. What is your race? Mark one or more.A WhiteB Black or African-AmericanC AsianD Native Hawaiian or other Pacific IslanderE American Indian or Alaska NativeF Other
64. Did someone help you complete this survey?1 Yes If Yes, Go to Question 652 No If No, Go to Question 66
65. How did that person help you? Mark one or more.A Read the questions to meB Wrote down the answers I gaveC Answered the questions for meD Translated the questions into my languageE Helped in some other way
66. In the last 12 months, have you visited your healthplan’s website?
1 Yes2 No3 I don’t use or have convenient access to the Internet
67. How would you rate your understanding of thebenefits your health plan offers?
1 Excellent2 Very good3 Good4 Fair5 Poor
68. If you had a problem understanding the benefits yourhealth plan offers, which type(s) of benefits were youunable to understand? (Mark all that apply.)
A Copays, coinsurance, deductiblesB Pharmacy benefits and the plan formularyC Inpatient hospitalizationD Emergency careE In-network versus Out-of-network careF Lab and radiologyG Preventive careH Other
69. Would you recommend your health plan to yourfamily or friends?
1 Definitely yes2 Probably yes3 Probably no4 Definitely no
70. Do you intend to switch to a different health planwhen you next have an opportunity?
1 Definitely no2 Probably no3 Probably yes4 Definitely yes
Questions below ask about your prescription drug plan’scustomer service (provided by Washington State RxServices).
71. In the last 12 months, did you call or were youtransferred by your health plan to Washington StateRx Services?
1 Yes If Yes, Go to Question 722 No Thank you. Please return the completed
survey in the postage-paid envelope.72. In the last 12 months, how often were you able to get
the help you needed when you called WashingtonState Rx Services?
1 Never2 Sometimes3 Usually4 Always
Thinking about all of the materials and correspondence youhave received for UMP Plus:
73. Please state your level of agreement with thefollowing:a) I liked the overall format and appearance of the
written materials1 Strongly Agree2 Agree3 Neither Agree nor Disagree4 Disagree5 Strongly Disagree6 Don’t know
b) The new member materials were easy to understand1 Strongly Agree2 Agree3 Neither Agree nor Disagree4 Disagree5 Strongly Disagree6 Don’t know
c) The written materials helped me to understand thehealth plan’s policies and procedures.
1 Strongly Agree2 Agree3 Neither Agree nor Disagree4 Disagree5 Strongly Disagree6 Don’t know
d) The new member written materials are an effectiveway to provide health benefit information.
1 Strongly Agree2 Agree3 Neither Agree nor Disagree4 Disagree5 Strongly Disagree6 Don’t know
e) The written materials helped me to understand myout-of-pocket expenses.
1 Strongly Agree2 Agree3 Neither Agree nor Disagree4 Disagree5 Strongly Disagree6 Don’t know
f) The written materials I received from UMP ClassicPlan accurately described the health care coverage Iselected.
1 Strongly Agree2 Agree3 Neither Agree nor Disagree4 Disagree5 Strongly Disagree6 Don’t know
Please continue on the next page.

2016 Final Report for UMP UW MEDICINE ACCOUNTABLE CARE NETWORK Consumer Assessment of Healthcare Providers and Systems (CAHPS®) Survey
SPH Analytics Commercial Adult Survey – 2016 10-1
10. Banner Tables The tables in the following section show detailed results for each question in your survey. Responses are organized across the banner table by: (1) all respondents, (2) demographic groups (Age, Education, Gender, Ethnicity, Race, Health Status, and Mental Health Status), (3) survey items, and (4) data collection method. In order to aid you in viewing the data contained in these tables, the following explanation is provided. The different categories by which the data are “sliced” are presented as column headers. Each category has a set of possible response choices that are listed immediately below the headers. The left-most column in each table is labeled “Total” and shows results for the entire set of valid responses. On the left side of the page are three row headers: “Total Eligible,” “Total Valid Responses,” and “No Answer.” “Total Eligible” represents the number of possible responses that meet the criteria for inclusion into the given question. For questions that are asked of all respondents, this figure will typically equal 176, which is the valid number of responses to the current survey. “Total Valid Responses” shows how many of the total respondents provided valid answers to the given question. Finally, “No Answer” is the number of individuals who did not respond to the question, even though they were eligible to do so. It should be noted that, in some cases, a survey response choice shows only the number of respondents providing that answer with no percentage. These response options are not considered valid responses by NCQA guidelines, and are therefore omitted from the percentage calculations. In some tables, an additional row is added to show Summary Rates. These scores are a single question response or combination of question responses considered to be favorable. It is included at the bottom of each of these tables and is shown with the response option, or options, that make up the score listed beside it. Information regarding the statistical testing of results is shown in the lower left corner of each table. The first line displays the Comparison Groups. These are the columns (denoted by upper case letters and separated by a slash (/)) in which statistical tests are run. Columns (B) and (C), for example, show results for Males and Females. These columns are compared in the statistical test to each other, but not to any other columns. If a letter is present, whether upper or lower case, its corresponding percentage is significantly higher than the specified percentages within its comparison group. Note that when comparing groups, the Z-Test is only valid for large sample sizes. See Z-Test in Technical Notes. The second line shows the type or types of statistical tests that are included in the table. The last two lines define the meaning of the upper and lower case letters.
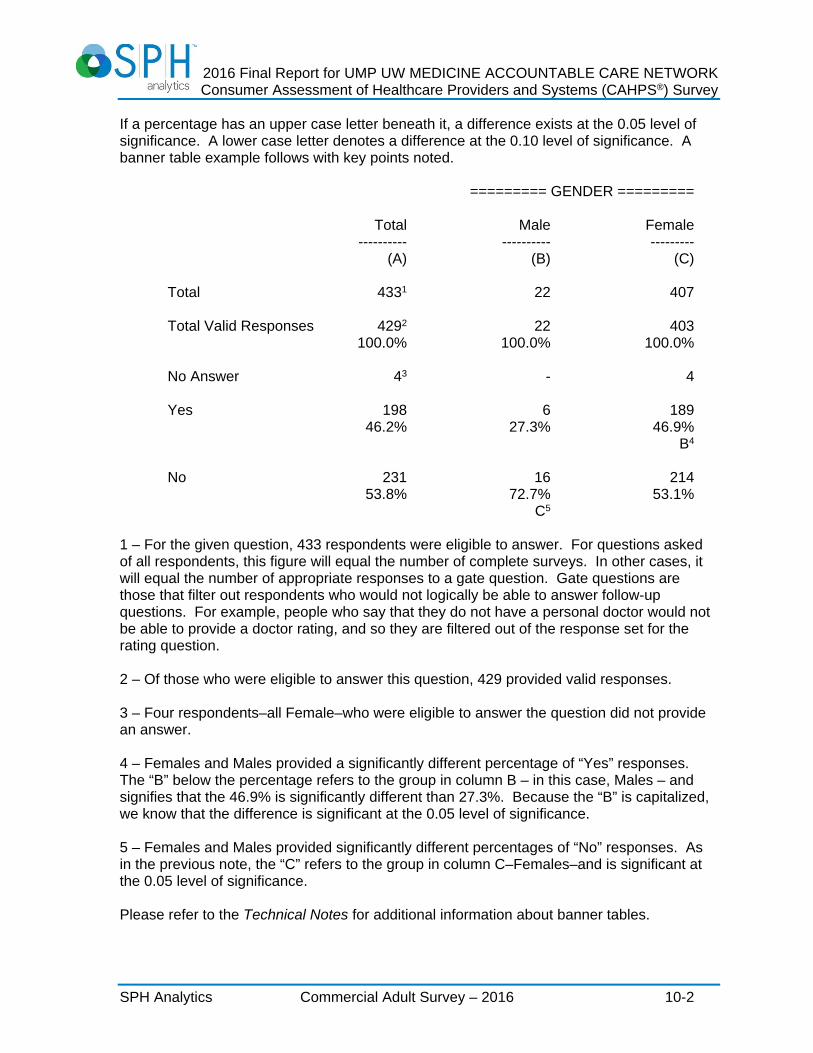
2016 Final Report for UMP UW MEDICINE ACCOUNTABLE CARE NETWORK Consumer Assessment of Healthcare Providers and Systems (CAHPS®) Survey
SPH Analytics Commercial Adult Survey – 2016 10-2
If a percentage has an upper case letter beneath it, a difference exists at the 0.05 level of significance. A lower case letter denotes a difference at the 0.10 level of significance. A banner table example follows with key points noted. ========= GENDER =========
Total Male Female ---------- ---------- --------- (A) (B) (C) Total 4331 22 407 Total Valid Responses 4292 22 403 100.0% 100.0% 100.0% No Answer 43 - 4 Yes 198 6 189 46.2% 27.3% 46.9% B4 No 231 16 214 53.8% 72.7% 53.1% C5
1 – For the given question, 433 respondents were eligible to answer. For questions asked of all respondents, this figure will equal the number of complete surveys. In other cases, it will equal the number of appropriate responses to a gate question. Gate questions are those that filter out respondents who would not logically be able to answer follow-up questions. For example, people who say that they do not have a personal doctor would not be able to provide a doctor rating, and so they are filtered out of the response set for the rating question. 2 – Of those who were eligible to answer this question, 429 provided valid responses. 3 – Four respondents–all Female–who were eligible to answer the question did not provide an answer. 4 – Females and Males provided a significantly different percentage of “Yes” responses. The “B” below the percentage refers to the group in column B – in this case, Males – and signifies that the 46.9% is significantly different than 27.3%. Because the “B” is capitalized, we know that the difference is significant at the 0.05 level of significance. 5 – Females and Males provided significantly different percentages of “No” responses. As in the previous note, the “C” refers to the group in column C–Females–and is significant at the 0.05 level of significance. Please refer to the Technical Notes for additional information about banner tables.
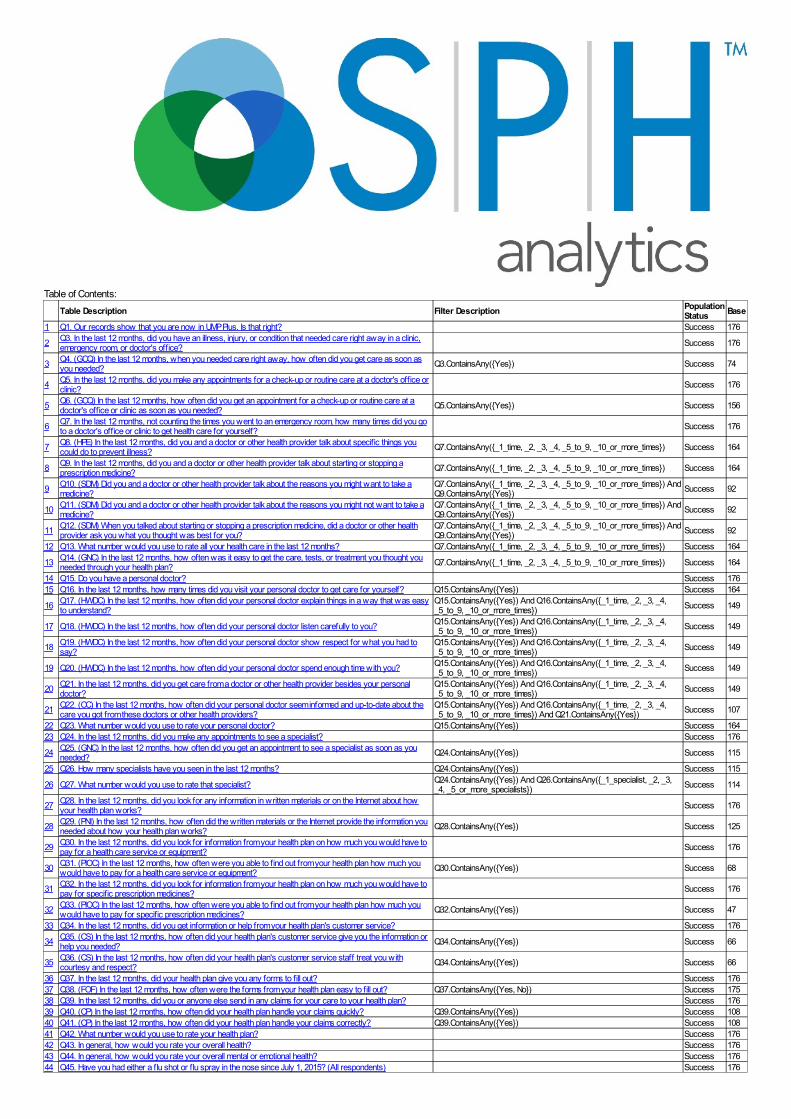
Table of Contents:
Table Description Filter Description PopulationStatus Base
1 Q1. Our records show that you are now in UMP Plus. Is that right? Success 176
2 Q3. In the last 12 months, did you have an illness, injury, or condition that needed care right away in a clinic,emergency room, or doctor's office? Success 176
3 Q4. (GCQ) In the last 12 months, when you needed care right away, how often did you get care as soon asyou needed? Q3.ContainsAny({Yes}) Success 74
4 Q5. In the last 12 months, did you make any appointments for a check-up or routine care at a doctor's office orclinic? Success 176
5 Q6. (GCQ) In the last 12 months, how often did you get an appointment for a check-up or routine care at adoctor's office or clinic as soon as you needed? Q5.ContainsAny({Yes}) Success 156
6 Q7. In the last 12 months, not counting the times you went to an emergency room, how many times did you goto a doctor's office or clinic to get health care for yourself? Success 176
7 Q8. (HPE) In the last 12 months, did you and a doctor or other health provider talk about specific things youcould do to prevent illness? Q7.ContainsAny({_1_time, _2, _3, _4, _5_to_9, _10_or_more_times}) Success 164
8 Q9. In the last 12 months, did you and a doctor or other health provider talk about starting or stopping aprescription medicine? Q7.ContainsAny({_1_time, _2, _3, _4, _5_to_9, _10_or_more_times}) Success 164
9 Q10. (SDM) Did you and a doctor or other health provider talk about the reasons you might want to take amedicine?
Q7.ContainsAny({_1_time, _2, _3, _4, _5_to_9, _10_or_more_times}) AndQ9.ContainsAny({Yes}) Success 92
10 Q11. (SDM) Did you and a doctor or other health provider talk about the reasons you might not want to take amedicine?
Q7.ContainsAny({_1_time, _2, _3, _4, _5_to_9, _10_or_more_times}) AndQ9.ContainsAny({Yes}) Success 92
11 Q12. (SDM) When you talked about starting or stopping a prescription medicine, did a doctor or other healthprovider ask you what you thought was best for you?
Q7.ContainsAny({_1_time, _2, _3, _4, _5_to_9, _10_or_more_times}) AndQ9.ContainsAny({Yes}) Success 92
12 Q13. What number would you use to rate all your health care in the last 12 months? Q7.ContainsAny({_1_time, _2, _3, _4, _5_to_9, _10_or_more_times}) Success 164
13 Q14. (GNC) In the last 12 months, how often was it easy to get the care, tests, or treatment you thought youneeded through your health plan? Q7.ContainsAny({_1_time, _2, _3, _4, _5_to_9, _10_or_more_times}) Success 164
14 Q15. Do you have a personal doctor? Success 17615 Q16. In the last 12 months, how many times did you visit your personal doctor to get care for yourself? Q15.ContainsAny({Yes}) Success 164
16 Q17. (HWDC) In the last 12 months, how often did your personal doctor explain things in a way that was easyto understand?
Q15.ContainsAny({Yes}) And Q16.ContainsAny({_1_time, _2, _3, _4,_5_to_9, _10_or_more_times}) Success 149
17 Q18. (HWDC) In the last 12 months, how often did your personal doctor listen carefully to you? Q15.ContainsAny({Yes}) And Q16.ContainsAny({_1_time, _2, _3, _4,_5_to_9, _10_or_more_times}) Success 149
18 Q19. (HWDC) In the last 12 months, how often did your personal doctor show respect for what you had tosay?
Q15.ContainsAny({Yes}) And Q16.ContainsAny({_1_time, _2, _3, _4,_5_to_9, _10_or_more_times}) Success 149
19 Q20. (HWDC) In the last 12 months, how often did your personal doctor spend enough time with you? Q15.ContainsAny({Yes}) And Q16.ContainsAny({_1_time, _2, _3, _4,_5_to_9, _10_or_more_times}) Success 149
20 Q21. In the last 12 months, did you get care from a doctor or other health provider besides your personaldoctor?
Q15.ContainsAny({Yes}) And Q16.ContainsAny({_1_time, _2, _3, _4,_5_to_9, _10_or_more_times}) Success 149
21 Q22. (CC) In the last 12 months, how often did your personal doctor seem informed and up-to-date about thecare you got from these doctors or other health providers?
Q15.ContainsAny({Yes}) And Q16.ContainsAny({_1_time, _2, _3, _4,_5_to_9, _10_or_more_times}) And Q21.ContainsAny({Yes}) Success 107
22 Q23. What number would you use to rate your personal doctor? Q15.ContainsAny({Yes}) Success 16423 Q24. In the last 12 months, did you make any appointments to see a specialist? Success 176
24 Q25. (GNC) In the last 12 months, how often did you get an appointment to see a specialist as soon as youneeded? Q24.ContainsAny({Yes}) Success 115
25 Q26. How many specialists have you seen in the last 12 months? Q24.ContainsAny({Yes}) Success 115
26 Q27. What number would you use to rate that specialist? Q24.ContainsAny({Yes}) And Q26.ContainsAny({_1_specialist, _2, _3,_4, _5_or_more_specialists}) Success 114
27 Q28. In the last 12 months, did you look for any information in written materials or on the Internet about howyour health plan works? Success 176
28 Q29. (PNI) In the last 12 months, how often did the written materials or the Internet provide the information youneeded about how your health plan works? Q28.ContainsAny({Yes}) Success 125
29 Q30. In the last 12 months, did you look for information from your health plan on how much you would have topay for a health care service or equipment? Success 176
30 Q31. (PIOC) In the last 12 months, how often were you able to find out from your health plan how much youwould have to pay for a health care service or equipment? Q30.ContainsAny({Yes}) Success 68
31 Q32. In the last 12 months, did you look for information from your health plan on how much you would have topay for specific prescription medicines? Success 176
32 Q33. (PIOC) In the last 12 months, how often were you able to find out from your health plan how much youwould have to pay for specific prescription medicines? Q32.ContainsAny({Yes}) Success 47
33 Q34. In the last 12 months, did you get information or help from your health plan's customer service? Success 176
34 Q35. (CS) In the last 12 months, how often did your health plan's customer service give you the information orhelp you needed? Q34.ContainsAny({Yes}) Success 66
35 Q36. (CS) In the last 12 months, how often did your health plan's customer service staff treat you withcourtesy and respect? Q34.ContainsAny({Yes}) Success 66
36 Q37. In the last 12 months, did your health plan give you any forms to fill out? Success 17637 Q38. (FOF) In the last 12 months, how often were the forms from your health plan easy to fill out? Q37.ContainsAny({Yes, No}) Success 17538 Q39. In the last 12 months, did you or anyone else send in any claims for your care to your health plan? Success 17639 Q40. (CP) In the last 12 months, how often did your health plan handle your claims quickly? Q39.ContainsAny({Yes}) Success 10840 Q41. (CP) In the last 12 months, how often did your health plan handle your claims correctly? Q39.ContainsAny({Yes}) Success 10841 Q42. What number would you use to rate your health plan? Success 17642 Q43. In general, how would you rate your overall health? Success 17643 Q44. In general, how would you rate your overall mental or emotional health? Success 17644 Q45. Have you had either a flu shot or flu spray in the nose since July 1, 2015? (All respondents) Success 176

45 Q45. (HEDIS) Have you had either a flu shot or flu spray in the nose since July 1, 2015? (Respondents 18-64years as of July 1 of the measurement year) fage = 1 Success 163
46 Q46. Do you now smoke cigarettes or use tobacco every day, some days, or not at all? Success 176
47 Q47. (HEDIS) In the last 12 months, how often were you advised to quit smoking or using tobacco by a doctoror other health provider in your plan? Q46.ContainsAny({Every_day, Some_days}) Success 4
48 Q48. (HEDIS) In the last 12 months, how often was medication recommended or discussed by a doctor orhealth provider to assist you with quitting smoking or using tobacco? Q46.ContainsAny({Every_day, Some_days}) Success 4
49 Q49. (HEDIS) In the last 12 months, how often did your doctor or health provider discuss or provide methodsand strategies other than medication to assist you with quitting smoking or using tobacco? Q46.ContainsAny({Every_day, Some_days}) Success 4
50 Q50. Do you take aspirin daily or every other day? (All respondents) Success 17651 HEDIS Measure: Aspirin Use Success 17652 Q51. Do you have a health problem or take medication that makes taking aspirin unsafe for you? Success 176
53 Q52. Has a doctor or health provider ever discussed with you the risks and benefits of aspirin to prevent heartattack or stroke? (All respondents) Success 176
54 HEDIS Measure: Aspirin Risks and Benefits Success 17655 Q53. Are you aware that you have any of the following conditions? Check all that apply. Success 17656 Q54. Has a doctor ever told you that you have any of the following conditions? Check all that apply. Success 176
57 Q55. In the last 12 months, have you seen a doctor or other health provider 3 or more times for the samecondition or problem? Success 176
58 Q56. Is this a condition or problem that has lasted for at least 3 months? Do not include pregnancy ormenopause. Q55.ContainsAny({Yes}) Success 60
59 Q57. Do you now need or take medicine prescribed by a doctor? Do not include birth control. Success 17660 Q58. Is this to treat a condition that has lasted for at least 3 months? Do not include pregnancy or menopause. Q57.ContainsAny({Yes}) Success 11061 Q59. What is your age? Success 17662 Q60. Are you male or female? Success 17663 Q61. What is the highest grade or level of school that you have completed? Success 17664 Q62. Are you of Hispanic or Latino origin or descent? Success 17665 Q63. What is your race? Please mark one or more. Success 17666 Q64. Did someone help you complete this survey? Dispo.ContainsAny({Internet, Mail}) Success 17667 Q65. How did that person help you? Check all that apply. Q64.ContainsAny({Yes}) And Dispo.ContainsAny({Internet, Mail}) Success 468 Q1. Our records show that you are now in UMP Plus. Is that right? Success 176
69 Q3. In the last 12 months, did you have an illness, injury, or condition that needed care right away in a clinic,emergency room, or doctor's office? Success 176
70 Q4. (GCQ) In the last 12 months, when you needed care right away, how often did you get care as soon asyou needed? Q3.ContainsAny({Yes}) Success 74
71 Q5. In the last 12 months, did you make any appointments for a check-up or routine care at a doctor's office orclinic? Success 176
72 Q6. (GCQ) In the last 12 months, how often did you get an appointment for a check-up or routine care at adoctor's office or clinic as soon as you needed? Q5.ContainsAny({Yes}) Success 156
73 Q7. In the last 12 months, not counting the times you went to an emergency room, how many times did you goto a doctor's office or clinic to get health care for yourself? Success 176
74 Q8. (HPE) In the last 12 months, did you and a doctor or other health provider talk about specific things youcould do to prevent illness? Q7.ContainsAny({_1_time, _2, _3, _4, _5_to_9, _10_or_more_times}) Success 164
75 Q9. In the last 12 months, did you and a doctor or other health provider talk about starting or stopping aprescription medicine? Q7.ContainsAny({_1_time, _2, _3, _4, _5_to_9, _10_or_more_times}) Success 164
76 Q10. (SDM) Did you and a doctor or other health provider talk about the reasons you might want to take amedicine?
Q7.ContainsAny({_1_time, _2, _3, _4, _5_to_9, _10_or_more_times}) AndQ9.ContainsAny({Yes}) Success 92
77 Q11. (SDM) Did you and a doctor or other health provider talk about the reasons you might not want to take amedicine?
Q7.ContainsAny({_1_time, _2, _3, _4, _5_to_9, _10_or_more_times}) AndQ9.ContainsAny({Yes}) Success 92
78 Q12. (SDM) When you talked about starting or stopping a prescription medicine, did a doctor or other healthprovider ask you what you thought was best for you?
Q7.ContainsAny({_1_time, _2, _3, _4, _5_to_9, _10_or_more_times}) AndQ9.ContainsAny({Yes}) Success 92
79 Q13. What number would you use to rate all your health care in the last 12 months? Q7.ContainsAny({_1_time, _2, _3, _4, _5_to_9, _10_or_more_times}) Success 164
80 Q14. (GNC) In the last 12 months, how often was it easy to get the care, tests, or treatment you thought youneeded through your health plan? Q7.ContainsAny({_1_time, _2, _3, _4, _5_to_9, _10_or_more_times}) Success 164
81 Q15. Do you have a personal doctor? Success 17682 Q16. In the last 12 months, how many times did you visit your personal doctor to get care for yourself? Q15.ContainsAny({Yes}) Success 164
83 Q17. (HWDC) In the last 12 months, how often did your personal doctor explain things in a way that was easyto understand?
Q15.ContainsAny({Yes}) And Q16.ContainsAny({_1_time, _2, _3, _4,_5_to_9, _10_or_more_times}) Success 149
84 Q18. (HWDC) In the last 12 months, how often did your personal doctor listen carefully to you? Q15.ContainsAny({Yes}) And Q16.ContainsAny({_1_time, _2, _3, _4,_5_to_9, _10_or_more_times}) Success 149
85 Q19. (HWDC) In the last 12 months, how often did your personal doctor show respect for what you had tosay?
Q15.ContainsAny({Yes}) And Q16.ContainsAny({_1_time, _2, _3, _4,_5_to_9, _10_or_more_times}) Success 149
86 Q20. (HWDC) In the last 12 months, how often did your personal doctor spend enough time with you? Q15.ContainsAny({Yes}) And Q16.ContainsAny({_1_time, _2, _3, _4,_5_to_9, _10_or_more_times}) Success 149
87 Q21. In the last 12 months, did you get care from a doctor or other health provider besides your personaldoctor?
Q15.ContainsAny({Yes}) And Q16.ContainsAny({_1_time, _2, _3, _4,_5_to_9, _10_or_more_times}) Success 149
88 Q22. (CC) In the last 12 months, how often did your personal doctor seem informed and up-to-date about thecare you got from these doctors or other health providers?
Q15.ContainsAny({Yes}) And Q16.ContainsAny({_1_time, _2, _3, _4,_5_to_9, _10_or_more_times}) And Q21.ContainsAny({Yes}) Success 107
89 Q23. What number would you use to rate your personal doctor? Q15.ContainsAny({Yes}) Success 16490 Q24. In the last 12 months, did you make any appointments to see a specialist? Success 176
91 Q25. (GNC) In the last 12 months, how often did you get an appointment to see a specialist as soon as youneeded? Q24.ContainsAny({Yes}) Success 115
92 Q26. How many specialists have you seen in the last 12 months? Q24.ContainsAny({Yes}) Success 115
93 Q27. What number would you use to rate that specialist? Q24.ContainsAny({Yes}) And Q26.ContainsAny({_1_specialist, _2, _3,_4, _5_or_more_specialists}) Success 114
94 Q28. In the last 12 months, did you look for any information in written materials or on the Internet about howyour health plan works? Success 176
95 Q29. (PNI) In the last 12 months, how often did the written materials or the Internet provide the information youneeded about how your health plan works? Q28.ContainsAny({Yes}) Success 125
96 Q30. In the last 12 months, did you look for information from your health plan on how much you would have topay for a health care service or equipment? Success 176
97 Q31. (PIOC) In the last 12 months, how often were you able to find out from your health plan how much youwould have to pay for a health care service or equipment? Q30.ContainsAny({Yes}) Success 68
98 Q32. In the last 12 months, did you look for information from your health plan on how much you would have topay for specific prescription medicines? Success 176
99 Q33. (PIOC) In the last 12 months, how often were you able to find out from your health plan how much youwould have to pay for specific prescription medicines? Q32.ContainsAny({Yes}) Success 47
100 Q34. In the last 12 months, did you get information or help from your health plan's customer service? Success 176
101 Q35. (CS) In the last 12 months, how often did your health plan's customer service give you the information orhelp you needed? Q34.ContainsAny({Yes}) Success 66
102 Q36. (CS) In the last 12 months, how often did your health plan's customer service staff treat you withcourtesy and respect? Q34.ContainsAny({Yes}) Success 66
103 Q37. In the last 12 months, did your health plan give you any forms to fill out? Success 176104 Q38. (FOF) In the last 12 months, how often were the forms from your health plan easy to fill out? Q37.ContainsAny({Yes, No}) Success 175105 Q39. In the last 12 months, did you or anyone else send in any claims for your care to your health plan? Success 176106 Q40. (CP) In the last 12 months, how often did your health plan handle your claims quickly? Q39.ContainsAny({Yes}) Success 108107 Q41. (CP) In the last 12 months, how often did your health plan handle your claims correctly? Q39.ContainsAny({Yes}) Success 108108 Q42. What number would you use to rate your health plan? Success 176

109 Q43. In general, how would you rate your overall health? Success 176110 Q44. In general, how would you rate your overall mental or emotional health? Success 176111 Q45. Have you had either a flu shot or flu spray in the nose since July 1, 2015? (All respondents) Success 176
112 Q45. (HEDIS) Have you had either a flu shot or flu spray in the nose since July 1, 2015? (Respondents 18-64years as of July 1 of the measurement year) fage = 1 Success 163
113 Q46. Do you now smoke cigarettes or use tobacco every day, some days, or not at all? Success 176
114 Q47. (HEDIS) In the last 12 months, how often were you advised to quit smoking or using tobacco by a doctoror other health provider in your plan? Q46.ContainsAny({Every_day, Some_days}) Success 4
115 Q48. (HEDIS) In the last 12 months, how often was medication recommended or discussed by a doctor orhealth provider to assist you with quitting smoking or using tobacco? Q46.ContainsAny({Every_day, Some_days}) Success 4
116 Q49. (HEDIS) In the last 12 months, how often did your doctor or health provider discuss or provide methodsand strategies other than medication to assist you with quitting smoking or using tobacco? Q46.ContainsAny({Every_day, Some_days}) Success 4
117 Q50. Do you take aspirin daily or every other day? (All respondents) Success 176118 HEDIS Measure: Aspirin Use Success 176119 Q51. Do you have a health problem or take medication that makes taking aspirin unsafe for you? Success 176
120 Q52. Has a doctor or health provider ever discussed with you the risks and benefits of aspirin to prevent heartattack or stroke? (All respondents) Success 176
121 HEDIS Measure: Aspirin Risks and Benefits Success 176122 Q53. Are you aware that you have any of the following conditions? Check all that apply. Success 176123 Q54. Has a doctor ever told you that you have any of the following conditions? Check all that apply. Success 176
124 Q55. In the last 12 months, have you seen a doctor or other health provider 3 or more times for the samecondition or problem? Success 176
125 Q56. Is this a condition or problem that has lasted for at least 3 months? Do not include pregnancy ormenopause. Q55.ContainsAny({Yes}) Success 60
126 Q57. Do you now need or take medicine prescribed by a doctor? Do not include birth control. Success 176127 Q58. Is this to treat a condition that has lasted for at least 3 months? Do not include pregnancy or menopause. Q57.ContainsAny({Yes}) Success 110128 Q59. What is your age? Success 176129 Q60. Are you male or female? Success 176130 Q61. What is the highest grade or level of school that you have completed? Success 176131 Q62. Are you of Hispanic or Latino origin or descent? Success 176132 Q63. What is your race? Please mark one or more. Success 176133 Q64. Did someone help you complete this survey? Dispo.ContainsAny({Internet, Mail}) Success 176134 Q65. How did that person help you? Check all that apply. Q64.ContainsAny({Yes}) And Dispo.ContainsAny({Internet, Mail}) Success 4

Q1. Our records show that you are now in UMPPlus. Is that right?
Regence BCBS2016 CAHPS 5.0H Commercial Adult Survey (1113020)
Table: 1Level: Top
AGE (Q59) EDUCATION(Q61)
GENDER(Q60)
ETHNICITY(Q62) RACE (Q63) HEALTH STATUS
(Q43)MENTAL HEALTH
(Q44)
Total 18 to34
35 to44
45 to54
55 orolder
HS/GED/Less
SomeColg/Grad+
Male Female Hispanicor Latino
NotHispanicor Latino
WhiteBlack orAfrican-
AmericanOther
Excellent/Verygood
Good Fair/Poor
Excellent/Verygood
Good Fair/Poor
A B C D E F G H I J K L M N O P Q R S
Q1. Our records show that you are now in UMP Plus. Is that right?
Total Eligible176 26 29 34 86 7 168 60 116 9 160 137 6 39 107 55 14 129 35 10
100.0% 100.0% 100.0% 100.0% 100.0% 100.0% 100.0% 100.0% 100.0% 100.0% 100.0% 100.0% 100.0% 100.0% 100.0% 100.0% 100.0% 100.0% 100.0% 100.0%
Total ValidResponses
174 26 29 34 84 7 166 59 115 9 158 135 6 39 106 55 13 127 35 10100.0% 100.0% 100.0% 100.0% 100.0% 100.0% 100.0% 100.0% 100.0% 100.0% 100.0% 100.0% 100.0% 100.0% 100.0% 100.0% 100.0% 100.0% 100.0% 100.0%
No Answer2 - - - 2 - 2 1 1 - 2 2 - - 1 - 1 2 - -
Yes174 26 29 34 84 7 166 59 115 9 158 135 6 39 106 55 13 127 35 10
100.0%100.0% 100.0% 100.0% 100.0% 100.0% 100.0% 100.0% 100.0% 100.0% 100.0% 100.0% 100.0% 100.0% 100.0% 100.0% 100.0% 100.0% 100.0% 100.0% ** ** ** ** ** ** **
No- - - - - - - - - - - - - - - - - - - -- - - - - - - - - - - - - - - - - - - - ** ** ** ** ** ** **
HEDIS/CAHPSSUMMARYRATE - Yes
174 26 29 34 84 7 166 59 115 9 158 135 6 39 106 55 13 127 35 10100.0%100.0% 100.0% 100.0% 100.0% 100.0% 100.0% 100.0% 100.0% 100.0% 100.0% 100.0% 100.0% 100.0% 100.0% 100.0% 100.0% 100.0% 100.0% 100.0%
** ** ** ** ** ** **
Cell Contents: - Count- Column Percentage- Statistical Test ResultsStatistics: Overlap formulae used- Column Proportions: Columns Tested (5%): A/B/C/D, E/F, G/H, I/J,K/L/M, N/O/P, Q/R/S, (10%): a/b/c/d, e/f, g/h, i/j,k/l/m, n/o/p, q/r/s Minimum Base: 30 (**), Small Base: 30 (*)
Presented by SPH Analytics770-978-3173
2016

Q3. In the last 12 months, did you have an illness,injury, or condition that needed care right away in aclinic, emergency room, or doctor's office?
Regence BCBS2016 CAHPS 5.0H Commercial Adult Survey (1113020)
Table: 2Level: Top
AGE (Q59) EDUCATION(Q61)
GENDER(Q60)
ETHNICITY(Q62) RACE (Q63) HEALTH STATUS
(Q43)MENTAL HEALTH
(Q44)
Total 18 to34
35 to44
45 to54
55 orolder
HS/GED/Less
SomeColg/Grad+
Male Female Hispanicor Latino
NotHispanicor Latino
WhiteBlack orAfrican-
AmericanOther Excellent/
Very good Good Fair/Poor
Excellent/Very good Good Fair/
Poor
A B C D E F G H I J K L M N O P Q R S
Q3. In the last 12 months, did you have an illness, injury, or condition that needed care right away in a clinic, emergency room, or doctor'soffice?
Total Eligible176 26 29 34 86 7 168 60 116 9 160 137 6 39 107 55 14 129 35 10
100.0% 100.0% 100.0% 100.0% 100.0% 100.0% 100.0% 100.0% 100.0% 100.0% 100.0% 100.0% 100.0% 100.0% 100.0% 100.0% 100.0% 100.0% 100.0% 100.0%
Total ValidResponses
175 26 29 34 85 7 167 60 115 9 159 136 6 39 106 55 14 128 35 10100.0% 100.0% 100.0% 100.0% 100.0% 100.0% 100.0% 100.0% 100.0% 100.0% 100.0% 100.0% 100.0% 100.0% 100.0% 100.0% 100.0% 100.0% 100.0% 100.0%
No Answer1 - - - 1 - 1 - 1 - 1 1 - - 1 - - 1 - -
Yes74 11 10 16 37 3 70 26 48 5 67 59 2 14 41 25 8 51 17 5
42.3% 42.3% 34.5% 47.1% 43.5% 42.9% 41.9% 43.3% 41.7% 55.6% 42.1% 43.4% 33.3% 35.9% 38.7% 45.5% 57.1% 39.8% 48.6% 50.0% ** ** ** ** ** ** **
No101 15 19 18 48 4 97 34 67 4 92 77 4 25 65 30 6 77 18 5
57.7% 57.7% 65.5% 52.9% 56.5% 57.1% 58.1% 56.7% 58.3% 44.4% 57.9% 56.6% 66.7% 64.1% 61.3% 54.5% 42.9% 60.2% 51.4% 50.0% ** ** ** ** ** ** **
HEDIS/CAHPSSUMMARYRATE - Yes
74 11 10 16 37 3 70 26 48 5 67 59 2 14 41 25 8 51 17 542.3% 42.3% 34.5% 47.1% 43.5% 42.9% 41.9% 43.3% 41.7% 55.6% 42.1% 43.4% 33.3% 35.9% 38.7% 45.5% 57.1% 39.8% 48.6% 50.0%
** ** ** ** ** ** **
Cell Contents: - Count- Column Percentage- Statistical Test ResultsStatistics: Overlap formulae used- Column Proportions: Columns Tested (5%): A/B/C/D, E/F, G/H, I/J,K/L/M, N/O/P, Q/R/S, (10%): a/b/c/d, e/f, g/h, i/j,k/l/m, n/o/p, q/r/s Minimum Base: 30 (**), Small Base: 30 (*)
Presented by SPH Analytics770-978-3173
2016

Q4. (GCQ) In the last 12 months, when you neededcare right away, how often did you get care as soonas you needed?
Regence BCBS2016 CAHPS 5.0H Commercial Adult Survey (1113020)
Table: 3Level: Top
AGE (Q59) EDUCATION(Q61)
GENDER(Q60)
ETHNICITY(Q62) RACE (Q63) HEALTH STATUS
(Q43)MENTAL HEALTH
(Q44)
Total 18 to34
35 to44
45 to54
55 orolder
HS/GED/Less
SomeColg/Grad+
Male Female Hispanicor Latino
NotHispanicor Latino
WhiteBlack orAfrican-
AmericanOther Excellent/
Very good Good Fair/Poor
Excellent/Very good Good Fair/
Poor
A B C D E F G H I J K L M N O P Q R S
Q4. (GCQ) In the last 12 months, when you needed care right away, how often did you get care as soon as you needed?
Total Eligible74 11 10 16 37 3 70 26 48 5 67 59 2 14 41 25 8 51 17 5
100.0% 100.0% 100.0% 100.0% 100.0% 100.0% 100.0% 100.0% 100.0% 100.0% 100.0% 100.0% 100.0% 100.0% 100.0% 100.0% 100.0% 100.0% 100.0% 100.0%
Total ValidResponses
72 11 10 16 35 3 68 26 46 5 65 59 1 13 41 23 8 51 15 5100.0% 100.0% 100.0% 100.0% 100.0% 100.0% 100.0% 100.0% 100.0% 100.0% 100.0% 100.0% 100.0% 100.0% 100.0% 100.0% 100.0% 100.0% 100.0% 100.0%
No Answer2 - - - 2 - 2 - 2 - 2 - 1 1 - 2 - - 2 -
Always45 10 6 5 24 2 42 16 29 2 41 42 - 5 30 12 3 33 10 2
62.5% 90.9% 60.0% 31.3% 68.6% 66.7% 61.8% 61.5% 63.0% 40.0% 63.1% 71.2% - 38.5% 73.2% 52.2% 37.5% 64.7% 66.7% 40.0% ** ** ** ** ** ** ** ** ** ** ** **
Usually19 1 3 7 8 1 18 5 14 2 17 13 - 6 8 8 3 12 4 2
26.4% 9.1% 30.0% 43.8% 22.9% 33.3% 26.5% 19.2% 30.4% 40.0% 26.2% 22.0% - 46.2% 19.5% 34.8% 37.5% 23.5% 26.7% 40.0% ** ** ** ** ** ** ** ** ** ** ** **
Sometimes6 - - 4 2 - 6 3 3 1 5 2 1 2 1 3 2 4 1 1
8.3% - - 25.0% 5.7% - 8.8% 11.5% 6.5% 20.0% 7.7% 3.4% 100.0% 15.4% 2.4% 13.0% 25.0% 7.8% 6.7% 20.0% ** ** ** ** ** ** ** ** ** ** ** **
Never2 - 1 - 1 - 2 2 - - 2 2 - - 2 - - 2 - -
2.8% - 10.0% - 2.9% - 2.9% 7.7% - - 3.1% 3.4% - - 4.9% - - 3.9% - - ** ** ** ** ** ** ** ** ** ** ** **
HEDIS/CAHPSSUMMARYRATE -Always/Usually
64 11 9 12 32 3 60 21 43 4 58 55 - 11 38 20 6 45 14 488.9% 100.0% 90.0% 75.0% 91.4% 100.0% 88.2% 80.8% 93.5% 80.0% 89.2% 93.2% - 84.6% 92.7% 87.0% 75.0% 88.2% 93.3% 80.0%
** ** ** ** ** ** ** ** ** ** ** **
HEDIS/CAHPSSUMMARYRATE - Always
45 10 6 5 24 2 42 16 29 2 41 42 - 5 30 12 3 33 10 262.5% 90.9% 60.0% 31.3% 68.6% 66.7% 61.8% 61.5% 63.0% 40.0% 63.1% 71.2% - 38.5% 73.2% 52.2% 37.5% 64.7% 66.7% 40.0%
** ** ** ** ** ** ** ** ** ** ** **
3-Point Score2.51 2.91 2.50 2.06 2.60 2.67 2.50 2.42 2.57 2.20 2.52 2.64 1.00 2.23 2.66 2.39 2.13 2.53 2.60 2.20
Cell Contents: - Count- Column Percentage- Statistical Test ResultsStatistics: Overlap formulae used- Column Proportions: Columns Tested (5%): A/B/C/D, E/F, G/H, I/J,K/L/M, N/O/P, Q/R/S, (10%): a/b/c/d, e/f, g/h, i/j,k/l/m, n/o/p, q/r/s Minimum Base: 30 (**), Small Base: 30 (*)
Presented by SPH Analytics770-978-3173
2016

Q5. In the last 12 months, did you make anyappointments for a check-up or routine care at adoctor's office or clinic?
Regence BCBS2016 CAHPS 5.0H Commercial Adult Survey (1113020)
Table: 4Level: Top
AGE (Q59) EDUCATION(Q61)
GENDER(Q60)
ETHNICITY(Q62) RACE (Q63) HEALTH STATUS
(Q43)MENTAL HEALTH
(Q44)
Total 18 to34
35 to44
45 to54
55 orolder
HS/GED/Less
SomeColg/Grad+
Male Female Hispanicor Latino
NotHispanicor Latino
WhiteBlack orAfrican-
AmericanOther Excellent/
Very good Good Fair/Poor
Excellent/Very good Good Fair/
Poor
A B C D E F G H I J K L M N O P Q R S
Q5. In the last 12 months, did you make any appointments for a check-up or routine care at a doctor's office or clinic?
Total Eligible176 26 29 34 86 7 168 60 116 9 160 137 6 39 107 55 14 129 35 10
100.0% 100.0% 100.0% 100.0% 100.0% 100.0% 100.0% 100.0% 100.0% 100.0% 100.0% 100.0% 100.0% 100.0% 100.0% 100.0% 100.0% 100.0% 100.0% 100.0%
Total ValidResponses
174 26 29 33 85 7 166 58 116 9 158 135 6 39 107 54 13 127 35 10100.0% 100.0% 100.0% 100.0% 100.0% 100.0% 100.0% 100.0% 100.0% 100.0% 100.0% 100.0% 100.0% 100.0% 100.0% 100.0% 100.0% 100.0% 100.0% 100.0%
No Answer2 - - 1 1 - 2 2 - - 2 2 - - - 1 1 2 - -
Yes156 23 25 29 78 7 148 54 102 9 140 120 6 35 94 49 13 112 33 10
89.7% 88.5% 86.2% 87.9% 91.8% 100.0% 89.2% 93.1% 87.9% 100.0% 88.6% 88.9% 100.0% 89.7% 87.9% 90.7% 100.0% 88.2% 94.3% 100.0% ** ** ** ** ** ** **
No18 3 4 4 7 - 18 4 14 - 18 15 - 4 13 5 - 15 2 -
10.3% 11.5% 13.8% 12.1% 8.2% - 10.8% 6.9% 12.1% - 11.4% 11.1% - 10.3% 12.1% 9.3% - 11.8% 5.7% - ** ** ** ** ** ** **
HEDIS/CAHPSSUMMARYRATE - Yes
156 23 25 29 78 7 148 54 102 9 140 120 6 35 94 49 13 112 33 1089.7% 88.5% 86.2% 87.9% 91.8% 100.0% 89.2% 93.1% 87.9% 100.0% 88.6% 88.9% 100.0% 89.7% 87.9% 90.7% 100.0% 88.2% 94.3% 100.0%
** ** ** ** ** ** **
Cell Contents: - Count- Column Percentage- Statistical Test ResultsStatistics: Overlap formulae used- Column Proportions: Columns Tested (5%): A/B/C/D, E/F, G/H, I/J,K/L/M, N/O/P, Q/R/S, (10%): a/b/c/d, e/f, g/h, i/j,k/l/m, n/o/p, q/r/s Minimum Base: 30 (**), Small Base: 30 (*)
Presented by SPH Analytics770-978-3173
2016

Q6. (GCQ) In the last 12 months, how often did youget an appointment for a check-up or routine care ata doctor's office or clinic as soon as you needed?
Regence BCBS2016 CAHPS 5.0H Commercial Adult Survey (1113020)
Table: 5Level: Top
AGE (Q59) EDUCATION(Q61)
GENDER(Q60)
ETHNICITY(Q62) RACE (Q63) HEALTH STATUS
(Q43)MENTAL HEALTH
(Q44)
Total 18 to34
35 to44
45 to54
55 orolder
HS/GED/Less
SomeColg/Grad+
Male Female Hispanicor Latino
NotHispanicor Latino
WhiteBlack orAfrican-
AmericanOther Excellent/
Very good Good Fair/Poor
Excellent/Very good Good Fair/
Poor
A B C D E F G H I J K L M N O P Q R S
Q6. (GCQ) In the last 12 months, how often did you get an appointment for a check-up or routine care at a doctor's office or clinic as soon asyou needed?
Total Eligible156 23 25 29 78 7 148 54 102 9 140 120 6 35 94 49 13 112 33 10
100.0% 100.0% 100.0% 100.0% 100.0% 100.0% 100.0% 100.0% 100.0% 100.0% 100.0% 100.0% 100.0% 100.0% 100.0% 100.0% 100.0% 100.0% 100.0% 100.0%
Total ValidResponses
149 23 24 28 73 6 142 53 96 9 133 114 6 33 89 48 12 106 32 10100.0% 100.0% 100.0% 100.0% 100.0% 100.0% 100.0% 100.0% 100.0% 100.0% 100.0% 100.0% 100.0% 100.0% 100.0% 100.0% 100.0% 100.0% 100.0% 100.0%
No Answer7 - 1 1 5 1 6 1 6 - 7 6 - 2 5 1 1 6 1 -
Always73 14 11 9 38 4 69 26 47 5 64 58 3 16 53 16 4 59 9 5
49.0% 60.9% 45.8% 32.1% 52.1% 66.7% 48.6% 49.1% 49.0% 55.6% 48.1% 50.9% 50.0% 48.5% 59.6% 33.3% 33.3% 55.7% 28.1% 50.0% ** ** ** ** ** ** O ** R **
Usually46 5 7 10 24 2 43 18 28 3 41 37 2 9 20 21 5 26 15 4
30.9% 21.7% 29.2% 35.7% 32.9% 33.3% 30.3% 34.0% 29.2% 33.3% 30.8% 32.5% 33.3% 27.3% 22.5% 43.8% 41.7% 24.5% 46.9% 40.0% ** ** ** ** ** ** N ** Q **
Sometimes25 3 5 8 9 - 25 5 20 1 23 15 1 7 14 9 2 19 6 -
16.8% 13.0% 20.8% 28.6% 12.3% - 17.6% 9.4% 20.8% 11.1% 17.3% 13.2% 16.7% 21.2% 15.7% 18.8% 16.7% 17.9% 18.8% - ** ** ** ** g ** ** ** **
Never5 1 1 1 2 - 5 4 1 - 5 4 - 1 2 2 1 2 2 1
3.4% 4.3% 4.2% 3.6% 2.7% - 3.5% 7.5% 1.0% - 3.8% 3.5% - 3.0% 2.2% 4.2% 8.3% 1.9% 6.3% 10.0% ** ** ** ** H ** ** ** **
HEDIS/CAHPSSUMMARYRATE -Always/Usually
119 19 18 19 62 6 112 44 75 8 105 95 5 25 73 37 9 85 24 979.9% 82.6% 75.0% 67.9% 84.9% 100.0% 78.9% 83.0% 78.1% 88.9% 78.9% 83.3% 83.3% 75.8% 82.0% 77.1% 75.0% 80.2% 75.0% 90.0%
** ** ** ** ** ** ** **
HEDIS/CAHPSSUMMARYRATE - Always
73 14 11 9 38 4 69 26 47 5 64 58 3 16 53 16 4 59 9 549.0% 60.9% 45.8% 32.1% 52.1% 66.7% 48.6% 49.1% 49.0% 55.6% 48.1% 50.9% 50.0% 48.5% 59.6% 33.3% 33.3% 55.7% 28.1% 50.0%
** ** ** ** ** ** O ** R **
3-Point Score2.29 2.43 2.21 2.00 2.37 2.67 2.27 2.32 2.27 2.44 2.27 2.34 2.33 2.24 2.42 2.10 2.08 2.36 2.03 2.40
Cell Contents: - Count- Column Percentage- Statistical Test ResultsStatistics: Overlap formulae used- Column Proportions: Columns Tested (5%): A/B/C/D, E/F, G/H, I/J,K/L/M, N/O/P, Q/R/S, (10%): a/b/c/d, e/f, g/h, i/j,k/l/m, n/o/p, q/r/s Minimum Base: 30 (**), Small Base: 30 (*)
Presented by SPH Analytics770-978-3173
2016

Q7. In the last 12 months, not counting the timesyou went to an emergency room, how many timesdid you go to a doctor's office or clinic to get healthcare for yourself?
Regence BCBS2016 CAHPS 5.0H Commercial Adult Survey (1113020)
Table: 6Level: Top
AGE (Q59) EDUCATION(Q61)
GENDER(Q60)
ETHNICITY(Q62) RACE (Q63) HEALTH STATUS
(Q43)MENTAL HEALTH
(Q44)
Total 18 to34
35 to44
45 to54
55 orolder
HS/GED/Less
SomeColg/Grad+
Male Female Hispanicor Latino
NotHispanicor Latino
WhiteBlack orAfrican-
AmericanOther Excellent/
Very good Good Fair/Poor
Excellent/Very good Good Fair/
Poor
A B C D E F G H I J K L M N O P Q R S
Q7. In the last 12 months, not counting the times you went to an emergency room, how many times did you go to a doctor's office or clinic to gethealth care for yourself?
Total Eligible176 26 29 34 86 7 168 60 116 9 160 137 6 39 107 55 14 129 35 10
100.0% 100.0% 100.0% 100.0% 100.0% 100.0% 100.0% 100.0% 100.0% 100.0% 100.0% 100.0% 100.0% 100.0% 100.0% 100.0% 100.0% 100.0% 100.0% 100.0%
Total ValidResponses
174 26 29 33 85 7 166 59 115 9 158 136 6 38 107 54 13 128 34 10100.0% 100.0% 100.0% 100.0% 100.0% 100.0% 100.0% 100.0% 100.0% 100.0% 100.0% 100.0% 100.0% 100.0% 100.0% 100.0% 100.0% 100.0% 100.0% 100.0%
No Answer2 - - 1 1 - 2 1 1 - 2 1 - 1 - 1 1 1 1 -
None10 2 1 2 5 - 10 3 7 - 10 8 - 3 10 - - 10 - -
5.7% 7.7% 3.4% 6.1% 5.9% - 6.0% 5.1% 6.1% - 6.3% 5.9% - 7.9% 9.3% - - 7.8% - - ** ** ** ** ** O ** r **
1 time24 3 5 5 10 1 23 4 20 - 23 17 - 8 19 4 1 19 4 1
13.8% 11.5% 17.2% 15.2% 11.8% 14.3% 13.9% 6.8% 17.4% - 14.6% 12.5% - 21.1% 17.8% 7.4% 7.7% 14.8% 11.8% 10.0% ** ** ** g ** ** o ** **
240 5 7 10 18 2 37 19 21 2 35 31 1 9 23 17 - 29 9 1
23.0% 19.2% 24.1% 30.3% 21.2% 28.6% 22.3% 32.2% 18.3% 22.2% 22.2% 22.8% 16.7% 23.7% 21.5% 31.5% - 22.7% 26.5% 10.0% ** ** ** H ** ** ** **
331 3 8 4 16 1 30 9 22 3 28 24 3 7 14 13 4 21 7 3
17.8% 11.5% 27.6% 12.1% 18.8% 14.3% 18.1% 15.3% 19.1% 33.3% 17.7% 17.6% 50.0% 18.4% 13.1% 24.1% 30.8% 16.4% 20.6% 30.0% ** ** ** ** ** n ** **
419 2 4 4 9 1 18 5 14 1 17 16 - 3 14 2 3 14 4 -
10.9% 7.7% 13.8% 12.1% 10.6% 14.3% 10.8% 8.5% 12.2% 11.1% 10.8% 11.8% - 7.9% 13.1% 3.7% 23.1% 10.9% 11.8% - ** ** ** ** ** o ** **
5 to 938 7 2 6 23 2 36 17 21 3 34 30 2 7 19 14 5 26 7 5
21.8% 26.9% 6.9% 18.2% 27.1% 28.6% 21.7% 28.8% 18.3% 33.3% 21.5% 22.1% 33.3% 18.4% 17.8% 25.9% 38.5% 20.3% 20.6% 50.0% ** ** ** ** ** ** **
10 or moretimes
12 4 2 2 4 - 12 2 10 - 11 10 - 1 8 4 - 9 3 -6.9% 15.4% 6.9% 6.1% 4.7% - 7.2% 3.4% 8.7% - 7.0% 7.4% - 2.6% 7.5% 7.4% - 7.0% 8.8% -
** ** ** ** ** ** **HEDIS/CAHPSSUMMARYRATE - 1 ormore times
164 24 28 31 80 7 156 56 108 9 148 128 6 35 97 54 13 118 34 1094.3% 92.3% 96.6% 93.9% 94.1% 100.0% 94.0% 94.9% 93.9% 100.0% 93.7% 94.1% 100.0% 92.1% 90.7% 100.0% 100.0% 92.2% 100.0% 100.0%
** ** ** ** ** N ** q **
Cell Contents: - Count- Column Percentage- Statistical Test ResultsStatistics: Overlap formulae used- Column Proportions: Columns Tested (5%): A/B/C/D, E/F, G/H, I/J,K/L/M, N/O/P, Q/R/S, (10%): a/b/c/d, e/f, g/h, i/j,k/l/m, n/o/p, q/r/s Minimum Base: 30 (**), Small Base: 30 (*)
Presented by SPH Analytics770-978-3173
2016

Q8. (HPE) In the last 12 months, did you and adoctor or other health provider talk about specificthings you could do to prevent illness?
Regence BCBS2016 CAHPS 5.0H Commercial Adult Survey (1113020)
Table: 7Level: Top
AGE (Q59) EDUCATION(Q61)
GENDER(Q60)
ETHNICITY(Q62) RACE (Q63) HEALTH STATUS
(Q43)MENTAL HEALTH
(Q44)
Total 18 to34
35 to44
45 to54
55 orolder
HS/GED/Less
SomeColg/Grad+
Male Female Hispanicor Latino
NotHispanicor Latino
WhiteBlack orAfrican-
AmericanOther Excellent/
Very good Good Fair/Poor
Excellent/Very good Good Fair/
Poor
A B C D E F G H I J K L M N O P Q R S
Q8. (HPE) In the last 12 months, did you and a doctor or other health provider talk about specific things you could do to prevent illness?
Total Eligible164 24 28 31 80 7 156 56 108 9 148 128 6 35 97 54 13 118 34 10
100.0% 100.0% 100.0% 100.0% 100.0% 100.0% 100.0% 100.0% 100.0% 100.0% 100.0% 100.0% 100.0% 100.0% 100.0% 100.0% 100.0% 100.0% 100.0% 100.0%
Total ValidResponses
163 24 28 31 79 7 155 56 107 8 148 127 6 35 97 53 13 117 34 10100.0% 100.0% 100.0% 100.0% 100.0% 100.0% 100.0% 100.0% 100.0% 100.0% 100.0% 100.0% 100.0% 100.0% 100.0% 100.0% 100.0% 100.0% 100.0% 100.0%
No Answer1 - - - 1 - 1 - 1 1 - 1 - - - 1 - 1 - -
Yes134 21 20 28 64 6 127 47 87 7 122 102 4 29 81 43 10 100 27 6
82.2% 87.5% 71.4% 90.3% 81.0% 85.7% 81.9% 83.9% 81.3% 87.5% 82.4% 80.3% 66.7% 82.9% 83.5% 81.1% 76.9% 85.5% 79.4% 60.0% ** ** ** ** ** ** **
No29 3 8 3 15 1 28 9 20 1 26 25 2 6 16 10 3 17 7 4
17.8% 12.5% 28.6% 9.7% 19.0% 14.3% 18.1% 16.1% 18.7% 12.5% 17.6% 19.7% 33.3% 17.1% 16.5% 18.9% 23.1% 14.5% 20.6% 40.0% ** ** ** ** ** ** **
HEDIS/CAHPSSUMMARYRATE - Yes
134 21 20 28 64 6 127 47 87 7 122 102 4 29 81 43 10 100 27 682.2% 87.5% 71.4% 90.3% 81.0% 85.7% 81.9% 83.9% 81.3% 87.5% 82.4% 80.3% 66.7% 82.9% 83.5% 81.1% 76.9% 85.5% 79.4% 60.0%
** ** ** ** ** ** **
3-Point Score2.64 2.75 2.43 2.81 2.62 2.71 2.64 2.68 2.63 2.75 2.65 2.61 2.33 2.66 2.67 2.62 2.54 2.71 2.59 2.20
Cell Contents: - Count- Column Percentage- Statistical Test ResultsStatistics: Overlap formulae used- Column Proportions: Columns Tested (5%): A/B/C/D, E/F, G/H, I/J,K/L/M, N/O/P, Q/R/S, (10%): a/b/c/d, e/f, g/h, i/j,k/l/m, n/o/p, q/r/s Minimum Base: 30 (**), Small Base: 30 (*)
Presented by SPH Analytics770-978-3173
2016

Q9. In the last 12 months, did you and a doctor orother health provider talk about starting or stopping aprescription medicine?
Regence BCBS2016 CAHPS 5.0H Commercial Adult Survey (1113020)
Table: 8Level: Top
AGE (Q59) EDUCATION(Q61)
GENDER(Q60)
ETHNICITY(Q62) RACE (Q63) HEALTH STATUS
(Q43)MENTAL HEALTH
(Q44)
Total 18 to34
35 to44
45 to54
55 orolder
HS/GED/Less
SomeColg/Grad+
Male Female Hispanicor Latino
NotHispanicor Latino
WhiteBlack orAfrican-
AmericanOther Excellent/
Very good Good Fair/Poor
Excellent/Very good Good Fair/
Poor
A B C D E F G H I J K L M N O P Q R S
Q9. In the last 12 months, did you and a doctor or other health provider talk about starting or stopping a prescription medicine?
Total Eligible164 24 28 31 80 7 156 56 108 9 148 128 6 35 97 54 13 118 34 10
100.0% 100.0% 100.0% 100.0% 100.0% 100.0% 100.0% 100.0% 100.0% 100.0% 100.0% 100.0% 100.0% 100.0% 100.0% 100.0% 100.0% 100.0% 100.0% 100.0%
Total ValidResponses
162 23 28 31 79 7 154 55 107 9 146 126 6 35 97 53 12 118 32 10100.0% 100.0% 100.0% 100.0% 100.0% 100.0% 100.0% 100.0% 100.0% 100.0% 100.0% 100.0% 100.0% 100.0% 100.0% 100.0% 100.0% 100.0% 100.0% 100.0%
No Answer2 1 - - 1 - 2 1 1 - 2 2 - - - 1 1 - 2 -
Yes92 15 12 17 48 5 87 32 60 6 81 75 5 16 48 36 8 64 20 7
56.8% 65.2% 42.9% 54.8% 60.8% 71.4% 56.5% 58.2% 56.1% 66.7% 55.5% 59.5% 83.3% 45.7% 49.5% 67.9% 66.7% 54.2% 62.5% 70.0% ** ** ** ** ** N ** **
No70 8 16 14 31 2 67 23 47 3 65 51 1 19 49 17 4 54 12 3
43.2% 34.8% 57.1% 45.2% 39.2% 28.6% 43.5% 41.8% 43.9% 33.3% 44.5% 40.5% 16.7% 54.3% 50.5% 32.1% 33.3% 45.8% 37.5% 30.0% ** ** ** ** ** O ** **
HEDIS/CAHPSSUMMARYRATE - Yes
92 15 12 17 48 5 87 32 60 6 81 75 5 16 48 36 8 64 20 756.8% 65.2% 42.9% 54.8% 60.8% 71.4% 56.5% 58.2% 56.1% 66.7% 55.5% 59.5% 83.3% 45.7% 49.5% 67.9% 66.7% 54.2% 62.5% 70.0%
** ** ** ** ** N ** **
Cell Contents: - Count- Column Percentage- Statistical Test ResultsStatistics: Overlap formulae used- Column Proportions: Columns Tested (5%): A/B/C/D, E/F, G/H, I/J,K/L/M, N/O/P, Q/R/S, (10%): a/b/c/d, e/f, g/h, i/j,k/l/m, n/o/p, q/r/s Minimum Base: 30 (**), Small Base: 30 (*)
Presented by SPH Analytics770-978-3173
2016

Q10. (SDM) Did you and a doctor or other healthprovider talk about the reasons you might want totake a medicine?
Regence BCBS2016 CAHPS 5.0H Commercial Adult Survey (1113020)
Table: 9Level: Top
AGE (Q59) EDUCATION(Q61)
GENDER(Q60)
ETHNICITY(Q62) RACE (Q63) HEALTH STATUS
(Q43)MENTAL HEALTH
(Q44)
Total 18 to34
35 to44
45 to54
55 orolder
HS/GED/Less
SomeColg/Grad+
Male Female Hispanicor Latino
NotHispanicor Latino
WhiteBlack orAfrican-
AmericanOther Excellent/
Very good Good Fair/Poor
Excellent/Very good Good Fair/
Poor
A B C D E F G H I J K L M N O P Q R S
Q10. (SDM) Did you and a doctor or other health provider talk about the reasons you might want to take a medicine?
Total Eligible92 15 12 17 48 5 87 32 60 6 81 75 5 16 48 36 8 64 20 7
100.0% 100.0% 100.0% 100.0% 100.0% 100.0% 100.0% 100.0% 100.0% 100.0% 100.0% 100.0% 100.0% 100.0% 100.0% 100.0% 100.0% 100.0% 100.0% 100.0%
Total ValidResponses
92 15 12 17 48 5 87 32 60 6 81 75 5 16 48 36 8 64 20 7100.0% 100.0% 100.0% 100.0% 100.0% 100.0% 100.0% 100.0% 100.0% 100.0% 100.0% 100.0% 100.0% 100.0% 100.0% 100.0% 100.0% 100.0% 100.0% 100.0%
No Answer- - - - - - - - - - - - - - - - - - - -
Yes85 15 12 14 44 5 80 30 55 6 74 70 5 14 44 34 7 58 19 7
92.4% 100.0% 100.0% 82.4% 91.7% 100.0% 92.0% 93.8% 91.7% 100.0% 91.4% 93.3% 100.0% 87.5% 91.7% 94.4% 87.5% 90.6% 95.0% 100.0% ** ** ** ** ** ** ** ** ** **
No7 - - 3 4 - 7 2 5 - 7 5 - 2 4 2 1 6 1 -
7.6% - - 17.6% 8.3% - 8.0% 6.3% 8.3% - 8.6% 6.7% - 12.5% 8.3% 5.6% 12.5% 9.4% 5.0% - ** ** ** ** ** ** ** ** ** **
HEDIS/CAHPSSUMMARYRATE - Yes
85 15 12 14 44 5 80 30 55 6 74 70 5 14 44 34 7 58 19 792.4% 100.0% 100.0% 82.4% 91.7% 100.0% 92.0% 93.8% 91.7% 100.0% 91.4% 93.3% 100.0% 87.5% 91.7% 94.4% 87.5% 90.6% 95.0% 100.0%
** ** ** ** ** ** ** ** ** **
3-Point Score2.85 3.00 3.00 2.65 2.83 3.00 2.84 2.88 2.83 3.00 2.83 2.87 3.00 2.75 2.83 2.89 2.75 2.81 2.90 3.00
Cell Contents: - Count- Column Percentage- Statistical Test ResultsStatistics: Overlap formulae used- Column Proportions: Columns Tested (5%): A/B/C/D, E/F, G/H, I/J,K/L/M, N/O/P, Q/R/S, (10%): a/b/c/d, e/f, g/h, i/j,k/l/m, n/o/p, q/r/s Minimum Base: 30 (**), Small Base: 30 (*)
Presented by SPH Analytics770-978-3173
2016

Q11. (SDM) Did you and a doctor or other healthprovider talk about the reasons you might not wantto take a medicine?
Regence BCBS2016 CAHPS 5.0H Commercial Adult Survey (1113020)
Table: 10Level: Top
AGE (Q59) EDUCATION(Q61)
GENDER(Q60)
ETHNICITY(Q62) RACE (Q63) HEALTH STATUS
(Q43)MENTAL HEALTH
(Q44)
Total 18 to34
35 to44
45 to54
55 orolder
HS/GED/Less
SomeColg/Grad+
Male Female Hispanicor Latino
NotHispanicor Latino
WhiteBlack orAfrican-
AmericanOther Excellent/
Very good Good Fair/Poor
Excellent/Very good Good Fair/
Poor
A B C D E F G H I J K L M N O P Q R S
Q11. (SDM) Did you and a doctor or other health provider talk about the reasons you might not want to take a medicine?
Total Eligible92 15 12 17 48 5 87 32 60 6 81 75 5 16 48 36 8 64 20 7
100.0% 100.0% 100.0% 100.0% 100.0% 100.0% 100.0% 100.0% 100.0% 100.0% 100.0% 100.0% 100.0% 100.0% 100.0% 100.0% 100.0% 100.0% 100.0% 100.0%
Total ValidResponses
92 15 12 17 48 5 87 32 60 6 81 75 5 16 48 36 8 64 20 7100.0% 100.0% 100.0% 100.0% 100.0% 100.0% 100.0% 100.0% 100.0% 100.0% 100.0% 100.0% 100.0% 100.0% 100.0% 100.0% 100.0% 100.0% 100.0% 100.0%
No Answer- - - - - - - - - - - - - - - - - - - -
Yes72 13 10 11 38 4 68 24 48 5 64 66 2 8 41 26 5 53 14 4
78.3% 86.7% 83.3% 64.7% 79.2% 80.0% 78.2% 75.0% 80.0% 83.3% 79.0% 88.0% 40.0% 50.0% 85.4% 72.2% 62.5% 82.8% 70.0% 57.1% ** ** ** ** ** ** ** ** ** **
No20 2 2 6 10 1 19 8 12 1 17 9 3 8 7 10 3 11 6 3
21.7% 13.3% 16.7% 35.3% 20.8% 20.0% 21.8% 25.0% 20.0% 16.7% 21.0% 12.0% 60.0% 50.0% 14.6% 27.8% 37.5% 17.2% 30.0% 42.9% ** ** ** ** ** ** ** ** ** **
HEDIS/CAHPSSUMMARYRATE - Yes
72 13 10 11 38 4 68 24 48 5 64 66 2 8 41 26 5 53 14 478.3% 86.7% 83.3% 64.7% 79.2% 80.0% 78.2% 75.0% 80.0% 83.3% 79.0% 88.0% 40.0% 50.0% 85.4% 72.2% 62.5% 82.8% 70.0% 57.1%
** ** ** ** ** ** ** ** ** **
3-Point Score2.57 2.73 2.67 2.29 2.58 2.60 2.56 2.50 2.60 2.67 2.58 2.76 1.80 2.00 2.71 2.44 2.25 2.66 2.40 2.14
Cell Contents: - Count- Column Percentage- Statistical Test ResultsStatistics: Overlap formulae used- Column Proportions: Columns Tested (5%): A/B/C/D, E/F, G/H, I/J,K/L/M, N/O/P, Q/R/S, (10%): a/b/c/d, e/f, g/h, i/j,k/l/m, n/o/p, q/r/s Minimum Base: 30 (**), Small Base: 30 (*)
Presented by SPH Analytics770-978-3173
2016

Q12. (SDM) When you talked about starting orstopping a prescription medicine, did a doctor orother health provider ask you what you thought wasbest for you?
Regence BCBS2016 CAHPS 5.0H Commercial Adult Survey (1113020)
Table: 11Level: Top
AGE (Q59) EDUCATION(Q61)
GENDER(Q60)
ETHNICITY(Q62) RACE (Q63) HEALTH STATUS
(Q43)MENTAL HEALTH
(Q44)
Total 18 to34
35 to44
45 to54
55 orolder
HS/GED/Less
SomeColg/Grad+
Male Female Hispanicor Latino
NotHispanicor Latino
WhiteBlack orAfrican-
AmericanOther Excellent/
Very good Good Fair/Poor
Excellent/Very good Good Fair/
Poor
A B C D E F G H I J K L M N O P Q R S
Q12. (SDM) When you talked about starting or stopping a prescription medicine, did a doctor or other health provider ask you what you thoughtwas best for you?
Total Eligible92 15 12 17 48 5 87 32 60 6 81 75 5 16 48 36 8 64 20 7
100.0% 100.0% 100.0% 100.0% 100.0% 100.0% 100.0% 100.0% 100.0% 100.0% 100.0% 100.0% 100.0% 100.0% 100.0% 100.0% 100.0% 100.0% 100.0% 100.0%
Total ValidResponses
92 15 12 17 48 5 87 32 60 6 81 75 5 16 48 36 8 64 20 7100.0% 100.0% 100.0% 100.0% 100.0% 100.0% 100.0% 100.0% 100.0% 100.0% 100.0% 100.0% 100.0% 100.0% 100.0% 100.0% 100.0% 100.0% 100.0% 100.0%
No Answer- - - - - - - - - - - - - - - - - - - -
Yes75 13 9 13 40 3 72 26 49 5 67 63 4 11 40 30 5 52 18 4
81.5% 86.7% 75.0% 76.5% 83.3% 60.0% 82.8% 81.3% 81.7% 83.3% 82.7% 84.0% 80.0% 68.8% 83.3% 83.3% 62.5% 81.3% 90.0% 57.1% ** ** ** ** ** ** ** ** ** **
No17 2 3 4 8 2 15 6 11 1 14 12 1 5 8 6 3 12 2 3
18.5% 13.3% 25.0% 23.5% 16.7% 40.0% 17.2% 18.8% 18.3% 16.7% 17.3% 16.0% 20.0% 31.3% 16.7% 16.7% 37.5% 18.8% 10.0% 42.9% ** ** ** ** ** ** ** ** ** **
HEDIS/CAHPSSUMMARYRATE - Yes
75 13 9 13 40 3 72 26 49 5 67 63 4 11 40 30 5 52 18 481.5% 86.7% 75.0% 76.5% 83.3% 60.0% 82.8% 81.3% 81.7% 83.3% 82.7% 84.0% 80.0% 68.8% 83.3% 83.3% 62.5% 81.3% 90.0% 57.1%
** ** ** ** ** ** ** ** ** **
3-Point Score2.63 2.73 2.50 2.53 2.67 2.20 2.66 2.63 2.63 2.67 2.65 2.68 2.60 2.38 2.67 2.67 2.25 2.63 2.80 2.14
Cell Contents: - Count- Column Percentage- Statistical Test ResultsStatistics: Overlap formulae used- Column Proportions: Columns Tested (5%): A/B/C/D, E/F, G/H, I/J,K/L/M, N/O/P, Q/R/S, (10%): a/b/c/d, e/f, g/h, i/j,k/l/m, n/o/p, q/r/s Minimum Base: 30 (**), Small Base: 30 (*)
Presented by SPH Analytics770-978-3173
2016

Q13. What number would you use to rate all yourhealth care in the last 12 months?
Regence BCBS2016 CAHPS 5.0H Commercial Adult Survey (1113020)
Table: 12Level: Top
AGE (Q59) EDUCATION(Q61)
GENDER(Q60)
ETHNICITY(Q62) RACE (Q63) HEALTH STATUS
(Q43)MENTAL HEALTH
(Q44)
Total 18 to34
35 to44
45 to54
55 orolder
HS/GED/Less
SomeColg/Grad+
Male Female Hispanicor Latino
NotHispanicor Latino
WhiteBlack orAfrican-
AmericanOther Excellent/
Very good Good Fair/Poor
Excellent/Very good Good Fair/
Poor
A B C D E F G H I J K L M N O P Q R S
Q13. What number would you use to rate all your health care in the last 12 months?
Total Eligible164 24 28 31 80 7 156 56 108 9 148 128 6 35 97 54 13 118 34 10
100.0% 100.0% 100.0% 100.0% 100.0% 100.0% 100.0% 100.0% 100.0% 100.0% 100.0% 100.0% 100.0% 100.0% 100.0% 100.0% 100.0% 100.0% 100.0% 100.0%
Total ValidResponses
163 24 28 31 79 7 155 56 107 9 147 128 6 34 97 53 13 118 33 10100.0% 100.0% 100.0% 100.0% 100.0% 100.0% 100.0% 100.0% 100.0% 100.0% 100.0% 100.0% 100.0% 100.0% 100.0% 100.0% 100.0% 100.0% 100.0% 100.0%
No Answer1 - - - 1 - 1 - 1 - 1 - - 1 - 1 - - 1 -
10 - Besthealth carepossible
40 5 6 5 24 1 38 14 26 2 37 34 - 7 31 7 2 33 7 -24.5% 20.8% 21.4% 16.1% 30.4% 14.3% 24.5% 25.0% 24.3% 22.2% 25.2% 26.6% - 20.6% 32.0% 13.2% 15.4% 28.0% 21.2% -
** ** ** ** ** O ** **
946 3 7 9 27 2 44 11 35 2 42 36 1 8 26 15 5 30 12 4
28.2% 12.5% 25.0% 29.0% 34.2% 28.6% 28.4% 19.6% 32.7% 22.2% 28.6% 28.1% 16.7% 23.5% 26.8% 28.3% 38.5% 25.4% 36.4% 40.0% ** ** ** g ** ** ** **
842 8 9 8 16 2 40 13 29 3 36 29 3 12 24 17 1 31 7 3
25.8% 33.3% 32.1% 25.8% 20.3% 28.6% 25.8% 23.2% 27.1% 33.3% 24.5% 22.7% 50.0% 35.3% 24.7% 32.1% 7.7% 26.3% 21.2% 30.0% ** ** ** ** ** ** **
720 6 3 8 3 2 18 10 10 1 18 16 1 4 9 11 - 15 5 -
12.3% 25.0% 10.7% 25.8% 3.8% 28.6% 11.6% 17.9% 9.3% 11.1% 12.2% 12.5% 16.7% 11.8% 9.3% 20.8% - 12.7% 15.2% - ** ** D ** ** ** N ** **
64 1 - - 3 - 4 3 1 - 4 4 - - 4 - - 4 - -
2.5% 4.2% - - 3.8% - 2.6% 5.4% 0.9% - 2.7% 3.1% - - 4.1% - - 3.4% - - ** ** ** h ** ** ** **
56 - 1 - 5 - 6 2 4 - 6 6 - 2 2 2 2 3 2 1
3.7% - 3.6% - 6.3% - 3.9% 3.6% 3.7% - 4.1% 4.7% - 5.9% 2.1% 3.8% 15.4% 2.5% 6.1% 10.0% ** ** ** ** ** ** **
41 - 1 - - - 1 - 1 - 1 1 - - - 1 - - - -
0.6% - 3.6% - - - 0.6% - 0.9% - 0.7% 0.8% - - - 1.9% - - - - ** ** ** ** ** ** **
34 1 1 1 1 - 4 3 1 1 3 2 1 1 1 - 3 2 - 2
2.5% 4.2% 3.6% 3.2% 1.3% - 2.6% 5.4% 0.9% 11.1% 2.0% 1.6% 16.7% 2.9% 1.0% - 23.1% 1.7% - 20.0% ** ** ** h ** ** ** **
2- - - - - - - - - - - - - - - - - - - -- - - - - - - - - - - - - - - - - - - - ** ** ** ** ** ** **
1- - - - - - - - - - - - - - - - - - - -- - - - - - - - - - - - - - - - - - - - ** ** ** ** ** ** **
0 - Worsthealth carepossible
- - - - - - - - - - - - - - - - - - - -- - - - - - - - - - - - - - - - - - - - ** ** ** ** ** ** **
SUMMARY - 0-3
4 1 1 1 1 - 4 3 1 1 3 2 1 1 1 - 3 2 - 22.5% 4.2% 3.6% 3.2% 1.3% - 2.6% 5.4% 0.9% 11.1% 2.0% 1.6% 16.7% 2.9% 1.0% - 23.1% 1.7% - 20.0%
** ** ** h ** ** ** **
SUMMARY - 4-7
31 7 5 8 11 2 29 15 16 1 29 27 1 6 15 14 2 22 7 119.0% 29.2% 17.9% 25.8% 13.9% 28.6% 18.7% 26.8% 15.0% 11.1% 19.7% 21.1% 16.7% 17.6% 15.5% 26.4% 15.4% 18.6% 21.2% 10.0%
** ** ** h ** ** ** **HEDIS/CAHPSSUMMARYRATE - 8-10
128 16 22 22 67 5 122 38 90 7 115 99 4 27 81 39 8 94 26 778.5% 66.7% 78.6% 71.0% 84.8% 71.4% 78.7% 67.9% 84.1% 77.8% 78.2% 77.3% 66.7% 79.4% 83.5% 73.6% 61.5% 79.7% 78.8% 70.0%
** ** c ** G ** ** ** **HEDIS/CAHPSSUMMARYRATE - 9-10
86 8 13 14 51 3 82 25 61 4 79 70 1 15 57 22 7 63 19 452.8% 33.3% 46.4% 45.2% 64.6% 42.9% 52.9% 44.6% 57.0% 44.4% 53.7% 54.7% 16.7% 44.1% 58.8% 41.5% 53.8% 53.4% 57.6% 40.0%
** ** c ** ** ** O ** **
3-Point Score2.44 2.25 2.36 2.42 2.53 2.43 2.43 2.30 2.50 2.33 2.44 2.45 2.00 2.35 2.52 2.36 2.15 2.46 2.52 2.10
Cell Contents: - Count- Column Percentage- Statistical Test ResultsStatistics: Overlap formulae used- Column Proportions: Columns Tested (5%): A/B/C/D, E/F, G/H, I/J,K/L/M, N/O/P, Q/R/S, (10%): a/b/c/d, e/f, g/h, i/j,k/l/m, n/o/p, q/r/s Minimum Base: 30 (**), Small Base: 30 (*)
Presented by SPH Analytics770-978-3173
2016

Q14. (GNC) In the last 12 months, how often was iteasy to get the care, tests, or treatment you thoughtyou needed through your health plan?
Regence BCBS2016 CAHPS 5.0H Commercial Adult Survey (1113020)
Table: 13Level: Top
AGE (Q59) EDUCATION(Q61)
GENDER(Q60)
ETHNICITY(Q62) RACE (Q63) HEALTH STATUS
(Q43)MENTAL HEALTH
(Q44)
Total 18 to34
35 to44
45 to54
55 orolder
HS/GED/Less
SomeColg/Grad+
Male Female Hispanicor Latino
NotHispanicor Latino
WhiteBlack orAfrican-
AmericanOther Excellent/
Very good Good Fair/Poor
Excellent/Very good Good Fair/
Poor
A B C D E F G H I J K L M N O P Q R S
Q14. (GNC) In the last 12 months, how often was it easy to get the care, tests, or treatment you thought you needed through your health plan?
Total Eligible164 24 28 31 80 7 156 56 108 9 148 128 6 35 97 54 13 118 34 10
100.0% 100.0% 100.0% 100.0% 100.0% 100.0% 100.0% 100.0% 100.0% 100.0% 100.0% 100.0% 100.0% 100.0% 100.0% 100.0% 100.0% 100.0% 100.0% 100.0%
Total ValidResponses
162 24 27 30 80 7 154 56 106 9 146 126 6 35 96 53 13 117 34 10100.0% 100.0% 100.0% 100.0% 100.0% 100.0% 100.0% 100.0% 100.0% 100.0% 100.0% 100.0% 100.0% 100.0% 100.0% 100.0% 100.0% 100.0% 100.0% 100.0%
No Answer2 - 1 1 - - 2 - 2 - 2 2 - - 1 1 - 1 - -
Always83 15 13 12 42 5 78 28 55 4 76 69 2 15 54 24 5 65 14 4
51.2% 62.5% 48.1% 40.0% 52.5% 71.4% 50.6% 50.0% 51.9% 44.4% 52.1% 54.8% 33.3% 42.9% 56.3% 45.3% 38.5% 55.6% 41.2% 40.0% ** ** ** ** ** ** **
Usually67 7 13 14 33 1 65 22 45 5 58 46 3 20 37 25 5 42 19 5
41.4% 29.2% 48.1% 46.7% 41.3% 14.3% 42.2% 39.3% 42.5% 55.6% 39.7% 36.5% 50.0% 57.1% 38.5% 47.2% 38.5% 35.9% 55.9% 50.0% ** ** ** ** ** K ** Q **
Sometimes9 1 - 4 4 1 8 4 5 - 9 9 - - 4 4 1 8 1 -
5.6% 4.2% - 13.3% 5.0% 14.3% 5.2% 7.1% 4.7% - 6.2% 7.1% - - 4.2% 7.5% 7.7% 6.8% 2.9% - ** ** ** ** m ** ** **
Never3 1 1 - 1 - 3 2 1 - 3 2 1 - 1 - 2 2 - 1
1.9% 4.2% 3.7% - 1.3% - 1.9% 3.6% 0.9% - 2.1% 1.6% 16.7% - 1.0% - 15.4% 1.7% - 10.0% ** ** ** ** ** ** **
HEDIS/CAHPSSUMMARYRATE -Always/Usually
150 22 26 26 75 6 143 50 100 9 134 115 5 35 91 49 10 107 33 992.6% 91.7% 96.3% 86.7% 93.8% 85.7% 92.9% 89.3% 94.3% 100.0% 91.8% 91.3% 83.3% 100.0% 94.8% 92.5% 76.9% 91.5% 97.1% 90.0%
** ** ** ** ** k ** **
HEDIS/CAHPSSUMMARYRATE - Always
83 15 13 12 42 5 78 28 55 4 76 69 2 15 54 24 5 65 14 451.2% 62.5% 48.1% 40.0% 52.5% 71.4% 50.6% 50.0% 51.9% 44.4% 52.1% 54.8% 33.3% 42.9% 56.3% 45.3% 38.5% 55.6% 41.2% 40.0%
** ** ** ** ** ** **
3-Point Score2.44 2.54 2.44 2.27 2.46 2.57 2.44 2.39 2.46 2.44 2.44 2.46 2.17 2.43 2.51 2.38 2.15 2.47 2.38 2.30
Cell Contents: - Count- Column Percentage- Statistical Test ResultsStatistics: Overlap formulae used- Column Proportions: Columns Tested (5%): A/B/C/D, E/F, G/H, I/J,K/L/M, N/O/P, Q/R/S, (10%): a/b/c/d, e/f, g/h, i/j,k/l/m, n/o/p, q/r/s Minimum Base: 30 (**), Small Base: 30 (*)
Presented by SPH Analytics770-978-3173
2016

Q15. Do you have a personal doctor? Regence BCBS2016 CAHPS 5.0H Commercial Adult Survey (1113020)
Table: 14Level: Top
AGE (Q59) EDUCATION(Q61)
GENDER(Q60)
ETHNICITY(Q62) RACE (Q63) HEALTH STATUS
(Q43)MENTAL HEALTH
(Q44)
Total 18 to34
35 to44
45 to54
55 orolder
HS/GED/Less
SomeColg/Grad+
Male Female Hispanicor Latino
NotHispanicor Latino
WhiteBlack orAfrican-
AmericanOther Excellent/
Very good Good Fair/Poor
Excellent/Very good Good Fair/
Poor
A B C D E F G H I J K L M N O P Q R S
Q15. Do you have a personal doctor?
Total Eligible176 26 29 34 86 7 168 60 116 9 160 137 6 39 107 55 14 129 35 10
100.0% 100.0% 100.0% 100.0% 100.0% 100.0% 100.0% 100.0% 100.0% 100.0% 100.0% 100.0% 100.0% 100.0% 100.0% 100.0% 100.0% 100.0% 100.0% 100.0%
Total ValidResponses
176 26 29 34 86 7 168 60 116 9 160 137 6 39 107 55 14 129 35 10100.0% 100.0% 100.0% 100.0% 100.0% 100.0% 100.0% 100.0% 100.0% 100.0% 100.0% 100.0% 100.0% 100.0% 100.0% 100.0% 100.0% 100.0% 100.0% 100.0%
No Answer- - - - - - - - - - - - - - - - - - - -
Yes164 23 25 32 83 7 156 57 107 8 150 127 6 34 96 55 13 117 35 10
93.2% 88.5% 86.2% 94.1% 96.5% 100.0% 92.9% 95.0% 92.2% 88.9% 93.8% 92.7% 100.0% 87.2% 89.7% 100.0% 92.9% 90.7% 100.0% 100.0% ** ** ** ** ** N ** q **
No12 3 4 2 3 - 12 3 9 1 10 10 - 5 11 - 1 12 - -
6.8% 11.5% 13.8% 5.9% 3.5% - 7.1% 5.0% 7.8% 11.1% 6.3% 7.3% - 12.8% 10.3% - 7.1% 9.3% - - ** ** ** ** ** O ** r **
HEDIS/CAHPSSUMMARYRATE - Yes
164 23 25 32 83 7 156 57 107 8 150 127 6 34 96 55 13 117 35 1093.2% 88.5% 86.2% 94.1% 96.5% 100.0% 92.9% 95.0% 92.2% 88.9% 93.8% 92.7% 100.0% 87.2% 89.7% 100.0% 92.9% 90.7% 100.0% 100.0%
** ** ** ** ** N ** q **
Cell Contents: - Count- Column Percentage- Statistical Test ResultsStatistics: Overlap formulae used- Column Proportions: Columns Tested (5%): A/B/C/D, E/F, G/H, I/J,K/L/M, N/O/P, Q/R/S, (10%): a/b/c/d, e/f, g/h, i/j,k/l/m, n/o/p, q/r/s Minimum Base: 30 (**), Small Base: 30 (*)
Presented by SPH Analytics770-978-3173
2016

Q16. In the last 12 months, how many times did youvisit your personal doctor to get care for yourself?
Regence BCBS2016 CAHPS 5.0H Commercial Adult Survey (1113020)
Table: 15Level: Top
AGE (Q59) EDUCATION(Q61)
GENDER(Q60)
ETHNICITY(Q62) RACE (Q63) HEALTH STATUS
(Q43)MENTAL HEALTH
(Q44)
Total 18 to34
35 to44
45 to54
55 orolder
HS/GED/Less
SomeColg/Grad+
Male Female Hispanicor Latino
NotHispanicor Latino
WhiteBlack orAfrican-
AmericanOther Excellent/
Very good Good Fair/Poor
Excellent/Very good Good Fair/
Poor
A B C D E F G H I J K L M N O P Q R S
Q16. In the last 12 months, how many times did you visit your personal doctor to get care for yourself?
Total Eligible164 23 25 32 83 7 156 57 107 8 150 127 6 34 96 55 13 117 35 10
100.0% 100.0% 100.0% 100.0% 100.0% 100.0% 100.0% 100.0% 100.0% 100.0% 100.0% 100.0% 100.0% 100.0% 100.0% 100.0% 100.0% 100.0% 100.0% 100.0%
Total ValidResponses
163 23 25 32 82 7 155 57 106 8 149 126 6 34 95 55 13 116 35 10100.0% 100.0% 100.0% 100.0% 100.0% 100.0% 100.0% 100.0% 100.0% 100.0% 100.0% 100.0% 100.0% 100.0% 100.0% 100.0% 100.0% 100.0% 100.0% 100.0%
No Answer1 - - - 1 - 1 - 1 - 1 1 - - 1 - - 1 - -
None14 - 3 7 4 1 13 3 11 - 14 9 - 5 8 6 - 10 4 -
8.6% - 12.0% 21.9% 4.9% 14.3% 8.4% 5.3% 10.4% - 9.4% 7.1% - 14.7% 8.4% 10.9% - 8.6% 11.4% - ** ** D ** ** ** ** **
1 time58 11 11 10 25 1 57 21 37 1 55 46 1 15 38 18 2 44 11 3
35.6% 47.8% 44.0% 31.3% 30.5% 14.3% 36.8% 36.8% 34.9% 12.5% 36.9% 36.5% 16.7% 44.1% 40.0% 32.7% 15.4% 37.9% 31.4% 30.0% ** ** ** ** ** ** **
246 5 6 10 25 3 42 17 29 3 41 35 2 8 27 17 2 33 11 1
28.2% 21.7% 24.0% 31.3% 30.5% 42.9% 27.1% 29.8% 27.4% 37.5% 27.5% 27.8% 33.3% 23.5% 28.4% 30.9% 15.4% 28.4% 31.4% 10.0% ** ** ** ** ** ** **
317 2 2 1 12 - 17 5 12 1 15 13 1 3 8 7 2 13 1 2
10.4% 8.7% 8.0% 3.1% 14.6% - 11.0% 8.8% 11.3% 12.5% 10.1% 10.3% 16.7% 8.8% 8.4% 12.7% 15.4% 11.2% 2.9% 20.0% ** ** c ** ** ** ** **
414 2 2 3 7 1 13 4 10 2 12 11 1 2 7 3 4 7 6 1
8.6% 8.7% 8.0% 9.4% 8.5% 14.3% 8.4% 7.0% 9.4% 25.0% 8.1% 8.7% 16.7% 5.9% 7.4% 5.5% 30.8% 6.0% 17.1% 10.0% ** ** ** ** ** ** Q **
5 to 913 3 1 1 8 1 12 7 6 1 11 11 1 1 7 3 3 8 2 3
8.0% 13.0% 4.0% 3.1% 9.8% 14.3% 7.7% 12.3% 5.7% 12.5% 7.4% 8.7% 16.7% 2.9% 7.4% 5.5% 23.1% 6.9% 5.7% 30.0% ** ** ** ** ** ** **
10 or moretimes
1 - - - 1 - 1 - 1 - 1 1 - - - 1 - 1 - -0.6% - - - 1.2% - 0.6% - 0.9% - 0.7% 0.8% - - - 1.8% - 0.9% - -
** ** ** ** ** ** **HEDIS/CAHPSSUMMARYRATE - 1 ormore times
149 23 22 25 78 6 142 54 95 8 135 117 6 29 87 49 13 106 31 1091.4% 100.0% 88.0% 78.1% 95.1% 85.7% 91.6% 94.7% 89.6% 100.0% 90.6% 92.9% 100.0% 85.3% 91.6% 89.1% 100.0% 91.4% 88.6% 100.0%
** ** C ** ** ** ** **
Cell Contents: - Count- Column Percentage- Statistical Test ResultsStatistics: Overlap formulae used- Column Proportions: Columns Tested (5%): A/B/C/D, E/F, G/H, I/J,K/L/M, N/O/P, Q/R/S, (10%): a/b/c/d, e/f, g/h, i/j,k/l/m, n/o/p, q/r/s Minimum Base: 30 (**), Small Base: 30 (*)
Presented by SPH Analytics770-978-3173
2016

Q17. (HWDC) In the last 12 months, how often didyour personal doctor explain things in a way thatwas easy to understand?
Regence BCBS2016 CAHPS 5.0H Commercial Adult Survey (1113020)
Table: 16Level: Top
AGE (Q59) EDUCATION(Q61)
GENDER(Q60)
ETHNICITY(Q62) RACE (Q63) HEALTH STATUS
(Q43)MENTAL HEALTH
(Q44)
Total 18 to34
35 to44
45 to54
55 orolder
HS/GED/Less
SomeColg/Grad+
Male Female Hispanicor Latino
NotHispanicor Latino
WhiteBlack orAfrican-
AmericanOther Excellent/
Very good Good Fair/Poor
Excellent/Very good Good Fair/
Poor
A B C D E F G H I J K L M N O P Q R S
Q17. (HWDC) In the last 12 months, how often did your personal doctor explain things in a way that was easy to understand?
Total Eligible149 23 22 25 78 6 142 54 95 8 135 117 6 29 87 49 13 106 31 10
100.0% 100.0% 100.0% 100.0% 100.0% 100.0% 100.0% 100.0% 100.0% 100.0% 100.0% 100.0% 100.0% 100.0% 100.0% 100.0% 100.0% 100.0% 100.0% 100.0%
Total ValidResponses
149 23 22 25 78 6 142 54 95 8 135 117 6 29 87 49 13 106 31 10100.0% 100.0% 100.0% 100.0% 100.0% 100.0% 100.0% 100.0% 100.0% 100.0% 100.0% 100.0% 100.0% 100.0% 100.0% 100.0% 100.0% 100.0% 100.0% 100.0%
No Answer- - - - - - - - - - - - - - - - - - - -
Always116 19 14 20 62 6 109 39 77 5 106 92 4 21 69 38 9 84 27 5
77.9% 82.6% 63.6% 80.0% 79.5% 100.0% 76.8% 72.2% 81.1% 62.5% 78.5% 78.6% 66.7% 72.4% 79.3% 77.6% 69.2% 79.2% 87.1% 50.0% ** ** ** ** ** ** ** ** **
Usually27 2 8 5 12 - 27 12 15 1 25 21 2 6 16 9 2 19 2 4
18.1% 8.7% 36.4% 20.0% 15.4% - 19.0% 22.2% 15.8% 12.5% 18.5% 17.9% 33.3% 20.7% 18.4% 18.4% 15.4% 17.9% 6.5% 40.0% ** ** ** ** ** ** ** ** **
Sometimes4 1 - - 3 - 4 2 2 1 3 3 - 1 2 1 1 2 2 -
2.7% 4.3% - - 3.8% - 2.8% 3.7% 2.1% 12.5% 2.2% 2.6% - 3.4% 2.3% 2.0% 7.7% 1.9% 6.5% - ** ** ** ** ** ** ** ** **
Never2 1 - - 1 - 2 1 1 1 1 1 - 1 - 1 1 1 - 1
1.3% 4.3% - - 1.3% - 1.4% 1.9% 1.1% 12.5% 0.7% 0.9% - 3.4% - 2.0% 7.7% 0.9% - 10.0% ** ** ** ** ** ** ** ** **
HEDIS/CAHPSSUMMARYRATE -Always/Usually
143 21 22 25 74 6 136 51 92 6 131 113 6 27 85 47 11 103 29 996.0% 91.3% 100.0% 100.0% 94.9% 100.0% 95.8% 94.4% 96.8% 75.0% 97.0% 96.6% 100.0% 93.1% 97.7% 95.9% 84.6% 97.2% 93.5% 90.0%
** ** ** ** ** ** ** ** **
HEDIS/CAHPSSUMMARYRATE - Always
116 19 14 20 62 6 109 39 77 5 106 92 4 21 69 38 9 84 27 577.9% 82.6% 63.6% 80.0% 79.5% 100.0% 76.8% 72.2% 81.1% 62.5% 78.5% 78.6% 66.7% 72.4% 79.3% 77.6% 69.2% 79.2% 87.1% 50.0%
** ** ** ** ** ** ** ** **
3-Point Score2.74 2.74 2.64 2.80 2.74 3.00 2.73 2.67 2.78 2.38 2.76 2.75 2.67 2.66 2.77 2.73 2.54 2.76 2.81 2.40
Cell Contents: - Count- Column Percentage- Statistical Test ResultsStatistics: Overlap formulae used- Column Proportions: Columns Tested (5%): A/B/C/D, E/F, G/H, I/J,K/L/M, N/O/P, Q/R/S, (10%): a/b/c/d, e/f, g/h, i/j,k/l/m, n/o/p, q/r/s Minimum Base: 30 (**), Small Base: 30 (*)
Presented by SPH Analytics770-978-3173
2016

Q18. (HWDC) In the last 12 months, how often didyour personal doctor listen carefully to you?
Regence BCBS2016 CAHPS 5.0H Commercial Adult Survey (1113020)
Table: 17Level: Top
AGE (Q59) EDUCATION(Q61)
GENDER(Q60)
ETHNICITY(Q62) RACE (Q63) HEALTH STATUS
(Q43)MENTAL HEALTH
(Q44)
Total 18 to34
35 to44
45 to54
55 orolder
HS/GED/Less
SomeColg/Grad+
Male Female Hispanicor Latino
NotHispanicor Latino
WhiteBlack orAfrican-
AmericanOther Excellent/
Very good Good Fair/Poor
Excellent/Very good Good Fair/
Poor
A B C D E F G H I J K L M N O P Q R S
Q18. (HWDC) In the last 12 months, how often did your personal doctor listen carefully to you?
Total Eligible149 23 22 25 78 6 142 54 95 8 135 117 6 29 87 49 13 106 31 10
100.0% 100.0% 100.0% 100.0% 100.0% 100.0% 100.0% 100.0% 100.0% 100.0% 100.0% 100.0% 100.0% 100.0% 100.0% 100.0% 100.0% 100.0% 100.0% 100.0%
Total ValidResponses
149 23 22 25 78 6 142 54 95 8 135 117 6 29 87 49 13 106 31 10100.0% 100.0% 100.0% 100.0% 100.0% 100.0% 100.0% 100.0% 100.0% 100.0% 100.0% 100.0% 100.0% 100.0% 100.0% 100.0% 100.0% 100.0% 100.0% 100.0%
No Answer- - - - - - - - - - - - - - - - - - - -
Always114 17 15 19 62 6 107 39 75 4 105 93 4 19 68 37 9 81 26 6
76.5% 73.9% 68.2% 76.0% 79.5% 100.0% 75.4% 72.2% 78.9% 50.0% 77.8% 79.5% 66.7% 65.5% 78.2% 75.5% 69.2% 76.4% 83.9% 60.0% ** ** ** ** ** ** ** ** **
Usually26 5 6 6 9 - 26 11 15 2 23 16 2 9 16 8 2 20 4 2
17.4% 21.7% 27.3% 24.0% 11.5% - 18.3% 20.4% 15.8% 25.0% 17.0% 13.7% 33.3% 31.0% 18.4% 16.3% 15.4% 18.9% 12.9% 20.0% ** ** ** ** ** ** ** ** **
Sometimes7 - 1 - 6 - 7 3 4 2 5 6 - 1 3 3 1 4 1 1
4.7% - 4.5% - 7.7% - 4.9% 5.6% 4.2% 25.0% 3.7% 5.1% - 3.4% 3.4% 6.1% 7.7% 3.8% 3.2% 10.0% ** ** ** ** ** ** ** ** **
Never2 1 - - 1 - 2 1 1 - 2 2 - - - 1 1 1 - 1
1.3% 4.3% - - 1.3% - 1.4% 1.9% 1.1% - 1.5% 1.7% - - - 2.0% 7.7% 0.9% - 10.0% ** ** ** ** ** ** ** ** **
HEDIS/CAHPSSUMMARYRATE -Always/Usually
140 22 21 25 71 6 133 50 90 6 128 109 6 28 84 45 11 101 30 894.0% 95.7% 95.5% 100.0% 91.0% 100.0% 93.7% 92.6% 94.7% 75.0% 94.8% 93.2% 100.0% 96.6% 96.6% 91.8% 84.6% 95.3% 96.8% 80.0%
** ** ** ** ** ** ** ** **
HEDIS/CAHPSSUMMARYRATE - Always
114 17 15 19 62 6 107 39 75 4 105 93 4 19 68 37 9 81 26 676.5% 73.9% 68.2% 76.0% 79.5% 100.0% 75.4% 72.2% 78.9% 50.0% 77.8% 79.5% 66.7% 65.5% 78.2% 75.5% 69.2% 76.4% 83.9% 60.0%
** ** ** ** ** ** ** ** **
3-Point Score2.70 2.70 2.64 2.76 2.71 3.00 2.69 2.65 2.74 2.25 2.73 2.73 2.67 2.62 2.75 2.67 2.54 2.72 2.81 2.40
Cell Contents: - Count- Column Percentage- Statistical Test ResultsStatistics: Overlap formulae used- Column Proportions: Columns Tested (5%): A/B/C/D, E/F, G/H, I/J,K/L/M, N/O/P, Q/R/S, (10%): a/b/c/d, e/f, g/h, i/j,k/l/m, n/o/p, q/r/s Minimum Base: 30 (**), Small Base: 30 (*)
Presented by SPH Analytics770-978-3173
2016

Q19. (HWDC) In the last 12 months, how often didyour personal doctor show respect for what you hadto say?
Regence BCBS2016 CAHPS 5.0H Commercial Adult Survey (1113020)
Table: 18Level: Top
AGE (Q59) EDUCATION(Q61)
GENDER(Q60)
ETHNICITY(Q62) RACE (Q63) HEALTH STATUS
(Q43)MENTAL HEALTH
(Q44)
Total 18 to34
35 to44
45 to54
55 orolder
HS/GED/Less
SomeColg/Grad+
Male Female Hispanicor Latino
NotHispanicor Latino
WhiteBlack orAfrican-
AmericanOther Excellent/
Very good Good Fair/Poor
Excellent/Very good Good Fair/
Poor
A B C D E F G H I J K L M N O P Q R S
Q19. (HWDC) In the last 12 months, how often did your personal doctor show respect for what you had to say?
Total Eligible149 23 22 25 78 6 142 54 95 8 135 117 6 29 87 49 13 106 31 10
100.0% 100.0% 100.0% 100.0% 100.0% 100.0% 100.0% 100.0% 100.0% 100.0% 100.0% 100.0% 100.0% 100.0% 100.0% 100.0% 100.0% 100.0% 100.0% 100.0%
Total ValidResponses
149 23 22 25 78 6 142 54 95 8 135 117 6 29 87 49 13 106 31 10100.0% 100.0% 100.0% 100.0% 100.0% 100.0% 100.0% 100.0% 100.0% 100.0% 100.0% 100.0% 100.0% 100.0% 100.0% 100.0% 100.0% 100.0% 100.0% 100.0%
No Answer- - - - - - - - - - - - - - - - - - - -
Always123 18 17 24 63 6 116 42 81 7 111 98 4 23 75 39 9 91 25 6
82.6% 78.3% 77.3% 96.0% 80.8% 100.0% 81.7% 77.8% 85.3% 87.5% 82.2% 83.8% 66.7% 79.3% 86.2% 79.6% 69.2% 85.8% 80.6% 60.0% ** ** ** ** ** ** ** ** **
Usually21 4 5 1 11 - 21 9 12 - 20 14 2 6 11 8 2 12 6 2
14.1% 17.4% 22.7% 4.0% 14.1% - 14.8% 16.7% 12.6% - 14.8% 12.0% 33.3% 20.7% 12.6% 16.3% 15.4% 11.3% 19.4% 20.0% ** ** ** ** ** ** ** ** **
Sometimes4 - - - 4 - 4 2 2 1 3 4 - - 1 2 1 3 - 1
2.7% - - - 5.1% - 2.8% 3.7% 2.1% 12.5% 2.2% 3.4% - - 1.1% 4.1% 7.7% 2.8% - 10.0% ** ** ** ** ** ** ** ** **
Never1 1 - - - - 1 1 - - 1 1 - - - - 1 - - 1
0.7% 4.3% - - - - 0.7% 1.9% - - 0.7% 0.9% - - - - 7.7% - - 10.0% ** ** ** ** ** ** ** ** **
HEDIS/CAHPSSUMMARYRATE -Always/Usually
144 22 22 25 74 6 137 51 93 7 131 112 6 29 86 47 11 103 31 896.6% 95.7% 100.0% 100.0% 94.9% 100.0% 96.5% 94.4% 97.9% 87.5% 97.0% 95.7% 100.0% 100.0% 98.9% 95.9% 84.6% 97.2% 100.0% 80.0%
** ** ** ** ** ** ** ** **
HEDIS/CAHPSSUMMARYRATE - Always
123 18 17 24 63 6 116 42 81 7 111 98 4 23 75 39 9 91 25 682.6% 78.3% 77.3% 96.0% 80.8% 100.0% 81.7% 77.8% 85.3% 87.5% 82.2% 83.8% 66.7% 79.3% 86.2% 79.6% 69.2% 85.8% 80.6% 60.0%
** ** ** ** ** ** ** ** **
3-Point Score2.79 2.74 2.77 2.96 2.76 3.00 2.78 2.72 2.83 2.75 2.79 2.79 2.67 2.79 2.85 2.76 2.54 2.83 2.81 2.40
Cell Contents: - Count- Column Percentage- Statistical Test ResultsStatistics: Overlap formulae used- Column Proportions: Columns Tested (5%): A/B/C/D, E/F, G/H, I/J,K/L/M, N/O/P, Q/R/S, (10%): a/b/c/d, e/f, g/h, i/j,k/l/m, n/o/p, q/r/s Minimum Base: 30 (**), Small Base: 30 (*)
Presented by SPH Analytics770-978-3173
2016

Q20. (HWDC) In the last 12 months, how often didyour personal doctor spend enough time with you?
Regence BCBS2016 CAHPS 5.0H Commercial Adult Survey (1113020)
Table: 19Level: Top
AGE (Q59) EDUCATION(Q61)
GENDER(Q60)
ETHNICITY(Q62) RACE (Q63) HEALTH STATUS
(Q43)MENTAL HEALTH
(Q44)
Total 18 to34
35 to44
45 to54
55 orolder
HS/GED/Less
SomeColg/Grad+
Male Female Hispanicor Latino
NotHispanicor Latino
WhiteBlack orAfrican-
AmericanOther Excellent/
Very good Good Fair/Poor
Excellent/Very good Good Fair/
Poor
A B C D E F G H I J K L M N O P Q R S
Q20. (HWDC) In the last 12 months, how often did your personal doctor spend enough time with you?
Total Eligible149 23 22 25 78 6 142 54 95 8 135 117 6 29 87 49 13 106 31 10
100.0% 100.0% 100.0% 100.0% 100.0% 100.0% 100.0% 100.0% 100.0% 100.0% 100.0% 100.0% 100.0% 100.0% 100.0% 100.0% 100.0% 100.0% 100.0% 100.0%
Total ValidResponses
149 23 22 25 78 6 142 54 95 8 135 117 6 29 87 49 13 106 31 10100.0% 100.0% 100.0% 100.0% 100.0% 100.0% 100.0% 100.0% 100.0% 100.0% 100.0% 100.0% 100.0% 100.0% 100.0% 100.0% 100.0% 100.0% 100.0% 100.0%
No Answer- - - - - - - - - - - - - - - - - - - -
Always105 15 12 20 57 4 100 40 65 6 95 88 3 17 62 33 10 76 23 6
70.5% 65.2% 54.5% 80.0% 73.1% 66.7% 70.4% 74.1% 68.4% 75.0% 70.4% 75.2% 50.0% 58.6% 71.3% 67.3% 76.9% 71.7% 74.2% 60.0% ** ** ** ** ** ** ** ** **
Usually32 4 10 5 13 2 30 9 23 - 31 19 3 10 20 10 2 25 4 2
21.5% 17.4% 45.5% 20.0% 16.7% 33.3% 21.1% 16.7% 24.2% - 23.0% 16.2% 50.0% 34.5% 23.0% 20.4% 15.4% 23.6% 12.9% 20.0% ** ** ** ** ** ** ** ** **
Sometimes9 3 - - 6 - 9 3 6 2 6 7 - 2 4 5 - 5 2 1
6.0% 13.0% - - 7.7% - 6.3% 5.6% 6.3% 25.0% 4.4% 6.0% - 6.9% 4.6% 10.2% - 4.7% 6.5% 10.0% ** ** ** ** ** ** ** ** **
Never3 1 - - 2 - 3 2 1 - 3 3 - - 1 1 1 - 2 1
2.0% 4.3% - - 2.6% - 2.1% 3.7% 1.1% - 2.2% 2.6% - - 1.1% 2.0% 7.7% - 6.5% 10.0% ** ** ** ** ** ** ** ** Q **
HEDIS/CAHPSSUMMARYRATE -Always/Usually
137 19 22 25 70 6 130 49 88 6 126 107 6 27 82 43 12 101 27 891.9% 82.6% 100.0% 100.0% 89.7% 100.0% 91.5% 90.7% 92.6% 75.0% 93.3% 91.5% 100.0% 93.1% 94.3% 87.8% 92.3% 95.3% 87.1% 80.0%
** ** ** ** ** ** ** ** **
HEDIS/CAHPSSUMMARYRATE - Always
105 15 12 20 57 4 100 40 65 6 95 88 3 17 62 33 10 76 23 670.5% 65.2% 54.5% 80.0% 73.1% 66.7% 70.4% 74.1% 68.4% 75.0% 70.4% 75.2% 50.0% 58.6% 71.3% 67.3% 76.9% 71.7% 74.2% 60.0%
** ** ** ** ** ** ** ** **
3-Point Score2.62 2.48 2.55 2.80 2.63 2.67 2.62 2.65 2.61 2.50 2.64 2.67 2.50 2.52 2.66 2.55 2.69 2.67 2.61 2.40
Cell Contents: - Count- Column Percentage- Statistical Test ResultsStatistics: Overlap formulae used- Column Proportions: Columns Tested (5%): A/B/C/D, E/F, G/H, I/J,K/L/M, N/O/P, Q/R/S, (10%): a/b/c/d, e/f, g/h, i/j,k/l/m, n/o/p, q/r/s Minimum Base: 30 (**), Small Base: 30 (*)
Presented by SPH Analytics770-978-3173
2016

Q21. In the last 12 months, did you get care from adoctor or other health provider besides your personaldoctor?
Regence BCBS2016 CAHPS 5.0H Commercial Adult Survey (1113020)
Table: 20Level: Top
AGE (Q59) EDUCATION(Q61)
GENDER(Q60)
ETHNICITY(Q62) RACE (Q63) HEALTH STATUS
(Q43)MENTAL HEALTH
(Q44)
Total 18 to34
35 to44
45 to54
55 orolder
HS/GED/Less
SomeColg/Grad+
Male Female Hispanicor Latino
NotHispanicor Latino
WhiteBlack orAfrican-
AmericanOther Excellent/
Very good Good Fair/Poor
Excellent/Very good Good Fair/
Poor
A B C D E F G H I J K L M N O P Q R S
Q21. In the last 12 months, did you get care from a doctor or other health provider besides your personal doctor?
Total Eligible149 23 22 25 78 6 142 54 95 8 135 117 6 29 87 49 13 106 31 10
100.0% 100.0% 100.0% 100.0% 100.0% 100.0% 100.0% 100.0% 100.0% 100.0% 100.0% 100.0% 100.0% 100.0% 100.0% 100.0% 100.0% 100.0% 100.0% 100.0%
Total ValidResponses
149 23 22 25 78 6 142 54 95 8 135 117 6 29 87 49 13 106 31 10100.0% 100.0% 100.0% 100.0% 100.0% 100.0% 100.0% 100.0% 100.0% 100.0% 100.0% 100.0% 100.0% 100.0% 100.0% 100.0% 100.0% 100.0% 100.0% 100.0%
No Answer- - - - - - - - - - - - - - - - - - - -
Yes107 18 15 18 56 5 101 38 69 6 97 83 5 20 61 36 10 74 23 9
71.8% 78.3% 68.2% 72.0% 71.8% 83.3% 71.1% 70.4% 72.6% 75.0% 71.9% 70.9% 83.3% 69.0% 70.1% 73.5% 76.9% 69.8% 74.2% 90.0% ** ** ** ** ** ** ** ** **
No42 5 7 7 22 1 41 16 26 2 38 34 1 9 26 13 3 32 8 1
28.2% 21.7% 31.8% 28.0% 28.2% 16.7% 28.9% 29.6% 27.4% 25.0% 28.1% 29.1% 16.7% 31.0% 29.9% 26.5% 23.1% 30.2% 25.8% 10.0% ** ** ** ** ** ** ** ** **
HEDIS/CAHPSSUMMARYRATE - Yes
107 18 15 18 56 5 101 38 69 6 97 83 5 20 61 36 10 74 23 971.8% 78.3% 68.2% 72.0% 71.8% 83.3% 71.1% 70.4% 72.6% 75.0% 71.9% 70.9% 83.3% 69.0% 70.1% 73.5% 76.9% 69.8% 74.2% 90.0%
** ** ** ** ** ** ** ** **
Cell Contents: - Count- Column Percentage- Statistical Test ResultsStatistics: Overlap formulae used- Column Proportions: Columns Tested (5%): A/B/C/D, E/F, G/H, I/J,K/L/M, N/O/P, Q/R/S, (10%): a/b/c/d, e/f, g/h, i/j,k/l/m, n/o/p, q/r/s Minimum Base: 30 (**), Small Base: 30 (*)
Presented by SPH Analytics770-978-3173
2016
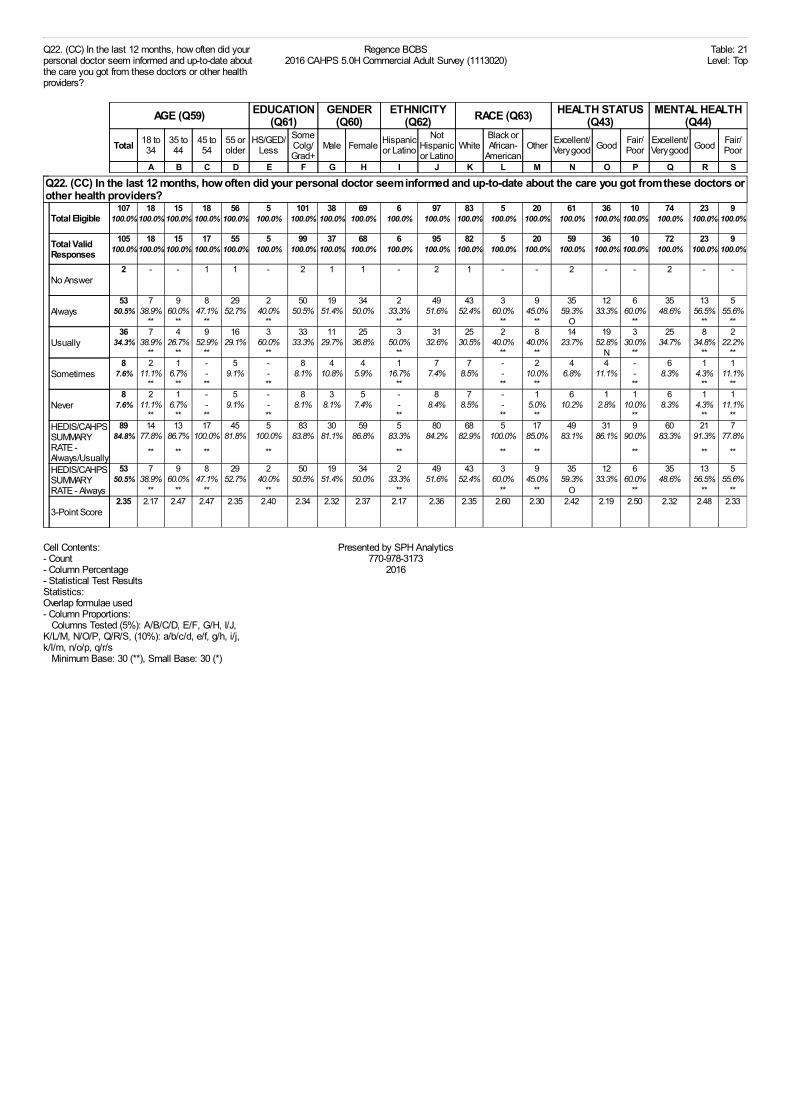
Q22. (CC) In the last 12 months, how often did yourpersonal doctor seem informed and up-to-date aboutthe care you got from these doctors or other healthproviders?
Regence BCBS2016 CAHPS 5.0H Commercial Adult Survey (1113020)
Table: 21Level: Top
AGE (Q59) EDUCATION(Q61)
GENDER(Q60)
ETHNICITY(Q62) RACE (Q63) HEALTH STATUS
(Q43)MENTAL HEALTH
(Q44)
Total 18 to34
35 to44
45 to54
55 orolder
HS/GED/Less
SomeColg/Grad+
Male Female Hispanicor Latino
NotHispanicor Latino
WhiteBlack orAfrican-
AmericanOther Excellent/
Very good Good Fair/Poor
Excellent/Very good Good Fair/
Poor
A B C D E F G H I J K L M N O P Q R S
Q22. (CC) In the last 12 months, how often did your personal doctor seem informed and up-to-date about the care you got from these doctors orother health providers?
Total Eligible107 18 15 18 56 5 101 38 69 6 97 83 5 20 61 36 10 74 23 9
100.0% 100.0% 100.0% 100.0% 100.0% 100.0% 100.0% 100.0% 100.0% 100.0% 100.0% 100.0% 100.0% 100.0% 100.0% 100.0% 100.0% 100.0% 100.0% 100.0%
Total ValidResponses
105 18 15 17 55 5 99 37 68 6 95 82 5 20 59 36 10 72 23 9100.0% 100.0% 100.0% 100.0% 100.0% 100.0% 100.0% 100.0% 100.0% 100.0% 100.0% 100.0% 100.0% 100.0% 100.0% 100.0% 100.0% 100.0% 100.0% 100.0%
No Answer2 - - 1 1 - 2 1 1 - 2 1 - - 2 - - 2 - -
Always53 7 9 8 29 2 50 19 34 2 49 43 3 9 35 12 6 35 13 5
50.5% 38.9% 60.0% 47.1% 52.7% 40.0% 50.5% 51.4% 50.0% 33.3% 51.6% 52.4% 60.0% 45.0% 59.3% 33.3% 60.0% 48.6% 56.5% 55.6% ** ** ** ** ** ** ** O ** ** **
Usually36 7 4 9 16 3 33 11 25 3 31 25 2 8 14 19 3 25 8 2
34.3% 38.9% 26.7% 52.9% 29.1% 60.0% 33.3% 29.7% 36.8% 50.0% 32.6% 30.5% 40.0% 40.0% 23.7% 52.8% 30.0% 34.7% 34.8% 22.2% ** ** ** ** ** ** ** N ** ** **
Sometimes8 2 1 - 5 - 8 4 4 1 7 7 - 2 4 4 - 6 1 1
7.6% 11.1% 6.7% - 9.1% - 8.1% 10.8% 5.9% 16.7% 7.4% 8.5% - 10.0% 6.8% 11.1% - 8.3% 4.3% 11.1% ** ** ** ** ** ** ** ** ** **
Never8 2 1 - 5 - 8 3 5 - 8 7 - 1 6 1 1 6 1 1
7.6% 11.1% 6.7% - 9.1% - 8.1% 8.1% 7.4% - 8.4% 8.5% - 5.0% 10.2% 2.8% 10.0% 8.3% 4.3% 11.1% ** ** ** ** ** ** ** ** ** **
HEDIS/CAHPSSUMMARYRATE -Always/Usually
89 14 13 17 45 5 83 30 59 5 80 68 5 17 49 31 9 60 21 784.8% 77.8% 86.7% 100.0% 81.8% 100.0% 83.8% 81.1% 86.8% 83.3% 84.2% 82.9% 100.0% 85.0% 83.1% 86.1% 90.0% 83.3% 91.3% 77.8%
** ** ** ** ** ** ** ** ** **
HEDIS/CAHPSSUMMARYRATE - Always
53 7 9 8 29 2 50 19 34 2 49 43 3 9 35 12 6 35 13 550.5% 38.9% 60.0% 47.1% 52.7% 40.0% 50.5% 51.4% 50.0% 33.3% 51.6% 52.4% 60.0% 45.0% 59.3% 33.3% 60.0% 48.6% 56.5% 55.6%
** ** ** ** ** ** ** O ** ** **
3-Point Score2.35 2.17 2.47 2.47 2.35 2.40 2.34 2.32 2.37 2.17 2.36 2.35 2.60 2.30 2.42 2.19 2.50 2.32 2.48 2.33
Cell Contents: - Count- Column Percentage- Statistical Test ResultsStatistics: Overlap formulae used- Column Proportions: Columns Tested (5%): A/B/C/D, E/F, G/H, I/J,K/L/M, N/O/P, Q/R/S, (10%): a/b/c/d, e/f, g/h, i/j,k/l/m, n/o/p, q/r/s Minimum Base: 30 (**), Small Base: 30 (*)
Presented by SPH Analytics770-978-3173
2016
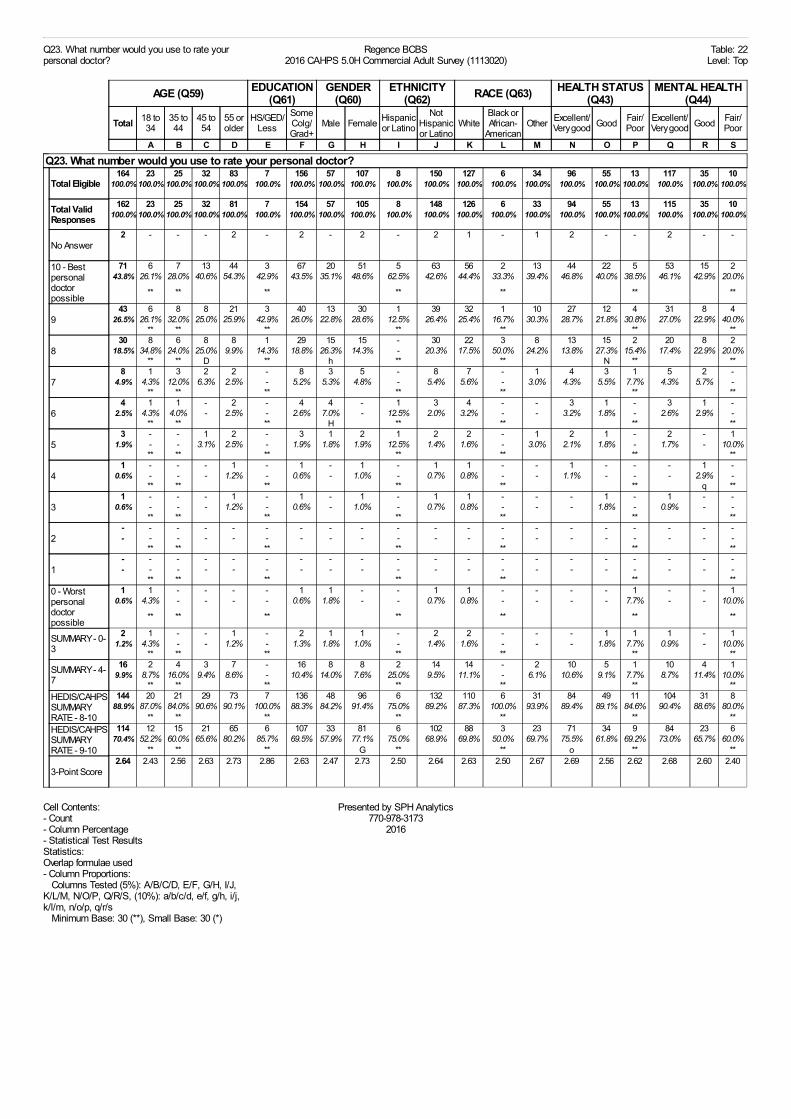
Q23. What number would you use to rate yourpersonal doctor?
Regence BCBS2016 CAHPS 5.0H Commercial Adult Survey (1113020)
Table: 22Level: Top
AGE (Q59) EDUCATION(Q61)
GENDER(Q60)
ETHNICITY(Q62) RACE (Q63) HEALTH STATUS
(Q43)MENTAL HEALTH
(Q44)
Total 18 to34
35 to44
45 to54
55 orolder
HS/GED/Less
SomeColg/Grad+
Male Female Hispanicor Latino
NotHispanicor Latino
WhiteBlack orAfrican-
AmericanOther Excellent/
Very good Good Fair/Poor
Excellent/Very good Good Fair/
Poor
A B C D E F G H I J K L M N O P Q R S
Q23. What number would you use to rate your personal doctor?
Total Eligible164 23 25 32 83 7 156 57 107 8 150 127 6 34 96 55 13 117 35 10
100.0% 100.0% 100.0% 100.0% 100.0% 100.0% 100.0% 100.0% 100.0% 100.0% 100.0% 100.0% 100.0% 100.0% 100.0% 100.0% 100.0% 100.0% 100.0% 100.0%
Total ValidResponses
162 23 25 32 81 7 154 57 105 8 148 126 6 33 94 55 13 115 35 10100.0% 100.0% 100.0% 100.0% 100.0% 100.0% 100.0% 100.0% 100.0% 100.0% 100.0% 100.0% 100.0% 100.0% 100.0% 100.0% 100.0% 100.0% 100.0% 100.0%
No Answer2 - - - 2 - 2 - 2 - 2 1 - 1 2 - - 2 - -
10 - Bestpersonaldoctorpossible
71 6 7 13 44 3 67 20 51 5 63 56 2 13 44 22 5 53 15 243.8% 26.1% 28.0% 40.6% 54.3% 42.9% 43.5% 35.1% 48.6% 62.5% 42.6% 44.4% 33.3% 39.4% 46.8% 40.0% 38.5% 46.1% 42.9% 20.0%
** ** ** ** ** ** **
943 6 8 8 21 3 40 13 30 1 39 32 1 10 27 12 4 31 8 4
26.5% 26.1% 32.0% 25.0% 25.9% 42.9% 26.0% 22.8% 28.6% 12.5% 26.4% 25.4% 16.7% 30.3% 28.7% 21.8% 30.8% 27.0% 22.9% 40.0% ** ** ** ** ** ** **
830 8 6 8 8 1 29 15 15 - 30 22 3 8 13 15 2 20 8 2
18.5% 34.8% 24.0% 25.0% 9.9% 14.3% 18.8% 26.3% 14.3% - 20.3% 17.5% 50.0% 24.2% 13.8% 27.3% 15.4% 17.4% 22.9% 20.0% ** ** D ** h ** ** N ** **
78 1 3 2 2 - 8 3 5 - 8 7 - 1 4 3 1 5 2 -
4.9% 4.3% 12.0% 6.3% 2.5% - 5.2% 5.3% 4.8% - 5.4% 5.6% - 3.0% 4.3% 5.5% 7.7% 4.3% 5.7% - ** ** ** ** ** ** **
64 1 1 - 2 - 4 4 - 1 3 4 - - 3 1 - 3 1 -
2.5% 4.3% 4.0% - 2.5% - 2.6% 7.0% - 12.5% 2.0% 3.2% - - 3.2% 1.8% - 2.6% 2.9% - ** ** ** H ** ** ** **
53 - - 1 2 - 3 1 2 1 2 2 - 1 2 1 - 2 - 1
1.9% - - 3.1% 2.5% - 1.9% 1.8% 1.9% 12.5% 1.4% 1.6% - 3.0% 2.1% 1.8% - 1.7% - 10.0% ** ** ** ** ** ** **
41 - - - 1 - 1 - 1 - 1 1 - - 1 - - - 1 -
0.6% - - - 1.2% - 0.6% - 1.0% - 0.7% 0.8% - - 1.1% - - - 2.9% - ** ** ** ** ** ** q **
31 - - - 1 - 1 - 1 - 1 1 - - - 1 - 1 - -
0.6% - - - 1.2% - 0.6% - 1.0% - 0.7% 0.8% - - - 1.8% - 0.9% - - ** ** ** ** ** ** **
2- - - - - - - - - - - - - - - - - - - -- - - - - - - - - - - - - - - - - - - - ** ** ** ** ** ** **
1- - - - - - - - - - - - - - - - - - - -- - - - - - - - - - - - - - - - - - - - ** ** ** ** ** ** **
0 - Worstpersonaldoctorpossible
1 1 - - - - 1 1 - - 1 1 - - - - 1 - - 10.6% 4.3% - - - - 0.6% 1.8% - - 0.7% 0.8% - - - - 7.7% - - 10.0%
** ** ** ** ** ** **
SUMMARY - 0-3
2 1 - - 1 - 2 1 1 - 2 2 - - - 1 1 1 - 11.2% 4.3% - - 1.2% - 1.3% 1.8% 1.0% - 1.4% 1.6% - - - 1.8% 7.7% 0.9% - 10.0%
** ** ** ** ** ** **
SUMMARY - 4-7
16 2 4 3 7 - 16 8 8 2 14 14 - 2 10 5 1 10 4 19.9% 8.7% 16.0% 9.4% 8.6% - 10.4% 14.0% 7.6% 25.0% 9.5% 11.1% - 6.1% 10.6% 9.1% 7.7% 8.7% 11.4% 10.0%
** ** ** ** ** ** **HEDIS/CAHPSSUMMARYRATE - 8-10
144 20 21 29 73 7 136 48 96 6 132 110 6 31 84 49 11 104 31 888.9% 87.0% 84.0% 90.6% 90.1% 100.0% 88.3% 84.2% 91.4% 75.0% 89.2% 87.3% 100.0% 93.9% 89.4% 89.1% 84.6% 90.4% 88.6% 80.0%
** ** ** ** ** ** **HEDIS/CAHPSSUMMARYRATE - 9-10
114 12 15 21 65 6 107 33 81 6 102 88 3 23 71 34 9 84 23 670.4% 52.2% 60.0% 65.6% 80.2% 85.7% 69.5% 57.9% 77.1% 75.0% 68.9% 69.8% 50.0% 69.7% 75.5% 61.8% 69.2% 73.0% 65.7% 60.0%
** ** ** G ** ** o ** **
3-Point Score2.64 2.43 2.56 2.63 2.73 2.86 2.63 2.47 2.73 2.50 2.64 2.63 2.50 2.67 2.69 2.56 2.62 2.68 2.60 2.40
Cell Contents: - Count- Column Percentage- Statistical Test ResultsStatistics: Overlap formulae used- Column Proportions: Columns Tested (5%): A/B/C/D, E/F, G/H, I/J,K/L/M, N/O/P, Q/R/S, (10%): a/b/c/d, e/f, g/h, i/j,k/l/m, n/o/p, q/r/s Minimum Base: 30 (**), Small Base: 30 (*)
Presented by SPH Analytics770-978-3173
2016

Q24. In the last 12 months, did you make anyappointments to see a specialist?
Regence BCBS2016 CAHPS 5.0H Commercial Adult Survey (1113020)
Table: 23Level: Top
AGE (Q59) EDUCATION(Q61)
GENDER(Q60)
ETHNICITY(Q62) RACE (Q63) HEALTH STATUS
(Q43)MENTAL HEALTH
(Q44)
Total 18 to34
35 to44
45 to54
55 orolder
HS/GED/Less
SomeColg/Grad+
Male Female Hispanicor Latino
NotHispanicor Latino
WhiteBlack orAfrican-
AmericanOther Excellent/
Very good Good Fair/Poor
Excellent/Very good Good Fair/
Poor
A B C D E F G H I J K L M N O P Q R S
Q24. In the last 12 months, did you make any appointments to see a specialist?
Total Eligible176 26 29 34 86 7 168 60 116 9 160 137 6 39 107 55 14 129 35 10
100.0% 100.0% 100.0% 100.0% 100.0% 100.0% 100.0% 100.0% 100.0% 100.0% 100.0% 100.0% 100.0% 100.0% 100.0% 100.0% 100.0% 100.0% 100.0% 100.0%
Total ValidResponses
175 26 29 34 85 7 167 60 115 9 159 137 6 38 106 55 14 128 35 10100.0% 100.0% 100.0% 100.0% 100.0% 100.0% 100.0% 100.0% 100.0% 100.0% 100.0% 100.0% 100.0% 100.0% 100.0% 100.0% 100.0% 100.0% 100.0% 100.0%
No Answer1 - - - 1 - 1 - 1 - 1 - - 1 1 - - 1 - -
Yes115 16 18 23 58 6 108 41 74 5 105 89 5 23 67 38 10 82 24 8
65.7% 61.5% 62.1% 67.6% 68.2% 85.7% 64.7% 68.3% 64.3% 55.6% 66.0% 65.0% 83.3% 60.5% 63.2% 69.1% 71.4% 64.1% 68.6% 80.0% ** ** ** ** ** ** **
No60 10 11 11 27 1 59 19 41 4 54 48 1 15 39 17 4 46 11 2
34.3% 38.5% 37.9% 32.4% 31.8% 14.3% 35.3% 31.7% 35.7% 44.4% 34.0% 35.0% 16.7% 39.5% 36.8% 30.9% 28.6% 35.9% 31.4% 20.0% ** ** ** ** ** ** **
HEDIS/CAHPSSUMMARYRATE - Yes
115 16 18 23 58 6 108 41 74 5 105 89 5 23 67 38 10 82 24 865.7% 61.5% 62.1% 67.6% 68.2% 85.7% 64.7% 68.3% 64.3% 55.6% 66.0% 65.0% 83.3% 60.5% 63.2% 69.1% 71.4% 64.1% 68.6% 80.0%
** ** ** ** ** ** **
Cell Contents: - Count- Column Percentage- Statistical Test ResultsStatistics: Overlap formulae used- Column Proportions: Columns Tested (5%): A/B/C/D, E/F, G/H, I/J,K/L/M, N/O/P, Q/R/S, (10%): a/b/c/d, e/f, g/h, i/j,k/l/m, n/o/p, q/r/s Minimum Base: 30 (**), Small Base: 30 (*)
Presented by SPH Analytics770-978-3173
2016

Q25. (GNC) In the last 12 months, how often did youget an appointment to see a specialist as soon asyou needed?
Regence BCBS2016 CAHPS 5.0H Commercial Adult Survey (1113020)
Table: 24Level: Top
AGE (Q59) EDUCATION(Q61)
GENDER(Q60)
ETHNICITY(Q62) RACE (Q63) HEALTH STATUS
(Q43)MENTAL HEALTH
(Q44)
Total 18 to34
35 to44
45 to54
55 orolder
HS/GED/Less
SomeColg/Grad+
Male Female Hispanicor Latino
NotHispanicor Latino
WhiteBlack orAfrican-
AmericanOther Excellent/
Very good Good Fair/Poor
Excellent/Very good Good Fair/
Poor
A B C D E F G H I J K L M N O P Q R S
Q25. (GNC) In the last 12 months, how often did you get an appointment to see a specialist as soon as you needed?
Total Eligible115 16 18 23 58 6 108 41 74 5 105 89 5 23 67 38 10 82 24 8
100.0% 100.0% 100.0% 100.0% 100.0% 100.0% 100.0% 100.0% 100.0% 100.0% 100.0% 100.0% 100.0% 100.0% 100.0% 100.0% 100.0% 100.0% 100.0% 100.0%
Total ValidResponses
114 16 18 23 57 6 107 41 73 5 104 88 5 23 66 38 10 81 24 8100.0% 100.0% 100.0% 100.0% 100.0% 100.0% 100.0% 100.0% 100.0% 100.0% 100.0% 100.0% 100.0% 100.0% 100.0% 100.0% 100.0% 100.0% 100.0% 100.0%
No Answer1 - - - 1 - 1 - 1 - 1 1 - - 1 - - 1 - -
Always51 8 7 5 31 3 47 17 34 3 45 40 2 9 35 11 5 37 9 5
44.7% 50.0% 38.9% 21.7% 54.4% 50.0% 43.9% 41.5% 46.6% 60.0% 43.3% 45.5% 40.0% 39.1% 53.0% 28.9% 50.0% 45.7% 37.5% 62.5% ** ** ** ** ** ** ** O ** ** **
Usually39 4 9 11 15 2 37 17 22 2 37 31 2 8 20 18 1 30 8 1
34.2% 25.0% 50.0% 47.8% 26.3% 33.3% 34.6% 41.5% 30.1% 40.0% 35.6% 35.2% 40.0% 34.8% 30.3% 47.4% 10.0% 37.0% 33.3% 12.5% ** ** ** ** ** ** ** n ** ** **
Sometimes20 4 1 7 8 1 19 5 15 - 18 14 - 6 9 9 2 10 7 2
17.5% 25.0% 5.6% 30.4% 14.0% 16.7% 17.8% 12.2% 20.5% - 17.3% 15.9% - 26.1% 13.6% 23.7% 20.0% 12.3% 29.2% 25.0% ** ** ** ** ** ** ** ** ** **
Never4 - 1 - 3 - 4 2 2 - 4 3 1 - 2 - 2 4 - -
3.5% - 5.6% - 5.3% - 3.7% 4.9% 2.7% - 3.8% 3.4% 20.0% - 3.0% - 20.0% 4.9% - - ** ** ** ** ** ** ** ** ** **
HEDIS/CAHPSSUMMARYRATE -Always/Usually
90 12 16 16 46 5 84 34 56 5 82 71 4 17 55 29 6 67 17 678.9% 75.0% 88.9% 69.6% 80.7% 83.3% 78.5% 82.9% 76.7% 100.0% 78.8% 80.7% 80.0% 73.9% 83.3% 76.3% 60.0% 82.7% 70.8% 75.0%
** ** ** ** ** ** ** ** ** **
HEDIS/CAHPSSUMMARYRATE - Always
51 8 7 5 31 3 47 17 34 3 45 40 2 9 35 11 5 37 9 544.7% 50.0% 38.9% 21.7% 54.4% 50.0% 43.9% 41.5% 46.6% 60.0% 43.3% 45.5% 40.0% 39.1% 53.0% 28.9% 50.0% 45.7% 37.5% 62.5%
** ** ** ** ** ** ** O ** ** **
3-Point Score2.24 2.25 2.28 1.91 2.35 2.33 2.22 2.24 2.23 2.60 2.22 2.26 2.20 2.13 2.36 2.05 2.10 2.28 2.08 2.38
Cell Contents: - Count- Column Percentage- Statistical Test ResultsStatistics: Overlap formulae used- Column Proportions: Columns Tested (5%): A/B/C/D, E/F, G/H, I/J,K/L/M, N/O/P, Q/R/S, (10%): a/b/c/d, e/f, g/h, i/j,k/l/m, n/o/p, q/r/s Minimum Base: 30 (**), Small Base: 30 (*)
Presented by SPH Analytics770-978-3173
2016

Q26. How many specialists have you seen in thelast 12 months?
Regence BCBS2016 CAHPS 5.0H Commercial Adult Survey (1113020)
Table: 25Level: Top
AGE (Q59) EDUCATION(Q61)
GENDER(Q60)
ETHNICITY(Q62) RACE (Q63) HEALTH STATUS
(Q43)MENTAL HEALTH
(Q44)
Total 18 to34
35 to44
45 to54
55 orolder
HS/GED/Less
SomeColg/Grad+
Male Female Hispanicor Latino
NotHispanicor Latino
WhiteBlack orAfrican-
AmericanOther
Excellent/Verygood
Good Fair/Poor
Excellent/Verygood
Good Fair/Poor
A B C D E F G H I J K L M N O P Q R S
Q26. How many specialists have you seen in the last 12 months?
Total Eligible115 16 18 23 58 6 108 41 74 5 105 89 5 23 67 38 10 82 24 8
100.0% 100.0% 100.0% 100.0% 100.0% 100.0% 100.0% 100.0% 100.0% 100.0% 100.0% 100.0% 100.0% 100.0% 100.0% 100.0% 100.0% 100.0% 100.0% 100.0%
Total ValidResponses
114 16 18 23 57 6 107 41 73 5 104 88 5 23 66 38 10 81 24 8100.0% 100.0% 100.0% 100.0% 100.0% 100.0% 100.0% 100.0% 100.0% 100.0% 100.0% 100.0% 100.0% 100.0% 100.0% 100.0% 100.0% 100.0% 100.0% 100.0%
No Answer1 - - - 1 - 1 - 1 - 1 1 - - 1 - - 1 - -
None- - - - - - - - - - - - - - - - - - - -- - - - - - - - - - - - - - - - - - - - ** ** ** ** ** ** ** ** ** **
1 specialist59 8 11 14 26 4 54 22 37 2 53 45 1 14 36 20 3 41 14 4
51.8% 50.0% 61.1% 60.9% 45.6% 66.7% 50.5% 53.7% 50.7% 40.0% 51.0% 51.1% 20.0% 60.9% 54.5% 52.6% 30.0% 50.6% 58.3% 50.0% ** ** ** ** ** ** ** ** ** **
237 5 7 2 23 1 36 14 23 2 35 28 4 6 22 11 4 28 7 2
32.5% 31.3% 38.9% 8.7% 40.4% 16.7% 33.6% 34.1% 31.5% 40.0% 33.7% 31.8% 80.0% 26.1% 33.3% 28.9% 40.0% 34.6% 29.2% 25.0% ** ** ** ** ** ** ** ** ** **
311 1 - 3 7 - 11 4 7 1 10 9 - 2 5 3 3 7 2 2
9.6% 6.3% - 13.0% 12.3% - 10.3% 9.8% 9.6% 20.0% 9.6% 10.2% - 8.7% 7.6% 7.9% 30.0% 8.6% 8.3% 25.0% ** ** ** ** ** ** ** ** ** **
46 1 - 4 1 1 5 1 5 - 5 5 - 1 3 3 - 4 1 -
5.3% 6.3% - 17.4% 1.8% 16.7% 4.7% 2.4% 6.8% - 4.8% 5.7% - 4.3% 4.5% 7.9% - 4.9% 4.2% - ** ** ** ** ** ** ** ** ** **
5 or morespecialists
1 1 - - - - 1 - 1 - 1 1 - - - 1 - 1 - -0.9% 6.3% - - - - 0.9% - 1.4% - 1.0% 1.1% - - - 2.6% - 1.2% - -
** ** ** ** ** ** ** ** ** **HEDIS/CAHPSSUMMARYRATE - 1 ormorespecialists
114 16 18 23 57 6 107 41 73 5 104 88 5 23 66 38 10 81 24 8100.0%100.0% 100.0% 100.0% 100.0% 100.0% 100.0% 100.0% 100.0% 100.0% 100.0% 100.0% 100.0% 100.0% 100.0% 100.0% 100.0% 100.0% 100.0% 100.0%
** ** ** ** ** ** ** ** ** **
Cell Contents: - Count- Column Percentage- Statistical Test ResultsStatistics: Overlap formulae used- Column Proportions: Columns Tested (5%): A/B/C/D, E/F, G/H, I/J,K/L/M, N/O/P, Q/R/S, (10%): a/b/c/d, e/f, g/h, i/j,k/l/m, n/o/p, q/r/s Minimum Base: 30 (**), Small Base: 30 (*)
Presented by SPH Analytics770-978-3173
2016

Q27. What number would you use to rate thatspecialist?
Regence BCBS2016 CAHPS 5.0H Commercial Adult Survey (1113020)
Table: 26Level: Top
AGE (Q59) EDUCATION(Q61)
GENDER(Q60)
ETHNICITY(Q62) RACE (Q63) HEALTH STATUS
(Q43)MENTAL HEALTH
(Q44)
Total 18 to34
35 to44
45 to54
55 orolder
HS/GED/Less
SomeColg/Grad+
Male Female Hispanicor Latino
NotHispanicor Latino
WhiteBlack orAfrican-
AmericanOther Excellent/
Very good Good Fair/Poor
Excellent/Very good Good Fair/
Poor
A B C D E F G H I J K L M N O P Q R S
Q27. What number would you use to rate that specialist?
Total Eligible114 16 18 23 57 6 107 41 73 5 104 88 5 23 66 38 10 81 24 8
100.0% 100.0% 100.0% 100.0% 100.0% 100.0% 100.0% 100.0% 100.0% 100.0% 100.0% 100.0% 100.0% 100.0% 100.0% 100.0% 100.0% 100.0% 100.0% 100.0%
Total ValidResponses
114 16 18 23 57 6 107 41 73 5 104 88 5 23 66 38 10 81 24 8100.0% 100.0% 100.0% 100.0% 100.0% 100.0% 100.0% 100.0% 100.0% 100.0% 100.0% 100.0% 100.0% 100.0% 100.0% 100.0% 100.0% 100.0% 100.0% 100.0%
No Answer- - - - - - - - - - - - - - - - - - - -
10 - Bestspecialistpossible
43 6 5 7 25 3 40 10 33 1 38 37 1 5 33 10 - 32 10 -37.7% 37.5% 27.8% 30.4% 43.9% 50.0% 37.4% 24.4% 45.2% 20.0% 36.5% 42.0% 20.0% 21.7% 50.0% 26.3% - 39.5% 41.7% -
** ** ** ** G ** ** ** O ** ** **
929 2 5 3 19 2 27 12 17 3 26 23 1 5 13 13 3 20 6 3
25.4% 12.5% 27.8% 13.0% 33.3% 33.3% 25.2% 29.3% 23.3% 60.0% 25.0% 26.1% 20.0% 21.7% 19.7% 34.2% 30.0% 24.7% 25.0% 37.5% ** ** ** ** ** ** ** ** ** **
824 3 6 8 7 - 23 10 14 1 23 15 2 9 9 12 3 15 6 3
21.1% 18.8% 33.3% 34.8% 12.3% - 21.5% 24.4% 19.2% 20.0% 22.1% 17.0% 40.0% 39.1% 13.6% 31.6% 30.0% 18.5% 25.0% 37.5% ** ** ** ** ** ** ** N ** ** **
710 4 - 4 2 - 10 4 6 - 9 7 - 2 6 3 1 7 2 1
8.8% 25.0% - 17.4% 3.5% - 9.3% 9.8% 8.2% - 8.7% 8.0% - 8.7% 9.1% 7.9% 10.0% 8.6% 8.3% 12.5% ** ** ** ** ** ** ** ** ** **
62 1 - - 1 - 2 - 2 - 2 1 - 1 1 - 1 2 - -
1.8% 6.3% - - 1.8% - 1.9% - 2.7% - 1.9% 1.1% - 4.3% 1.5% - 10.0% 2.5% - - ** ** ** ** ** ** ** ** ** **
52 - 1 - 1 - 2 1 1 - 2 1 1 1 1 - 1 1 - 1
1.8% - 5.6% - 1.8% - 1.9% 2.4% 1.4% - 1.9% 1.1% 20.0% 4.3% 1.5% - 10.0% 1.2% - 12.5% ** ** ** ** ** ** ** ** ** **
41 - 1 - - 1 - 1 - - 1 1 - - 1 - - 1 - -
0.9% - 5.6% - - 16.7% - 2.4% - - 1.0% 1.1% - - 1.5% - - 1.2% - - ** ** ** ** ** ** ** ** ** **
32 - - - 2 - 2 2 - - 2 2 - - 1 - 1 2 - -
1.8% - - - 3.5% - 1.9% 4.9% - - 1.9% 2.3% - - 1.5% - 10.0% 2.5% - - ** ** ** ** h ** ** ** ** ** **
2- - - - - - - - - - - - - - - - - - - -- - - - - - - - - - - - - - - - - - - - ** ** ** ** ** ** ** ** ** **
11 - - 1 - - 1 1 - - 1 1 - - 1 - - 1 - -
0.9% - - 4.3% - - 0.9% 2.4% - - 1.0% 1.1% - - 1.5% - - 1.2% - - ** ** ** ** ** ** ** ** ** **
0 - Worstspecialistpossible
- - - - - - - - - - - - - - - - - - - -- - - - - - - - - - - - - - - - - - - - ** ** ** ** ** ** ** ** ** **
SUMMARY - 0-3
3 - - 1 2 - 3 3 - - 3 3 - - 2 - 1 3 - -2.6% - - 4.3% 3.5% - 2.8% 7.3% - - 2.9% 3.4% - - 3.0% - 10.0% 3.7% - -
** ** ** ** H ** ** ** ** ** **
SUMMARY - 4-7
15 5 2 4 4 1 14 6 9 - 14 10 1 4 9 3 3 11 2 213.2% 31.3% 11.1% 17.4% 7.0% 16.7% 13.1% 14.6% 12.3% - 13.5% 11.4% 20.0% 17.4% 13.6% 7.9% 30.0% 13.6% 8.3% 25.0%
** ** ** ** ** ** ** ** ** **HEDIS/CAHPSSUMMARYRATE - 8-10
96 11 16 18 51 5 90 32 64 5 87 75 4 19 55 35 6 67 22 684.2% 68.8% 88.9% 78.3% 89.5% 83.3% 84.1% 78.0% 87.7% 100.0% 83.7% 85.2% 80.0% 82.6% 83.3% 92.1% 60.0% 82.7% 91.7% 75.0%
** ** ** ** ** ** ** ** ** **HEDIS/CAHPSSUMMARYRATE - 9-10
72 8 10 10 44 5 67 22 50 4 64 60 2 10 46 23 3 52 16 363.2% 50.0% 55.6% 43.5% 77.2% 83.3% 62.6% 53.7% 68.5% 80.0% 61.5% 68.2% 40.0% 43.5% 69.7% 60.5% 30.0% 64.2% 66.7% 37.5%
** ** ** ** ** ** ** ** ** **
3-Point Score2.56 2.44 2.44 2.39 2.70 2.67 2.56 2.41 2.64 2.80 2.54 2.61 2.20 2.35 2.62 2.61 2.00 2.56 2.67 2.25
Cell Contents: - Count- Column Percentage- Statistical Test ResultsStatistics: Overlap formulae used- Column Proportions: Columns Tested (5%): A/B/C/D, E/F, G/H, I/J,K/L/M, N/O/P, Q/R/S, (10%): a/b/c/d, e/f, g/h, i/j,k/l/m, n/o/p, q/r/s Minimum Base: 30 (**), Small Base: 30 (*)
Presented by SPH Analytics770-978-3173
2016

Q28. In the last 12 months, did you look for anyinformation in written materials or on the Internetabout how your health plan works?
Regence BCBS2016 CAHPS 5.0H Commercial Adult Survey (1113020)
Table: 27Level: Top
AGE (Q59) EDUCATION(Q61)
GENDER(Q60)
ETHNICITY(Q62) RACE (Q63) HEALTH STATUS
(Q43)MENTAL HEALTH
(Q44)
Total 18 to34
35 to44
45 to54
55 orolder
HS/GED/Less
SomeColg/Grad+
Male Female Hispanicor Latino
NotHispanicor Latino
WhiteBlack orAfrican-
AmericanOther Excellent/
Very good Good Fair/Poor
Excellent/Very good Good Fair/
Poor
A B C D E F G H I J K L M N O P Q R S
Q28. In the last 12 months, did you look for any information in written materials or on the Internet about how your health plan works?
Total Eligible176 26 29 34 86 7 168 60 116 9 160 137 6 39 107 55 14 129 35 10
100.0% 100.0% 100.0% 100.0% 100.0% 100.0% 100.0% 100.0% 100.0% 100.0% 100.0% 100.0% 100.0% 100.0% 100.0% 100.0% 100.0% 100.0% 100.0% 100.0%
Total ValidResponses
175 26 29 34 85 7 167 60 115 9 159 137 6 38 106 55 14 128 35 10100.0% 100.0% 100.0% 100.0% 100.0% 100.0% 100.0% 100.0% 100.0% 100.0% 100.0% 100.0% 100.0% 100.0% 100.0% 100.0% 100.0% 100.0% 100.0% 100.0%
No Answer1 - - - 1 - 1 - 1 - 1 - - 1 1 - - 1 - -
Yes125 20 29 23 52 2 123 39 86 6 116 101 4 26 80 36 9 95 24 5
71.4% 76.9% 100.0% 67.6% 61.2% 28.6% 73.7% 65.0% 74.8% 66.7% 73.0% 73.7% 66.7% 68.4% 75.5% 65.5% 64.3% 74.2% 68.6% 50.0% ** ** ** ** ** ** **
No50 6 - 11 33 5 44 21 29 3 43 36 2 12 26 19 5 33 11 5
28.6% 23.1% - 32.4% 38.8% 71.4% 26.3% 35.0% 25.2% 33.3% 27.0% 26.3% 33.3% 31.6% 24.5% 34.5% 35.7% 25.8% 31.4% 50.0% ** ** ** ** ** ** **
HEDIS/CAHPSSUMMARYRATE - Yes
125 20 29 23 52 2 123 39 86 6 116 101 4 26 80 36 9 95 24 571.4% 76.9% 100.0% 67.6% 61.2% 28.6% 73.7% 65.0% 74.8% 66.7% 73.0% 73.7% 66.7% 68.4% 75.5% 65.5% 64.3% 74.2% 68.6% 50.0%
** ** ** ** ** ** **
Cell Contents: - Count- Column Percentage- Statistical Test ResultsStatistics: Overlap formulae used- Column Proportions: Columns Tested (5%): A/B/C/D, E/F, G/H, I/J,K/L/M, N/O/P, Q/R/S, (10%): a/b/c/d, e/f, g/h, i/j,k/l/m, n/o/p, q/r/s Minimum Base: 30 (**), Small Base: 30 (*)
Presented by SPH Analytics770-978-3173
2016

Q29. (PNI) In the last 12 months, how often did thewritten materials or the Internet provide theinformation you needed about how your health planworks?
Regence BCBS2016 CAHPS 5.0H Commercial Adult Survey (1113020)
Table: 28Level: Top
AGE (Q59) EDUCATION(Q61)
GENDER(Q60)
ETHNICITY(Q62) RACE (Q63) HEALTH STATUS
(Q43)MENTAL HEALTH
(Q44)
Total 18 to34
35 to44
45 to54
55 orolder
HS/GED/Less
SomeColg/Grad+
Male Female Hispanicor Latino
NotHispanicor Latino
WhiteBlack orAfrican-
AmericanOther Excellent/
Very good Good Fair/Poor
Excellent/Very good Good Fair/
Poor
A B C D E F G H I J K L M N O P Q R S
Q29. (PNI) In the last 12 months, how often did the written materials or the Internet provide the information you needed about how your healthplan works?
Total Eligible125 20 29 23 52 2 123 39 86 6 116 101 4 26 80 36 9 95 24 5
100.0% 100.0% 100.0% 100.0% 100.0% 100.0% 100.0% 100.0% 100.0% 100.0% 100.0% 100.0% 100.0% 100.0% 100.0% 100.0% 100.0% 100.0% 100.0% 100.0%
Total ValidResponses
124 20 28 23 52 2 122 39 85 6 115 100 4 26 80 35 9 95 23 5100.0% 100.0% 100.0% 100.0% 100.0% 100.0% 100.0% 100.0% 100.0% 100.0% 100.0% 100.0% 100.0% 100.0% 100.0% 100.0% 100.0% 100.0% 100.0% 100.0%
No Answer1 - 1 - - - 1 - 1 - 1 1 - - - 1 - - 1 -
Always34 7 7 5 14 - 34 11 23 1 32 30 - 5 25 9 - 26 8 -
27.4% 35.0% 25.0% 21.7% 26.9% - 27.9% 28.2% 27.1% 16.7% 27.8% 30.0% - 19.2% 31.3% 25.7% - 27.4% 34.8% - ** ** ** ** ** ** ** ** ** **
Usually54 7 10 13 24 2 52 17 37 3 51 42 1 11 33 15 6 42 8 3
43.5% 35.0% 35.7% 56.5% 46.2% 100.0% 42.6% 43.6% 43.5% 50.0% 44.3% 42.0% 25.0% 42.3% 41.3% 42.9% 66.7% 44.2% 34.8% 60.0% ** ** ** ** ** ** ** ** ** **
Sometimes32 6 10 5 11 - 32 9 23 2 28 25 2 9 20 11 1 23 7 2
25.8% 30.0% 35.7% 21.7% 21.2% - 26.2% 23.1% 27.1% 33.3% 24.3% 25.0% 50.0% 34.6% 25.0% 31.4% 11.1% 24.2% 30.4% 40.0% ** ** ** ** ** ** ** ** ** **
Never4 - 1 - 3 - 4 2 2 - 4 3 1 1 2 - 2 4 - -
3.2% - 3.6% - 5.8% - 3.3% 5.1% 2.4% - 3.5% 3.0% 25.0% 3.8% 2.5% - 22.2% 4.2% - - ** ** ** ** ** ** ** ** ** **
HEDIS/CAHPSSUMMARYRATE -Always/Usually
88 14 17 18 38 2 86 28 60 4 83 72 1 16 58 24 6 68 16 371.0% 70.0% 60.7% 78.3% 73.1% 100.0% 70.5% 71.8% 70.6% 66.7% 72.2% 72.0% 25.0% 61.5% 72.5% 68.6% 66.7% 71.6% 69.6% 60.0%
** ** ** ** ** ** ** ** ** **
HEDIS/CAHPSSUMMARYRATE - Always
34 7 7 5 14 - 34 11 23 1 32 30 - 5 25 9 - 26 8 -27.4% 35.0% 25.0% 21.7% 26.9% - 27.9% 28.2% 27.1% 16.7% 27.8% 30.0% - 19.2% 31.3% 25.7% - 27.4% 34.8% -
** ** ** ** ** ** ** ** ** **
3-Point Score1.98 2.05 1.86 2.00 2.00 2.00 1.98 2.00 1.98 1.83 2.00 2.02 1.25 1.81 2.04 1.94 1.67 1.99 2.04 1.60
Cell Contents: - Count- Column Percentage- Statistical Test ResultsStatistics: Overlap formulae used- Column Proportions: Columns Tested (5%): A/B/C/D, E/F, G/H, I/J,K/L/M, N/O/P, Q/R/S, (10%): a/b/c/d, e/f, g/h, i/j,k/l/m, n/o/p, q/r/s Minimum Base: 30 (**), Small Base: 30 (*)
Presented by SPH Analytics770-978-3173
2016

Q30. In the last 12 months, did you look forinformation from your health plan on how much youwould have to pay for a health care service orequipment?
Regence BCBS2016 CAHPS 5.0H Commercial Adult Survey (1113020)
Table: 29Level: Top
AGE (Q59) EDUCATION(Q61)
GENDER(Q60)
ETHNICITY(Q62) RACE (Q63) HEALTH STATUS
(Q43)MENTAL HEALTH
(Q44)
Total 18 to34
35 to44
45 to54
55 orolder
HS/GED/Less
SomeColg/Grad+
Male Female Hispanicor Latino
NotHispanicor Latino
WhiteBlack orAfrican-
AmericanOther Excellent/
Very good Good Fair/Poor
Excellent/Very good Good Fair/
Poor
A B C D E F G H I J K L M N O P Q R S
Q30. In the last 12 months, did you look for information from your health plan on how much you would have to pay for a health care service orequipment?
Total Eligible176 26 29 34 86 7 168 60 116 9 160 137 6 39 107 55 14 129 35 10
100.0% 100.0% 100.0% 100.0% 100.0% 100.0% 100.0% 100.0% 100.0% 100.0% 100.0% 100.0% 100.0% 100.0% 100.0% 100.0% 100.0% 100.0% 100.0% 100.0%
Total ValidResponses
176 26 29 34 86 7 168 60 116 9 160 137 6 39 107 55 14 129 35 10100.0% 100.0% 100.0% 100.0% 100.0% 100.0% 100.0% 100.0% 100.0% 100.0% 100.0% 100.0% 100.0% 100.0% 100.0% 100.0% 100.0% 100.0% 100.0% 100.0%
No Answer- - - - - - - - - - - - - - - - - - - -
Yes68 14 12 17 25 1 67 20 48 4 63 55 - 13 43 20 5 49 16 3
38.6% 53.8% 41.4% 50.0% 29.1% 14.3% 39.9% 33.3% 41.4% 44.4% 39.4% 40.1% - 33.3% 40.2% 36.4% 35.7% 38.0% 45.7% 30.0% ** ** D ** ** ** ** **
No108 12 17 17 61 6 101 40 68 5 97 82 6 26 64 35 9 80 19 7
61.4% 46.2% 58.6% 50.0% 70.9% 85.7% 60.1% 66.7% 58.6% 55.6% 60.6% 59.9% 100.0% 66.7% 59.8% 63.6% 64.3% 62.0% 54.3% 70.0% ** ** C ** ** ** ** **
HEDIS/CAHPSSUMMARYRATE - Yes
68 14 12 17 25 1 67 20 48 4 63 55 - 13 43 20 5 49 16 338.6% 53.8% 41.4% 50.0% 29.1% 14.3% 39.9% 33.3% 41.4% 44.4% 39.4% 40.1% - 33.3% 40.2% 36.4% 35.7% 38.0% 45.7% 30.0%
** ** D ** ** ** ** **
Cell Contents: - Count- Column Percentage- Statistical Test ResultsStatistics: Overlap formulae used- Column Proportions: Columns Tested (5%): A/B/C/D, E/F, G/H, I/J,K/L/M, N/O/P, Q/R/S, (10%): a/b/c/d, e/f, g/h, i/j,k/l/m, n/o/p, q/r/s Minimum Base: 30 (**), Small Base: 30 (*)
Presented by SPH Analytics770-978-3173
2016

Q31. (PIOC) In the last 12 months, how often wereyou able to find out from your health plan how muchyou would have to pay for a health care service orequipment?
Regence BCBS2016 CAHPS 5.0H Commercial Adult Survey (1113020)
Table: 30Level: Top
AGE (Q59) EDUCATION(Q61)
GENDER(Q60)
ETHNICITY(Q62) RACE (Q63) HEALTH STATUS
(Q43)MENTAL HEALTH
(Q44)
Total 18 to34
35 to44
45 to54
55 orolder
HS/GED/Less
SomeColg/Grad+
Male Female Hispanicor Latino
NotHispanicor Latino
WhiteBlack orAfrican-
AmericanOther Excellent/
Very good Good Fair/Poor
Excellent/Very good Good Fair/
Poor
A B C D E F G H I J K L M N O P Q R S
Q31. (PIOC) In the last 12 months, how often were you able to find out from your health plan how much you would have to pay for a health careservice or equipment?
Total Eligible68 14 12 17 25 1 67 20 48 4 63 55 - 13 43 20 5 49 16 3
100.0% 100.0% 100.0% 100.0% 100.0% 100.0% 100.0% 100.0% 100.0% 100.0% 100.0% 100.0% - 100.0% 100.0% 100.0% 100.0% 100.0% 100.0% 100.0%
Total ValidResponses
68 14 12 17 25 1 67 20 48 4 63 55 - 13 43 20 5 49 16 3100.0% 100.0% 100.0% 100.0% 100.0% 100.0% 100.0% 100.0% 100.0% 100.0% 100.0% 100.0% - 100.0% 100.0% 100.0% 100.0% 100.0% 100.0% 100.0%
No Answer- - - - - - - - - - - - - - - - - - - -
Always18 4 3 4 7 - 18 1 17 - 18 15 - 3 12 6 - 11 7 -
26.5% 28.6% 25.0% 23.5% 28.0% - 26.9% 5.0% 35.4% - 28.6% 27.3% - 23.1% 27.9% 30.0% - 22.4% 43.8% - ** ** ** ** ** ** ** ** ** ** ** **
Usually25 7 5 5 8 1 24 6 19 - 25 21 - 4 18 5 2 18 6 1
36.8% 50.0% 41.7% 29.4% 32.0% 100.0% 35.8% 30.0% 39.6% - 39.7% 38.2% - 30.8% 41.9% 25.0% 40.0% 36.7% 37.5% 33.3% ** ** ** ** ** ** ** ** ** ** ** **
Sometimes18 2 2 6 8 - 18 10 8 3 15 15 - 3 9 6 3 16 - 2
26.5% 14.3% 16.7% 35.3% 32.0% - 26.9% 50.0% 16.7% 75.0% 23.8% 27.3% - 23.1% 20.9% 30.0% 60.0% 32.7% - 66.7% ** ** ** ** ** ** ** ** ** ** ** **
Never7 1 2 2 2 - 7 3 4 1 5 4 - 3 4 3 - 4 3 -
10.3% 7.1% 16.7% 11.8% 8.0% - 10.4% 15.0% 8.3% 25.0% 7.9% 7.3% - 23.1% 9.3% 15.0% - 8.2% 18.8% - ** ** ** ** ** ** ** ** ** ** ** **
HEDIS/CAHPSSUMMARYRATE -Always/Usually
43 11 8 9 15 1 42 7 36 - 43 36 - 7 30 11 2 29 13 163.2% 78.6% 66.7% 52.9% 60.0% 100.0% 62.7% 35.0% 75.0% - 68.3% 65.5% - 53.8% 69.8% 55.0% 40.0% 59.2% 81.3% 33.3%
** ** ** ** ** ** ** ** ** ** ** **
HEDIS/CAHPSSUMMARYRATE - Always
18 4 3 4 7 - 18 1 17 - 18 15 - 3 12 6 - 11 7 -26.5% 28.6% 25.0% 23.5% 28.0% - 26.9% 5.0% 35.4% - 28.6% 27.3% - 23.1% 27.9% 30.0% - 22.4% 43.8% -
** ** ** ** ** ** ** ** ** ** ** **
3-Point Score1.90 2.07 1.92 1.76 1.88 2.00 1.90 1.40 2.10 1.00 1.97 1.93 - 1.77 1.98 1.85 1.40 1.82 2.25 1.33
Cell Contents: - Count- Column Percentage- Statistical Test ResultsStatistics: Overlap formulae used- Column Proportions: Columns Tested (5%): A/B/C/D, E/F, G/H, I/J,K/L/M, N/O/P, Q/R/S, (10%): a/b/c/d, e/f, g/h, i/j,k/l/m, n/o/p, q/r/s Minimum Base: 30 (**), Small Base: 30 (*)
Presented by SPH Analytics770-978-3173
2016

Q32. In the last 12 months, did you look forinformation from your health plan on how much youwould have to pay for specific prescriptionmedicines?
Regence BCBS2016 CAHPS 5.0H Commercial Adult Survey (1113020)
Table: 31Level: Top
AGE (Q59) EDUCATION(Q61)
GENDER(Q60)
ETHNICITY(Q62) RACE (Q63) HEALTH STATUS
(Q43)MENTAL HEALTH
(Q44)
Total 18 to34
35 to44
45 to54
55 orolder
HS/GED/Less
SomeColg/Grad+
Male Female Hispanicor Latino
NotHispanicor Latino
WhiteBlack orAfrican-
AmericanOther Excellent/
Very good Good Fair/Poor
Excellent/Very good Good Fair/
Poor
A B C D E F G H I J K L M N O P Q R S
Q32. In the last 12 months, did you look for information from your health plan on how much you would have to pay for specific prescriptionmedicines?
Total Eligible176 26 29 34 86 7 168 60 116 9 160 137 6 39 107 55 14 129 35 10
100.0% 100.0% 100.0% 100.0% 100.0% 100.0% 100.0% 100.0% 100.0% 100.0% 100.0% 100.0% 100.0% 100.0% 100.0% 100.0% 100.0% 100.0% 100.0% 100.0%
Total ValidResponses
176 26 29 34 86 7 168 60 116 9 160 137 6 39 107 55 14 129 35 10100.0% 100.0% 100.0% 100.0% 100.0% 100.0% 100.0% 100.0% 100.0% 100.0% 100.0% 100.0% 100.0% 100.0% 100.0% 100.0% 100.0% 100.0% 100.0% 100.0%
No Answer- - - - - - - - - - - - - - - - - - - -
Yes47 9 6 11 21 1 46 14 33 3 42 36 2 10 23 18 6 29 14 4
26.7% 34.6% 20.7% 32.4% 24.4% 14.3% 27.4% 23.3% 28.4% 33.3% 26.3% 26.3% 33.3% 25.6% 21.5% 32.7% 42.9% 22.5% 40.0% 40.0% ** ** ** ** ** ** Q **
No129 17 23 23 65 6 122 46 83 6 118 101 4 29 84 37 8 100 21 6
73.3% 65.4% 79.3% 67.6% 75.6% 85.7% 72.6% 76.7% 71.6% 66.7% 73.8% 73.7% 66.7% 74.4% 78.5% 67.3% 57.1% 77.5% 60.0% 60.0% ** ** ** ** ** ** R **
HEDIS/CAHPSSUMMARYRATE - Yes
47 9 6 11 21 1 46 14 33 3 42 36 2 10 23 18 6 29 14 426.7% 34.6% 20.7% 32.4% 24.4% 14.3% 27.4% 23.3% 28.4% 33.3% 26.3% 26.3% 33.3% 25.6% 21.5% 32.7% 42.9% 22.5% 40.0% 40.0%
** ** ** ** ** ** Q **
Cell Contents: - Count- Column Percentage- Statistical Test ResultsStatistics: Overlap formulae used- Column Proportions: Columns Tested (5%): A/B/C/D, E/F, G/H, I/J,K/L/M, N/O/P, Q/R/S, (10%): a/b/c/d, e/f, g/h, i/j,k/l/m, n/o/p, q/r/s Minimum Base: 30 (**), Small Base: 30 (*)
Presented by SPH Analytics770-978-3173
2016

Q33. (PIOC) In the last 12 months, how often wereyou able to find out from your health plan how muchyou would have to pay for specific prescriptionmedicines?
Regence BCBS2016 CAHPS 5.0H Commercial Adult Survey (1113020)
Table: 32Level: Top
AGE (Q59) EDUCATION(Q61)
GENDER(Q60)
ETHNICITY(Q62) RACE (Q63) HEALTH STATUS
(Q43)MENTAL HEALTH
(Q44)
Total 18 to34
35 to44
45 to54
55 orolder
HS/GED/Less
SomeColg/Grad+
Male Female Hispanicor Latino
NotHispanicor Latino
WhiteBlack orAfrican-
AmericanOther Excellent/
Very good Good Fair/Poor
Excellent/Very good Good Fair/
Poor
A B C D E F G H I J K L M N O P Q R S
Q33. (PIOC) In the last 12 months, how often were you able to find out from your health plan how much you would have to pay for specificprescription medicines?
Total Eligible47 9 6 11 21 1 46 14 33 3 42 36 2 10 23 18 6 29 14 4
100.0% 100.0% 100.0% 100.0% 100.0% 100.0% 100.0% 100.0% 100.0% 100.0% 100.0% 100.0% 100.0% 100.0% 100.0% 100.0% 100.0% 100.0% 100.0% 100.0%
Total ValidResponses
47 9 6 11 21 1 46 14 33 3 42 36 2 10 23 18 6 29 14 4100.0% 100.0% 100.0% 100.0% 100.0% 100.0% 100.0% 100.0% 100.0% 100.0% 100.0% 100.0% 100.0% 100.0% 100.0% 100.0% 100.0% 100.0% 100.0% 100.0%
No Answer- - - - - - - - - - - - - - - - - - - -
Always17 4 1 1 11 1 16 4 13 - 15 14 1 2 9 5 3 12 4 1
36.2% 44.4% 16.7% 9.1% 52.4% 100.0% 34.8% 28.6% 39.4% - 35.7% 38.9% 50.0% 20.0% 39.1% 27.8% 50.0% 41.4% 28.6% 25.0% ** ** ** ** ** ** ** ** ** ** ** ** ** ** **
Usually14 - 2 5 7 - 14 3 11 1 13 12 - 2 7 5 2 9 4 1
29.8% - 33.3% 45.5% 33.3% - 30.4% 21.4% 33.3% 33.3% 31.0% 33.3% - 20.0% 30.4% 27.8% 33.3% 31.0% 28.6% 25.0% ** ** ** ** ** ** ** ** ** ** ** ** ** ** **
Sometimes10 2 2 3 3 - 10 4 6 2 8 7 1 3 4 6 - 6 3 1
21.3% 22.2% 33.3% 27.3% 14.3% - 21.7% 28.6% 18.2% 66.7% 19.0% 19.4% 50.0% 30.0% 17.4% 33.3% - 20.7% 21.4% 25.0% ** ** ** ** ** ** ** ** ** ** ** ** ** ** **
Never6 3 1 2 - - 6 3 3 - 6 3 - 3 3 2 1 2 3 1
12.8% 33.3% 16.7% 18.2% - - 13.0% 21.4% 9.1% - 14.3% 8.3% - 30.0% 13.0% 11.1% 16.7% 6.9% 21.4% 25.0% ** ** ** ** ** ** ** ** ** ** ** ** ** ** **
HEDIS/CAHPSSUMMARYRATE -Always/Usually
31 4 3 6 18 1 30 7 24 1 28 26 1 4 16 10 5 21 8 266.0% 44.4% 50.0% 54.5% 85.7% 100.0% 65.2% 50.0% 72.7% 33.3% 66.7% 72.2% 50.0% 40.0% 69.6% 55.6% 83.3% 72.4% 57.1% 50.0%
** ** ** ** ** ** ** ** ** ** ** ** ** ** **
HEDIS/CAHPSSUMMARYRATE - Always
17 4 1 1 11 1 16 4 13 - 15 14 1 2 9 5 3 12 4 136.2% 44.4% 16.7% 9.1% 52.4% 100.0% 34.8% 28.6% 39.4% - 35.7% 38.9% 50.0% 20.0% 39.1% 27.8% 50.0% 41.4% 28.6% 25.0%
** ** ** ** ** ** ** ** ** ** ** ** ** ** **
3-Point Score2.02 1.89 1.67 1.64 2.38 3.00 2.00 1.79 2.12 1.33 2.02 2.11 2.00 1.60 2.09 1.83 2.33 2.14 1.86 1.75
Cell Contents: - Count- Column Percentage- Statistical Test ResultsStatistics: Overlap formulae used- Column Proportions: Columns Tested (5%): A/B/C/D, E/F, G/H, I/J,K/L/M, N/O/P, Q/R/S, (10%): a/b/c/d, e/f, g/h, i/j,k/l/m, n/o/p, q/r/s Minimum Base: 30 (**), Small Base: 30 (*)
Presented by SPH Analytics770-978-3173
2016

Q34. In the last 12 months, did you get informationor help from your health plan's customer service?
Regence BCBS2016 CAHPS 5.0H Commercial Adult Survey (1113020)
Table: 33Level: Top
AGE (Q59) EDUCATION(Q61)
GENDER(Q60)
ETHNICITY(Q62) RACE (Q63) HEALTH STATUS
(Q43)MENTAL HEALTH
(Q44)
Total 18 to34
35 to44
45 to54
55 orolder
HS/GED/Less
SomeColg/Grad+
Male Female Hispanicor Latino
NotHispanicor Latino
WhiteBlack orAfrican-
AmericanOther Excellent/
Very good Good Fair/Poor
Excellent/Very good Good Fair/
Poor
A B C D E F G H I J K L M N O P Q R S
Q34. In the last 12 months, did you get information or help from your health plan's customer service?
Total Eligible176 26 29 34 86 7 168 60 116 9 160 137 6 39 107 55 14 129 35 10
100.0% 100.0% 100.0% 100.0% 100.0% 100.0% 100.0% 100.0% 100.0% 100.0% 100.0% 100.0% 100.0% 100.0% 100.0% 100.0% 100.0% 100.0% 100.0% 100.0%
Total ValidResponses
175 26 29 34 85 7 167 60 115 9 159 137 6 38 107 54 14 129 34 10100.0% 100.0% 100.0% 100.0% 100.0% 100.0% 100.0% 100.0% 100.0% 100.0% 100.0% 100.0% 100.0% 100.0% 100.0% 100.0% 100.0% 100.0% 100.0% 100.0%
No Answer1 - - - 1 - 1 - 1 - 1 - - 1 - 1 - - 1 -
Yes66 13 9 14 30 2 63 24 42 3 59 53 2 12 43 18 5 52 12 2
37.7% 50.0% 31.0% 41.2% 35.3% 28.6% 37.7% 40.0% 36.5% 33.3% 37.1% 38.7% 33.3% 31.6% 40.2% 33.3% 35.7% 40.3% 35.3% 20.0% ** ** ** ** ** ** **
No109 13 20 20 55 5 104 36 73 6 100 84 4 26 64 36 9 77 22 8
62.3% 50.0% 69.0% 58.8% 64.7% 71.4% 62.3% 60.0% 63.5% 66.7% 62.9% 61.3% 66.7% 68.4% 59.8% 66.7% 64.3% 59.7% 64.7% 80.0% ** ** ** ** ** ** **
HEDIS/CAHPSSUMMARYRATE - Yes
66 13 9 14 30 2 63 24 42 3 59 53 2 12 43 18 5 52 12 237.7% 50.0% 31.0% 41.2% 35.3% 28.6% 37.7% 40.0% 36.5% 33.3% 37.1% 38.7% 33.3% 31.6% 40.2% 33.3% 35.7% 40.3% 35.3% 20.0%
** ** ** ** ** ** **
Cell Contents: - Count- Column Percentage- Statistical Test ResultsStatistics: Overlap formulae used- Column Proportions: Columns Tested (5%): A/B/C/D, E/F, G/H, I/J,K/L/M, N/O/P, Q/R/S, (10%): a/b/c/d, e/f, g/h, i/j,k/l/m, n/o/p, q/r/s Minimum Base: 30 (**), Small Base: 30 (*)
Presented by SPH Analytics770-978-3173
2016

Q35. (CS) In the last 12 months, how often did yourhealth plan's customer service give you theinformation or help you needed?
Regence BCBS2016 CAHPS 5.0H Commercial Adult Survey (1113020)
Table: 34Level: Top
AGE (Q59) EDUCATION(Q61)
GENDER(Q60)
ETHNICITY(Q62) RACE (Q63) HEALTH STATUS
(Q43)MENTAL HEALTH
(Q44)
Total 18 to34
35 to44
45 to54
55 orolder
HS/GED/Less
SomeColg/Grad+
Male Female Hispanicor Latino
NotHispanicor Latino
WhiteBlack orAfrican-
AmericanOther Excellent/
Very good Good Fair/Poor
Excellent/Very good Good Fair/
Poor
A B C D E F G H I J K L M N O P Q R S
Q35. (CS) In the last 12 months, how often did your health plan's customer service give you the information or help you needed?
Total Eligible66 13 9 14 30 2 63 24 42 3 59 53 2 12 43 18 5 52 12 2
100.0% 100.0% 100.0% 100.0% 100.0% 100.0% 100.0% 100.0% 100.0% 100.0% 100.0% 100.0% 100.0% 100.0% 100.0% 100.0% 100.0% 100.0% 100.0% 100.0%
Total ValidResponses
66 13 9 14 30 2 63 24 42 3 59 53 2 12 43 18 5 52 12 2100.0% 100.0% 100.0% 100.0% 100.0% 100.0% 100.0% 100.0% 100.0% 100.0% 100.0% 100.0% 100.0% 100.0% 100.0% 100.0% 100.0% 100.0% 100.0% 100.0%
No Answer- - - - - - - - - - - - - - - - - - - -
Always37 7 3 5 22 2 34 11 26 2 31 30 1 5 28 7 2 31 6 -
56.1% 53.8% 33.3% 35.7% 73.3% 100.0% 54.0% 45.8% 61.9% 66.7% 52.5% 56.6% 50.0% 41.7% 65.1% 38.9% 40.0% 59.6% 50.0% - ** ** ** ** ** ** ** ** ** ** ** **
Usually18 3 3 5 7 - 18 8 10 1 17 14 - 4 12 5 1 14 4 -
27.3% 23.1% 33.3% 35.7% 23.3% - 28.6% 33.3% 23.8% 33.3% 28.8% 26.4% - 33.3% 27.9% 27.8% 20.0% 26.9% 33.3% - ** ** ** ** ** ** ** ** ** ** ** **
Sometimes9 2 2 4 1 - 9 4 5 - 9 7 1 3 2 5 2 5 2 2
13.6% 15.4% 22.2% 28.6% 3.3% - 14.3% 16.7% 11.9% - 15.3% 13.2% 50.0% 25.0% 4.7% 27.8% 40.0% 9.6% 16.7% 100.0% ** ** ** ** ** ** ** ** ** ** ** **
Never2 1 1 - - - 2 1 1 - 2 2 - - 1 1 - 2 - -
3.0% 7.7% 11.1% - - - 3.2% 4.2% 2.4% - 3.4% 3.8% - - 2.3% 5.6% - 3.8% - - ** ** ** ** ** ** ** ** ** ** ** **
HEDIS/CAHPSSUMMARYRATE -Always/Usually
55 10 6 10 29 2 52 19 36 3 48 44 1 9 40 12 3 45 10 -83.3% 76.9% 66.7% 71.4% 96.7% 100.0% 82.5% 79.2% 85.7% 100.0% 81.4% 83.0% 50.0% 75.0% 93.0% 66.7% 60.0% 86.5% 83.3% -
** ** ** ** ** ** ** ** ** ** ** **
HEDIS/CAHPSSUMMARYRATE - Always
37 7 3 5 22 2 34 11 26 2 31 30 1 5 28 7 2 31 6 -56.1% 53.8% 33.3% 35.7% 73.3% 100.0% 54.0% 45.8% 61.9% 66.7% 52.5% 56.6% 50.0% 41.7% 65.1% 38.9% 40.0% 59.6% 50.0% -
** ** ** ** ** ** ** ** ** ** ** **
3-Point Score2.39 2.31 2.00 2.07 2.70 3.00 2.37 2.25 2.48 2.67 2.34 2.40 2.00 2.17 2.58 2.06 2.00 2.46 2.33 1.00
Cell Contents: - Count- Column Percentage- Statistical Test ResultsStatistics: Overlap formulae used- Column Proportions: Columns Tested (5%): A/B/C/D, E/F, G/H, I/J,K/L/M, N/O/P, Q/R/S, (10%): a/b/c/d, e/f, g/h, i/j,k/l/m, n/o/p, q/r/s Minimum Base: 30 (**), Small Base: 30 (*)
Presented by SPH Analytics770-978-3173
2016

Q36. (CS) In the last 12 months, how often did yourhealth plan's customer service staff treat you withcourtesy and respect?
Regence BCBS2016 CAHPS 5.0H Commercial Adult Survey (1113020)
Table: 35Level: Top
AGE (Q59) EDUCATION(Q61)
GENDER(Q60)
ETHNICITY(Q62) RACE (Q63) HEALTH STATUS
(Q43)MENTAL HEALTH
(Q44)
Total 18 to34
35 to44
45 to54
55 orolder
HS/GED/Less
SomeColg/Grad+
Male Female Hispanicor Latino
NotHispanicor Latino
WhiteBlack orAfrican-
AmericanOther Excellent/
Very good Good Fair/Poor
Excellent/Very good Good Fair/
Poor
A B C D E F G H I J K L M N O P Q R S
Q36. (CS) In the last 12 months, how often did your health plan's customer service staff treat you with courtesy and respect?
Total Eligible66 13 9 14 30 2 63 24 42 3 59 53 2 12 43 18 5 52 12 2
100.0% 100.0% 100.0% 100.0% 100.0% 100.0% 100.0% 100.0% 100.0% 100.0% 100.0% 100.0% 100.0% 100.0% 100.0% 100.0% 100.0% 100.0% 100.0% 100.0%
Total ValidResponses
65 13 9 14 29 2 62 23 42 3 58 52 2 12 42 18 5 51 12 2100.0% 100.0% 100.0% 100.0% 100.0% 100.0% 100.0% 100.0% 100.0% 100.0% 100.0% 100.0% 100.0% 100.0% 100.0% 100.0% 100.0% 100.0% 100.0% 100.0%
No Answer1 - - - 1 - 1 1 - - 1 1 - - 1 - - 1 - -
Always53 11 5 11 26 2 50 20 33 3 46 45 2 7 38 12 3 44 8 1
81.5% 84.6% 55.6% 78.6% 89.7% 100.0% 80.6% 87.0% 78.6% 100.0% 79.3% 86.5% 100.0% 58.3% 90.5% 66.7% 60.0% 86.3% 66.7% 50.0% ** ** ** ** ** ** ** ** ** ** ** ** **
Usually8 1 3 1 3 - 8 3 5 - 8 5 - 3 4 2 2 5 2 1
12.3% 7.7% 33.3% 7.1% 10.3% - 12.9% 13.0% 11.9% - 13.8% 9.6% - 25.0% 9.5% 11.1% 40.0% 9.8% 16.7% 50.0% ** ** ** ** ** ** ** ** ** ** ** ** **
Sometimes3 1 - 2 - - 3 - 3 - 3 1 - 2 - 3 - 1 2 -
4.6% 7.7% - 14.3% - - 4.8% - 7.1% - 5.2% 1.9% - 16.7% - 16.7% - 2.0% 16.7% - ** ** ** ** ** ** ** ** ** ** ** ** **
Never1 - 1 - - - 1 - 1 - 1 1 - - - 1 - 1 - -
1.5% - 11.1% - - - 1.6% - 2.4% - 1.7% 1.9% - - - 5.6% - 2.0% - - ** ** ** ** ** ** ** ** ** ** ** ** **
HEDIS/CAHPSSUMMARYRATE -Always/Usually
61 12 8 12 29 2 58 23 38 3 54 50 2 10 42 14 5 49 10 293.8% 92.3% 88.9% 85.7% 100.0% 100.0% 93.5% 100.0% 90.5% 100.0% 93.1% 96.2% 100.0% 83.3% 100.0% 77.8% 100.0% 96.1% 83.3% 100.0%
** ** ** ** ** ** ** ** ** ** ** ** **
HEDIS/CAHPSSUMMARYRATE - Always
53 11 5 11 26 2 50 20 33 3 46 45 2 7 38 12 3 44 8 181.5% 84.6% 55.6% 78.6% 89.7% 100.0% 80.6% 87.0% 78.6% 100.0% 79.3% 86.5% 100.0% 58.3% 90.5% 66.7% 60.0% 86.3% 66.7% 50.0%
** ** ** ** ** ** ** ** ** ** ** ** **
3-Point Score2.75 2.77 2.44 2.64 2.90 3.00 2.74 2.87 2.69 3.00 2.72 2.83 3.00 2.42 2.90 2.44 2.60 2.82 2.50 2.50
Cell Contents: - Count- Column Percentage- Statistical Test ResultsStatistics: Overlap formulae used- Column Proportions: Columns Tested (5%): A/B/C/D, E/F, G/H, I/J,K/L/M, N/O/P, Q/R/S, (10%): a/b/c/d, e/f, g/h, i/j,k/l/m, n/o/p, q/r/s Minimum Base: 30 (**), Small Base: 30 (*)
Presented by SPH Analytics770-978-3173
2016

Q37. In the last 12 months, did your health plan giveyou any forms to fill out?
Regence BCBS2016 CAHPS 5.0H Commercial Adult Survey (1113020)
Table: 36Level: Top
AGE (Q59) EDUCATION(Q61)
GENDER(Q60)
ETHNICITY(Q62) RACE (Q63) HEALTH STATUS
(Q43)MENTAL HEALTH
(Q44)
Total 18 to34
35 to44
45 to54
55 orolder
HS/GED/Less
SomeColg/Grad+
Male Female Hispanicor Latino
NotHispanicor Latino
WhiteBlack orAfrican-
AmericanOther Excellent/
Very good Good Fair/Poor
Excellent/Very good Good Fair/
Poor
A B C D E F G H I J K L M N O P Q R S
Q37. In the last 12 months, did your health plan give you any forms to fill out?
Total Eligible176 26 29 34 86 7 168 60 116 9 160 137 6 39 107 55 14 129 35 10
100.0% 100.0% 100.0% 100.0% 100.0% 100.0% 100.0% 100.0% 100.0% 100.0% 100.0% 100.0% 100.0% 100.0% 100.0% 100.0% 100.0% 100.0% 100.0% 100.0%
Total ValidResponses
175 26 29 34 85 7 167 60 115 8 160 137 6 38 107 54 14 128 35 10100.0% 100.0% 100.0% 100.0% 100.0% 100.0% 100.0% 100.0% 100.0% 100.0% 100.0% 100.0% 100.0% 100.0% 100.0% 100.0% 100.0% 100.0% 100.0% 100.0%
No Answer1 - - - 1 - 1 - 1 1 - - - 1 - 1 - 1 - -
Yes45 9 6 13 17 2 42 20 25 2 40 37 1 8 28 15 2 31 13 1
25.7% 34.6% 20.7% 38.2% 20.0% 28.6% 25.1% 33.3% 21.7% 25.0% 25.0% 27.0% 16.7% 21.1% 26.2% 27.8% 14.3% 24.2% 37.1% 10.0% ** ** D ** h ** ** ** **
No130 17 23 21 68 5 125 40 90 6 120 100 5 30 79 39 12 97 22 9
74.3% 65.4% 79.3% 61.8% 80.0% 71.4% 74.9% 66.7% 78.3% 75.0% 75.0% 73.0% 83.3% 78.9% 73.8% 72.2% 85.7% 75.8% 62.9% 90.0% ** ** C ** g ** ** ** **
HEDIS/CAHPSSUMMARYRATE - Yes
45 9 6 13 17 2 42 20 25 2 40 37 1 8 28 15 2 31 13 125.7% 34.6% 20.7% 38.2% 20.0% 28.6% 25.1% 33.3% 21.7% 25.0% 25.0% 27.0% 16.7% 21.1% 26.2% 27.8% 14.3% 24.2% 37.1% 10.0%
** ** D ** h ** ** ** **
Cell Contents: - Count- Column Percentage- Statistical Test ResultsStatistics: Overlap formulae used- Column Proportions: Columns Tested (5%): A/B/C/D, E/F, G/H, I/J,K/L/M, N/O/P, Q/R/S, (10%): a/b/c/d, e/f, g/h, i/j,k/l/m, n/o/p, q/r/s Minimum Base: 30 (**), Small Base: 30 (*)
Presented by SPH Analytics770-978-3173
2016

Q38. (FOF) In the last 12 months, how often werethe forms from your health plan easy to fill out?
Regence BCBS2016 CAHPS 5.0H Commercial Adult Survey (1113020)
Table: 37Level: Top
AGE (Q59) EDUCATION(Q61)
GENDER(Q60)
ETHNICITY(Q62) RACE (Q63) HEALTH STATUS
(Q43)MENTAL HEALTH
(Q44)
Total 18 to34
35 to44
45 to54
55 orolder
HS/GED/Less
SomeColg/Grad+
Male Female Hispanicor Latino
NotHispanicor Latino
WhiteBlack orAfrican-
AmericanOther Excellent/
Very good Good Fair/Poor
Excellent/Very good Good Fair/
Poor
A B C D E F G H I J K L M N O P Q R S
Q38. (FOF) In the last 12 months, how often were the forms from your health plan easy to fill out?
Total Eligible175 26 29 34 85 7 167 60 115 8 160 137 6 38 107 54 14 128 35 10
100.0% 100.0% 100.0% 100.0% 100.0% 100.0% 100.0% 100.0% 100.0% 100.0% 100.0% 100.0% 100.0% 100.0% 100.0% 100.0% 100.0% 100.0% 100.0% 100.0%
Total ValidResponses
175 26 29 34 85 7 167 60 115 8 160 137 6 38 107 54 14 128 35 10100.0% 100.0% 100.0% 100.0% 100.0% 100.0% 100.0% 100.0% 100.0% 100.0% 100.0% 100.0% 100.0% 100.0% 100.0% 100.0% 100.0% 100.0% 100.0% 100.0%
No Answer- - - - - - - - - - - - - - - - - - - -
Always147 24 23 24 75 5 141 49 98 7 135 115 6 34 93 41 13 111 24 10
84.0% 92.3% 79.3% 70.6% 88.2% 71.4% 84.4% 81.7% 85.2% 87.5% 84.4% 83.9% 100.0% 89.5% 86.9% 75.9% 92.9% 86.7% 68.6% 100.0% ** ** C ** ** ** o ** R **
Usually18 1 3 7 7 2 16 5 13 - 18 14 - 3 7 10 1 10 8 -
10.3% 3.8% 10.3% 20.6% 8.2% 28.6% 9.6% 8.3% 11.3% - 11.3% 10.2% - 7.9% 6.5% 18.5% 7.1% 7.8% 22.9% - ** ** d ** ** ** N ** Q **
Sometimes10 1 3 3 3 - 10 6 4 1 7 8 - 1 7 3 - 7 3 -
5.7% 3.8% 10.3% 8.8% 3.5% - 6.0% 10.0% 3.5% 12.5% 4.4% 5.8% - 2.6% 6.5% 5.6% - 5.5% 8.6% - ** ** ** h ** ** ** **
Never- - - - - - - - - - - - - - - - - - - -- - - - - - - - - - - - - - - - - - - - ** ** ** ** ** ** **
HEDIS/CAHPSSUMMARYRATE -Always/Usually
165 25 26 31 82 7 157 54 111 7 153 129 6 37 100 51 14 121 32 1094.3% 96.2% 89.7% 91.2% 96.5% 100.0% 94.0% 90.0% 96.5% 87.5% 95.6% 94.2% 100.0% 97.4% 93.5% 94.4% 100.0% 94.5% 91.4% 100.0%
** ** ** g ** ** ** **
HEDIS/CAHPSSUMMARYRATE - Always
147 24 23 24 75 5 141 49 98 7 135 115 6 34 93 41 13 111 24 1084.0% 92.3% 79.3% 70.6% 88.2% 71.4% 84.4% 81.7% 85.2% 87.5% 84.4% 83.9% 100.0% 89.5% 86.9% 75.9% 92.9% 86.7% 68.6% 100.0%
** ** C ** ** ** o ** R **
3-Point Score2.78 2.88 2.69 2.62 2.85 2.71 2.78 2.72 2.82 2.75 2.80 2.78 3.00 2.87 2.80 2.70 2.93 2.81 2.60 3.00
Cell Contents: - Count- Column Percentage- Statistical Test ResultsStatistics: Overlap formulae used- Column Proportions: Columns Tested (5%): A/B/C/D, E/F, G/H, I/J,K/L/M, N/O/P, Q/R/S, (10%): a/b/c/d, e/f, g/h, i/j,k/l/m, n/o/p, q/r/s Minimum Base: 30 (**), Small Base: 30 (*)
Presented by SPH Analytics770-978-3173
2016

Q39. In the last 12 months, did you or anyone elsesend in any claims for your care to your health plan?
Regence BCBS2016 CAHPS 5.0H Commercial Adult Survey (1113020)
Table: 38Level: Top
AGE (Q59) EDUCATION(Q61)
GENDER(Q60)
ETHNICITY(Q62) RACE (Q63) HEALTH STATUS
(Q43)MENTAL HEALTH
(Q44)
Total 18 to34
35 to44
45 to54
55 orolder
HS/GED/Less
SomeColg/Grad+
Male Female Hispanicor Latino
NotHispanicor Latino
WhiteBlack orAfrican-
AmericanOther Excellent/
Very good Good Fair/Poor
Excellent/Very good Good Fair/
Poor
A B C D E F G H I J K L M N O P Q R S
Q39. In the last 12 months, did you or anyone else send in any claims for your care to your health plan?
Total Eligible176 26 29 34 86 7 168 60 116 9 160 137 6 39 107 55 14 129 35 10
100.0% 100.0% 100.0% 100.0% 100.0% 100.0% 100.0% 100.0% 100.0% 100.0% 100.0% 100.0% 100.0% 100.0% 100.0% 100.0% 100.0% 100.0% 100.0% 100.0%
Total ValidResponses
151 21 23 31 75 5 145 50 101 9 136 116 4 33 91 49 11 110 33 7100.0% 100.0% 100.0% 100.0% 100.0% 100.0% 100.0% 100.0% 100.0% 100.0% 100.0% 100.0% 100.0% 100.0% 100.0% 100.0% 100.0% 100.0% 100.0% 100.0%
No Answer1 - - 1 - - 1 1 - - 1 1 - - 1 - - 1 - -
Yes108 19 21 21 46 3 104 36 72 3 101 86 4 21 63 39 6 76 27 4
71.5% 90.5% 91.3% 67.7% 61.3% 60.0% 71.7% 72.0% 71.3% 33.3% 74.3% 74.1% 100.0% 63.6% 69.2% 79.6% 54.5% 69.1% 81.8% 57.1% ** ** ** ** ** ** **
No43 2 2 10 29 2 41 14 29 6 35 30 - 12 28 10 5 34 6 3
28.5% 9.5% 8.7% 32.3% 38.7% 40.0% 28.3% 28.0% 28.7% 66.7% 25.7% 25.9% - 36.4% 30.8% 20.4% 45.5% 30.9% 18.2% 42.9% ** ** ** ** ** ** **
Don't know24 5 6 2 11 2 22 9 15 - 23 20 2 6 15 6 3 18 2 3
HEDIS/CAHPSSUMMARYRATE - Yes
108 19 21 21 46 3 104 36 72 3 101 86 4 21 63 39 6 76 27 471.5% 90.5% 91.3% 67.7% 61.3% 60.0% 71.7% 72.0% 71.3% 33.3% 74.3% 74.1% 100.0% 63.6% 69.2% 79.6% 54.5% 69.1% 81.8% 57.1%
** ** ** ** ** ** **
Cell Contents: - Count- Column Percentage- Statistical Test ResultsStatistics: Overlap formulae used- Column Proportions: Columns Tested (5%): A/B/C/D, E/F, G/H, I/J,K/L/M, N/O/P, Q/R/S, (10%): a/b/c/d, e/f, g/h, i/j,k/l/m, n/o/p, q/r/s Minimum Base: 30 (**), Small Base: 30 (*)
Presented by SPH Analytics770-978-3173
2016

Q40. (CP) In the last 12 months, how often did yourhealth plan handle your claims quickly?
Regence BCBS2016 CAHPS 5.0H Commercial Adult Survey (1113020)
Table: 39Level: Top
AGE (Q59) EDUCATION(Q61)
GENDER(Q60)
ETHNICITY(Q62) RACE (Q63) HEALTH STATUS
(Q43)MENTAL HEALTH
(Q44)
Total 18 to34
35 to44
45 to54
55 orolder
HS/GED/Less
SomeColg/Grad+
Male Female Hispanicor Latino
NotHispanicor Latino
WhiteBlack orAfrican-
AmericanOther Excellent/
Very good Good Fair/Poor
Excellent/Very good Good Fair/
Poor
A B C D E F G H I J K L M N O P Q R S
Q40. (CP) In the last 12 months, how often did your health plan handle your claims quickly?
Total Eligible108 19 21 21 46 3 104 36 72 3 101 86 4 21 63 39 6 76 27 4
100.0% 100.0% 100.0% 100.0% 100.0% 100.0% 100.0% 100.0% 100.0% 100.0% 100.0% 100.0% 100.0% 100.0% 100.0% 100.0% 100.0% 100.0% 100.0% 100.0%
Total ValidResponses
88 15 18 18 36 2 85 31 57 3 83 72 2 15 52 32 4 60 24 4100.0% 100.0% 100.0% 100.0% 100.0% 100.0% 100.0% 100.0% 100.0% 100.0% 100.0% 100.0% 100.0% 100.0% 100.0% 100.0% 100.0% 100.0% 100.0% 100.0%
No Answer- - - - - - - - - - - - - - - - - - - -
Always41 7 9 6 18 1 40 15 26 1 39 35 1 5 29 11 1 29 11 1
46.6% 46.7% 50.0% 33.3% 50.0% 50.0% 47.1% 48.4% 45.6% 33.3% 47.0% 48.6% 50.0% 33.3% 55.8% 34.4% 25.0% 48.3% 45.8% 25.0% ** ** ** ** ** ** ** o ** ** **
Usually38 5 8 9 16 1 37 12 26 1 36 31 1 7 20 16 2 26 10 2
43.2% 33.3% 44.4% 50.0% 44.4% 50.0% 43.5% 38.7% 45.6% 33.3% 43.4% 43.1% 50.0% 46.7% 38.5% 50.0% 50.0% 43.3% 41.7% 50.0% ** ** ** ** ** ** ** ** ** **
Sometimes7 3 1 1 2 - 6 4 3 1 6 5 - 2 2 4 1 4 2 1
8.0% 20.0% 5.6% 5.6% 5.6% - 7.1% 12.9% 5.3% 33.3% 7.2% 6.9% - 13.3% 3.8% 12.5% 25.0% 6.7% 8.3% 25.0% ** ** ** ** ** ** ** ** ** **
Never2 - - 2 - - 2 - 2 - 2 1 - 1 1 1 - 1 1 -
2.3% - - 11.1% - - 2.4% - 3.5% - 2.4% 1.4% - 6.7% 1.9% 3.1% - 1.7% 4.2% - ** ** ** ** ** ** ** ** ** **
Don't know20 4 3 3 10 1 19 5 15 - 18 14 2 6 11 7 2 16 3 -
HEDIS/CAHPSSUMMARYRATE -Always/Usually
79 12 17 15 34 2 77 27 52 2 75 66 2 12 49 27 3 55 21 389.8% 80.0% 94.4% 83.3% 94.4% 100.0% 90.6% 87.1% 91.2% 66.7% 90.4% 91.7% 100.0% 80.0% 94.2% 84.4% 75.0% 91.7% 87.5% 75.0%
** ** ** ** ** ** ** ** ** **
HEDIS/CAHPSSUMMARYRATE - Always
41 7 9 6 18 1 40 15 26 1 39 35 1 5 29 11 1 29 11 146.6% 46.7% 50.0% 33.3% 50.0% 50.0% 47.1% 48.4% 45.6% 33.3% 47.0% 48.6% 50.0% 33.3% 55.8% 34.4% 25.0% 48.3% 45.8% 25.0%
** ** ** ** ** ** ** o ** ** **
3-Point Score2.36 2.27 2.44 2.17 2.44 2.50 2.38 2.35 2.37 2.00 2.37 2.40 2.50 2.13 2.50 2.19 2.00 2.40 2.33 2.00
Cell Contents: - Count- Column Percentage- Statistical Test ResultsStatistics: Overlap formulae used- Column Proportions: Columns Tested (5%): A/B/C/D, E/F, G/H, I/J,K/L/M, N/O/P, Q/R/S, (10%): a/b/c/d, e/f, g/h, i/j,k/l/m, n/o/p, q/r/s Minimum Base: 30 (**), Small Base: 30 (*)
Presented by SPH Analytics770-978-3173
2016

Q41. (CP) In the last 12 months, how often did yourhealth plan handle your claims correctly?
Regence BCBS2016 CAHPS 5.0H Commercial Adult Survey (1113020)
Table: 40Level: Top
AGE (Q59) EDUCATION(Q61)
GENDER(Q60)
ETHNICITY(Q62) RACE (Q63) HEALTH STATUS
(Q43)MENTAL HEALTH
(Q44)
Total 18 to34
35 to44
45 to54
55 orolder
HS/GED/Less
SomeColg/Grad+
Male Female Hispanicor Latino
NotHispanicor Latino
WhiteBlack orAfrican-
AmericanOther Excellent/
Very good Good Fair/Poor
Excellent/Very good Good Fair/
Poor
A B C D E F G H I J K L M N O P Q R S
Q41. (CP) In the last 12 months, how often did your health plan handle your claims correctly?
Total Eligible108 19 21 21 46 3 104 36 72 3 101 86 4 21 63 39 6 76 27 4
100.0% 100.0% 100.0% 100.0% 100.0% 100.0% 100.0% 100.0% 100.0% 100.0% 100.0% 100.0% 100.0% 100.0% 100.0% 100.0% 100.0% 100.0% 100.0% 100.0%
Total ValidResponses
90 17 16 17 39 1 88 30 60 3 84 75 - 17 58 28 4 65 23 2100.0% 100.0% 100.0% 100.0% 100.0% 100.0% 100.0% 100.0% 100.0% 100.0% 100.0% 100.0% - 100.0% 100.0% 100.0% 100.0% 100.0% 100.0% 100.0%
No Answer- - - - - - - - - - - - - - - - - - - -
Always60 12 10 6 31 1 59 22 38 1 56 54 - 6 43 14 3 48 11 1
66.7% 70.6% 62.5% 35.3% 79.5% 100.0% 67.0% 73.3% 63.3% 33.3% 66.7% 72.0% - 35.3% 74.1% 50.0% 75.0% 73.8% 47.8% 50.0% ** ** ** ** ** ** ** ** ** **
Usually26 4 5 9 8 - 26 7 19 1 25 19 - 9 14 12 - 15 11 -
28.9% 23.5% 31.3% 52.9% 20.5% - 29.5% 23.3% 31.7% 33.3% 29.8% 25.3% - 52.9% 24.1% 42.9% - 23.1% 47.8% - ** ** ** ** ** ** ** ** ** **
Sometimes4 1 1 2 - - 3 1 3 1 3 2 - 2 1 2 1 2 1 1
4.4% 5.9% 6.3% 11.8% - - 3.4% 3.3% 5.0% 33.3% 3.6% 2.7% - 11.8% 1.7% 7.1% 25.0% 3.1% 4.3% 50.0% ** ** ** ** ** ** ** ** ** **
Never- - - - - - - - - - - - - - - - - - - -- - - - - - - - - - - - - - - - - - - - ** ** ** ** ** ** ** ** ** **
Don't know18 2 5 4 7 2 16 6 12 - 17 11 4 4 5 11 2 11 4 2
HEDIS/CAHPSSUMMARYRATE -Always/Usually
86 16 15 15 39 1 85 29 57 2 81 73 - 15 57 26 3 63 22 195.6% 94.1% 93.8% 88.2% 100.0% 100.0% 96.6% 96.7% 95.0% 66.7% 96.4% 97.3% - 88.2% 98.3% 92.9% 75.0% 96.9% 95.7% 50.0%
** ** ** ** ** ** ** ** ** **
HEDIS/CAHPSSUMMARYRATE - Always
60 12 10 6 31 1 59 22 38 1 56 54 - 6 43 14 3 48 11 166.7% 70.6% 62.5% 35.3% 79.5% 100.0% 67.0% 73.3% 63.3% 33.3% 66.7% 72.0% - 35.3% 74.1% 50.0% 75.0% 73.8% 47.8% 50.0%
** ** ** ** ** ** ** ** ** **
3-Point Score2.62 2.65 2.56 2.24 2.79 3.00 2.64 2.70 2.58 2.00 2.63 2.69 - 2.24 2.72 2.43 2.50 2.71 2.43 2.00
Cell Contents: - Count- Column Percentage- Statistical Test ResultsStatistics: Overlap formulae used- Column Proportions: Columns Tested (5%): A/B/C/D, E/F, G/H, I/J,K/L/M, N/O/P, Q/R/S, (10%): a/b/c/d, e/f, g/h, i/j,k/l/m, n/o/p, q/r/s Minimum Base: 30 (**), Small Base: 30 (*)
Presented by SPH Analytics770-978-3173
2016

Q42. What number would you use to rate yourhealth plan?
Regence BCBS2016 CAHPS 5.0H Commercial Adult Survey (1113020)
Table: 41Level: Top
AGE (Q59) EDUCATION(Q61)
GENDER(Q60)
ETHNICITY(Q62) RACE (Q63) HEALTH STATUS
(Q43)MENTAL HEALTH
(Q44)
Total 18 to34
35 to44
45 to54
55 orolder
HS/GED/Less
SomeColg/Grad+
Male Female Hispanicor Latino
NotHispanicor Latino
WhiteBlack orAfrican-
AmericanOther Excellent/
Very good Good Fair/Poor
Excellent/Very good Good Fair/
Poor
A B C D E F G H I J K L M N O P Q R S
Q42. What number would you use to rate your health plan?
Total Eligible176 26 29 34 86 7 168 60 116 9 160 137 6 39 107 55 14 129 35 10
100.0% 100.0% 100.0% 100.0% 100.0% 100.0% 100.0% 100.0% 100.0% 100.0% 100.0% 100.0% 100.0% 100.0% 100.0% 100.0% 100.0% 100.0% 100.0% 100.0%
Total ValidResponses
176 26 29 34 86 7 168 60 116 9 160 137 6 39 107 55 14 129 35 10100.0% 100.0% 100.0% 100.0% 100.0% 100.0% 100.0% 100.0% 100.0% 100.0% 100.0% 100.0% 100.0% 100.0% 100.0% 100.0% 100.0% 100.0% 100.0% 100.0%
No Answer- - - - - - - - - - - - - - - - - - - -
10 - Besthealth planpossible
26 4 3 3 16 2 23 9 17 1 25 20 2 6 17 6 3 19 5 214.8% 15.4% 10.3% 8.8% 18.6% 28.6% 13.7% 15.0% 14.7% 11.1% 15.6% 14.6% 33.3% 15.4% 15.9% 10.9% 21.4% 14.7% 14.3% 20.0%
** ** ** ** ** ** **
951 8 5 9 29 2 49 15 36 1 48 40 1 10 37 13 1 39 11 1
29.0% 30.8% 17.2% 26.5% 33.7% 28.6% 29.2% 25.0% 31.0% 11.1% 30.0% 29.2% 16.7% 25.6% 34.6% 23.6% 7.1% 30.2% 31.4% 10.0% ** ** ** ** ** ** **
843 7 7 11 18 1 42 9 34 3 37 31 1 12 26 15 2 31 9 2
24.4% 26.9% 24.1% 32.4% 20.9% 14.3% 25.0% 15.0% 29.3% 33.3% 23.1% 22.6% 16.7% 30.8% 24.3% 27.3% 14.3% 24.0% 25.7% 20.0% ** ** ** G ** ** ** **
723 3 6 2 11 - 23 13 10 3 19 20 1 3 15 7 1 19 2 1
13.1% 11.5% 20.7% 5.9% 12.8% - 13.7% 21.7% 8.6% 33.3% 11.9% 14.6% 16.7% 7.7% 14.0% 12.7% 7.1% 14.7% 5.7% 10.0% ** ** ** H ** ** ** **
614 2 5 2 5 - 14 4 10 - 14 12 - 3 7 5 2 9 3 2
8.0% 7.7% 17.2% 5.9% 5.8% - 8.3% 6.7% 8.6% - 8.8% 8.8% - 7.7% 6.5% 9.1% 14.3% 7.0% 8.6% 20.0% ** ** ** ** ** ** **
512 1 1 6 4 1 11 5 7 - 11 9 - 3 3 9 - 7 5 -
6.8% 3.8% 3.4% 17.6% 4.7% 14.3% 6.5% 8.3% 6.0% - 6.9% 6.6% - 7.7% 2.8% 16.4% - 5.4% 14.3% - ** ** D ** ** ** N ** q **
41 - 1 - - 1 - 1 - - 1 1 - - 1 - - 1 - -
0.6% - 3.4% - - 14.3% - 1.7% - - 0.6% 0.7% - - 0.9% - - 0.8% - - ** ** ** ** ** ** **
31 - - - 1 - 1 1 - - 1 1 - - - - 1 1 - -
0.6% - - - 1.2% - 0.6% 1.7% - - 0.6% 0.7% - - - - 7.1% 0.8% - - ** ** ** ** ** ** **
21 - 1 - - - 1 1 - - 1 1 - - 1 - - 1 - -
0.6% - 3.4% - - - 0.6% 1.7% - - 0.6% 0.7% - - 0.9% - - 0.8% - - ** ** ** ** ** ** **
12 1 - 1 - - 2 2 - 1 1 1 - 1 - - 2 - - 2
1.1% 3.8% - 2.9% - - 1.2% 3.3% - 11.1% 0.6% 0.7% - 2.6% - - 14.3% - - 20.0% ** ** ** H ** ** ** **
0 - Worsthealth planpossible
2 - - - 2 - 2 - 2 - 2 1 1 1 - - 2 2 - -1.1% - - - 2.3% - 1.2% - 1.7% - 1.3% 0.7% 16.7% 2.6% - - 14.3% 1.6% - -
** ** ** ** ** ** **
SUMMARY - 0-3
6 1 1 1 3 - 6 4 2 1 5 4 1 2 1 - 5 4 - 23.4% 3.8% 3.4% 2.9% 3.5% - 3.6% 6.7% 1.7% 11.1% 3.1% 2.9% 16.7% 5.1% 0.9% - 35.7% 3.1% - 20.0%
** ** ** h ** ** ** **
SUMMARY - 4-7
50 6 13 10 20 2 48 23 27 3 45 42 1 9 26 21 3 36 10 328.4% 23.1% 44.8% 29.4% 23.3% 28.6% 28.6% 38.3% 23.3% 33.3% 28.1% 30.7% 16.7% 23.1% 24.3% 38.2% 21.4% 27.9% 28.6% 30.0%
** ** ** H ** ** n ** **HEDIS/CAHPSSUMMARYRATE - 8-10
120 19 15 23 63 5 114 33 87 5 110 91 4 28 80 34 6 89 25 568.2% 73.1% 51.7% 67.6% 73.3% 71.4% 67.9% 55.0% 75.0% 55.6% 68.8% 66.4% 66.7% 71.8% 74.8% 61.8% 42.9% 69.0% 71.4% 50.0%
** ** ** G ** ** o ** **HEDIS/CAHPSSUMMARYRATE - 9-10
77 12 8 12 45 4 72 24 53 2 73 60 3 16 54 19 4 58 16 343.8% 46.2% 27.6% 35.3% 52.3% 57.1% 42.9% 40.0% 45.7% 22.2% 45.6% 43.8% 50.0% 41.0% 50.5% 34.5% 28.6% 45.0% 45.7% 30.0%
** ** c ** ** ** o ** **
3-Point Score2.25 2.31 2.00 2.09 2.38 2.29 2.24 2.17 2.29 2.11 2.26 2.25 2.33 2.21 2.39 2.09 1.79 2.29 2.23 1.90
Cell Contents: - Count- Column Percentage- Statistical Test ResultsStatistics: Overlap formulae used- Column Proportions: Columns Tested (5%): A/B/C/D, E/F, G/H, I/J,K/L/M, N/O/P, Q/R/S, (10%): a/b/c/d, e/f, g/h, i/j,k/l/m, n/o/p, q/r/s Minimum Base: 30 (**), Small Base: 30 (*)
Presented by SPH Analytics770-978-3173
2016

Q43. In general, how would you rate your overallhealth?
Regence BCBS2016 CAHPS 5.0H Commercial Adult Survey (1113020)
Table: 42Level: Top
AGE (Q59) EDUCATION(Q61)
GENDER(Q60)
ETHNICITY(Q62) RACE (Q63) HEALTH STATUS
(Q43)MENTAL HEALTH
(Q44)
Total 18 to34
35 to44
45 to54
55 orolder
HS/GED/Less
SomeColg/Grad+
Male Female Hispanicor Latino
NotHispanicor Latino
WhiteBlack orAfrican-
AmericanOther Excellent/
Very good Good Fair/Poor
Excellent/Very good Good Fair/
Poor
A B C D E F G H I J K L M N O P Q R S
Q43. In general, how would you rate your overall health?
Total Eligible176 26 29 34 86 7 168 60 116 9 160 137 6 39 107 55 14 129 35 10
100.0% 100.0% 100.0% 100.0% 100.0% 100.0% 100.0% 100.0% 100.0% 100.0% 100.0% 100.0% 100.0% 100.0% 100.0% 100.0% 100.0% 100.0% 100.0% 100.0%
Total ValidResponses
176 26 29 34 86 7 168 60 116 9 160 137 6 39 107 55 14 129 35 10100.0% 100.0% 100.0% 100.0% 100.0% 100.0% 100.0% 100.0% 100.0% 100.0% 100.0% 100.0% 100.0% 100.0% 100.0% 100.0% 100.0% 100.0% 100.0% 100.0%
No Answer- - - - - - - - - - - - - - - - - - - -
Excellent42 8 7 3 23 - 41 19 23 3 37 34 - 8 42 - - 39 3 -
23.9% 30.8% 24.1% 8.8% 26.7% - 24.4% 31.7% 19.8% 33.3% 23.1% 24.8% - 20.5% 39.3% - - 30.2% 8.6% - ** ** C ** h ** ** O ** R **
Very good65 11 11 15 28 4 61 18 47 1 60 53 - 12 65 - - 57 7 -
36.9% 42.3% 37.9% 44.1% 32.6% 57.1% 36.3% 30.0% 40.5% 11.1% 37.5% 38.7% - 30.8% 60.7% - - 44.2% 20.0% - ** ** ** ** ** O ** R **
Good55 6 10 15 24 3 52 15 40 4 50 39 4 17 - 55 - 27 24 3
31.3% 23.1% 34.5% 44.1% 27.9% 42.9% 31.0% 25.0% 34.5% 44.4% 31.3% 28.5% 66.7% 43.6% - 100.0% - 20.9% 68.6% 30.0% ** ** d ** ** ** k N ** Q **
Fair12 1 1 - 10 - 12 6 6 - 12 10 2 1 - - 12 6 1 5
6.8% 3.8% 3.4% - 11.6% - 7.1% 10.0% 5.2% - 7.5% 7.3% 33.3% 2.6% - - 85.7% 4.7% 2.9% 50.0% ** ** C ** ** ** ** **
Poor2 - - 1 1 - 2 2 - 1 1 1 - 1 - - 2 - - 2
1.1% - - 2.9% 1.2% - 1.2% 3.3% - 11.1% 0.6% 0.7% - 2.6% - - 14.3% - - 20.0% ** ** ** H ** ** ** **
HEDIS/CAHPSSUMMARYRATE -Excellent/Verygood
107 19 18 18 51 4 102 37 70 4 97 87 - 20 107 - - 96 10 -60.8% 73.1% 62.1% 52.9% 59.3% 57.1% 60.7% 61.7% 60.3% 44.4% 60.6% 63.5% - 51.3% 100.0% - - 74.4% 28.6% -
** ** ** ** ** O ** R **
Cell Contents: - Count- Column Percentage- Statistical Test ResultsStatistics: Overlap formulae used- Column Proportions: Columns Tested (5%): A/B/C/D, E/F, G/H, I/J,K/L/M, N/O/P, Q/R/S, (10%): a/b/c/d, e/f, g/h, i/j,k/l/m, n/o/p, q/r/s Minimum Base: 30 (**), Small Base: 30 (*)
Presented by SPH Analytics770-978-3173
2016

Q44. In general, how would you rate your overallmental or emotional health?
Regence BCBS2016 CAHPS 5.0H Commercial Adult Survey (1113020)
Table: 43Level: Top
AGE (Q59) EDUCATION(Q61)
GENDER(Q60)
ETHNICITY(Q62) RACE (Q63) HEALTH STATUS
(Q43)MENTAL HEALTH
(Q44)
Total 18 to34
35 to44
45 to54
55 orolder
HS/GED/Less
SomeColg/Grad+
Male Female Hispanicor Latino
NotHispanicor Latino
WhiteBlack orAfrican-
AmericanOther Excellent/
Very good Good Fair/Poor
Excellent/Very good Good Fair/
Poor
A B C D E F G H I J K L M N O P Q R S
Q44. In general, how would you rate your overall mental or emotional health?
Total Eligible176 26 29 34 86 7 168 60 116 9 160 137 6 39 107 55 14 129 35 10
100.0% 100.0% 100.0% 100.0% 100.0% 100.0% 100.0% 100.0% 100.0% 100.0% 100.0% 100.0% 100.0% 100.0% 100.0% 100.0% 100.0% 100.0% 100.0% 100.0%
Total ValidResponses
174 26 28 34 85 7 166 60 114 9 159 135 6 39 106 54 14 129 35 10100.0% 100.0% 100.0% 100.0% 100.0% 100.0% 100.0% 100.0% 100.0% 100.0% 100.0% 100.0% 100.0% 100.0% 100.0% 100.0% 100.0% 100.0% 100.0% 100.0%
No Answer2 - 1 - 1 - 2 - 2 - 1 2 - - 1 1 - - - -
Excellent53 11 5 8 28 1 51 23 30 4 47 43 1 9 43 9 1 53 - -
30.5% 42.3% 17.9% 23.5% 32.9% 14.3% 30.7% 38.3% 26.3% 44.4% 29.6% 31.9% 16.7% 23.1% 40.6% 16.7% 7.1% 41.1% - - ** ** ** ** ** O ** R **
Very good76 9 14 18 35 4 72 25 51 3 70 62 1 17 53 18 5 76 - -
43.7% 34.6% 50.0% 52.9% 41.2% 57.1% 43.4% 41.7% 44.7% 33.3% 44.0% 45.9% 16.7% 43.6% 50.0% 33.3% 35.7% 58.9% - - ** ** ** ** ** O ** R **
Good35 5 6 7 17 2 33 5 30 1 33 22 1 12 10 24 1 - 35 -
20.1% 19.2% 21.4% 20.6% 20.0% 28.6% 19.9% 8.3% 26.3% 11.1% 20.8% 16.3% 16.7% 30.8% 9.4% 44.4% 7.1% - 100.0% - ** ** ** G ** ** K N ** Q **
Fair8 1 3 - 4 - 8 5 3 - 8 7 2 - - 3 5 - - 8
4.6% 3.8% 10.7% - 4.7% - 4.8% 8.3% 2.6% - 5.0% 5.2% 33.3% - - 5.6% 35.7% - - 80.0% ** ** ** h ** ** N ** **
Poor2 - - 1 1 - 2 2 - 1 1 1 1 1 - - 2 - - 2
1.1% - - 2.9% 1.2% - 1.2% 3.3% - 11.1% 0.6% 0.7% 16.7% 2.6% - - 14.3% - - 20.0% ** ** ** h ** ** ** **
HEDIS/CAHPSSUMMARYRATE -Excellent/Verygood
129 20 19 26 63 5 123 48 81 7 117 105 2 26 96 27 6 129 - -74.1% 76.9% 67.9% 76.5% 74.1% 71.4% 74.1% 80.0% 71.1% 77.8% 73.6% 77.8% 33.3% 66.7% 90.6% 50.0% 42.9% 100.0% - -
** ** ** ** ** O ** R **
Cell Contents: - Count- Column Percentage- Statistical Test ResultsStatistics: Overlap formulae used- Column Proportions: Columns Tested (5%): A/B/C/D, E/F, G/H, I/J,K/L/M, N/O/P, Q/R/S, (10%): a/b/c/d, e/f, g/h, i/j,k/l/m, n/o/p, q/r/s Minimum Base: 30 (**), Small Base: 30 (*)
Presented by SPH Analytics770-978-3173
2016

Q45. Have you had either a flu shot or flu spray inthe nose since July 1, 2015? (All respondents)
Regence BCBS2016 CAHPS 5.0H Commercial Adult Survey (1113020)
Table: 44Level: Top
AGE (Q59) EDUCATION(Q61)
GENDER(Q60)
ETHNICITY(Q62) RACE (Q63) HEALTH STATUS
(Q43)MENTAL HEALTH
(Q44)
Total 18 to34
35 to44
45 to54
55 orolder
HS/GED/Less
SomeColg/Grad+
Male Female Hispanicor Latino
NotHispanicor Latino
WhiteBlack orAfrican-
AmericanOther Excellent/
Very good Good Fair/Poor
Excellent/Very good Good Fair/
Poor
A B C D E F G H I J K L M N O P Q R S
Q45. Have you had either a flu shot or flu spray in the nose since July 1, 2015? (All respondents)
Total Eligible176 26 29 34 86 7 168 60 116 9 160 137 6 39 107 55 14 129 35 10
100.0% 100.0% 100.0% 100.0% 100.0% 100.0% 100.0% 100.0% 100.0% 100.0% 100.0% 100.0% 100.0% 100.0% 100.0% 100.0% 100.0% 100.0% 100.0% 100.0%
Total ValidResponses
174 26 29 33 85 6 167 59 115 9 158 136 5 37 107 53 14 128 34 10100.0% 100.0% 100.0% 100.0% 100.0% 100.0% 100.0% 100.0% 100.0% 100.0% 100.0% 100.0% 100.0% 100.0% 100.0% 100.0% 100.0% 100.0% 100.0% 100.0%
No Answer- - - - - - - - - - - - - - - - - - - -
Yes138 23 20 26 68 5 132 46 92 6 127 107 2 28 89 38 11 101 28 7
79.3% 88.5% 69.0% 78.8% 80.0% 83.3% 79.0% 78.0% 80.0% 66.7% 80.4% 78.7% 40.0% 75.7% 83.2% 71.7% 78.6% 78.9% 82.4% 70.0% ** ** ** ** ** o ** **
No36 3 9 7 17 1 35 13 23 3 31 29 3 9 18 15 3 27 6 3
20.7% 11.5% 31.0% 21.2% 20.0% 16.7% 21.0% 22.0% 20.0% 33.3% 19.6% 21.3% 60.0% 24.3% 16.8% 28.3% 21.4% 21.1% 17.6% 30.0% ** ** ** ** ** n ** **
Don't know2 - - 1 1 1 1 1 1 - 2 1 1 2 - 2 - 1 1 -
HEDIS/CAHPSSUMMARYRATE - Yes
138 23 20 26 68 5 132 46 92 6 127 107 2 28 89 38 11 101 28 779.3% 88.5% 69.0% 78.8% 80.0% 83.3% 79.0% 78.0% 80.0% 66.7% 80.4% 78.7% 40.0% 75.7% 83.2% 71.7% 78.6% 78.9% 82.4% 70.0%
** ** ** ** ** o ** **
Cell Contents: - Count- Column Percentage- Statistical Test ResultsStatistics: Overlap formulae used- Column Proportions: Columns Tested (5%): A/B/C/D, E/F, G/H, I/J,K/L/M, N/O/P, Q/R/S, (10%): a/b/c/d, e/f, g/h, i/j,k/l/m, n/o/p, q/r/s Minimum Base: 30 (**), Small Base: 30 (*)
Presented by SPH Analytics770-978-3173
2016
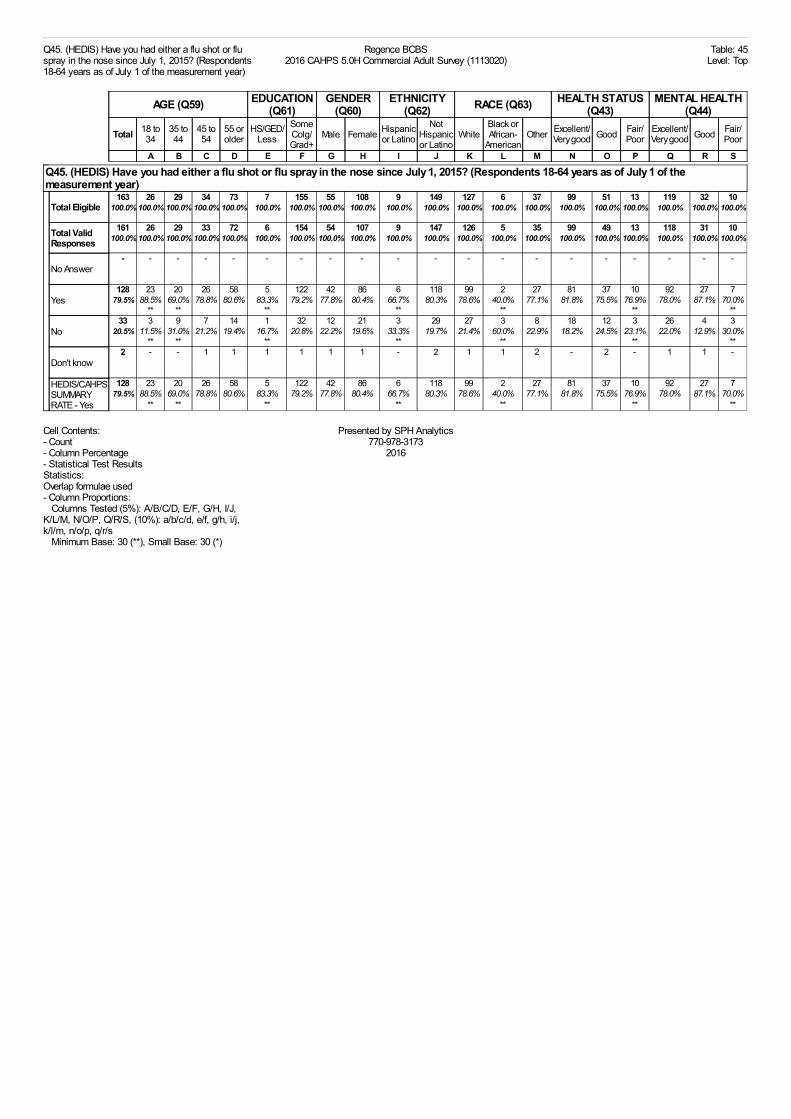
Q45. (HEDIS) Have you had either a flu shot or fluspray in the nose since July 1, 2015? (Respondents18-64 years as of July 1 of the measurement year)
Regence BCBS2016 CAHPS 5.0H Commercial Adult Survey (1113020)
Table: 45Level: Top
AGE (Q59) EDUCATION(Q61)
GENDER(Q60)
ETHNICITY(Q62) RACE (Q63) HEALTH STATUS
(Q43)MENTAL HEALTH
(Q44)
Total 18 to34
35 to44
45 to54
55 orolder
HS/GED/Less
SomeColg/Grad+
Male Female Hispanicor Latino
NotHispanicor Latino
WhiteBlack orAfrican-
AmericanOther Excellent/
Very good Good Fair/Poor
Excellent/Very good Good Fair/
Poor
A B C D E F G H I J K L M N O P Q R S
Q45. (HEDIS) Have you had either a flu shot or flu spray in the nose since July 1, 2015? (Respondents 18-64 years as of July 1 of themeasurement year)
Total Eligible163 26 29 34 73 7 155 55 108 9 149 127 6 37 99 51 13 119 32 10
100.0% 100.0% 100.0% 100.0% 100.0% 100.0% 100.0% 100.0% 100.0% 100.0% 100.0% 100.0% 100.0% 100.0% 100.0% 100.0% 100.0% 100.0% 100.0% 100.0%
Total ValidResponses
161 26 29 33 72 6 154 54 107 9 147 126 5 35 99 49 13 118 31 10100.0% 100.0% 100.0% 100.0% 100.0% 100.0% 100.0% 100.0% 100.0% 100.0% 100.0% 100.0% 100.0% 100.0% 100.0% 100.0% 100.0% 100.0% 100.0% 100.0%
No Answer- - - - - - - - - - - - - - - - - - - -
Yes128 23 20 26 58 5 122 42 86 6 118 99 2 27 81 37 10 92 27 7
79.5% 88.5% 69.0% 78.8% 80.6% 83.3% 79.2% 77.8% 80.4% 66.7% 80.3% 78.6% 40.0% 77.1% 81.8% 75.5% 76.9% 78.0% 87.1% 70.0% ** ** ** ** ** ** **
No33 3 9 7 14 1 32 12 21 3 29 27 3 8 18 12 3 26 4 3
20.5% 11.5% 31.0% 21.2% 19.4% 16.7% 20.8% 22.2% 19.6% 33.3% 19.7% 21.4% 60.0% 22.9% 18.2% 24.5% 23.1% 22.0% 12.9% 30.0% ** ** ** ** ** ** **
Don't know2 - - 1 1 1 1 1 1 - 2 1 1 2 - 2 - 1 1 -
HEDIS/CAHPSSUMMARYRATE - Yes
128 23 20 26 58 5 122 42 86 6 118 99 2 27 81 37 10 92 27 779.5% 88.5% 69.0% 78.8% 80.6% 83.3% 79.2% 77.8% 80.4% 66.7% 80.3% 78.6% 40.0% 77.1% 81.8% 75.5% 76.9% 78.0% 87.1% 70.0%
** ** ** ** ** ** **
Cell Contents: - Count- Column Percentage- Statistical Test ResultsStatistics: Overlap formulae used- Column Proportions: Columns Tested (5%): A/B/C/D, E/F, G/H, I/J,K/L/M, N/O/P, Q/R/S, (10%): a/b/c/d, e/f, g/h, i/j,k/l/m, n/o/p, q/r/s Minimum Base: 30 (**), Small Base: 30 (*)
Presented by SPH Analytics770-978-3173
2016

Q46. Do you now smoke cigarettes or use tobaccoevery day, some days, or not at all?
Regence BCBS2016 CAHPS 5.0H Commercial Adult Survey (1113020)
Table: 46Level: Top
AGE (Q59) EDUCATION(Q61)
GENDER(Q60)
ETHNICITY(Q62) RACE (Q63) HEALTH STATUS
(Q43)MENTAL HEALTH
(Q44)
Total 18 to34
35 to44
45 to54
55 orolder
HS/GED/Less
SomeColg/Grad+
Male Female Hispanicor Latino
NotHispanicor Latino
WhiteBlack orAfrican-
AmericanOther Excellent/
Very good Good Fair/Poor
Excellent/Very good Good Fair/
Poor
A B C D E F G H I J K L M N O P Q R S
Q46. Do you now smoke cigarettes or use tobacco every day, some days, or not at all?
Total Eligible176 26 29 34 86 7 168 60 116 9 160 137 6 39 107 55 14 129 35 10
100.0% 100.0% 100.0% 100.0% 100.0% 100.0% 100.0% 100.0% 100.0% 100.0% 100.0% 100.0% 100.0% 100.0% 100.0% 100.0% 100.0% 100.0% 100.0% 100.0%
Total ValidResponses
175 26 29 33 86 7 167 60 115 9 159 136 6 39 107 54 14 129 34 10100.0% 100.0% 100.0% 100.0% 100.0% 100.0% 100.0% 100.0% 100.0% 100.0% 100.0% 100.0% 100.0% 100.0% 100.0% 100.0% 100.0% 100.0% 100.0% 100.0%
No Answer1 - - 1 - - 1 - 1 - 1 1 - - - 1 - - 1 -
Every day4 - 1 2 1 1 3 3 1 - 4 4 1 - 1 2 1 3 - 1
2.3% - 3.4% 6.1% 1.2% 14.3% 1.8% 5.0% 0.9% - 2.5% 2.9% 16.7% - 0.9% 3.7% 7.1% 2.3% - 10.0% ** ** ** h ** ** ** **
Some days- - - - - - - - - - - - - - - - - - - -- - - - - - - - - - - - - - - - - - - - ** ** ** ** ** ** **
Not at all167 24 28 31 83 6 160 56 111 9 151 129 5 39 104 52 11 123 33 9
95.4% 92.3% 96.6% 93.9% 96.5% 85.7% 95.8% 93.3% 96.5% 100.0% 95.0% 94.9% 83.3% 100.0% 97.2% 96.3% 78.6% 95.3% 97.1% 90.0% ** ** ** ** ** ** **
Don't know4 2 - - 2 - 4 1 3 - 4 3 - - 2 - 2 3 1 -
2.3% 7.7% - - 2.3% - 2.4% 1.7% 2.6% - 2.5% 2.2% - - 1.9% - 14.3% 2.3% 2.9% - ** ** ** ** ** ** **
HEDIS/CAHPSSUMMARYRATE - %Smokers andTobaccoUsers
4 - 1 2 1 1 3 3 1 - 4 4 1 - 1 2 1 3 - 12.3% - 3.4% 6.1% 1.2% 14.3% 1.8% 5.0% 0.9% - 2.5% 2.9% 16.7% - 0.9% 3.7% 7.1% 2.3% - 10.0%
** ** ** h ** ** ** **
Cell Contents: - Count- Column Percentage- Statistical Test ResultsStatistics: Overlap formulae used- Column Proportions: Columns Tested (5%): A/B/C/D, E/F, G/H, I/J,K/L/M, N/O/P, Q/R/S, (10%): a/b/c/d, e/f, g/h, i/j,k/l/m, n/o/p, q/r/s Minimum Base: 30 (**), Small Base: 30 (*)
Presented by SPH Analytics770-978-3173
2016

Q47. (HEDIS) In the last 12 months, how often wereyou advised to quit smoking or using tobacco by adoctor or other health provider in your plan?
Regence BCBS2016 CAHPS 5.0H Commercial Adult Survey (1113020)
Table: 47Level: Top
AGE (Q59) EDUCATION(Q61)
GENDER(Q60)
ETHNICITY(Q62) RACE (Q63) HEALTH STATUS
(Q43)MENTAL HEALTH
(Q44)
Total18to34
35 to44
45 to54
55 orolder
HS/GED/Less
SomeColg/Grad+
Male Female Hispanicor Latino
NotHispanicor Latino
WhiteBlack orAfrican-
AmericanOther Excellent/
Very good Good Fair/Poor
Excellent/Very good Good Fair/
Poor
A B C D E F G H I J K L M N O P Q R S
Q47. (HEDIS) In the last 12 months, how often were you advised to quit smoking or using tobacco by a doctor or other health provider in yourplan?
TotalEligible
4 - 1 2 1 1 3 3 1 - 4 4 1 - 1 2 1 3 - 1100.0% - 100.0% 100.0% 100.0% 100.0% 100.0% 100.0% 100.0% - 100.0% 100.0% 100.0% - 100.0% 100.0% 100.0% 100.0% - 100.0%
Total ValidResponses
4 - 1 2 1 1 3 3 1 - 4 4 1 - 1 2 1 3 - 1100.0% - 100.0% 100.0% 100.0% 100.0% 100.0% 100.0% 100.0% - 100.0% 100.0% 100.0% - 100.0% 100.0% 100.0% 100.0% - 100.0%
No Answer- - - - - - - - - - - - - - - - - - - -
Always1 - - - 1 - 1 1 - - 1 1 1 - - - 1 - - 1
25.0% - - - 100.0% - 33.3% 33.3% - - 25.0% 25.0% 100.0% - - - 100.0% - - 100.0% ** ** ** ** ** ** ** ** ** ** ** ** ** **
Usually- - - - - - - - - - - - - - - - - - - -- - - - - - - - - - - - - - - - - - - - ** ** ** ** ** ** ** ** ** ** ** ** ** **
Sometimes1 - - 1 - 1 - 1 - - 1 1 - - - 1 - 1 - -
25.0% - - 50.0% - 100.0% - 33.3% - - 25.0% 25.0% - - - 50.0% - 33.3% - - ** ** ** ** ** ** ** ** ** ** ** ** ** **
Never2 - 1 1 - - 2 1 1 - 2 2 - - 1 1 - 2 - -
50.0% - 100.0% 50.0% - - 66.7% 33.3% 100.0% - 50.0% 50.0% - - 100.0% 50.0% - 66.7% - - ** ** ** ** ** ** ** ** ** ** ** ** ** **
CURRENTYEARSUMMARYRATE -AdvisingSmokersandTobaccoUsers toQuit Rate
2 - - 1 1 1 1 2 - - 2 2 1 - - 1 1 1 - 150.0% - - 50.0% 100.0% 100.0% 33.3% 66.7% - - 50.0% 50.0% 100.0% - - 50.0% 100.0% 33.3% - 100.0%
** ** ** ** ** ** ** ** ** ** ** ** ** **
Cell Contents: - Count- Column Percentage- Statistical Test ResultsStatistics: Overlap formulae used- Column Proportions: Columns Tested (5%): A/B/C/D, E/F, G/H, I/J,K/L/M, N/O/P, Q/R/S, (10%): a/b/c/d, e/f, g/h, i/j,k/l/m, n/o/p, q/r/s Minimum Base: 30 (**), Small Base: 30 (*)
Presented by SPH Analytics770-978-3173
2016

Q48. (HEDIS) In the last 12 months, how often wasmedication recommended or discussed by a doctoror health provider to assist you with quitting smokingor using tobacco?
Regence BCBS2016 CAHPS 5.0H Commercial Adult Survey (1113020)
Table: 48Level: Top
AGE (Q59) EDUCATION(Q61)
GENDER(Q60)
ETHNICITY(Q62) RACE (Q63) HEALTH STATUS
(Q43)MENTAL HEALTH
(Q44)
Total18to34
35 to44
45 to54
55 orolder
HS/GED/Less
SomeColg/Grad+
Male Female Hispanicor Latino
NotHispanicor Latino
WhiteBlack orAfrican-
AmericanOther Excellent/
Very good Good Fair/Poor
Excellent/Very good Good Fair/
Poor
A B C D E F G H I J K L M N O P Q R S
Q48. (HEDIS) In the last 12 months, how often was medication recommended or discussed by a doctor or health provider to assist you withquitting smoking or using tobacco?
TotalEligible
4 - 1 2 1 1 3 3 1 - 4 4 1 - 1 2 1 3 - 1100.0% - 100.0% 100.0% 100.0% 100.0% 100.0% 100.0% 100.0% - 100.0% 100.0% 100.0% - 100.0% 100.0% 100.0% 100.0% - 100.0%
Total ValidResponses
4 - 1 2 1 1 3 3 1 - 4 4 1 - 1 2 1 3 - 1100.0% - 100.0% 100.0% 100.0% 100.0% 100.0% 100.0% 100.0% - 100.0% 100.0% 100.0% - 100.0% 100.0% 100.0% 100.0% - 100.0%
No Answer- - - - - - - - - - - - - - - - - - - -
Always1 - - 1 - - 1 1 - - 1 1 - - 1 - - 1 - -
25.0% - - 50.0% - - 33.3% 33.3% - - 25.0% 25.0% - - 100.0% - - 33.3% - - ** ** ** ** ** ** ** ** ** ** ** ** ** **
Usually- - - - - - - - - - - - - - - - - - - -- - - - - - - - - - - - - - - - - - - - ** ** ** ** ** ** ** ** ** ** ** ** ** **
Sometimes2 - - 1 1 1 1 2 - - 2 2 1 - - 1 1 1 - 1
50.0% - - 50.0% 100.0% 100.0% 33.3% 66.7% - - 50.0% 50.0% 100.0% - - 50.0% 100.0% 33.3% - 100.0% ** ** ** ** ** ** ** ** ** ** ** ** ** **
Never1 - 1 - - - 1 - 1 - 1 1 - - - 1 - 1 - -
25.0% - 100.0% - - - 33.3% - 100.0% - 25.0% 25.0% - - - 50.0% - 33.3% - - ** ** ** ** ** ** ** ** ** ** ** ** ** **
CURRENTYEARSUMMARYRATE -DiscussingCessationMedicationsRate
3 - - 2 1 1 2 3 - - 3 3 1 - 1 1 1 2 - 175.0% - - 100.0% 100.0% 100.0% 66.7% 100.0% - - 75.0% 75.0% 100.0% - 100.0% 50.0% 100.0% 66.7% - 100.0%
** ** ** ** ** ** ** ** ** ** ** ** ** **
Cell Contents: - Count- Column Percentage- Statistical Test ResultsStatistics: Overlap formulae used- Column Proportions: Columns Tested (5%): A/B/C/D, E/F, G/H, I/J,K/L/M, N/O/P, Q/R/S, (10%): a/b/c/d, e/f, g/h, i/j,k/l/m, n/o/p, q/r/s Minimum Base: 30 (**), Small Base: 30 (*)
Presented by SPH Analytics770-978-3173
2016

Q49. (HEDIS) In the last 12 months, how often didyour doctor or health provider discuss or providemethods and strategies other than medication toassist you with quitting smoking or using tobacco?
Regence BCBS2016 CAHPS 5.0H Commercial Adult Survey (1113020)
Table: 49Level: Top
AGE (Q59) EDUCATION(Q61)
GENDER(Q60)
ETHNICITY(Q62) RACE (Q63) HEALTH STATUS
(Q43)MENTAL HEALTH
(Q44)
Total18to34
35 to44
45 to54
55 orolder
HS/GED/Less
SomeColg/Grad+
Male Female Hispanicor Latino
NotHispanicor Latino
WhiteBlack orAfrican-
AmericanOther Excellent/
Very good Good Fair/Poor
Excellent/Very good Good Fair/
Poor
A B C D E F G H I J K L M N O P Q R S
Q49. (HEDIS) In the last 12 months, how often did your doctor or health provider discuss or provide methods and strategies other thanmedication to assist you with quitting smoking or using tobacco?
TotalEligible
4 - 1 2 1 1 3 3 1 - 4 4 1 - 1 2 1 3 - 1100.0% - 100.0% 100.0% 100.0% 100.0% 100.0% 100.0% 100.0% - 100.0% 100.0% 100.0% - 100.0% 100.0% 100.0% 100.0% - 100.0%
Total ValidResponses
4 - 1 2 1 1 3 3 1 - 4 4 1 - 1 2 1 3 - 1100.0% - 100.0% 100.0% 100.0% 100.0% 100.0% 100.0% 100.0% - 100.0% 100.0% 100.0% - 100.0% 100.0% 100.0% 100.0% - 100.0%
No Answer- - - - - - - - - - - - - - - - - - - -
Always- - - - - - - - - - - - - - - - - - - -- - - - - - - - - - - - - - - - - - - - ** ** ** ** ** ** ** ** ** ** ** ** ** **
Usually- - - - - - - - - - - - - - - - - - - -- - - - - - - - - - - - - - - - - - - - ** ** ** ** ** ** ** ** ** ** ** ** ** **
Sometimes1 - - - 1 - 1 1 - - 1 1 1 - - - 1 - - 1
25.0% - - - 100.0% - 33.3% 33.3% - - 25.0% 25.0% 100.0% - - - 100.0% - - 100.0% ** ** ** ** ** ** ** ** ** ** ** ** ** **
Never3 - 1 2 - 1 2 2 1 - 3 3 - - 1 2 - 3 - -
75.0% - 100.0% 100.0% - 100.0% 66.7% 66.7% 100.0% - 75.0% 75.0% - - 100.0% 100.0% - 100.0% - - ** ** ** ** ** ** ** ** ** ** ** ** ** **
CURRENTYEARSUMMARYRATE -DiscussingCessationStrategiesRate
1 - - - 1 - 1 1 - - 1 1 1 - - - 1 - - 125.0% - - - 100.0% - 33.3% 33.3% - - 25.0% 25.0% 100.0% - - - 100.0% - - 100.0%
** ** ** ** ** ** ** ** ** ** ** ** ** **
Cell Contents: - Count- Column Percentage- Statistical Test ResultsStatistics: Overlap formulae used- Column Proportions: Columns Tested (5%): A/B/C/D, E/F, G/H, I/J,K/L/M, N/O/P, Q/R/S, (10%): a/b/c/d, e/f, g/h, i/j,k/l/m, n/o/p, q/r/s Minimum Base: 30 (**), Small Base: 30 (*)
Presented by SPH Analytics770-978-3173
2016

Q50. Do you take aspirin daily or every other day?(All respondents)
Regence BCBS2016 CAHPS 5.0H Commercial Adult Survey (1113020)
Table: 50Level: Top
AGE (Q59) EDUCATION(Q61)
GENDER(Q60)
ETHNICITY(Q62) RACE (Q63) HEALTH STATUS
(Q43)MENTAL HEALTH
(Q44)
Total 18 to34
35 to44
45 to54
55 orolder
HS/GED/Less
SomeColg/Grad+
Male Female Hispanicor Latino
NotHispanicor Latino
WhiteBlack orAfrican-
AmericanOther Excellent/
Very good Good Fair/Poor
Excellent/Very good Good Fair/
Poor
A B C D E F G H I J K L M N O P Q R S
Q50. Do you take aspirin daily or every other day? (All respondents)
Total Eligible176 26 29 34 86 7 168 60 116 9 160 137 6 39 107 55 14 129 35 10
100.0% 100.0% 100.0% 100.0% 100.0% 100.0% 100.0% 100.0% 100.0% 100.0% 100.0% 100.0% 100.0% 100.0% 100.0% 100.0% 100.0% 100.0% 100.0% 100.0%
Total ValidResponses
176 26 29 34 86 7 168 60 116 9 160 137 6 39 107 55 14 129 35 10100.0% 100.0% 100.0% 100.0% 100.0% 100.0% 100.0% 100.0% 100.0% 100.0% 100.0% 100.0% 100.0% 100.0% 100.0% 100.0% 100.0% 100.0% 100.0% 100.0%
No Answer- - - - - - - - - - - - - - - - - - - -
Yes31 - 1 6 24 2 29 18 13 1 28 26 2 5 19 6 6 24 5 1
17.6% - 3.4% 17.6% 27.9% 28.6% 17.3% 30.0% 11.2% 11.1% 17.5% 19.0% 33.3% 12.8% 17.8% 10.9% 42.9% 18.6% 14.3% 10.0% ** ** ** H ** ** ** **
No145 26 28 28 62 5 139 42 103 8 132 111 4 34 88 49 8 105 30 9
82.4% 100.0% 96.6% 82.4% 72.1% 71.4% 82.7% 70.0% 88.8% 88.9% 82.5% 81.0% 66.7% 87.2% 82.2% 89.1% 57.1% 81.4% 85.7% 90.0% ** ** ** G ** ** ** **
Don't know- - - - - - - - - - - - - - - - - - - -
HEDIS/CAHPSSUMMARYRATE - Yes
31 - 1 6 24 2 29 18 13 1 28 26 2 5 19 6 6 24 5 117.6% - 3.4% 17.6% 27.9% 28.6% 17.3% 30.0% 11.2% 11.1% 17.5% 19.0% 33.3% 12.8% 17.8% 10.9% 42.9% 18.6% 14.3% 10.0%
** ** ** H ** ** ** **
Cell Contents: - Count- Column Percentage- Statistical Test ResultsStatistics: Overlap formulae used- Column Proportions: Columns Tested (5%): A/B/C/D, E/F, G/H, I/J,K/L/M, N/O/P, Q/R/S, (10%): a/b/c/d, e/f, g/h, i/j,k/l/m, n/o/p, q/r/s Minimum Base: 30 (**), Small Base: 30 (*)
Presented by SPH Analytics770-978-3173
2016

HEDIS Measure: Aspirin Use Regence BCBS2016 CAHPS 5.0H Commercial Adult Survey (1113020)
Table: 51Level: Top
AGE (Q59) EDUCATION(Q61)
GENDER(Q60)
ETHNICITY(Q62) RACE (Q63) HEALTH STATUS
(Q43)MENTAL HEALTH
(Q44)
Total 18 to34
35 to44
45 to54
55 orolder
HS/GED/Less
SomeColg/Grad+
Male Female Hispanicor Latino
NotHispanicor Latino
WhiteBlack orAfrican-
AmericanOther Excellent/
Very good Good Fair/Poor
Excellent/Very good Good Fair/
Poor
A B C D E F G H I J K L M N O P Q R S
HEDIS Measure: Aspirin Use
TotalEligible
176 26 29 34 86 7 168 60 116 9 160 137 6 39 107 55 14 129 35 10100.0% 100.0% 100.0% 100.0% 100.0% 100.0% 100.0% 100.0% 100.0% 100.0% 100.0% 100.0% 100.0% 100.0% 100.0% 100.0% 100.0% 100.0% 100.0% 100.0%
Total ValidResponses
23 - - 3 20 4 19 17 6 1 20 20 - 2 16 5 2 19 2 2100.0% - - 100.0% 100.0% 100.0% 100.0% 100.0% 100.0% 100.0% 100.0% 100.0% - 100.0% 100.0% 100.0% 100.0% 100.0% 100.0% 100.0%
No Answer153 26 29 31 66 3 149 43 110 8 140 117 6 37 91 50 12 110 33 8
CurrentYearSummaryRate
10 - - 1 9 2 8 7 3 - 9 9 - - 9 1 - 10 - -43.5% - - 33.3% 45.0% 50.0% 42.1% 41.2% 50.0% - 45.0% 45.0% - - 56.3% 20.0% - 52.6% - -
** ** ** ** ** ** ** ** ** ** ** ** ** ** ** **
CurrentYearBottom BoxRate
13 - - 2 11 2 11 10 3 1 11 11 - 2 7 4 2 9 2 256.5% - - 66.7% 55.0% 50.0% 57.9% 58.8% 50.0% 100.0% 55.0% 55.0% - 100.0% 43.8% 80.0% 100.0% 47.4% 100.0% 100.0%
** ** ** ** ** ** ** ** ** ** ** ** ** ** ** **
Cell Contents: - Count- Column Percentage- Statistical Test ResultsStatistics: Overlap formulae used- Column Proportions: Columns Tested (5%): A/B/C/D, E/F, G/H, I/J,K/L/M, N/O/P, Q/R/S, (10%): a/b/c/d, e/f, g/h, i/j,k/l/m, n/o/p, q/r/s Minimum Base: 30 (**), Small Base: 30 (*)
Presented by SPH Analytics770-978-3173
2016

Q51. Do you have a health problem or takemedication that makes taking aspirin unsafe for you?
Regence BCBS2016 CAHPS 5.0H Commercial Adult Survey (1113020)
Table: 52Level: Top
AGE (Q59) EDUCATION(Q61)
GENDER(Q60)
ETHNICITY(Q62) RACE (Q63) HEALTH STATUS
(Q43)MENTAL HEALTH
(Q44)
Total 18 to34
35 to44
45 to54
55 orolder
HS/GED/Less
SomeColg/Grad+
Male Female Hispanicor Latino
NotHispanicor Latino
WhiteBlack orAfrican-
AmericanOther Excellent/
Very good Good Fair/Poor
Excellent/Very good Good Fair/
Poor
A B C D E F G H I J K L M N O P Q R S
Q51. Do you have a health problem or take medication that makes taking aspirin unsafe for you?
Total Eligible176 26 29 34 86 7 168 60 116 9 160 137 6 39 107 55 14 129 35 10
100.0% 100.0% 100.0% 100.0% 100.0% 100.0% 100.0% 100.0% 100.0% 100.0% 100.0% 100.0% 100.0% 100.0% 100.0% 100.0% 100.0% 100.0% 100.0% 100.0%
Total ValidResponses
163 25 29 32 76 7 155 53 110 8 150 129 4 35 105 48 10 127 28 7100.0% 100.0% 100.0% 100.0% 100.0% 100.0% 100.0% 100.0% 100.0% 100.0% 100.0% 100.0% 100.0% 100.0% 100.0% 100.0% 100.0% 100.0% 100.0% 100.0%
No Answer2 - - - 2 - 2 - 2 - 1 1 - 1 1 1 - - 1 -
Yes7 - 2 1 4 - 7 3 4 1 6 7 - 1 2 3 2 6 - 1
4.3% - 6.9% 3.1% 5.3% - 4.5% 5.7% 3.6% 12.5% 4.0% 5.4% - 2.9% 1.9% 6.3% 20.0% 4.7% - 14.3% ** ** ** ** ** ** ** **
No156 25 27 31 72 7 148 50 106 7 144 122 4 34 103 45 8 121 28 6
95.7% 100.0% 93.1% 96.9% 94.7% 100.0% 95.5% 94.3% 96.4% 87.5% 96.0% 94.6% 100.0% 97.1% 98.1% 93.8% 80.0% 95.3% 100.0% 85.7% ** ** ** ** ** ** ** **
Don't know11 1 - 2 8 - 11 7 4 1 9 7 2 3 1 6 4 2 6 3
HEDIS/CAHPSSUMMARYRATE - No
156 25 27 31 72 7 148 50 106 7 144 122 4 34 103 45 8 121 28 695.7% 100.0% 93.1% 96.9% 94.7% 100.0% 95.5% 94.3% 96.4% 87.5% 96.0% 94.6% 100.0% 97.1% 98.1% 93.8% 80.0% 95.3% 100.0% 85.7%
Cell Contents: - Count- Column Percentage- Statistical Test ResultsStatistics: Overlap formulae used- Column Proportions: Columns Tested (5%): A/B/C/D, E/F, G/H, I/J,K/L/M, N/O/P, Q/R/S, (10%): a/b/c/d, e/f, g/h, i/j,k/l/m, n/o/p, q/r/s Minimum Base: 30 (**), Small Base: 30 (*)
Presented by SPH Analytics770-978-3173
2016

Q52. Has a doctor or health provider ever discussedwith you the risks and benefits of aspirin to preventheart attack or stroke? (All respondents)
Regence BCBS2016 CAHPS 5.0H Commercial Adult Survey (1113020)
Table: 53Level: Top
AGE (Q59) EDUCATION(Q61)
GENDER(Q60)
ETHNICITY(Q62) RACE (Q63) HEALTH STATUS
(Q43)MENTAL HEALTH
(Q44)
Total 18 to34
35 to44
45 to54
55 orolder
HS/GED/Less
SomeColg/Grad+
Male Female Hispanicor Latino
NotHispanicor Latino
WhiteBlack orAfrican-
AmericanOther Excellent/
Very good Good Fair/Poor
Excellent/Very good Good Fair/
Poor
A B C D E F G H I J K L M N O P Q R S
Q52. Has a doctor or health provider ever discussed with you the risks and benefits of aspirin to prevent heart attack or stroke? (Allrespondents)
Total Eligible176 26 29 34 86 7 168 60 116 9 160 137 6 39 107 55 14 129 35 10
100.0% 100.0% 100.0% 100.0% 100.0% 100.0% 100.0% 100.0% 100.0% 100.0% 100.0% 100.0% 100.0% 100.0% 100.0% 100.0% 100.0% 100.0% 100.0% 100.0%
Total ValidResponses
176 26 29 34 86 7 168 60 116 9 160 137 6 39 107 55 14 129 35 10100.0% 100.0% 100.0% 100.0% 100.0% 100.0% 100.0% 100.0% 100.0% 100.0% 100.0% 100.0% 100.0% 100.0% 100.0% 100.0% 100.0% 100.0% 100.0% 100.0%
No Answer- - - - - - - - - - - - - - - - - - - -
Yes51 - 3 7 41 3 48 24 27 3 45 42 2 9 30 10 11 39 7 4
29.0% - 10.3% 20.6% 47.7% 42.9% 28.6% 40.0% 23.3% 33.3% 28.1% 30.7% 33.3% 23.1% 28.0% 18.2% 78.6% 30.2% 20.0% 40.0% ** ** C ** H ** ** ** **
No125 26 26 27 45 4 120 36 89 6 115 95 4 30 77 45 3 90 28 6
71.0% 100.0% 89.7% 79.4% 52.3% 57.1% 71.4% 60.0% 76.7% 66.7% 71.9% 69.3% 66.7% 76.9% 72.0% 81.8% 21.4% 69.8% 80.0% 60.0% ** ** D ** G ** ** ** **
HEDIS/CAHPSSUMMARYRATE - Yes
51 - 3 7 41 3 48 24 27 3 45 42 2 9 30 10 11 39 7 429.0% - 10.3% 20.6% 47.7% 42.9% 28.6% 40.0% 23.3% 33.3% 28.1% 30.7% 33.3% 23.1% 28.0% 18.2% 78.6% 30.2% 20.0% 40.0%
** ** C ** H ** ** ** **
Cell Contents: - Count- Column Percentage- Statistical Test ResultsStatistics: Overlap formulae used- Column Proportions: Columns Tested (5%): A/B/C/D, E/F, G/H, I/J,K/L/M, N/O/P, Q/R/S, (10%): a/b/c/d, e/f, g/h, i/j,k/l/m, n/o/p, q/r/s Minimum Base: 30 (**), Small Base: 30 (*)
Presented by SPH Analytics770-978-3173
2016

HEDIS Measure: Aspirin Risks and Benefits Regence BCBS2016 CAHPS 5.0H Commercial Adult Survey (1113020)
Table: 54Level: Top
AGE (Q59) EDUCATION(Q61)
GENDER(Q60)
ETHNICITY(Q62) RACE (Q63) HEALTH STATUS
(Q43)MENTAL HEALTH
(Q44)
Total 18 to34
35 to44
45 to54
55 orolder
HS/GED/Less
SomeColg/Grad+
Male Female Hispanicor Latino
NotHispanicor Latino
WhiteBlack orAfrican-
AmericanOther Excellent/
Very good Good Fair/Poor
Excellent/Very good Good Fair/
Poor
A B C D E F G H I J K L M N O P Q R S
HEDIS Measure: Aspirin Risks and Benefits
TotalEligible
176 26 29 34 86 7 168 60 116 9 160 137 6 39 107 55 14 129 35 10100.0% 100.0% 100.0% 100.0% 100.0% 100.0% 100.0% 100.0% 100.0% 100.0% 100.0% 100.0% 100.0% 100.0% 100.0% 100.0% 100.0% 100.0% 100.0% 100.0%
Total ValidResponses
79 - - 8 70 4 75 33 46 6 69 64 2 14 52 23 4 61 13 5100.0% - - 100.0% 100.0% 100.0% 100.0% 100.0% 100.0% 100.0% 100.0% 100.0% 100.0% 100.0% 100.0% 100.0% 100.0% 100.0% 100.0% 100.0%
No Answer97 26 29 26 16 3 93 27 70 3 91 73 4 25 55 32 10 68 22 5
CurrentYearSummaryRate
33 - - 4 29 3 30 17 16 2 29 26 1 7 23 7 3 25 5 341.8% - - 50.0% 41.4% 75.0% 40.0% 51.5% 34.8% 33.3% 42.0% 40.6% 50.0% 50.0% 44.2% 30.4% 75.0% 41.0% 38.5% 60.0%
** ** ** ** ** ** ** ** **
CurrentYearBottom BoxRate
46 - - 4 41 1 45 16 30 4 40 38 1 7 29 16 1 36 8 258.2% - - 50.0% 58.6% 25.0% 60.0% 48.5% 65.2% 66.7% 58.0% 59.4% 50.0% 50.0% 55.8% 69.6% 25.0% 59.0% 61.5% 40.0%
** ** ** ** ** ** ** ** **
Cell Contents: - Count- Column Percentage- Statistical Test ResultsStatistics: Overlap formulae used- Column Proportions: Columns Tested (5%): A/B/C/D, E/F, G/H, I/J,K/L/M, N/O/P, Q/R/S, (10%): a/b/c/d, e/f, g/h, i/j,k/l/m, n/o/p, q/r/s Minimum Base: 30 (**), Small Base: 30 (*)
Presented by SPH Analytics770-978-3173
2016

Q53. Are you aware that you have any of thefollowing conditions? Check all that apply.
Regence BCBS2016 CAHPS 5.0H Commercial Adult Survey (1113020)
Table: 55Level: Top
AGE (Q59) EDUCATION(Q61)
GENDER(Q60)
ETHNICITY(Q62) RACE (Q63) HEALTH STATUS
(Q43)MENTAL HEALTH
(Q44)
Total 18 to34
35 to44
45 to54
55 orolder
HS/GED/Less
SomeColg/Grad+
Male Female Hispanicor Latino
NotHispanicor Latino
WhiteBlack orAfrican-
AmericanOther Excellent/
Very good Good Fair/Poor
Excellent/Very good Good Fair/
Poor
A B C D E F G H I J K L M N O P Q R S
Q53. Are you aware that you have any of the following conditions? Check all that apply.
Total Eligible176 26 29 34 86 7 168 60 116 9 160 137 6 39 107 55 14 129 35 10
100.0% 100.0% 100.0% 100.0% 100.0% 100.0% 100.0% 100.0% 100.0% 100.0% 100.0% 100.0% 100.0% 100.0% 100.0% 100.0% 100.0% 100.0% 100.0% 100.0%
Total ValidResponses
109 5 8 12 84 7 102 39 70 6 96 85 6 21 53 34 22 72 25 9
TotalRespondents
82 5 8 10 59 4 78 32 50 5 72 65 4 14 44 27 11 56 18 6100.0% 100.0% 100.0% 100.0% 100.0% 100.0% 100.0% 100.0% 100.0% 100.0% 100.0% 100.0% 100.0% 100.0% 100.0% 100.0% 100.0% 100.0% 100.0% 100.0%
Highcholesterol
38 1 2 5 30 3 35 11 27 2 33 29 1 9 19 12 7 25 11 146.3% 20.0% 25.0% 50.0% 50.8% 75.0% 44.9% 34.4% 54.0% 40.0% 45.8% 44.6% 25.0% 64.3% 43.2% 44.4% 63.6% 44.6% 61.1% 16.7%
** ** ** ** g ** ** ** ** ** ** **
High bloodpressure
43 1 4 4 34 4 39 22 21 2 39 36 3 4 21 12 10 29 8 552.4% 20.0% 50.0% 40.0% 57.6% 100.0% 50.0% 68.8% 42.0% 40.0% 54.2% 55.4% 75.0% 28.6% 47.7% 44.4% 90.9% 51.8% 44.4% 83.3%
** ** ** ** H ** ** ** ** ** ** **Parent orsibling withheart attackbefore theage of 60
28 3 2 3 20 - 28 6 22 2 24 20 2 8 13 10 5 18 6 334.1% 60.0% 25.0% 30.0% 33.9% - 35.9% 18.8% 44.0% 40.0% 33.3% 30.8% 50.0% 57.1% 29.5% 37.0% 45.5% 32.1% 33.3% 50.0%
** ** ** ** G ** ** ** ** ** ** **
Cell Contents: - Count- Column Percentage- Statistical Test ResultsStatistics: Overlap formulae used- Column Proportions: Columns Tested (5%): A/B/C/D, E/F, G/H, I/J,K/L/M, N/O/P, Q/R/S, (10%): a/b/c/d, e/f, g/h, i/j,k/l/m, n/o/p, q/r/s Minimum Base: 30 (**), Small Base: 30 (*)
Presented by SPH Analytics770-978-3173
2016

Q54. Has a doctor ever told you that you have any ofthe following conditions? Check all that apply.
Regence BCBS2016 CAHPS 5.0H Commercial Adult Survey (1113020)
Table: 56Level: Top
AGE (Q59) EDUCATION(Q61)
GENDER(Q60)
ETHNICITY(Q62) RACE (Q63) HEALTH STATUS
(Q43)MENTAL HEALTH
(Q44)
Total 18 to34
35 to44
45 to54
55 orolder
HS/GED/Less
SomeColg/Grad+
Male Female Hispanicor Latino
NotHispanicor Latino
WhiteBlack orAfrican-
AmericanOther Excellent/
Very good Good Fair/Poor
Excellent/Very good Good Fair/
Poor
A B C D E F G H I J K L M N O P Q R S
Q54. Has a doctor ever told you that you have any of the following conditions? Check all that apply.
Total Eligible176 26 29 34 86 7 168 60 116 9 160 137 6 39 107 55 14 129 35 10
100.0% 100.0% 100.0% 100.0% 100.0% 100.0% 100.0% 100.0% 100.0% 100.0% 100.0% 100.0% 100.0% 100.0% 100.0% 100.0% 100.0% 100.0% 100.0% 100.0%
Total ValidResponses
22 - 2 4 16 - 22 8 14 - 20 16 3 4 8 6 8 13 5 2
TotalRespondents
21 - 2 4 15 - 21 8 13 - 20 15 3 4 7 6 8 13 5 2100.0% - 100.0% 100.0% 100.0% - 100.0% 100.0% 100.0% - 100.0% 100.0% 100.0% 100.0% 100.0% 100.0% 100.0% 100.0% 100.0% 100.0%
A heart attack- - - - - - - - - - - - - - - - - - - -- - - - - - - - - - - - - - - - - - - - ** ** ** ** ** ** ** ** ** ** ** ** ** **
Angina orcoronaryheartdisease
2 - - - 2 - 2 1 1 - 2 2 - - 2 - - 2 - -9.5% - - - 13.3% - 9.5% 12.5% 7.7% - 10.0% 13.3% - - 28.6% - - 15.4% - -
** ** ** ** ** ** ** ** ** ** ** ** ** **
A stroke4 - - 1 3 - 4 1 3 - 3 2 - 1 2 1 1 2 1 -
19.0% - - 25.0% 20.0% - 19.0% 12.5% 23.1% - 15.0% 13.3% - 25.0% 28.6% 16.7% 12.5% 15.4% 20.0% - ** ** ** ** ** ** ** ** ** ** ** ** ** **
Any kind ofdiabetes orhigh bloodsugar
16 - 2 3 11 - 16 6 10 - 15 12 3 3 4 5 7 9 4 276.2% - 100.0% 75.0% 73.3% - 76.2% 75.0% 76.9% - 75.0% 80.0% 100.0% 75.0% 57.1% 83.3% 87.5% 69.2% 80.0% 100.0%
** ** ** ** ** ** ** ** ** ** ** ** ** **
Cell Contents: - Count- Column Percentage- Statistical Test ResultsStatistics: Overlap formulae used- Column Proportions: Columns Tested (5%): A/B/C/D, E/F, G/H, I/J,K/L/M, N/O/P, Q/R/S, (10%): a/b/c/d, e/f, g/h, i/j,k/l/m, n/o/p, q/r/s Minimum Base: 30 (**), Small Base: 30 (*)
Presented by SPH Analytics770-978-3173
2016

Q55. In the last 12 months, have you seen a doctoror other health provider 3 or more times for the samecondition or problem?
Regence BCBS2016 CAHPS 5.0H Commercial Adult Survey (1113020)
Table: 57Level: Top
AGE (Q59) EDUCATION(Q61)
GENDER(Q60)
ETHNICITY(Q62) RACE (Q63) HEALTH STATUS
(Q43)MENTAL HEALTH
(Q44)
Total 18 to34
35 to44
45 to54
55 orolder
HS/GED/Less
SomeColg/Grad+
Male Female Hispanicor Latino
NotHispanicor Latino
WhiteBlack orAfrican-
AmericanOther Excellent/
Very good Good Fair/Poor
Excellent/Very good Good Fair/
Poor
A B C D E F G H I J K L M N O P Q R S
Q55. In the last 12 months, have you seen a doctor or other health provider 3 or more times for the same condition or problem?
Total Eligible176 26 29 34 86 7 168 60 116 9 160 137 6 39 107 55 14 129 35 10
100.0% 100.0% 100.0% 100.0% 100.0% 100.0% 100.0% 100.0% 100.0% 100.0% 100.0% 100.0% 100.0% 100.0% 100.0% 100.0% 100.0% 100.0% 100.0% 100.0%
Total ValidResponses
176 26 29 34 86 7 168 60 116 9 160 137 6 39 107 55 14 129 35 10100.0% 100.0% 100.0% 100.0% 100.0% 100.0% 100.0% 100.0% 100.0% 100.0% 100.0% 100.0% 100.0% 100.0% 100.0% 100.0% 100.0% 100.0% 100.0% 100.0%
No Answer- - - - - - - - - - - - - - - - - - - -
Yes60 10 8 12 30 2 58 18 42 5 52 47 2 12 29 21 10 40 15 4
34.1% 38.5% 27.6% 35.3% 34.9% 28.6% 34.5% 30.0% 36.2% 55.6% 32.5% 34.3% 33.3% 30.8% 27.1% 38.2% 71.4% 31.0% 42.9% 40.0% ** ** ** ** ** ** **
No116 16 21 22 56 5 110 42 74 4 108 90 4 27 78 34 4 89 20 6
65.9% 61.5% 72.4% 64.7% 65.1% 71.4% 65.5% 70.0% 63.8% 44.4% 67.5% 65.7% 66.7% 69.2% 72.9% 61.8% 28.6% 69.0% 57.1% 60.0% ** ** ** ** ** ** **
HEDIS/CAHPSSUMMARYRATE - Yes
60 10 8 12 30 2 58 18 42 5 52 47 2 12 29 21 10 40 15 434.1% 38.5% 27.6% 35.3% 34.9% 28.6% 34.5% 30.0% 36.2% 55.6% 32.5% 34.3% 33.3% 30.8% 27.1% 38.2% 71.4% 31.0% 42.9% 40.0%
** ** ** ** ** ** **
Cell Contents: - Count- Column Percentage- Statistical Test ResultsStatistics: Overlap formulae used- Column Proportions: Columns Tested (5%): A/B/C/D, E/F, G/H, I/J,K/L/M, N/O/P, Q/R/S, (10%): a/b/c/d, e/f, g/h, i/j,k/l/m, n/o/p, q/r/s Minimum Base: 30 (**), Small Base: 30 (*)
Presented by SPH Analytics770-978-3173
2016
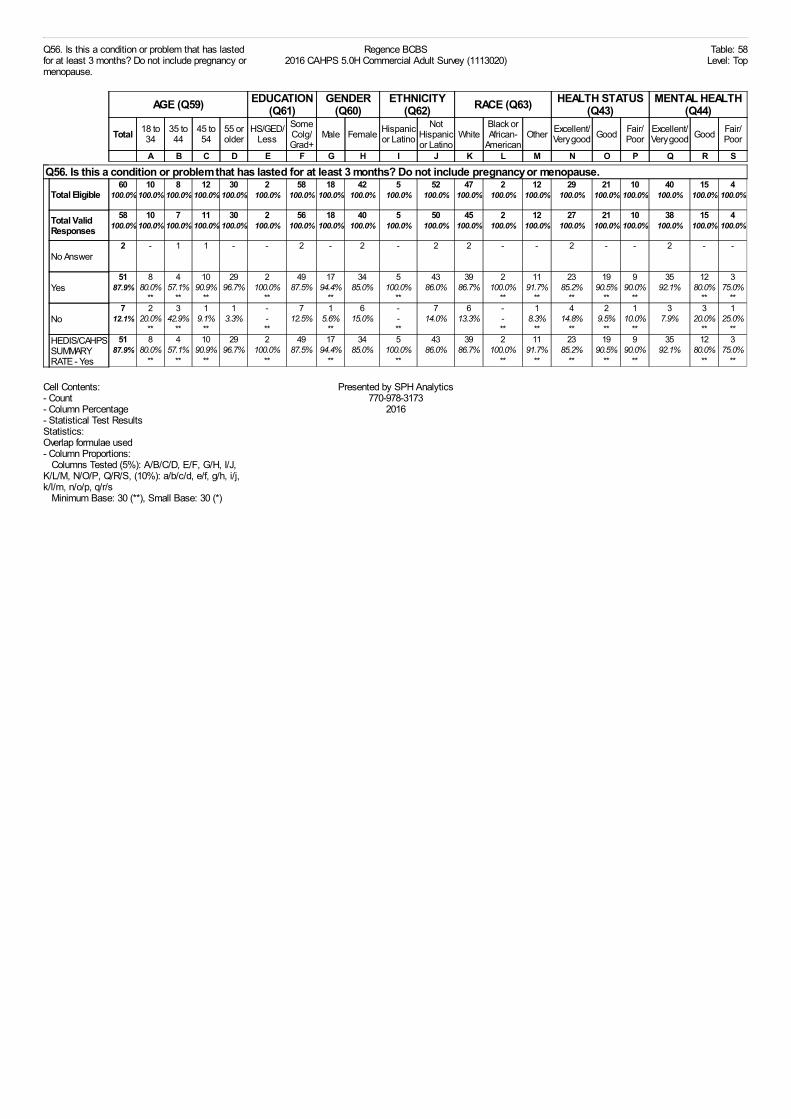
Q56. Is this a condition or problem that has lastedfor at least 3 months? Do not include pregnancy ormenopause.
Regence BCBS2016 CAHPS 5.0H Commercial Adult Survey (1113020)
Table: 58Level: Top
AGE (Q59) EDUCATION(Q61)
GENDER(Q60)
ETHNICITY(Q62) RACE (Q63) HEALTH STATUS
(Q43)MENTAL HEALTH
(Q44)
Total 18 to34
35 to44
45 to54
55 orolder
HS/GED/Less
SomeColg/Grad+
Male Female Hispanicor Latino
NotHispanicor Latino
WhiteBlack orAfrican-
AmericanOther Excellent/
Very good Good Fair/Poor
Excellent/Very good Good Fair/
Poor
A B C D E F G H I J K L M N O P Q R S
Q56. Is this a condition or problem that has lasted for at least 3 months? Do not include pregnancy or menopause.
Total Eligible60 10 8 12 30 2 58 18 42 5 52 47 2 12 29 21 10 40 15 4
100.0% 100.0% 100.0% 100.0% 100.0% 100.0% 100.0% 100.0% 100.0% 100.0% 100.0% 100.0% 100.0% 100.0% 100.0% 100.0% 100.0% 100.0% 100.0% 100.0%
Total ValidResponses
58 10 7 11 30 2 56 18 40 5 50 45 2 12 27 21 10 38 15 4100.0% 100.0% 100.0% 100.0% 100.0% 100.0% 100.0% 100.0% 100.0% 100.0% 100.0% 100.0% 100.0% 100.0% 100.0% 100.0% 100.0% 100.0% 100.0% 100.0%
No Answer2 - 1 1 - - 2 - 2 - 2 2 - - 2 - - 2 - -
Yes51 8 4 10 29 2 49 17 34 5 43 39 2 11 23 19 9 35 12 3
87.9% 80.0% 57.1% 90.9% 96.7% 100.0% 87.5% 94.4% 85.0% 100.0% 86.0% 86.7% 100.0% 91.7% 85.2% 90.5% 90.0% 92.1% 80.0% 75.0% ** ** ** ** ** ** ** ** ** ** ** ** **
No7 2 3 1 1 - 7 1 6 - 7 6 - 1 4 2 1 3 3 1
12.1% 20.0% 42.9% 9.1% 3.3% - 12.5% 5.6% 15.0% - 14.0% 13.3% - 8.3% 14.8% 9.5% 10.0% 7.9% 20.0% 25.0% ** ** ** ** ** ** ** ** ** ** ** ** **
HEDIS/CAHPSSUMMARYRATE - Yes
51 8 4 10 29 2 49 17 34 5 43 39 2 11 23 19 9 35 12 387.9% 80.0% 57.1% 90.9% 96.7% 100.0% 87.5% 94.4% 85.0% 100.0% 86.0% 86.7% 100.0% 91.7% 85.2% 90.5% 90.0% 92.1% 80.0% 75.0%
** ** ** ** ** ** ** ** ** ** ** ** **
Cell Contents: - Count- Column Percentage- Statistical Test ResultsStatistics: Overlap formulae used- Column Proportions: Columns Tested (5%): A/B/C/D, E/F, G/H, I/J,K/L/M, N/O/P, Q/R/S, (10%): a/b/c/d, e/f, g/h, i/j,k/l/m, n/o/p, q/r/s Minimum Base: 30 (**), Small Base: 30 (*)
Presented by SPH Analytics770-978-3173
2016

Q57. Do you now need or take medicine prescribedby a doctor? Do not include birth control.
Regence BCBS2016 CAHPS 5.0H Commercial Adult Survey (1113020)
Table: 59Level: Top
AGE (Q59) EDUCATION(Q61)
GENDER(Q60)
ETHNICITY(Q62) RACE (Q63) HEALTH STATUS
(Q43)MENTAL HEALTH
(Q44)
Total 18 to34
35 to44
45 to54
55 orolder
HS/GED/Less
SomeColg/Grad+
Male Female Hispanicor Latino
NotHispanicor Latino
WhiteBlack orAfrican-
AmericanOther Excellent/
Very good Good Fair/Poor
Excellent/Very good Good Fair/
Poor
A B C D E F G H I J K L M N O P Q R S
Q57. Do you now need or take medicine prescribed by a doctor? Do not include birth control.
Total Eligible176 26 29 34 86 7 168 60 116 9 160 137 6 39 107 55 14 129 35 10
100.0% 100.0% 100.0% 100.0% 100.0% 100.0% 100.0% 100.0% 100.0% 100.0% 100.0% 100.0% 100.0% 100.0% 100.0% 100.0% 100.0% 100.0% 100.0% 100.0%
Total ValidResponses
173 25 28 34 85 7 165 60 113 9 157 135 6 38 107 52 14 129 33 10100.0% 100.0% 100.0% 100.0% 100.0% 100.0% 100.0% 100.0% 100.0% 100.0% 100.0% 100.0% 100.0% 100.0% 100.0% 100.0% 100.0% 100.0% 100.0% 100.0%
No Answer3 1 1 - 1 - 3 - 3 - 3 2 - 1 - 3 - - 2 -
Yes110 13 11 21 65 5 105 40 70 6 100 93 5 17 58 39 13 78 23 8
63.6% 52.0% 39.3% 61.8% 76.5% 71.4% 63.6% 66.7% 61.9% 66.7% 63.7% 68.9% 83.3% 44.7% 54.2% 75.0% 92.9% 60.5% 69.7% 80.0% ** ** ** ** M ** N ** **
No63 12 17 13 20 2 60 20 43 3 57 42 1 21 49 13 1 51 10 2
36.4% 48.0% 60.7% 38.2% 23.5% 28.6% 36.4% 33.3% 38.1% 33.3% 36.3% 31.1% 16.7% 55.3% 45.8% 25.0% 7.1% 39.5% 30.3% 20.0% ** ** ** ** ** K O ** **
HEDIS/CAHPSSUMMARYRATE - Yes
110 13 11 21 65 5 105 40 70 6 100 93 5 17 58 39 13 78 23 863.6% 52.0% 39.3% 61.8% 76.5% 71.4% 63.6% 66.7% 61.9% 66.7% 63.7% 68.9% 83.3% 44.7% 54.2% 75.0% 92.9% 60.5% 69.7% 80.0%
** ** ** ** M ** N ** **
Cell Contents: - Count- Column Percentage- Statistical Test ResultsStatistics: Overlap formulae used- Column Proportions: Columns Tested (5%): A/B/C/D, E/F, G/H, I/J,K/L/M, N/O/P, Q/R/S, (10%): a/b/c/d, e/f, g/h, i/j,k/l/m, n/o/p, q/r/s Minimum Base: 30 (**), Small Base: 30 (*)
Presented by SPH Analytics770-978-3173
2016

Q58. Is this to treat a condition that has lasted for atleast 3 months? Do not include pregnancy ormenopause.
Regence BCBS2016 CAHPS 5.0H Commercial Adult Survey (1113020)
Table: 60Level: Top
AGE (Q59) EDUCATION(Q61)
GENDER(Q60)
ETHNICITY(Q62) RACE (Q63) HEALTH STATUS
(Q43)MENTAL HEALTH
(Q44)
Total 18 to34
35 to44
45 to54
55 orolder
HS/GED/Less
SomeColg/Grad+
Male Female Hispanicor Latino
NotHispanicor Latino
WhiteBlack orAfrican-
AmericanOther Excellent/
Very good Good Fair/Poor
Excellent/Very good Good Fair/
Poor
A B C D E F G H I J K L M N O P Q R S
Q58. Is this to treat a condition that has lasted for at least 3 months? Do not include pregnancy or menopause.
Total Eligible110 13 11 21 65 5 105 40 70 6 100 93 5 17 58 39 13 78 23 8
100.0% 100.0% 100.0% 100.0% 100.0% 100.0% 100.0% 100.0% 100.0% 100.0% 100.0% 100.0% 100.0% 100.0% 100.0% 100.0% 100.0% 100.0% 100.0% 100.0%
Total ValidResponses
110 13 11 21 65 5 105 40 70 6 100 93 5 17 58 39 13 78 23 8100.0% 100.0% 100.0% 100.0% 100.0% 100.0% 100.0% 100.0% 100.0% 100.0% 100.0% 100.0% 100.0% 100.0% 100.0% 100.0% 100.0% 100.0% 100.0% 100.0%
No Answer- - - - - - - - - - - - - - - - - - - -
Yes103 13 8 18 64 5 98 37 66 4 95 87 5 16 54 37 12 74 21 7
93.6% 100.0% 72.7% 85.7% 98.5% 100.0% 93.3% 92.5% 94.3% 66.7% 95.0% 93.5% 100.0% 94.1% 93.1% 94.9% 92.3% 94.9% 91.3% 87.5% ** ** ** ** ** ** ** ** ** **
No7 - 3 3 1 - 7 3 4 2 5 6 - 1 4 2 1 4 2 1
6.4% - 27.3% 14.3% 1.5% - 6.7% 7.5% 5.7% 33.3% 5.0% 6.5% - 5.9% 6.9% 5.1% 7.7% 5.1% 8.7% 12.5% ** ** ** ** ** ** ** ** ** **
HEDIS/CAHPSSUMMARYRATE - Yes
103 13 8 18 64 5 98 37 66 4 95 87 5 16 54 37 12 74 21 793.6% 100.0% 72.7% 85.7% 98.5% 100.0% 93.3% 92.5% 94.3% 66.7% 95.0% 93.5% 100.0% 94.1% 93.1% 94.9% 92.3% 94.9% 91.3% 87.5%
** ** ** ** ** ** ** ** ** **
Cell Contents: - Count- Column Percentage- Statistical Test ResultsStatistics: Overlap formulae used- Column Proportions: Columns Tested (5%): A/B/C/D, E/F, G/H, I/J,K/L/M, N/O/P, Q/R/S, (10%): a/b/c/d, e/f, g/h, i/j,k/l/m, n/o/p, q/r/s Minimum Base: 30 (**), Small Base: 30 (*)
Presented by SPH Analytics770-978-3173
2016

Q59. What is your age? Regence BCBS2016 CAHPS 5.0H Commercial Adult Survey (1113020)
Table: 61Level: Top
AGE (Q59) EDUCATION(Q61)
GENDER(Q60)
ETHNICITY(Q62) RACE (Q63) HEALTH STATUS
(Q43)MENTAL HEALTH
(Q44)
Total 18 to34
35 to44
45 to54
55 orolder
HS/GED/Less
SomeColg/Grad+
Male Female Hispanicor Latino
NotHispanicor Latino
WhiteBlack orAfrican-
AmericanOther Excellent/
Very good Good Fair/Poor
Excellent/Very good Good Fair/
Poor
A B C D E F G H I J K L M N O P Q R S
Q59. What is your age?
TotalEligible
176 26 29 34 86 7 168 60 116 9 160 137 6 39 107 55 14 129 35 10100.0% 100.0% 100.0% 100.0% 100.0% 100.0% 100.0% 100.0% 100.0% 100.0% 100.0% 100.0% 100.0% 100.0% 100.0% 100.0% 100.0% 100.0% 100.0% 100.0%
Total ValidResponses
175 26 29 34 86 7 167 59 116 9 160 137 6 39 106 55 14 128 35 10100.0% 100.0% 100.0% 100.0% 100.0% 100.0% 100.0% 100.0% 100.0% 100.0% 100.0% 100.0% 100.0% 100.0% 100.0% 100.0% 100.0% 100.0% 100.0% 100.0%
No Answer1 - - - - - 1 1 - - - - - - 1 - - 1 - -
18 to 242 2 - - - 1 1 1 1 - 2 1 - 1 2 - - 2 - -
1.1% 7.7% - - - 14.3% 0.6% 1.7% 0.9% - 1.3% 0.7% - 2.6% 1.9% - - 1.6% - - ** ** ** ** ** ** **
25 to 3424 24 - - - 1 22 9 15 1 22 19 - 5 17 6 1 18 5 1
13.7% 92.3% - - - 14.3% 13.2% 15.3% 12.9% 11.1% 13.8% 13.9% - 12.8% 16.0% 10.9% 7.1% 14.1% 14.3% 10.0% ** ** ** ** ** ** **
35 to 4429 - 29 - - 1 28 8 21 2 26 24 2 6 18 10 1 19 6 3
16.6% - 100.0% - - 14.3% 16.8% 13.6% 18.1% 22.2% 16.3% 17.5% 33.3% 15.4% 17.0% 18.2% 7.1% 14.8% 17.1% 30.0% ** ** ** ** ** ** **
45 to 5434 - - 34 - 1 33 11 23 1 33 22 1 13 18 15 1 26 7 1
19.4% - - 100.0% - 14.3% 19.8% 18.6% 19.8% 11.1% 20.6% 16.1% 16.7% 33.3% 17.0% 27.3% 7.1% 20.3% 20.0% 10.0% ** ** D ** ** ** K ** **
55 to 6466 - - - 66 2 64 22 44 5 59 56 3 10 39 19 8 48 13 4
37.7% - - - 76.7% 28.6% 38.3% 37.3% 37.9% 55.6% 36.9% 40.9% 50.0% 25.6% 36.8% 34.5% 57.1% 37.5% 37.1% 40.0% ** ** C ** ** m ** ** **
65 to 7419 - - - 19 1 18 7 12 - 17 14 - 4 11 5 3 14 4 1
10.9% - - - 22.1% 14.3% 10.8% 11.9% 10.3% - 10.6% 10.2% - 10.3% 10.4% 9.1% 21.4% 10.9% 11.4% 10.0% ** ** C ** ** ** ** **
75 or older1 - - - 1 - 1 1 - - 1 1 - - 1 - - 1 - -
0.6% - - - 1.2% - 0.6% 1.7% - - 0.6% 0.7% - - 0.9% - - 0.8% - - ** ** ** ** ** ** **
SPHASUMMARYRATE -Members18 to 34
26 26 - - - 2 23 10 16 1 24 20 - 6 19 6 1 20 5 114.9% 100.0% - - - 28.6% 13.8% 16.9% 13.8% 11.1% 15.0% 14.6% - 15.4% 17.9% 10.9% 7.1% 15.6% 14.3% 10.0%
** ** ** ** ** ** **
SPHASUMMARYRATE -Members35 to 44
29 - 29 - - 1 28 8 21 2 26 24 2 6 18 10 1 19 6 316.6% - 100.0% - - 14.3% 16.8% 13.6% 18.1% 22.2% 16.3% 17.5% 33.3% 15.4% 17.0% 18.2% 7.1% 14.8% 17.1% 30.0%
SPHASUMMARYRATE -Members45 to 54
34 - - 34 - 1 33 11 23 1 33 22 1 13 18 15 1 26 7 119.4% - - 100.0% - 14.3% 19.8% 18.6% 19.8% 11.1% 20.6% 16.1% 16.7% 33.3% 17.0% 27.3% 7.1% 20.3% 20.0% 10.0%
SPHASUMMARYRATE -Members55 or older
86 - - - 86 3 83 30 56 5 77 71 3 14 51 24 11 63 17 549.1% - - - 100.0% 42.9% 49.7% 50.8% 48.3% 55.6% 48.1% 51.8% 50.0% 35.9% 48.1% 43.6% 78.6% 49.2% 48.6% 50.0%
** ** C ** ** m ** ** **
Cell Contents: - Count- Column Percentage- Statistical Test ResultsStatistics: Overlap formulae used- Column Proportions: Columns Tested (5%): A/B/C/D, E/F, G/H, I/J,K/L/M, N/O/P, Q/R/S, (10%): a/b/c/d, e/f, g/h, i/j,k/l/m, n/o/p, q/r/s Minimum Base: 30 (**), Small Base: 30 (*)
Presented by SPH Analytics770-978-3173
2016
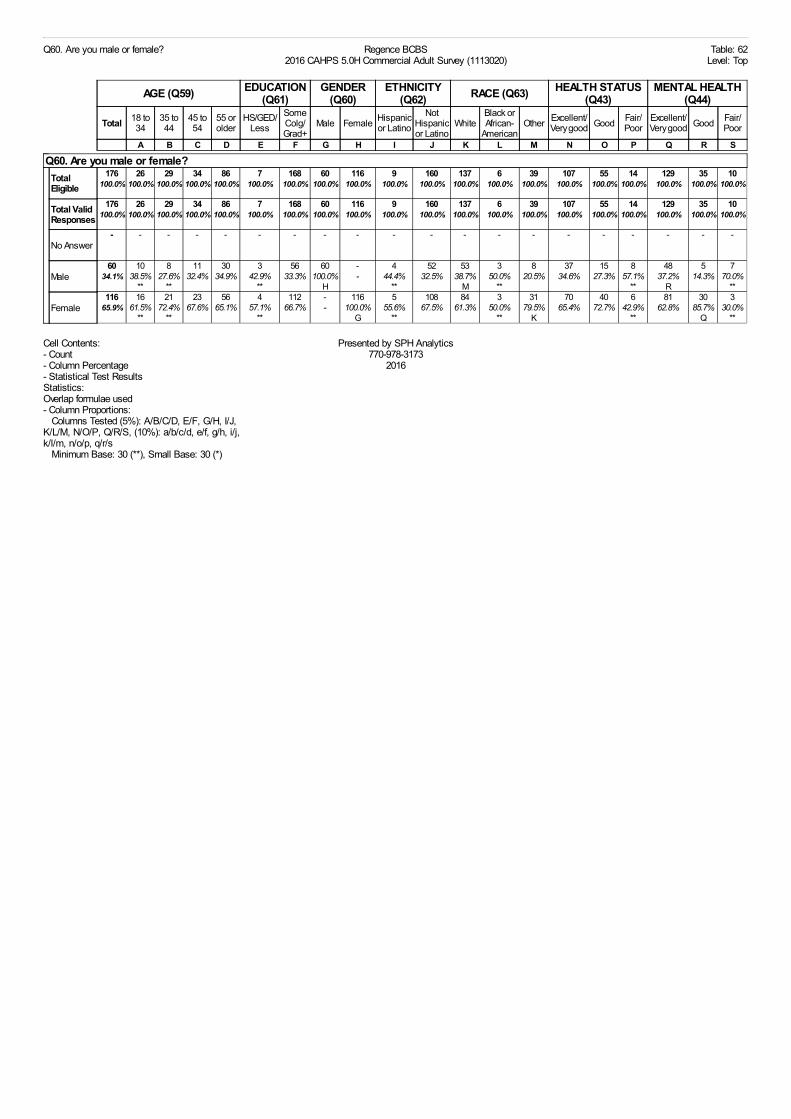
Q60. Are you male or female? Regence BCBS2016 CAHPS 5.0H Commercial Adult Survey (1113020)
Table: 62Level: Top
AGE (Q59) EDUCATION(Q61)
GENDER(Q60)
ETHNICITY(Q62) RACE (Q63) HEALTH STATUS
(Q43)MENTAL HEALTH
(Q44)
Total 18 to34
35 to44
45 to54
55 orolder
HS/GED/Less
SomeColg/Grad+
Male Female Hispanicor Latino
NotHispanicor Latino
WhiteBlack orAfrican-
AmericanOther Excellent/
Very good Good Fair/Poor
Excellent/Very good Good Fair/
Poor
A B C D E F G H I J K L M N O P Q R S
Q60. Are you male or female?
TotalEligible
176 26 29 34 86 7 168 60 116 9 160 137 6 39 107 55 14 129 35 10100.0% 100.0% 100.0% 100.0% 100.0% 100.0% 100.0% 100.0% 100.0% 100.0% 100.0% 100.0% 100.0% 100.0% 100.0% 100.0% 100.0% 100.0% 100.0% 100.0%
Total ValidResponses
176 26 29 34 86 7 168 60 116 9 160 137 6 39 107 55 14 129 35 10100.0% 100.0% 100.0% 100.0% 100.0% 100.0% 100.0% 100.0% 100.0% 100.0% 100.0% 100.0% 100.0% 100.0% 100.0% 100.0% 100.0% 100.0% 100.0% 100.0%
No Answer- - - - - - - - - - - - - - - - - - - -
Male60 10 8 11 30 3 56 60 - 4 52 53 3 8 37 15 8 48 5 7
34.1% 38.5% 27.6% 32.4% 34.9% 42.9% 33.3% 100.0% - 44.4% 32.5% 38.7% 50.0% 20.5% 34.6% 27.3% 57.1% 37.2% 14.3% 70.0% ** ** ** H ** M ** ** R **
Female116 16 21 23 56 4 112 - 116 5 108 84 3 31 70 40 6 81 30 3
65.9% 61.5% 72.4% 67.6% 65.1% 57.1% 66.7% - 100.0% 55.6% 67.5% 61.3% 50.0% 79.5% 65.4% 72.7% 42.9% 62.8% 85.7% 30.0% ** ** ** G ** ** K ** Q **
Cell Contents: - Count- Column Percentage- Statistical Test ResultsStatistics: Overlap formulae used- Column Proportions: Columns Tested (5%): A/B/C/D, E/F, G/H, I/J,K/L/M, N/O/P, Q/R/S, (10%): a/b/c/d, e/f, g/h, i/j,k/l/m, n/o/p, q/r/s Minimum Base: 30 (**), Small Base: 30 (*)
Presented by SPH Analytics770-978-3173
2016

Q61. What is the highest grade or level of schoolthat you have completed?
Regence BCBS2016 CAHPS 5.0H Commercial Adult Survey (1113020)
Table: 63Level: Top
AGE (Q59) EDUCATION(Q61)
GENDER(Q60)
ETHNICITY(Q62) RACE (Q63) HEALTH STATUS
(Q43)MENTAL HEALTH
(Q44)
Total 18 to34
35 to44
45 to54
55 orolder
HS/GED/Less
SomeColg/Grad+
Male Female Hispanicor Latino
NotHispanicor Latino
WhiteBlack orAfrican-
AmericanOther Excellent/
Very good Good Fair/Poor
Excellent/Very good Good Fair/
Poor
A B C D E F G H I J K L M N O P Q R S
Q61. What is the highest grade or level of school that you have completed?
TotalEligible
176 26 29 34 86 7 168 60 116 9 160 137 6 39 107 55 14 129 35 10100.0% 100.0% 100.0% 100.0% 100.0% 100.0% 100.0% 100.0% 100.0% 100.0% 100.0% 100.0% 100.0% 100.0% 100.0% 100.0% 100.0% 100.0% 100.0% 100.0%
Total ValidResponses
175 25 29 34 86 7 168 59 116 8 160 137 6 38 106 55 14 128 35 10100.0% 100.0% 100.0% 100.0% 100.0% 100.0% 100.0% 100.0% 100.0% 100.0% 100.0% 100.0% 100.0% 100.0% 100.0% 100.0% 100.0% 100.0% 100.0% 100.0%
No Answer1 1 - - - - - 1 - 1 - - - 1 1 - - 1 - -
8th gradeor less
1 - - 1 - 1 - 1 - - 1 1 - - - 1 - 1 - -0.6% - - 2.9% - 14.3% - 1.7% - - 0.6% 0.7% - - - 1.8% - 0.8% - -
** ** ** ** ** ** **Some highschool, butdid notgraduate
1 - - - 1 1 - - 1 - 1 - - 1 - 1 - - 1 -0.6% - - - 1.2% 14.3% - - 0.9% - 0.6% - - 2.6% - 1.8% - - 2.9% -
** ** ** ** ** K ** q **
Highschoolgraduate orGED
5 2 1 - 2 5 - 2 3 - 5 4 - 1 4 1 - 4 1 -2.9% 8.0% 3.4% - 2.3% 71.4% - 3.4% 2.6% - 3.1% 2.9% - 2.6% 3.8% 1.8% - 3.1% 2.9% -
** ** ** ** ** ** **
Somecollege or2-yeardegree
40 4 3 8 25 - 40 13 27 2 36 31 4 11 16 18 6 24 11 422.9% 16.0% 10.3% 23.5% 29.1% - 23.8% 22.0% 23.3% 25.0% 22.5% 22.6% 66.7% 28.9% 15.1% 32.7% 42.9% 18.8% 31.4% 40.0%
** ** ** ** ** N ** **
4-yearcollegegraduate
55 7 11 12 25 - 55 14 41 2 51 41 1 13 37 15 3 41 12 131.4% 28.0% 37.9% 35.3% 29.1% - 32.7% 23.7% 35.3% 25.0% 31.9% 29.9% 16.7% 34.2% 34.9% 27.3% 21.4% 32.0% 34.3% 10.0%
** ** ** ** ** ** **More than4-yearcollegedegree
73 12 14 13 33 - 73 29 44 4 66 60 1 12 49 19 5 58 10 541.7% 48.0% 48.3% 38.2% 38.4% - 43.5% 49.2% 37.9% 50.0% 41.3% 43.8% 16.7% 31.6% 46.2% 34.5% 35.7% 45.3% 28.6% 50.0%
** ** ** ** ** ** r **
SPHASUMMARYRATE -Highschoolgraduate orless
7 2 1 1 3 7 - 3 4 - 7 5 - 2 4 3 - 5 2 -4.0% 8.0% 3.4% 2.9% 3.5% 100.0% - 5.1% 3.4% - 4.4% 3.6% - 5.3% 3.8% 5.5% - 3.9% 5.7% -
** ** ** ** ** ** **
SPHASUMMARYRATE -Somecollege
40 4 3 8 25 - 40 13 27 2 36 31 4 11 16 18 6 24 11 422.9% 16.0% 10.3% 23.5% 29.1% - 23.8% 22.0% 23.3% 25.0% 22.5% 22.6% 66.7% 28.9% 15.1% 32.7% 42.9% 18.8% 31.4% 40.0%
** ** ** ** ** N ** **
SPHASUMMARYRATE - 4 -yearcollegegraduate ormore
128 19 25 25 58 - 128 43 85 6 117 101 2 25 86 34 8 99 22 673.1% 76.0% 86.2% 73.5% 67.4% - 76.2% 72.9% 73.3% 75.0% 73.1% 73.7% 33.3% 65.8% 81.1% 61.8% 57.1% 77.3% 62.9% 60.0%
** ** ** ** ** O ** r **
Cell Contents: - Count- Column Percentage- Statistical Test ResultsStatistics: Overlap formulae used- Column Proportions: Columns Tested (5%): A/B/C/D, E/F, G/H, I/J,K/L/M, N/O/P, Q/R/S, (10%): a/b/c/d, e/f, g/h, i/j,k/l/m, n/o/p, q/r/s Minimum Base: 30 (**), Small Base: 30 (*)
Presented by SPH Analytics770-978-3173
2016

Q62. Are you of Hispanic or Latino origin ordescent?
Regence BCBS2016 CAHPS 5.0H Commercial Adult Survey (1113020)
Table: 64Level: Top
AGE (Q59) EDUCATION(Q61)
GENDER(Q60)
ETHNICITY(Q62) RACE (Q63) HEALTH STATUS
(Q43)MENTAL HEALTH
(Q44)
Total 18 to34
35 to44
45 to54
55 orolder
HS/GED/Less
SomeColg/Grad+
Male Female Hispanicor Latino
NotHispanicor Latino
WhiteBlack orAfrican-
AmericanOther Excellent/
Very good Good Fair/Poor
Excellent/Very good Good Fair/
Poor
A B C D E F G H I J K L M N O P Q R S
Q62. Are you of Hispanic or Latino origin or descent?
TotalEligible
176 26 29 34 86 7 168 60 116 9 160 137 6 39 107 55 14 129 35 10100.0% 100.0% 100.0% 100.0% 100.0% 100.0% 100.0% 100.0% 100.0% 100.0% 100.0% 100.0% 100.0% 100.0% 100.0% 100.0% 100.0% 100.0% 100.0% 100.0%
Total ValidResponses
169 25 28 34 82 7 161 56 113 9 160 134 6 38 101 54 14 124 34 10100.0% 100.0% 100.0% 100.0% 100.0% 100.0% 100.0% 100.0% 100.0% 100.0% 100.0% 100.0% 100.0% 100.0% 100.0% 100.0% 100.0% 100.0% 100.0% 100.0%
No Answer7 1 1 - 4 - 7 4 3 - - 3 - 1 6 1 - 5 1 -
Yes,Hispanic orLatino
9 1 2 1 5 - 8 4 5 9 - 4 - 5 4 4 1 7 1 15.3% 4.0% 7.1% 2.9% 6.1% - 5.0% 7.1% 4.4% 100.0% - 3.0% - 13.2% 4.0% 7.4% 7.1% 5.6% 2.9% 10.0%
** ** ** ** ** K ** **No, NotHispanic orLatino
160 24 26 33 77 7 153 52 108 - 160 130 6 33 97 50 13 117 33 994.7% 96.0% 92.9% 97.1% 93.9% 100.0% 95.0% 92.9% 95.6% - 100.0% 97.0% 100.0% 86.8% 96.0% 92.6% 92.9% 94.4% 97.1% 90.0%
** ** ** ** M ** ** **
Cell Contents: - Count- Column Percentage- Statistical Test ResultsStatistics: Overlap formulae used- Column Proportions: Columns Tested (5%): A/B/C/D, E/F, G/H, I/J,K/L/M, N/O/P, Q/R/S, (10%): a/b/c/d, e/f, g/h, i/j,k/l/m, n/o/p, q/r/s Minimum Base: 30 (**), Small Base: 30 (*)
Presented by SPH Analytics770-978-3173
2016

Q63. What is your race? Please mark one or more. Regence BCBS2016 CAHPS 5.0H Commercial Adult Survey (1113020)
Table: 65Level: Top
AGE (Q59) EDUCATION(Q61)
GENDER(Q60)
ETHNICITY(Q62) RACE (Q63) HEALTH STATUS
(Q43)MENTAL HEALTH
(Q44)
Total 18 to34
35 to44
45 to54
55 orolder
HS/GED/Less
SomeColg/Grad+
Male Female Hispanicor Latino
NotHispanicor Latino
WhiteBlack orAfrican-
AmericanOther Excellent/
Very good Good Fair/Poor
Excellent/Very good Good Fair/
Poor
A B C D E F G H I J K L M N O P Q R S
Q63. What is your race? Please mark one or more.
Total Eligible176 26 29 34 86 7 168 60 116 9 160 137 6 39 107 55 14 129 35 10
100.0% 100.0% 100.0% 100.0% 100.0% 100.0% 100.0% 100.0% 100.0% 100.0% 100.0% 100.0% 100.0% 100.0% 100.0% 100.0% 100.0% 100.0% 100.0% 100.0%
Total ValidResponses
182 26 32 36 88 7 174 64 118 9 169 148 10 48 107 60 15 133 35 12
TotalRespondents
171 25 29 33 84 7 163 57 114 9 158 137 6 39 103 55 13 124 35 10100.0% 100.0% 100.0% 100.0% 100.0% 100.0% 100.0% 100.0% 100.0% 100.0% 100.0% 100.0% 100.0% 100.0% 100.0% 100.0% 100.0% 100.0% 100.0% 100.0%
White137 20 24 22 71 5 132 53 84 4 130 137 3 8 87 39 11 105 22 8
80.1% 80.0% 82.8% 66.7% 84.5% 71.4% 81.0% 93.0% 73.7% 44.4% 82.3% 100.0% 50.0% 20.5% 84.5% 70.9% 84.6% 84.7% 62.9% 80.0% ** ** C ** H ** M ** O ** R **
Black orAfrican-American
6 - 2 1 3 - 6 3 3 - 6 3 6 1 - 4 2 2 1 33.5% - 6.9% 3.0% 3.6% - 3.7% 5.3% 2.6% - 3.8% 2.2% 100.0% 2.6% - 7.3% 15.4% 1.6% 2.9% 30.0%
** ** ** ** ** N ** **
Asian27 4 5 10 8 2 25 2 25 2 25 2 - 27 16 11 - 16 11 -
15.8% 16.0% 17.2% 30.3% 9.5% 28.6% 15.3% 3.5% 21.9% 22.2% 15.8% 1.5% - 69.2% 15.5% 20.0% - 12.9% 31.4% - ** ** D ** G ** ** K ** Q **
NativeHawaiian orother PacificIslander
1 - 1 - - - 1 - 1 - 1 - - 1 - 1 - 1 - -0.6% - 3.4% - - - 0.6% - 0.9% - 0.6% - - 2.6% - 1.8% - 0.8% - -
** ** ** ** ** k ** **
AmericanIndian orAlaska Native
6 1 - 1 4 - 6 4 2 1 5 5 1 6 2 3 1 6 - -3.5% 4.0% - 3.0% 4.8% - 3.7% 7.0% 1.8% 11.1% 3.2% 3.6% 16.7% 15.4% 1.9% 5.5% 7.7% 4.8% - -
** ** ** h ** ** K ** **
Other5 1 - 2 2 - 4 2 3 2 2 1 - 5 2 2 1 3 1 1
2.9% 4.0% - 6.1% 2.4% - 2.5% 3.5% 2.6% 22.2% 1.3% 0.7% - 12.8% 1.9% 3.6% 7.7% 2.4% 2.9% 10.0% ** ** ** ** ** K ** **
Cell Contents: - Count- Column Percentage- Statistical Test ResultsStatistics: Overlap formulae used- Column Proportions: Columns Tested (5%): A/B/C/D, E/F, G/H, I/J,K/L/M, N/O/P, Q/R/S, (10%): a/b/c/d, e/f, g/h, i/j,k/l/m, n/o/p, q/r/s Minimum Base: 30 (**), Small Base: 30 (*)
Presented by SPH Analytics770-978-3173
2016

Q64. Did someone help you complete this survey? Regence BCBS2016 CAHPS 5.0H Commercial Adult Survey (1113020)
Table: 66Level: Top
AGE (Q59) EDUCATION(Q61)
GENDER(Q60)
ETHNICITY(Q62) RACE (Q63) HEALTH STATUS
(Q43)MENTAL HEALTH
(Q44)
Total 18 to34
35 to44
45 to54
55 orolder
HS/GED/Less
SomeColg/Grad+
Male Female Hispanicor Latino
NotHispanicor Latino
WhiteBlack orAfrican-
AmericanOther Excellent/
Very good Good Fair/Poor
Excellent/Very good Good Fair/
Poor
A B C D E F G H I J K L M N O P Q R S
Q64. Did someone help you complete this survey?
TotalEligible
176 26 29 34 86 7 168 60 116 9 160 137 6 39 107 55 14 129 35 10100.0% 100.0% 100.0% 100.0% 100.0% 100.0% 100.0% 100.0% 100.0% 100.0% 100.0% 100.0% 100.0% 100.0% 100.0% 100.0% 100.0% 100.0% 100.0% 100.0%
Total ValidResponses
175 26 29 34 85 7 167 59 116 9 159 136 5 39 107 55 13 129 35 9100.0% 100.0% 100.0% 100.0% 100.0% 100.0% 100.0% 100.0% 100.0% 100.0% 100.0% 100.0% 100.0% 100.0% 100.0% 100.0% 100.0% 100.0% 100.0% 100.0%
No Answer1 - - - 1 - 1 1 - - 1 1 1 - - - 1 - - 1
Yes4 - - 2 2 2 2 3 1 - 4 3 - 1 1 3 - 3 1 -
2.3% - - 5.9% 2.4% 28.6% 1.2% 5.1% 0.9% - 2.5% 2.2% - 2.6% 0.9% 5.5% - 2.3% 2.9% - ** ** ** h ** ** n ** **
No171 26 29 32 83 5 165 56 115 9 155 133 5 38 106 52 13 126 34 9
97.7% 100.0% 100.0% 94.1% 97.6% 71.4% 98.8% 94.9% 99.1% 100.0% 97.5% 97.8% 100.0% 97.4% 99.1% 94.5% 100.0% 97.7% 97.1% 100.0% ** ** ** g ** ** o ** **
Cell Contents: - Count- Column Percentage- Statistical Test ResultsStatistics: Overlap formulae used- Column Proportions: Columns Tested (5%): A/B/C/D, E/F, G/H, I/J,K/L/M, N/O/P, Q/R/S, (10%): a/b/c/d, e/f, g/h, i/j,k/l/m, n/o/p, q/r/s Minimum Base: 30 (**), Small Base: 30 (*)
Presented by SPH Analytics770-978-3173
2016

Q65. How did that person help you? Check all thatapply.
Regence BCBS2016 CAHPS 5.0H Commercial Adult Survey (1113020)
Table: 67Level: Top
AGE (Q59) EDUCATION(Q61)
GENDER(Q60)
ETHNICITY(Q62) RACE (Q63) HEALTH STATUS
(Q43)MENTAL HEALTH
(Q44)
Total18to34
35to44
45 to54
55 orolder
HS/GED/Less
SomeColg/Grad+
Male Female Hispanicor Latino
NotHispanicor Latino
WhiteBlack orAfrican-
AmericanOther Excellent/
Very good Good Fair/Poor
Excellent/Very good Good Fair/
Poor
A B C D E F G H I J K L M N O P Q R S
Q65. How did that person help you? Check all that apply.
Total Eligible4 - - 2 2 2 2 3 1 - 4 3 - 1 1 3 - 3 1 -
100.0% - - 100.0% 100.0% 100.0% 100.0% 100.0% 100.0% - 100.0% 100.0% - 100.0% 100.0% 100.0% - 100.0% 100.0% -
Total ValidResponses
5 - - 3 2 3 2 4 1 - 5 4 - 1 1 4 - 4 1 -
TotalRespondents
4 - - 2 2 2 2 3 1 - 4 3 - 1 1 3 - 3 1 -100.0% - - 100.0% 100.0% 100.0% 100.0% 100.0% 100.0% - 100.0% 100.0% - 100.0% 100.0% 100.0% - 100.0% 100.0% -
Read thequestions tome
1 - - 1 - 1 - 1 - - 1 1 - - - 1 - 1 - -25.0% - - 50.0% - 50.0% - 33.3% - - 25.0% 33.3% - - - 33.3% - 33.3% - -
** ** ** ** ** ** ** ** ** ** ** ** Wrote downthe answers Igave
1 - - 1 - 1 - 1 - - 1 1 - - - 1 - 1 - -25.0% - - 50.0% - 50.0% - 33.3% - - 25.0% 33.3% - - - 33.3% - 33.3% - -
** ** ** ** ** ** ** ** ** ** ** ** Answered thequestions forme
2 - - - 2 1 1 1 1 - 2 1 - 1 1 1 - 1 1 -50.0% - - - 100.0% 50.0% 50.0% 33.3% 100.0% - 50.0% 33.3% - 100.0% 100.0% 33.3% - 33.3% 100.0% -
** ** ** ** ** ** ** ** ** ** ** ** Translatedthe questionsinto mylanguage
- - - - - - - - - - - - - - - - - - - -- - - - - - - - - - - - - - - - - - - -
** ** ** ** ** ** ** ** ** ** ** **
Helped insome otherway
1 - - 1 - - 1 1 - - 1 1 - - - 1 - 1 - -25.0% - - 50.0% - - 50.0% 33.3% - - 25.0% 33.3% - - - 33.3% - 33.3% - -
** ** ** ** ** ** ** ** ** ** ** **
Cell Contents: - Count- Column Percentage- Statistical Test ResultsStatistics: Overlap formulae used- Column Proportions: Columns Tested (5%): A/B/C/D, E/F, G/H, I/J,K/L/M, N/O/P, Q/R/S, (10%): a/b/c/d, e/f, g/h, i/j,k/l/m, n/o/p, q/r/s Minimum Base: 30 (**), Small Base: 30 (*)
Presented by SPH Analytics770-978-3173
2016

Q1. Our records show that you are now in UMPPlus. Is that right?
Regence BCBS2016 CAHPS 5.0H Commercial Adult Survey (1113020)
Table: 68Level: Top
HEALTH PLANRATING (Q42)
HEALTHCARE
RATING(Q13)
DOCTORRATING
(Q23)
HEALTH PLANRATING BY
GLOBALPROP. (Q42)
CONTACTCUSTOMER
SERVICE(Q34)
GOTINFO/HELP
FROMCUSTOMER
SERVICE (Q35)
NUMBER OFDOCTOR/CLINIC
VISITS (Q7)CLAIMS
(Q39)DATA
COLLECTIONMETHOD
Total 0-7 8-10 0-7 8-10 0-7 8-10 0-6 7-8 9-10 Yes No Never/Sometimes
Always/Usually
Less than3 3 or More Yes No Mail Phone Internet
A B C D E F G H I J K L M N O P Q R S T
Q1. Our records show that you are now in UMP Plus. Is that right?
Total Eligible176 56 120 35 128 18 144 33 66 77 66 109 11 55 74 100 108 43 176 - -
100.0%100.0% 100.0% 100.0% 100.0% 100.0% 100.0% 100.0% 100.0% 100.0% 100.0% 100.0% 100.0% 100.0% 100.0% 100.0% 100.0% 100.0% 100.0% - -
Total ValidResponses
174 55 119 35 127 17 143 33 65 76 66 107 11 55 73 100 106 43 174 - -100.0%100.0% 100.0% 100.0% 100.0% 100.0% 100.0% 100.0% 100.0% 100.0% 100.0% 100.0% 100.0% 100.0% 100.0% 100.0% 100.0% 100.0% 100.0% - -
No Answer2 1 1 - 1 1 1 - 1 1 - 2 - - 1 - 2 - 2 - -
Yes174 55 119 35 127 17 143 33 65 76 66 107 11 55 73 100 106 43 174 - -
100.0%100.0%100.0%100.0%100.0%100.0%100.0%100.0%100.0%100.0% 100.0% 100.0% 100.0% 100.0% 100.0% 100.0% 100.0%100.0%100.0% - - ** **
No- - - - - - - - - - - - - - - - - - - - -- - - - - - - - - - - - - - - - - - - - - ** **
HEDIS/CAHPSSUMMARYRATE - Yes
174 55 119 35 127 17 143 33 65 76 66 107 11 55 73 100 106 43 174 - -100.0%100.0%100.0%100.0%100.0%100.0%100.0%100.0%100.0%100.0% 100.0% 100.0% 100.0% 100.0% 100.0% 100.0% 100.0%100.0%100.0% - -
** **
Cell Contents: - Count- Column Percentage- Statistical Test ResultsStatistics: - Column Proportions: Columns Tested (5%): A/B, C/D, E/F, G/H/I, J/K,L/M, N/O, P/Q, R/S/T, (10%): a/b, c/d, e/f, g/h/i, j/k,l/m, n/o, p/q, r/s/t Minimum Base: 30 (**), Small Base: 30 (*)
Presented by SPH Analytics770-978-3173
2016

Q3. In the last 12 months, did you have an illness,injury, or condition that needed care right away in aclinic, emergency room, or doctor's office?
Regence BCBS2016 CAHPS 5.0H Commercial Adult Survey (1113020)
Table: 69Level: Top
HEALTH PLANRATING (Q42)
HEALTHCARE
RATING(Q13)
DOCTORRATING
(Q23)
HEALTH PLANRATING BY
GLOBALPROP. (Q42)
CONTACTCUSTOMER
SERVICE(Q34)
GOTINFO/HELP
FROMCUSTOMER
SERVICE (Q35)
NUMBER OFDOCTOR/CLINIC
VISITS (Q7)CLAIMS
(Q39)DATA
COLLECTIONMETHOD
Total 0-7 8-10 0-7 8-10 0-7 8-10 0-6 7-8 9-10 Yes No Never/Sometimes
Always/Usually
Less than3 3 or More Yes No Mail Phone Internet
A B C D E F G H I J K L M N O P Q R S T
Q3. In the last 12 months, did you have an illness, injury, or condition that needed care right away in a clinic, emergency room, or doctor'soffice?
Total Eligible176 56 120 35 128 18 144 33 66 77 66 109 11 55 74 100 108 43 176 - -
100.0%100.0%100.0%100.0%100.0%100.0%100.0%100.0%100.0%100.0% 100.0% 100.0% 100.0% 100.0% 100.0% 100.0% 100.0%100.0%100.0% - -
Total ValidResponses
175 56 119 35 127 18 143 33 66 76 66 108 11 55 73 100 107 43 175 - -100.0%100.0%100.0%100.0%100.0%100.0%100.0%100.0%100.0%100.0% 100.0% 100.0% 100.0% 100.0% 100.0% 100.0% 100.0%100.0%100.0% - -
No Answer1 - 1 - 1 - 1 - - 1 - 1 - - 1 - 1 - 1 - -
Yes74 21 53 12 59 6 66 13 28 33 32 41 3 29 21 52 49 16 74 - -
42.3% 37.5% 44.5% 34.3% 46.5% 33.3% 46.2% 39.4% 42.4% 43.4% 48.5% 38.0% 27.3% 52.7% 28.8% 52.0% 45.8% 37.2% 42.3% - - ** ** N
No101 35 66 23 68 12 77 20 38 43 34 67 8 26 52 48 58 27 101 - -
57.7% 62.5% 55.5% 65.7% 53.5% 66.7% 53.8% 60.6% 57.6% 56.6% 51.5% 62.0% 72.7% 47.3% 71.2% 48.0% 54.2% 62.8% 57.7% - - ** ** O
HEDIS/CAHPSSUMMARYRATE - Yes
74 21 53 12 59 6 66 13 28 33 32 41 3 29 21 52 49 16 74 - -42.3% 37.5% 44.5% 34.3% 46.5% 33.3% 46.2% 39.4% 42.4% 43.4% 48.5% 38.0% 27.3% 52.7% 28.8% 52.0% 45.8% 37.2% 42.3% - -
** ** N
Cell Contents: - Count- Column Percentage- Statistical Test ResultsStatistics: - Column Proportions: Columns Tested (5%): A/B, C/D, E/F, G/H/I, J/K,L/M, N/O, P/Q, R/S/T, (10%): a/b, c/d, e/f, g/h/i, j/k,l/m, n/o, p/q, r/s/t Minimum Base: 30 (**), Small Base: 30 (*)
Presented by SPH Analytics770-978-3173
2016

Q4. (GCQ) In the last 12 months, when you neededcare right away, how often did you get care as soonas you needed?
Regence BCBS2016 CAHPS 5.0H Commercial Adult Survey (1113020)
Table: 70Level: Top
HEALTH PLANRATING (Q42)
HEALTHCARE
RATING(Q13)
DOCTORRATING
(Q23)
HEALTH PLANRATING BY
GLOBALPROP. (Q42)
CONTACTCUSTOMER
SERVICE(Q34)
GOTINFO/HELP
FROMCUSTOMER
SERVICE (Q35)
NUMBER OFDOCTOR/CLINIC
VISITS (Q7)CLAIMS
(Q39)DATA
COLLECTIONMETHOD
Total 0-7 8-10 0-7 8-10 0-7 8-10 0-6 7-8 9-10 Yes No Never/Sometimes
Always/Usually
Less than3 3 or More Yes No Mail Phone Internet
A B C D E F G H I J K L M N O P Q R S T
Q4. (GCQ) In the last 12 months, when you needed care right away, how often did you get care as soon as you needed?
Total Eligible74 21 53 12 59 6 66 13 28 33 32 41 3 29 21 52 49 16 74 - -
100.0%100.0%100.0%100.0%100.0%100.0%100.0%100.0%100.0%100.0% 100.0% 100.0% 100.0% 100.0% 100.0% 100.0% 100.0%100.0%100.0% - -
Total ValidResponses
72 21 51 12 58 6 64 13 28 31 32 40 3 29 21 50 47 16 72 - -100.0%100.0%100.0%100.0%100.0%100.0%100.0%100.0%100.0%100.0% 100.0% 100.0% 100.0% 100.0% 100.0% 100.0% 100.0%100.0%100.0% - -
No Answer2 - 2 - 1 - 2 - - 2 - 1 - - - 2 2 - 2 - -
Always45 7 38 2 42 1 43 5 15 25 22 23 1 21 13 32 30 8 45 - -
62.5% 33.3% 74.5% 16.7% 72.4% 16.7% 67.2% 38.5% 53.6% 80.6% 68.8% 57.5% 33.3% 72.4% 61.9% 64.0% 63.8% 50.0% 62.5% - - ** ** ** ** ** ** ** ** **
Usually19 7 12 5 13 5 13 3 10 6 8 11 1 7 5 13 12 6 19 - -
26.4% 33.3% 23.5% 41.7% 22.4% 83.3% 20.3% 23.1% 35.7% 19.4% 25.0% 27.5% 33.3% 24.1% 23.8% 26.0% 25.5% 37.5% 26.4% - - ** ** ** ** ** ** ** ** **
Sometimes6 5 1 3 3 - 6 4 2 - 1 5 - 1 2 4 3 2 6 - -
8.3% 23.8% 2.0% 25.0% 5.2% - 9.4% 30.8% 7.1% - 3.1% 12.5% - 3.4% 9.5% 8.0% 6.4% 12.5% 8.3% - - ** ** ** ** ** ** ** ** **
Never2 2 - 2 - - 2 1 1 - 1 1 1 - 1 1 2 - 2 - -
2.8% 9.5% - 16.7% - - 3.1% 7.7% 3.6% - 3.1% 2.5% 33.3% - 4.8% 2.0% 4.3% - 2.8% - - ** ** ** ** ** ** ** ** **
HEDIS/CAHPSSUMMARYRATE -Always/Usually
64 14 50 7 55 6 56 8 25 31 30 34 2 28 18 45 42 14 64 - -88.9% 66.7% 98.0% 58.3% 94.8% 100.0% 87.5% 61.5% 89.3% 100.0% 93.8% 85.0% 66.7% 96.6% 85.7% 90.0% 89.4% 87.5% 88.9% - -
** ** ** ** ** ** ** ** **
HEDIS/CAHPSSUMMARYRATE - Always
45 7 38 2 42 1 43 5 15 25 22 23 1 21 13 32 30 8 45 - -62.5% 33.3% 74.5% 16.7% 72.4% 16.7% 67.2% 38.5% 53.6% 80.6% 68.8% 57.5% 33.3% 72.4% 61.9% 64.0% 63.8% 50.0% 62.5% - -
** ** ** ** ** ** ** ** **
3-Point Score2.51 2.00 2.73 1.75 2.67 2.17 2.55 2.00 2.43 2.81 2.63 2.43 2.00 2.69 2.48 2.54 2.53 2.38 2.51 - -
Cell Contents: - Count- Column Percentage- Statistical Test ResultsStatistics: - Column Proportions: Columns Tested (5%): A/B, C/D, E/F, G/H/I, J/K,L/M, N/O, P/Q, R/S/T, (10%): a/b, c/d, e/f, g/h/i, j/k,l/m, n/o, p/q, r/s/t Minimum Base: 30 (**), Small Base: 30 (*)
Presented by SPH Analytics770-978-3173
2016

Q5. In the last 12 months, did you make anyappointments for a check-up or routine care at adoctor's office or clinic?
Regence BCBS2016 CAHPS 5.0H Commercial Adult Survey (1113020)
Table: 71Level: Top
HEALTH PLANRATING (Q42)
HEALTHCARE
RATING(Q13)
DOCTORRATING
(Q23)
HEALTH PLANRATING BY
GLOBALPROP. (Q42)
CONTACTCUSTOMER
SERVICE(Q34)
GOTINFO/HELP
FROMCUSTOMER
SERVICE (Q35)
NUMBER OFDOCTOR/CLINIC
VISITS (Q7)CLAIMS
(Q39)DATA
COLLECTIONMETHOD
Total 0-7 8-10 0-7 8-10 0-7 8-10 0-6 7-8 9-10 Yes No Never/Sometimes
Always/Usually
Less than3 3 or More Yes No Mail Phone Internet
A B C D E F G H I J K L M N O P Q R S T
Q5. In the last 12 months, did you make any appointments for a check-up or routine care at a doctor's office or clinic?
Total Eligible176 56 120 35 128 18 144 33 66 77 66 109 11 55 74 100 108 43 176 - -
100.0%100.0%100.0%100.0%100.0%100.0%100.0%100.0%100.0%100.0% 100.0% 100.0% 100.0% 100.0% 100.0% 100.0% 100.0%100.0%100.0% - -
Total ValidResponses
174 54 120 34 128 17 143 32 65 77 66 107 11 55 73 100 106 43 174 - -100.0%100.0%100.0%100.0%100.0%100.0%100.0%100.0%100.0%100.0% 100.0% 100.0% 100.0% 100.0% 100.0% 100.0% 100.0%100.0%100.0% - -
No Answer2 2 - 1 - 1 1 1 1 - - 2 - - 1 - 2 - 2 - -
Yes156 47 109 32 122 15 132 27 56 73 63 92 10 53 59 96 98 37 156 - -
89.7% 87.0% 90.8% 94.1% 95.3% 88.2% 92.3% 84.4% 86.2% 94.8% 95.5% 86.0% 90.9% 96.4% 80.8% 96.0% 92.5% 86.0% 89.7% - - ** gh K ** N
No18 7 11 2 6 2 11 5 9 4 3 15 1 2 14 4 8 6 18 - -
10.3% 13.0% 9.2% 5.9% 4.7% 11.8% 7.7% 15.6% 13.8% 5.2% 4.5% 14.0% 9.1% 3.6% 19.2% 4.0% 7.5% 14.0% 10.3% - - ** i i J ** O
HEDIS/CAHPSSUMMARYRATE - Yes
156 47 109 32 122 15 132 27 56 73 63 92 10 53 59 96 98 37 156 - -89.7% 87.0% 90.8% 94.1% 95.3% 88.2% 92.3% 84.4% 86.2% 94.8% 95.5% 86.0% 90.9% 96.4% 80.8% 96.0% 92.5% 86.0% 89.7% - -
** gh K ** N
Cell Contents: - Count- Column Percentage- Statistical Test ResultsStatistics: - Column Proportions: Columns Tested (5%): A/B, C/D, E/F, G/H/I, J/K,L/M, N/O, P/Q, R/S/T, (10%): a/b, c/d, e/f, g/h/i, j/k,l/m, n/o, p/q, r/s/t Minimum Base: 30 (**), Small Base: 30 (*)
Presented by SPH Analytics770-978-3173
2016

Q6. (GCQ) In the last 12 months, how often did youget an appointment for a check-up or routine care ata doctor's office or clinic as soon as you needed?
Regence BCBS2016 CAHPS 5.0H Commercial Adult Survey (1113020)
Table: 72Level: Top
HEALTH PLANRATING (Q42)
HEALTHCARE
RATING(Q13)
DOCTORRATING
(Q23)
HEALTH PLANRATING BY
GLOBALPROP. (Q42)
CONTACTCUSTOMER
SERVICE(Q34)
GOTINFO/HELP
FROMCUSTOMER
SERVICE (Q35)
NUMBER OFDOCTOR/CLINIC
VISITS (Q7)CLAIMS
(Q39)DATA
COLLECTIONMETHOD
Total 0-7 8-10 0-7 8-10 0-7 8-10 0-6 7-8 9-10 Yes No Never/Sometimes
Always/Usually
Less than3 3 or More Yes No Mail Phone Internet
A B C D E F G H I J K L M N O P Q R S T
Q6. (GCQ) In the last 12 months, how often did you get an appointment for a check-up or routine care at a doctor's office or clinic as soon asyou needed?
Total Eligible156 47 109 32 122 15 132 27 56 73 63 92 10 53 59 96 98 37 156 - -
100.0%100.0%100.0%100.0%100.0%100.0%100.0%100.0%100.0%100.0% 100.0% 100.0% 100.0% 100.0% 100.0% 100.0% 100.0%100.0%100.0% - -
Total ValidResponses
149 46 103 31 117 14 129 26 55 68 59 90 10 49 57 91 95 34 149 - -100.0%100.0%100.0%100.0%100.0%100.0%100.0%100.0%100.0%100.0% 100.0% 100.0% 100.0% 100.0% 100.0% 100.0% 100.0%100.0%100.0% - -
No Answer7 1 6 1 5 1 3 1 1 5 4 2 - 4 2 5 3 3 7 - -
Always73 13 60 6 67 4 66 5 23 45 31 42 4 27 28 45 45 18 73 - -
49.0% 28.3% 58.3% 19.4% 57.3% 28.6% 51.2% 19.2% 41.8% 66.2% 52.5% 46.7% 40.0% 55.1% 49.1% 49.5% 47.4% 52.9% 49.0% - - A C ** ** H **
Usually46 14 32 10 36 3 42 8 21 17 14 32 1 13 20 26 29 11 46 - -
30.9% 30.4% 31.1% 32.3% 30.8% 21.4% 32.6% 30.8% 38.2% 25.0% 23.7% 35.6% 10.0% 26.5% 35.1% 28.6% 30.5% 32.4% 30.9% - - ** ** **
Sometimes25 15 10 11 13 5 18 10 10 5 10 15 2 8 5 19 17 4 25 - -
16.8% 32.6% 9.7% 35.5% 11.1% 35.7% 14.0% 38.5% 18.2% 7.4% 16.9% 16.7% 20.0% 16.3% 8.8% 20.9% 17.9% 11.8% 16.8% - - B D ** ** i ** n
Never5 4 1 4 1 2 3 3 1 1 4 1 3 1 4 1 4 1 5 - -
3.4% 8.7% 1.0% 12.9% 0.9% 14.3% 2.3% 11.5% 1.8% 1.5% 6.8% 1.1% 30.0% 2.0% 7.0% 1.1% 4.2% 2.9% 3.4% - - B D ** ** k ** o
HEDIS/CAHPSSUMMARYRATE -Always/Usually
119 27 92 16 103 7 108 13 44 62 45 74 5 40 48 71 74 29 119 - -79.9% 58.7% 89.3% 51.6% 88.0% 50.0% 83.7% 50.0% 80.0% 91.2% 76.3% 82.2% 50.0% 81.6% 84.2% 78.0% 77.9% 85.3% 79.9% - -
A C ** ** h **
HEDIS/CAHPSSUMMARYRATE - Always
73 13 60 6 67 4 66 5 23 45 31 42 4 27 28 45 45 18 73 - -49.0% 28.3% 58.3% 19.4% 57.3% 28.6% 51.2% 19.2% 41.8% 66.2% 52.5% 46.7% 40.0% 55.1% 49.1% 49.5% 47.4% 52.9% 49.0% - -
A C ** ** H **
3-Point Score2.29 1.87 2.48 1.71 2.45 1.79 2.35 1.69 2.22 2.57 2.29 2.29 1.90 2.37 2.33 2.27 2.25 2.38 2.29 - -
Cell Contents: - Count- Column Percentage- Statistical Test ResultsStatistics: - Column Proportions: Columns Tested (5%): A/B, C/D, E/F, G/H/I, J/K,L/M, N/O, P/Q, R/S/T, (10%): a/b, c/d, e/f, g/h/i, j/k,l/m, n/o, p/q, r/s/t Minimum Base: 30 (**), Small Base: 30 (*)
Presented by SPH Analytics770-978-3173
2016

Q7. In the last 12 months, not counting the timesyou went to an emergency room, how many timesdid you go to a doctor's office or clinic to get healthcare for yourself?
Regence BCBS2016 CAHPS 5.0H Commercial Adult Survey (1113020)
Table: 73Level: Top
HEALTH PLANRATING (Q42)
HEALTHCARE
RATING(Q13)
DOCTORRATING
(Q23)
HEALTH PLANRATING BY
GLOBALPROP. (Q42)
CONTACTCUSTOMER
SERVICE(Q34)
GOTINFO/HELP
FROMCUSTOMER
SERVICE (Q35)
NUMBER OFDOCTOR/CLINIC
VISITS (Q7)CLAIMS
(Q39)DATA
COLLECTIONMETHOD
Total 0-7 8-10 0-7 8-10 0-7 8-10 0-6 7-8 9-10 Yes No Never/Sometimes
Always/Usually
Less than3 3 or More Yes No Mail Phone Internet
A B C D E F G H I J K L M N O P Q R S T
Q7. In the last 12 months, not counting the times you went to an emergency room, how many times did you go to a doctor's office or clinic to gethealth care for yourself?
Total Eligible176 56 120 35 128 18 144 33 66 77 66 109 11 55 74 100 108 43 176 - -
100.0%100.0%100.0%100.0% 100.0% 100.0%100.0%100.0%100.0%100.0% 100.0% 100.0% 100.0% 100.0% 100.0% 100.0% 100.0%100.0%100.0% - -
Total ValidResponses
174 55 119 35 128 17 143 33 64 77 65 108 10 55 74 100 106 43 174 - -100.0%100.0%100.0%100.0% 100.0% 100.0%100.0%100.0%100.0%100.0% 100.0% 100.0% 100.0% 100.0% 100.0% 100.0% 100.0%100.0%100.0% - -
No Answer2 1 1 - - 1 1 - 2 - 1 1 1 - - - 2 - 2 - -
None10 4 6 - - - 6 3 6 1 - 10 - - 10 - 1 6 10 - -
5.7% 7.3% 5.0% - - - 4.2% 9.1% 9.4% 1.3% - 9.3% - - 13.5% - 0.9% 14.0% 5.7% - - ** I I J ** O P
1 time24 4 20 2 22 3 21 1 10 13 7 17 1 6 24 - 13 8 24 - -
13.8% 7.3% 16.8% 5.7% 17.2% 17.6% 14.7% 3.0% 15.6% 16.9% 10.8% 15.7% 10.0% 10.9% 32.4% - 12.3% 18.6% 13.8% - - a c ** g G ** O
240 15 25 13 27 4 34 6 19 15 15 25 2 13 40 - 23 10 40 - -
23.0% 27.3% 21.0% 37.1% 21.1% 23.5% 23.8% 18.2% 29.7% 19.5% 23.1% 23.1% 20.0% 23.6% 54.1% - 21.7% 23.3% 23.0% - - d ** ** O
331 11 20 7 24 1 28 9 11 11 16 15 1 15 - 31 20 7 31 - -
17.8% 20.0% 16.8% 20.0% 18.8% 5.9% 19.6% 27.3% 17.2% 14.3% 24.6% 13.9% 10.0% 27.3% - 31.0% 18.9% 16.3% 17.8% - - ** k ** N
419 6 13 2 17 2 14 2 8 9 6 13 - 6 - 19 12 5 19 - -
10.9% 10.9% 10.9% 5.7% 13.3% 11.8% 9.8% 6.1% 12.5% 11.7% 9.2% 12.0% - 10.9% - 19.0% 11.3% 11.6% 10.9% - - ** ** N
5 to 938 14 24 9 28 6 31 11 8 19 14 23 5 9 - 38 27 6 38 - -
21.8% 25.5% 20.2% 25.7% 21.9% 35.3% 21.7% 33.3% 12.5% 24.7% 21.5% 21.3% 50.0% 16.4% - 38.0% 25.5% 14.0% 21.8% - - ** H h ** N
10 or moretimes
12 1 11 2 10 1 9 1 2 9 7 5 1 6 - 12 10 1 12 - -6.9% 1.8% 9.2% 5.7% 7.8% 5.9% 6.3% 3.0% 3.1% 11.7% 10.8% 4.6% 10.0% 10.9% - 12.0% 9.4% 2.3% 6.9% - -
a ** h ** N HEDIS/CAHPSSUMMARYRATE - 1 ormore times
164 51 113 35 128 17 137 30 58 76 65 98 10 55 64 100 105 37 164 - -94.3% 92.7% 95.0% 100.0%100.0%100.0% 95.8% 90.9% 90.6% 98.7% 100.0% 90.7% 100.0% 100.0% 86.5% 100.0% 99.1% 86.0% 94.3% - -
** GH K ** N Q
Cell Contents: - Count- Column Percentage- Statistical Test ResultsStatistics: - Column Proportions: Columns Tested (5%): A/B, C/D, E/F, G/H/I, J/K,L/M, N/O, P/Q, R/S/T, (10%): a/b, c/d, e/f, g/h/i, j/k,l/m, n/o, p/q, r/s/t Minimum Base: 30 (**), Small Base: 30 (*)
Presented by SPH Analytics770-978-3173
2016

Q8. (HPE) In the last 12 months, did you and adoctor or other health provider talk about specificthings you could do to prevent illness?
Regence BCBS2016 CAHPS 5.0H Commercial Adult Survey (1113020)
Table: 74Level: Top
HEALTH PLANRATING (Q42)
HEALTHCARE
RATING(Q13)
DOCTORRATING
(Q23)
HEALTH PLANRATING BY
GLOBALPROP. (Q42)
CONTACTCUSTOMER
SERVICE(Q34)
GOTINFO/HELP
FROMCUSTOMER
SERVICE (Q35)
NUMBER OFDOCTOR/CLINIC
VISITS (Q7)CLAIMS
(Q39)DATA
COLLECTIONMETHOD
Total 0-7 8-10 0-7 8-10 0-7 8-10 0-6 7-8 9-10 Yes No Never/Sometimes
Always/Usually
Less than3 3 or More Yes No Mail Phone Internet
A B C D E F G H I J K L M N O P Q R S T
Q8. (HPE) In the last 12 months, did you and a doctor or other health provider talk about specific things you could do to prevent illness?
Total Eligible164 51 113 35 128 17 137 30 58 76 65 98 10 55 64 100 105 37 164 - -
100.0%100.0%100.0%100.0%100.0%100.0%100.0%100.0%100.0%100.0% 100.0% 100.0% 100.0% 100.0% 100.0% 100.0% 100.0%100.0%100.0% - -
Total ValidResponses
163 51 112 35 127 17 136 30 57 76 64 98 10 54 64 99 105 36 163 - -100.0%100.0%100.0%100.0%100.0%100.0%100.0%100.0%100.0%100.0% 100.0% 100.0% 100.0% 100.0% 100.0% 100.0% 100.0%100.0%100.0% - -
No Answer1 - 1 - 1 - 1 - 1 - 1 - - 1 - 1 - 1 1 - -
Yes134 37 97 23 110 7 121 23 42 69 50 83 7 43 49 85 86 31 134 - -
82.2% 72.5% 86.6% 65.7% 86.6% 41.2% 89.0% 76.7% 73.7% 90.8% 78.1% 84.7% 70.0% 79.6% 76.6% 85.9% 81.9% 86.1% 82.2% - - A C ** gH **
No29 14 15 12 17 10 15 7 15 7 14 15 3 11 15 14 19 5 29 - -
17.8% 27.5% 13.4% 34.3% 13.4% 58.8% 11.0% 23.3% 26.3% 9.2% 21.9% 15.3% 30.0% 20.4% 23.4% 14.1% 18.1% 13.9% 17.8% - - B D ** i I **
HEDIS/CAHPSSUMMARYRATE - Yes
134 37 97 23 110 7 121 23 42 69 50 83 7 43 49 85 86 31 134 - -82.2% 72.5% 86.6% 65.7% 86.6% 41.2% 89.0% 76.7% 73.7% 90.8% 78.1% 84.7% 70.0% 79.6% 76.6% 85.9% 81.9% 86.1% 82.2% - -
A C ** gH **
3-Point Score2.64 2.45 2.73 2.31 2.73 1.82 2.78 2.53 2.47 2.82 2.56 2.69 2.40 2.59 2.53 2.72 2.64 2.72 2.64 - -
Cell Contents: - Count- Column Percentage- Statistical Test ResultsStatistics: - Column Proportions: Columns Tested (5%): A/B, C/D, E/F, G/H/I, J/K,L/M, N/O, P/Q, R/S/T, (10%): a/b, c/d, e/f, g/h/i, j/k,l/m, n/o, p/q, r/s/t Minimum Base: 30 (**), Small Base: 30 (*)
Presented by SPH Analytics770-978-3173
2016

Q9. In the last 12 months, did you and a doctor orother health provider talk about starting or stopping aprescription medicine?
Regence BCBS2016 CAHPS 5.0H Commercial Adult Survey (1113020)
Table: 75Level: Top
HEALTH PLANRATING (Q42)
HEALTHCARE
RATING(Q13)
DOCTORRATING
(Q23)
HEALTH PLANRATING BY
GLOBALPROP. (Q42)
CONTACTCUSTOMER
SERVICE(Q34)
GOTINFO/HELP
FROMCUSTOMER
SERVICE (Q35)
NUMBER OFDOCTOR/CLINIC
VISITS (Q7)CLAIMS
(Q39)DATA
COLLECTIONMETHOD
Total 0-7 8-10 0-7 8-10 0-7 8-10 0-6 7-8 9-10 Yes No Never/Sometimes
Always/Usually
Less than3 3 or More Yes No Mail Phone Internet
A B C D E F G H I J K L M N O P Q R S T
Q9. In the last 12 months, did you and a doctor or other health provider talk about starting or stopping a prescription medicine?
Total Eligible164 51 113 35 128 17 137 30 58 76 65 98 10 55 64 100 105 37 164 - -
100.0%100.0%100.0%100.0%100.0%100.0%100.0%100.0%100.0%100.0% 100.0% 100.0% 100.0% 100.0% 100.0% 100.0% 100.0%100.0%100.0% - -
Total ValidResponses
162 50 112 34 127 17 135 30 57 75 64 97 10 54 63 99 104 36 162 - -100.0%100.0%100.0%100.0%100.0%100.0%100.0%100.0%100.0%100.0% 100.0% 100.0% 100.0% 100.0% 100.0% 100.0% 100.0%100.0%100.0% - -
No Answer2 1 1 1 1 - 2 - 1 1 1 1 - 1 1 1 1 1 2 - -
Yes92 27 65 19 72 10 77 18 30 44 37 54 6 31 28 64 59 20 92 - -
56.8% 54.0% 58.0% 55.9% 56.7% 58.8% 57.0% 60.0% 52.6% 58.7% 57.8% 55.7% 60.0% 57.4% 44.4% 64.6% 56.7% 55.6% 56.8% - - ** ** N
No70 23 47 15 55 7 58 12 27 31 27 43 4 23 35 35 45 16 70 - -
43.2% 46.0% 42.0% 44.1% 43.3% 41.2% 43.0% 40.0% 47.4% 41.3% 42.2% 44.3% 40.0% 42.6% 55.6% 35.4% 43.3% 44.4% 43.2% - - ** ** O
HEDIS/CAHPSSUMMARYRATE - Yes
92 27 65 19 72 10 77 18 30 44 37 54 6 31 28 64 59 20 92 - -56.8% 54.0% 58.0% 55.9% 56.7% 58.8% 57.0% 60.0% 52.6% 58.7% 57.8% 55.7% 60.0% 57.4% 44.4% 64.6% 56.7% 55.6% 56.8% - -
** ** N
Cell Contents: - Count- Column Percentage- Statistical Test ResultsStatistics: - Column Proportions: Columns Tested (5%): A/B, C/D, E/F, G/H/I, J/K,L/M, N/O, P/Q, R/S/T, (10%): a/b, c/d, e/f, g/h/i, j/k,l/m, n/o, p/q, r/s/t Minimum Base: 30 (**), Small Base: 30 (*)
Presented by SPH Analytics770-978-3173
2016

Q10. (SDM) Did you and a doctor or other healthprovider talk about the reasons you might want totake a medicine?
Regence BCBS2016 CAHPS 5.0H Commercial Adult Survey (1113020)
Table: 76Level: Top
HEALTH PLANRATING (Q42)
HEALTHCARE
RATING(Q13)
DOCTORRATING
(Q23)
HEALTH PLANRATING BY
GLOBALPROP. (Q42)
CONTACTCUSTOMER
SERVICE(Q34)
GOTINFO/HELP
FROMCUSTOMER
SERVICE (Q35)
NUMBER OFDOCTOR/CLINIC
VISITS (Q7)CLAIMS
(Q39)DATA
COLLECTIONMETHOD
Total 0-7 8-10 0-7 8-10 0-7 8-10 0-6 7-8 9-10 Yes No Never/Sometimes
Always/Usually
Less than3 3 or More Yes No Mail Phone Internet
A B C D E F G H I J K L M N O P Q R S T
Q10. (SDM) Did you and a doctor or other health provider talk about the reasons you might want to take a medicine?
Total Eligible92 27 65 19 72 10 77 18 30 44 37 54 6 31 28 64 59 20 92 - -
100.0%100.0%100.0%100.0%100.0%100.0%100.0%100.0%100.0%100.0% 100.0% 100.0% 100.0% 100.0% 100.0% 100.0% 100.0%100.0%100.0% - -
Total ValidResponses
92 27 65 19 72 10 77 18 30 44 37 54 6 31 28 64 59 20 92 - -100.0%100.0%100.0%100.0%100.0%100.0%100.0%100.0%100.0%100.0% 100.0% 100.0% 100.0% 100.0% 100.0% 100.0% 100.0%100.0%100.0% - -
No Answer- - - - - - - - - - - - - - - - - - - - -
Yes85 25 60 18 66 10 70 16 30 39 35 49 6 29 26 59 55 17 85 - -
92.4% 92.6% 92.3% 94.7% 91.7% 100.0% 90.9% 88.9% 100.0% 88.6% 94.6% 90.7% 100.0% 93.5% 92.9% 92.2% 93.2% 85.0% 92.4% - - ** ** ** ** i ** ** **
No7 2 5 1 6 - 7 2 - 5 2 5 - 2 2 5 4 3 7 - -
7.6% 7.4% 7.7% 5.3% 8.3% - 9.1% 11.1% - 11.4% 5.4% 9.3% - 6.5% 7.1% 7.8% 6.8% 15.0% 7.6% - - ** ** ** ** h ** ** **
HEDIS/CAHPSSUMMARYRATE - Yes
85 25 60 18 66 10 70 16 30 39 35 49 6 29 26 59 55 17 85 - -92.4% 92.6% 92.3% 94.7% 91.7% 100.0% 90.9% 88.9% 100.0% 88.6% 94.6% 90.7% 100.0% 93.5% 92.9% 92.2% 93.2% 85.0% 92.4% - -
** ** ** ** i ** ** **
3-Point Score2.85 2.85 2.85 2.89 2.83 3.00 2.82 2.78 3.00 2.77 2.89 2.81 3.00 2.87 2.86 2.84 2.86 2.70 2.85 - -
Cell Contents: - Count- Column Percentage- Statistical Test ResultsStatistics: - Column Proportions: Columns Tested (5%): A/B, C/D, E/F, G/H/I, J/K,L/M, N/O, P/Q, R/S/T, (10%): a/b, c/d, e/f, g/h/i, j/k,l/m, n/o, p/q, r/s/t Minimum Base: 30 (**), Small Base: 30 (*)
Presented by SPH Analytics770-978-3173
2016

Q11. (SDM) Did you and a doctor or other healthprovider talk about the reasons you might not wantto take a medicine?
Regence BCBS2016 CAHPS 5.0H Commercial Adult Survey (1113020)
Table: 77Level: Top
HEALTH PLANRATING (Q42)
HEALTHCARE
RATING(Q13)
DOCTORRATING
(Q23)
HEALTH PLANRATING BY
GLOBALPROP. (Q42)
CONTACTCUSTOMER
SERVICE(Q34)
GOTINFO/HELP
FROMCUSTOMER
SERVICE (Q35)
NUMBER OFDOCTOR/CLINIC
VISITS (Q7)CLAIMS
(Q39)DATA
COLLECTIONMETHOD
Total 0-7 8-10 0-7 8-10 0-7 8-10 0-6 7-8 9-10 Yes No Never/Sometimes
Always/Usually
Less than3 3 or More Yes No Mail Phone Internet
A B C D E F G H I J K L M N O P Q R S T
Q11. (SDM) Did you and a doctor or other health provider talk about the reasons you might not want to take a medicine?
Total Eligible92 27 65 19 72 10 77 18 30 44 37 54 6 31 28 64 59 20 92 - -
100.0%100.0%100.0%100.0%100.0%100.0%100.0%100.0%100.0%100.0% 100.0% 100.0% 100.0% 100.0% 100.0% 100.0% 100.0%100.0%100.0% - -
Total ValidResponses
92 27 65 19 72 10 77 18 30 44 37 54 6 31 28 64 59 20 92 - -100.0%100.0%100.0%100.0%100.0%100.0%100.0%100.0%100.0%100.0% 100.0% 100.0% 100.0% 100.0% 100.0% 100.0% 100.0%100.0%100.0% - -
No Answer- - - - - - - - - - - - - - - - - - - - -
Yes72 17 55 11 60 5 64 11 25 36 29 42 4 25 18 54 44 15 72 - -
78.3% 63.0% 84.6% 57.9% 83.3% 50.0% 83.1% 61.1% 83.3% 81.8% 78.4% 77.8% 66.7% 80.6% 64.3% 84.4% 74.6% 75.0% 78.3% - - ** ** ** ** ** ** **
No20 10 10 8 12 5 13 7 5 8 8 12 2 6 10 10 15 5 20 - -
21.7% 37.0% 15.4% 42.1% 16.7% 50.0% 16.9% 38.9% 16.7% 18.2% 21.6% 22.2% 33.3% 19.4% 35.7% 15.6% 25.4% 25.0% 21.7% - - ** ** ** ** ** ** **
HEDIS/CAHPSSUMMARYRATE - Yes
72 17 55 11 60 5 64 11 25 36 29 42 4 25 18 54 44 15 72 - -78.3% 63.0% 84.6% 57.9% 83.3% 50.0% 83.1% 61.1% 83.3% 81.8% 78.4% 77.8% 66.7% 80.6% 64.3% 84.4% 74.6% 75.0% 78.3% - -
** ** ** ** ** ** **
3-Point Score2.57 2.26 2.69 2.16 2.67 2.00 2.66 2.22 2.67 2.64 2.57 2.56 2.33 2.61 2.29 2.69 2.49 2.50 2.57 - -
Cell Contents: - Count- Column Percentage- Statistical Test ResultsStatistics: - Column Proportions: Columns Tested (5%): A/B, C/D, E/F, G/H/I, J/K,L/M, N/O, P/Q, R/S/T, (10%): a/b, c/d, e/f, g/h/i, j/k,l/m, n/o, p/q, r/s/t Minimum Base: 30 (**), Small Base: 30 (*)
Presented by SPH Analytics770-978-3173
2016

Q12. (SDM) When you talked about starting orstopping a prescription medicine, did a doctor orother health provider ask you what you thought wasbest for you?
Regence BCBS2016 CAHPS 5.0H Commercial Adult Survey (1113020)
Table: 78Level: Top
HEALTH PLANRATING (Q42)
HEALTHCARE
RATING(Q13)
DOCTORRATING
(Q23)
HEALTH PLANRATING BY
GLOBALPROP. (Q42)
CONTACTCUSTOMER
SERVICE(Q34)
GOTINFO/HELP
FROMCUSTOMER
SERVICE (Q35)
NUMBER OFDOCTOR/CLINIC
VISITS (Q7)CLAIMS
(Q39)DATA
COLLECTIONMETHOD
Total 0-7 8-10 0-7 8-10 0-7 8-10 0-6 7-8 9-10 Yes No Never/Sometimes
Always/Usually
Less than3 3 or More Yes No Mail Phone Internet
A B C D E F G H I J K L M N O P Q R S T
Q12. (SDM) When you talked about starting or stopping a prescription medicine, did a doctor or other health provider ask you what you thoughtwas best for you?
Total Eligible92 27 65 19 72 10 77 18 30 44 37 54 6 31 28 64 59 20 92 - -
100.0%100.0%100.0%100.0%100.0%100.0%100.0%100.0%100.0%100.0% 100.0% 100.0% 100.0% 100.0% 100.0% 100.0% 100.0%100.0%100.0% - -
Total ValidResponses
92 27 65 19 72 10 77 18 30 44 37 54 6 31 28 64 59 20 92 - -100.0%100.0%100.0%100.0%100.0%100.0%100.0%100.0%100.0%100.0% 100.0% 100.0% 100.0% 100.0% 100.0% 100.0% 100.0%100.0%100.0% - -
No Answer- - - - - - - - - - - - - - - - - - - - -
Yes75 20 55 14 60 6 66 13 25 37 29 45 5 24 20 55 50 14 75 - -
81.5% 74.1% 84.6% 73.7% 83.3% 60.0% 85.7% 72.2% 83.3% 84.1% 78.4% 83.3% 83.3% 77.4% 71.4% 85.9% 84.7% 70.0% 81.5% - - ** ** ** ** ** ** **
No17 7 10 5 12 4 11 5 5 7 8 9 1 7 8 9 9 6 17 - -
18.5% 25.9% 15.4% 26.3% 16.7% 40.0% 14.3% 27.8% 16.7% 15.9% 21.6% 16.7% 16.7% 22.6% 28.6% 14.1% 15.3% 30.0% 18.5% - - ** ** ** ** ** ** **
HEDIS/CAHPSSUMMARYRATE - Yes
75 20 55 14 60 6 66 13 25 37 29 45 5 24 20 55 50 14 75 - -81.5% 74.1% 84.6% 73.7% 83.3% 60.0% 85.7% 72.2% 83.3% 84.1% 78.4% 83.3% 83.3% 77.4% 71.4% 85.9% 84.7% 70.0% 81.5% - -
** ** ** ** ** ** **
3-Point Score2.63 2.48 2.69 2.47 2.67 2.20 2.71 2.44 2.67 2.68 2.57 2.67 2.67 2.55 2.43 2.72 2.69 2.40 2.63 - -
Cell Contents: - Count- Column Percentage- Statistical Test ResultsStatistics: - Column Proportions: Columns Tested (5%): A/B, C/D, E/F, G/H/I, J/K,L/M, N/O, P/Q, R/S/T, (10%): a/b, c/d, e/f, g/h/i, j/k,l/m, n/o, p/q, r/s/t Minimum Base: 30 (**), Small Base: 30 (*)
Presented by SPH Analytics770-978-3173
2016

Q13. What number would you use to rate all yourhealth care in the last 12 months?
Regence BCBS2016 CAHPS 5.0H Commercial Adult Survey (1113020)
Table: 79Level: Top
HEALTH PLANRATING (Q42)
HEALTHCARE
RATING(Q13)
DOCTORRATING
(Q23)
HEALTH PLANRATING BY
GLOBALPROP. (Q42)
CONTACTCUSTOMER
SERVICE(Q34)
GOTINFO/HELP
FROMCUSTOMER
SERVICE (Q35)
NUMBER OFDOCTOR/CLINIC
VISITS (Q7)CLAIMS
(Q39)DATA
COLLECTIONMETHOD
Total 0-7 8-10 0-7 8-10 0-7 8-10 0-6 7-8 9-10 Yes No Never/Sometimes
Always/Usually
Less than3 3 or More Yes No Mail Phone Internet
A B C D E F G H I J K L M N O P Q R S T
Q13. What number would you use to rate all your health care in the last 12 months?
Total Eligible164 51 113 35 128 17 137 30 58 76 65 98 10 55 64 100 105 37 164 - -
100.0%100.0%100.0%100.0%100.0%100.0%100.0%100.0%100.0%100.0% 100.0% 100.0% 100.0% 100.0% 100.0% 100.0% 100.0%100.0%100.0% - -
Total ValidResponses
163 51 112 35 128 17 136 30 58 75 65 98 10 55 64 99 104 37 163 - -100.0%100.0%100.0%100.0%100.0%100.0%100.0%100.0%100.0%100.0% 100.0% 100.0% 100.0% 100.0% 100.0% 100.0% 100.0%100.0%100.0% - -
No Answer1 - 1 - - - 1 - - 1 - - - - - 1 1 - 1 - -
10 - Besthealth carepossible
40 1 39 - 40 1 38 - 7 33 21 19 2 19 18 22 21 14 40 - -24.5% 2.0% 34.8% - 31.3% 5.9% 27.9% - 12.1% 44.0% 32.3% 19.4% 20.0% 34.5% 28.1% 22.2% 20.2% 37.8% 24.5% - -
A C ** g GH k ** P
946 8 38 - 46 2 41 4 18 24 18 28 1 17 13 33 31 11 46 - -
28.2% 15.7% 33.9% - 35.9% 11.8% 30.1% 13.3% 31.0% 32.0% 27.7% 28.6% 10.0% 30.9% 20.3% 33.3% 29.8% 29.7% 28.2% - - A C ** g g ** n
842 11 31 - 42 3 36 6 18 18 12 30 3 9 18 24 28 6 42 - -
25.8% 21.6% 27.7% - 32.8% 17.6% 26.5% 20.0% 31.0% 24.0% 18.5% 30.6% 30.0% 16.4% 28.1% 24.2% 26.9% 16.2% 25.8% - - C ** j **
720 16 4 20 - 5 14 11 9 - 8 12 2 6 9 11 13 3 20 - -
12.3% 31.4% 3.6% 57.1% - 29.4% 10.3% 36.7% 15.5% - 12.3% 12.2% 20.0% 10.9% 14.1% 11.1% 12.5% 8.1% 12.3% - - B D ** HI I **
64 4 - 4 - 1 3 - 4 - 1 3 - 1 2 2 3 1 4 - -
2.5% 7.8% - 11.4% - 5.9% 2.2% - 6.9% - 1.5% 3.1% - 1.8% 3.1% 2.0% 2.9% 2.7% 2.5% - - B D ** I **
56 6 - 6 - 3 1 5 1 - 2 4 - 2 2 4 4 1 6 - -
3.7% 11.8% - 17.1% - 17.6% 0.7% 16.7% 1.7% - 3.1% 4.1% - 3.6% 3.1% 4.0% 3.8% 2.7% 3.7% - - B D ** HI **
41 1 - 1 - 1 - - 1 - - 1 - - 1 - 1 - 1 - -
0.6% 2.0% - 2.9% - 5.9% - - 1.7% - - 1.0% - - 1.6% - 1.0% - 0.6% - - d ** **
34 4 - 4 - 1 3 4 - - 3 1 2 1 1 3 3 1 4 - -
2.5% 7.8% - 11.4% - 5.9% 2.2% 13.3% - - 4.6% 1.0% 20.0% 1.8% 1.6% 3.0% 2.9% 2.7% 2.5% - - B D ** HI **
2- - - - - - - - - - - - - - - - - - - - -- - - - - - - - - - - - - - - - - - - - - ** **
1- - - - - - - - - - - - - - - - - - - - -- - - - - - - - - - - - - - - - - - - - - ** **
0 - Worsthealth carepossible
- - - - - - - - - - - - - - - - - - - - -- - - - - - - - - - - - - - - - - - - - - ** **
SUMMARY - 0-3
4 4 - 4 - 1 3 4 - - 3 1 2 1 1 3 3 1 4 - -2.5% 7.8% - 11.4% - 5.9% 2.2% 13.3% - - 4.6% 1.0% 20.0% 1.8% 1.6% 3.0% 2.9% 2.7% 2.5% - -
B D ** HI **
SUMMARY - 4-7
31 27 4 31 - 10 18 16 15 - 11 20 2 9 14 17 21 5 31 - -19.0% 52.9% 3.6% 88.6% - 58.8% 13.2% 53.3% 25.9% - 16.9% 20.4% 20.0% 16.4% 21.9% 17.2% 20.2% 13.5% 19.0% - -
B D ** HI I ** HEDIS/CAHPSSUMMARYRATE - 8-10
128 20 108 - 128 6 115 10 43 75 51 77 6 45 49 79 80 31 128 - -78.5% 39.2% 96.4% - 100.0% 35.3% 84.6% 33.3% 74.1% 100.0% 78.5% 78.6% 60.0% 81.8% 76.6% 79.8% 76.9% 83.8% 78.5% - -
A C ** G GH ** HEDIS/CAHPSSUMMARYRATE - 9-10
86 9 77 - 86 3 79 4 25 57 39 47 3 36 31 55 52 25 86 - -52.8% 17.6% 68.8% - 67.2% 17.6% 58.1% 13.3% 43.1% 76.0% 60.0% 48.0% 30.0% 65.5% 48.4% 55.6% 50.0% 67.6% 52.8% - -
A C ** G GH ** p
3-Point Score2.44 1.88 2.69 1.57 2.67 1.82 2.53 1.83 2.33 2.76 2.51 2.39 2.10 2.58 2.39 2.46 2.39 2.59 2.44 - -
Cell Contents: - Count- Column Percentage- Statistical Test ResultsStatistics: - Column Proportions: Columns Tested (5%): A/B, C/D, E/F, G/H/I, J/K,L/M, N/O, P/Q, R/S/T, (10%): a/b, c/d, e/f, g/h/i, j/k,l/m, n/o, p/q, r/s/t Minimum Base: 30 (**), Small Base: 30 (*)
Presented by SPH Analytics770-978-3173
2016

Q14. (GNC) In the last 12 months, how often was iteasy to get the care, tests, or treatment you thoughtyou needed through your health plan?
Regence BCBS2016 CAHPS 5.0H Commercial Adult Survey (1113020)
Table: 80Level: Top
HEALTH PLANRATING (Q42)
HEALTHCARE
RATING(Q13)
DOCTORRATING
(Q23)
HEALTH PLANRATING BY
GLOBALPROP. (Q42)
CONTACTCUSTOMER
SERVICE(Q34)
GOTINFO/HELP
FROMCUSTOMER
SERVICE (Q35)
NUMBER OFDOCTOR/CLINIC
VISITS (Q7)CLAIMS
(Q39)DATA
COLLECTIONMETHOD
Total 0-7 8-10 0-7 8-10 0-7 8-10 0-6 7-8 9-10 Yes No Never/Sometimes
Always/Usually
Less than3 3 or More Yes No Mail Phone Internet
A B C D E F G H I J K L M N O P Q R S T
Q14. (GNC) In the last 12 months, how often was it easy to get the care, tests, or treatment you thought you needed through your health plan?
Total Eligible164 51 113 35 128 17 137 30 58 76 65 98 10 55 64 100 105 37 164 - -
100.0%100.0%100.0%100.0%100.0%100.0%100.0%100.0%100.0% 100.0% 100.0% 100.0% 100.0% 100.0% 100.0% 100.0% 100.0%100.0%100.0% - -
Total ValidResponses
162 49 113 34 127 16 136 29 57 76 65 96 10 55 62 100 103 37 162 - -100.0%100.0%100.0%100.0%100.0%100.0%100.0%100.0%100.0% 100.0% 100.0% 100.0% 100.0% 100.0% 100.0% 100.0% 100.0%100.0%100.0% - -
No Answer2 2 - 1 1 1 1 1 1 - - 2 - - 2 - 2 - 2 - -
Always83 15 68 9 73 5 74 7 24 52 32 50 4 28 32 51 53 22 83 - -
51.2% 30.6% 60.2% 26.5% 57.5% 31.3% 54.4% 24.1% 42.1% 68.4% 49.2% 52.1% 40.0% 50.9% 51.6% 51.0% 51.5% 59.5% 51.2% - - A C ** ** H **
Usually67 23 44 14 53 9 52 12 31 24 26 41 3 23 29 38 41 13 67 - -
41.4% 46.9% 38.9% 41.2% 41.7% 56.3% 38.2% 41.4% 54.4% 31.6% 40.0% 42.7% 30.0% 41.8% 46.8% 38.0% 39.8% 35.1% 41.4% - - ** ** I **
Sometimes9 8 1 8 1 1 8 7 2 - 4 5 1 3 - 9 6 2 9 - -
5.6% 16.3% 0.9% 23.5% 0.8% 6.3% 5.9% 24.1% 3.5% - 6.2% 5.2% 10.0% 5.5% - 9.0% 5.8% 5.4% 5.6% - - B D ** ** ** N
Never3 3 - 3 - 1 2 3 - - 3 - 2 1 1 2 3 - 3 - -
1.9% 6.1% - 8.8% - 6.3% 1.5% 10.3% - - 4.6% - 20.0% 1.8% 1.6% 2.0% 2.9% - 1.9% - - B D ** ** K **
HEDIS/CAHPSSUMMARYRATE -Always/Usually
150 38 112 23 126 14 126 19 55 76 58 91 7 51 61 89 94 35 150 - -92.6% 77.6% 99.1% 67.6% 99.2% 87.5% 92.6% 65.5% 96.5% 100.0% 89.2% 94.8% 70.0% 92.7% 98.4% 89.0% 91.3% 94.6% 92.6% - -
A C ** ** ** O
HEDIS/CAHPSSUMMARYRATE - Always
83 15 68 9 73 5 74 7 24 52 32 50 4 28 32 51 53 22 83 - -51.2% 30.6% 60.2% 26.5% 57.5% 31.3% 54.4% 24.1% 42.1% 68.4% 49.2% 52.1% 40.0% 50.9% 51.6% 51.0% 51.5% 59.5% 51.2% - -
A C ** ** H **
3-Point Score2.44 2.08 2.59 1.94 2.57 2.19 2.47 1.90 2.39 2.68 2.38 2.47 2.10 2.44 2.50 2.40 2.43 2.54 2.44 - -
Cell Contents: - Count- Column Percentage- Statistical Test ResultsStatistics: - Column Proportions: Columns Tested (5%): A/B, C/D, E/F, G/H/I, J/K,L/M, N/O, P/Q, R/S/T, (10%): a/b, c/d, e/f, g/h/i, j/k,l/m, n/o, p/q, r/s/t Minimum Base: 30 (**), Small Base: 30 (*)
Presented by SPH Analytics770-978-3173
2016

Q15. Do you have a personal doctor? Regence BCBS2016 CAHPS 5.0H Commercial Adult Survey (1113020)
Table: 81Level: Top
HEALTH PLANRATING (Q42)
HEALTHCARE
RATING(Q13)
DOCTORRATING
(Q23)
HEALTH PLANRATING BY
GLOBALPROP. (Q42)
CONTACTCUSTOMER
SERVICE(Q34)
GOTINFO/HELP
FROMCUSTOMER
SERVICE (Q35)
NUMBER OFDOCTOR/CLINIC
VISITS (Q7)CLAIMS
(Q39)DATA
COLLECTIONMETHOD
Total 0-7 8-10 0-7 8-10 0-7 8-10 0-6 7-8 9-10 Yes No Never/Sometimes
Always/Usually
Less than3 3 or More Yes No Mail Phone Internet
A B C D E F G H I J K L M N O P Q R S T
Q15. Do you have a personal doctor?
Total Eligible176 56 120 35 128 18 144 33 66 77 66 109 11 55 74 100 108 43 176 - -
100.0%100.0%100.0%100.0%100.0%100.0% 100.0%100.0%100.0%100.0% 100.0% 100.0% 100.0% 100.0% 100.0% 100.0% 100.0%100.0%100.0% - -
Total ValidResponses
176 56 120 35 128 18 144 33 66 77 66 109 11 55 74 100 108 43 176 - -100.0%100.0%100.0%100.0%100.0%100.0% 100.0%100.0%100.0%100.0% 100.0% 100.0% 100.0% 100.0% 100.0% 100.0% 100.0%100.0%100.0% - -
No Answer- - - - - - - - - - - - - - - - - - - - -
Yes164 51 113 32 123 18 144 29 61 74 64 99 11 53 69 93 100 40 164 - -
93.2% 91.1% 94.2% 91.4% 96.1% 100.0%100.0% 87.9% 92.4% 96.1% 97.0% 90.8% 100.0% 96.4% 93.2% 93.0% 92.6% 93.0% 93.2% - - ** **
No12 5 7 3 5 - - 4 5 3 2 10 - 2 5 7 8 3 12 - -
6.8% 8.9% 5.8% 8.6% 3.9% - - 12.1% 7.6% 3.9% 3.0% 9.2% - 3.6% 6.8% 7.0% 7.4% 7.0% 6.8% - - ** **
HEDIS/CAHPSSUMMARYRATE - Yes
164 51 113 32 123 18 144 29 61 74 64 99 11 53 69 93 100 40 164 - -93.2% 91.1% 94.2% 91.4% 96.1% 100.0%100.0% 87.9% 92.4% 96.1% 97.0% 90.8% 100.0% 96.4% 93.2% 93.0% 92.6% 93.0% 93.2% - -
** **
Cell Contents: - Count- Column Percentage- Statistical Test ResultsStatistics: - Column Proportions: Columns Tested (5%): A/B, C/D, E/F, G/H/I, J/K,L/M, N/O, P/Q, R/S/T, (10%): a/b, c/d, e/f, g/h/i, j/k,l/m, n/o, p/q, r/s/t Minimum Base: 30 (**), Small Base: 30 (*)
Presented by SPH Analytics770-978-3173
2016

Q16. In the last 12 months, how many times did youvisit your personal doctor to get care for yourself?
Regence BCBS2016 CAHPS 5.0H Commercial Adult Survey (1113020)
Table: 82Level: Top
HEALTH PLANRATING (Q42)
HEALTHCARE
RATING(Q13)
DOCTORRATING
(Q23)
HEALTH PLANRATING BY
GLOBALPROP. (Q42)
CONTACTCUSTOMER
SERVICE(Q34)
GOTINFO/HELP
FROMCUSTOMER
SERVICE (Q35)
NUMBER OFDOCTOR/CLINIC
VISITS (Q7)CLAIMS
(Q39)DATA
COLLECTIONMETHOD
Total 0-7 8-10 0-7 8-10 0-7 8-10 0-6 7-8 9-10 Yes No Never/Sometimes
Always/Usually
Less than3 3 or More Yes No Mail Phone Internet
A B C D E F G H I J K L M N O P Q R S T
Q16. In the last 12 months, how many times did you visit your personal doctor to get care for yourself?
Total Eligible164 51 113 32 123 18 144 29 61 74 64 99 11 53 69 93 100 40 164 - -
100.0%100.0%100.0%100.0%100.0%100.0%100.0%100.0%100.0%100.0% 100.0% 100.0% 100.0% 100.0% 100.0% 100.0% 100.0%100.0%100.0% - -
Total ValidResponses
163 51 112 32 122 18 144 29 61 73 64 98 11 53 69 92 100 39 163 - -100.0%100.0%100.0%100.0%100.0%100.0%100.0%100.0%100.0%100.0% 100.0% 100.0% 100.0% 100.0% 100.0% 100.0% 100.0%100.0%100.0% - -
No Answer1 - 1 - 1 - - - - 1 - 1 - - - 1 - 1 1 - -
None14 4 10 1 7 1 13 3 7 4 3 11 2 1 10 3 6 4 14 - -
8.6% 7.8% 8.9% 3.1% 5.7% 5.6% 9.0% 10.3% 11.5% 5.5% 4.7% 11.2% 18.2% 1.9% 14.5% 3.3% 6.0% 10.3% 8.6% - - ** ** ** O
1 time58 18 40 10 47 7 50 9 23 26 20 38 3 17 33 25 36 11 58 - -
35.6% 35.3% 35.7% 31.3% 38.5% 38.9% 34.7% 31.0% 37.7% 35.6% 31.3% 38.8% 27.3% 32.1% 47.8% 27.2% 36.0% 28.2% 35.6% - - ** ** ** O
246 13 33 11 33 7 39 6 19 21 17 28 2 15 26 19 33 11 46 - -
28.2% 25.5% 29.5% 34.4% 27.0% 38.9% 27.1% 20.7% 31.1% 28.8% 26.6% 28.6% 18.2% 28.3% 37.7% 20.7% 33.0% 28.2% 28.2% - - ** ** ** O
317 5 12 3 14 1 16 2 6 9 10 7 2 8 - 17 11 4 17 - -
10.4% 9.8% 10.7% 9.4% 11.5% 5.6% 11.1% 6.9% 9.8% 12.3% 15.6% 7.1% 18.2% 15.1% - 18.5% 11.0% 10.3% 10.4% - - ** ** k ** N
414 7 7 5 9 2 12 6 1 7 9 5 1 8 - 14 9 5 14 - -
8.6% 13.7% 6.3% 15.6% 7.4% 11.1% 8.3% 20.7% 1.6% 9.6% 14.1% 5.1% 9.1% 15.1% - 15.2% 9.0% 12.8% 8.6% - - ** ** h K ** N
5 to 913 4 9 2 11 - 13 3 5 5 4 9 1 3 - 13 4 4 13 - -
8.0% 7.8% 8.0% 6.3% 9.0% - 9.0% 10.3% 8.2% 6.8% 6.3% 9.2% 9.1% 5.7% - 14.1% 4.0% 10.3% 8.0% - - ** ** ** N
10 or moretimes
1 - 1 - 1 - 1 - - 1 1 - - 1 - 1 1 - 1 - -0.6% - 0.9% - 0.8% - 0.7% - - 1.4% 1.6% - - 1.9% - 1.1% 1.0% - 0.6% - -
** ** ** HEDIS/CAHPSSUMMARYRATE - 1 ormore times
149 47 102 31 115 17 131 26 54 69 61 87 9 52 59 89 94 35 149 - -91.4% 92.2% 91.1% 96.9% 94.3% 94.4% 91.0% 89.7% 88.5% 94.5% 95.3% 88.8% 81.8% 98.1% 85.5% 96.7% 94.0% 89.7% 91.4% - -
** ** ** N
Cell Contents: - Count- Column Percentage- Statistical Test ResultsStatistics: - Column Proportions: Columns Tested (5%): A/B, C/D, E/F, G/H/I, J/K,L/M, N/O, P/Q, R/S/T, (10%): a/b, c/d, e/f, g/h/i, j/k,l/m, n/o, p/q, r/s/t Minimum Base: 30 (**), Small Base: 30 (*)
Presented by SPH Analytics770-978-3173
2016

Q17. (HWDC) In the last 12 months, how often didyour personal doctor explain things in a way thatwas easy to understand?
Regence BCBS2016 CAHPS 5.0H Commercial Adult Survey (1113020)
Table: 83Level: Top
HEALTH PLANRATING (Q42)
HEALTHCARE
RATING(Q13)
DOCTORRATING
(Q23)
HEALTH PLANRATING BY
GLOBALPROP. (Q42)
CONTACTCUSTOMER
SERVICE(Q34)
GOTINFO/HELP
FROMCUSTOMER
SERVICE (Q35)
NUMBER OFDOCTOR/CLINIC
VISITS (Q7)CLAIMS
(Q39)DATA
COLLECTIONMETHOD
Total 0-7 8-10 0-7 8-10 0-7 8-10 0-6 7-8 9-10 Yes No Never/Sometimes
Always/Usually
Less than3 3 or More Yes No Mail Phone Internet
A B C D E F G H I J K L M N O P Q R S T
Q17. (HWDC) In the last 12 months, how often did your personal doctor explain things in a way that was easy to understand?
Total Eligible149 47 102 31 115 17 131 26 54 69 61 87 9 52 59 89 94 35 149 - -
100.0%100.0%100.0%100.0%100.0%100.0%100.0%100.0%100.0%100.0% 100.0% 100.0% 100.0% 100.0% 100.0% 100.0% 100.0%100.0%100.0% - -
Total ValidResponses
149 47 102 31 115 17 131 26 54 69 61 87 9 52 59 89 94 35 149 - -100.0%100.0%100.0%100.0%100.0%100.0%100.0%100.0%100.0%100.0% 100.0% 100.0% 100.0% 100.0% 100.0% 100.0% 100.0%100.0%100.0% - -
No Answer- - - - - - - - - - - - - - - - - - - - -
Always116 31 85 18 96 5 110 18 38 60 51 64 7 44 45 71 76 29 116 - -
77.9% 66.0% 83.3% 58.1% 83.5% 29.4% 84.0% 69.2% 70.4% 87.0% 83.6% 73.6% 77.8% 84.6% 76.3% 79.8% 80.9% 82.9% 77.9% - - A C ** ** H **
Usually27 13 14 11 16 8 19 6 14 7 8 19 1 7 13 14 13 5 27 - -
18.1% 27.7% 13.7% 35.5% 13.9% 47.1% 14.5% 23.1% 25.9% 10.1% 13.1% 21.8% 11.1% 13.5% 22.0% 15.7% 13.8% 14.3% 18.1% - - B D ** ** I **
Sometimes4 2 2 1 2 3 1 1 1 2 1 3 - 1 - 3 4 - 4 - -
2.7% 4.3% 2.0% 3.2% 1.7% 17.6% 0.8% 3.8% 1.9% 2.9% 1.6% 3.4% - 1.9% - 3.4% 4.3% - 2.7% - - ** ** **
Never2 1 1 1 1 1 1 1 1 - 1 1 1 - 1 1 1 1 2 - -
1.3% 2.1% 1.0% 3.2% 0.9% 5.9% 0.8% 3.8% 1.9% - 1.6% 1.1% 11.1% - 1.7% 1.1% 1.1% 2.9% 1.3% - - ** ** **
HEDIS/CAHPSSUMMARYRATE -Always/Usually
143 44 99 29 112 13 129 24 52 67 59 83 8 51 58 85 89 34 143 - -96.0% 93.6% 97.1% 93.5% 97.4% 76.5% 98.5% 92.3% 96.3% 97.1% 96.7% 95.4% 88.9% 98.1% 98.3% 95.5% 94.7% 97.1% 96.0% - -
** ** **
HEDIS/CAHPSSUMMARYRATE - Always
116 31 85 18 96 5 110 18 38 60 51 64 7 44 45 71 76 29 116 - -77.9% 66.0% 83.3% 58.1% 83.5% 29.4% 84.0% 69.2% 70.4% 87.0% 83.6% 73.6% 77.8% 84.6% 76.3% 79.8% 80.9% 82.9% 77.9% - -
A C ** ** H **
3-Point Score2.74 2.60 2.80 2.52 2.81 2.06 2.82 2.62 2.67 2.84 2.80 2.69 2.67 2.83 2.75 2.75 2.76 2.80 2.74 - -
Cell Contents: - Count- Column Percentage- Statistical Test ResultsStatistics: - Column Proportions: Columns Tested (5%): A/B, C/D, E/F, G/H/I, J/K,L/M, N/O, P/Q, R/S/T, (10%): a/b, c/d, e/f, g/h/i, j/k,l/m, n/o, p/q, r/s/t Minimum Base: 30 (**), Small Base: 30 (*)
Presented by SPH Analytics770-978-3173
2016

Q18. (HWDC) In the last 12 months, how often didyour personal doctor listen carefully to you?
Regence BCBS2016 CAHPS 5.0H Commercial Adult Survey (1113020)
Table: 84Level: Top
HEALTH PLANRATING (Q42)
HEALTHCARE
RATING(Q13)
DOCTORRATING
(Q23)
HEALTH PLANRATING BY
GLOBALPROP. (Q42)
CONTACTCUSTOMER
SERVICE(Q34)
GOTINFO/HELP
FROMCUSTOMER
SERVICE (Q35)
NUMBER OFDOCTOR/CLINIC
VISITS (Q7)CLAIMS
(Q39)DATA
COLLECTIONMETHOD
Total 0-7 8-10 0-7 8-10 0-7 8-10 0-6 7-8 9-10 Yes No Never/Sometimes
Always/Usually
Less than3 3 or More Yes No Mail Phone Internet
A B C D E F G H I J K L M N O P Q R S T
Q18. (HWDC) In the last 12 months, how often did your personal doctor listen carefully to you?
Total Eligible149 47 102 31 115 17 131 26 54 69 61 87 9 52 59 89 94 35 149 - -
100.0%100.0%100.0%100.0%100.0%100.0%100.0%100.0%100.0%100.0% 100.0% 100.0% 100.0% 100.0% 100.0% 100.0% 100.0%100.0%100.0% - -
Total ValidResponses
149 47 102 31 115 17 131 26 54 69 61 87 9 52 59 89 94 35 149 - -100.0%100.0%100.0%100.0%100.0%100.0%100.0%100.0%100.0%100.0% 100.0% 100.0% 100.0% 100.0% 100.0% 100.0% 100.0%100.0%100.0% - -
No Answer- - - - - - - - - - - - - - - - - - - - -
Always114 30 84 17 95 5 109 17 37 60 46 67 6 40 43 71 73 29 114 - -
76.5% 63.8% 82.4% 54.8% 82.6% 29.4% 83.2% 65.4% 68.5% 87.0% 75.4% 77.0% 66.7% 76.9% 72.9% 79.8% 77.7% 82.9% 76.5% - - A C ** ** H **
Usually26 12 14 10 16 4 21 7 12 7 13 13 2 11 13 13 13 5 26 - -
17.4% 25.5% 13.7% 32.3% 13.9% 23.5% 16.0% 26.9% 22.2% 10.1% 21.3% 14.9% 22.2% 21.2% 22.0% 14.6% 13.8% 14.3% 17.4% - - b D ** ** i **
Sometimes7 4 3 3 3 6 1 1 5 1 1 6 - 1 3 3 6 1 7 - -
4.7% 8.5% 2.9% 9.7% 2.6% 35.3% 0.8% 3.8% 9.3% 1.4% 1.6% 6.9% - 1.9% 5.1% 3.4% 6.4% 2.9% 4.7% - - d ** ** I **
Never2 1 1 1 1 2 - 1 - 1 1 1 1 - - 2 2 - 2 - -
1.3% 2.1% 1.0% 3.2% 0.9% 11.8% - 3.8% - 1.4% 1.6% 1.1% 11.1% - - 2.2% 2.1% - 1.3% - - ** ** **
HEDIS/CAHPSSUMMARYRATE -Always/Usually
140 42 98 27 111 9 130 24 49 67 59 80 8 51 56 84 86 34 140 - -94.0% 89.4% 96.1% 87.1% 96.5% 52.9% 99.2% 92.3% 90.7% 97.1% 96.7% 92.0% 88.9% 98.1% 94.9% 94.4% 91.5% 97.1% 94.0% - -
C ** ** **
HEDIS/CAHPSSUMMARYRATE - Always
114 30 84 17 95 5 109 17 37 60 46 67 6 40 43 71 73 29 114 - -76.5% 63.8% 82.4% 54.8% 82.6% 29.4% 83.2% 65.4% 68.5% 87.0% 75.4% 77.0% 66.7% 76.9% 72.9% 79.8% 77.7% 82.9% 76.5% - -
A C ** ** H **
3-Point Score2.70 2.53 2.78 2.42 2.79 1.82 2.82 2.58 2.59 2.84 2.72 2.69 2.56 2.75 2.68 2.74 2.69 2.80 2.70 - -
Cell Contents: - Count- Column Percentage- Statistical Test ResultsStatistics: - Column Proportions: Columns Tested (5%): A/B, C/D, E/F, G/H/I, J/K,L/M, N/O, P/Q, R/S/T, (10%): a/b, c/d, e/f, g/h/i, j/k,l/m, n/o, p/q, r/s/t Minimum Base: 30 (**), Small Base: 30 (*)
Presented by SPH Analytics770-978-3173
2016

Q19. (HWDC) In the last 12 months, how often didyour personal doctor show respect for what you hadto say?
Regence BCBS2016 CAHPS 5.0H Commercial Adult Survey (1113020)
Table: 85Level: Top
HEALTH PLANRATING (Q42)
HEALTHCARE
RATING(Q13)
DOCTORRATING
(Q23)
HEALTH PLANRATING BY
GLOBALPROP. (Q42)
CONTACTCUSTOMER
SERVICE(Q34)
GOTINFO/HELP
FROMCUSTOMER
SERVICE (Q35)
NUMBER OFDOCTOR/CLINIC
VISITS (Q7)CLAIMS
(Q39)DATA
COLLECTIONMETHOD
Total 0-7 8-10 0-7 8-10 0-7 8-10 0-6 7-8 9-10 Yes No Never/Sometimes
Always/Usually
Less than3 3 or More Yes No Mail Phone Internet
A B C D E F G H I J K L M N O P Q R S T
Q19. (HWDC) In the last 12 months, how often did your personal doctor show respect for what you had to say?
Total Eligible149 47 102 31 115 17 131 26 54 69 61 87 9 52 59 89 94 35 149 - -
100.0%100.0%100.0%100.0%100.0%100.0%100.0%100.0%100.0%100.0% 100.0% 100.0% 100.0% 100.0% 100.0% 100.0% 100.0% 100.0% 100.0% - -
Total ValidResponses
149 47 102 31 115 17 131 26 54 69 61 87 9 52 59 89 94 35 149 - -100.0%100.0%100.0%100.0%100.0%100.0%100.0%100.0%100.0%100.0% 100.0% 100.0% 100.0% 100.0% 100.0% 100.0% 100.0% 100.0% 100.0% - -
No Answer- - - - - - - - - - - - - - - - - - - - -
Always123 34 89 19 102 4 118 19 43 61 51 71 7 44 47 76 75 33 123 - -
82.6% 72.3% 87.3% 61.3% 88.7% 23.5% 90.1% 73.1% 79.6% 88.4% 83.6% 81.6% 77.8% 84.6% 79.7% 85.4% 79.8% 94.3% 82.6% - - A C ** ** ** P
Usually21 10 11 10 11 8 13 6 9 6 9 12 1 8 11 10 14 2 21 - -
14.1% 21.3% 10.8% 32.3% 9.6% 47.1% 9.9% 23.1% 16.7% 8.7% 14.8% 13.8% 11.1% 15.4% 18.6% 11.2% 14.9% 5.7% 14.1% - - b D ** ** **
Sometimes4 2 2 1 2 4 - - 2 2 - 4 - - 1 2 4 - 4 - -
2.7% 4.3% 2.0% 3.2% 1.7% 23.5% - - 3.7% 2.9% - 4.6% - - 1.7% 2.2% 4.3% - 2.7% - - ** ** j **
Never1 1 - 1 - 1 - 1 - - 1 - 1 - - 1 1 - 1 - -
0.7% 2.1% - 3.2% - 5.9% - 3.8% - - 1.6% - 11.1% - - 1.1% 1.1% - 0.7% - - d ** ** **
HEDIS/CAHPSSUMMARYRATE -Always/Usually
144 44 100 29 113 12 131 25 52 67 60 83 8 52 58 86 89 35 144 - -96.6% 93.6% 98.0% 93.5% 98.3% 70.6% 100.0% 96.2% 96.3% 97.1% 98.4% 95.4% 88.9% 100.0% 98.3% 96.6% 94.7% 100.0% 96.6% - -
** ** **
HEDIS/CAHPSSUMMARYRATE - Always
123 34 89 19 102 4 118 19 43 61 51 71 7 44 47 76 75 33 123 - -82.6% 72.3% 87.3% 61.3% 88.7% 23.5% 90.1% 73.1% 79.6% 88.4% 83.6% 81.6% 77.8% 84.6% 79.7% 85.4% 79.8% 94.3% 82.6% - -
A C ** ** ** P
3-Point Score2.79 2.66 2.85 2.55 2.87 1.94 2.90 2.69 2.76 2.86 2.82 2.77 2.67 2.85 2.78 2.82 2.74 2.94 2.79 - -
Cell Contents: - Count- Column Percentage- Statistical Test ResultsStatistics: - Column Proportions: Columns Tested (5%): A/B, C/D, E/F, G/H/I, J/K,L/M, N/O, P/Q, R/S/T, (10%): a/b, c/d, e/f, g/h/i, j/k,l/m, n/o, p/q, r/s/t Minimum Base: 30 (**), Small Base: 30 (*)
Presented by SPH Analytics770-978-3173
2016

Q20. (HWDC) In the last 12 months, how often didyour personal doctor spend enough time with you?
Regence BCBS2016 CAHPS 5.0H Commercial Adult Survey (1113020)
Table: 86Level: Top
HEALTH PLANRATING (Q42)
HEALTHCARE
RATING(Q13)
DOCTORRATING
(Q23)
HEALTH PLANRATING BY
GLOBALPROP. (Q42)
CONTACTCUSTOMER
SERVICE(Q34)
GOTINFO/HELP
FROMCUSTOMER
SERVICE (Q35)
NUMBER OFDOCTOR/CLINIC
VISITS (Q7)CLAIMS
(Q39)DATA
COLLECTIONMETHOD
Total 0-7 8-10 0-7 8-10 0-7 8-10 0-6 7-8 9-10 Yes No Never/Sometimes
Always/Usually
Less than3 3 or More Yes No Mail Phone Internet
A B C D E F G H I J K L M N O P Q R S T
Q20. (HWDC) In the last 12 months, how often did your personal doctor spend enough time with you?
Total Eligible149 47 102 31 115 17 131 26 54 69 61 87 9 52 59 89 94 35 149 - -
100.0%100.0%100.0%100.0%100.0%100.0%100.0%100.0%100.0%100.0% 100.0% 100.0% 100.0% 100.0% 100.0% 100.0% 100.0%100.0%100.0% - -
Total ValidResponses
149 47 102 31 115 17 131 26 54 69 61 87 9 52 59 89 94 35 149 - -100.0%100.0%100.0%100.0%100.0%100.0%100.0%100.0%100.0%100.0% 100.0% 100.0% 100.0% 100.0% 100.0% 100.0% 100.0%100.0%100.0% - -
No Answer- - - - - - - - - - - - - - - - - - - - -
Always105 29 76 16 88 4 101 18 30 57 47 57 5 42 35 70 67 28 105 - -
70.5% 61.7% 74.5% 51.6% 76.5% 23.5% 77.1% 69.2% 55.6% 82.6% 77.0% 65.5% 55.6% 80.8% 59.3% 78.7% 71.3% 80.0% 70.5% - - C ** ** H ** N
Usually32 13 19 10 20 7 24 4 19 9 8 24 2 6 21 10 18 6 32 - -
21.5% 27.7% 18.6% 32.3% 17.4% 41.2% 18.3% 15.4% 35.2% 13.0% 13.1% 27.6% 22.2% 11.5% 35.6% 11.2% 19.1% 17.1% 21.5% - - d ** ** I J ** O
Sometimes9 2 7 2 7 3 6 1 5 3 4 5 1 3 2 7 6 1 9 - -
6.0% 4.3% 6.9% 6.5% 6.1% 17.6% 4.6% 3.8% 9.3% 4.3% 6.6% 5.7% 11.1% 5.8% 3.4% 7.9% 6.4% 2.9% 6.0% - - ** ** **
Never3 3 - 3 - 3 - 3 - - 2 1 1 1 1 2 3 - 3 - -
2.0% 6.4% - 9.7% - 17.6% - 11.5% - - 3.3% 1.1% 11.1% 1.9% 1.7% 2.2% 3.2% - 2.0% - - B D ** ** **
HEDIS/CAHPSSUMMARYRATE -Always/Usually
137 42 95 26 108 11 125 22 49 66 55 81 7 48 56 80 85 34 137 - -91.9% 89.4% 93.1% 83.9% 93.9% 64.7% 95.4% 84.6% 90.7% 95.7% 90.2% 93.1% 77.8% 92.3% 94.9% 89.9% 90.4% 97.1% 91.9% - -
c ** ** **
HEDIS/CAHPSSUMMARYRATE - Always
105 29 76 16 88 4 101 18 30 57 47 57 5 42 35 70 67 28 105 - -70.5% 61.7% 74.5% 51.6% 76.5% 23.5% 77.1% 69.2% 55.6% 82.6% 77.0% 65.5% 55.6% 80.8% 59.3% 78.7% 71.3% 80.0% 70.5% - -
C ** ** H ** N
3-Point Score2.62 2.51 2.68 2.35 2.70 1.88 2.73 2.54 2.46 2.78 2.67 2.59 2.33 2.73 2.54 2.69 2.62 2.77 2.62 - -
Cell Contents: - Count- Column Percentage- Statistical Test ResultsStatistics: - Column Proportions: Columns Tested (5%): A/B, C/D, E/F, G/H/I, J/K,L/M, N/O, P/Q, R/S/T, (10%): a/b, c/d, e/f, g/h/i, j/k,l/m, n/o, p/q, r/s/t Minimum Base: 30 (**), Small Base: 30 (*)
Presented by SPH Analytics770-978-3173
2016

Q21. In the last 12 months, did you get care from adoctor or other health provider besides your personaldoctor?
Regence BCBS2016 CAHPS 5.0H Commercial Adult Survey (1113020)
Table: 87Level: Top
HEALTH PLANRATING (Q42)
HEALTHCARE
RATING(Q13)
DOCTORRATING
(Q23)
HEALTH PLANRATING BY
GLOBALPROP. (Q42)
CONTACTCUSTOMER
SERVICE(Q34)
GOTINFO/HELP
FROMCUSTOMER
SERVICE (Q35)
NUMBER OFDOCTOR/CLINIC
VISITS (Q7)CLAIMS
(Q39)DATA
COLLECTIONMETHOD
Total 0-7 8-10 0-7 8-10 0-7 8-10 0-6 7-8 9-10 Yes No Never/Sometimes
Always/Usually
Less than3 3 or More Yes No Mail Phone Internet
A B C D E F G H I J K L M N O P Q R S T
Q21. In the last 12 months, did you get care from a doctor or other health provider besides your personal doctor?
Total Eligible149 47 102 31 115 17 131 26 54 69 61 87 9 52 59 89 94 35 149 - -
100.0%100.0%100.0%100.0%100.0%100.0%100.0%100.0%100.0%100.0% 100.0% 100.0% 100.0% 100.0% 100.0% 100.0% 100.0%100.0%100.0% - -
Total ValidResponses
149 47 102 31 115 17 131 26 54 69 61 87 9 52 59 89 94 35 149 - -100.0%100.0%100.0%100.0%100.0%100.0%100.0%100.0%100.0%100.0% 100.0% 100.0% 100.0% 100.0% 100.0% 100.0% 100.0%100.0%100.0% - -
No Answer- - - - - - - - - - - - - - - - - - - - -
Yes107 33 74 22 83 11 95 21 37 49 45 61 6 39 26 81 70 20 107 - -
71.8% 70.2% 72.5% 71.0% 72.2% 64.7% 72.5% 80.8% 68.5% 71.0% 73.8% 70.1% 66.7% 75.0% 44.1% 91.0% 74.5% 57.1% 71.8% - - ** ** ** N q
No42 14 28 9 32 6 36 5 17 20 16 26 3 13 33 8 24 15 42 - -
28.2% 29.8% 27.5% 29.0% 27.8% 35.3% 27.5% 19.2% 31.5% 29.0% 26.2% 29.9% 33.3% 25.0% 55.9% 9.0% 25.5% 42.9% 28.2% - - ** ** ** O p
HEDIS/CAHPSSUMMARYRATE - Yes
107 33 74 22 83 11 95 21 37 49 45 61 6 39 26 81 70 20 107 - -71.8% 70.2% 72.5% 71.0% 72.2% 64.7% 72.5% 80.8% 68.5% 71.0% 73.8% 70.1% 66.7% 75.0% 44.1% 91.0% 74.5% 57.1% 71.8% - -
** ** ** N q
Cell Contents: - Count- Column Percentage- Statistical Test ResultsStatistics: - Column Proportions: Columns Tested (5%): A/B, C/D, E/F, G/H/I, J/K,L/M, N/O, P/Q, R/S/T, (10%): a/b, c/d, e/f, g/h/i, j/k,l/m, n/o, p/q, r/s/t Minimum Base: 30 (**), Small Base: 30 (*)
Presented by SPH Analytics770-978-3173
2016

Q22. (CC) In the last 12 months, how often did yourpersonal doctor seem informed and up-to-date aboutthe care you got from these doctors or other healthproviders?
Regence BCBS2016 CAHPS 5.0H Commercial Adult Survey (1113020)
Table: 88Level: Top
HEALTH PLANRATING (Q42)
HEALTHCARE
RATING(Q13)
DOCTORRATING
(Q23)
HEALTH PLANRATING BY
GLOBALPROP. (Q42)
CONTACTCUSTOMER
SERVICE(Q34)
GOTINFO/HELP
FROMCUSTOMER
SERVICE (Q35)
NUMBER OFDOCTOR/CLINIC
VISITS (Q7)CLAIMS
(Q39)DATA
COLLECTIONMETHOD
Total 0-7 8-10 0-7 8-10 0-7 8-10 0-6 7-8 9-10 Yes No Never/Sometimes
Always/Usually
Less than3 3 or More Yes No Mail Phone Internet
A B C D E F G H I J K L M N O P Q R S T
Q22. (CC) In the last 12 months, how often did your personal doctor seem informed and up-to-date about the care you got from these doctors orother health providers?
Total Eligible107 33 74 22 83 11 95 21 37 49 45 61 6 39 26 81 70 20 107 - -
100.0%100.0%100.0%100.0%100.0%100.0%100.0%100.0%100.0%100.0% 100.0% 100.0% 100.0% 100.0% 100.0% 100.0% 100.0% 100.0% 100.0% - -
Total ValidResponses
105 32 73 21 82 11 93 20 37 48 45 59 6 39 24 81 70 18 105 - -100.0%100.0%100.0%100.0%100.0%100.0%100.0%100.0%100.0%100.0% 100.0% 100.0% 100.0% 100.0% 100.0% 100.0% 100.0% 100.0% 100.0% - -
No Answer2 1 1 1 1 - 2 1 - 1 - 2 - - 2 - - 2 2 - -
Always53 11 42 3 49 1 52 6 16 31 23 29 2 21 14 39 35 11 53 - -
50.5% 34.4% 57.5% 14.3% 59.8% 9.1% 55.9% 30.0% 43.2% 64.6% 51.1% 49.2% 33.3% 53.8% 58.3% 48.1% 50.0% 61.1% 50.5% - - A ** ** ** h ** ** **
Usually36 14 22 12 24 2 33 10 16 10 15 21 2 13 8 28 21 7 36 - -
34.3% 43.8% 30.1% 57.1% 29.3% 18.2% 35.5% 50.0% 43.2% 20.8% 33.3% 35.6% 33.3% 33.3% 33.3% 34.6% 30.0% 38.9% 34.3% - - ** ** ** I ** ** **
Sometimes8 3 5 3 5 4 4 1 3 4 3 5 1 2 1 7 7 - 8 - -
7.6% 9.4% 6.8% 14.3% 6.1% 36.4% 4.3% 5.0% 8.1% 8.3% 6.7% 8.5% 16.7% 5.1% 4.2% 8.6% 10.0% - 7.6% - - ** ** ** ** ** **
Never8 4 4 3 4 4 4 3 2 3 4 4 1 3 1 7 7 - 8 - -
7.6% 12.5% 5.5% 14.3% 4.9% 36.4% 4.3% 15.0% 5.4% 6.3% 8.9% 6.8% 16.7% 7.7% 4.2% 8.6% 10.0% - 7.6% - - ** ** ** ** ** **
HEDIS/CAHPSSUMMARYRATE -Always/Usually
89 25 64 15 73 3 85 16 32 41 38 50 4 34 22 67 56 18 89 - -84.8% 78.1% 87.7% 71.4% 89.0% 27.3% 91.4% 80.0% 86.5% 85.4% 84.4% 84.7% 66.7% 87.2% 91.7% 82.7% 80.0% 100.0% 84.8% - -
** ** ** ** ** **
HEDIS/CAHPSSUMMARYRATE - Always
53 11 42 3 49 1 52 6 16 31 23 29 2 21 14 39 35 11 53 - -50.5% 34.4% 57.5% 14.3% 59.8% 9.1% 55.9% 30.0% 43.2% 64.6% 51.1% 49.2% 33.3% 53.8% 58.3% 48.1% 50.0% 61.1% 50.5% - -
A ** ** ** h ** ** **
3-Point Score2.35 2.13 2.45 1.86 2.49 1.36 2.47 2.10 2.30 2.50 2.36 2.34 2.00 2.41 2.50 2.31 2.30 2.61 2.35 - -
Cell Contents: - Count- Column Percentage- Statistical Test ResultsStatistics: - Column Proportions: Columns Tested (5%): A/B, C/D, E/F, G/H/I, J/K,L/M, N/O, P/Q, R/S/T, (10%): a/b, c/d, e/f, g/h/i, j/k,l/m, n/o, p/q, r/s/t Minimum Base: 30 (**), Small Base: 30 (*)
Presented by SPH Analytics770-978-3173
2016

Q23. What number would you use to rate yourpersonal doctor?
Regence BCBS2016 CAHPS 5.0H Commercial Adult Survey (1113020)
Table: 89Level: Top
HEALTH PLANRATING (Q42)
HEALTHCARE
RATING(Q13)
DOCTORRATING
(Q23)
HEALTH PLANRATING BY
GLOBALPROP. (Q42)
CONTACTCUSTOMER
SERVICE(Q34)
GOTINFO/HELP
FROMCUSTOMER
SERVICE (Q35)
NUMBER OFDOCTOR/CLINIC
VISITS (Q7)CLAIMS
(Q39)DATA
COLLECTIONMETHOD
Total 0-7 8-10 0-7 8-10 0-7 8-10 0-6 7-8 9-10 Yes No Never/Sometimes
Always/Usually
Less than3 3 or More Yes No Mail Phone Internet
A B C D E F G H I J K L M N O P Q R S T
Q23. What number would you use to rate your personal doctor?
Total Eligible164 51 113 32 123 18 144 29 61 74 64 99 11 53 69 93 100 40 164 - -
100.0%100.0%100.0%100.0%100.0%100.0%100.0%100.0%100.0%100.0% 100.0% 100.0% 100.0% 100.0% 100.0% 100.0% 100.0%100.0%100.0% - -
Total ValidResponses
162 50 112 32 121 18 144 29 60 73 64 97 11 53 68 92 100 39 162 - -100.0%100.0%100.0%100.0%100.0%100.0%100.0%100.0%100.0%100.0% 100.0% 100.0% 100.0% 100.0% 100.0% 100.0% 100.0%100.0%100.0% - -
No Answer2 1 1 - 2 - - - 1 1 - 2 - - 1 1 - 1 2 - -
10 - Bestpersonaldoctorpossible
71 11 60 3 64 - 71 6 20 45 29 41 3 26 31 40 38 23 71 - -43.8% 22.0% 53.6% 9.4% 52.9% - 49.3% 20.7% 33.3% 61.6% 45.3% 42.3% 27.3% 49.1% 45.6% 43.5% 38.0% 59.0% 43.8% - -
A C ** ** H ** P
943 15 28 7 34 - 43 9 18 16 12 31 1 11 16 27 27 11 43 - -
26.5% 30.0% 25.0% 21.9% 28.1% - 29.9% 31.0% 30.0% 21.9% 18.8% 32.0% 9.1% 20.8% 23.5% 29.3% 27.0% 28.2% 26.5% - - ** ** j **
830 12 18 11 17 - 30 9 12 9 15 15 6 9 14 15 22 2 30 - -
18.5% 24.0% 16.1% 34.4% 14.0% - 20.8% 31.0% 20.0% 12.3% 23.4% 15.5% 54.5% 17.0% 20.6% 16.3% 22.0% 5.1% 18.5% - - D ** ** ** Q
78 6 2 6 1 8 - 2 5 1 3 5 - 3 3 4 5 1 8 - -
4.9% 12.0% 1.8% 18.8% 0.8% 44.4% - 6.9% 8.3% 1.4% 4.7% 5.2% - 5.7% 4.4% 4.3% 5.0% 2.6% 4.9% - - B D ** ** i **
64 3 1 2 2 4 - 1 3 - 3 1 - 3 2 2 3 1 4 - -
2.5% 6.0% 0.9% 6.3% 1.7% 22.2% - 3.4% 5.0% - 4.7% 1.0% - 5.7% 2.9% 2.2% 3.0% 2.6% 2.5% - - b ** ** i **
53 1 2 1 2 3 - - 2 1 1 2 - 1 2 1 2 1 3 - -
1.9% 2.0% 1.8% 3.1% 1.7% 16.7% - - 3.3% 1.4% 1.6% 2.1% - 1.9% 2.9% 1.1% 2.0% 2.6% 1.9% - - ** ** **
41 1 - 1 - 1 - 1 - - - 1 - - - 1 1 - 1 - -
0.6% 2.0% - 3.1% - 5.6% - 3.4% - - - 1.0% - - - 1.1% 1.0% - 0.6% - - d ** ** **
31 - 1 - 1 1 - - - 1 - 1 - - - 1 1 - 1 - -
0.6% - 0.9% - 0.8% 5.6% - - - 1.4% - 1.0% - - - 1.1% 1.0% - 0.6% - - ** ** **
2- - - - - - - - - - - - - - - - - - - - -- - - - - - - - - - - - - - - - - - - - - ** ** **
1- - - - - - - - - - - - - - - - - - - - -- - - - - - - - - - - - - - - - - - - - - ** ** **
0 - Worstpersonaldoctorpossible
1 1 - 1 - 1 - 1 - - 1 - 1 - - 1 1 - 1 - -0.6% 2.0% - 3.1% - 5.6% - 3.4% - - 1.6% - 9.1% - - 1.1% 1.0% - 0.6% - -
d ** ** **
SUMMARY - 0-3
2 1 1 1 1 2 - 1 - 1 1 1 1 - - 2 2 - 2 - -1.2% 2.0% 0.9% 3.1% 0.8% 11.1% - 3.4% - 1.4% 1.6% 1.0% 9.1% - - 2.2% 2.0% - 1.2% - -
** ** **
SUMMARY - 4-7
16 11 5 10 5 16 - 4 10 2 7 9 - 7 7 8 11 3 16 - -9.9% 22.0% 4.5% 31.3% 4.1% 88.9% - 13.8% 16.7% 2.7% 10.9% 9.3% - 13.2% 10.3% 8.7% 11.0% 7.7% 9.9% - -
B D ** ** I ** HEDIS/CAHPSSUMMARYRATE - 8-10
144 38 106 21 115 - 144 24 50 70 56 87 10 46 61 82 87 36 144 - -88.9% 76.0% 94.6% 65.6% 95.0% - 100.0% 82.8% 83.3% 95.9% 87.5% 89.7% 90.9% 86.8% 89.7% 89.1% 87.0% 92.3% 88.9% - -
A C ** ** H ** HEDIS/CAHPSSUMMARYRATE - 9-10
114 26 88 10 98 - 114 15 38 61 41 72 4 37 47 67 65 34 114 - -70.4% 52.0% 78.6% 31.3% 81.0% - 79.2% 51.7% 63.3% 83.6% 64.1% 74.2% 36.4% 69.8% 69.1% 72.8% 65.0% 87.2% 70.4% - -
A C ** ** H ** P
3-Point Score2.64 2.40 2.75 2.16 2.77 1.44 2.79 2.41 2.55 2.81 2.56 2.69 2.27 2.62 2.63 2.66 2.57 2.82 2.64 - -
Cell Contents: - Count- Column Percentage- Statistical Test ResultsStatistics: - Column Proportions: Columns Tested (5%): A/B, C/D, E/F, G/H/I, J/K,L/M, N/O, P/Q, R/S/T, (10%): a/b, c/d, e/f, g/h/i, j/k,l/m, n/o, p/q, r/s/t Minimum Base: 30 (**), Small Base: 30 (*)
Presented by SPH Analytics770-978-3173
2016

Q24. In the last 12 months, did you make anyappointments to see a specialist?
Regence BCBS2016 CAHPS 5.0H Commercial Adult Survey (1113020)
Table: 90Level: Top
HEALTH PLANRATING (Q42)
HEALTHCARE
RATING(Q13)
DOCTORRATING
(Q23)
HEALTH PLANRATING BY
GLOBALPROP. (Q42)
CONTACTCUSTOMER
SERVICE(Q34)
GOTINFO/HELP
FROMCUSTOMER
SERVICE (Q35)
NUMBER OFDOCTOR/CLINIC
VISITS (Q7)CLAIMS
(Q39)DATA
COLLECTIONMETHOD
Total 0-7 8-10 0-7 8-10 0-7 8-10 0-6 7-8 9-10 Yes No Never/Sometimes
Always/Usually
Less than3 3 or More Yes No Mail Phone Internet
A B C D E F G H I J K L M N O P Q R S T
Q24. In the last 12 months, did you make any appointments to see a specialist?
Total Eligible176 56 120 35 128 18 144 33 66 77 66 109 11 55 74 100 108 43 176 - -
100.0%100.0%100.0%100.0%100.0%100.0%100.0%100.0%100.0%100.0% 100.0% 100.0% 100.0% 100.0% 100.0% 100.0% 100.0%100.0%100.0% - -
Total ValidResponses
175 55 120 35 127 18 144 33 65 77 66 108 11 55 73 100 108 43 175 - -100.0%100.0%100.0%100.0%100.0%100.0%100.0%100.0%100.0%100.0% 100.0% 100.0% 100.0% 100.0% 100.0% 100.0% 100.0%100.0%100.0% - -
No Answer1 1 - - 1 - - - 1 - - 1 - - 1 - - - 1 - -
Yes115 34 81 21 91 12 97 23 35 57 50 65 8 42 30 83 79 22 115 - -
65.7% 61.8% 67.5% 60.0% 71.7% 66.7% 67.4% 69.7% 53.8% 74.0% 75.8% 60.2% 72.7% 76.4% 41.1% 83.0% 73.1% 51.2% 65.7% - - ** H K ** N Q
No60 21 39 14 36 6 47 10 30 20 16 43 3 13 43 17 29 21 60 - -
34.3% 38.2% 32.5% 40.0% 28.3% 33.3% 32.6% 30.3% 46.2% 26.0% 24.2% 39.8% 27.3% 23.6% 58.9% 17.0% 26.9% 48.8% 34.3% - - ** I J ** O P
HEDIS/CAHPSSUMMARYRATE - Yes
115 34 81 21 91 12 97 23 35 57 50 65 8 42 30 83 79 22 115 - -65.7% 61.8% 67.5% 60.0% 71.7% 66.7% 67.4% 69.7% 53.8% 74.0% 75.8% 60.2% 72.7% 76.4% 41.1% 83.0% 73.1% 51.2% 65.7% - -
** H K ** N Q
Cell Contents: - Count- Column Percentage- Statistical Test ResultsStatistics: - Column Proportions: Columns Tested (5%): A/B, C/D, E/F, G/H/I, J/K,L/M, N/O, P/Q, R/S/T, (10%): a/b, c/d, e/f, g/h/i, j/k,l/m, n/o, p/q, r/s/t Minimum Base: 30 (**), Small Base: 30 (*)
Presented by SPH Analytics770-978-3173
2016

Q25. (GNC) In the last 12 months, how often did youget an appointment to see a specialist as soon asyou needed?
Regence BCBS2016 CAHPS 5.0H Commercial Adult Survey (1113020)
Table: 91Level: Top
HEALTH PLANRATING (Q42)
HEALTHCARE
RATING(Q13)
DOCTORRATING
(Q23)
HEALTH PLANRATING BY
GLOBALPROP. (Q42)
CONTACTCUSTOMER
SERVICE(Q34)
GOTINFO/HELP
FROMCUSTOMER
SERVICE (Q35)
NUMBER OFDOCTOR/CLINIC
VISITS (Q7)CLAIMS
(Q39)DATA
COLLECTIONMETHOD
Total 0-7 8-10 0-7 8-10 0-7 8-10 0-6 7-8 9-10 Yes No Never/Sometimes
Always/Usually
Less than3 3 or More Yes No Mail Phone Internet
A B C D E F G H I J K L M N O P Q R S T
Q25. (GNC) In the last 12 months, how often did you get an appointment to see a specialist as soon as you needed?
Total Eligible115 34 81 21 91 12 97 23 35 57 50 65 8 42 30 83 79 22 115 - -
100.0%100.0%100.0%100.0%100.0%100.0%100.0%100.0%100.0%100.0% 100.0% 100.0% 100.0% 100.0% 100.0% 100.0% 100.0%100.0%100.0% - -
Total ValidResponses
114 34 80 21 90 12 97 23 35 56 50 64 8 42 30 82 79 21 114 - -100.0%100.0%100.0%100.0%100.0%100.0%100.0%100.0%100.0%100.0% 100.0% 100.0% 100.0% 100.0% 100.0% 100.0% 100.0%100.0%100.0% - -
No Answer1 - 1 - 1 - - - - 1 - 1 - - - 1 - 1 1 - -
Always51 6 45 4 47 2 47 6 13 32 24 27 1 23 12 39 34 12 51 - -
44.7% 17.6% 56.3% 19.0% 52.2% 16.7% 48.5% 26.1% 37.1% 57.1% 48.0% 42.2% 12.5% 54.8% 40.0% 47.6% 43.0% 57.1% 44.7% - - A ** ** ** h ** **
Usually39 15 24 7 29 6 31 8 15 16 14 25 3 11 11 26 27 5 39 - -
34.2% 44.1% 30.0% 33.3% 32.2% 50.0% 32.0% 34.8% 42.9% 28.6% 28.0% 39.1% 37.5% 26.2% 36.7% 31.7% 34.2% 23.8% 34.2% - - ** ** ** ** **
Sometimes20 10 10 8 12 4 15 8 5 7 11 9 4 7 6 14 15 3 20 - -
17.5% 29.4% 12.5% 38.1% 13.3% 33.3% 15.5% 34.8% 14.3% 12.5% 22.0% 14.1% 50.0% 16.7% 20.0% 17.1% 19.0% 14.3% 17.5% - - B ** ** ** ** **
Never4 3 1 2 2 - 4 1 2 1 1 3 - 1 1 3 3 1 4 - -
3.5% 8.8% 1.3% 9.5% 2.2% - 4.1% 4.3% 5.7% 1.8% 2.0% 4.7% - 2.4% 3.3% 3.7% 3.8% 4.8% 3.5% - - B ** ** ** ** **
HEDIS/CAHPSSUMMARYRATE -Always/Usually
90 21 69 11 76 8 78 14 28 48 38 52 4 34 23 65 61 17 90 - -78.9% 61.8% 86.3% 52.4% 84.4% 66.7% 80.4% 60.9% 80.0% 85.7% 76.0% 81.3% 50.0% 81.0% 76.7% 79.3% 77.2% 81.0% 78.9% - -
A ** ** ** ** **
HEDIS/CAHPSSUMMARYRATE - Always
51 6 45 4 47 2 47 6 13 32 24 27 1 23 12 39 34 12 51 - -44.7% 17.6% 56.3% 19.0% 52.2% 16.7% 48.5% 26.1% 37.1% 57.1% 48.0% 42.2% 12.5% 54.8% 40.0% 47.6% 43.0% 57.1% 44.7% - -
A ** ** ** h ** **
3-Point Score2.24 1.79 2.43 1.71 2.37 1.83 2.29 1.87 2.17 2.43 2.24 2.23 1.63 2.36 2.17 2.27 2.20 2.38 2.24 - -
Cell Contents: - Count- Column Percentage- Statistical Test ResultsStatistics: - Column Proportions: Columns Tested (5%): A/B, C/D, E/F, G/H/I, J/K,L/M, N/O, P/Q, R/S/T, (10%): a/b, c/d, e/f, g/h/i, j/k,l/m, n/o, p/q, r/s/t Minimum Base: 30 (**), Small Base: 30 (*)
Presented by SPH Analytics770-978-3173
2016

Q26. How many specialists have you seen in thelast 12 months?
Regence BCBS2016 CAHPS 5.0H Commercial Adult Survey (1113020)
Table: 92Level: Top
HEALTH PLANRATING (Q42)
HEALTHCARE
RATING(Q13)
DOCTORRATING
(Q23)
HEALTH PLANRATING BY
GLOBALPROP. (Q42)
CONTACTCUSTOMER
SERVICE(Q34)
GOTINFO/HELP
FROMCUSTOMER
SERVICE (Q35)
NUMBER OFDOCTOR/CLINIC
VISITS (Q7)CLAIMS
(Q39)DATA
COLLECTIONMETHOD
Total 0-7 8-10 0-7 8-10 0-7 8-10 0-6 7-8 9-10 Yes No Never/Sometimes
Always/Usually
Less than3 3 or More Yes No Mail Phone Internet
A B C D E F G H I J K L M N O P Q R S T
Q26. How many specialists have you seen in the last 12 months?
Total Eligible115 34 81 21 91 12 97 23 35 57 50 65 8 42 30 83 79 22 115 - -
100.0%100.0% 100.0% 100.0% 100.0% 100.0% 100.0% 100.0% 100.0% 100.0% 100.0% 100.0% 100.0% 100.0% 100.0% 100.0% 100.0% 100.0% 100.0% - -
Total ValidResponses
114 34 80 21 90 12 97 23 35 56 50 64 8 42 30 82 79 21 114 - -100.0%100.0% 100.0% 100.0% 100.0% 100.0% 100.0% 100.0% 100.0% 100.0% 100.0% 100.0% 100.0% 100.0% 100.0% 100.0% 100.0% 100.0% 100.0% - -
No Answer1 - 1 - 1 - - - - 1 - 1 - - - 1 - 1 1 - -
None- - - - - - - - - - - - - - - - - - - - -- - - - - - - - - - - - - - - - - - - - - ** ** ** ** **
1 specialist59 16 43 8 49 5 52 10 19 30 24 35 3 21 23 35 38 12 59 - -
51.8% 47.1% 53.8% 38.1% 54.4% 41.7% 53.6% 43.5% 54.3% 53.6% 48.0% 54.7% 37.5% 50.0% 76.7% 42.7% 48.1% 57.1% 51.8% - - ** ** ** ** O **
237 11 26 9 28 3 32 7 10 20 18 19 1 17 6 31 26 7 37 - -
32.5% 32.4% 32.5% 42.9% 31.1% 25.0% 33.0% 30.4% 28.6% 35.7% 36.0% 29.7% 12.5% 40.5% 20.0% 37.8% 32.9% 33.3% 32.5% - - ** ** ** ** n **
311 5 6 2 8 4 6 4 2 5 5 6 3 2 1 9 10 1 11 - -
9.6% 14.7% 7.5% 9.5% 8.9% 33.3% 6.2% 17.4% 5.7% 8.9% 10.0% 9.4% 37.5% 4.8% 3.3% 11.0% 12.7% 4.8% 9.6% - - ** ** ** ** **
46 2 4 2 4 - 6 2 4 - 2 4 - 2 - 6 4 1 6 - -
5.3% 5.9% 5.0% 9.5% 4.4% - 6.2% 8.7% 11.4% - 4.0% 6.3% - 4.8% - 7.3% 5.1% 4.8% 5.3% - - ** ** ** I ** **
5 or morespecialists
1 - 1 - 1 - 1 - - 1 1 - 1 - - 1 1 - 1 - -0.9% - 1.3% - 1.1% - 1.0% - - 1.8% 2.0% - 12.5% - - 1.2% 1.3% - 0.9% - -
** ** ** ** ** HEDIS/CAHPSSUMMARYRATE - 1 ormorespecialists
114 34 80 21 90 12 97 23 35 56 50 64 8 42 30 82 79 21 114 - -100.0%100.0%100.0%100.0%100.0%100.0%100.0%100.0%100.0%100.0% 100.0% 100.0% 100.0% 100.0% 100.0% 100.0% 100.0%100.0%100.0% - -
** ** ** ** **
Cell Contents: - Count- Column Percentage- Statistical Test ResultsStatistics: - Column Proportions: Columns Tested (5%): A/B, C/D, E/F, G/H/I, J/K,L/M, N/O, P/Q, R/S/T, (10%): a/b, c/d, e/f, g/h/i, j/k,l/m, n/o, p/q, r/s/t Minimum Base: 30 (**), Small Base: 30 (*)
Presented by SPH Analytics770-978-3173
2016

Q27. What number would you use to rate thatspecialist?
Regence BCBS2016 CAHPS 5.0H Commercial Adult Survey (1113020)
Table: 93Level: Top
HEALTH PLANRATING (Q42)
HEALTHCARE
RATING(Q13)
DOCTORRATING
(Q23)
HEALTH PLANRATING BY
GLOBALPROP. (Q42)
CONTACTCUSTOMER
SERVICE(Q34)
GOTINFO/HELP
FROMCUSTOMER
SERVICE (Q35)
NUMBER OFDOCTOR/CLINIC
VISITS (Q7)CLAIMS
(Q39)DATA
COLLECTIONMETHOD
Total 0-7 8-10 0-7 8-10 0-7 8-10 0-6 7-8 9-10 Yes No Never/Sometimes
Always/Usually
Less than3 3 or More Yes No Mail Phone Internet
A B C D E F G H I J K L M N O P Q R S T
Q27. What number would you use to rate that specialist?
Total Eligible114 34 80 21 90 12 97 23 35 56 50 64 8 42 30 82 79 21 114 - -
100.0%100.0%100.0%100.0%100.0%100.0%100.0%100.0%100.0%100.0% 100.0% 100.0% 100.0% 100.0% 100.0% 100.0% 100.0%100.0%100.0% - -
Total ValidResponses
114 34 80 21 90 12 97 23 35 56 50 64 8 42 30 82 79 21 114 - -100.0%100.0%100.0%100.0%100.0%100.0%100.0%100.0%100.0%100.0% 100.0% 100.0% 100.0% 100.0% 100.0% 100.0% 100.0%100.0%100.0% - -
No Answer- - - - - - - - - - - - - - - - - - - - -
10 - Bestspecialistpossible
43 4 39 1 42 1 41 2 7 34 24 19 1 23 12 31 28 10 43 - -37.7% 11.8% 48.8% 4.8% 46.7% 8.3% 42.3% 8.7% 20.0% 60.7% 48.0% 29.7% 12.5% 54.8% 40.0% 37.8% 35.4% 47.6% 37.7% - -
A ** ** ** H K ** **
929 11 18 5 23 3 26 6 12 11 9 20 1 8 9 19 19 6 29 - -
25.4% 32.4% 22.5% 23.8% 25.6% 25.0% 26.8% 26.1% 34.3% 19.6% 18.0% 31.3% 12.5% 19.0% 30.0% 23.2% 24.1% 28.6% 25.4% - - ** ** ** ** **
824 10 14 7 16 2 20 8 8 8 11 13 5 6 4 19 20 2 24 - -
21.1% 29.4% 17.5% 33.3% 17.8% 16.7% 20.6% 34.8% 22.9% 14.3% 22.0% 20.3% 62.5% 14.3% 13.3% 23.2% 25.3% 9.5% 21.1% - - ** ** ** ** **
710 5 5 6 4 6 3 4 6 - 4 6 1 3 3 7 8 2 10 - -
8.8% 14.7% 6.3% 28.6% 4.4% 50.0% 3.1% 17.4% 17.1% - 8.0% 9.4% 12.5% 7.1% 10.0% 8.5% 10.1% 9.5% 8.8% - - ** ** ** I ** **
62 - 2 - 2 - 1 - 1 1 - 2 - - - 2 2 - 2 - -
1.8% - 2.5% - 2.2% - 1.0% - 2.9% 1.8% - 3.1% - - - 2.4% 2.5% - 1.8% - - ** ** ** ** **
52 1 1 - 1 - 2 1 - 1 - 2 - - 1 1 - - 2 - -
1.8% 2.9% 1.3% - 1.1% - 2.1% 4.3% - 1.8% - 3.1% - - 3.3% 1.2% - - 1.8% - - ** ** ** ** **
41 1 - - 1 - 1 1 - - - 1 - - - 1 1 - 1 - -
0.9% 2.9% - - 1.1% - 1.0% 4.3% - - - 1.6% - - - 1.2% 1.3% - 0.9% - - ** ** ** ** **
32 2 - 2 - - 2 1 1 - 1 1 - 1 - 2 1 1 2 - -
1.8% 5.9% - 9.5% - - 2.1% 4.3% 2.9% - 2.0% 1.6% - 2.4% - 2.4% 1.3% 4.8% 1.8% - - B ** ** ** ** **
2- - - - - - - - - - - - - - - - - - - - -- - - - - - - - - - - - - - - - - - - - - ** ** ** ** **
11 - 1 - 1 - 1 - - 1 1 - - 1 1 - - - 1 - -
0.9% - 1.3% - 1.1% - 1.0% - - 1.8% 2.0% - - 2.4% 3.3% - - - 0.9% - - ** ** ** ** o **
0 - Worstspecialistpossible
- - - - - - - - - - - - - - - - - - - - -- - - - - - - - - - - - - - - - - - - - - ** ** ** ** **
SUMMARY - 0-3
3 2 1 2 1 - 3 1 1 1 2 1 - 2 1 2 1 1 3 - -2.6% 5.9% 1.3% 9.5% 1.1% - 3.1% 4.3% 2.9% 1.8% 4.0% 1.6% - 4.8% 3.3% 2.4% 1.3% 4.8% 2.6% - -
** ** ** ** **
SUMMARY - 4-7
15 7 8 6 8 6 7 6 7 2 4 11 1 3 4 11 11 2 15 - -13.2% 20.6% 10.0% 28.6% 8.9% 50.0% 7.2% 26.1% 20.0% 3.6% 8.0% 17.2% 12.5% 7.1% 13.3% 13.4% 13.9% 9.5% 13.2% - -
** ** ** I ** ** HEDIS/CAHPSSUMMARYRATE - 8-10
96 25 71 13 81 6 87 16 27 53 44 52 7 37 25 69 67 18 96 - -84.2% 73.5% 88.8% 61.9% 90.0% 50.0% 89.7% 69.6% 77.1% 94.6% 88.0% 81.3% 87.5% 88.1% 83.3% 84.1% 84.8% 85.7% 84.2% - -
A ** ** ** H ** ** HEDIS/CAHPSSUMMARYRATE - 9-10
72 15 57 6 65 4 67 8 19 45 33 39 2 31 21 50 47 16 72 - -63.2% 44.1% 71.3% 28.6% 72.2% 33.3% 69.1% 34.8% 54.3% 80.4% 66.0% 60.9% 25.0% 73.8% 70.0% 61.0% 59.5% 76.2% 63.2% - -
A ** ** ** H ** **
3-Point Score2.56 2.32 2.66 2.19 2.67 2.33 2.62 2.22 2.49 2.75 2.62 2.52 2.25 2.69 2.63 2.54 2.54 2.71 2.56 - -
Cell Contents: - Count- Column Percentage- Statistical Test ResultsStatistics: - Column Proportions: Columns Tested (5%): A/B, C/D, E/F, G/H/I, J/K,L/M, N/O, P/Q, R/S/T, (10%): a/b, c/d, e/f, g/h/i, j/k,l/m, n/o, p/q, r/s/t Minimum Base: 30 (**), Small Base: 30 (*)
Presented by SPH Analytics770-978-3173
2016

Q28. In the last 12 months, did you look for anyinformation in written materials or on the Internetabout how your health plan works?
Regence BCBS2016 CAHPS 5.0H Commercial Adult Survey (1113020)
Table: 94Level: Top
HEALTH PLANRATING (Q42)
HEALTHCARE
RATING(Q13)
DOCTORRATING
(Q23)
HEALTH PLANRATING BY
GLOBALPROP. (Q42)
CONTACTCUSTOMER
SERVICE(Q34)
GOTINFO/HELP
FROMCUSTOMER
SERVICE (Q35)
NUMBER OFDOCTOR/CLINIC
VISITS (Q7)CLAIMS
(Q39)DATA
COLLECTIONMETHOD
Total 0-7 8-10 0-7 8-10 0-7 8-10 0-6 7-8 9-10 Yes No Never/Sometimes
Always/Usually
Less than3 3 or More Yes No Mail Phone Internet
A B C D E F G H I J K L M N O P Q R S T
Q28. In the last 12 months, did you look for any information in written materials or on the Internet about how your health plan works?
Total Eligible176 56 120 35 128 18 144 33 66 77 66 109 11 55 74 100 108 43 176 - -
100.0%100.0%100.0%100.0%100.0%100.0%100.0%100.0%100.0%100.0% 100.0% 100.0% 100.0% 100.0% 100.0% 100.0% 100.0%100.0%100.0% - -
Total ValidResponses
175 55 120 35 127 18 144 33 65 77 66 108 11 55 73 100 108 43 175 - -100.0%100.0%100.0%100.0%100.0%100.0%100.0%100.0%100.0%100.0% 100.0% 100.0% 100.0% 100.0% 100.0% 100.0% 100.0%100.0%100.0% - -
No Answer1 1 - - 1 - - - 1 - - 1 - - 1 - - - 1 - -
Yes125 44 81 26 89 13 102 25 48 52 58 66 9 49 49 75 81 27 125 - -
71.4% 80.0% 67.5% 74.3% 70.1% 72.2% 70.8% 75.8% 73.8% 67.5% 87.9% 61.1% 81.8% 89.1% 67.1% 75.0% 75.0% 62.8% 71.4% - - b ** K **
No50 11 39 9 38 5 42 8 17 25 8 42 2 6 24 25 27 16 50 - -
28.6% 20.0% 32.5% 25.7% 29.9% 27.8% 29.2% 24.2% 26.2% 32.5% 12.1% 38.9% 18.2% 10.9% 32.9% 25.0% 25.0% 37.2% 28.6% - - a ** J **
HEDIS/CAHPSSUMMARYRATE - Yes
125 44 81 26 89 13 102 25 48 52 58 66 9 49 49 75 81 27 125 - -71.4% 80.0% 67.5% 74.3% 70.1% 72.2% 70.8% 75.8% 73.8% 67.5% 87.9% 61.1% 81.8% 89.1% 67.1% 75.0% 75.0% 62.8% 71.4% - -
b ** K **
Cell Contents: - Count- Column Percentage- Statistical Test ResultsStatistics: - Column Proportions: Columns Tested (5%): A/B, C/D, E/F, G/H/I, J/K,L/M, N/O, P/Q, R/S/T, (10%): a/b, c/d, e/f, g/h/i, j/k,l/m, n/o, p/q, r/s/t Minimum Base: 30 (**), Small Base: 30 (*)
Presented by SPH Analytics770-978-3173
2016

Q29. (PNI) In the last 12 months, how often did thewritten materials or the Internet provide theinformation you needed about how your health planworks?
Regence BCBS2016 CAHPS 5.0H Commercial Adult Survey (1113020)
Table: 95Level: Top
HEALTH PLANRATING (Q42)
HEALTHCARE
RATING(Q13)
DOCTORRATING
(Q23)
HEALTH PLANRATING BY
GLOBALPROP. (Q42)
CONTACTCUSTOMER
SERVICE(Q34)
GOTINFO/HELP
FROMCUSTOMER
SERVICE (Q35)
NUMBER OFDOCTOR/CLINIC
VISITS (Q7)CLAIMS
(Q39)DATA
COLLECTIONMETHOD
Total 0-7 8-10 0-7 8-10 0-7 8-10 0-6 7-8 9-10 Yes No Never/Sometimes
Always/Usually
Less than3 3 or More Yes No Mail Phone Internet
A B C D E F G H I J K L M N O P Q R S T
Q29. (PNI) In the last 12 months, how often did the written materials or the Internet provide the information you needed about how your healthplan works?
Total Eligible125 44 81 26 89 13 102 25 48 52 58 66 9 49 49 75 81 27 125 - -
100.0%100.0%100.0%100.0%100.0%100.0%100.0%100.0%100.0%100.0% 100.0% 100.0% 100.0% 100.0% 100.0% 100.0% 100.0%100.0%100.0% - -
Total ValidResponses
124 43 81 26 88 13 101 24 48 52 58 65 9 49 48 75 80 27 124 - -100.0%100.0%100.0%100.0%100.0%100.0%100.0%100.0%100.0%100.0% 100.0% 100.0% 100.0% 100.0% 100.0% 100.0% 100.0%100.0%100.0% - -
No Answer1 1 - - 1 - 1 1 - - - 1 - - 1 - 1 - 1 - -
Always34 10 24 4 27 3 28 3 12 19 12 21 1 11 15 19 23 8 34 - -
27.4% 23.3% 29.6% 15.4% 30.7% 23.1% 27.7% 12.5% 25.0% 36.5% 20.7% 32.3% 11.1% 22.4% 31.3% 25.3% 28.8% 29.6% 27.4% - - ** ** ** ** **
Usually54 18 36 12 36 7 44 11 23 20 24 30 1 23 21 32 32 15 54 - -
43.5% 41.9% 44.4% 46.2% 40.9% 53.8% 43.6% 45.8% 47.9% 38.5% 41.4% 46.2% 11.1% 46.9% 43.8% 42.7% 40.0% 55.6% 43.5% - - ** ** ** ** **
Sometimes32 11 21 6 25 3 26 7 12 13 20 12 6 14 11 21 22 4 32 - -
25.8% 25.6% 25.9% 23.1% 28.4% 23.1% 25.7% 29.2% 25.0% 25.0% 34.5% 18.5% 66.7% 28.6% 22.9% 28.0% 27.5% 14.8% 25.8% - - ** ** ** K ** **
Never4 4 - 4 - - 3 3 1 - 2 2 1 1 1 3 3 - 4 - -
3.2% 9.3% - 15.4% - - 3.0% 12.5% 2.1% - 3.4% 3.1% 11.1% 2.0% 2.1% 4.0% 3.8% - 3.2% - - B ** ** ** ** **
HEDIS/CAHPSSUMMARYRATE -Always/Usually
88 28 60 16 63 10 72 14 35 39 36 51 2 34 36 51 55 23 88 - -71.0% 65.1% 74.1% 61.5% 71.6% 76.9% 71.3% 58.3% 72.9% 75.0% 62.1% 78.5% 22.2% 69.4% 75.0% 68.0% 68.8% 85.2% 71.0% - -
** ** ** J ** **
HEDIS/CAHPSSUMMARYRATE - Always
34 10 24 4 27 3 28 3 12 19 12 21 1 11 15 19 23 8 34 - -27.4% 23.3% 29.6% 15.4% 30.7% 23.1% 27.7% 12.5% 25.0% 36.5% 20.7% 32.3% 11.1% 22.4% 31.3% 25.3% 28.8% 29.6% 27.4% - -
** ** ** ** **
3-Point Score1.98 1.88 2.04 1.77 2.02 2.00 1.99 1.71 1.98 2.12 1.83 2.11 1.33 1.92 2.06 1.93 1.98 2.15 1.98 - -
Cell Contents: - Count- Column Percentage- Statistical Test ResultsStatistics: - Column Proportions: Columns Tested (5%): A/B, C/D, E/F, G/H/I, J/K,L/M, N/O, P/Q, R/S/T, (10%): a/b, c/d, e/f, g/h/i, j/k,l/m, n/o, p/q, r/s/t Minimum Base: 30 (**), Small Base: 30 (*)
Presented by SPH Analytics770-978-3173
2016

Q30. In the last 12 months, did you look forinformation from your health plan on how much youwould have to pay for a health care service orequipment?
Regence BCBS2016 CAHPS 5.0H Commercial Adult Survey (1113020)
Table: 96Level: Top
HEALTH PLANRATING (Q42)
HEALTHCARE
RATING(Q13)
DOCTORRATING
(Q23)
HEALTH PLANRATING BY
GLOBALPROP. (Q42)
CONTACTCUSTOMER
SERVICE(Q34)
GOTINFO/HELP
FROMCUSTOMER
SERVICE (Q35)
NUMBER OFDOCTOR/CLINIC
VISITS (Q7)CLAIMS
(Q39)DATA
COLLECTIONMETHOD
Total 0-7 8-10 0-7 8-10 0-7 8-10 0-6 7-8 9-10 Yes No Never/Sometimes
Always/Usually
Less than3 3 or More Yes No Mail Phone Internet
A B C D E F G H I J K L M N O P Q R S T
Q30. In the last 12 months, did you look for information from your health plan on how much you would have to pay for a health care service orequipment?
Total Eligible176 56 120 35 128 18 144 33 66 77 66 109 11 55 74 100 108 43 176 - -
100.0%100.0%100.0%100.0%100.0%100.0%100.0%100.0%100.0%100.0% 100.0% 100.0% 100.0% 100.0% 100.0% 100.0% 100.0%100.0%100.0% - -
Total ValidResponses
176 56 120 35 128 18 144 33 66 77 66 109 11 55 74 100 108 43 176 - -100.0%100.0%100.0%100.0%100.0%100.0%100.0%100.0%100.0%100.0% 100.0% 100.0% 100.0% 100.0% 100.0% 100.0% 100.0%100.0%100.0% - -
No Answer- - - - - - - - - - - - - - - - - - - - -
Yes68 26 42 17 47 7 58 17 25 26 36 31 9 27 24 43 47 15 68 - -
38.6% 46.4% 35.0% 48.6% 36.7% 38.9% 40.3% 51.5% 37.9% 33.8% 54.5% 28.4% 81.8% 49.1% 32.4% 43.0% 43.5% 34.9% 38.6% - - ** i K **
No108 30 78 18 81 11 86 16 41 51 30 78 2 28 50 57 61 28 108 - -
61.4% 53.6% 65.0% 51.4% 63.3% 61.1% 59.7% 48.5% 62.1% 66.2% 45.5% 71.6% 18.2% 50.9% 67.6% 57.0% 56.5% 65.1% 61.4% - - ** g J **
HEDIS/CAHPSSUMMARYRATE - Yes
68 26 42 17 47 7 58 17 25 26 36 31 9 27 24 43 47 15 68 - -38.6% 46.4% 35.0% 48.6% 36.7% 38.9% 40.3% 51.5% 37.9% 33.8% 54.5% 28.4% 81.8% 49.1% 32.4% 43.0% 43.5% 34.9% 38.6% - -
** i K **
Cell Contents: - Count- Column Percentage- Statistical Test ResultsStatistics: - Column Proportions: Columns Tested (5%): A/B, C/D, E/F, G/H/I, J/K,L/M, N/O, P/Q, R/S/T, (10%): a/b, c/d, e/f, g/h/i, j/k,l/m, n/o, p/q, r/s/t Minimum Base: 30 (**), Small Base: 30 (*)
Presented by SPH Analytics770-978-3173
2016

Q31. (PIOC) In the last 12 months, how often wereyou able to find out from your health plan how muchyou would have to pay for a health care service orequipment?
Regence BCBS2016 CAHPS 5.0H Commercial Adult Survey (1113020)
Table: 97Level: Top
HEALTH PLANRATING (Q42)
HEALTHCARE
RATING(Q13)
DOCTORRATING
(Q23)
HEALTH PLANRATING BY
GLOBALPROP. (Q42)
CONTACTCUSTOMER
SERVICE(Q34)
GOTINFO/HELP
FROMCUSTOMER
SERVICE (Q35)
NUMBER OFDOCTOR/CLINIC
VISITS (Q7)CLAIMS
(Q39)DATA
COLLECTIONMETHOD
Total 0-7 8-10 0-7 8-10 0-7 8-10 0-6 7-8 9-10 Yes No Never/Sometimes
Always/Usually
Less than3 3 or More Yes No Mail Phone Internet
A B C D E F G H I J K L M N O P Q R S T
Q31. (PIOC) In the last 12 months, how often were you able to find out from your health plan how much you would have to pay for a health careservice or equipment?
Total Eligible68 26 42 17 47 7 58 17 25 26 36 31 9 27 24 43 47 15 68 - -
100.0%100.0%100.0%100.0%100.0%100.0%100.0%100.0%100.0%100.0% 100.0% 100.0% 100.0% 100.0% 100.0% 100.0% 100.0%100.0%100.0% - -
Total ValidResponses
68 26 42 17 47 7 58 17 25 26 36 31 9 27 24 43 47 15 68 - -100.0%100.0%100.0%100.0%100.0%100.0%100.0%100.0%100.0%100.0% 100.0% 100.0% 100.0% 100.0% 100.0% 100.0% 100.0%100.0%100.0% - -
No Answer- - - - - - - - - - - - - - - - - - - - -
Always18 4 14 1 15 - 18 3 4 11 10 7 2 8 6 11 14 3 18 - -
26.5% 15.4% 33.3% 5.9% 31.9% - 31.0% 17.6% 16.0% 42.3% 27.8% 22.6% 22.2% 29.6% 25.0% 25.6% 29.8% 20.0% 26.5% - - ** ** ** ** ** ** ** ** ** **
Usually25 8 17 6 17 4 20 6 9 10 13 12 2 11 10 15 18 4 25 - -
36.8% 30.8% 40.5% 35.3% 36.2% 57.1% 34.5% 35.3% 36.0% 38.5% 36.1% 38.7% 22.2% 40.7% 41.7% 34.9% 38.3% 26.7% 36.8% - - ** ** ** ** ** ** ** ** ** **
Sometimes18 12 6 8 10 3 14 7 7 4 9 9 3 6 5 13 9 7 18 - -
26.5% 46.2% 14.3% 47.1% 21.3% 42.9% 24.1% 41.2% 28.0% 15.4% 25.0% 29.0% 33.3% 22.2% 20.8% 30.2% 19.1% 46.7% 26.5% - - ** ** ** ** ** ** ** ** ** **
Never7 2 5 2 5 - 6 1 5 1 4 3 2 2 3 4 6 1 7 - -
10.3% 7.7% 11.9% 11.8% 10.6% - 10.3% 5.9% 20.0% 3.8% 11.1% 9.7% 22.2% 7.4% 12.5% 9.3% 12.8% 6.7% 10.3% - - ** ** ** ** ** ** ** ** ** **
HEDIS/CAHPSSUMMARYRATE -Always/Usually
43 12 31 7 32 4 38 9 13 21 23 19 4 19 16 26 32 7 43 - -63.2% 46.2% 73.8% 41.2% 68.1% 57.1% 65.5% 52.9% 52.0% 80.8% 63.9% 61.3% 44.4% 70.4% 66.7% 60.5% 68.1% 46.7% 63.2% - -
** ** ** ** ** ** ** ** ** **
HEDIS/CAHPSSUMMARYRATE - Always
18 4 14 1 15 - 18 3 4 11 10 7 2 8 6 11 14 3 18 - -26.5% 15.4% 33.3% 5.9% 31.9% - 31.0% 17.6% 16.0% 42.3% 27.8% 22.6% 22.2% 29.6% 25.0% 25.6% 29.8% 20.0% 26.5% - -
** ** ** ** ** ** ** ** ** **
3-Point Score1.90 1.62 2.07 1.47 2.00 1.57 1.97 1.71 1.68 2.23 1.92 1.84 1.67 2.00 1.92 1.86 1.98 1.67 1.90 - -
Cell Contents: - Count- Column Percentage- Statistical Test ResultsStatistics: - Column Proportions: Columns Tested (5%): A/B, C/D, E/F, G/H/I, J/K,L/M, N/O, P/Q, R/S/T, (10%): a/b, c/d, e/f, g/h/i, j/k,l/m, n/o, p/q, r/s/t Minimum Base: 30 (**), Small Base: 30 (*)
Presented by SPH Analytics770-978-3173
2016

Q32. In the last 12 months, did you look forinformation from your health plan on how much youwould have to pay for specific prescriptionmedicines?
Regence BCBS2016 CAHPS 5.0H Commercial Adult Survey (1113020)
Table: 98Level: Top
HEALTH PLANRATING (Q42)
HEALTHCARE
RATING(Q13)
DOCTORRATING
(Q23)
HEALTH PLANRATING BY
GLOBALPROP. (Q42)
CONTACTCUSTOMER
SERVICE(Q34)
GOTINFO/HELP
FROMCUSTOMER
SERVICE (Q35)
NUMBER OFDOCTOR/CLINIC
VISITS (Q7)CLAIMS
(Q39)DATA
COLLECTIONMETHOD
Total 0-7 8-10 0-7 8-10 0-7 8-10 0-6 7-8 9-10 Yes No Never/Sometimes
Always/Usually
Less than3 3 or More Yes No Mail Phone Internet
A B C D E F G H I J K L M N O P Q R S T
Q32. In the last 12 months, did you look for information from your health plan on how much you would have to pay for specific prescriptionmedicines?
Total Eligible176 56 120 35 128 18 144 33 66 77 66 109 11 55 74 100 108 43 176 - -
100.0%100.0%100.0%100.0%100.0%100.0%100.0%100.0%100.0%100.0% 100.0% 100.0% 100.0% 100.0% 100.0% 100.0% 100.0%100.0%100.0% - -
Total ValidResponses
176 56 120 35 128 18 144 33 66 77 66 109 11 55 74 100 108 43 176 - -100.0%100.0%100.0%100.0%100.0%100.0%100.0%100.0%100.0%100.0% 100.0% 100.0% 100.0% 100.0% 100.0% 100.0% 100.0%100.0%100.0% - -
No Answer- - - - - - - - - - - - - - - - - - - - -
Yes47 18 29 10 33 5 42 14 15 18 29 17 7 22 15 30 32 10 47 - -
26.7% 32.1% 24.2% 28.6% 25.8% 27.8% 29.2% 42.4% 22.7% 23.4% 43.9% 15.6% 63.6% 40.0% 20.3% 30.0% 29.6% 23.3% 26.7% - - ** HI K **
No129 38 91 25 95 13 102 19 51 59 37 92 4 33 59 70 76 33 129 - -
73.3% 67.9% 75.8% 71.4% 74.2% 72.2% 70.8% 57.6% 77.3% 76.6% 56.1% 84.4% 36.4% 60.0% 79.7% 70.0% 70.4% 76.7% 73.3% - - ** G G J **
HEDIS/CAHPSSUMMARYRATE - Yes
47 18 29 10 33 5 42 14 15 18 29 17 7 22 15 30 32 10 47 - -26.7% 32.1% 24.2% 28.6% 25.8% 27.8% 29.2% 42.4% 22.7% 23.4% 43.9% 15.6% 63.6% 40.0% 20.3% 30.0% 29.6% 23.3% 26.7% - -
** HI K **
Cell Contents: - Count- Column Percentage- Statistical Test ResultsStatistics: - Column Proportions: Columns Tested (5%): A/B, C/D, E/F, G/H/I, J/K,L/M, N/O, P/Q, R/S/T, (10%): a/b, c/d, e/f, g/h/i, j/k,l/m, n/o, p/q, r/s/t Minimum Base: 30 (**), Small Base: 30 (*)
Presented by SPH Analytics770-978-3173
2016

Q33. (PIOC) In the last 12 months, how often wereyou able to find out from your health plan how muchyou would have to pay for specific prescriptionmedicines?
Regence BCBS2016 CAHPS 5.0H Commercial Adult Survey (1113020)
Table: 99Level: Top
HEALTH PLANRATING (Q42)
HEALTHCARE
RATING(Q13)
DOCTORRATING
(Q23)
HEALTH PLANRATING BY
GLOBALPROP. (Q42)
CONTACTCUSTOMER
SERVICE(Q34)
GOTINFO/HELP
FROMCUSTOMER
SERVICE (Q35)
NUMBER OFDOCTOR/CLINIC
VISITS (Q7)CLAIMS
(Q39)DATA
COLLECTIONMETHOD
Total 0-7 8-10 0-7 8-10 0-7 8-10 0-6 7-8 9-10 Yes No Never/Sometimes
Always/Usually
Less than3 3 or More Yes No Mail Phone Internet
A B C D E F G H I J K L M N O P Q R S T
Q33. (PIOC) In the last 12 months, how often were you able to find out from your health plan how much you would have to pay for specificprescription medicines?
Total Eligible47 18 29 10 33 5 42 14 15 18 29 17 7 22 15 30 32 10 47 - -
100.0%100.0%100.0%100.0%100.0%100.0%100.0%100.0%100.0%100.0% 100.0% 100.0% 100.0% 100.0% 100.0% 100.0% 100.0%100.0%100.0% - -
Total ValidResponses
47 18 29 10 33 5 42 14 15 18 29 17 7 22 15 30 32 10 47 - -100.0%100.0%100.0%100.0%100.0%100.0%100.0%100.0%100.0%100.0% 100.0% 100.0% 100.0% 100.0% 100.0% 100.0% 100.0%100.0%100.0% - -
No Answer- - - - - - - - - - - - - - - - - - - - -
Always17 5 12 2 14 - 17 5 2 10 11 5 1 10 5 12 13 4 17 - -
36.2% 27.8% 41.4% 20.0% 42.4% - 40.5% 35.7% 13.3% 55.6% 37.9% 29.4% 14.3% 45.5% 33.3% 40.0% 40.6% 40.0% 36.2% - - ** ** ** ** ** ** ** ** ** ** ** ** **
Usually14 6 8 3 9 2 12 4 6 4 7 7 1 6 8 5 9 3 14 - -
29.8% 33.3% 27.6% 30.0% 27.3% 40.0% 28.6% 28.6% 40.0% 22.2% 24.1% 41.2% 14.3% 27.3% 53.3% 16.7% 28.1% 30.0% 29.8% - - ** ** ** ** ** ** ** ** ** ** ** ** **
Sometimes10 5 5 3 7 2 8 3 5 2 5 5 - 5 - 10 5 3 10 - -
21.3% 27.8% 17.2% 30.0% 21.2% 40.0% 19.0% 21.4% 33.3% 11.1% 17.2% 29.4% - 22.7% - 33.3% 15.6% 30.0% 21.3% - - ** ** ** ** ** ** ** ** ** ** ** ** **
Never6 2 4 2 3 1 5 2 2 2 6 - 5 1 2 3 5 - 6 - -
12.8% 11.1% 13.8% 20.0% 9.1% 20.0% 11.9% 14.3% 13.3% 11.1% 20.7% - 71.4% 4.5% 13.3% 10.0% 15.6% - 12.8% - - ** ** ** ** ** ** ** ** ** ** ** ** **
HEDIS/CAHPSSUMMARYRATE -Always/Usually
31 11 20 5 23 2 29 9 8 14 18 12 2 16 13 17 22 7 31 - -66.0% 61.1% 69.0% 50.0% 69.7% 40.0% 69.0% 64.3% 53.3% 77.8% 62.1% 70.6% 28.6% 72.7% 86.7% 56.7% 68.8% 70.0% 66.0% - -
** ** ** ** ** ** ** ** ** ** ** ** **
HEDIS/CAHPSSUMMARYRATE - Always
17 5 12 2 14 - 17 5 2 10 11 5 1 10 5 12 13 4 17 - -36.2% 27.8% 41.4% 20.0% 42.4% - 40.5% 35.7% 13.3% 55.6% 37.9% 29.4% 14.3% 45.5% 33.3% 40.0% 40.6% 40.0% 36.2% - -
** ** ** ** ** ** ** ** ** ** ** ** **
3-Point Score2.02 1.89 2.10 1.70 2.12 1.40 2.10 2.00 1.67 2.33 2.00 2.00 1.43 2.18 2.20 1.97 2.09 2.10 2.02 - -
Cell Contents: - Count- Column Percentage- Statistical Test ResultsStatistics: - Column Proportions: Columns Tested (5%): A/B, C/D, E/F, G/H/I, J/K,L/M, N/O, P/Q, R/S/T, (10%): a/b, c/d, e/f, g/h/i, j/k,l/m, n/o, p/q, r/s/t Minimum Base: 30 (**), Small Base: 30 (*)
Presented by SPH Analytics770-978-3173
2016

Q34. In the last 12 months, did you get informationor help from your health plan's customer service?
Regence BCBS2016 CAHPS 5.0H Commercial Adult Survey (1113020)
Table: 100Level: Top
HEALTH PLANRATING (Q42)
HEALTHCARE
RATING(Q13)
DOCTORRATING
(Q23)
HEALTH PLANRATING BY
GLOBALPROP. (Q42)
CONTACTCUSTOMER
SERVICE(Q34)
GOTINFO/HELP
FROMCUSTOMER
SERVICE (Q35)
NUMBER OFDOCTOR/CLINIC
VISITS (Q7)CLAIMS
(Q39)DATA
COLLECTIONMETHOD
Total 0-7 8-10 0-7 8-10 0-7 8-10 0-6 7-8 9-10 Yes No Never/Sometimes
Always/Usually
Less than3 3 or More Yes No Mail Phone Internet
A B C D E F G H I J K L M N O P Q R S T
Q34. In the last 12 months, did you get information or help from your health plan's customer service?
Total Eligible176 56 120 35 128 18 144 33 66 77 66 109 11 55 74 100 108 43 176 - -
100.0%100.0%100.0%100.0%100.0%100.0%100.0%100.0%100.0%100.0% 100.0% 100.0% 100.0% 100.0% 100.0% 100.0% 100.0%100.0%100.0% - -
Total ValidResponses
175 56 119 35 128 18 143 33 66 76 66 109 11 55 74 99 107 43 175 - -100.0%100.0%100.0%100.0%100.0%100.0%100.0%100.0%100.0%100.0% 100.0% 100.0% 100.0% 100.0% 100.0% 100.0% 100.0%100.0%100.0% - -
No Answer1 - 1 - - - 1 - - 1 - - - - - 1 1 - 1 - -
Yes66 16 50 14 51 8 56 12 20 34 66 - 11 55 22 43 49 13 66 - -
37.7% 28.6% 42.0% 40.0% 39.8% 44.4% 39.2% 36.4% 30.3% 44.7% 100.0% - 100.0% 100.0% 29.7% 43.4% 45.8% 30.2% 37.7% - - a ** h K ** n q
No109 40 69 21 77 10 87 21 46 42 - 109 - - 52 56 58 30 109 - -
62.3% 71.4% 58.0% 60.0% 60.2% 55.6% 60.8% 63.6% 69.7% 55.3% - 100.0% - - 70.3% 56.6% 54.2% 69.8% 62.3% - - b ** i J ** o p
HEDIS/CAHPSSUMMARYRATE - Yes
66 16 50 14 51 8 56 12 20 34 66 - 11 55 22 43 49 13 66 - -37.7% 28.6% 42.0% 40.0% 39.8% 44.4% 39.2% 36.4% 30.3% 44.7% 100.0% - 100.0% 100.0% 29.7% 43.4% 45.8% 30.2% 37.7% - -
a ** h K ** n q
Cell Contents: - Count- Column Percentage- Statistical Test ResultsStatistics: - Column Proportions: Columns Tested (5%): A/B, C/D, E/F, G/H/I, J/K,L/M, N/O, P/Q, R/S/T, (10%): a/b, c/d, e/f, g/h/i, j/k,l/m, n/o, p/q, r/s/t Minimum Base: 30 (**), Small Base: 30 (*)
Presented by SPH Analytics770-978-3173
2016

Q35. (CS) In the last 12 months, how often did yourhealth plan's customer service give you theinformation or help you needed?
Regence BCBS2016 CAHPS 5.0H Commercial Adult Survey (1113020)
Table: 101Level: Top
HEALTH PLANRATING (Q42)
HEALTHCARE
RATING(Q13)
DOCTORRATING
(Q23)
HEALTH PLANRATING BY
GLOBALPROP. (Q42)
CONTACTCUSTOMER
SERVICE(Q34)
GOTINFO/HELP
FROMCUSTOMER
SERVICE (Q35)
NUMBER OFDOCTOR/CLINIC
VISITS (Q7)CLAIMS
(Q39)DATA
COLLECTIONMETHOD
Total 0-7 8-10 0-7 8-10 0-7 8-10 0-6 7-8 9-10 Yes No Never/Sometimes
Always/Usually
Less than3 3 or More Yes No Mail Phone Internet
A B C D E F G H I J K L M N O P Q R S T
Q35. (CS) In the last 12 months, how often did your health plan's customer service give you the information or help you needed?
Total Eligible66 16 50 14 51 8 56 12 20 34 66 - 11 55 22 43 49 13 66 - -
100.0%100.0%100.0%100.0%100.0%100.0%100.0%100.0%100.0%100.0% 100.0% - 100.0% 100.0% 100.0% 100.0% 100.0%100.0%100.0% - -
Total ValidResponses
66 16 50 14 51 8 56 12 20 34 66 - 11 55 22 43 49 13 66 - -100.0%100.0%100.0%100.0%100.0%100.0%100.0%100.0%100.0%100.0% 100.0% - 100.0% 100.0% 100.0% 100.0% 100.0%100.0%100.0% - -
No Answer- - - - - - - - - - - - - - - - - - - - -
Always37 3 34 4 33 3 32 3 8 26 37 - - 37 13 24 26 8 37 - -
56.1% 18.8% 68.0% 28.6% 64.7% 37.5% 57.1% 25.0% 40.0% 76.5% 56.1% - - 67.3% 59.1% 55.8% 53.1% 61.5% 56.1% - - ** ** ** ** ** ** ** **
Usually18 7 11 6 12 4 14 4 9 5 18 - - 18 6 12 14 4 18 - -
27.3% 43.8% 22.0% 42.9% 23.5% 50.0% 25.0% 33.3% 45.0% 14.7% 27.3% - - 32.7% 27.3% 27.9% 28.6% 30.8% 27.3% - - ** ** ** ** ** ** ** **
Sometimes9 5 4 4 4 1 8 4 3 2 9 - 9 - 3 5 8 1 9 - -
13.6% 31.3% 8.0% 28.6% 7.8% 12.5% 14.3% 33.3% 15.0% 5.9% 13.6% - 81.8% - 13.6% 11.6% 16.3% 7.7% 13.6% - - ** ** ** ** ** ** ** **
Never2 1 1 - 2 - 2 1 - 1 2 - 2 - - 2 1 - 2 - -
3.0% 6.3% 2.0% - 3.9% - 3.6% 8.3% - 2.9% 3.0% - 18.2% - - 4.7% 2.0% - 3.0% - - ** ** ** ** ** ** ** **
HEDIS/CAHPSSUMMARYRATE -Always/Usually
55 10 45 10 45 7 46 7 17 31 55 - - 55 19 36 40 12 55 - -83.3% 62.5% 90.0% 71.4% 88.2% 87.5% 82.1% 58.3% 85.0% 91.2% 83.3% - - 100.0% 86.4% 83.7% 81.6% 92.3% 83.3% - -
** ** ** ** ** ** ** **
HEDIS/CAHPSSUMMARYRATE - Always
37 3 34 4 33 3 32 3 8 26 37 - - 37 13 24 26 8 37 - -56.1% 18.8% 68.0% 28.6% 64.7% 37.5% 57.1% 25.0% 40.0% 76.5% 56.1% - - 67.3% 59.1% 55.8% 53.1% 61.5% 56.1% - -
** ** ** ** ** ** ** **
3-Point Score2.39 1.81 2.58 2.00 2.53 2.25 2.39 1.83 2.25 2.68 2.39 - 1.00 2.67 2.45 2.40 2.35 2.54 2.39 - -
Cell Contents: - Count- Column Percentage- Statistical Test ResultsStatistics: - Column Proportions: Columns Tested (5%): A/B, C/D, E/F, G/H/I, J/K,L/M, N/O, P/Q, R/S/T, (10%): a/b, c/d, e/f, g/h/i, j/k,l/m, n/o, p/q, r/s/t Minimum Base: 30 (**), Small Base: 30 (*)
Presented by SPH Analytics770-978-3173
2016

Q36. (CS) In the last 12 months, how often did yourhealth plan's customer service staff treat you withcourtesy and respect?
Regence BCBS2016 CAHPS 5.0H Commercial Adult Survey (1113020)
Table: 102Level: Top
HEALTH PLANRATING (Q42)
HEALTHCARE
RATING(Q13)
DOCTORRATING
(Q23)
HEALTH PLANRATING BY
GLOBALPROP. (Q42)
CONTACTCUSTOMER
SERVICE(Q34)
GOTINFO/HELP
FROMCUSTOMER
SERVICE (Q35)
NUMBER OFDOCTOR/CLINIC
VISITS (Q7)CLAIMS
(Q39)DATA
COLLECTIONMETHOD
Total 0-7 8-10 0-7 8-10 0-7 8-10 0-6 7-8 9-10 Yes No Never/Sometimes
Always/Usually
Less than3 3 or More Yes No Mail Phone Internet
A B C D E F G H I J K L M N O P Q R S T
Q36. (CS) In the last 12 months, how often did your health plan's customer service staff treat you with courtesy and respect?
Total Eligible66 16 50 14 51 8 56 12 20 34 66 - 11 55 22 43 49 13 66 - -
100.0%100.0%100.0%100.0%100.0%100.0%100.0%100.0%100.0%100.0% 100.0% - 100.0% 100.0% 100.0% 100.0% 100.0% 100.0% 100.0% - -
Total ValidResponses
65 16 49 14 50 8 55 12 19 34 65 - 10 55 22 42 49 12 65 - -100.0%100.0%100.0%100.0%100.0%100.0%100.0%100.0%100.0%100.0% 100.0% - 100.0% 100.0% 100.0% 100.0% 100.0% 100.0% 100.0% - -
No Answer1 - 1 - 1 - 1 - 1 - 1 - 1 - - 1 - 1 1 - -
Always53 11 42 11 42 6 45 7 15 31 53 - 4 49 18 35 39 10 53 - -
81.5% 68.8% 85.7% 78.6% 84.0% 75.0% 81.8% 58.3% 78.9% 91.2% 81.5% - 40.0% 89.1% 81.8% 83.3% 79.6% 83.3% 81.5% - - ** ** ** ** ** ** ** **
Usually8 4 4 3 5 2 6 4 3 1 8 - 2 6 3 5 6 2 8 - -
12.3% 25.0% 8.2% 21.4% 10.0% 25.0% 10.9% 33.3% 15.8% 2.9% 12.3% - 20.0% 10.9% 13.6% 11.9% 12.2% 16.7% 12.3% - - ** ** ** ** ** ** ** **
Sometimes3 - 3 - 2 - 3 - 1 2 3 - 3 - 1 1 3 - 3 - -
4.6% - 6.1% - 4.0% - 5.5% - 5.3% 5.9% 4.6% - 30.0% - 4.5% 2.4% 6.1% - 4.6% - - ** ** ** ** ** ** ** **
Never1 1 - - 1 - 1 1 - - 1 - 1 - - 1 1 - 1 - -
1.5% 6.3% - - 2.0% - 1.8% 8.3% - - 1.5% - 10.0% - - 2.4% 2.0% - 1.5% - - ** ** ** ** ** ** ** **
HEDIS/CAHPSSUMMARYRATE -Always/Usually
61 15 46 14 47 8 51 11 18 32 61 - 6 55 21 40 45 12 61 - -93.8% 93.8% 93.9% 100.0% 94.0% 100.0% 92.7% 91.7% 94.7% 94.1% 93.8% - 60.0% 100.0% 95.5% 95.2% 91.8% 100.0% 93.8% - -
** ** ** ** ** ** ** **
HEDIS/CAHPSSUMMARYRATE - Always
53 11 42 11 42 6 45 7 15 31 53 - 4 49 18 35 39 10 53 - -81.5% 68.8% 85.7% 78.6% 84.0% 75.0% 81.8% 58.3% 78.9% 91.2% 81.5% - 40.0% 89.1% 81.8% 83.3% 79.6% 83.3% 81.5% - -
** ** ** ** ** ** ** **
3-Point Score2.75 2.63 2.80 2.79 2.78 2.75 2.75 2.50 2.74 2.85 2.75 - 2.00 2.89 2.77 2.79 2.71 2.83 2.75 - -
Cell Contents: - Count- Column Percentage- Statistical Test ResultsStatistics: - Column Proportions: Columns Tested (5%): A/B, C/D, E/F, G/H/I, J/K,L/M, N/O, P/Q, R/S/T, (10%): a/b, c/d, e/f, g/h/i, j/k,l/m, n/o, p/q, r/s/t Minimum Base: 30 (**), Small Base: 30 (*)
Presented by SPH Analytics770-978-3173
2016

Q37. In the last 12 months, did your health plan giveyou any forms to fill out?
Regence BCBS2016 CAHPS 5.0H Commercial Adult Survey (1113020)
Table: 103Level: Top
HEALTH PLANRATING (Q42)
HEALTHCARE
RATING(Q13)
DOCTORRATING
(Q23)
HEALTH PLANRATING BY
GLOBALPROP. (Q42)
CONTACTCUSTOMER
SERVICE(Q34)
GOTINFO/HELP
FROMCUSTOMER
SERVICE (Q35)
NUMBER OFDOCTOR/CLINIC
VISITS (Q7)CLAIMS
(Q39)DATA
COLLECTIONMETHOD
Total 0-7 8-10 0-7 8-10 0-7 8-10 0-6 7-8 9-10 Yes No Never/Sometimes
Always/Usually
Less than3 3 or More Yes No Mail Phone Internet
A B C D E F G H I J K L M N O P Q R S T
Q37. In the last 12 months, did your health plan give you any forms to fill out?
Total Eligible176 56 120 35 128 18 144 33 66 77 66 109 11 55 74 100 108 43 176 - -
100.0%100.0%100.0%100.0%100.0%100.0%100.0%100.0%100.0%100.0% 100.0% 100.0% 100.0% 100.0% 100.0% 100.0% 100.0%100.0%100.0% - -
Total ValidResponses
175 55 120 35 127 18 143 33 65 77 66 108 11 55 74 99 108 42 175 - -100.0%100.0%100.0%100.0%100.0%100.0%100.0%100.0%100.0%100.0% 100.0% 100.0% 100.0% 100.0% 100.0% 100.0% 100.0%100.0%100.0% - -
No Answer1 1 - - 1 - 1 - 1 - - 1 - - - 1 - 1 1 - -
Yes45 13 32 11 34 6 37 10 15 20 28 17 4 24 14 31 32 8 45 - -
25.7% 23.6% 26.7% 31.4% 26.8% 33.3% 25.9% 30.3% 23.1% 26.0% 42.4% 15.7% 36.4% 43.6% 18.9% 31.3% 29.6% 19.0% 25.7% - - ** K ** n
No130 42 88 24 93 12 106 23 50 57 38 91 7 31 60 68 76 34 130 - -
74.3% 76.4% 73.3% 68.6% 73.2% 66.7% 74.1% 69.7% 76.9% 74.0% 57.6% 84.3% 63.6% 56.4% 81.1% 68.7% 70.4% 81.0% 74.3% - - ** J ** o
HEDIS/CAHPSSUMMARYRATE - Yes
45 13 32 11 34 6 37 10 15 20 28 17 4 24 14 31 32 8 45 - -25.7% 23.6% 26.7% 31.4% 26.8% 33.3% 25.9% 30.3% 23.1% 26.0% 42.4% 15.7% 36.4% 43.6% 18.9% 31.3% 29.6% 19.0% 25.7% - -
** K ** n
Cell Contents: - Count- Column Percentage- Statistical Test ResultsStatistics: - Column Proportions: Columns Tested (5%): A/B, C/D, E/F, G/H/I, J/K,L/M, N/O, P/Q, R/S/T, (10%): a/b, c/d, e/f, g/h/i, j/k,l/m, n/o, p/q, r/s/t Minimum Base: 30 (**), Small Base: 30 (*)
Presented by SPH Analytics770-978-3173
2016

Q38. (FOF) In the last 12 months, how often werethe forms from your health plan easy to fill out?
Regence BCBS2016 CAHPS 5.0H Commercial Adult Survey (1113020)
Table: 104Level: Top
HEALTH PLANRATING (Q42)
HEALTHCARE
RATING(Q13)
DOCTORRATING
(Q23)
HEALTH PLANRATING BY
GLOBALPROP. (Q42)
CONTACTCUSTOMER
SERVICE(Q34)
GOTINFO/HELP
FROMCUSTOMER
SERVICE (Q35)
NUMBER OFDOCTOR/CLINIC
VISITS (Q7)CLAIMS
(Q39)DATA
COLLECTIONMETHOD
Total 0-7 8-10 0-7 8-10 0-7 8-10 0-6 7-8 9-10 Yes No Never/Sometimes
Always/Usually
Less than3 3 or More Yes No Mail Phone Internet
A B C D E F G H I J K L M N O P Q R S T
Q38. (FOF) In the last 12 months, how often were the forms from your health plan easy to fill out?
Total Eligible175 55 120 35 127 18 143 33 65 77 66 108 11 55 74 99 108 42 175 - -
100.0%100.0%100.0%100.0%100.0%100.0%100.0%100.0%100.0%100.0% 100.0% 100.0% 100.0% 100.0% 100.0% 100.0% 100.0%100.0%100.0% - -
Total ValidResponses
175 55 120 35 127 18 143 33 65 77 66 108 11 55 74 99 108 42 175 - -100.0%100.0%100.0%100.0%100.0%100.0%100.0%100.0%100.0%100.0% 100.0% 100.0% 100.0% 100.0% 100.0% 100.0% 100.0%100.0%100.0% - -
No Answer- - - - - - - - - - - - - - - - - - - - -
Always147 43 104 25 109 13 122 24 51 72 50 96 8 42 64 81 89 36 147 - -
84.0% 78.2% 86.7% 71.4% 85.8% 72.2% 85.3% 72.7% 78.5% 93.5% 75.8% 88.9% 72.7% 76.4% 86.5% 81.8% 82.4% 85.7% 84.0% - - C ** GH J **
Usually18 6 12 6 12 3 14 5 10 3 9 9 1 8 7 11 12 4 18 - -
10.3% 10.9% 10.0% 17.1% 9.4% 16.7% 9.8% 15.2% 15.4% 3.9% 13.6% 8.3% 9.1% 14.5% 9.5% 11.1% 11.1% 9.5% 10.3% - - ** I I **
Sometimes10 6 4 4 6 2 7 4 4 2 7 3 2 5 3 7 7 2 10 - -
5.7% 10.9% 3.3% 11.4% 4.7% 11.1% 4.9% 12.1% 6.2% 2.6% 10.6% 2.8% 18.2% 9.1% 4.1% 7.1% 6.5% 4.8% 5.7% - - B ** I K **
Never- - - - - - - - - - - - - - - - - - - - -- - - - - - - - - - - - - - - - - - - - - ** **
HEDIS/CAHPSSUMMARYRATE -Always/Usually
165 49 116 31 121 16 136 29 61 75 59 105 9 50 71 92 101 40 165 - -94.3% 89.1% 96.7% 88.6% 95.3% 88.9% 95.1% 87.9% 93.8% 97.4% 89.4% 97.2% 81.8% 90.9% 95.9% 92.9% 93.5% 95.2% 94.3% - -
A ** G J **
HEDIS/CAHPSSUMMARYRATE - Always
147 43 104 25 109 13 122 24 51 72 50 96 8 42 64 81 89 36 147 - -84.0% 78.2% 86.7% 71.4% 85.8% 72.2% 85.3% 72.7% 78.5% 93.5% 75.8% 88.9% 72.7% 76.4% 86.5% 81.8% 82.4% 85.7% 84.0% - -
C ** GH J **
3-Point Score2.78 2.67 2.83 2.60 2.81 2.61 2.80 2.61 2.72 2.91 2.65 2.86 2.55 2.67 2.82 2.75 2.76 2.81 2.78 - -
Cell Contents: - Count- Column Percentage- Statistical Test ResultsStatistics: - Column Proportions: Columns Tested (5%): A/B, C/D, E/F, G/H/I, J/K,L/M, N/O, P/Q, R/S/T, (10%): a/b, c/d, e/f, g/h/i, j/k,l/m, n/o, p/q, r/s/t Minimum Base: 30 (**), Small Base: 30 (*)
Presented by SPH Analytics770-978-3173
2016

Q39. In the last 12 months, did you or anyone elsesend in any claims for your care to your health plan?
Regence BCBS2016 CAHPS 5.0H Commercial Adult Survey (1113020)
Table: 105Level: Top
HEALTH PLANRATING (Q42)
HEALTHCARE
RATING(Q13)
DOCTORRATING
(Q23)
HEALTH PLANRATING BY
GLOBALPROP. (Q42)
CONTACTCUSTOMER
SERVICE(Q34)
GOTINFO/HELP
FROMCUSTOMER
SERVICE (Q35)
NUMBER OFDOCTOR/CLINIC
VISITS (Q7)CLAIMS
(Q39)DATA
COLLECTIONMETHOD
Total 0-7 8-10 0-7 8-10 0-7 8-10 0-6 7-8 9-10 Yes No Never/Sometimes
Always/Usually
Less than3 3 or More Yes No Mail Phone Internet
A B C D E F G H I J K L M N O P Q R S T
Q39. In the last 12 months, did you or anyone else send in any claims for your care to your health plan?
Total Eligible176 56 120 35 128 18 144 33 66 77 66 109 11 55 74 100 108 43 176 - -
100.0%100.0%100.0%100.0%100.0%100.0%100.0%100.0%100.0%100.0% 100.0% 100.0% 100.0% 100.0% 100.0% 100.0% 100.0% 100.0% 100.0% - -
Total ValidResponses
151 48 103 30 111 16 123 29 55 67 62 88 10 52 61 88 108 43 151 - -100.0%100.0%100.0%100.0%100.0%100.0%100.0%100.0%100.0%100.0% 100.0% 100.0% 100.0% 100.0% 100.0% 100.0% 100.0% 100.0% 100.0% - -
No Answer1 - 1 - 1 - 1 - - 1 1 - - 1 1 - - - 1 - -
Yes108 36 72 24 80 13 87 22 38 48 49 58 9 40 37 69 108 - 108 - -
71.5% 75.0% 69.9% 80.0% 72.1% 81.3% 70.7% 75.9% 69.1% 71.6% 79.0% 65.9% 90.0% 76.9% 60.7% 78.4% 100.0% - 71.5% - - ** ** k ** N Q
No43 12 31 6 31 3 36 7 17 19 13 30 1 12 24 19 - 43 43 - -
28.5% 25.0% 30.1% 20.0% 27.9% 18.8% 29.3% 24.1% 30.9% 28.4% 21.0% 34.1% 10.0% 23.1% 39.3% 21.6% - 100.0% 28.5% - - ** ** j ** O P
Don't know24 8 16 5 16 2 20 4 11 9 3 21 1 2 12 12 - - 24 - -
HEDIS/CAHPSSUMMARYRATE - Yes
108 36 72 24 80 13 87 22 38 48 49 58 9 40 37 69 108 - 108 - -71.5% 75.0% 69.9% 80.0% 72.1% 81.3% 70.7% 75.9% 69.1% 71.6% 79.0% 65.9% 90.0% 76.9% 60.7% 78.4% 100.0% - 71.5% - -
** ** k ** N Q
Cell Contents: - Count- Column Percentage- Statistical Test ResultsStatistics: - Column Proportions: Columns Tested (5%): A/B, C/D, E/F, G/H/I, J/K,L/M, N/O, P/Q, R/S/T, (10%): a/b, c/d, e/f, g/h/i, j/k,l/m, n/o, p/q, r/s/t Minimum Base: 30 (**), Small Base: 30 (*)
Presented by SPH Analytics770-978-3173
2016
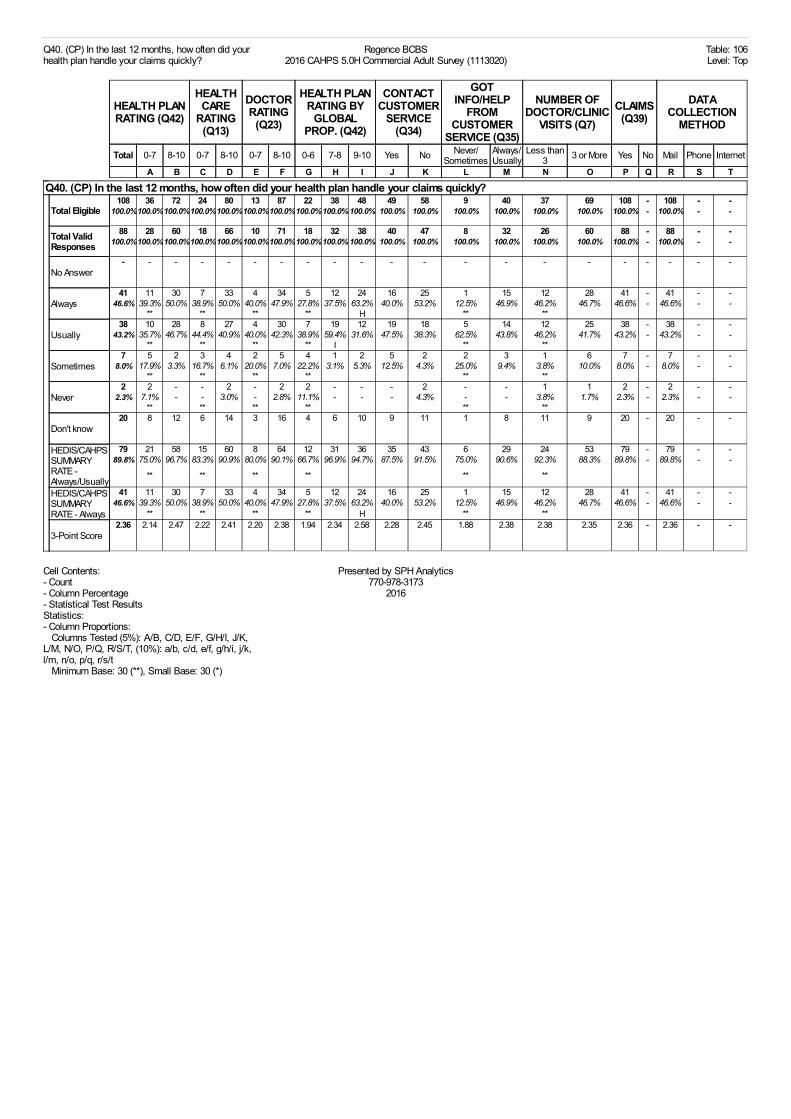
Q40. (CP) In the last 12 months, how often did yourhealth plan handle your claims quickly?
Regence BCBS2016 CAHPS 5.0H Commercial Adult Survey (1113020)
Table: 106Level: Top
HEALTH PLANRATING (Q42)
HEALTHCARE
RATING(Q13)
DOCTORRATING
(Q23)
HEALTH PLANRATING BY
GLOBALPROP. (Q42)
CONTACTCUSTOMER
SERVICE(Q34)
GOTINFO/HELP
FROMCUSTOMER
SERVICE (Q35)
NUMBER OFDOCTOR/CLINIC
VISITS (Q7)CLAIMS
(Q39)DATA
COLLECTIONMETHOD
Total 0-7 8-10 0-7 8-10 0-7 8-10 0-6 7-8 9-10 Yes No Never/Sometimes
Always/Usually
Less than3 3 or More Yes No Mail Phone Internet
A B C D E F G H I J K L M N O P Q R S T
Q40. (CP) In the last 12 months, how often did your health plan handle your claims quickly?
Total Eligible108 36 72 24 80 13 87 22 38 48 49 58 9 40 37 69 108 - 108 - -
100.0%100.0%100.0%100.0%100.0%100.0%100.0%100.0%100.0% 100.0% 100.0% 100.0% 100.0% 100.0% 100.0% 100.0% 100.0% - 100.0% - -
Total ValidResponses
88 28 60 18 66 10 71 18 32 38 40 47 8 32 26 60 88 - 88 - -100.0%100.0%100.0%100.0%100.0%100.0%100.0%100.0%100.0% 100.0% 100.0% 100.0% 100.0% 100.0% 100.0% 100.0% 100.0% - 100.0% - -
No Answer- - - - - - - - - - - - - - - - - - - - -
Always41 11 30 7 33 4 34 5 12 24 16 25 1 15 12 28 41 - 41 - -
46.6% 39.3% 50.0% 38.9% 50.0% 40.0% 47.9% 27.8% 37.5% 63.2% 40.0% 53.2% 12.5% 46.9% 46.2% 46.7% 46.6% - 46.6% - - ** ** ** ** H ** **
Usually38 10 28 8 27 4 30 7 19 12 19 18 5 14 12 25 38 - 38 - -
43.2% 35.7% 46.7% 44.4% 40.9% 40.0% 42.3% 38.9% 59.4% 31.6% 47.5% 38.3% 62.5% 43.8% 46.2% 41.7% 43.2% - 43.2% - - ** ** ** ** I ** **
Sometimes7 5 2 3 4 2 5 4 1 2 5 2 2 3 1 6 7 - 7 - -
8.0% 17.9% 3.3% 16.7% 6.1% 20.0% 7.0% 22.2% 3.1% 5.3% 12.5% 4.3% 25.0% 9.4% 3.8% 10.0% 8.0% - 8.0% - - ** ** ** ** ** **
Never2 2 - - 2 - 2 2 - - - 2 - - 1 1 2 - 2 - -
2.3% 7.1% - - 3.0% - 2.8% 11.1% - - - 4.3% - - 3.8% 1.7% 2.3% - 2.3% - - ** ** ** ** ** **
Don't know20 8 12 6 14 3 16 4 6 10 9 11 1 8 11 9 20 - 20 - -
HEDIS/CAHPSSUMMARYRATE -Always/Usually
79 21 58 15 60 8 64 12 31 36 35 43 6 29 24 53 79 - 79 - -89.8% 75.0% 96.7% 83.3% 90.9% 80.0% 90.1% 66.7% 96.9% 94.7% 87.5% 91.5% 75.0% 90.6% 92.3% 88.3% 89.8% - 89.8% - -
** ** ** ** ** **
HEDIS/CAHPSSUMMARYRATE - Always
41 11 30 7 33 4 34 5 12 24 16 25 1 15 12 28 41 - 41 - -46.6% 39.3% 50.0% 38.9% 50.0% 40.0% 47.9% 27.8% 37.5% 63.2% 40.0% 53.2% 12.5% 46.9% 46.2% 46.7% 46.6% - 46.6% - -
** ** ** ** H ** **
3-Point Score2.36 2.14 2.47 2.22 2.41 2.20 2.38 1.94 2.34 2.58 2.28 2.45 1.88 2.38 2.38 2.35 2.36 - 2.36 - -
Cell Contents: - Count- Column Percentage- Statistical Test ResultsStatistics: - Column Proportions: Columns Tested (5%): A/B, C/D, E/F, G/H/I, J/K,L/M, N/O, P/Q, R/S/T, (10%): a/b, c/d, e/f, g/h/i, j/k,l/m, n/o, p/q, r/s/t Minimum Base: 30 (**), Small Base: 30 (*)
Presented by SPH Analytics770-978-3173
2016

Q41. (CP) In the last 12 months, how often did yourhealth plan handle your claims correctly?
Regence BCBS2016 CAHPS 5.0H Commercial Adult Survey (1113020)
Table: 107Level: Top
HEALTH PLANRATING (Q42)
HEALTHCARE
RATING(Q13)
DOCTORRATING
(Q23)
HEALTH PLANRATING BY
GLOBALPROP. (Q42)
CONTACTCUSTOMER
SERVICE(Q34)
GOTINFO/HELP
FROMCUSTOMER
SERVICE (Q35)
NUMBER OFDOCTOR/CLINIC
VISITS (Q7)CLAIMS
(Q39)DATA
COLLECTIONMETHOD
Total 0-7 8-10 0-7 8-10 0-7 8-10 0-6 7-8 9-10 Yes No Never/Sometimes
Always/Usually
Less than3 3 or More Yes No Mail Phone Internet
A B C D E F G H I J K L M N O P Q R S T
Q41. (CP) In the last 12 months, how often did your health plan handle your claims correctly?
Total Eligible108 36 72 24 80 13 87 22 38 48 49 58 9 40 37 69 108 - 108 - -
100.0%100.0%100.0%100.0%100.0% 100.0% 100.0%100.0%100.0%100.0% 100.0% 100.0% 100.0% 100.0% 100.0% 100.0% 100.0% - 100.0% - -
Total ValidResponses
90 26 64 14 72 9 73 16 31 43 44 45 7 37 28 60 90 - 90 - -100.0%100.0%100.0%100.0%100.0% 100.0% 100.0%100.0%100.0%100.0% 100.0% 100.0% 100.0% 100.0% 100.0% 100.0% 100.0% - 100.0% - -
No Answer- - - - - - - - - - - - - - - - - - - - -
Always60 16 44 9 48 5 49 7 21 32 25 34 2 23 20 39 60 - 60 - -
66.7% 61.5% 68.8% 64.3% 66.7% 55.6% 67.1% 43.8% 67.7% 74.4% 56.8% 75.6% 28.6% 62.2% 71.4% 65.0% 66.7% - 66.7% - - ** ** ** ** j ** **
Usually26 8 18 4 22 4 20 7 9 10 15 11 2 13 7 19 26 - 26 - -
28.9% 30.8% 28.1% 28.6% 30.6% 44.4% 27.4% 43.8% 29.0% 23.3% 34.1% 24.4% 28.6% 35.1% 25.0% 31.7% 28.9% - 28.9% - - ** ** ** ** ** **
Sometimes4 2 2 1 2 - 4 2 1 1 4 - 3 1 1 2 4 - 4 - -
4.4% 7.7% 3.1% 7.1% 2.8% - 5.5% 12.5% 3.2% 2.3% 9.1% - 42.9% 2.7% 3.6% 3.3% 4.4% - 4.4% - - ** ** ** ** K ** **
Never- - - - - - - - - - - - - - - - - - - - -- - - - - - - - - - - - - - - - - - - - - ** ** ** ** ** **
Don't know18 10 8 10 8 4 14 6 7 5 5 13 2 3 9 9 18 - 18 - -
HEDIS/CAHPSSUMMARYRATE -Always/Usually
86 24 62 13 70 9 69 14 30 42 40 45 4 36 27 58 86 - 86 - -95.6% 92.3% 96.9% 92.9% 97.2% 100.0% 94.5% 87.5% 96.8% 97.7% 90.9% 100.0% 57.1% 97.3% 96.4% 96.7% 95.6% - 95.6% - -
** ** ** ** J ** **
HEDIS/CAHPSSUMMARYRATE - Always
60 16 44 9 48 5 49 7 21 32 25 34 2 23 20 39 60 - 60 - -66.7% 61.5% 68.8% 64.3% 66.7% 55.6% 67.1% 43.8% 67.7% 74.4% 56.8% 75.6% 28.6% 62.2% 71.4% 65.0% 66.7% - 66.7% - -
** ** ** ** j ** **
3-Point Score2.62 2.54 2.66 2.57 2.64 2.56 2.62 2.31 2.65 2.72 2.48 2.76 1.86 2.59 2.68 2.62 2.62 - 2.62 - -
Cell Contents: - Count- Column Percentage- Statistical Test ResultsStatistics: - Column Proportions: Columns Tested (5%): A/B, C/D, E/F, G/H/I, J/K,L/M, N/O, P/Q, R/S/T, (10%): a/b, c/d, e/f, g/h/i, j/k,l/m, n/o, p/q, r/s/t Minimum Base: 30 (**), Small Base: 30 (*)
Presented by SPH Analytics770-978-3173
2016

Q42. What number would you use to rate yourhealth plan?
Regence BCBS2016 CAHPS 5.0H Commercial Adult Survey (1113020)
Table: 108Level: Top
HEALTH PLANRATING (Q42)
HEALTHCARE
RATING(Q13)
DOCTORRATING
(Q23)
HEALTH PLANRATING BY
GLOBALPROP. (Q42)
CONTACTCUSTOMER
SERVICE(Q34)
GOTINFO/HELP
FROMCUSTOMER
SERVICE (Q35)
NUMBER OFDOCTOR/CLINIC
VISITS (Q7)CLAIMS
(Q39)DATA
COLLECTIONMETHOD
Total 0-7 8-10 0-7 8-10 0-7 8-10 0-6 7-8 9-10 Yes No Never/Sometimes
Always/Usually
Less than3 3 or More Yes No Mail Phone Internet
A B C D E F G H I J K L M N O P Q R S T
Q42. What number would you use to rate your health plan?
Total Eligible176 56 120 35 128 18 144 33 66 77 66 109 11 55 74 100 108 43 176 - -
100.0%100.0%100.0%100.0%100.0%100.0%100.0%100.0%100.0%100.0% 100.0% 100.0% 100.0% 100.0% 100.0% 100.0% 100.0%100.0%100.0% - -
Total ValidResponses
176 56 120 35 128 18 144 33 66 77 66 109 11 55 74 100 108 43 176 - -100.0%100.0%100.0%100.0%100.0%100.0%100.0%100.0%100.0%100.0% 100.0% 100.0% 100.0% 100.0% 100.0% 100.0% 100.0%100.0%100.0% - -
No Answer- - - - - - - - - - - - - - - - - - - - -
10 - Besthealth planpossible
26 - 26 - 25 - 26 - - 26 10 15 - 10 11 15 15 8 26 - -14.8% - 21.7% - 19.5% - 18.1% - - 33.8% 15.2% 13.8% - 18.2% 14.9% 15.0% 13.9% 18.6% 14.8% - -
A C ** GH **
951 - 51 - 50 3 44 - - 51 24 27 3 21 18 33 33 11 51 - -
29.0% - 42.5% - 39.1% 16.7% 30.6% - - 66.2% 36.4% 24.8% 27.3% 38.2% 24.3% 33.0% 30.6% 25.6% 29.0% - - A C ** GH **
843 - 43 4 33 3 36 - 43 - 16 27 2 14 22 20 24 12 43 - -
24.4% - 35.8% 11.4% 25.8% 16.7% 25.0% - 65.2% - 24.2% 24.8% 18.2% 25.5% 29.7% 20.0% 22.2% 27.9% 24.4% - - A c ** GI **
723 23 - 11 10 7 14 - 23 - 4 19 1 3 13 9 14 5 23 - -
13.1% 41.1% - 31.4% 7.8% 38.9% 9.7% - 34.8% - 6.1% 17.4% 9.1% 5.5% 17.6% 9.0% 13.0% 11.6% 13.1% - - B D ** GI J ** o
614 14 - 7 5 3 9 14 - - 6 8 3 3 2 12 10 2 14 - -
8.0% 25.0% - 20.0% 3.9% 16.7% 6.3% 42.4% - - 9.1% 7.3% 27.3% 5.5% 2.7% 12.0% 9.3% 4.7% 8.0% - - B D ** HI ** N
512 12 - 7 4 1 10 12 - - 2 10 - 2 7 5 8 3 12 - -
6.8% 21.4% - 20.0% 3.1% 5.6% 6.9% 36.4% - - 3.0% 9.2% - 3.6% 9.5% 5.0% 7.4% 7.0% 6.8% - - B D ** HI **
41 1 - - 1 - 1 1 - - - 1 - - - 1 1 - 1 - -
0.6% 1.8% - - 0.8% - 0.7% 3.0% - - - 0.9% - - - 1.0% 0.9% - 0.6% - - ** **
31 1 - 1 - - 1 1 - - 1 - - 1 - 1 - 1 1 - -
0.6% 1.8% - 2.9% - - 0.7% 3.0% - - 1.5% - - 1.8% - 1.0% - 2.3% 0.6% - - d ** **
21 1 - 1 - - 1 1 - - 1 - 1 - 1 - 1 - 1 - -
0.6% 1.8% - 2.9% - - 0.7% 3.0% - - 1.5% - 9.1% - 1.4% - 0.9% - 0.6% - - d ** **
12 2 - 2 - 1 1 2 - - 1 1 1 - - 2 1 1 2 - -
1.1% 3.6% - 5.7% - 5.6% 0.7% 6.1% - - 1.5% 0.9% 9.1% - - 2.0% 0.9% 2.3% 1.1% - - B D ** HI **
0 - Worsthealth planpossible
2 2 - 2 - - 1 2 - - 1 1 - 1 - 2 1 - 2 - -1.1% 3.6% - 5.7% - - 0.7% 6.1% - - 1.5% 0.9% - 1.8% - 2.0% 0.9% - 1.1% - -
B D ** HI **
SUMMARY - 0-3
6 6 - 6 - 1 4 6 - - 4 2 2 2 1 5 3 2 6 - -3.4% 10.7% - 17.1% - 5.6% 2.8% 18.2% - - 6.1% 1.8% 18.2% 3.6% 1.4% 5.0% 2.8% 4.7% 3.4% - -
B D ** HI **
SUMMARY - 4-7
50 50 - 25 20 11 34 27 23 - 12 38 4 8 22 27 33 10 50 - -28.4% 89.3% - 71.4% 15.6% 61.1% 23.6% 81.8% 34.8% - 18.2% 34.9% 36.4% 14.5% 29.7% 27.0% 30.6% 23.3% 28.4% - -
B D ** HI I J ** HEDIS/CAHPSSUMMARYRATE - 8-10
120 - 120 4 108 6 106 - 43 77 50 69 5 45 51 68 72 31 120 - -68.2% - 100.0% 11.4% 84.4% 33.3% 73.6% - 65.2% 100.0% 75.8% 63.3% 45.5% 81.8% 68.9% 68.0% 66.7% 72.1% 68.2% - -
A C ** G GH k ** HEDIS/CAHPSSUMMARYRATE - 9-10
77 - 77 - 75 3 70 - - 77 34 42 3 31 29 48 48 19 77 - -43.8% - 64.2% - 58.6% 16.7% 48.6% - - 100.0% 51.5% 38.5% 27.3% 56.4% 39.2% 48.0% 44.4% 44.2% 43.8% - -
A C ** GH k **
3-Point Score2.25 1.41 2.64 1.43 2.51 1.89 2.32 1.00 2.00 3.00 2.33 2.19 1.82 2.44 2.26 2.25 2.24 2.28 2.25 - -
Cell Contents: - Count- Column Percentage- Statistical Test ResultsStatistics: - Column Proportions: Columns Tested (5%): A/B, C/D, E/F, G/H/I, J/K,L/M, N/O, P/Q, R/S/T, (10%): a/b, c/d, e/f, g/h/i, j/k,l/m, n/o, p/q, r/s/t Minimum Base: 30 (**), Small Base: 30 (*)
Presented by SPH Analytics770-978-3173
2016

Q43. In general, how would you rate your overallhealth?
Regence BCBS2016 CAHPS 5.0H Commercial Adult Survey (1113020)
Table: 109Level: Top
HEALTH PLANRATING (Q42)
HEALTHCARE
RATING(Q13)
DOCTORRATING
(Q23)
HEALTH PLANRATING BY
GLOBALPROP. (Q42)
CONTACTCUSTOMER
SERVICE(Q34)
GOTINFO/HELP
FROMCUSTOMER
SERVICE (Q35)
NUMBER OFDOCTOR/CLINIC
VISITS (Q7)CLAIMS
(Q39)DATA
COLLECTIONMETHOD
Total 0-7 8-10 0-7 8-10 0-7 8-10 0-6 7-8 9-10 Yes No Never/Sometimes
Always/Usually
Less than3 3 or More Yes No Mail Phone Internet
A B C D E F G H I J K L M N O P Q R S T
Q43. In general, how would you rate your overall health?
Total Eligible176 56 120 35 128 18 144 33 66 77 66 109 11 55 74 100 108 43 176 - -
100.0%100.0%100.0%100.0%100.0%100.0%100.0%100.0%100.0%100.0% 100.0% 100.0% 100.0% 100.0% 100.0% 100.0% 100.0%100.0%100.0% - -
Total ValidResponses
176 56 120 35 128 18 144 33 66 77 66 109 11 55 74 100 108 43 176 - -100.0%100.0%100.0%100.0%100.0%100.0%100.0%100.0%100.0%100.0% 100.0% 100.0% 100.0% 100.0% 100.0% 100.0% 100.0%100.0%100.0% - -
No Answer- - - - - - - - - - - - - - - - - - - - -
Excellent42 9 33 4 33 5 33 2 20 20 19 23 2 17 21 21 25 9 42 - -
23.9% 16.1% 27.5% 11.4% 25.8% 27.8% 22.9% 6.1% 30.3% 26.0% 28.8% 21.1% 18.2% 30.9% 28.4% 21.0% 23.1% 20.9% 23.9% - - a c ** G G **
Very good65 18 47 12 48 5 51 10 21 34 24 41 1 23 31 34 38 19 65 - -
36.9% 32.1% 39.2% 34.3% 37.5% 27.8% 35.4% 30.3% 31.8% 44.2% 36.4% 37.6% 9.1% 41.8% 41.9% 34.0% 35.2% 44.2% 36.9% - - ** **
Good55 21 34 14 39 6 49 14 22 19 18 36 6 12 21 33 39 10 55 - -
31.3% 37.5% 28.3% 40.0% 30.5% 33.3% 34.0% 42.4% 33.3% 24.7% 27.3% 33.0% 54.5% 21.8% 28.4% 33.0% 36.1% 23.3% 31.3% - - ** i **
Fair12 6 6 4 7 2 9 5 3 4 5 7 2 3 1 10 6 3 12 - -
6.8% 10.7% 5.0% 11.4% 5.5% 11.1% 6.3% 15.2% 4.5% 5.2% 7.6% 6.4% 18.2% 5.5% 1.4% 10.0% 5.6% 7.0% 6.8% - - ** hi ** N
Poor2 2 - 1 1 - 2 2 - - - 2 - - - 2 - 2 2 - -
1.1% 3.6% - 2.9% 0.8% - 1.4% 6.1% - - - 1.8% - - - 2.0% - 4.7% 1.1% - - B ** HI ** P
HEDIS/CAHPSSUMMARYRATE -Excellent/Verygood
107 27 80 16 81 10 84 12 41 54 43 64 3 40 52 55 63 28 107 - -60.8% 48.2% 66.7% 45.7% 63.3% 55.6% 58.3% 36.4% 62.1% 70.1% 65.2% 58.7% 27.3% 72.7% 70.3% 55.0% 58.3% 65.1% 60.8% - -
A c ** G G ** O
Cell Contents: - Count- Column Percentage- Statistical Test ResultsStatistics: - Column Proportions: Columns Tested (5%): A/B, C/D, E/F, G/H/I, J/K,L/M, N/O, P/Q, R/S/T, (10%): a/b, c/d, e/f, g/h/i, j/k,l/m, n/o, p/q, r/s/t Minimum Base: 30 (**), Small Base: 30 (*)
Presented by SPH Analytics770-978-3173
2016

Q44. In general, how would you rate your overallmental or emotional health?
Regence BCBS2016 CAHPS 5.0H Commercial Adult Survey (1113020)
Table: 110Level: Top
HEALTH PLANRATING (Q42)
HEALTHCARE
RATING(Q13)
DOCTORRATING
(Q23)
HEALTH PLANRATING BY
GLOBALPROP. (Q42)
CONTACTCUSTOMER
SERVICE(Q34)
GOTINFO/HELP
FROMCUSTOMER
SERVICE (Q35)
NUMBER OFDOCTOR/CLINIC
VISITS (Q7)CLAIMS
(Q39)DATA
COLLECTIONMETHOD
Total 0-7 8-10 0-7 8-10 0-7 8-10 0-6 7-8 9-10 Yes No Never/Sometimes
Always/Usually
Less than3 3 or More Yes No Mail Phone Internet
A B C D E F G H I J K L M N O P Q R S T
Q44. In general, how would you rate your overall mental or emotional health?
Total Eligible176 56 120 35 128 18 144 33 66 77 66 109 11 55 74 100 108 43 176 - -
100.0%100.0%100.0%100.0%100.0%100.0%100.0%100.0%100.0%100.0% 100.0% 100.0% 100.0% 100.0% 100.0% 100.0% 100.0%100.0%100.0% - -
Total ValidResponses
174 55 119 34 127 17 143 33 64 77 66 107 11 55 73 99 107 43 174 - -100.0%100.0%100.0%100.0%100.0%100.0%100.0%100.0%100.0%100.0% 100.0% 100.0% 100.0% 100.0% 100.0% 100.0% 100.0%100.0%100.0% - -
No Answer2 1 1 1 1 1 1 - 2 - - 2 - - 1 1 1 - 2 - -
Excellent53 10 43 5 44 7 43 5 18 30 23 30 3 20 21 32 31 13 53 - -
30.5% 18.2% 36.1% 14.7% 34.6% 41.2% 30.1% 15.2% 28.1% 39.0% 34.8% 28.0% 27.3% 36.4% 28.8% 32.3% 29.0% 30.2% 30.5% - - A C ** G **
Very good76 30 46 19 50 4 61 16 32 28 29 47 4 25 37 38 45 21 76 - -
43.7% 54.5% 38.7% 55.9% 39.4% 23.5% 42.7% 48.5% 50.0% 36.4% 43.9% 43.9% 36.4% 45.5% 50.7% 38.4% 42.1% 48.8% 43.7% - - b d ** **
Good35 10 25 7 26 4 31 8 11 16 12 22 2 10 13 21 27 6 35 - -
20.1% 18.2% 21.0% 20.6% 20.5% 23.5% 21.7% 24.2% 17.2% 20.8% 18.2% 20.6% 18.2% 18.2% 17.8% 21.2% 25.2% 14.0% 20.1% - - ** **
Fair8 4 4 2 6 2 6 3 3 2 2 6 2 - 2 6 4 2 8 - -
4.6% 7.3% 3.4% 5.9% 4.7% 11.8% 4.2% 9.1% 4.7% 2.6% 3.0% 5.6% 18.2% - 2.7% 6.1% 3.7% 4.7% 4.6% - - ** **
Poor2 1 1 1 1 - 2 1 - 1 - 2 - - - 2 - 1 2 - -
1.1% 1.8% 0.8% 2.9% 0.8% - 1.4% 3.0% - 1.3% - 1.9% - - - 2.0% - 2.3% 1.1% - - ** **
HEDIS/CAHPSSUMMARYRATE -Excellent/Verygood
129 40 89 24 94 11 104 21 50 58 52 77 7 45 58 70 76 34 129 - -74.1% 72.7% 74.8% 70.6% 74.0% 64.7% 72.7% 63.6% 78.1% 75.3% 78.8% 72.0% 63.6% 81.8% 79.5% 70.7% 71.0% 79.1% 74.1% - -
** **
Cell Contents: - Count- Column Percentage- Statistical Test ResultsStatistics: - Column Proportions: Columns Tested (5%): A/B, C/D, E/F, G/H/I, J/K,L/M, N/O, P/Q, R/S/T, (10%): a/b, c/d, e/f, g/h/i, j/k,l/m, n/o, p/q, r/s/t Minimum Base: 30 (**), Small Base: 30 (*)
Presented by SPH Analytics770-978-3173
2016

Q45. Have you had either a flu shot or flu spray inthe nose since July 1, 2015? (All respondents)
Regence BCBS2016 CAHPS 5.0H Commercial Adult Survey (1113020)
Table: 111Level: Top
HEALTH PLANRATING (Q42)
HEALTHCARE
RATING(Q13)
DOCTORRATING
(Q23)
HEALTH PLANRATING BY
GLOBALPROP. (Q42)
CONTACTCUSTOMER
SERVICE(Q34)
GOTINFO/HELP
FROMCUSTOMER
SERVICE (Q35)
NUMBER OFDOCTOR/CLINIC
VISITS (Q7)CLAIMS
(Q39)DATA
COLLECTIONMETHOD
Total 0-7 8-10 0-7 8-10 0-7 8-10 0-6 7-8 9-10 Yes No Never/Sometimes
Always/Usually
Less than3 3 or More Yes No Mail Phone Internet
A B C D E F G H I J K L M N O P Q R S T
Q45. Have you had either a flu shot or flu spray in the nose since July 1, 2015? (All respondents)
Total Eligible176 56 120 35 128 18 144 33 66 77 66 109 11 55 74 100 108 43 176 - -
100.0%100.0%100.0%100.0%100.0%100.0%100.0%100.0%100.0%100.0% 100.0% 100.0% 100.0% 100.0% 100.0% 100.0% 100.0%100.0%100.0% - -
Total ValidResponses
174 55 119 34 127 18 142 33 65 76 65 108 10 55 72 100 107 42 174 - -100.0%100.0%100.0%100.0%100.0%100.0%100.0%100.0%100.0%100.0% 100.0% 100.0% 100.0% 100.0% 100.0% 100.0% 100.0%100.0%100.0% - -
No Answer- - - - - - - - - - - - - - - - - - - - -
Yes138 45 93 24 103 15 115 27 47 64 53 84 10 43 60 76 86 35 138 - -
79.3% 81.8% 78.2% 70.6% 81.1% 83.3% 81.0% 81.8% 72.3% 84.2% 81.5% 77.8% 100.0% 78.2% 83.3% 76.0% 80.4% 83.3% 79.3% - - ** h **
No36 10 26 10 24 3 27 6 18 12 12 24 - 12 12 24 21 7 36 - -
20.7% 18.2% 21.8% 29.4% 18.9% 16.7% 19.0% 18.2% 27.7% 15.8% 18.5% 22.2% - 21.8% 16.7% 24.0% 19.6% 16.7% 20.7% - - ** i **
Don't know2 1 1 1 1 - 2 - 1 1 1 1 1 - 2 - 1 1 2 - -
HEDIS/CAHPSSUMMARYRATE - Yes
138 45 93 24 103 15 115 27 47 64 53 84 10 43 60 76 86 35 138 - -79.3% 81.8% 78.2% 70.6% 81.1% 83.3% 81.0% 81.8% 72.3% 84.2% 81.5% 77.8% 100.0% 78.2% 83.3% 76.0% 80.4% 83.3% 79.3% - -
** h **
Cell Contents: - Count- Column Percentage- Statistical Test ResultsStatistics: - Column Proportions: Columns Tested (5%): A/B, C/D, E/F, G/H/I, J/K,L/M, N/O, P/Q, R/S/T, (10%): a/b, c/d, e/f, g/h/i, j/k,l/m, n/o, p/q, r/s/t Minimum Base: 30 (**), Small Base: 30 (*)
Presented by SPH Analytics770-978-3173
2016

Q45. (HEDIS) Have you had either a flu shot or fluspray in the nose since July 1, 2015? (Respondents18-64 years as of July 1 of the measurement year)
Regence BCBS2016 CAHPS 5.0H Commercial Adult Survey (1113020)
Table: 112Level: Top
HEALTH PLANRATING (Q42)
HEALTHCARE
RATING(Q13)
DOCTORRATING
(Q23)
HEALTH PLANRATING BY
GLOBALPROP. (Q42)
CONTACTCUSTOMER
SERVICE(Q34)
GOTINFO/HELP
FROMCUSTOMER
SERVICE (Q35)
NUMBER OFDOCTOR/CLINIC
VISITS (Q7)CLAIMS
(Q39)DATA
COLLECTIONMETHOD
Total 0-7 8-10 0-7 8-10 0-7 8-10 0-6 7-8 9-10 Yes No Never/Sometimes
Always/Usually
Less than3 3 or More Yes No Mail Phone Internet
A B C D E F G H I J K L M N O P Q R S T
Q45. (HEDIS) Have you had either a flu shot or flu spray in the nose since July 1, 2015? (Respondents 18-64 years as of July 1 of themeasurement year)
Total Eligible163 51 112 32 119 17 132 30 63 70 60 102 11 49 71 90 101 38 163 - -
100.0%100.0%100.0%100.0%100.0%100.0%100.0%100.0%100.0%100.0% 100.0% 100.0% 100.0% 100.0% 100.0% 100.0% 100.0%100.0%100.0% - -
Total ValidResponses
161 50 111 31 118 17 130 30 62 69 59 101 10 49 69 90 100 37 161 - -100.0%100.0%100.0%100.0%100.0%100.0%100.0%100.0%100.0%100.0% 100.0% 100.0% 100.0% 100.0% 100.0% 100.0% 100.0%100.0%100.0% - -
No Answer- - - - - - - - - - - - - - - - - - - - -
Yes128 41 87 22 96 14 106 25 45 58 49 78 10 39 58 68 82 30 128 - -
79.5% 82.0% 78.4% 71.0% 81.4% 82.4% 81.5% 83.3% 72.6% 84.1% 83.1% 77.2% 100.0% 79.6% 84.1% 75.6% 82.0% 81.1% 79.5% - - ** **
No33 9 24 9 22 3 24 5 17 11 10 23 - 10 11 22 18 7 33 - -
20.5% 18.0% 21.6% 29.0% 18.6% 17.6% 18.5% 16.7% 27.4% 15.9% 16.9% 22.8% - 20.4% 15.9% 24.4% 18.0% 18.9% 20.5% - - ** **
Don't know2 1 1 1 1 - 2 - 1 1 1 1 1 - 2 - 1 1 2 - -
HEDIS/CAHPSSUMMARYRATE - Yes
128 41 87 22 96 14 106 25 45 58 49 78 10 39 58 68 82 30 128 - -79.5% 82.0% 78.4% 71.0% 81.4% 82.4% 81.5% 83.3% 72.6% 84.1% 83.1% 77.2% 100.0% 79.6% 84.1% 75.6% 82.0% 81.1% 79.5% - -
** **
Cell Contents: - Count- Column Percentage- Statistical Test ResultsStatistics: - Column Proportions: Columns Tested (5%): A/B, C/D, E/F, G/H/I, J/K,L/M, N/O, P/Q, R/S/T, (10%): a/b, c/d, e/f, g/h/i, j/k,l/m, n/o, p/q, r/s/t Minimum Base: 30 (**), Small Base: 30 (*)
Presented by SPH Analytics770-978-3173
2016

Q46. Do you now smoke cigarettes or use tobaccoevery day, some days, or not at all?
Regence BCBS2016 CAHPS 5.0H Commercial Adult Survey (1113020)
Table: 113Level: Top
HEALTH PLANRATING (Q42)
HEALTHCARE
RATING(Q13)
DOCTORRATING
(Q23)
HEALTH PLANRATING BY
GLOBALPROP. (Q42)
CONTACTCUSTOMER
SERVICE(Q34)
GOTINFO/HELP
FROMCUSTOMER
SERVICE (Q35)
NUMBER OFDOCTOR/CLINIC
VISITS (Q7)CLAIMS
(Q39)DATA
COLLECTIONMETHOD
Total 0-7 8-10 0-7 8-10 0-7 8-10 0-6 7-8 9-10 Yes No Never/Sometimes
Always/Usually
Less than3 3 or More Yes No Mail Phone Internet
A B C D E F G H I J K L M N O P Q R S T
Q46. Do you now smoke cigarettes or use tobacco every day, some days, or not at all?
Total Eligible176 56 120 35 128 18 144 33 66 77 66 109 11 55 74 100 108 43 176 - -
100.0%100.0%100.0%100.0%100.0%100.0%100.0%100.0%100.0%100.0% 100.0% 100.0% 100.0% 100.0% 100.0% 100.0% 100.0% 100.0% 100.0% - -
Total ValidResponses
175 56 119 35 127 18 143 33 65 77 66 108 11 55 73 100 108 42 175 - -100.0%100.0%100.0%100.0%100.0%100.0%100.0%100.0%100.0%100.0% 100.0% 100.0% 100.0% 100.0% 100.0% 100.0% 100.0% 100.0% 100.0% - -
No Answer1 - 1 - 1 - 1 - 1 - - 1 - - 1 - - 1 1 - -
Every day4 2 2 1 3 - 4 2 - 2 2 2 1 1 1 3 2 - 4 - -
2.3% 3.6% 1.7% 2.9% 2.4% - 2.8% 6.1% - 2.6% 3.0% 1.9% 9.1% 1.8% 1.4% 3.0% 1.9% - 2.3% - - ** H **
Some days- - - - - - - - - - - - - - - - - - - - -- - - - - - - - - - - - - - - - - - - - - ** **
Not at all167 53 114 33 121 17 136 30 64 73 63 103 10 53 72 93 102 42 167 - -
95.4% 94.6% 95.8% 94.3% 95.3% 94.4% 95.1% 90.9% 98.5% 94.8% 95.5% 95.4% 90.9% 96.4% 98.6% 93.0% 94.4% 100.0% 95.4% - - ** g ** o
Don't know4 1 3 1 3 1 3 1 1 2 1 3 - 1 - 4 4 - 4 - -
2.3% 1.8% 2.5% 2.9% 2.4% 5.6% 2.1% 3.0% 1.5% 2.6% 1.5% 2.8% - 1.8% - 4.0% 3.7% - 2.3% - - ** ** n
HEDIS/CAHPSSUMMARYRATE - %Smokers andTobaccoUsers
4 2 2 1 3 - 4 2 - 2 2 2 1 1 1 3 2 - 4 - -2.3% 3.6% 1.7% 2.9% 2.4% - 2.8% 6.1% - 2.6% 3.0% 1.9% 9.1% 1.8% 1.4% 3.0% 1.9% - 2.3% - -
** H **
Cell Contents: - Count- Column Percentage- Statistical Test ResultsStatistics: - Column Proportions: Columns Tested (5%): A/B, C/D, E/F, G/H/I, J/K,L/M, N/O, P/Q, R/S/T, (10%): a/b, c/d, e/f, g/h/i, j/k,l/m, n/o, p/q, r/s/t Minimum Base: 30 (**), Small Base: 30 (*)
Presented by SPH Analytics770-978-3173
2016

Q47. (HEDIS) In the last 12 months, how often wereyou advised to quit smoking or using tobacco by adoctor or other health provider in your plan?
Regence BCBS2016 CAHPS 5.0H Commercial Adult Survey (1113020)
Table: 114Level: Top
HEALTH PLANRATING (Q42)
HEALTHCARE
RATING(Q13)
DOCTORRATING
(Q23)
HEALTHPLAN
RATING BYGLOBAL
PROP. (Q42)
CONTACTCUSTOMER
SERVICE(Q34)
GOTINFO/HELP
FROMCUSTOMER
SERVICE (Q35)
NUMBER OFDOCTOR/CLINIC
VISITS (Q7)CLAIMS
(Q39)DATA
COLLECTIONMETHOD
Total 0-7 8-10 0-7 8-10 0-7 8-10 0-6 7-8 9-10 Yes No Never/
SometimesAlways/Usually
Less than3 3 or More Yes No Mail Phone Internet
A B C D E F G H I J K L M N O P Q R S T
Q47. (HEDIS) In the last 12 months, how often were you advised to quit smoking or using tobacco by a doctor or other health provider in yourplan?
TotalEligible
4 2 2 1 3 - 4 2 - 2 2 2 1 1 1 3 2 - 4 - -100.0% 100.0% 100.0% 100.0% 100.0% - 100.0% 100.0% - 100.0% 100.0% 100.0% 100.0% 100.0% 100.0% 100.0% 100.0% - 100.0% - -
Total ValidResponses
4 2 2 1 3 - 4 2 - 2 2 2 1 1 1 3 2 - 4 - -100.0% 100.0% 100.0% 100.0% 100.0% - 100.0% 100.0% - 100.0% 100.0% 100.0% 100.0% 100.0% 100.0% 100.0% 100.0% - 100.0% - -
No Answer- - - - - - - - - - - - - - - - - - - - -
Always1 - 1 - 1 - 1 - - 1 - 1 - - - 1 - - 1 - -
25.0% - 50.0% - 33.3% - 25.0% - - 50.0% - 50.0% - - - 33.3% - - 25.0% - - ** ** ** ** ** ** ** ** ** ** ** **
Usually- - - - - - - - - - - - - - - - - - - - -- - - - - - - - - - - - - - - - - - - - - ** ** ** ** ** ** ** ** ** ** ** **
Sometimes1 1 - 1 - - 1 1 - - - 1 - - - 1 1 - 1 - -
25.0% 50.0% - 100.0% - - 25.0% 50.0% - - - 50.0% - - - 33.3% 50.0% - 25.0% - - ** ** ** ** ** ** ** ** ** ** ** **
Never2 1 1 - 2 - 2 1 - 1 2 - 1 1 1 1 1 - 2 - -
50.0% 50.0% 50.0% - 66.7% - 50.0% 50.0% - 50.0% 100.0% - 100.0% 100.0% 100.0% 33.3% 50.0% - 50.0% - - ** ** ** ** ** ** ** ** ** ** ** **
CURRENTYEARSUMMARYRATE -AdvisingSmokersandTobaccoUsers toQuit Rate
2 1 1 1 1 - 2 1 - 1 - 2 - - - 2 1 - 2 - -50.0% 50.0% 50.0% 100.0% 33.3% - 50.0% 50.0% - 50.0% - 100.0% - - - 66.7% 50.0% - 50.0% - -
** ** ** ** ** ** ** ** ** ** ** **
Cell Contents: - Count- Column Percentage- Statistical Test ResultsStatistics: - Column Proportions: Columns Tested (5%): A/B, C/D, E/F, G/H/I, J/K,L/M, N/O, P/Q, R/S/T, (10%): a/b, c/d, e/f, g/h/i, j/k,l/m, n/o, p/q, r/s/t Minimum Base: 30 (**), Small Base: 30 (*)
Presented by SPH Analytics770-978-3173
2016

Q48. (HEDIS) In the last 12 months, how often wasmedication recommended or discussed by a doctoror health provider to assist you with quitting smokingor using tobacco?
Regence BCBS2016 CAHPS 5.0H Commercial Adult Survey (1113020)
Table: 115Level: Top
HEALTH PLANRATING (Q42)
HEALTHCARE
RATING(Q13)
DOCTORRATING
(Q23)
HEALTHPLAN
RATING BYGLOBAL
PROP. (Q42)
CONTACTCUSTOMER
SERVICE(Q34)
GOTINFO/HELP
FROMCUSTOMER
SERVICE (Q35)
NUMBER OFDOCTOR/CLINIC
VISITS (Q7)CLAIMS
(Q39)DATA
COLLECTIONMETHOD
Total 0-7 8-10 0-7 8-10 0-7 8-10 0-6 7-8 9-10 Yes No Never/
SometimesAlways/Usually
Less than3 3 or More Yes No Mail Phone Internet
A B C D E F G H I J K L M N O P Q R S T
Q48. (HEDIS) In the last 12 months, how often was medication recommended or discussed by a doctor or health provider to assist you withquitting smoking or using tobacco?
TotalEligible
4 2 2 1 3 - 4 2 - 2 2 2 1 1 1 3 2 - 4 - -100.0% 100.0% 100.0% 100.0% 100.0% - 100.0% 100.0% - 100.0% 100.0% 100.0% 100.0% 100.0% 100.0% 100.0% 100.0% - 100.0% - -
Total ValidResponses
4 2 2 1 3 - 4 2 - 2 2 2 1 1 1 3 2 - 4 - -100.0% 100.0% 100.0% 100.0% 100.0% - 100.0% 100.0% - 100.0% 100.0% 100.0% 100.0% 100.0% 100.0% 100.0% 100.0% - 100.0% - -
No Answer- - - - - - - - - - - - - - - - - - - - -
Always1 - 1 - 1 - 1 - - 1 1 - - 1 1 - - - 1 - -
25.0% - 50.0% - 33.3% - 25.0% - - 50.0% 50.0% - - 100.0% 100.0% - - - 25.0% - - ** ** ** ** ** ** ** ** ** ** ** **
Usually- - - - - - - - - - - - - - - - - - - - -- - - - - - - - - - - - - - - - - - - - - ** ** ** ** ** ** ** ** ** ** ** **
Sometimes2 1 1 1 1 - 2 1 - 1 - 2 - - - 2 1 - 2 - -
50.0% 50.0% 50.0% 100.0% 33.3% - 50.0% 50.0% - 50.0% - 100.0% - - - 66.7% 50.0% - 50.0% - - ** ** ** ** ** ** ** ** ** ** ** **
Never1 1 - - 1 - 1 1 - - 1 - 1 - - 1 1 - 1 - -
25.0% 50.0% - - 33.3% - 25.0% 50.0% - - 50.0% - 100.0% - - 33.3% 50.0% - 25.0% - - ** ** ** ** ** ** ** ** ** ** ** **
CURRENTYEARSUMMARYRATE -DiscussingCessationMedicationsRate
3 1 2 1 2 - 3 1 - 2 1 2 - 1 1 2 1 - 3 - -75.0% 50.0% 100.0% 100.0% 66.7% - 75.0% 50.0% - 100.0% 50.0% 100.0% - 100.0% 100.0% 66.7% 50.0% - 75.0% - -
** ** ** ** ** ** ** ** ** ** ** **
Cell Contents: - Count- Column Percentage- Statistical Test ResultsStatistics: - Column Proportions: Columns Tested (5%): A/B, C/D, E/F, G/H/I, J/K,L/M, N/O, P/Q, R/S/T, (10%): a/b, c/d, e/f, g/h/i, j/k,l/m, n/o, p/q, r/s/t Minimum Base: 30 (**), Small Base: 30 (*)
Presented by SPH Analytics770-978-3173
2016

Q49. (HEDIS) In the last 12 months, how often didyour doctor or health provider discuss or providemethods and strategies other than medication toassist you with quitting smoking or using tobacco?
Regence BCBS2016 CAHPS 5.0H Commercial Adult Survey (1113020)
Table: 116Level: Top
HEALTH PLANRATING (Q42)
HEALTHCARE
RATING(Q13)
DOCTORRATING
(Q23)
HEALTHPLAN
RATING BYGLOBAL
PROP. (Q42)
CONTACTCUSTOMER
SERVICE(Q34)
GOTINFO/HELP
FROMCUSTOMER
SERVICE (Q35)
NUMBER OFDOCTOR/CLINIC
VISITS (Q7)CLAIMS
(Q39)DATA
COLLECTIONMETHOD
Total 0-7 8-10 0-7 8-10 0-7 8-10 0-6 7-8 9-10 Yes No Never/
SometimesAlways/Usually
Less than3 3 or More Yes No Mail Phone Internet
A B C D E F G H I J K L M N O P Q R S T
Q49. (HEDIS) In the last 12 months, how often did your doctor or health provider discuss or provide methods and strategies other thanmedication to assist you with quitting smoking or using tobacco?
TotalEligible
4 2 2 1 3 - 4 2 - 2 2 2 1 1 1 3 2 - 4 - -100.0% 100.0% 100.0% 100.0% 100.0% - 100.0% 100.0% - 100.0% 100.0% 100.0% 100.0% 100.0% 100.0% 100.0% 100.0% - 100.0% - -
Total ValidResponses
4 2 2 1 3 - 4 2 - 2 2 2 1 1 1 3 2 - 4 - -100.0% 100.0% 100.0% 100.0% 100.0% - 100.0% 100.0% - 100.0% 100.0% 100.0% 100.0% 100.0% 100.0% 100.0% 100.0% - 100.0% - -
No Answer- - - - - - - - - - - - - - - - - - - - -
Always- - - - - - - - - - - - - - - - - - - - -- - - - - - - - - - - - - - - - - - - - - ** ** ** ** ** ** ** ** ** ** ** **
Usually- - - - - - - - - - - - - - - - - - - - -- - - - - - - - - - - - - - - - - - - - - ** ** ** ** ** ** ** ** ** ** ** **
Sometimes1 - 1 - 1 - 1 - - 1 - 1 - - - 1 - - 1 - -
25.0% - 50.0% - 33.3% - 25.0% - - 50.0% - 50.0% - - - 33.3% - - 25.0% - - ** ** ** ** ** ** ** ** ** ** ** **
Never3 2 1 1 2 - 3 2 - 1 2 1 1 1 1 2 2 - 3 - -
75.0% 100.0% 50.0% 100.0% 66.7% - 75.0% 100.0% - 50.0% 100.0% 50.0% 100.0% 100.0% 100.0% 66.7% 100.0% - 75.0% - - ** ** ** ** ** ** ** ** ** ** ** **
CURRENTYEARSUMMARYRATE -DiscussingCessationStrategiesRate
1 - 1 - 1 - 1 - - 1 - 1 - - - 1 - - 1 - -25.0% - 50.0% - 33.3% - 25.0% - - 50.0% - 50.0% - - - 33.3% - - 25.0% - -
** ** ** ** ** ** ** ** ** ** ** **
Cell Contents: - Count- Column Percentage- Statistical Test ResultsStatistics: - Column Proportions: Columns Tested (5%): A/B, C/D, E/F, G/H/I, J/K,L/M, N/O, P/Q, R/S/T, (10%): a/b, c/d, e/f, g/h/i, j/k,l/m, n/o, p/q, r/s/t Minimum Base: 30 (**), Small Base: 30 (*)
Presented by SPH Analytics770-978-3173
2016

Q50. Do you take aspirin daily or every other day?(All respondents)
Regence BCBS2016 CAHPS 5.0H Commercial Adult Survey (1113020)
Table: 117Level: Top
HEALTH PLANRATING (Q42)
HEALTHCARE
RATING(Q13)
DOCTORRATING
(Q23)
HEALTH PLANRATING BY
GLOBALPROP. (Q42)
CONTACTCUSTOMER
SERVICE(Q34)
GOTINFO/HELP
FROMCUSTOMER
SERVICE (Q35)
NUMBER OFDOCTOR/CLINIC
VISITS (Q7)CLAIMS
(Q39)DATA
COLLECTIONMETHOD
Total 0-7 8-10 0-7 8-10 0-7 8-10 0-6 7-8 9-10 Yes No Never/Sometimes
Always/Usually
Less than3 3 or More Yes No Mail Phone Internet
A B C D E F G H I J K L M N O P Q R S T
Q50. Do you take aspirin daily or every other day? (All respondents)
Total Eligible176 56 120 35 128 18 144 33 66 77 66 109 11 55 74 100 108 43 176 - -
100.0%100.0%100.0%100.0%100.0%100.0%100.0%100.0%100.0%100.0% 100.0% 100.0% 100.0% 100.0% 100.0% 100.0% 100.0%100.0%100.0% - -
Total ValidResponses
176 56 120 35 128 18 144 33 66 77 66 109 11 55 74 100 108 43 176 - -100.0%100.0%100.0%100.0%100.0%100.0%100.0%100.0%100.0%100.0% 100.0% 100.0% 100.0% 100.0% 100.0% 100.0% 100.0%100.0%100.0% - -
No Answer- - - - - - - - - - - - - - - - - - - - -
Yes31 13 18 11 17 4 27 7 13 11 18 12 2 16 9 21 19 10 31 - -
17.6% 23.2% 15.0% 31.4% 13.3% 22.2% 18.8% 21.2% 19.7% 14.3% 27.3% 11.0% 18.2% 29.1% 12.2% 21.0% 17.6% 23.3% 17.6% - - D ** K **
No145 43 102 24 111 14 117 26 53 66 48 97 9 39 65 79 89 33 145 - -
82.4% 76.8% 85.0% 68.6% 86.7% 77.8% 81.3% 78.8% 80.3% 85.7% 72.7% 89.0% 81.8% 70.9% 87.8% 79.0% 82.4% 76.7% 82.4% - - C ** J **
Don't know- - - - - - - - - - - - - - - - - - - - -
HEDIS/CAHPSSUMMARYRATE - Yes
31 13 18 11 17 4 27 7 13 11 18 12 2 16 9 21 19 10 31 - -17.6% 23.2% 15.0% 31.4% 13.3% 22.2% 18.8% 21.2% 19.7% 14.3% 27.3% 11.0% 18.2% 29.1% 12.2% 21.0% 17.6% 23.3% 17.6% - -
D ** K **
Cell Contents: - Count- Column Percentage- Statistical Test ResultsStatistics: - Column Proportions: Columns Tested (5%): A/B, C/D, E/F, G/H/I, J/K,L/M, N/O, P/Q, R/S/T, (10%): a/b, c/d, e/f, g/h/i, j/k,l/m, n/o, p/q, r/s/t Minimum Base: 30 (**), Small Base: 30 (*)
Presented by SPH Analytics770-978-3173
2016

HEDIS Measure: Aspirin Use Regence BCBS2016 CAHPS 5.0H Commercial Adult Survey (1113020)
Table: 118Level: Top
HEALTH PLANRATING (Q42)
HEALTHCARE
RATING(Q13)
DOCTORRATING
(Q23)
HEALTH PLANRATING BY
GLOBALPROP. (Q42)
CONTACTCUSTOMER
SERVICE(Q34)
GOTINFO/HELP
FROMCUSTOMER
SERVICE (Q35)
NUMBER OFDOCTOR/CLINIC
VISITS (Q7)CLAIMS
(Q39)DATA
COLLECTIONMETHOD
Total 0-7 8-10 0-7 8-10 0-7 8-10 0-6 7-8 9-10 Yes No Never/Sometimes
Always/Usually
Less than3 3 or More Yes No Mail Phone Internet
A B C D E F G H I J K L M N O P Q R S T
HEDIS Measure: Aspirin Use
TotalEligible
176 56 120 35 128 18 144 33 66 77 66 109 11 55 74 100 108 43 176 - -100.0%100.0%100.0%100.0%100.0%100.0%100.0% 100.0% 100.0% 100.0% 100.0% 100.0% 100.0% 100.0% 100.0% 100.0% 100.0% 100.0% 100.0% - -
Total ValidResponses
23 5 18 4 18 2 21 2 8 13 11 12 1 10 13 10 8 10 23 - -100.0%100.0%100.0%100.0%100.0%100.0%100.0% 100.0% 100.0% 100.0% 100.0% 100.0% 100.0% 100.0% 100.0% 100.0% 100.0% 100.0% 100.0% - -
No Answer153 51 102 31 110 16 123 31 58 64 55 97 10 45 61 90 100 33 153 - -
CurrentYearSummaryRate
10 3 7 3 6 1 9 1 5 4 6 4 - 6 5 5 4 5 10 - -43.5% 60.0% 38.9% 75.0% 33.3% 50.0% 42.9% 50.0% 62.5% 30.8% 54.5% 33.3% - 60.0% 38.5% 50.0% 50.0% 50.0% 43.5% - -
** ** ** ** ** ** ** ** ** ** ** ** ** ** ** ** **
CurrentYearBottom BoxRate
13 2 11 1 12 1 12 1 3 9 5 8 1 4 8 5 4 5 13 - -56.5% 40.0% 61.1% 25.0% 66.7% 50.0% 57.1% 50.0% 37.5% 69.2% 45.5% 66.7% 100.0% 40.0% 61.5% 50.0% 50.0% 50.0% 56.5% - -
** ** ** ** ** ** ** ** ** ** ** ** ** ** ** ** **
Cell Contents: - Count- Column Percentage- Statistical Test ResultsStatistics: - Column Proportions: Columns Tested (5%): A/B, C/D, E/F, G/H/I, J/K,L/M, N/O, P/Q, R/S/T, (10%): a/b, c/d, e/f, g/h/i, j/k,l/m, n/o, p/q, r/s/t Minimum Base: 30 (**), Small Base: 30 (*)
Presented by SPH Analytics770-978-3173
2016

Q51. Do you have a health problem or takemedication that makes taking aspirin unsafe for you?
Regence BCBS2016 CAHPS 5.0H Commercial Adult Survey (1113020)
Table: 119Level: Top
HEALTH PLANRATING (Q42)
HEALTHCARE
RATING(Q13)
DOCTORRATING
(Q23)
HEALTH PLANRATING BY
GLOBALPROP. (Q42)
CONTACTCUSTOMER
SERVICE(Q34)
GOTINFO/HELP
FROMCUSTOMER
SERVICE (Q35)
NUMBER OFDOCTOR/CLINIC
VISITS (Q7)CLAIMS
(Q39)DATA
COLLECTIONMETHOD
Total 0-7 8-10 0-7 8-10 0-7 8-10 0-6 7-8 9-10 Yes No Never/Sometimes
Always/Usually
Less than3 3 or More Yes No Mail Phone Internet
A B C D E F G H I J K L M N O P Q R S T
Q51. Do you have a health problem or take medication that makes taking aspirin unsafe for you?
Total Eligible176 56 120 35 128 18 144 33 66 77 66 109 11 55 74 100 108 43 176 - -
100.0%100.0%100.0%100.0%100.0%100.0%100.0%100.0%100.0%100.0% 100.0% 100.0% 100.0% 100.0% 100.0% 100.0% 100.0%100.0%100.0% - -
Total ValidResponses
163 49 114 29 122 13 136 28 62 73 62 100 10 52 70 92 99 41 163 - -100.0%100.0%100.0%100.0%100.0%100.0%100.0%100.0%100.0%100.0% 100.0% 100.0% 100.0% 100.0% 100.0% 100.0% 100.0%100.0%100.0% - -
No Answer2 1 1 1 1 1 1 1 1 - 1 1 - 1 - 2 1 - 2 - -
Yes7 3 4 2 5 - 4 2 2 3 1 6 - 1 - 7 5 1 7 - -
4.3% 6.1% 3.5% 6.9% 4.1% - 2.9% 7.1% 3.2% 4.1% 1.6% 6.0% - 1.9% - 7.6% 5.1% 2.4% 4.3% - - ** ** ** ** N
No156 46 110 27 117 13 132 26 60 70 61 94 10 51 70 85 94 40 156 - -
95.7% 93.9% 96.5% 93.1% 95.9% 100.0% 97.1% 92.9% 96.8% 95.9% 98.4% 94.0% 100.0% 98.1% 100.0% 92.4% 94.9% 97.6% 95.7% - - ** ** ** ** O
Don't know11 6 5 5 5 4 7 4 3 4 3 8 1 2 4 6 8 2 11 - -
HEDIS/CAHPSSUMMARYRATE - No
156 46 110 27 117 13 132 26 60 70 61 94 10 51 70 85 94 40 156 - -95.7% 93.9% 96.5% 93.1% 95.9% 100.0% 97.1% 92.9% 96.8% 95.9% 98.4% 94.0% 100.0% 98.1% 100.0% 92.4% 94.9% 97.6% 95.7% - -
Cell Contents: - Count- Column Percentage- Statistical Test ResultsStatistics: - Column Proportions: Columns Tested (5%): A/B, C/D, E/F, G/H/I, J/K,L/M, N/O, P/Q, R/S/T, (10%): a/b, c/d, e/f, g/h/i, j/k,l/m, n/o, p/q, r/s/t Minimum Base: 30 (**), Small Base: 30 (*)
Presented by SPH Analytics770-978-3173
2016

Q52. Has a doctor or health provider ever discussedwith you the risks and benefits of aspirin to preventheart attack or stroke? (All respondents)
Regence BCBS2016 CAHPS 5.0H Commercial Adult Survey (1113020)
Table: 120Level: Top
HEALTH PLANRATING (Q42)
HEALTHCARE
RATING(Q13)
DOCTORRATING
(Q23)
HEALTH PLANRATING BY
GLOBALPROP. (Q42)
CONTACTCUSTOMER
SERVICE(Q34)
GOTINFO/HELP
FROMCUSTOMER
SERVICE (Q35)
NUMBER OFDOCTOR/CLINIC
VISITS (Q7)CLAIMS
(Q39)DATA
COLLECTIONMETHOD
Total 0-7 8-10 0-7 8-10 0-7 8-10 0-6 7-8 9-10 Yes No Never/Sometimes
Always/Usually
Less than3 3 or More Yes No Mail Phone Internet
A B C D E F G H I J K L M N O P Q R S T
Q52. Has a doctor or health provider ever discussed with you the risks and benefits of aspirin to prevent heart attack or stroke? (Allrespondents)
Total Eligible176 56 120 35 128 18 144 33 66 77 66 109 11 55 74 100 108 43 176 - -
100.0%100.0%100.0%100.0%100.0%100.0%100.0%100.0%100.0%100.0% 100.0% 100.0% 100.0% 100.0% 100.0% 100.0% 100.0%100.0%100.0% - -
Total ValidResponses
176 56 120 35 128 18 144 33 66 77 66 109 11 55 74 100 108 43 176 - -100.0%100.0%100.0%100.0%100.0%100.0%100.0%100.0%100.0%100.0% 100.0% 100.0% 100.0% 100.0% 100.0% 100.0% 100.0%100.0%100.0% - -
No Answer- - - - - - - - - - - - - - - - - - - - -
Yes51 17 34 9 40 5 44 10 20 21 21 30 2 19 15 35 27 15 51 - -
29.0% 30.4% 28.3% 25.7% 31.3% 27.8% 30.6% 30.3% 30.3% 27.3% 31.8% 27.5% 18.2% 34.5% 20.3% 35.0% 25.0% 34.9% 29.0% - - ** ** N
No125 39 86 26 88 13 100 23 46 56 45 79 9 36 59 65 81 28 125 - -
71.0% 69.6% 71.7% 74.3% 68.8% 72.2% 69.4% 69.7% 69.7% 72.7% 68.2% 72.5% 81.8% 65.5% 79.7% 65.0% 75.0% 65.1% 71.0% - - ** ** O
HEDIS/CAHPSSUMMARYRATE - Yes
51 17 34 9 40 5 44 10 20 21 21 30 2 19 15 35 27 15 51 - -29.0% 30.4% 28.3% 25.7% 31.3% 27.8% 30.6% 30.3% 30.3% 27.3% 31.8% 27.5% 18.2% 34.5% 20.3% 35.0% 25.0% 34.9% 29.0% - -
** ** N
Cell Contents: - Count- Column Percentage- Statistical Test ResultsStatistics: - Column Proportions: Columns Tested (5%): A/B, C/D, E/F, G/H/I, J/K,L/M, N/O, P/Q, R/S/T, (10%): a/b, c/d, e/f, g/h/i, j/k,l/m, n/o, p/q, r/s/t Minimum Base: 30 (**), Small Base: 30 (*)
Presented by SPH Analytics770-978-3173
2016

HEDIS Measure: Aspirin Risks and Benefits Regence BCBS2016 CAHPS 5.0H Commercial Adult Survey (1113020)
Table: 121Level: Top
HEALTH PLANRATING (Q42)
HEALTHCARE
RATING(Q13)
DOCTORRATING
(Q23)
HEALTH PLANRATING BY
GLOBALPROP. (Q42)
CONTACTCUSTOMER
SERVICE(Q34)
GOTINFO/HELP
FROMCUSTOMER
SERVICE (Q35)
NUMBER OFDOCTOR/CLINIC
VISITS (Q7)CLAIMS
(Q39)DATA
COLLECTIONMETHOD
Total 0-7 8-10 0-7 8-10 0-7 8-10 0-6 7-8 9-10 Yes No Never/Sometimes
Always/Usually
Less than3 3 or More Yes No Mail Phone Internet
A B C D E F G H I J K L M N O P Q R S T
HEDIS Measure: Aspirin Risks and Benefits
TotalEligible
176 56 120 35 128 18 144 33 66 77 66 109 11 55 74 100 108 43 176 - -100.0%100.0%100.0%100.0%100.0%100.0%100.0% 100.0% 100.0% 100.0% 100.0% 100.0% 100.0% 100.0% 100.0% 100.0% 100.0% 100.0% 100.0% - -
Total ValidResponses
79 22 57 11 63 6 69 10 28 41 28 51 1 27 34 45 42 26 79 - -100.0%100.0%100.0%100.0%100.0%100.0%100.0% 100.0% 100.0% 100.0% 100.0% 100.0% 100.0% 100.0% 100.0% 100.0% 100.0% 100.0% 100.0% - -
No Answer97 34 63 24 65 12 75 23 38 36 38 58 10 28 40 55 66 17 97 - -
CurrentYearSummaryRate
33 9 24 5 27 3 29 4 13 16 14 19 1 13 11 22 15 11 33 - -41.8% 40.9% 42.1% 45.5% 42.9% 50.0% 42.0% 40.0% 46.4% 39.0% 50.0% 37.3% 100.0% 48.1% 32.4% 48.9% 35.7% 42.3% 41.8% - -
** ** ** ** ** ** ** ** **
CurrentYearBottom BoxRate
46 13 33 6 36 3 40 6 15 25 14 32 - 14 23 23 27 15 46 - -58.2% 59.1% 57.9% 54.5% 57.1% 50.0% 58.0% 60.0% 53.6% 61.0% 50.0% 62.7% - 51.9% 67.6% 51.1% 64.3% 57.7% 58.2% - -
** ** ** ** ** ** ** ** **
Cell Contents: - Count- Column Percentage- Statistical Test ResultsStatistics: - Column Proportions: Columns Tested (5%): A/B, C/D, E/F, G/H/I, J/K,L/M, N/O, P/Q, R/S/T, (10%): a/b, c/d, e/f, g/h/i, j/k,l/m, n/o, p/q, r/s/t Minimum Base: 30 (**), Small Base: 30 (*)
Presented by SPH Analytics770-978-3173
2016

Q53. Are you aware that you have any of thefollowing conditions? Check all that apply.
Regence BCBS2016 CAHPS 5.0H Commercial Adult Survey (1113020)
Table: 122Level: Top
HEALTH PLANRATING (Q42)
HEALTHCARE
RATING(Q13)
DOCTORRATING
(Q23)
HEALTH PLANRATING BY
GLOBALPROP. (Q42)
CONTACTCUSTOMER
SERVICE(Q34)
GOTINFO/HELP
FROMCUSTOMER
SERVICE (Q35)
NUMBER OFDOCTOR/CLINIC
VISITS (Q7)CLAIMS
(Q39)DATA
COLLECTIONMETHOD
Total 0-7 8-10 0-7 8-10 0-7 8-10 0-6 7-8 9-10 Yes No Never/Sometimes
Always/Usually
Less than3 3 or More Yes No Mail Phone Internet
A B C D E F G H I J K L M N O P Q R S T
Q53. Are you aware that you have any of the following conditions? Check all that apply.
Total Eligible176 56 120 35 128 18 144 33 66 77 66 109 11 55 74 100 108 43 176 - -
100.0%100.0%100.0%100.0%100.0%100.0%100.0%100.0%100.0%100.0% 100.0% 100.0% 100.0% 100.0% 100.0% 100.0% 100.0% 100.0% 100.0% - -
Total ValidResponses
109 33 76 24 79 11 90 23 34 52 43 65 3 40 43 64 59 36 109 - -
TotalRespondents
82 23 59 16 60 10 66 15 26 41 33 48 3 30 29 51 48 24 82 - -100.0%100.0%100.0%100.0%100.0%100.0%100.0%100.0%100.0%100.0% 100.0% 100.0% 100.0% 100.0% 100.0% 100.0% 100.0% 100.0% 100.0% - -
Highcholesterol
38 12 26 10 25 5 30 9 12 17 13 25 2 11 16 21 21 11 38 - -46.3% 52.2% 44.1% 62.5% 41.7% 50.0% 45.5% 60.0% 46.2% 41.5% 39.4% 52.1% 66.7% 36.7% 55.2% 41.2% 43.8% 45.8% 46.3% - -
** ** ** ** ** ** ** **
High bloodpressure
43 11 32 8 33 3 39 8 10 25 19 23 1 18 15 27 23 15 43 - -52.4% 47.8% 54.2% 50.0% 55.0% 30.0% 59.1% 53.3% 38.5% 61.0% 57.6% 47.9% 33.3% 60.0% 51.7% 52.9% 47.9% 62.5% 52.4% - -
** ** ** ** ** ** ** ** Parent orsibling withheart attackbefore theage of 60
28 10 18 6 21 3 21 6 12 10 11 17 - 11 12 16 15 10 28 - -34.1% 43.5% 30.5% 37.5% 35.0% 30.0% 31.8% 40.0% 46.2% 24.4% 33.3% 35.4% - 36.7% 41.4% 31.4% 31.3% 41.7% 34.1% - -
** ** ** ** ** ** ** **
Cell Contents: - Count- Column Percentage- Statistical Test ResultsStatistics: - Column Proportions: Columns Tested (5%): A/B, C/D, E/F, G/H/I, J/K,L/M, N/O, P/Q, R/S/T, (10%): a/b, c/d, e/f, g/h/i, j/k,l/m, n/o, p/q, r/s/t Minimum Base: 30 (**), Small Base: 30 (*)
Presented by SPH Analytics770-978-3173
2016

Q54. Has a doctor ever told you that you have any ofthe following conditions? Check all that apply.
Regence BCBS2016 CAHPS 5.0H Commercial Adult Survey (1113020)
Table: 123Level: Top
HEALTH PLANRATING (Q42)
HEALTHCARE
RATING(Q13)
DOCTORRATING
(Q23)
HEALTH PLANRATING BY
GLOBALPROP. (Q42)
CONTACTCUSTOMER
SERVICE(Q34)
GOTINFO/HELP
FROMCUSTOMER
SERVICE (Q35)
NUMBER OFDOCTOR/CLINIC
VISITS (Q7)CLAIMS
(Q39)DATA
COLLECTIONMETHOD
Total 0-7 8-10 0-7 8-10 0-7 8-10 0-6 7-8 9-10 Yes No Never/Sometimes
Always/Usually
Less than3 3 or More Yes No Mail Phone Internet
A B C D E F G H I J K L M N O P Q R S T
Q54. Has a doctor ever told you that you have any of the following conditions? Check all that apply.
Total Eligible176 56 120 35 128 18 144 33 66 77 66 109 11 55 74 100 108 43 176 - -
100.0%100.0%100.0%100.0%100.0%100.0%100.0%100.0%100.0%100.0% 100.0% 100.0% 100.0% 100.0% 100.0% 100.0% 100.0% 100.0% 100.0% - -
Total ValidResponses
22 8 14 6 13 2 18 6 7 9 10 11 2 8 4 16 14 5 22 - -
TotalRespondents
21 8 13 6 12 2 17 6 6 9 10 10 2 8 4 15 14 5 21 - -100.0%100.0%100.0%100.0%100.0%100.0%100.0%100.0%100.0%100.0% 100.0% 100.0% 100.0% 100.0% 100.0% 100.0% 100.0% 100.0% 100.0% - -
A heart attack- - - - - - - - - - - - - - - - - - - - -- - - - - - - - - - - - - - - - - - - - - ** ** ** ** ** ** ** ** ** ** ** ** ** ** ** ** **
Angina orcoronaryheartdisease
2 - 2 - 2 - 2 - 1 1 1 1 - 1 1 1 2 - 2 - -9.5% - 15.4% - 16.7% - 11.8% - 16.7% 11.1% 10.0% 10.0% - 12.5% 25.0% 6.7% 14.3% - 9.5% - -
** ** ** ** ** ** ** ** ** ** ** ** ** ** ** ** **
A stroke4 - 4 - 3 - 4 - 2 2 1 2 - 1 - 4 3 - 4 - -
19.0% - 30.8% - 25.0% - 23.5% - 33.3% 22.2% 10.0% 20.0% - 12.5% - 26.7% 21.4% - 19.0% - - ** ** ** ** ** ** ** ** ** ** ** ** ** ** ** ** **
Any kind ofdiabetes orhigh bloodsugar
16 8 8 6 8 2 12 6 4 6 8 8 2 6 3 11 9 5 16 - -76.2% 100.0% 61.5% 100.0% 66.7% 100.0% 70.6% 100.0% 66.7% 66.7% 80.0% 80.0% 100.0% 75.0% 75.0% 73.3% 64.3% 100.0% 76.2% - -
** ** ** ** ** ** ** ** ** ** ** ** ** ** ** ** **
Cell Contents: - Count- Column Percentage- Statistical Test ResultsStatistics: - Column Proportions: Columns Tested (5%): A/B, C/D, E/F, G/H/I, J/K,L/M, N/O, P/Q, R/S/T, (10%): a/b, c/d, e/f, g/h/i, j/k,l/m, n/o, p/q, r/s/t Minimum Base: 30 (**), Small Base: 30 (*)
Presented by SPH Analytics770-978-3173
2016

Q55. In the last 12 months, have you seen a doctoror other health provider 3 or more times for the samecondition or problem?
Regence BCBS2016 CAHPS 5.0H Commercial Adult Survey (1113020)
Table: 124Level: Top
HEALTH PLANRATING (Q42)
HEALTHCARE
RATING(Q13)
DOCTORRATING
(Q23)
HEALTH PLANRATING BY
GLOBALPROP. (Q42)
CONTACTCUSTOMER
SERVICE(Q34)
GOTINFO/HELP
FROMCUSTOMER
SERVICE (Q35)
NUMBER OFDOCTOR/CLINIC
VISITS (Q7)CLAIMS
(Q39)DATA
COLLECTIONMETHOD
Total 0-7 8-10 0-7 8-10 0-7 8-10 0-6 7-8 9-10 Yes No Never/Sometimes
Always/Usually
Less than3 3 or More Yes No Mail Phone Internet
A B C D E F G H I J K L M N O P Q R S T
Q55. In the last 12 months, have you seen a doctor or other health provider 3 or more times for the same condition or problem?
Total Eligible176 56 120 35 128 18 144 33 66 77 66 109 11 55 74 100 108 43 176 - -
100.0%100.0%100.0%100.0%100.0%100.0%100.0%100.0%100.0%100.0% 100.0% 100.0% 100.0% 100.0% 100.0% 100.0% 100.0%100.0%100.0% - -
Total ValidResponses
176 56 120 35 128 18 144 33 66 77 66 109 11 55 74 100 108 43 176 - -100.0%100.0%100.0%100.0%100.0%100.0%100.0%100.0%100.0%100.0% 100.0% 100.0% 100.0% 100.0% 100.0% 100.0% 100.0%100.0%100.0% - -
No Answer- - - - - - - - - - - - - - - - - - - - -
Yes60 18 42 10 48 5 51 14 16 30 28 31 6 22 6 53 42 11 60 - -
34.1% 32.1% 35.0% 28.6% 37.5% 27.8% 35.4% 42.4% 24.2% 39.0% 42.4% 28.4% 54.5% 40.0% 8.1% 53.0% 38.9% 25.6% 34.1% - - ** h h k ** N
No116 38 78 25 80 13 93 19 50 47 38 78 5 33 68 47 66 32 116 - -
65.9% 67.9% 65.0% 71.4% 62.5% 72.2% 64.6% 57.6% 75.8% 61.0% 57.6% 71.6% 45.5% 60.0% 91.9% 47.0% 61.1% 74.4% 65.9% - - ** gi j ** O
HEDIS/CAHPSSUMMARYRATE - Yes
60 18 42 10 48 5 51 14 16 30 28 31 6 22 6 53 42 11 60 - -34.1% 32.1% 35.0% 28.6% 37.5% 27.8% 35.4% 42.4% 24.2% 39.0% 42.4% 28.4% 54.5% 40.0% 8.1% 53.0% 38.9% 25.6% 34.1% - -
** h h k ** N
Cell Contents: - Count- Column Percentage- Statistical Test ResultsStatistics: - Column Proportions: Columns Tested (5%): A/B, C/D, E/F, G/H/I, J/K,L/M, N/O, P/Q, R/S/T, (10%): a/b, c/d, e/f, g/h/i, j/k,l/m, n/o, p/q, r/s/t Minimum Base: 30 (**), Small Base: 30 (*)
Presented by SPH Analytics770-978-3173
2016

Q56. Is this a condition or problem that has lastedfor at least 3 months? Do not include pregnancy ormenopause.
Regence BCBS2016 CAHPS 5.0H Commercial Adult Survey (1113020)
Table: 125Level: Top
HEALTH PLANRATING (Q42)
HEALTHCARE
RATING(Q13)
DOCTORRATING
(Q23)
HEALTH PLANRATING BY
GLOBALPROP. (Q42)
CONTACTCUSTOMER
SERVICE(Q34)
GOTINFO/HELP
FROMCUSTOMER
SERVICE (Q35)
NUMBER OFDOCTOR/CLINIC
VISITS (Q7)CLAIMS
(Q39)DATA
COLLECTIONMETHOD
Total 0-7 8-10 0-7 8-10 0-7 8-10 0-6 7-8 9-10 Yes No Never/Sometimes
Always/Usually
Less than3 3 or More Yes No Mail Phone Internet
A B C D E F G H I J K L M N O P Q R S T
Q56. Is this a condition or problem that has lasted for at least 3 months? Do not include pregnancy or menopause.
Total Eligible60 18 42 10 48 5 51 14 16 30 28 31 6 22 6 53 42 11 60 - -
100.0%100.0%100.0%100.0%100.0%100.0%100.0%100.0%100.0%100.0% 100.0% 100.0% 100.0% 100.0% 100.0% 100.0% 100.0% 100.0% 100.0% - -
Total ValidResponses
58 18 40 10 46 5 49 14 15 29 26 31 6 20 6 51 40 11 58 - -100.0%100.0%100.0%100.0%100.0%100.0%100.0%100.0%100.0%100.0% 100.0% 100.0% 100.0% 100.0% 100.0% 100.0% 100.0% 100.0% 100.0% - -
No Answer2 - 2 - 2 - 2 - 1 1 2 - - 2 - 2 2 - 2 - -
Yes51 16 35 10 40 5 43 12 15 24 22 29 5 17 5 45 33 11 51 - -
87.9% 88.9% 87.5% 100.0% 87.0% 100.0% 87.8% 85.7% 100.0% 82.8% 84.6% 93.5% 83.3% 85.0% 83.3% 88.2% 82.5% 100.0% 87.9% - - ** ** ** ** ** ** ** ** ** ** **
No7 2 5 - 6 - 6 2 - 5 4 2 1 3 1 6 7 - 7 - -
12.1% 11.1% 12.5% - 13.0% - 12.2% 14.3% - 17.2% 15.4% 6.5% 16.7% 15.0% 16.7% 11.8% 17.5% - 12.1% - - ** ** ** ** ** ** ** ** ** ** **
HEDIS/CAHPSSUMMARYRATE - Yes
51 16 35 10 40 5 43 12 15 24 22 29 5 17 5 45 33 11 51 - -87.9% 88.9% 87.5% 100.0% 87.0% 100.0% 87.8% 85.7% 100.0% 82.8% 84.6% 93.5% 83.3% 85.0% 83.3% 88.2% 82.5% 100.0% 87.9% - -
** ** ** ** ** ** ** ** ** ** **
Cell Contents: - Count- Column Percentage- Statistical Test ResultsStatistics: - Column Proportions: Columns Tested (5%): A/B, C/D, E/F, G/H/I, J/K,L/M, N/O, P/Q, R/S/T, (10%): a/b, c/d, e/f, g/h/i, j/k,l/m, n/o, p/q, r/s/t Minimum Base: 30 (**), Small Base: 30 (*)
Presented by SPH Analytics770-978-3173
2016

Q57. Do you now need or take medicine prescribedby a doctor? Do not include birth control.
Regence BCBS2016 CAHPS 5.0H Commercial Adult Survey (1113020)
Table: 126Level: Top
HEALTH PLANRATING (Q42)
HEALTHCARE
RATING(Q13)
DOCTORRATING
(Q23)
HEALTH PLANRATING BY
GLOBALPROP. (Q42)
CONTACTCUSTOMER
SERVICE(Q34)
GOTINFO/HELP
FROMCUSTOMER
SERVICE (Q35)
NUMBER OFDOCTOR/CLINIC
VISITS (Q7)CLAIMS
(Q39)DATA
COLLECTIONMETHOD
Total 0-7 8-10 0-7 8-10 0-7 8-10 0-6 7-8 9-10 Yes No Never/Sometimes
Always/Usually
Less than3 3 or More Yes No Mail Phone Internet
A B C D E F G H I J K L M N O P Q R S T
Q57. Do you now need or take medicine prescribed by a doctor? Do not include birth control.
Total Eligible176 56 120 35 128 18 144 33 66 77 66 109 11 55 74 100 108 43 176 - -
100.0%100.0%100.0%100.0%100.0%100.0%100.0%100.0%100.0%100.0% 100.0% 100.0% 100.0% 100.0% 100.0% 100.0% 100.0%100.0%100.0% - -
Total ValidResponses
173 54 119 33 128 17 142 32 65 76 66 107 11 55 73 98 106 43 173 - -100.0%100.0%100.0%100.0%100.0%100.0%100.0%100.0%100.0%100.0% 100.0% 100.0% 100.0% 100.0% 100.0% 100.0% 100.0%100.0%100.0% - -
No Answer3 2 1 2 - 1 2 1 1 1 - 2 - - 1 2 2 - 3 - -
Yes110 36 74 24 84 12 95 23 37 50 41 69 8 33 41 68 69 29 110 - -
63.6% 66.7% 62.2% 72.7% 65.6% 70.6% 66.9% 71.9% 56.9% 65.8% 62.1% 64.5% 72.7% 60.0% 56.2% 69.4% 65.1% 67.4% 63.6% - - ** ** n
No63 18 45 9 44 5 47 9 28 26 25 38 3 22 32 30 37 14 63 - -
36.4% 33.3% 37.8% 27.3% 34.4% 29.4% 33.1% 28.1% 43.1% 34.2% 37.9% 35.5% 27.3% 40.0% 43.8% 30.6% 34.9% 32.6% 36.4% - - ** ** o
HEDIS/CAHPSSUMMARYRATE - Yes
110 36 74 24 84 12 95 23 37 50 41 69 8 33 41 68 69 29 110 - -63.6% 66.7% 62.2% 72.7% 65.6% 70.6% 66.9% 71.9% 56.9% 65.8% 62.1% 64.5% 72.7% 60.0% 56.2% 69.4% 65.1% 67.4% 63.6% - -
** ** n
Cell Contents: - Count- Column Percentage- Statistical Test ResultsStatistics: - Column Proportions: Columns Tested (5%): A/B, C/D, E/F, G/H/I, J/K,L/M, N/O, P/Q, R/S/T, (10%): a/b, c/d, e/f, g/h/i, j/k,l/m, n/o, p/q, r/s/t Minimum Base: 30 (**), Small Base: 30 (*)
Presented by SPH Analytics770-978-3173
2016

Q58. Is this to treat a condition that has lasted for atleast 3 months? Do not include pregnancy ormenopause.
Regence BCBS2016 CAHPS 5.0H Commercial Adult Survey (1113020)
Table: 127Level: Top
HEALTH PLANRATING (Q42)
HEALTHCARE
RATING(Q13)
DOCTORRATING
(Q23)
HEALTH PLANRATING BY
GLOBALPROP. (Q42)
CONTACTCUSTOMER
SERVICE(Q34)
GOTINFO/HELP
FROMCUSTOMER
SERVICE (Q35)
NUMBER OFDOCTOR/CLINIC
VISITS (Q7)CLAIMS
(Q39)DATA
COLLECTIONMETHOD
Total 0-7 8-10 0-7 8-10 0-7 8-10 0-6 7-8 9-10 Yes No Never/Sometimes
Always/Usually
Less than3 3 or More Yes No Mail Phone Internet
A B C D E F G H I J K L M N O P Q R S T
Q58. Is this to treat a condition that has lasted for at least 3 months? Do not include pregnancy or menopause.
Total Eligible110 36 74 24 84 12 95 23 37 50 41 69 8 33 41 68 69 29 110 - -
100.0%100.0%100.0%100.0%100.0%100.0%100.0%100.0%100.0%100.0% 100.0% 100.0% 100.0% 100.0% 100.0% 100.0% 100.0%100.0%100.0% - -
Total ValidResponses
110 36 74 24 84 12 95 23 37 50 41 69 8 33 41 68 69 29 110 - -100.0%100.0%100.0%100.0%100.0%100.0%100.0%100.0%100.0%100.0% 100.0% 100.0% 100.0% 100.0% 100.0% 100.0% 100.0%100.0%100.0% - -
No Answer- - - - - - - - - - - - - - - - - - - - -
Yes103 32 71 22 79 11 89 20 35 48 39 64 8 31 37 65 65 26 103 - -
93.6% 88.9% 95.9% 91.7% 94.0% 91.7% 93.7% 87.0% 94.6% 96.0% 95.1% 92.8% 100.0% 93.9% 90.2% 95.6% 94.2% 89.7% 93.6% - - ** ** ** ** **
No7 4 3 2 5 1 6 3 2 2 2 5 - 2 4 3 4 3 7 - -
6.4% 11.1% 4.1% 8.3% 6.0% 8.3% 6.3% 13.0% 5.4% 4.0% 4.9% 7.2% - 6.1% 9.8% 4.4% 5.8% 10.3% 6.4% - - ** ** ** ** **
HEDIS/CAHPSSUMMARYRATE - Yes
103 32 71 22 79 11 89 20 35 48 39 64 8 31 37 65 65 26 103 - -93.6% 88.9% 95.9% 91.7% 94.0% 91.7% 93.7% 87.0% 94.6% 96.0% 95.1% 92.8% 100.0% 93.9% 90.2% 95.6% 94.2% 89.7% 93.6% - -
** ** ** ** **
Cell Contents: - Count- Column Percentage- Statistical Test ResultsStatistics: - Column Proportions: Columns Tested (5%): A/B, C/D, E/F, G/H/I, J/K,L/M, N/O, P/Q, R/S/T, (10%): a/b, c/d, e/f, g/h/i, j/k,l/m, n/o, p/q, r/s/t Minimum Base: 30 (**), Small Base: 30 (*)
Presented by SPH Analytics770-978-3173
2016

Q59. What is your age? Regence BCBS2016 CAHPS 5.0H Commercial Adult Survey (1113020)
Table: 128Level: Top
HEALTH PLANRATING (Q42)
HEALTHCARE
RATING(Q13)
DOCTORRATING
(Q23)
HEALTH PLANRATING BY
GLOBALPROP. (Q42)
CONTACTCUSTOMER
SERVICE(Q34)
GOTINFO/HELP
FROMCUSTOMER
SERVICE (Q35)
NUMBER OFDOCTOR/CLINIC
VISITS (Q7)CLAIMS
(Q39)DATA
COLLECTIONMETHOD
Total 0-7 8-10 0-7 8-10 0-7 8-10 0-6 7-8 9-10 Yes No Never/Sometimes
Always/Usually
Less than3 3 or More Yes No Mail Phone Internet
A B C D E F G H I J K L M N O P Q R S T
Q59. What is your age?
TotalEligible
176 56 120 35 128 18 144 33 66 77 66 109 11 55 74 100 108 43 176 - -100.0%100.0%100.0%100.0%100.0%100.0%100.0% 100.0% 100.0% 100.0% 100.0% 100.0% 100.0% 100.0% 100.0% 100.0% 100.0% 100.0% 100.0% - -
Total ValidResponses
175 55 120 35 127 18 143 33 65 77 66 108 11 55 73 100 107 43 175 - -100.0%100.0%100.0%100.0%100.0%100.0%100.0% 100.0% 100.0% 100.0% 100.0% 100.0% 100.0% 100.0% 100.0% 100.0% 100.0% 100.0% 100.0% - -
No Answer1 1 - - 1 - 1 - 1 - - 1 - - 1 - 1 - 1 - -
18 to 242 - 2 1 1 - 2 - 1 1 1 1 1 - 1 1 - - 2 - -
1.1% - 1.7% 2.9% 0.8% - 1.4% - 1.5% 1.3% 1.5% 0.9% 9.1% - 1.4% 1.0% - - 1.1% - - ** **
25 to 3424 7 17 7 15 3 18 4 9 11 12 12 2 10 9 15 19 2 24 - -
13.7% 12.7% 14.2% 20.0% 11.8% 16.7% 12.6% 12.1% 13.8% 14.3% 18.2% 11.1% 18.2% 18.2% 12.3% 15.0% 17.8% 4.7% 13.7% - - ** ** Q
35 to 4429 14 15 6 22 4 21 8 13 8 9 20 3 6 13 16 21 2 29 - -
16.6% 25.5% 12.5% 17.1% 17.3% 22.2% 14.7% 24.2% 20.0% 10.4% 13.6% 18.5% 27.3% 10.9% 17.8% 16.0% 19.6% 4.7% 16.6% - - B ** i ** Q
45 to 5434 11 23 9 22 3 29 9 13 12 14 20 4 10 17 16 21 10 34 - -
19.4% 20.0% 19.2% 25.7% 17.3% 16.7% 20.3% 27.3% 20.0% 15.6% 21.2% 18.5% 36.4% 18.2% 23.3% 16.0% 19.6% 23.3% 19.4% - - ** **
55 to 6466 17 49 9 53 7 55 8 24 34 23 42 1 22 26 39 38 20 66 - -
37.7% 30.9% 40.8% 25.7% 41.7% 38.9% 38.5% 24.2% 36.9% 44.2% 34.8% 38.9% 9.1% 40.0% 35.6% 39.0% 35.5% 46.5% 37.7% - - c ** g **
65 to 7419 5 14 3 14 1 17 4 4 11 7 12 - 7 6 13 8 9 19 - -
10.9% 9.1% 11.7% 8.6% 11.0% 5.6% 11.9% 12.1% 6.2% 14.3% 10.6% 11.1% - 12.7% 8.2% 13.0% 7.5% 20.9% 10.9% - - ** ** P
75 or older1 1 - - - - 1 - 1 - - 1 - - 1 - - - 1 - -
0.6% 1.8% - - - - 0.7% - 1.5% - - 0.9% - - 1.4% - - - 0.6% - - ** **
SPHASUMMARYRATE -Members18 to 34
26 7 19 8 16 3 20 4 10 12 13 13 3 10 10 16 19 2 26 - -14.9% 12.7% 15.8% 22.9% 12.6% 16.7% 14.0% 12.1% 15.4% 15.6% 19.7% 12.0% 27.3% 18.2% 13.7% 16.0% 17.8% 4.7% 14.9% - -
** ** Q
SPHASUMMARYRATE -Members35 to 44
29 14 15 6 22 4 21 8 13 8 9 20 3 6 13 16 21 2 29 - -16.6% 25.5% 12.5% 17.1% 17.3% 22.2% 14.7% 24.2% 20.0% 10.4% 13.6% 18.5% 27.3% 10.9% 17.8% 16.0% 19.6% 4.7% 16.6% - -
SPHASUMMARYRATE -Members45 to 54
34 11 23 9 22 3 29 9 13 12 14 20 4 10 17 16 21 10 34 - -19.4% 20.0% 19.2% 25.7% 17.3% 16.7% 20.3% 27.3% 20.0% 15.6% 21.2% 18.5% 36.4% 18.2% 23.3% 16.0% 19.6% 23.3% 19.4% - -
SPHASUMMARYRATE -Members55 or older
86 23 63 12 67 8 73 12 29 45 30 55 1 29 33 52 46 29 86 - -49.1% 41.8% 52.5% 34.3% 52.8% 44.4% 51.0% 36.4% 44.6% 58.4% 45.5% 50.9% 9.1% 52.7% 45.2% 52.0% 43.0% 67.4% 49.1% - -
c ** G ** P
Cell Contents: - Count- Column Percentage- Statistical Test ResultsStatistics: - Column Proportions: Columns Tested (5%): A/B, C/D, E/F, G/H/I, J/K,L/M, N/O, P/Q, R/S/T, (10%): a/b, c/d, e/f, g/h/i, j/k,l/m, n/o, p/q, r/s/t Minimum Base: 30 (**), Small Base: 30 (*)
Presented by SPH Analytics770-978-3173
2016

Q60. Are you male or female? Regence BCBS2016 CAHPS 5.0H Commercial Adult Survey (1113020)
Table: 129Level: Top
HEALTH PLANRATING (Q42)
HEALTHCARE
RATING(Q13)
DOCTORRATING
(Q23)
HEALTH PLANRATING BY
GLOBALPROP. (Q42)
CONTACTCUSTOMER
SERVICE(Q34)
GOTINFO/HELP
FROMCUSTOMER
SERVICE (Q35)
NUMBER OFDOCTOR/CLINIC
VISITS (Q7)CLAIMS
(Q39)DATA
COLLECTIONMETHOD
Total 0-7 8-10 0-7 8-10 0-7 8-10 0-6 7-8 9-10 Yes No Never/Sometimes
Always/Usually
Less than3 3 or More Yes No Mail Phone Internet
A B C D E F G H I J K L M N O P Q R S T
Q60. Are you male or female?
TotalEligible
176 56 120 35 128 18 144 33 66 77 66 109 11 55 74 100 108 43 176 - -100.0%100.0%100.0%100.0%100.0%100.0%100.0% 100.0% 100.0% 100.0% 100.0% 100.0% 100.0% 100.0% 100.0% 100.0% 100.0% 100.0% 100.0% - -
Total ValidResponses
176 56 120 35 128 18 144 33 66 77 66 109 11 55 74 100 108 43 176 - -100.0%100.0%100.0%100.0%100.0%100.0%100.0% 100.0% 100.0% 100.0% 100.0% 100.0% 100.0% 100.0% 100.0% 100.0% 100.0% 100.0% 100.0% - -
No Answer- - - - - - - - - - - - - - - - - - - - -
Male60 27 33 18 38 9 48 14 22 24 24 36 5 19 26 33 36 14 60 - -
34.1% 48.2% 27.5% 51.4% 29.7% 50.0% 33.3% 42.4% 33.3% 31.2% 36.4% 33.0% 45.5% 34.5% 35.1% 33.0% 33.3% 32.6% 34.1% - - B D ** **
Female116 29 87 17 90 9 96 19 44 53 42 73 6 36 48 67 72 29 116 - -
65.9% 51.8% 72.5% 48.6% 70.3% 50.0% 66.7% 57.6% 66.7% 68.8% 63.6% 67.0% 54.5% 65.5% 64.9% 67.0% 66.7% 67.4% 65.9% - - A C ** **
Cell Contents: - Count- Column Percentage- Statistical Test ResultsStatistics: - Column Proportions: Columns Tested (5%): A/B, C/D, E/F, G/H/I, J/K,L/M, N/O, P/Q, R/S/T, (10%): a/b, c/d, e/f, g/h/i, j/k,l/m, n/o, p/q, r/s/t Minimum Base: 30 (**), Small Base: 30 (*)
Presented by SPH Analytics770-978-3173
2016

Q61. What is the highest grade or level of schoolthat you have completed?
Regence BCBS2016 CAHPS 5.0H Commercial Adult Survey (1113020)
Table: 130Level: Top
HEALTH PLANRATING (Q42)
HEALTHCARE
RATING(Q13)
DOCTORRATING
(Q23)
HEALTH PLANRATING BY
GLOBALPROP. (Q42)
CONTACTCUSTOMER
SERVICE(Q34)
GOTINFO/HELP
FROMCUSTOMER
SERVICE (Q35)
NUMBER OFDOCTOR/CLINIC
VISITS (Q7)CLAIMS
(Q39)DATA
COLLECTIONMETHOD
Total 0-7 8-10 0-7 8-10 0-7 8-10 0-6 7-8 9-10 Yes No Never/Sometimes
Always/Usually
Less than3 3 or More Yes No Mail Phone Internet
A B C D E F G H I J K L M N O P Q R S T
Q61. What is the highest grade or level of school that you have completed?
TotalEligible
176 56 120 35 128 18 144 33 66 77 66 109 11 55 74 100 108 43 176 - -100.0%100.0%100.0%100.0%100.0%100.0%100.0% 100.0% 100.0% 100.0% 100.0% 100.0% 100.0% 100.0% 100.0% 100.0% 100.0% 100.0% 100.0% - -
Total ValidResponses
175 56 119 35 127 18 143 33 66 76 65 109 11 54 73 100 107 43 175 - -100.0%100.0%100.0%100.0%100.0%100.0%100.0% 100.0% 100.0% 100.0% 100.0% 100.0% 100.0% 100.0% 100.0% 100.0% 100.0% 100.0% 100.0% - -
No Answer1 - 1 - 1 - 1 - - 1 1 - - 1 1 - 1 - 1 - -
8th gradeor less
1 1 - 1 - - 1 1 - - - 1 - - - 1 1 - 1 - -0.6% 1.8% - 2.9% - - 0.7% 3.0% - - - 0.9% - - - 1.0% 0.9% - 0.6% - -
d ** ** Some highschool, butdid notgraduate
1 - 1 - 1 - 1 - - 1 - 1 - - 1 - - 1 1 - -0.6% - 0.8% - 0.8% - 0.7% - - 1.3% - 0.9% - - 1.4% - - 2.3% 0.6% - -
** **
Highschoolgraduate orGED
5 1 4 1 4 - 5 1 1 3 2 3 - 2 2 3 2 1 5 - -2.9% 1.8% 3.4% 2.9% 3.1% - 3.5% 3.0% 1.5% 3.9% 3.1% 2.8% - 3.7% 2.7% 3.0% 1.9% 2.3% 2.9% - -
** **
Somecollege or2-yeardegree
40 10 30 7 31 3 35 6 12 22 18 21 4 14 16 23 24 11 40 - -22.9% 17.9% 25.2% 20.0% 24.4% 16.7% 24.5% 18.2% 18.2% 28.9% 27.7% 19.3% 36.4% 25.9% 21.9% 23.0% 22.4% 25.6% 22.9% - -
** **
4-yearcollegegraduate
55 16 39 10 40 8 44 10 25 20 18 37 - 18 27 28 32 14 55 - -31.4% 28.6% 32.8% 28.6% 31.5% 44.4% 30.8% 30.3% 37.9% 26.3% 27.7% 33.9% - 33.3% 37.0% 28.0% 29.9% 32.6% 31.4% - -
** ** More than4-yearcollegedegree
73 28 45 16 51 7 57 15 28 30 27 46 7 20 27 45 48 16 73 - -41.7% 50.0% 37.8% 45.7% 40.2% 38.9% 39.9% 45.5% 42.4% 39.5% 41.5% 42.2% 63.6% 37.0% 37.0% 45.0% 44.9% 37.2% 41.7% - -
** **
SPHASUMMARYRATE -Highschoolgraduate orless
7 2 5 2 5 - 7 2 1 4 2 5 - 2 3 4 3 2 7 - -4.0% 3.6% 4.2% 5.7% 3.9% - 4.9% 6.1% 1.5% 5.3% 3.1% 4.6% - 3.7% 4.1% 4.0% 2.8% 4.7% 4.0% - -
** **
SPHASUMMARYRATE -Somecollege
40 10 30 7 31 3 35 6 12 22 18 21 4 14 16 23 24 11 40 - -22.9% 17.9% 25.2% 20.0% 24.4% 16.7% 24.5% 18.2% 18.2% 28.9% 27.7% 19.3% 36.4% 25.9% 21.9% 23.0% 22.4% 25.6% 22.9% - -
** **
SPHASUMMARYRATE - 4 -yearcollegegraduate ormore
128 44 84 26 91 15 101 25 53 50 45 83 7 38 54 73 80 30 128 - -73.1% 78.6% 70.6% 74.3% 71.7% 83.3% 70.6% 75.8% 80.3% 65.8% 69.2% 76.1% 63.6% 70.4% 74.0% 73.0% 74.8% 69.8% 73.1% - -
** i **
Cell Contents: - Count- Column Percentage- Statistical Test ResultsStatistics: - Column Proportions: Columns Tested (5%): A/B, C/D, E/F, G/H/I, J/K,L/M, N/O, P/Q, R/S/T, (10%): a/b, c/d, e/f, g/h/i, j/k,l/m, n/o, p/q, r/s/t Minimum Base: 30 (**), Small Base: 30 (*)
Presented by SPH Analytics770-978-3173
2016

Q62. Are you of Hispanic or Latino origin ordescent?
Regence BCBS2016 CAHPS 5.0H Commercial Adult Survey (1113020)
Table: 131Level: Top
HEALTH PLANRATING (Q42)
HEALTHCARE
RATING(Q13)
DOCTORRATING
(Q23)
HEALTH PLANRATING BY
GLOBALPROP. (Q42)
CONTACTCUSTOMER
SERVICE(Q34)
GOTINFO/HELP
FROMCUSTOMER
SERVICE (Q35)
NUMBER OFDOCTOR/CLINIC
VISITS (Q7)CLAIMS
(Q39)DATA
COLLECTIONMETHOD
Total 0-7 8-10 0-7 8-10 0-7 8-10 0-6 7-8 9-10 Yes No Never/Sometimes
Always/Usually
Less than3 3 or More Yes No Mail Phone Internet
A B C D E F G H I J K L M N O P Q R S T
Q62. Are you of Hispanic or Latino origin or descent?
TotalEligible
176 56 120 35 128 18 144 33 66 77 66 109 11 55 74 100 108 43 176 - -100.0%100.0%100.0%100.0%100.0%100.0%100.0% 100.0% 100.0% 100.0% 100.0% 100.0% 100.0% 100.0% 100.0% 100.0% 100.0% 100.0% 100.0% - -
Total ValidResponses
169 54 115 34 122 18 138 32 62 75 62 106 11 51 70 97 104 41 169 - -100.0%100.0%100.0%100.0%100.0%100.0%100.0% 100.0% 100.0% 100.0% 100.0% 100.0% 100.0% 100.0% 100.0% 100.0% 100.0% 100.0% 100.0% - -
No Answer7 2 5 1 6 - 6 1 4 2 4 3 - 4 4 3 4 2 7 - -
Yes,Hispanic orLatino
9 4 5 2 7 2 6 1 6 2 3 6 - 3 2 7 3 6 9 - -5.3% 7.4% 4.3% 5.9% 5.7% 11.1% 4.3% 3.1% 9.7% 2.7% 4.8% 5.7% - 5.9% 2.9% 7.2% 2.9% 14.6% 5.3% - -
** i ** P No, NotHispanic orLatino
160 50 110 32 115 16 132 31 56 73 59 100 11 48 68 90 101 35 160 - -94.7% 92.6% 95.7% 94.1% 94.3% 88.9% 95.7% 96.9% 90.3% 97.3% 95.2% 94.3% 100.0% 94.1% 97.1% 92.8% 97.1% 85.4% 94.7% - -
** h ** Q
Cell Contents: - Count- Column Percentage- Statistical Test ResultsStatistics: - Column Proportions: Columns Tested (5%): A/B, C/D, E/F, G/H/I, J/K,L/M, N/O, P/Q, R/S/T, (10%): a/b, c/d, e/f, g/h/i, j/k,l/m, n/o, p/q, r/s/t Minimum Base: 30 (**), Small Base: 30 (*)
Presented by SPH Analytics770-978-3173
2016

Q63. What is your race? Please mark one or more. Regence BCBS2016 CAHPS 5.0H Commercial Adult Survey (1113020)
Table: 132Level: Top
HEALTH PLANRATING (Q42)
HEALTHCARE
RATING(Q13)
DOCTORRATING
(Q23)
HEALTH PLANRATING BY
GLOBALPROP. (Q42)
CONTACTCUSTOMER
SERVICE(Q34)
GOTINFO/HELP
FROMCUSTOMER
SERVICE (Q35)
NUMBER OFDOCTOR/CLINIC
VISITS (Q7)CLAIMS
(Q39)DATA
COLLECTIONMETHOD
Total 0-7 8-10 0-7 8-10 0-7 8-10 0-6 7-8 9-10 Yes No Never/Sometimes
Always/Usually
Less than3 3 or More Yes No Mail Phone Internet
A B C D E F G H I J K L M N O P Q R S T
Q63. What is your race? Please mark one or more.
Total Eligible176 56 120 35 128 18 144 33 66 77 66 109 11 55 74 100 108 43 176 - -
100.0%100.0%100.0%100.0%100.0%100.0%100.0%100.0%100.0%100.0% 100.0% 100.0% 100.0% 100.0% 100.0% 100.0% 100.0% 100.0% 100.0% - -
Total ValidResponses
182 59 123 38 130 18 147 35 68 79 67 114 13 54 77 103 111 42 182 - -
TotalRespondents
171 54 117 34 124 18 139 32 63 76 65 105 11 54 72 97 106 40 171 - -100.0%100.0%100.0%100.0%100.0%100.0%100.0%100.0%100.0%100.0% 100.0% 100.0% 100.0% 100.0% 100.0% 100.0% 100.0% 100.0% 100.0% - -
White137 46 91 29 99 16 110 26 51 60 53 84 9 44 56 80 86 30 137 - -
80.1% 85.2% 77.8% 85.3% 79.8% 88.9% 79.1% 81.3% 81.0% 78.9% 81.5% 80.0% 81.8% 81.5% 77.8% 82.5% 81.1% 75.0% 80.1% - - ** **
Black orAfrican-American
6 2 4 2 4 - 6 1 2 3 2 4 1 1 1 5 4 - 6 - -3.5% 3.7% 3.4% 5.9% 3.2% - 4.3% 3.1% 3.2% 3.9% 3.1% 3.8% 9.1% 1.9% 1.4% 5.2% 3.8% - 3.5% - -
** **
Asian27 4 23 3 20 2 22 4 10 13 9 17 2 7 13 13 16 8 27 - -
15.8% 7.4% 19.7% 8.8% 16.1% 11.1% 15.8% 12.5% 15.9% 17.1% 13.8% 16.2% 18.2% 13.0% 18.1% 13.4% 15.1% 20.0% 15.8% - - A ** **
NativeHawaiian orother PacificIslander
1 - 1 - 1 - 1 - 1 - - 1 - - 1 - - - 1 - -0.6% - 0.9% - 0.8% - 0.7% - 1.6% - - 1.0% - - 1.4% - - - 0.6% - -
** **
AmericanIndian orAlaska Native
6 4 2 2 3 - 4 2 2 2 1 5 1 - 2 4 2 3 6 - -3.5% 7.4% 1.7% 5.9% 2.4% - 2.9% 6.3% 3.2% 2.6% 1.5% 4.8% 9.1% - 2.8% 4.1% 1.9% 7.5% 3.5% - -
b ** ** p
Other5 3 2 2 3 - 4 2 2 1 2 3 - 2 4 1 3 1 5 - -
2.9% 5.6% 1.7% 5.9% 2.4% - 2.9% 6.3% 3.2% 1.3% 3.1% 2.9% - 3.7% 5.6% 1.0% 2.8% 2.5% 2.9% - - ** ** o
Cell Contents: - Count- Column Percentage- Statistical Test ResultsStatistics: - Column Proportions: Columns Tested (5%): A/B, C/D, E/F, G/H/I, J/K,L/M, N/O, P/Q, R/S/T, (10%): a/b, c/d, e/f, g/h/i, j/k,l/m, n/o, p/q, r/s/t Minimum Base: 30 (**), Small Base: 30 (*)
Presented by SPH Analytics770-978-3173
2016

Q64. Did someone help you complete this survey? Regence BCBS2016 CAHPS 5.0H Commercial Adult Survey (1113020)
Table: 133Level: Top
HEALTH PLANRATING (Q42)
HEALTHCARE
RATING(Q13)
DOCTORRATING
(Q23)
HEALTH PLANRATING BY
GLOBALPROP. (Q42)
CONTACTCUSTOMER
SERVICE(Q34)
GOTINFO/HELP
FROMCUSTOMER
SERVICE (Q35)
NUMBER OFDOCTOR/CLINIC
VISITS (Q7)CLAIMS
(Q39)DATA
COLLECTIONMETHOD
Total 0-7 8-10 0-7 8-10 0-7 8-10 0-6 7-8 9-10 Yes No Never/Sometimes
Always/Usually
Less than3 3 or More Yes No Mail Phone Internet
A B C D E F G H I J K L M N O P Q R S T
Q64. Did someone help you complete this survey?
TotalEligible
176 56 120 35 128 18 144 33 66 77 66 109 11 55 74 100 108 43 176 - -100.0%100.0%100.0%100.0%100.0% 100.0% 100.0% 100.0% 100.0% 100.0% 100.0% 100.0% 100.0% 100.0% 100.0% 100.0% 100.0% 100.0% 100.0% - -
Total ValidResponses
175 56 119 35 127 18 143 33 66 76 66 108 11 55 74 99 108 43 175 - -100.0%100.0%100.0%100.0%100.0% 100.0% 100.0% 100.0% 100.0% 100.0% 100.0% 100.0% 100.0% 100.0% 100.0% 100.0% 100.0% 100.0% 100.0% - -
No Answer1 - 1 - 1 - 1 - - 1 - 1 - - - 1 - - 1 - -
Yes4 2 2 3 1 - 4 2 1 1 2 2 - 2 2 2 3 1 4 - -
2.3% 3.6% 1.7% 8.6% 0.8% - 2.8% 6.1% 1.5% 1.3% 3.0% 1.9% - 3.6% 2.7% 2.0% 2.8% 2.3% 2.3% - - D ** **
No171 54 117 32 126 18 139 31 65 75 64 106 11 53 72 97 105 42 171 - -
97.7% 96.4% 98.3% 91.4% 99.2% 100.0% 97.2% 93.9% 98.5% 98.7% 97.0% 98.1% 100.0% 96.4% 97.3% 98.0% 97.2% 97.7% 97.7% - - C ** **
Cell Contents: - Count- Column Percentage- Statistical Test ResultsStatistics: - Column Proportions: Columns Tested (5%): A/B, C/D, E/F, G/H/I, J/K,L/M, N/O, P/Q, R/S/T, (10%): a/b, c/d, e/f, g/h/i, j/k,l/m, n/o, p/q, r/s/t Minimum Base: 30 (**), Small Base: 30 (*)
Presented by SPH Analytics770-978-3173
2016

Q65. How did that person help you? Check all thatapply.
Regence BCBS2016 CAHPS 5.0H Commercial Adult Survey (1113020)
Table: 134Level: Top
HEALTH PLANRATING (Q42)
HEALTHCARE
RATING(Q13)
DOCTORRATING
(Q23)
HEALTH PLANRATING BY
GLOBALPROP. (Q42)
CONTACTCUSTOMER
SERVICE(Q34)
GOTINFO/HELP
FROMCUSTOMER
SERVICE (Q35)
NUMBER OFDOCTOR/CLINIC
VISITS (Q7)CLAIMS
(Q39)DATA
COLLECTIONMETHOD
Total 0-7 8-10 0-7 8-10 0-7 8-10 0-6 7-8 9-10 Yes No Never/Sometimes
Always/Usually
Less than3 3 or More Yes No Mail Phone Internet
A B C D E F G H I J K L M N O P Q R S T
Q65. How did that person help you? Check all that apply.
Total Eligible4 2 2 3 1 - 4 2 1 1 2 2 - 2 2 2 3 1 4 - -
100.0%100.0%100.0%100.0%100.0% - 100.0%100.0%100.0% 100.0% 100.0% 100.0% - 100.0% 100.0% 100.0% 100.0% 100.0% 100.0% - -
Total ValidResponses
5 3 2 4 1 - 5 3 1 1 2 3 - 2 2 3 4 1 5 - -
TotalRespondents
4 2 2 3 1 - 4 2 1 1 2 2 - 2 2 2 3 1 4 - -100.0%100.0%100.0%100.0%100.0% - 100.0%100.0%100.0% 100.0% 100.0% 100.0% - 100.0% 100.0% 100.0% 100.0% 100.0% 100.0% - -
Read thequestions tome
1 1 - 1 - - 1 1 - - - 1 - - - 1 1 - 1 - -25.0% 50.0% - 33.3% - - 25.0% 50.0% - - - 50.0% - - - 50.0% 33.3% - 25.0% - -
** ** ** ** ** ** ** ** ** ** ** ** ** Wrote downthe answers Igave
1 1 - 1 - - 1 1 - - - 1 - - - 1 1 - 1 - -25.0% 50.0% - 33.3% - - 25.0% 50.0% - - - 50.0% - - - 50.0% 33.3% - 25.0% - -
** ** ** ** ** ** ** ** ** ** ** ** ** Answered thequestions forme
2 - 2 1 1 - 2 - 1 1 1 1 - 1 2 - 1 1 2 - -50.0% - 100.0% 33.3% 100.0% - 50.0% - 100.0% 100.0% 50.0% 50.0% - 50.0% 100.0% - 33.3% 100.0% 50.0% - -
** ** ** ** ** ** ** ** ** ** ** ** ** Translatedthe questionsinto mylanguage
- - - - - - - - - - - - - - - - - - - - -- - - - - - - - - - - - - - - - - - - - -
** ** ** ** ** ** ** ** ** ** ** ** **
Helped insome otherway
1 1 - 1 - - 1 1 - - 1 - - 1 - 1 1 - 1 - -25.0% 50.0% - 33.3% - - 25.0% 50.0% - - 50.0% - - 50.0% - 50.0% 33.3% - 25.0% - -
** ** ** ** ** ** ** ** ** ** ** ** **
Cell Contents: - Count- Column Percentage- Statistical Test ResultsStatistics: - Column Proportions: Columns Tested (5%): A/B, C/D, E/F, G/H/I, J/K,L/M, N/O, P/Q, R/S/T, (10%): a/b, c/d, e/f, g/h/i, j/k,l/m, n/o, p/q, r/s/t Minimum Base: 30 (**), Small Base: 30 (*)
Presented by SPH Analytics770-978-3173
2016

UMP UW MEDICINE ACCOUNTABLE CARE NETWORK 2016 CAHPS 5.0H Commercial Adult Survey (1113020)
TABLE OF CONTENTS
Results by Demographic
Page 1 LOYALTY
Page 2 Q66. In the last 12 months, have you visited your health plan's website?
Page 3 Q67. How would you rate your understanding of the benefits your health plan offers?
Page 4 Q68. If you had a problem understanding the benefits your health plan offers, which type(s) of benefits were you unable to understand? (Mark all that apply.)
Page 5 Q69. Would you recommend your health plan to your family or friends?
Page 6 Q70. Do you intend to switch to a different health plan when you next have an opportunity?
Page 7 Q71. In the last 12 months, did you call or were you transferred by your health plan to Washington State Rx Services?
Page 8 Q72. In the last 12 months, how often were you able to get the help you needed when you called Washington State Rx Services?
Page 9 Q73A. Please state your level of agreement with the following: I liked the overall format and appearance of the written materials.
Page 10 Q73B. Please state your level of agreement with the following: The new member materials were easy to understand.
Page 11 Q73C. Please state your level of agreement with the following: The written materials helped me to understand the health plan’s policies and procedures.
Page 12 Q73D. Please state your level of agreement with the following: The new member written materials are an effective way to provide health benefit information.
Page 13 Q73E. Please state your level of agreement with the following: The written materials helped me to understand my out-of-pocket expenses.
Page 14 Q73F. Please state your level of agreement with the following: The written materials I received from UMP Classic Plan accurately described the health care coverage I selected.
Page 15 Q74A. Please state to what extent you agree or disagree with each statement: I know how to choose or find a doctor in my plan’s network.
Page 16 Q74B. Please state to what extent you agree or disagree with each statement: I know what to do when I or a family member needs urgent or emergency care.
Page 17 Q74C. Please state to what extent you agree or disagree with each statement: I understand what services are covered and not covered in my plan.
Page 18 Q74D. Please state to what extent you agree or disagree with each statement: I understand when I need a referral to a specialist.
Page 19 Q74E. Please state to what extent you agree or disagree with each statement: I know how much I have to pay (co-pay) at the doctor’s office for a preventive care visit.
Page 20 Q74F. Please state to what extent you agree or disagree with each statement: I know which services are subject to a deductible under my coverage plan.
Page 21 Q74G. Please state to what extent you agree or disagree with each statement: I understand my right to appeal a claims or coverage decision.
Page 22 Q74H. Please state to what extent you agree or disagree with each statement: I understand my plan’s prescription drug coverage.
Page 23 Q74I. Please state to what extent you agree or disagree with each statement: I understand my health care rights for privacy and confidentiality.

UMP UW MEDICINE ACCOUNTABLE CARE NETWORK 2016 CAHPS 5.0H Commercial Adult Survey (1113020)
TABLE OF CONTENTS
Results by Survey Measures
Page 24 LOYALTY
Page 25 Q66. In the last 12 months, have you visited your health plan's website?
Page 26 Q67. How would you rate your understanding of the benefits your health plan offers?
Page 27 Q68. If you had a problem understanding the benefits your health plan offers, which type(s) of benefits were you unable to understand? (Mark all that apply.)
Page 28 Q69. Would you recommend your health plan to your family or friends?
Page 29 Q70. Do you intend to switch to a different health plan when you next have an opportunity?
Page 30 Q71. In the last 12 months, did you call or were you transferred by your health plan to Washington State Rx Services?
Page 31 Q72. In the last 12 months, how often were you able to get the help you needed when you called Washington State Rx Services?
Page 32 Q73A. Please state your level of agreement with the following: I liked the overall format and appearance of the written materials.
Page 33 Q73B. Please state your level of agreement with the following: The new member materials were easy to understand.
Page 34 Q73C. Please state your level of agreement with the following: The written materials helped me to understand the health plan’s policies and procedures.
Page 35 Q73D. Please state your level of agreement with the following: The new member written materials are an effective way to provide health benefit information.
Page 36 Q73E. Please state your level of agreement with the following: The written materials helped me to understand my out-of-pocket expenses.
Page 37 Q73F. Please state your level of agreement with the following: The written materials I received from UMP Classic Plan accurately described the health care coverage I selected.
Page 38 Q74A. Please state to what extent you agree or disagree with each statement: I know how to choose or find a doctor in my plan’s network.
Page 39 Q74B. Please state to what extent you agree or disagree with each statement: I know what to do when I or a family member needs urgent or emergency care.
Page 40 Q74C. Please state to what extent you agree or disagree with each statement: I understand what services are covered and not covered in my plan.
Page 41 Q74D. Please state to what extent you agree or disagree with each statement: I understand when I need a referral to a specialist.
Page 42 Q74E. Please state to what extent you agree or disagree with each statement: I know how much I have to pay (co-pay) at the doctor’s office for a preventive care visit.
Page 43 Q74F. Please state to what extent you agree or disagree with each statement: I know which services are subject to a deductible under my coverage plan.
Page 44 Q74G. Please state to what extent you agree or disagree with each statement: I understand my right to appeal a claims or coverage decision.
Page 45 Q74H. Please state to what extent you agree or disagree with each statement: I understand my plan’s prescription drug coverage.
Page 46 Q74I. Please state to what extent you agree or disagree with each statement: I understand my health care rights for privacy and confidentiality.

UMP UW MEDICINE ACCOUNTABLE CARE NETWORK 2016 CAHPS 5.0H Commercial Adult Survey (1113020)
TABLE OF CONTENTS
Results by Survey Administration Mode
Page 47 LOYALTY
Page 48 Q66. In the last 12 months, have you visited your health plan's website?
Page 49 Q67. How would you rate your understanding of the benefits your health plan offers?
Page 50 Q68. If you had a problem understanding the benefits your health plan offers, which type(s) of benefits were you unable to understand? (Mark all that apply.)
Page 51 Q69. Would you recommend your health plan to your family or friends?
Page 52 Q70. Do you intend to switch to a different health plan when you next have an opportunity?
Page 53 Q71. In the last 12 months, did you call or were you transferred by your health plan to Washington State Rx Services?
Page 54 Q72. In the last 12 months, how often were you able to get the help you needed when you called Washington State Rx Services?
Page 55 Q73A. Please state your level of agreement with the following: I liked the overall format and appearance of the written materials.
Page 56 Q73B. Please state your level of agreement with the following: The new member materials were easy to understand.
Page 57 Q73C. Please state your level of agreement with the following: The written materials helped me to understand the health plan’s policies and procedures.
Page 58 Q73D. Please state your level of agreement with the following: The new member written materials are an effective way to provide health benefit information.
Page 59 Q73E. Please state your level of agreement with the following: The written materials helped me to understand my out-of-pocket expenses.
Page 60 Q73F. Please state your level of agreement with the following: The written materials I received from UMP Classic Plan accurately described the health care coverage I selected.
Page 61 Q74A. Please state to what extent you agree or disagree with each statement: I know how to choose or find a doctor in my plan’s network.
Page 62 Q74B. Please state to what extent you agree or disagree with each statement: I know what to do when I or a family member needs urgent or emergency care.
Page 63 Q74C. Please state to what extent you agree or disagree with each statement: I understand what services are covered and not covered in my plan.
Page 64 Q74D. Please state to what extent you agree or disagree with each statement: I understand when I need a referral to a specialist.
Page 65 Q74E. Please state to what extent you agree or disagree with each statement: I know how much I have to pay (co-pay) at the doctor’s office for a preventive care visit.
Page 66 Q74F. Please state to what extent you agree or disagree with each statement: I know which services are subject to a deductible under my coverage plan.
Page 67 Q74G. Please state to what extent you agree or disagree with each statement: I understand my right to appeal a claims or coverage decision.
Page 68 Q74H. Please state to what extent you agree or disagree with each statement: I understand my plan’s prescription drug coverage.
Page 69 Q74I. Please state to what extent you agree or disagree with each statement: I understand my health care rights for privacy and confidentiality.

Page 1
UMP UW MEDICINE ACCOUNTABLE CARE NETWORK 2016 CAHPS 5.0H Commercial Adult Survey (1113020)
LOYALTY
========= AGE ========= = EDUCATION = === GENDER == == ETHNICITY == ========= RACE ======== === HEALTH STATUS === === MENTAL HEALTH === HS/ Some Not Black/ Exclnt/ Exclnt/ GED/ Colg/ Hspnc/ Hspnc/ African Very Fair/ Very Fair/ Total 18-34 35-44 45-54 55+ Less Grad+ Male Female Latino Latino White Am Other Good Good Poor Good Good Poor ------ ----- ----- ----- ----- ------ ------ ------ ------ ------- ------- ------- ------- ------- ------- ------ ------ ------- ------ ------
Total Eligible 175 26 29 34 85 6 168 59 116 9 159 136 6 39 107 54 14 129 34 10
Total Valid Responses 175 26 29 34 85 6 168 59 116 9 159 136 6 39 107 54 14 129 34 10 100.0% 100% 100% 100% 100% 100.0% 100.0% 100.0% 100.0% 100.0% 100.0% 100.0% 100.0% 100.0% 100.0% 100.0% 100.0% 100.0% 100.0% 100.0%
LOYALTY ZONE 77 11 7 19 40 3 73 21 56 3 70 57 3 17 55 18 4 60 14 2 44.0% 42.3% 24.1% 55.9% 47.1% 50.0% 43.5% 35.6% 48.3% 33.3% 44.0% 41.9% 50.0% 43.6% 51.4% 33.3% 28.6% 46.5% 41.2% 20.0%
INDIFFERENT ZONE 93 14 22 14 42 3 90 35 58 5 85 76 2 20 52 36 5 66 20 6 53.1% 53.8% 75.9% 41.2% 49.4% 50.0% 53.6% 59.3% 50.0% 55.6% 53.5% 55.9% 33.3% 51.3% 48.6% 66.7% 35.7% 51.2% 58.8% 60.0%
DEFECTION ZONE 5 1 - 1 3 - 5 3 2 1 4 3 1 2 - - 5 3 - 2 2.9% 3.8% 2.9% 3.5% 3.0% 5.1% 1.7% 11.1% 2.5% 2.2% 16.7% 5.1% 35.7% 2.3% 20.0%
Presented by SPH Analytics 770-978-3173 2016

Page 2
UMP UW MEDICINE ACCOUNTABLE CARE NETWORK 2016 CAHPS 5.0H Commercial Adult Survey (1113020)
Q66. In the last 12 months, have you visited your health plan's website?
========= AGE ========= = EDUCATION = === GENDER == == ETHNICITY == ========= RACE ======== === HEALTH STATUS === === MENTAL HEALTH === HS/ Some Not Black/ Exclnt/ Exclnt/ GED/ Colg/ Hspnc/ Hspnc/ African Very Fair/ Very Fair/ Total 18-34 35-44 45-54 55+ Less Grad+ Male Female Latino Latino White Am Other Good Good Poor Good Good Poor ------ ----- ----- ----- ----- ------ ------ ------ ------ ------- ------- ------- ------- ------- ------- ------ ------ ------- ------ ------ (A) (B) (C) (D) (E) (F) (G) (H) (I) (J) (K) (L) (M) (N) (O) (P) (Q) (R) (S) (T)
Total Eligible 176 26 29 34 86 7 168 60 116 9 160 137 6 39 107 55 14 129 35 10
Total Answering 173 26 28 33 85 7 165 59 114 9 158 136 6 37 106 53 14 128 33 10 100.0% 100% 100% 100% 100% 100.0% 100.0% 100.0% 100.0% 100.0% 100.0% 100.0% 100.0% 100.0% 100.0% 100.0% 100.0% 100.0% 100.0% 100.0%
No Answer 2 - 1 1 - - 2 1 1 - 2 1 - 1 1 1 - 1 1 -
Yes 135 23 26 26 59 4 130 44 91 7 123 106 4 29 87 37 11 104 24 6 78.0% 88.5% 92.9% 78.8% 69.4% 57.1% 78.8% 74.6% 79.8% 77.8% 77.8% 77.9% 66.7% 78.4% 82.1% 69.8% 78.6% 81.3% 72.7% 60.0% E E p
No 38 3 2 7 26 3 35 15 23 2 35 30 2 8 19 16 3 24 9 4 22.0% 11.5% 7.1% 21.2% 30.6% 42.9% 21.2% 25.4% 20.2% 22.2% 22.2% 22.1% 33.3% 21.6% 17.9% 30.2% 21.4% 18.8% 27.3% 40.0% BC o
I don't use or have 1 - - - 1 - 1 - 1 - - - - 1 - 1 - - 1 -convenient access to the Internet
SPHA SUMMARY RATE - Yes 135 23 26 26 59 4 130 44 91 7 123 106 4 29 87 37 11 104 24 6 78.0% 88.5% 92.9% 78.8% 69.4% 57.1% 78.8% 74.6% 79.8% 77.8% 77.8% 77.9% 66.7% 78.4% 82.1% 69.8% 78.6% 81.3% 72.7% 60.0% E E p
Comparison Groups: BCDE/FG/HI/JK/LMN/OPQ/RSTIndependent Z-Test for Percentages (unpooled proportions)Uppercase letters indicate significance at the 95% level.Lowercase letters indicate significance at the 90% level.Note: When comparing groups the Z-Test is only valid for large sample sizes (generally, n >=30) Presented by SPH Analytics 770-978-3173 2016

Page 3
UMP UW MEDICINE ACCOUNTABLE CARE NETWORK 2016 CAHPS 5.0H Commercial Adult Survey (1113020)
Q67. How would you rate your understanding of the benefits your health plan offers?
========= AGE ========= = EDUCATION = === GENDER == == ETHNICITY == ========= RACE ======== === HEALTH STATUS === === MENTAL HEALTH === HS/ Some Not Black/ Exclnt/ Exclnt/ GED/ Colg/ Hspnc/ Hspnc/ African Very Fair/ Very Fair/ Total 18-34 35-44 45-54 55+ Less Grad+ Male Female Latino Latino White Am Other Good Good Poor Good Good Poor ------ ----- ----- ----- ----- ------ ------ ------ ------ ------- ------- ------- ------- ------- ------- ------ ------ ------- ------ ------ (A) (B) (C) (D) (E) (F) (G) (H) (I) (J) (K) (L) (M) (N) (O) (P) (Q) (R) (S) (T)
Total Eligible 176 26 29 34 86 7 168 60 116 9 160 137 6 39 107 55 14 129 35 10
Total Answering 176 26 29 34 86 7 168 60 116 9 160 137 6 39 107 55 14 129 35 10 100.0% 100% 100% 100% 100% 100.0% 100.0% 100.0% 100.0% 100.0% 100.0% 100.0% 100.0% 100.0% 100.0% 100.0% 100.0% 100.0% 100.0% 100.0%
No Answer - - - - - - - - - - - - - - - - - - - -
Excellent 17 5 2 1 9 1 15 4 13 1 15 14 - 4 13 3 1 12 3 1 9.7% 19.2% 6.9% 2.9% 10.5% 14.3% 8.9% 6.7% 11.2% 11.1% 9.4% 10.2% 10.3% 12.1% 5.5% 7.1% 9.3% 8.6% 10.0% D d
Very good 68 13 9 10 35 1 67 22 46 3 63 54 1 12 54 13 1 57 10 1 38.6% 50.0% 31.0% 29.4% 40.7% 14.3% 39.9% 36.7% 39.7% 33.3% 39.4% 39.4% 16.7% 30.8% 50.5% 23.6% 7.1% 44.2% 28.6% 10.0% f PQ q sT
Good 63 5 12 18 28 1 62 21 42 2 59 49 - 16 30 26 7 42 16 5 35.8% 19.2% 41.4% 52.9% 32.6% 14.3% 36.9% 35.0% 36.2% 22.2% 36.9% 35.8% 41.0% 28.0% 47.3% 50.0% 32.6% 45.7% 50.0% b BE f O
Fair 21 3 4 5 9 4 17 11 10 3 17 16 4 4 9 9 3 14 3 3 11.9% 11.5% 13.8% 14.7% 10.5% 57.1% 10.1% 18.3% 8.6% 33.3% 10.6% 11.7% 66.7% 10.3% 8.4% 16.4% 21.4% 10.9% 8.6% 30.0% G i LN
Poor 7 - 2 - 5 - 7 2 5 - 6 4 1 3 1 4 2 4 3 - 4.0% 6.9% 5.8% 4.2% 3.3% 4.3% 3.8% 2.9% 16.7% 7.7% 0.9% 7.3% 14.3% 3.1% 8.6% o
SPHA SUMMARY RATE - 85 18 11 11 44 2 82 26 59 4 78 68 1 16 67 16 2 69 13 2Excellent/Very good 48.3% 69.2% 37.9% 32.4% 51.2% 28.6% 48.8% 43.3% 50.9% 44.4% 48.8% 49.6% 16.7% 41.0% 62.6% 29.1% 14.3% 53.5% 37.1% 20.0% CDe d M PQ sT
Comparison Groups: BCDE/FG/HI/JK/LMN/OPQ/RSTIndependent Z-Test for Percentages (unpooled proportions)Uppercase letters indicate significance at the 95% level.Lowercase letters indicate significance at the 90% level.Note: When comparing groups the Z-Test is only valid for large sample sizes (generally, n >=30) Presented by SPH Analytics 770-978-3173 2016

Page 4
UMP UW MEDICINE ACCOUNTABLE CARE NETWORK 2016 CAHPS 5.0H Commercial Adult Survey (1113020)
Q68. If you had a problem understanding the benefits your health plan offers, which type(s) of benefits were you unable to understand? (Mark all that apply.)
========= AGE ========= = EDUCATION = === GENDER == == ETHNICITY == ========= RACE ======== === HEALTH STATUS === === MENTAL HEALTH === HS/ Some Not Black/ Exclnt/ Exclnt/ GED/ Colg/ Hspnc/ Hspnc/ African Very Fair/ Very Fair/ Total 18-34 35-44 45-54 55+ Less Grad+ Male Female Latino Latino White Am Other Good Good Poor Good Good Poor ------ ----- ----- ----- ----- ------ ------ ------ ------ ------- ------- ------- ------- ------- ------- ------ ------ ------- ------ ------
Total Eligible 176 26 29 34 86 7 168 60 116 9 160 137 6 39 107 55 14 129 35 10
Total Valid Responses 211 28 55 58 69 4 207 72 139 13 190 144 14 66 122 73 16 151 49 11
Total Respondents 100 14 20 23 42 3 97 33 67 6 91 75 4 26 61 31 8 74 21 5 100.0% 100% 100% 100% 100% 100.0% 100.0% 100.0% 100.0% 100.0% 100.0% 100.0% 100.0% 100.0% 100.0% 100.0% 100.0% 100.0% 100.0% 100.0%
Copays, coinsurance, 62 7 15 13 26 2 60 24 38 6 53 46 2 15 36 20 6 42 15 5deductibles 62.0% 50.0% 75.0% 56.5% 61.9% 66.7% 61.9% 72.7% 56.7% 100.0% 58.2% 61.3% 50.0% 57.7% 59.0% 64.5% 75.0% 56.8% 71.4% 100.0%
Pharmacy benefits and 35 4 10 11 10 1 34 9 26 3 30 20 2 15 20 12 3 25 8 2the plan formulary 35.0% 28.6% 50.0% 47.8% 23.8% 33.3% 35.1% 27.3% 38.8% 50.0% 33.0% 26.7% 50.0% 57.7% 32.8% 38.7% 37.5% 33.8% 38.1% 40.0%
Inpatient 11 2 3 3 3 - 11 5 6 - 11 6 1 3 5 6 - 7 4 -hospitalization 11.0% 14.3% 15.0% 13.0% 7.1% 11.3% 15.2% 9.0% 12.1% 8.0% 25.0% 11.5% 8.2% 19.4% 9.5% 19.0%
Emergency care 11 1 4 4 2 - 11 3 8 - 11 6 2 5 6 5 - 8 3 - 11.0% 7.1% 20.0% 17.4% 4.8% 11.3% 9.1% 11.9% 12.1% 8.0% 50.0% 19.2% 9.8% 16.1% 10.8% 14.3%
In-network versus out-of- 40 7 10 9 14 - 40 12 28 2 37 30 2 12 28 10 2 31 8 1network care 40.0% 50.0% 50.0% 39.1% 33.3% 41.2% 36.4% 41.8% 33.3% 40.7% 40.0% 50.0% 46.2% 45.9% 32.3% 25.0% 41.9% 38.1% 20.0%
Lab and radiology 15 3 2 6 4 - 15 5 10 1 14 8 2 6 8 7 - 12 3 - 15.0% 21.4% 10.0% 26.1% 9.5% 15.5% 15.2% 14.9% 16.7% 15.4% 10.7% 50.0% 23.1% 13.1% 22.6% 16.2% 14.3%
Preventive care 18 2 7 6 3 1 17 10 8 1 16 13 1 5 11 6 1 12 4 2 18.0% 14.3% 35.0% 26.1% 7.1% 33.3% 17.5% 30.3% 11.9% 16.7% 17.6% 17.3% 25.0% 19.2% 18.0% 19.4% 12.5% 16.2% 19.0% 40.0%
Other 19 2 4 6 7 - 19 4 15 - 18 15 2 5 8 7 4 14 4 1 19.0% 14.3% 20.0% 26.1% 16.7% 19.6% 12.1% 22.4% 19.8% 20.0% 50.0% 19.2% 13.1% 22.6% 50.0% 18.9% 19.0% 20.0%
Presented by SPH Analytics 770-978-3173 2016
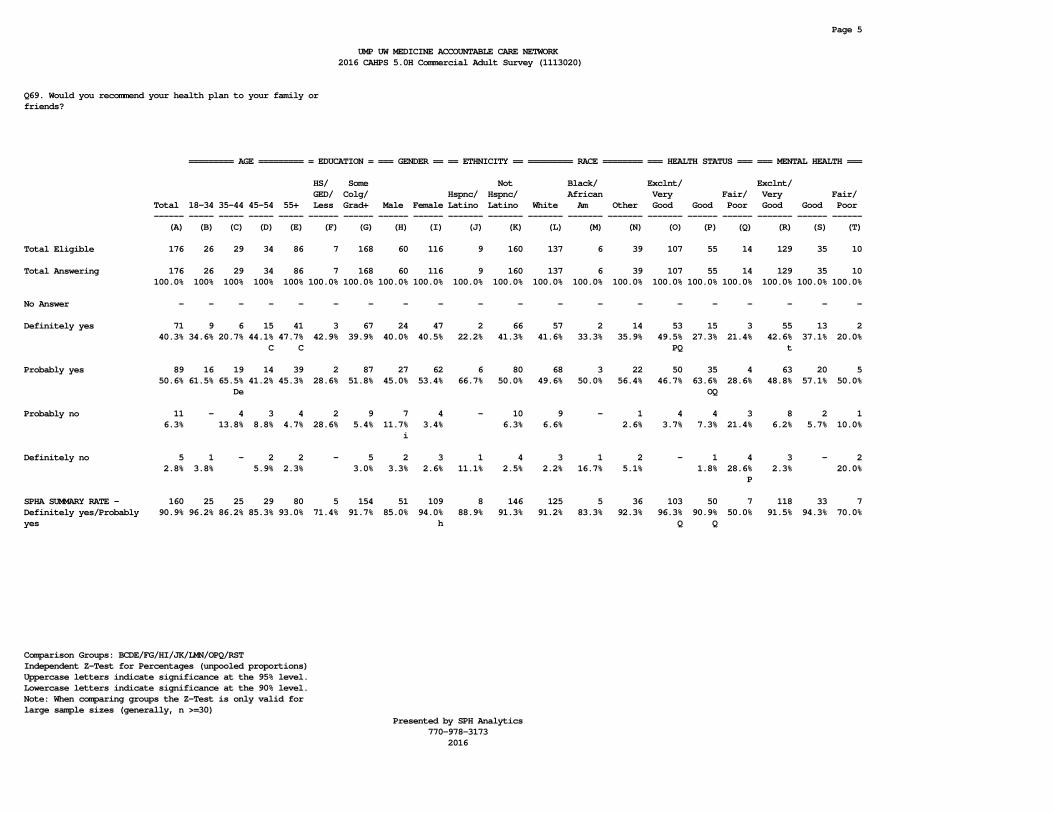
Page 5
UMP UW MEDICINE ACCOUNTABLE CARE NETWORK 2016 CAHPS 5.0H Commercial Adult Survey (1113020)
Q69. Would you recommend your health plan to your family or friends?
========= AGE ========= = EDUCATION = === GENDER == == ETHNICITY == ========= RACE ======== === HEALTH STATUS === === MENTAL HEALTH === HS/ Some Not Black/ Exclnt/ Exclnt/ GED/ Colg/ Hspnc/ Hspnc/ African Very Fair/ Very Fair/ Total 18-34 35-44 45-54 55+ Less Grad+ Male Female Latino Latino White Am Other Good Good Poor Good Good Poor ------ ----- ----- ----- ----- ------ ------ ------ ------ ------- ------- ------- ------- ------- ------- ------ ------ ------- ------ ------ (A) (B) (C) (D) (E) (F) (G) (H) (I) (J) (K) (L) (M) (N) (O) (P) (Q) (R) (S) (T)
Total Eligible 176 26 29 34 86 7 168 60 116 9 160 137 6 39 107 55 14 129 35 10
Total Answering 176 26 29 34 86 7 168 60 116 9 160 137 6 39 107 55 14 129 35 10 100.0% 100% 100% 100% 100% 100.0% 100.0% 100.0% 100.0% 100.0% 100.0% 100.0% 100.0% 100.0% 100.0% 100.0% 100.0% 100.0% 100.0% 100.0%
No Answer - - - - - - - - - - - - - - - - - - - -
Definitely yes 71 9 6 15 41 3 67 24 47 2 66 57 2 14 53 15 3 55 13 2 40.3% 34.6% 20.7% 44.1% 47.7% 42.9% 39.9% 40.0% 40.5% 22.2% 41.3% 41.6% 33.3% 35.9% 49.5% 27.3% 21.4% 42.6% 37.1% 20.0% C C PQ t
Probably yes 89 16 19 14 39 2 87 27 62 6 80 68 3 22 50 35 4 63 20 5 50.6% 61.5% 65.5% 41.2% 45.3% 28.6% 51.8% 45.0% 53.4% 66.7% 50.0% 49.6% 50.0% 56.4% 46.7% 63.6% 28.6% 48.8% 57.1% 50.0% De OQ
Probably no 11 - 4 3 4 2 9 7 4 - 10 9 - 1 4 4 3 8 2 1 6.3% 13.8% 8.8% 4.7% 28.6% 5.4% 11.7% 3.4% 6.3% 6.6% 2.6% 3.7% 7.3% 21.4% 6.2% 5.7% 10.0% i
Definitely no 5 1 - 2 2 - 5 2 3 1 4 3 1 2 - 1 4 3 - 2 2.8% 3.8% 5.9% 2.3% 3.0% 3.3% 2.6% 11.1% 2.5% 2.2% 16.7% 5.1% 1.8% 28.6% 2.3% 20.0% P
SPHA SUMMARY RATE - 160 25 25 29 80 5 154 51 109 8 146 125 5 36 103 50 7 118 33 7Definitely yes/Probably 90.9% 96.2% 86.2% 85.3% 93.0% 71.4% 91.7% 85.0% 94.0% 88.9% 91.3% 91.2% 83.3% 92.3% 96.3% 90.9% 50.0% 91.5% 94.3% 70.0%yes h Q Q
Comparison Groups: BCDE/FG/HI/JK/LMN/OPQ/RSTIndependent Z-Test for Percentages (unpooled proportions)Uppercase letters indicate significance at the 95% level.Lowercase letters indicate significance at the 90% level.Note: When comparing groups the Z-Test is only valid for large sample sizes (generally, n >=30) Presented by SPH Analytics 770-978-3173 2016

Page 6
UMP UW MEDICINE ACCOUNTABLE CARE NETWORK 2016 CAHPS 5.0H Commercial Adult Survey (1113020)
Q70. Do you intend to switch to a different health plan when you next have an opportunity?
========= AGE ========= = EDUCATION = === GENDER == == ETHNICITY == ========= RACE ======== === HEALTH STATUS === === MENTAL HEALTH === HS/ Some Not Black/ Exclnt/ Exclnt/ GED/ Colg/ Hspnc/ Hspnc/ African Very Fair/ Very Fair/ Total 18-34 35-44 45-54 55+ Less Grad+ Male Female Latino Latino White Am Other Good Good Poor Good Good Poor ------ ----- ----- ----- ----- ------ ------ ------ ------ ------- ------- ------- ------- ------- ------- ------ ------ ------- ------ ------ (A) (B) (C) (D) (E) (F) (G) (H) (I) (J) (K) (L) (M) (N) (O) (P) (Q) (R) (S) (T)
Total Eligible 176 26 29 34 86 7 168 60 116 9 160 137 6 39 107 55 14 129 35 10
Total Answering 175 26 29 34 85 6 168 59 116 9 159 136 6 39 107 54 14 129 34 10 100.0% 100% 100% 100% 100% 100.0% 100.0% 100.0% 100.0% 100.0% 100.0% 100.0% 100.0% 100.0% 100.0% 100.0% 100.0% 100.0% 100.0% 100.0%
No Answer 1 - - - 1 1 - 1 - - 1 1 - - - 1 - - 1 -
Definitely no 67 8 5 15 39 1 65 21 46 3 60 51 2 14 45 17 5 50 14 2 38.3% 30.8% 17.2% 44.1% 45.9% 16.7% 38.7% 35.6% 39.7% 33.3% 37.7% 37.5% 33.3% 35.9% 42.1% 31.5% 35.7% 38.8% 41.2% 20.0% C C
Probably no 83 15 22 13 32 2 81 27 56 5 76 66 3 19 52 28 3 63 13 6 47.4% 57.7% 75.9% 38.2% 37.6% 33.3% 48.2% 45.8% 48.3% 55.6% 47.8% 48.5% 50.0% 48.7% 48.6% 51.9% 21.4% 48.8% 38.2% 60.0% e DE Q Q
Probably yes 14 2 - 4 8 - 14 6 8 1 12 10 - 4 5 6 3 6 6 2 8.0% 7.7% 11.8% 9.4% 8.3% 10.2% 6.9% 11.1% 7.5% 7.4% 10.3% 4.7% 11.1% 21.4% 4.7% 17.6% 20.0% r
Definitely yes 11 1 2 2 6 3 8 5 6 - 11 9 1 2 5 3 3 10 1 - 6.3% 3.8% 6.9% 5.9% 7.1% 50.0% 4.8% 8.5% 5.2% 6.9% 6.6% 16.7% 5.1% 4.7% 5.6% 21.4% 7.8% 2.9% G
SPHA SUMMARY RATE - 150 23 27 28 71 3 146 48 102 8 136 117 5 33 97 45 8 113 27 8Definitely no/Probably 85.7% 88.5% 93.1% 82.4% 83.5% 50.0% 86.9% 81.4% 87.9% 88.9% 85.5% 86.0% 83.3% 84.6% 90.7% 83.3% 57.1% 87.6% 79.4% 80.0%no f Q q
Comparison Groups: BCDE/FG/HI/JK/LMN/OPQ/RSTIndependent Z-Test for Percentages (unpooled proportions)Uppercase letters indicate significance at the 95% level.Lowercase letters indicate significance at the 90% level.Note: When comparing groups the Z-Test is only valid for large sample sizes (generally, n >=30) Presented by SPH Analytics 770-978-3173 2016

Page 7
UMP UW MEDICINE ACCOUNTABLE CARE NETWORK 2016 CAHPS 5.0H Commercial Adult Survey (1113020)
Q71. In the last 12 months, did you call or were you transferred by your health plan to Washington State Rx Services?
========= AGE ========= = EDUCATION = === GENDER == == ETHNICITY == ========= RACE ======== === HEALTH STATUS === === MENTAL HEALTH === HS/ Some Not Black/ Exclnt/ Exclnt/ GED/ Colg/ Hspnc/ Hspnc/ African Very Fair/ Very Fair/ Total 18-34 35-44 45-54 55+ Less Grad+ Male Female Latino Latino White Am Other Good Good Poor Good Good Poor ------ ----- ----- ----- ----- ------ ------ ------ ------ ------- ------- ------- ------- ------- ------- ------ ------ ------- ------ ------ (A) (B) (C) (D) (E) (F) (G) (H) (I) (J) (K) (L) (M) (N) (O) (P) (Q) (R) (S) (T)
Total Eligible 176 26 29 34 86 7 168 60 116 9 160 137 6 39 107 55 14 129 35 10
Total Answering 174 26 29 34 84 6 167 58 116 9 158 135 6 39 106 54 14 128 34 10 100.0% 100% 100% 100% 100% 100.0% 100.0% 100.0% 100.0% 100.0% 100.0% 100.0% 100.0% 100.0% 100.0% 100.0% 100.0% 100.0% 100.0% 100.0%
No Answer 2 - - - 2 1 1 2 - - 2 2 - - 1 1 - 1 1 -
Yes 18 7 - 3 8 2 16 8 10 1 15 13 1 2 9 5 4 14 2 2 10.3% 26.9% 8.8% 9.5% 33.3% 9.6% 13.8% 8.6% 11.1% 9.5% 9.6% 16.7% 5.1% 8.5% 9.3% 28.6% 10.9% 5.9% 20.0% de
No 156 19 29 31 76 4 151 50 106 8 143 122 5 37 97 49 10 114 32 8 89.7% 73.1% 100% 91.2% 90.5% 66.7% 90.4% 86.2% 91.4% 88.9% 90.5% 90.4% 83.3% 94.9% 91.5% 90.7% 71.4% 89.1% 94.1% 80.0% BdE b b
SPHA SUMMARY RATE - Yes 18 7 - 3 8 2 16 8 10 1 15 13 1 2 9 5 4 14 2 2 10.3% 26.9% 8.8% 9.5% 33.3% 9.6% 13.8% 8.6% 11.1% 9.5% 9.6% 16.7% 5.1% 8.5% 9.3% 28.6% 10.9% 5.9% 20.0% de
Comparison Groups: BCDE/FG/HI/JK/LMN/OPQ/RSTIndependent Z-Test for Percentages (unpooled proportions)Uppercase letters indicate significance at the 95% level.Lowercase letters indicate significance at the 90% level.Note: When comparing groups the Z-Test is only valid for large sample sizes (generally, n >=30) Presented by SPH Analytics 770-978-3173 2016

Page 8
UMP UW MEDICINE ACCOUNTABLE CARE NETWORK 2016 CAHPS 5.0H Commercial Adult Survey (1113020)
Q72. In the last 12 months, how often were you able to get the help you needed when you called Washington State Rx Services?
========= AGE ========= = EDUCATION = === GENDER == == ETHNICITY == ========= RACE ======== === HEALTH STATUS === === MENTAL HEALTH === HS/ Some Not Black/ Exclnt/ Exclnt/ GED/ Colg/ Hspnc/ Hspnc/ African Very Fair/ Very Fair/ Total 18-34 35-44 45-54 55+ Less Grad+ Male Female Latino Latino White Am Other Good Good Poor Good Good Poor ------ ----- ----- ----- ----- ------ ------ ------ ------ ------- ------- ------- ------- ------- ------- ------ ------ ------- ------ ------ (A) (B) (C) (D) (E) (F) (G) (H) (I) (J) (K) (L) (M) (N) (O) (P) (Q) (R) (S) (T)
Total Eligible 18 7 - 3 8 2 16 8 10 1 15 13 1 2 9 5 4 14 2 2
Total Answering 18 7 - 3 8 2 16 8 10 1 15 13 1 2 9 5 4 14 2 2 100.0% 100% 100% 100% 100.0% 100.0% 100.0% 100.0% 100.0% 100.0% 100.0% 100.0% 100.0% 100.0% 100.0% 100.0% 100.0% 100.0% 100.0%
No Answer - - - - - - - - - - - - - - - - - - - -
Never 1 - - - 1 - 1 - 1 1 - - - 1 - 1 - 1 - - 5.6% 12.5% 6.3% 10.0% 100.0% 50.0% 20.0% 7.1%
Sometimes 1 - - 1 - - 1 - 1 - 1 - - 1 - 1 - - 1 - 5.6% 33.3% 6.3% 10.0% 6.7% 50.0% 20.0% 50.0%
Usually 3 1 - - 2 - 3 2 1 - 2 2 - - 1 - 2 2 - 1 16.7% 14.3% 25.0% 18.8% 25.0% 10.0% 13.3% 15.4% 11.1% 50.0% 14.3% 50.0%
Always 13 6 - 2 5 2 11 6 7 - 12 11 1 - 8 3 2 11 1 1 72.2% 85.7% 66.7% 62.5% 100.0% 68.8% 75.0% 70.0% 80.0% 84.6% 100.0% 88.9% 60.0% 50.0% 78.6% 50.0% 50.0% G
SPHA SUMMARY RATE - 16 7 - 2 7 2 14 8 8 - 14 13 1 - 9 3 4 13 1 2Always/Usually 88.9% 100% 66.7% 87.5% 100.0% 87.5% 100.0% 80.0% 93.3% 100.0% 100.0% 100.0% 60.0% 100.0% 92.9% 50.0% 100.0% p p
Comparison Groups: BCDE/FG/HI/JK/LMN/OPQ/RSTIndependent Z-Test for Percentages (unpooled proportions)Uppercase letters indicate significance at the 95% level.Lowercase letters indicate significance at the 90% level.Note: When comparing groups the Z-Test is only valid for large sample sizes (generally, n >=30) Presented by SPH Analytics 770-978-3173 2016

Page 9
UMP UW MEDICINE ACCOUNTABLE CARE NETWORK 2016 CAHPS 5.0H Commercial Adult Survey (1113020)
Q73A. Please state your level of agreement with the following: I liked the overall format and appearance of the written materials.
========= AGE ========= = EDUCATION = === GENDER == == ETHNICITY == ========= RACE ======== === HEALTH STATUS === === MENTAL HEALTH === HS/ Some Not Black/ Exclnt/ Exclnt/ GED/ Colg/ Hspnc/ Hspnc/ African Very Fair/ Very Fair/ Total 18-34 35-44 45-54 55+ Less Grad+ Male Female Latino Latino White Am Other Good Good Poor Good Good Poor ------ ----- ----- ----- ----- ------ ------ ------ ------ ------- ------- ------- ------- ------- ------- ------ ------ ------- ------ ------ (A) (B) (C) (D) (E) (F) (G) (H) (I) (J) (K) (L) (M) (N) (O) (P) (Q) (R) (S) (T)
Total Eligible 18 7 - 3 8 2 16 8 10 1 15 13 1 2 9 5 4 14 2 2
Total Answering 16 6 - 3 7 1 15 8 8 1 13 12 - 2 8 5 3 12 2 2 100.0% 100% 100% 100% 100.0% 100.0% 100.0% 100.0% 100.0% 100.0% 100.0% 100.0% 100.0% 100.0% 100.0% 100.0% 100.0% 100.0%
No Answer - - - - - - - - - - - - - - - - - - - -
Strongly Agree 2 2 - - - - 2 1 1 - 2 2 - - 2 - - 2 - - 12.5% 33.3% 13.3% 12.5% 12.5% 15.4% 16.7% 25.0% 16.7%
Agree 7 3 - 1 3 - 7 2 5 - 6 6 - - 5 2 - 6 1 - 43.8% 50.0% 33.3% 42.9% 46.7% 25.0% 62.5% 46.2% 50.0% 62.5% 40.0% 50.0% 50.0%
Neither Agree nor 7 1 - 2 4 1 6 5 2 1 5 4 - 2 1 3 3 4 1 2Disagree 43.8% 16.7% 66.7% 57.1% 100.0% 40.0% 62.5% 25.0% 100.0% 38.5% 33.3% 100.0% 12.5% 60.0% 100.0% 33.3% 50.0% 100.0% b G K L o Op R
Disagree - - - - - - - - - - - - - - - - - - - -
Strongly Disagree - - - - - - - - - - - - - - - - - - - -
Don't know 2 1 - - 1 1 1 - 2 - 2 1 1 - 1 - 1 2 - -
SPHA SUMMARY RATE - 9 5 - 1 3 - 9 3 6 - 8 8 - - 7 2 - 8 1 -Strongly Agree/Agree 56.3% 83.3% 33.3% 42.9% 60.0% 37.5% 75.0% 61.5% 66.7% 87.5% 40.0% 66.7% 50.0% e p
Comparison Groups: BCDE/FG/HI/JK/LMN/OPQ/RSTIndependent Z-Test for Percentages (unpooled proportions)Uppercase letters indicate significance at the 95% level.Lowercase letters indicate significance at the 90% level.Note: When comparing groups the Z-Test is only valid for large sample sizes (generally, n >=30) Presented by SPH Analytics 770-978-3173 2016

Page 10
UMP UW MEDICINE ACCOUNTABLE CARE NETWORK 2016 CAHPS 5.0H Commercial Adult Survey (1113020)
Q73B. Please state your level of agreement with the following: The new member materials were easy to understand.
========= AGE ========= = EDUCATION = === GENDER == == ETHNICITY == ========= RACE ======== === HEALTH STATUS === === MENTAL HEALTH === HS/ Some Not Black/ Exclnt/ Exclnt/ GED/ Colg/ Hspnc/ Hspnc/ African Very Fair/ Very Fair/ Total 18-34 35-44 45-54 55+ Less Grad+ Male Female Latino Latino White Am Other Good Good Poor Good Good Poor ------ ----- ----- ----- ----- ------ ------ ------ ------ ------- ------- ------- ------- ------- ------- ------ ------ ------- ------ ------ (A) (B) (C) (D) (E) (F) (G) (H) (I) (J) (K) (L) (M) (N) (O) (P) (Q) (R) (S) (T)
Total Eligible 18 7 - 3 8 2 16 8 10 1 15 13 1 2 9 5 4 14 2 2
Total Answering 17 7 - 3 7 2 15 8 9 1 14 13 - 2 9 5 3 13 2 2 100.0% 100% 100% 100% 100.0% 100.0% 100.0% 100.0% 100.0% 100.0% 100.0% 100.0% 100.0% 100.0% 100.0% 100.0% 100.0% 100.0%
No Answer - - - - - - - - - - - - - - - - - - - -
Strongly Agree 2 2 - - - - 2 - 2 - 2 2 - - 2 - - 2 - - 11.8% 28.6% 13.3% 22.2% 14.3% 15.4% 22.2% 15.4%
Agree 10 4 - 1 5 2 8 5 5 1 7 7 - 1 6 4 - 9 1 - 58.8% 57.1% 33.3% 71.4% 100.0% 53.3% 62.5% 55.6% 100.0% 50.0% 53.8% 50.0% 66.7% 80.0% 69.2% 50.0% G K
Neither Agree nor 5 1 - 2 2 - 5 3 2 - 5 4 - 1 1 1 3 2 1 2Disagree 29.4% 14.3% 66.7% 28.6% 33.3% 37.5% 22.2% 35.7% 30.8% 50.0% 11.1% 20.0% 100.0% 15.4% 50.0% 100.0% b OP R
Disagree - - - - - - - - - - - - - - - - - - - -
Strongly Disagree - - - - - - - - - - - - - - - - - - - -
Don't know 1 - - - 1 - 1 - 1 - 1 - 1 - - - 1 1 - -
SPHA SUMMARY RATE - 12 6 - 1 5 2 10 5 7 1 9 9 - 1 8 4 - 11 1 -Strongly Agree/Agree 70.6% 85.7% 33.3% 71.4% 100.0% 66.7% 62.5% 77.8% 100.0% 64.3% 69.2% 50.0% 88.9% 80.0% 84.6% 50.0% d G K
Comparison Groups: BCDE/FG/HI/JK/LMN/OPQ/RSTIndependent Z-Test for Percentages (unpooled proportions)Uppercase letters indicate significance at the 95% level.Lowercase letters indicate significance at the 90% level.Note: When comparing groups the Z-Test is only valid for large sample sizes (generally, n >=30) Presented by SPH Analytics 770-978-3173 2016

Page 11
UMP UW MEDICINE ACCOUNTABLE CARE NETWORK 2016 CAHPS 5.0H Commercial Adult Survey (1113020)
Q73C. Please state your level of agreement with the following: The written materials helped me to understand the health plan’s policies and procedures.
========= AGE ========= = EDUCATION = === GENDER == == ETHNICITY == ========= RACE ======== === HEALTH STATUS === === MENTAL HEALTH === HS/ Some Not Black/ Exclnt/ Exclnt/ GED/ Colg/ Hspnc/ Hspnc/ African Very Fair/ Very Fair/ Total 18-34 35-44 45-54 55+ Less Grad+ Male Female Latino Latino White Am Other Good Good Poor Good Good Poor ------ ----- ----- ----- ----- ------ ------ ------ ------ ------- ------- ------- ------- ------- ------- ------ ------ ------- ------ ------ (A) (B) (C) (D) (E) (F) (G) (H) (I) (J) (K) (L) (M) (N) (O) (P) (Q) (R) (S) (T)
Total Eligible 18 7 - 3 8 2 16 8 10 1 15 13 1 2 9 5 4 14 2 2
Total Answering 17 7 - 3 7 2 15 8 9 1 14 13 - 2 9 5 3 13 2 2 100.0% 100% 100% 100% 100.0% 100.0% 100.0% 100.0% 100.0% 100.0% 100.0% 100.0% 100.0% 100.0% 100.0% 100.0% 100.0% 100.0%
No Answer - - - - - - - - - - - - - - - - - - - -
Strongly Agree 1 1 - - - 1 - - 1 - 1 1 - - 1 - - 1 - - 5.9% 14.3% 50.0% 11.1% 7.1% 7.7% 11.1% 7.7%
Agree 10 5 - 1 4 1 9 5 5 - 8 8 - - 7 3 - 9 1 - 58.8% 71.4% 33.3% 57.1% 50.0% 60.0% 62.5% 55.6% 57.1% 61.5% 77.8% 60.0% 69.2% 50.0%
Neither Agree nor 6 1 - 2 3 - 6 3 3 1 5 4 - 2 1 2 3 3 1 2Disagree 35.3% 14.3% 66.7% 42.9% 40.0% 37.5% 33.3% 100.0% 35.7% 30.8% 100.0% 11.1% 40.0% 100.0% 23.1% 50.0% 100.0% b K L OP R
Disagree - - - - - - - - - - - - - - - - - - - -
Strongly Disagree - - - - - - - - - - - - - - - - - - - -
Don't know 1 - - - 1 - 1 - 1 - 1 - 1 - - - 1 1 - -
SPHA SUMMARY RATE - 11 6 - 1 4 2 9 5 6 - 9 9 - - 8 3 - 10 1 -Strongly Agree/Agree 64.7% 85.7% 33.3% 57.1% 100.0% 60.0% 62.5% 66.7% 64.3% 69.2% 88.9% 60.0% 76.9% 50.0% d G
Comparison Groups: BCDE/FG/HI/JK/LMN/OPQ/RSTIndependent Z-Test for Percentages (unpooled proportions)Uppercase letters indicate significance at the 95% level.Lowercase letters indicate significance at the 90% level.Note: When comparing groups the Z-Test is only valid for large sample sizes (generally, n >=30) Presented by SPH Analytics 770-978-3173 2016

Page 12
UMP UW MEDICINE ACCOUNTABLE CARE NETWORK 2016 CAHPS 5.0H Commercial Adult Survey (1113020)
Q73D. Please state your level of agreement with the following: The new member written materials are an effective way to provide health benefit information.
========= AGE ========= = EDUCATION = === GENDER == == ETHNICITY == ========= RACE ======== === HEALTH STATUS === === MENTAL HEALTH === HS/ Some Not Black/ Exclnt/ Exclnt/ GED/ Colg/ Hspnc/ Hspnc/ African Very Fair/ Very Fair/ Total 18-34 35-44 45-54 55+ Less Grad+ Male Female Latino Latino White Am Other Good Good Poor Good Good Poor ------ ----- ----- ----- ----- ------ ------ ------ ------ ------- ------- ------- ------- ------- ------- ------ ------ ------- ------ ------ (A) (B) (C) (D) (E) (F) (G) (H) (I) (J) (K) (L) (M) (N) (O) (P) (Q) (R) (S) (T)
Total Eligible 18 7 - 3 8 2 16 8 10 1 15 13 1 2 9 5 4 14 2 2
Total Answering 17 7 - 3 7 2 15 8 9 1 14 13 - 2 9 5 3 13 2 2 100.0% 100% 100% 100% 100.0% 100.0% 100.0% 100.0% 100.0% 100.0% 100.0% 100.0% 100.0% 100.0% 100.0% 100.0% 100.0% 100.0%
No Answer - - - - - - - - - - - - - - - - - - - -
Strongly Agree 3 3 - - - 1 2 - 3 - 3 3 - - 3 - - 3 - - 17.6% 42.9% 50.0% 13.3% 33.3% 21.4% 23.1% 33.3% 23.1%
Agree 9 3 - 2 4 1 8 4 5 1 6 5 - 2 5 4 - 8 1 - 52.9% 42.9% 66.7% 57.1% 50.0% 53.3% 50.0% 55.6% 100.0% 42.9% 38.5% 100.0% 55.6% 80.0% 61.5% 50.0% K L
Neither Agree nor 4 1 - - 3 - 4 4 - - 4 4 - - - 1 3 1 1 2Disagree 23.5% 14.3% 42.9% 26.7% 50.0% 28.6% 30.8% 20.0% 100.0% 7.7% 50.0% 100.0% P R
Disagree 1 - - 1 - - 1 - 1 - 1 1 - - 1 - - 1 - - 5.9% 33.3% 6.7% 11.1% 7.1% 7.7% 11.1% 7.7%
Strongly Disagree - - - - - - - - - - - - - - - - - - - -
Don't know 1 - - - 1 - 1 - 1 - 1 - 1 - - - 1 1 - -
SPHA SUMMARY RATE - 12 6 - 2 4 2 10 4 8 1 9 8 - 2 8 4 - 11 1 -Strongly Agree/Agree 70.6% 85.7% 66.7% 57.1% 100.0% 66.7% 50.0% 88.9% 100.0% 64.3% 61.5% 100.0% 88.9% 80.0% 84.6% 50.0% G h K L
Comparison Groups: BCDE/FG/HI/JK/LMN/OPQ/RSTIndependent Z-Test for Percentages (unpooled proportions)Uppercase letters indicate significance at the 95% level.Lowercase letters indicate significance at the 90% level.Note: When comparing groups the Z-Test is only valid for large sample sizes (generally, n >=30) Presented by SPH Analytics 770-978-3173 2016

Page 13
UMP UW MEDICINE ACCOUNTABLE CARE NETWORK 2016 CAHPS 5.0H Commercial Adult Survey (1113020)
Q73E. Please state your level of agreement with the following: The written materials helped me to understand my out-of-pocket expenses.
========= AGE ========= = EDUCATION = === GENDER == == ETHNICITY == ========= RACE ======== === HEALTH STATUS === === MENTAL HEALTH === HS/ Some Not Black/ Exclnt/ Exclnt/ GED/ Colg/ Hspnc/ Hspnc/ African Very Fair/ Very Fair/ Total 18-34 35-44 45-54 55+ Less Grad+ Male Female Latino Latino White Am Other Good Good Poor Good Good Poor ------ ----- ----- ----- ----- ------ ------ ------ ------ ------- ------- ------- ------- ------- ------- ------ ------ ------- ------ ------ (A) (B) (C) (D) (E) (F) (G) (H) (I) (J) (K) (L) (M) (N) (O) (P) (Q) (R) (S) (T)
Total Eligible 18 7 - 3 8 2 16 8 10 1 15 13 1 2 9 5 4 14 2 2
Total Answering 17 7 - 3 7 2 15 8 9 1 14 13 - 2 9 5 3 13 2 2 100.0% 100% 100% 100% 100.0% 100.0% 100.0% 100.0% 100.0% 100.0% 100.0% 100.0% 100.0% 100.0% 100.0% 100.0% 100.0% 100.0%
No Answer - - - - - - - - - - - - - - - - - - - -
Strongly Agree 2 2 - - - 1 1 - 2 - 2 2 - - 2 - - 2 - - 11.8% 28.6% 50.0% 6.7% 22.2% 14.3% 15.4% 22.2% 15.4%
Agree 5 1 - 1 3 1 4 2 3 - 4 4 - - 3 2 - 5 - - 29.4% 14.3% 33.3% 42.9% 50.0% 26.7% 25.0% 33.3% 28.6% 30.8% 33.3% 40.0% 38.5%
Neither Agree nor 7 3 - 2 2 - 7 4 3 - 6 5 - 1 4 2 1 4 2 1Disagree 41.2% 42.9% 66.7% 28.6% 46.7% 50.0% 33.3% 42.9% 38.5% 50.0% 44.4% 40.0% 33.3% 30.8% 100.0% 50.0% R
Disagree 2 - - - 2 - 2 1 1 1 1 1 - 1 - 1 1 2 - - 11.8% 28.6% 13.3% 12.5% 11.1% 100.0% 7.1% 7.7% 50.0% 20.0% 33.3% 15.4% K
Strongly Disagree 1 1 - - - - 1 1 - - 1 1 - - - - 1 - - 1 5.9% 14.3% 6.7% 12.5% 7.1% 7.7% 33.3% 50.0%
Don't know 1 - - - 1 - 1 - 1 - 1 - 1 - - - 1 1 - -
SPHA SUMMARY RATE - 7 3 - 1 3 2 5 2 5 - 6 6 - - 5 2 - 7 - -Strongly Agree/Agree 41.2% 42.9% 33.3% 42.9% 100.0% 33.3% 25.0% 55.6% 42.9% 46.2% 55.6% 40.0% 53.8% G
Comparison Groups: BCDE/FG/HI/JK/LMN/OPQ/RSTIndependent Z-Test for Percentages (unpooled proportions)Uppercase letters indicate significance at the 95% level.Lowercase letters indicate significance at the 90% level.Note: When comparing groups the Z-Test is only valid for large sample sizes (generally, n >=30) Presented by SPH Analytics 770-978-3173 2016

Page 14
UMP UW MEDICINE ACCOUNTABLE CARE NETWORK 2016 CAHPS 5.0H Commercial Adult Survey (1113020)
Q73F. Please state your level of agreement with the following: The written materials I received from UMP Classic Plan accurately described the health care coverage I selected.
========= AGE ========= = EDUCATION = === GENDER == == ETHNICITY == ========= RACE ======== === HEALTH STATUS === === MENTAL HEALTH === HS/ Some Not Black/ Exclnt/ Exclnt/ GED/ Colg/ Hspnc/ Hspnc/ African Very Fair/ Very Fair/ Total 18-34 35-44 45-54 55+ Less Grad+ Male Female Latino Latino White Am Other Good Good Poor Good Good Poor ------ ----- ----- ----- ----- ------ ------ ------ ------ ------- ------- ------- ------- ------- ------- ------ ------ ------- ------ ------ (A) (B) (C) (D) (E) (F) (G) (H) (I) (J) (K) (L) (M) (N) (O) (P) (Q) (R) (S) (T)
Total Eligible 18 7 - 3 8 2 16 8 10 1 15 13 1 2 9 5 4 14 2 2
Total Answering 17 7 - 3 7 2 15 8 9 1 14 12 1 2 8 5 4 13 2 2 100.0% 100% 100% 100% 100.0% 100.0% 100.0% 100.0% 100.0% 100.0% 100.0% 100.0% 100.0% 100.0% 100.0% 100.0% 100.0% 100.0% 100.0%
No Answer - - - - - - - - - - - - - - - - - - - -
Strongly Agree 2 2 - - - 1 1 - 2 - 2 2 - - 2 - - 2 - - 11.8% 28.6% 50.0% 6.7% 22.2% 14.3% 16.7% 25.0% 15.4%
Agree 10 3 - 2 5 1 9 6 4 - 8 7 - 1 4 4 2 7 2 1 58.8% 42.9% 66.7% 71.4% 50.0% 60.0% 75.0% 44.4% 57.1% 58.3% 50.0% 50.0% 80.0% 50.0% 53.8% 100.0% 50.0% R
Neither Agree nor 3 1 - 1 1 - 3 1 2 1 2 2 - 1 2 1 - 3 - -Disagree 17.6% 14.3% 33.3% 14.3% 20.0% 12.5% 22.2% 100.0% 14.3% 16.7% 50.0% 25.0% 20.0% 23.1% K
Disagree 1 1 - - - - 1 1 - - 1 1 - - - - 1 - - 1 5.9% 14.3% 6.7% 12.5% 7.1% 8.3% 25.0% 50.0%
Strongly Disagree 1 - - - 1 - 1 - 1 - 1 - 1 - - - 1 1 - - 5.9% 14.3% 6.7% 11.1% 7.1% 100.0% 25.0% 7.7%
Don't know 1 - - - 1 - 1 - 1 - 1 1 - - 1 - - 1 - -
SPHA SUMMARY RATE - 12 5 - 2 5 2 10 6 6 - 10 9 - 1 6 4 2 9 2 1Strongly Agree/Agree 70.6% 71.4% 66.7% 71.4% 100.0% 66.7% 75.0% 66.7% 71.4% 75.0% 50.0% 75.0% 80.0% 50.0% 69.2% 100.0% 50.0% G R
Comparison Groups: BCDE/FG/HI/JK/LMN/OPQ/RSTIndependent Z-Test for Percentages (unpooled proportions)Uppercase letters indicate significance at the 95% level.Lowercase letters indicate significance at the 90% level.Note: When comparing groups the Z-Test is only valid for large sample sizes (generally, n >=30) Presented by SPH Analytics 770-978-3173 2016

Page 15
UMP UW MEDICINE ACCOUNTABLE CARE NETWORK 2016 CAHPS 5.0H Commercial Adult Survey (1113020)
Q74A. Please state to what extent you agree or disagree with each statement: I know how to choose or find a doctor in my plan’s network.
========= AGE ========= = EDUCATION = === GENDER == == ETHNICITY == ========= RACE ======== === HEALTH STATUS === === MENTAL HEALTH === HS/ Some Not Black/ Exclnt/ Exclnt/ GED/ Colg/ Hspnc/ Hspnc/ African Very Fair/ Very Fair/ Total 18-34 35-44 45-54 55+ Less Grad+ Male Female Latino Latino White Am Other Good Good Poor Good Good Poor ------ ----- ----- ----- ----- ------ ------ ------ ------ ------- ------- ------- ------- ------- ------- ------ ------ ------- ------ ------ (A) (B) (C) (D) (E) (F) (G) (H) (I) (J) (K) (L) (M) (N) (O) (P) (Q) (R) (S) (T)
Total Eligible 18 7 - 3 8 2 16 8 10 1 15 13 1 2 9 5 4 14 2 2
Total Answering 18 7 - 3 8 2 16 8 10 1 15 13 1 2 9 5 4 14 2 2 100.0% 100% 100% 100% 100.0% 100.0% 100.0% 100.0% 100.0% 100.0% 100.0% 100.0% 100.0% 100.0% 100.0% 100.0% 100.0% 100.0% 100.0%
No Answer - - - - - - - - - - - - - - - - - - - -
Strongly Agree 9 5 - 2 2 1 8 3 6 - 9 8 - 1 7 1 1 7 1 1 50.0% 71.4% 66.7% 25.0% 50.0% 50.0% 37.5% 60.0% 60.0% 61.5% 50.0% 77.8% 20.0% 25.0% 50.0% 50.0% 50.0% E PQ
Agree 8 2 - 1 5 1 7 5 3 1 5 5 - 1 2 4 2 6 1 1 44.4% 28.6% 33.3% 62.5% 50.0% 43.8% 62.5% 30.0% 100.0% 33.3% 38.5% 50.0% 22.2% 80.0% 50.0% 42.9% 50.0% 50.0% K O
Neither Agree nor - - - - - - - - - - - - - - - - - - - -Disagree
Disagree - - - - - - - - - - - - - - - - - - - -
Strongly Disagree 1 - - - 1 - 1 - 1 - 1 - 1 - - - 1 1 - - 5.6% 12.5% 6.3% 10.0% 6.7% 100.0% 25.0% 7.1%
Don't know - - - - - - - - - - - - - - - - - - - -
SPHA SUMMARY RATE - 17 7 - 3 7 2 15 8 9 1 14 13 - 2 9 5 3 13 2 2Strongly Agree/Agree 94.4% 100% 100% 87.5% 100.0% 93.8% 100.0% 90.0% 100.0% 93.3% 100.0% 100.0% 100.0% 100.0% 75.0% 92.9% 100.0% 100.0%
Comparison Groups: BCDE/FG/HI/JK/LMN/OPQ/RSTIndependent Z-Test for Percentages (unpooled proportions)Uppercase letters indicate significance at the 95% level.Lowercase letters indicate significance at the 90% level.Note: When comparing groups the Z-Test is only valid for large sample sizes (generally, n >=30) Presented by SPH Analytics 770-978-3173 2016

Page 16
UMP UW MEDICINE ACCOUNTABLE CARE NETWORK 2016 CAHPS 5.0H Commercial Adult Survey (1113020)
Q74B. Please state to what extent you agree or disagree with each statement: I know what to do when I or a family member needs urgent or emergency care.
========= AGE ========= = EDUCATION = === GENDER == == ETHNICITY == ========= RACE ======== === HEALTH STATUS === === MENTAL HEALTH === HS/ Some Not Black/ Exclnt/ Exclnt/ GED/ Colg/ Hspnc/ Hspnc/ African Very Fair/ Very Fair/ Total 18-34 35-44 45-54 55+ Less Grad+ Male Female Latino Latino White Am Other Good Good Poor Good Good Poor ------ ----- ----- ----- ----- ------ ------ ------ ------ ------- ------- ------- ------- ------- ------- ------ ------ ------- ------ ------ (A) (B) (C) (D) (E) (F) (G) (H) (I) (J) (K) (L) (M) (N) (O) (P) (Q) (R) (S) (T)
Total Eligible 18 7 - 3 8 2 16 8 10 1 15 13 1 2 9 5 4 14 2 2
Total Answering 18 7 - 3 8 2 16 8 10 1 15 13 1 2 9 5 4 14 2 2 100.0% 100% 100% 100% 100.0% 100.0% 100.0% 100.0% 100.0% 100.0% 100.0% 100.0% 100.0% 100.0% 100.0% 100.0% 100.0% 100.0% 100.0%
No Answer - - - - - - - - - - - - - - - - - - - -
Strongly Agree 8 5 - - 3 1 7 3 5 - 8 7 1 - 5 - 3 6 - 2 44.4% 71.4% 37.5% 50.0% 43.8% 37.5% 50.0% 53.3% 53.8% 100.0% 55.6% 75.0% 42.9% 100.0% L R
Agree 5 - - 1 4 1 4 4 1 - 4 4 - - 1 3 1 4 1 - 27.8% 33.3% 50.0% 50.0% 25.0% 50.0% 10.0% 26.7% 30.8% 11.1% 60.0% 25.0% 28.6% 50.0% I O
Neither Agree nor 3 1 - 2 - - 3 - 3 - 2 1 - 1 2 1 - 2 1 -Disagree 16.7% 14.3% 66.7% 18.8% 30.0% 13.3% 7.7% 50.0% 22.2% 20.0% 14.3% 50.0% b
Disagree 2 1 - - 1 - 2 1 1 1 1 1 - 1 1 1 - 2 - - 11.1% 14.3% 12.5% 12.5% 12.5% 10.0% 100.0% 6.7% 7.7% 50.0% 11.1% 20.0% 14.3% K
Strongly Disagree - - - - - - - - - - - - - - - - - - - -
Don't know - - - - - - - - - - - - - - - - - - - -
SPHA SUMMARY RATE - 13 5 - 1 7 2 11 7 6 - 12 11 1 - 6 3 4 10 1 2Strongly Agree/Agree 72.2% 71.4% 33.3% 87.5% 100.0% 68.8% 87.5% 60.0% 80.0% 84.6% 100.0% 66.7% 60.0% 100.0% 71.4% 50.0% 100.0% d G Op R
Comparison Groups: BCDE/FG/HI/JK/LMN/OPQ/RSTIndependent Z-Test for Percentages (unpooled proportions)Uppercase letters indicate significance at the 95% level.Lowercase letters indicate significance at the 90% level.Note: When comparing groups the Z-Test is only valid for large sample sizes (generally, n >=30) Presented by SPH Analytics 770-978-3173 2016

Page 17
UMP UW MEDICINE ACCOUNTABLE CARE NETWORK 2016 CAHPS 5.0H Commercial Adult Survey (1113020)
Q74C. Please state to what extent you agree or disagree with each statement: I understand what services are covered and not covered in my plan.
========= AGE ========= = EDUCATION = === GENDER == == ETHNICITY == ========= RACE ======== === HEALTH STATUS === === MENTAL HEALTH === HS/ Some Not Black/ Exclnt/ Exclnt/ GED/ Colg/ Hspnc/ Hspnc/ African Very Fair/ Very Fair/ Total 18-34 35-44 45-54 55+ Less Grad+ Male Female Latino Latino White Am Other Good Good Poor Good Good Poor ------ ----- ----- ----- ----- ------ ------ ------ ------ ------- ------- ------- ------- ------- ------- ------ ------ ------- ------ ------ (A) (B) (C) (D) (E) (F) (G) (H) (I) (J) (K) (L) (M) (N) (O) (P) (Q) (R) (S) (T)
Total Eligible 18 7 - 3 8 2 16 8 10 1 15 13 1 2 9 5 4 14 2 2
Total Answering 18 7 - 3 8 2 16 8 10 1 15 13 1 2 9 5 4 14 2 2 100.0% 100% 100% 100% 100.0% 100.0% 100.0% 100.0% 100.0% 100.0% 100.0% 100.0% 100.0% 100.0% 100.0% 100.0% 100.0% 100.0% 100.0%
No Answer - - - - - - - - - - - - - - - - - - - -
Strongly Agree 3 2 - - 1 1 2 1 2 - 3 2 1 - 2 - 1 3 - - 16.7% 28.6% 12.5% 50.0% 12.5% 12.5% 20.0% 20.0% 15.4% 100.0% 22.2% 25.0% 21.4% L
Agree 10 4 - 2 4 - 10 3 7 - 8 7 - 1 6 3 1 7 2 1 55.6% 57.1% 66.7% 50.0% 62.5% 37.5% 70.0% 53.3% 53.8% 50.0% 66.7% 60.0% 25.0% 50.0% 100.0% 50.0% R
Neither Agree nor 2 - - 1 1 1 1 2 - - 2 2 - - - 1 1 1 - 1Disagree 11.1% 33.3% 12.5% 50.0% 6.3% 25.0% 13.3% 15.4% 20.0% 25.0% 7.1% 50.0%
Disagree 2 - - - 2 - 2 1 1 1 1 1 - 1 - 1 1 2 - - 11.1% 25.0% 12.5% 12.5% 10.0% 100.0% 6.7% 7.7% 50.0% 20.0% 25.0% 14.3% K
Strongly Disagree 1 1 - - - - 1 1 - - 1 1 - - 1 - - 1 - - 5.6% 14.3% 6.3% 12.5% 6.7% 7.7% 11.1% 7.1%
Don't know - - - - - - - - - - - - - - - - - - - -
SPHA SUMMARY RATE - 13 6 - 2 5 1 12 4 9 - 11 9 1 1 8 3 2 10 2 1Strongly Agree/Agree 72.2% 85.7% 66.7% 62.5% 50.0% 75.0% 50.0% 90.0% 73.3% 69.2% 100.0% 50.0% 88.9% 60.0% 50.0% 71.4% 100.0% 50.0% H L R
Comparison Groups: BCDE/FG/HI/JK/LMN/OPQ/RSTIndependent Z-Test for Percentages (unpooled proportions)Uppercase letters indicate significance at the 95% level.Lowercase letters indicate significance at the 90% level.Note: When comparing groups the Z-Test is only valid for large sample sizes (generally, n >=30) Presented by SPH Analytics 770-978-3173 2016

Page 18
UMP UW MEDICINE ACCOUNTABLE CARE NETWORK 2016 CAHPS 5.0H Commercial Adult Survey (1113020)
Q74D. Please state to what extent you agree or disagree with each statement: I understand when I need a referral to a specialist.
========= AGE ========= = EDUCATION = === GENDER == == ETHNICITY == ========= RACE ======== === HEALTH STATUS === === MENTAL HEALTH === HS/ Some Not Black/ Exclnt/ Exclnt/ GED/ Colg/ Hspnc/ Hspnc/ African Very Fair/ Very Fair/ Total 18-34 35-44 45-54 55+ Less Grad+ Male Female Latino Latino White Am Other Good Good Poor Good Good Poor ------ ----- ----- ----- ----- ------ ------ ------ ------ ------- ------- ------- ------- ------- ------- ------ ------ ------- ------ ------ (A) (B) (C) (D) (E) (F) (G) (H) (I) (J) (K) (L) (M) (N) (O) (P) (Q) (R) (S) (T)
Total Eligible 18 7 - 3 8 2 16 8 10 1 15 13 1 2 9 5 4 14 2 2
Total Answering 18 7 - 3 8 2 16 8 10 1 15 13 1 2 9 5 4 14 2 2 100.0% 100% 100% 100% 100.0% 100.0% 100.0% 100.0% 100.0% 100.0% 100.0% 100.0% 100.0% 100.0% 100.0% 100.0% 100.0% 100.0% 100.0%
No Answer - - - - - - - - - - - - - - - - - - - -
Strongly Agree 4 2 - - 2 1 3 2 2 - 4 3 1 - 2 - 2 3 - 1 22.2% 28.6% 25.0% 50.0% 18.8% 25.0% 20.0% 26.7% 23.1% 100.0% 22.2% 50.0% 21.4% 50.0% L
Agree 5 2 - 1 2 - 5 2 3 - 4 4 - - 4 1 - 5 - - 27.8% 28.6% 33.3% 25.0% 31.3% 25.0% 30.0% 26.7% 30.8% 44.4% 20.0% 35.7%
Neither Agree nor 2 1 - 1 - - 2 - 2 - 2 1 - 1 1 1 - 1 1 -Disagree 11.1% 14.3% 33.3% 12.5% 20.0% 13.3% 7.7% 50.0% 11.1% 20.0% 7.1% 50.0%
Disagree 7 2 - 1 4 1 6 4 3 1 5 5 - 1 2 3 2 5 1 1 38.9% 28.6% 33.3% 50.0% 50.0% 37.5% 50.0% 30.0% 100.0% 33.3% 38.5% 50.0% 22.2% 60.0% 50.0% 35.7% 50.0% 50.0% K
Strongly Disagree - - - - - - - - - - - - - - - - - - - -
Don't know - - - - - - - - - - - - - - - - - - - -
SPHA SUMMARY RATE - 9 4 - 1 4 1 8 4 5 - 8 7 1 - 6 1 2 8 - 1Strongly Agree/Agree 50.0% 57.1% 33.3% 50.0% 50.0% 50.0% 50.0% 50.0% 53.3% 53.8% 100.0% 66.7% 20.0% 50.0% 57.1% 50.0% L p
Comparison Groups: BCDE/FG/HI/JK/LMN/OPQ/RSTIndependent Z-Test for Percentages (unpooled proportions)Uppercase letters indicate significance at the 95% level.Lowercase letters indicate significance at the 90% level.Note: When comparing groups the Z-Test is only valid for large sample sizes (generally, n >=30) Presented by SPH Analytics 770-978-3173 2016

Page 19
UMP UW MEDICINE ACCOUNTABLE CARE NETWORK 2016 CAHPS 5.0H Commercial Adult Survey (1113020)
Q74E. Please state to what extent you agree or disagree with each statement: I know how much I have to pay (co-pay) at the doctor’s office for a preventive care visit.
========= AGE ========= = EDUCATION = === GENDER == == ETHNICITY == ========= RACE ======== === HEALTH STATUS === === MENTAL HEALTH === HS/ Some Not Black/ Exclnt/ Exclnt/ GED/ Colg/ Hspnc/ Hspnc/ African Very Fair/ Very Fair/ Total 18-34 35-44 45-54 55+ Less Grad+ Male Female Latino Latino White Am Other Good Good Poor Good Good Poor ------ ----- ----- ----- ----- ------ ------ ------ ------ ------- ------- ------- ------- ------- ------- ------ ------ ------- ------ ------ (A) (B) (C) (D) (E) (F) (G) (H) (I) (J) (K) (L) (M) (N) (O) (P) (Q) (R) (S) (T)
Total Eligible 18 7 - 3 8 2 16 8 10 1 15 13 1 2 9 5 4 14 2 2
Total Answering 18 7 - 3 8 2 16 8 10 1 15 13 1 2 9 5 4 14 2 2 100.0% 100% 100% 100% 100.0% 100.0% 100.0% 100.0% 100.0% 100.0% 100.0% 100.0% 100.0% 100.0% 100.0% 100.0% 100.0% 100.0% 100.0%
No Answer - - - - - - - - - - - - - - - - - - - -
Strongly Agree 6 3 - 1 2 1 5 2 4 - 6 4 1 1 3 1 2 4 1 1 33.3% 42.9% 33.3% 25.0% 50.0% 31.3% 25.0% 40.0% 40.0% 30.8% 100.0% 50.0% 33.3% 20.0% 50.0% 28.6% 50.0% 50.0% L
Agree 6 1 - 1 4 1 5 4 2 - 5 5 - - 3 3 - 5 1 - 33.3% 14.3% 33.3% 50.0% 50.0% 31.3% 50.0% 20.0% 33.3% 38.5% 33.3% 60.0% 35.7% 50.0%
Neither Agree nor 4 2 - 1 1 - 4 1 3 - 3 3 - - 3 - 1 4 - -Disagree 22.2% 28.6% 33.3% 12.5% 25.0% 12.5% 30.0% 20.0% 23.1% 33.3% 25.0% 28.6%
Disagree 2 1 - - 1 - 2 1 1 1 1 1 - 1 - 1 1 1 - 1 11.1% 14.3% 12.5% 12.5% 12.5% 10.0% 100.0% 6.7% 7.7% 50.0% 20.0% 25.0% 7.1% 50.0% K
Strongly Disagree - - - - - - - - - - - - - - - - - - - -
Don't know - - - - - - - - - - - - - - - - - - - -
SPHA SUMMARY RATE - 12 4 - 2 6 2 10 6 6 - 11 9 1 1 6 4 2 9 2 1Strongly Agree/Agree 66.7% 57.1% 66.7% 75.0% 100.0% 62.5% 75.0% 60.0% 73.3% 69.2% 100.0% 50.0% 66.7% 80.0% 50.0% 64.3% 100.0% 50.0% G L R
Comparison Groups: BCDE/FG/HI/JK/LMN/OPQ/RSTIndependent Z-Test for Percentages (unpooled proportions)Uppercase letters indicate significance at the 95% level.Lowercase letters indicate significance at the 90% level.Note: When comparing groups the Z-Test is only valid for large sample sizes (generally, n >=30) Presented by SPH Analytics 770-978-3173 2016

Page 20
UMP UW MEDICINE ACCOUNTABLE CARE NETWORK 2016 CAHPS 5.0H Commercial Adult Survey (1113020)
Q74F. Please state to what extent you agree or disagree with each statement: I know which services are subject to a deductible under my coverage plan.
========= AGE ========= = EDUCATION = === GENDER == == ETHNICITY == ========= RACE ======== === HEALTH STATUS === === MENTAL HEALTH === HS/ Some Not Black/ Exclnt/ Exclnt/ GED/ Colg/ Hspnc/ Hspnc/ African Very Fair/ Very Fair/ Total 18-34 35-44 45-54 55+ Less Grad+ Male Female Latino Latino White Am Other Good Good Poor Good Good Poor ------ ----- ----- ----- ----- ------ ------ ------ ------ ------- ------- ------- ------- ------- ------- ------ ------ ------- ------ ------ (A) (B) (C) (D) (E) (F) (G) (H) (I) (J) (K) (L) (M) (N) (O) (P) (Q) (R) (S) (T)
Total Eligible 18 7 - 3 8 2 16 8 10 1 15 13 1 2 9 5 4 14 2 2
Total Answering 18 7 - 3 8 2 16 8 10 1 15 13 1 2 9 5 4 14 2 2 100.0% 100% 100% 100% 100.0% 100.0% 100.0% 100.0% 100.0% 100.0% 100.0% 100.0% 100.0% 100.0% 100.0% 100.0% 100.0% 100.0% 100.0%
No Answer - - - - - - - - - - - - - - - - - - - -
Strongly Agree 3 2 - - 1 1 2 1 2 - 3 2 1 - 2 - 1 3 - - 16.7% 28.6% 12.5% 50.0% 12.5% 12.5% 20.0% 20.0% 15.4% 100.0% 22.2% 25.0% 21.4% L
Agree 9 3 - 1 5 - 9 3 6 1 6 5 - 2 4 4 1 6 2 1 50.0% 42.9% 33.3% 62.5% 56.3% 37.5% 60.0% 100.0% 40.0% 38.5% 100.0% 44.4% 80.0% 25.0% 42.9% 100.0% 50.0% K L q R
Neither Agree nor 3 1 - 1 1 - 3 1 2 - 3 3 - - 2 - 1 2 - 1Disagree 16.7% 14.3% 33.3% 12.5% 18.8% 12.5% 20.0% 20.0% 23.1% 22.2% 25.0% 14.3% 50.0%
Disagree 3 1 - 1 1 1 2 3 - - 3 3 - - 1 1 1 3 - - 16.7% 14.3% 33.3% 12.5% 50.0% 12.5% 37.5% 20.0% 23.1% 11.1% 20.0% 25.0% 21.4%
Strongly Disagree - - - - - - - - - - - - - - - - - - - -
Don't know - - - - - - - - - - - - - - - - - - - -
SPHA SUMMARY RATE - 12 5 - 1 6 1 11 4 8 1 9 7 1 2 6 4 2 9 2 1Strongly Agree/Agree 66.7% 71.4% 33.3% 75.0% 50.0% 68.8% 50.0% 80.0% 100.0% 60.0% 53.8% 100.0% 100.0% 66.7% 80.0% 50.0% 64.3% 100.0% 50.0% K L L R
Comparison Groups: BCDE/FG/HI/JK/LMN/OPQ/RSTIndependent Z-Test for Percentages (unpooled proportions)Uppercase letters indicate significance at the 95% level.Lowercase letters indicate significance at the 90% level.Note: When comparing groups the Z-Test is only valid for large sample sizes (generally, n >=30) Presented by SPH Analytics 770-978-3173 2016

Page 21
UMP UW MEDICINE ACCOUNTABLE CARE NETWORK 2016 CAHPS 5.0H Commercial Adult Survey (1113020)
Q74G. Please state to what extent you agree or disagree with each statement: I understand my right to appeal a claims or coverage decision.
========= AGE ========= = EDUCATION = === GENDER == == ETHNICITY == ========= RACE ======== === HEALTH STATUS === === MENTAL HEALTH === HS/ Some Not Black/ Exclnt/ Exclnt/ GED/ Colg/ Hspnc/ Hspnc/ African Very Fair/ Very Fair/ Total 18-34 35-44 45-54 55+ Less Grad+ Male Female Latino Latino White Am Other Good Good Poor Good Good Poor ------ ----- ----- ----- ----- ------ ------ ------ ------ ------- ------- ------- ------- ------- ------- ------ ------ ------- ------ ------ (A) (B) (C) (D) (E) (F) (G) (H) (I) (J) (K) (L) (M) (N) (O) (P) (Q) (R) (S) (T)
Total Eligible 18 7 - 3 8 2 16 8 10 1 15 13 1 2 9 5 4 14 2 2
Total Answering 18 7 - 3 8 2 16 8 10 1 15 13 1 2 9 5 4 14 2 2 100.0% 100% 100% 100% 100.0% 100.0% 100.0% 100.0% 100.0% 100.0% 100.0% 100.0% 100.0% 100.0% 100.0% 100.0% 100.0% 100.0% 100.0%
No Answer - - - - - - - - - - - - - - - - - - - -
Strongly Agree 2 2 - - - 1 1 1 1 - 2 2 - - 2 - - 2 - - 11.1% 28.6% 50.0% 6.3% 12.5% 10.0% 13.3% 15.4% 22.2% 14.3%
Agree 9 3 - 1 5 - 9 4 5 - 8 7 - 1 4 3 2 5 2 2 50.0% 42.9% 33.3% 62.5% 56.3% 50.0% 50.0% 53.3% 53.8% 50.0% 44.4% 60.0% 50.0% 35.7% 100.0% 100.0% R R
Neither Agree nor 1 - - 1 - 1 - 1 - - 1 1 - - - 1 - 1 - -Disagree 5.6% 33.3% 50.0% 12.5% 6.7% 7.7% 20.0% 7.1%
Disagree 4 2 - - 2 - 4 2 2 1 2 2 - 1 2 1 1 4 - - 22.2% 28.6% 25.0% 25.0% 25.0% 20.0% 100.0% 13.3% 15.4% 50.0% 22.2% 20.0% 25.0% 28.6% K
Strongly Disagree 2 - - 1 1 - 2 - 2 - 2 1 1 - 1 - 1 2 - - 11.1% 33.3% 12.5% 12.5% 20.0% 13.3% 7.7% 100.0% 11.1% 25.0% 14.3% L
Don't know - - - - - - - - - - - - - - - - - - - -
SPHA SUMMARY RATE - 11 5 - 1 5 1 10 5 6 - 10 9 - 1 6 3 2 7 2 2Strongly Agree/Agree 61.1% 71.4% 33.3% 62.5% 50.0% 62.5% 62.5% 60.0% 66.7% 69.2% 50.0% 66.7% 60.0% 50.0% 50.0% 100.0% 100.0% R R
Comparison Groups: BCDE/FG/HI/JK/LMN/OPQ/RSTIndependent Z-Test for Percentages (unpooled proportions)Uppercase letters indicate significance at the 95% level.Lowercase letters indicate significance at the 90% level.Note: When comparing groups the Z-Test is only valid for large sample sizes (generally, n >=30) Presented by SPH Analytics 770-978-3173 2016

Page 22
UMP UW MEDICINE ACCOUNTABLE CARE NETWORK 2016 CAHPS 5.0H Commercial Adult Survey (1113020)
Q74H. Please state to what extent you agree or disagree with each statement: I understand my plan’s prescription drug coverage.
========= AGE ========= = EDUCATION = === GENDER == == ETHNICITY == ========= RACE ======== === HEALTH STATUS === === MENTAL HEALTH === HS/ Some Not Black/ Exclnt/ Exclnt/ GED/ Colg/ Hspnc/ Hspnc/ African Very Fair/ Very Fair/ Total 18-34 35-44 45-54 55+ Less Grad+ Male Female Latino Latino White Am Other Good Good Poor Good Good Poor ------ ----- ----- ----- ----- ------ ------ ------ ------ ------- ------- ------- ------- ------- ------- ------ ------ ------- ------ ------ (A) (B) (C) (D) (E) (F) (G) (H) (I) (J) (K) (L) (M) (N) (O) (P) (Q) (R) (S) (T)
Total Eligible 18 7 - 3 8 2 16 8 10 1 15 13 1 2 9 5 4 14 2 2
Total Answering 16 6 - 3 7 2 14 8 8 1 13 12 - 2 8 5 3 12 2 2 100.0% 100% 100% 100% 100.0% 100.0% 100.0% 100.0% 100.0% 100.0% 100.0% 100.0% 100.0% 100.0% 100.0% 100.0% 100.0% 100.0%
No Answer 1 1 - - - - 1 - 1 - 1 1 - - 1 - - 1 - -
Strongly Agree 2 2 - - - 1 1 1 1 - 2 2 - - 2 - - 2 - - 12.5% 33.3% 50.0% 7.1% 12.5% 12.5% 15.4% 16.7% 25.0% 16.7%
Agree 9 3 - 2 4 1 8 5 4 - 8 7 - 1 4 4 1 6 2 1 56.3% 50.0% 66.7% 57.1% 50.0% 57.1% 62.5% 50.0% 61.5% 58.3% 50.0% 50.0% 80.0% 33.3% 50.0% 100.0% 50.0% R
Neither Agree nor 4 1 - 1 2 - 4 1 3 1 2 2 - 1 2 1 1 3 - 1Disagree 25.0% 16.7% 33.3% 28.6% 28.6% 12.5% 37.5% 100.0% 15.4% 16.7% 50.0% 25.0% 20.0% 33.3% 25.0% 50.0% K
Disagree 1 - - - 1 - 1 1 - - 1 1 - - - - 1 1 - - 6.3% 14.3% 7.1% 12.5% 7.7% 8.3% 33.3% 8.3%
Strongly Disagree - - - - - - - - - - - - - - - - - - - -
Don't know 1 - - - 1 - 1 - 1 - 1 - 1 - - - 1 1 - -
SPHA SUMMARY RATE - 11 5 - 2 4 2 9 6 5 - 10 9 - 1 6 4 1 8 2 1Strongly Agree/Agree 68.8% 83.3% 66.7% 57.1% 100.0% 64.3% 75.0% 62.5% 76.9% 75.0% 50.0% 75.0% 80.0% 33.3% 66.7% 100.0% 50.0% G R
Comparison Groups: BCDE/FG/HI/JK/LMN/OPQ/RSTIndependent Z-Test for Percentages (unpooled proportions)Uppercase letters indicate significance at the 95% level.Lowercase letters indicate significance at the 90% level.Note: When comparing groups the Z-Test is only valid for large sample sizes (generally, n >=30) Presented by SPH Analytics 770-978-3173 2016

Page 23
UMP UW MEDICINE ACCOUNTABLE CARE NETWORK 2016 CAHPS 5.0H Commercial Adult Survey (1113020)
Q74I. Please state to what extent you agree or disagree with each statement: I understand my health care rights for privacy and confidentiality.
========= AGE ========= = EDUCATION = === GENDER == == ETHNICITY == ========= RACE ======== === HEALTH STATUS === === MENTAL HEALTH === HS/ Some Not Black/ Exclnt/ Exclnt/ GED/ Colg/ Hspnc/ Hspnc/ African Very Fair/ Very Fair/ Total 18-34 35-44 45-54 55+ Less Grad+ Male Female Latino Latino White Am Other Good Good Poor Good Good Poor ------ ----- ----- ----- ----- ------ ------ ------ ------ ------- ------- ------- ------- ------- ------- ------ ------ ------- ------ ------ (A) (B) (C) (D) (E) (F) (G) (H) (I) (J) (K) (L) (M) (N) (O) (P) (Q) (R) (S) (T)
Total Eligible 18 7 - 3 8 2 16 8 10 1 15 13 1 2 9 5 4 14 2 2
Total Answering 17 6 - 3 8 2 15 8 9 1 14 12 1 2 8 5 4 13 2 2 100.0% 100% 100% 100% 100.0% 100.0% 100.0% 100.0% 100.0% 100.0% 100.0% 100.0% 100.0% 100.0% 100.0% 100.0% 100.0% 100.0% 100.0%
No Answer 1 1 - - - - 1 - 1 - 1 1 - - 1 - - 1 - -
Strongly Agree 5 3 - 1 1 1 4 2 3 - 5 5 - - 4 - 1 4 - 1 29.4% 50.0% 33.3% 12.5% 50.0% 26.7% 25.0% 33.3% 35.7% 41.7% 50.0% 25.0% 30.8% 50.0%
Agree 9 3 - 2 4 1 8 4 5 1 7 6 - 2 3 5 1 6 2 1 52.9% 50.0% 66.7% 50.0% 50.0% 53.3% 50.0% 55.6% 100.0% 50.0% 50.0% 100.0% 37.5% 100.0% 25.0% 46.2% 100.0% 50.0% K L OQ R
Neither Agree nor 2 - - - 2 - 2 2 - - 1 1 - - 1 - 1 2 - -Disagree 11.8% 25.0% 13.3% 25.0% 7.1% 8.3% 12.5% 25.0% 15.4%
Disagree - - - - - - - - - - - - - - - - - - - -
Strongly Disagree 1 - - - 1 - 1 - 1 - 1 - 1 - - - 1 1 - - 5.9% 12.5% 6.7% 11.1% 7.1% 100.0% 25.0% 7.7%
Don't know - - - - - - - - - - - - - - - - - - - -
SPHA SUMMARY RATE - 14 6 - 3 5 2 12 6 8 1 12 11 - 2 7 5 2 10 2 2Strongly Agree/Agree 82.4% 100% 100% 62.5% 100.0% 80.0% 75.0% 88.9% 100.0% 85.7% 91.7% 100.0% 87.5% 100.0% 50.0% 76.9% 100.0% 100.0% E E g Q R R
Comparison Groups: BCDE/FG/HI/JK/LMN/OPQ/RSTIndependent Z-Test for Percentages (unpooled proportions)Uppercase letters indicate significance at the 95% level.Lowercase letters indicate significance at the 90% level.Note: When comparing groups the Z-Test is only valid for large sample sizes (generally, n >=30) Presented by SPH Analytics 770-978-3173 2016

Page 24
UMP UW MEDICINE ACCOUNTABLE CARE NETWORK 2016 CAHPS 5.0H Commercial Adult Survey (1113020)
LOYALTY
= HEALTH PLAN = = HEALTH CARE = === DOCTOR ==== = HEALTH PLAN RTNG = === CONTACT === = GOT INFO/HELP= == # DCTR/ === == CLAIMS === = RATING (Q42)= = RATING (Q13)= = RATING (Q23)= = BY GLOBAL PROP. == === CUSTOMER == == FROM CUST === === CLINIC === === (Q39) === ====== (Q42) ======= === SVC (Q34) = == SVC (Q35) === = VISITS (Q7)= Never/ Always/ Less 3 or Total 0-7 8-10 0-7 8-10 0-7 8-10 0-6 7-8 9-10 Yes No Sometime Usually than 3 More Yes No ------ ------- ------- ------- ------- ------- ------- ------ ------ ------ ------- ------- -------- ------- ------- ------ ------ ------
Total Eligible 175 56 119 35 127 18 143 33 66 76 66 108 11 55 74 99 108 43
Total Valid Responses 175 56 119 35 127 18 143 33 66 76 66 108 11 55 74 99 108 43 100.0% 100.0% 100.0% 100.0% 100.0% 100.0% 100.0% 100.0% 100.0% 100.0% 100.0% 100.0% 100.0% 100.0% 100.0% 100.0% 100.0% 100.0%
LOYALTY ZONE 77 - 77 2 70 6 66 - 18 59 34 42 4 30 31 46 46 23 44.0% 64.7% 5.7% 55.1% 33.3% 46.2% 27.3% 77.6% 51.5% 38.9% 36.4% 54.5% 41.9% 46.5% 42.6% 53.5%
INDIFFERENT ZONE 93 51 42 28 57 11 74 28 48 17 29 64 6 23 43 48 60 18 53.1% 91.1% 35.3% 80.0% 44.9% 61.1% 51.7% 84.8% 72.7% 22.4% 43.9% 59.3% 54.5% 41.8% 58.1% 48.5% 55.6% 41.9%
DEFECTION ZONE 5 5 - 5 - 1 3 5 - - 3 2 1 2 - 5 2 2 2.9% 8.9% 14.3% 5.6% 2.1% 15.2% 4.5% 1.9% 9.1% 3.6% 5.1% 1.9% 4.7%
Presented by SPH Analytics 770-978-3173 2016

Page 25
UMP UW MEDICINE ACCOUNTABLE CARE NETWORK 2016 CAHPS 5.0H Commercial Adult Survey (1113020)
Q66. In the last 12 months, have you visited your health plan's website?
= HEALTH PLAN = = HEALTH CARE = === DOCTOR ==== = HEALTH PLAN RTNG = === CONTACT === = GOT INFO/HELP= == # DCTR/ === == CLAIMS === = RATING (Q42)= = RATING (Q13)= = RATING (Q23)= = BY GLOBAL PROP. == === CUSTOMER == == FROM CUST === === CLINIC === === (Q39) === ====== (Q42) ======= === SVC (Q34) = == SVC (Q35) === = VISITS (Q7)= Never/ Always/ Less 3 or Total 0-7 8-10 0-7 8-10 0-7 8-10 0-6 7-8 9-10 Yes No Sometime Usually than 3 More Yes No ------ ------- ------- ------- ------- ------- ------- ------ ------ ------ ------- ------- -------- ------- ------- ------ ------ ------ (A) (B) (C) (D) (E) (F) (G) (H) (I) (J) (K) (L) (M) (N) (O) (P) (Q) (R)
Total Eligible 176 56 120 35 128 18 144 33 66 77 66 109 11 55 74 100 108 43
Total Answering 173 54 119 34 126 18 141 31 66 76 65 107 11 54 72 99 106 42 100.0% 100.0% 100.0% 100.0% 100.0% 100.0% 100.0% 100.0% 100.0% 100.0% 100.0% 100.0% 100.0% 100.0% 100.0% 100.0% 100.0% 100.0%
No Answer 2 1 1 - 2 - 2 1 - 1 - 2 - - 1 1 1 1
Yes 135 46 89 27 98 12 111 26 50 59 58 77 10 48 53 80 84 32 78.0% 85.2% 74.8% 79.4% 77.8% 66.7% 78.7% 83.9% 75.8% 77.6% 89.2% 72.0% 90.9% 88.9% 73.6% 80.8% 79.2% 76.2% c L
No 38 8 30 7 28 6 30 5 16 17 7 30 1 6 19 19 22 10 22.0% 14.8% 25.2% 20.6% 22.2% 33.3% 21.3% 16.1% 24.2% 22.4% 10.8% 28.0% 9.1% 11.1% 26.4% 19.2% 20.8% 23.8% b K
I don't use or have 1 1 - 1 - - 1 1 - - 1 - - 1 1 - 1 -convenient access to the Internet
SPHA SUMMARY RATE - Yes 135 46 89 27 98 12 111 26 50 59 58 77 10 48 53 80 84 32 78.0% 85.2% 74.8% 79.4% 77.8% 66.7% 78.7% 83.9% 75.8% 77.6% 89.2% 72.0% 90.9% 88.9% 73.6% 80.8% 79.2% 76.2% c L
Comparison Groups: BC/DE/FG/HIJ/KL/MN/OP/QRIndependent Z-Test for Percentages (unpooled proportions)Uppercase letters indicate significance at the 95% level.Lowercase letters indicate significance at the 90% level.Note: When comparing groups the Z-Test is only valid for large sample sizes (generally, n >=30) Presented by SPH Analytics 770-978-3173 2016
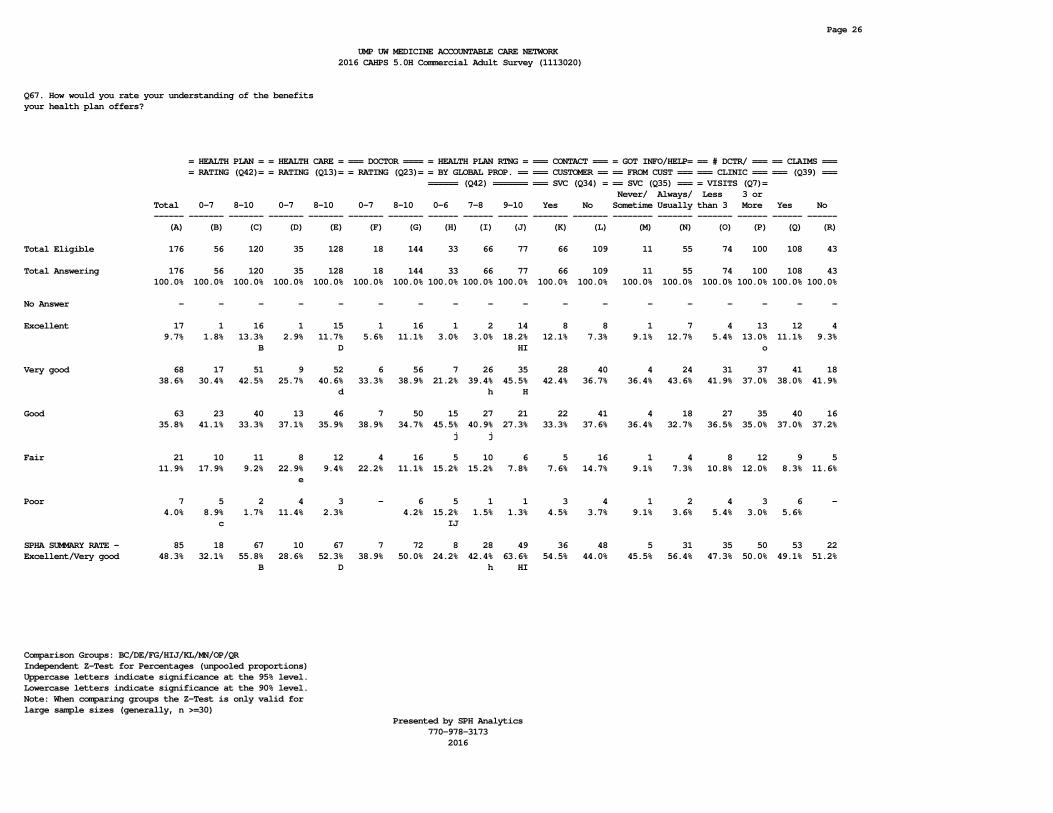
Page 26
UMP UW MEDICINE ACCOUNTABLE CARE NETWORK 2016 CAHPS 5.0H Commercial Adult Survey (1113020)
Q67. How would you rate your understanding of the benefits your health plan offers?
= HEALTH PLAN = = HEALTH CARE = === DOCTOR ==== = HEALTH PLAN RTNG = === CONTACT === = GOT INFO/HELP= == # DCTR/ === == CLAIMS === = RATING (Q42)= = RATING (Q13)= = RATING (Q23)= = BY GLOBAL PROP. == === CUSTOMER == == FROM CUST === === CLINIC === === (Q39) === ====== (Q42) ======= === SVC (Q34) = == SVC (Q35) === = VISITS (Q7)= Never/ Always/ Less 3 or Total 0-7 8-10 0-7 8-10 0-7 8-10 0-6 7-8 9-10 Yes No Sometime Usually than 3 More Yes No ------ ------- ------- ------- ------- ------- ------- ------ ------ ------ ------- ------- -------- ------- ------- ------ ------ ------ (A) (B) (C) (D) (E) (F) (G) (H) (I) (J) (K) (L) (M) (N) (O) (P) (Q) (R)
Total Eligible 176 56 120 35 128 18 144 33 66 77 66 109 11 55 74 100 108 43
Total Answering 176 56 120 35 128 18 144 33 66 77 66 109 11 55 74 100 108 43 100.0% 100.0% 100.0% 100.0% 100.0% 100.0% 100.0% 100.0% 100.0% 100.0% 100.0% 100.0% 100.0% 100.0% 100.0% 100.0% 100.0% 100.0%
No Answer - - - - - - - - - - - - - - - - - -
Excellent 17 1 16 1 15 1 16 1 2 14 8 8 1 7 4 13 12 4 9.7% 1.8% 13.3% 2.9% 11.7% 5.6% 11.1% 3.0% 3.0% 18.2% 12.1% 7.3% 9.1% 12.7% 5.4% 13.0% 11.1% 9.3% B D HI o
Very good 68 17 51 9 52 6 56 7 26 35 28 40 4 24 31 37 41 18 38.6% 30.4% 42.5% 25.7% 40.6% 33.3% 38.9% 21.2% 39.4% 45.5% 42.4% 36.7% 36.4% 43.6% 41.9% 37.0% 38.0% 41.9% d h H
Good 63 23 40 13 46 7 50 15 27 21 22 41 4 18 27 35 40 16 35.8% 41.1% 33.3% 37.1% 35.9% 38.9% 34.7% 45.5% 40.9% 27.3% 33.3% 37.6% 36.4% 32.7% 36.5% 35.0% 37.0% 37.2% j j
Fair 21 10 11 8 12 4 16 5 10 6 5 16 1 4 8 12 9 5 11.9% 17.9% 9.2% 22.9% 9.4% 22.2% 11.1% 15.2% 15.2% 7.8% 7.6% 14.7% 9.1% 7.3% 10.8% 12.0% 8.3% 11.6% e
Poor 7 5 2 4 3 - 6 5 1 1 3 4 1 2 4 3 6 - 4.0% 8.9% 1.7% 11.4% 2.3% 4.2% 15.2% 1.5% 1.3% 4.5% 3.7% 9.1% 3.6% 5.4% 3.0% 5.6% c IJ
SPHA SUMMARY RATE - 85 18 67 10 67 7 72 8 28 49 36 48 5 31 35 50 53 22Excellent/Very good 48.3% 32.1% 55.8% 28.6% 52.3% 38.9% 50.0% 24.2% 42.4% 63.6% 54.5% 44.0% 45.5% 56.4% 47.3% 50.0% 49.1% 51.2% B D h HI
Comparison Groups: BC/DE/FG/HIJ/KL/MN/OP/QRIndependent Z-Test for Percentages (unpooled proportions)Uppercase letters indicate significance at the 95% level.Lowercase letters indicate significance at the 90% level.Note: When comparing groups the Z-Test is only valid for large sample sizes (generally, n >=30) Presented by SPH Analytics 770-978-3173 2016

Page 27
UMP UW MEDICINE ACCOUNTABLE CARE NETWORK 2016 CAHPS 5.0H Commercial Adult Survey (1113020)
Q68. If you had a problem understanding the benefits your health plan offers, which type(s) of benefits were you unable to understand? (Mark all that apply.)
= HEALTH PLAN = = HEALTH CARE = === DOCTOR ==== = HEALTH PLAN RTNG = === CONTACT === = GOT INFO/HELP= == # DCTR/ === == CLAIMS === = RATING (Q42)= = RATING (Q13)= = RATING (Q23)= = BY GLOBAL PROP. == === CUSTOMER == == FROM CUST === === CLINIC === === (Q39) === ====== (Q42) ======= === SVC (Q34) = == SVC (Q35) === = VISITS (Q7)= Never/ Always/ Less 3 or Total 0-7 8-10 0-7 8-10 0-7 8-10 0-6 7-8 9-10 Yes No Sometime Usually than 3 More Yes No ------ ------- ------- ------- ------- ------- ------- ------ ------ ------ ------- ------- -------- ------- ------- ------ ------ ------
Total Eligible 176 56 120 35 128 18 144 33 66 77 66 109 11 55 74 100 108 43
Total Valid Responses 211 91 120 64 129 20 173 64 87 60 96 114 29 67 103 101 127 53
Total Respondents 100 38 62 25 68 10 83 25 39 36 44 55 9 35 44 54 61 24 100.0% 100.0% 100.0% 100.0% 100.0% 100.0% 100.0% 100.0% 100.0% 100.0% 100.0% 100.0% 100.0% 100.0% 100.0% 100.0% 100.0% 100.0%
Copays, coinsurance, 62 30 32 21 37 6 51 20 26 16 24 38 5 19 26 34 36 17deductibles 62.0% 78.9% 51.6% 84.0% 54.4% 60.0% 61.4% 80.0% 66.7% 44.4% 54.5% 69.1% 55.6% 54.3% 59.1% 63.0% 59.0% 70.8%
Pharmacy benefits and 35 11 24 7 25 4 27 9 14 12 15 20 4 11 17 16 21 9the plan formulary 35.0% 28.9% 38.7% 28.0% 36.8% 40.0% 32.5% 36.0% 35.9% 33.3% 34.1% 36.4% 44.4% 31.4% 38.6% 29.6% 34.4% 37.5%
Inpatient 11 4 7 3 7 2 9 3 5 3 3 8 1 2 7 4 7 3hospitalization 11.0% 10.5% 11.3% 12.0% 10.3% 20.0% 10.8% 12.0% 12.8% 8.3% 6.8% 14.5% 11.1% 5.7% 15.9% 7.4% 11.5% 12.5%
Emergency care 11 3 8 3 7 - 11 2 7 2 5 6 2 3 8 3 6 3 11.0% 7.9% 12.9% 12.0% 10.3% 13.3% 8.0% 17.9% 5.6% 11.4% 10.9% 22.2% 8.6% 18.2% 5.6% 9.8% 12.5%
In-network versus out-of- 40 20 20 15 21 3 33 13 17 10 18 21 4 14 19 20 25 8network care 40.0% 52.6% 32.3% 60.0% 30.9% 30.0% 39.8% 52.0% 43.6% 27.8% 40.9% 38.2% 44.4% 40.0% 43.2% 37.0% 41.0% 33.3%
Lab and radiology 15 7 8 5 8 2 12 4 7 4 8 7 4 4 8 6 9 5 15.0% 18.4% 12.9% 20.0% 11.8% 20.0% 14.5% 16.0% 17.9% 11.1% 18.2% 12.7% 44.4% 11.4% 18.2% 11.1% 14.8% 20.8%
Preventive care 18 10 8 5 10 2 15 8 6 4 8 10 4 4 10 7 9 6 18.0% 26.3% 12.9% 20.0% 14.7% 20.0% 18.1% 32.0% 15.4% 11.1% 18.2% 18.2% 44.4% 11.4% 22.7% 13.0% 14.8% 25.0%
Other 19 6 13 5 14 1 15 5 5 9 15 4 5 10 8 11 14 2 19.0% 15.8% 21.0% 20.0% 20.6% 10.0% 18.1% 20.0% 12.8% 25.0% 34.1% 7.3% 55.6% 28.6% 18.2% 20.4% 23.0% 8.3%
Presented by SPH Analytics 770-978-3173 2016

Page 28
UMP UW MEDICINE ACCOUNTABLE CARE NETWORK 2016 CAHPS 5.0H Commercial Adult Survey (1113020)
Q69. Would you recommend your health plan to your family or friends?
= HEALTH PLAN = = HEALTH CARE = === DOCTOR ==== = HEALTH PLAN RTNG = === CONTACT === = GOT INFO/HELP= == # DCTR/ === == CLAIMS === = RATING (Q42)= = RATING (Q13)= = RATING (Q23)= = BY GLOBAL PROP. == === CUSTOMER == == FROM CUST === === CLINIC === === (Q39) === ====== (Q42) ======= === SVC (Q34) = == SVC (Q35) === = VISITS (Q7)= Never/ Always/ Less 3 or Total 0-7 8-10 0-7 8-10 0-7 8-10 0-6 7-8 9-10 Yes No Sometime Usually than 3 More Yes No ------ ------- ------- ------- ------- ------- ------- ------ ------ ------ ------- ------- -------- ------- ------- ------ ------ ------ (A) (B) (C) (D) (E) (F) (G) (H) (I) (J) (K) (L) (M) (N) (O) (P) (Q) (R)
Total Eligible 176 56 120 35 128 18 144 33 66 77 66 109 11 55 74 100 108 43
Total Answering 176 56 120 35 128 18 144 33 66 77 66 109 11 55 74 100 108 43 100.0% 100.0% 100.0% 100.0% 100.0% 100.0% 100.0% 100.0% 100.0% 100.0% 100.0% 100.0% 100.0% 100.0% 100.0% 100.0% 100.0% 100.0%
No Answer - - - - - - - - - - - - - - - - - -
Definitely yes 71 5 66 2 64 5 64 1 13 57 33 37 4 29 30 41 41 21 40.3% 8.9% 55.0% 5.7% 50.0% 27.8% 44.4% 3.0% 19.7% 74.0% 50.0% 33.9% 36.4% 52.7% 40.5% 41.0% 38.0% 48.8% B D H HI L
Probably yes 89 36 53 22 60 11 67 19 50 20 25 64 3 22 41 47 56 18 50.6% 64.3% 44.2% 62.9% 46.9% 61.1% 46.5% 57.6% 75.8% 26.0% 37.9% 58.7% 27.3% 40.0% 55.4% 47.0% 51.9% 41.9% C e J hJ K
Probably no 11 10 1 6 4 1 10 8 3 - 6 5 3 3 3 7 9 2 6.3% 17.9% 0.8% 17.1% 3.1% 5.6% 6.9% 24.2% 4.5% 9.1% 4.6% 27.3% 5.5% 4.1% 7.0% 8.3% 4.7% C E I
Definitely no 5 5 - 5 - 1 3 5 - - 2 3 1 1 - 5 2 2 2.8% 8.9% 14.3% 5.6% 2.1% 15.2% 3.0% 2.8% 9.1% 1.8% 5.0% 1.9% 4.7%
SPHA SUMMARY RATE - 160 41 119 24 124 16 131 20 63 77 58 101 7 51 71 88 97 39Definitely yes/Probably 90.9% 73.2% 99.2% 68.6% 96.9% 88.9% 91.0% 60.6% 95.5% 100.0% 87.9% 92.7% 63.6% 92.7% 95.9% 88.0% 89.8% 90.7%yes B D H Hi m P
Comparison Groups: BC/DE/FG/HIJ/KL/MN/OP/QRIndependent Z-Test for Percentages (unpooled proportions)Uppercase letters indicate significance at the 95% level.Lowercase letters indicate significance at the 90% level.Note: When comparing groups the Z-Test is only valid for large sample sizes (generally, n >=30) Presented by SPH Analytics 770-978-3173 2016

Page 29
UMP UW MEDICINE ACCOUNTABLE CARE NETWORK 2016 CAHPS 5.0H Commercial Adult Survey (1113020)
Q70. Do you intend to switch to a different health plan when you next have an opportunity?
= HEALTH PLAN = = HEALTH CARE = === DOCTOR ==== = HEALTH PLAN RTNG = === CONTACT === = GOT INFO/HELP= == # DCTR/ === == CLAIMS === = RATING (Q42)= = RATING (Q13)= = RATING (Q23)= = BY GLOBAL PROP. == === CUSTOMER == == FROM CUST === === CLINIC === === (Q39) === ====== (Q42) ======= === SVC (Q34) = == SVC (Q35) === = VISITS (Q7)= Never/ Always/ Less 3 or Total 0-7 8-10 0-7 8-10 0-7 8-10 0-6 7-8 9-10 Yes No Sometime Usually than 3 More Yes No ------ ------- ------- ------- ------- ------- ------- ------ ------ ------ ------- ------- -------- ------- ------- ------ ------ ------ (A) (B) (C) (D) (E) (F) (G) (H) (I) (J) (K) (L) (M) (N) (O) (P) (Q) (R)
Total Eligible 176 56 120 35 128 18 144 33 66 77 66 109 11 55 74 100 108 43
Total Answering 175 56 119 35 127 18 143 33 66 76 66 108 11 55 74 99 108 43 100.0% 100.0% 100.0% 100.0% 100.0% 100.0% 100.0% 100.0% 100.0% 100.0% 100.0% 100.0% 100.0% 100.0% 100.0% 100.0% 100.0% 100.0%
No Answer 1 - 1 - 1 - 1 - - 1 - 1 - - - 1 - -
Definitely no 67 5 62 3 60 5 58 2 18 47 26 40 3 23 28 39 37 21 38.3% 8.9% 52.1% 8.6% 47.2% 27.8% 40.6% 6.1% 27.3% 61.8% 39.4% 37.0% 27.3% 41.8% 37.8% 39.4% 34.3% 48.8% B D H HI
Probably no 83 34 49 18 58 9 65 19 38 26 25 58 5 20 41 42 51 18 47.4% 60.7% 41.2% 51.4% 45.7% 50.0% 45.5% 57.6% 57.6% 34.2% 37.9% 53.7% 45.5% 36.4% 55.4% 42.4% 47.2% 41.9% C J J K p
Probably yes 14 9 5 8 4 4 10 6 7 1 11 3 3 8 4 8 13 1 8.0% 16.1% 4.2% 22.9% 3.1% 22.2% 7.0% 18.2% 10.6% 1.3% 16.7% 2.8% 27.3% 14.5% 5.4% 8.1% 12.0% 2.3% C E J J L R
Definitely yes 11 8 3 6 5 - 10 6 3 2 4 7 - 4 1 10 7 3 6.3% 14.3% 2.5% 17.1% 3.9% 7.0% 18.2% 4.5% 2.6% 6.1% 6.5% 7.3% 1.4% 10.1% 6.5% 7.0% C E iJ O
SPHA SUMMARY RATE - 150 39 111 21 118 14 123 21 56 73 51 98 8 43 69 81 88 39Definitely no/Probably 85.7% 69.6% 93.3% 60.0% 92.9% 77.8% 86.0% 63.6% 84.8% 96.1% 77.3% 90.7% 72.7% 78.2% 93.2% 81.8% 81.5% 90.7%no B D H HI K P
Comparison Groups: BC/DE/FG/HIJ/KL/MN/OP/QRIndependent Z-Test for Percentages (unpooled proportions)Uppercase letters indicate significance at the 95% level.Lowercase letters indicate significance at the 90% level.Note: When comparing groups the Z-Test is only valid for large sample sizes (generally, n >=30) Presented by SPH Analytics 770-978-3173 2016

Page 30
UMP UW MEDICINE ACCOUNTABLE CARE NETWORK 2016 CAHPS 5.0H Commercial Adult Survey (1113020)
Q71. In the last 12 months, did you call or were you transferred by your health plan to Washington State Rx Services?
= HEALTH PLAN = = HEALTH CARE = === DOCTOR ==== = HEALTH PLAN RTNG = === CONTACT === = GOT INFO/HELP= == # DCTR/ === == CLAIMS === = RATING (Q42)= = RATING (Q13)= = RATING (Q23)= = BY GLOBAL PROP. == === CUSTOMER == == FROM CUST === === CLINIC === === (Q39) === ====== (Q42) ======= === SVC (Q34) = == SVC (Q35) === = VISITS (Q7)= Never/ Always/ Less 3 or Total 0-7 8-10 0-7 8-10 0-7 8-10 0-6 7-8 9-10 Yes No Sometime Usually than 3 More Yes No ------ ------- ------- ------- ------- ------- ------- ------ ------ ------ ------- ------- -------- ------- ------- ------ ------ ------ (A) (B) (C) (D) (E) (F) (G) (H) (I) (J) (K) (L) (M) (N) (O) (P) (Q) (R)
Total Eligible 176 56 120 35 128 18 144 33 66 77 66 109 11 55 74 100 108 43
Total Answering 174 56 118 35 126 18 142 33 65 76 65 108 10 55 74 98 108 42 100.0% 100.0% 100.0% 100.0% 100.0% 100.0% 100.0% 100.0% 100.0% 100.0% 100.0% 100.0% 100.0% 100.0% 100.0% 100.0% 100.0% 100.0%
No Answer 2 - 2 - 2 - 2 - 1 1 1 1 1 - - 2 - 1
Yes 18 8 10 5 12 5 13 6 3 9 12 6 3 9 3 14 10 6 10.3% 14.3% 8.5% 14.3% 9.5% 27.8% 9.2% 18.2% 4.6% 11.8% 18.5% 5.6% 30.0% 16.4% 4.1% 14.3% 9.3% 14.3% g i L O
No 156 48 108 30 114 13 129 27 62 67 53 102 7 46 71 84 98 36 89.7% 85.7% 91.5% 85.7% 90.5% 72.2% 90.8% 81.8% 95.4% 88.2% 81.5% 94.4% 70.0% 83.6% 95.9% 85.7% 90.7% 85.7% f h K P
SPHA SUMMARY RATE - Yes 18 8 10 5 12 5 13 6 3 9 12 6 3 9 3 14 10 6 10.3% 14.3% 8.5% 14.3% 9.5% 27.8% 9.2% 18.2% 4.6% 11.8% 18.5% 5.6% 30.0% 16.4% 4.1% 14.3% 9.3% 14.3% g i L O
Comparison Groups: BC/DE/FG/HIJ/KL/MN/OP/QRIndependent Z-Test for Percentages (unpooled proportions)Uppercase letters indicate significance at the 95% level.Lowercase letters indicate significance at the 90% level.Note: When comparing groups the Z-Test is only valid for large sample sizes (generally, n >=30) Presented by SPH Analytics 770-978-3173 2016

Page 31
UMP UW MEDICINE ACCOUNTABLE CARE NETWORK 2016 CAHPS 5.0H Commercial Adult Survey (1113020)
Q72. In the last 12 months, how often were you able to get the help you needed when you called Washington State Rx Services?
= HEALTH PLAN = = HEALTH CARE = === DOCTOR ==== = HEALTH PLAN RTNG = === CONTACT === = GOT INFO/HELP= == # DCTR/ === == CLAIMS === = RATING (Q42)= = RATING (Q13)= = RATING (Q23)= = BY GLOBAL PROP. == === CUSTOMER == == FROM CUST === === CLINIC === === (Q39) === ====== (Q42) ======= === SVC (Q34) = == SVC (Q35) === = VISITS (Q7)= Never/ Always/ Less 3 or Total 0-7 8-10 0-7 8-10 0-7 8-10 0-6 7-8 9-10 Yes No Sometime Usually than 3 More Yes No ------ ------- ------- ------- ------- ------- ------- ------ ------ ------ ------- ------- -------- ------- ------- ------ ------ ------ (A) (B) (C) (D) (E) (F) (G) (H) (I) (J) (K) (L) (M) (N) (O) (P) (Q) (R)
Total Eligible 18 8 10 5 12 5 13 6 3 9 12 6 3 9 3 14 10 6
Total Answering 18 8 10 5 12 5 13 6 3 9 12 6 3 9 3 14 10 6 100.0% 100.0% 100.0% 100.0% 100.0% 100.0% 100.0% 100.0% 100.0% 100.0% 100.0% 100.0% 100.0% 100.0% 100.0% 100.0% 100.0% 100.0%
No Answer - - - - - - - - - - - - - - - - - -
Never 1 1 - - 1 - 1 - 1 - - 1 - - - 1 - 1 5.6% 12.5% 8.3% 7.7% 33.3% 16.7% 7.1% 16.7%
Sometimes 1 - 1 - 1 - 1 - - 1 1 - 1 - 1 - 1 - 5.6% 10.0% 8.3% 7.7% 11.1% 8.3% 33.3% 33.3% 10.0%
Usually 3 2 1 - 2 1 2 1 2 - - 3 - - - 2 1 2 16.7% 25.0% 10.0% 16.7% 20.0% 15.4% 16.7% 66.7% 50.0% 14.3% 10.0% 33.3%
Always 13 5 8 5 8 4 9 5 - 8 11 2 2 9 2 11 8 3 72.2% 62.5% 80.0% 100.0% 66.7% 80.0% 69.2% 83.3% 88.9% 91.7% 33.3% 66.7% 100.0% 66.7% 78.6% 80.0% 50.0% E L
SPHA SUMMARY RATE - 16 7 9 5 10 5 11 6 2 8 11 5 2 9 2 13 9 5Always/Usually 88.9% 87.5% 90.0% 100.0% 83.3% 100.0% 84.6% 100.0% 66.7% 88.9% 91.7% 83.3% 66.7% 100.0% 66.7% 92.9% 90.0% 83.3%
Comparison Groups: BC/DE/FG/HIJ/KL/MN/OP/QRIndependent Z-Test for Percentages (unpooled proportions)Uppercase letters indicate significance at the 95% level.Lowercase letters indicate significance at the 90% level.Note: When comparing groups the Z-Test is only valid for large sample sizes (generally, n >=30) Presented by SPH Analytics 770-978-3173 2016

Page 32
UMP UW MEDICINE ACCOUNTABLE CARE NETWORK 2016 CAHPS 5.0H Commercial Adult Survey (1113020)
Q73A. Please state your level of agreement with the following: I liked the overall format and appearance of the written materials.
= HEALTH PLAN = = HEALTH CARE = === DOCTOR ==== = HEALTH PLAN RTNG = === CONTACT === = GOT INFO/HELP= == # DCTR/ === == CLAIMS === = RATING (Q42)= = RATING (Q13)= = RATING (Q23)= = BY GLOBAL PROP. == === CUSTOMER == == FROM CUST === === CLINIC === === (Q39) === ====== (Q42) ======= === SVC (Q34) = == SVC (Q35) === = VISITS (Q7)= Never/ Always/ Less 3 or Total 0-7 8-10 0-7 8-10 0-7 8-10 0-6 7-8 9-10 Yes No Sometime Usually than 3 More Yes No ------ ------- ------- ------- ------- ------- ------- ------ ------ ------ ------- ------- -------- ------- ------- ------ ------ ------ (A) (B) (C) (D) (E) (F) (G) (H) (I) (J) (K) (L) (M) (N) (O) (P) (Q) (R)
Total Eligible 18 8 10 5 12 5 13 6 3 9 12 6 3 9 3 14 10 6
Total Answering 16 7 9 4 11 5 11 5 3 8 10 6 3 7 3 12 8 6 100.0% 100.0% 100.0% 100.0% 100.0% 100.0% 100.0% 100.0% 100.0% 100.0% 100.0% 100.0% 100.0% 100.0% 100.0% 100.0% 100.0% 100.0%
No Answer - - - - - - - - - - - - - - - - - -
Strongly Agree 2 - 2 - 2 - 2 - - 2 2 - 1 1 - 2 1 - 12.5% 22.2% 18.2% 18.2% 25.0% 20.0% 33.3% 14.3% 16.7% 12.5%
Agree 7 2 5 2 5 3 4 2 1 4 5 2 - 5 2 5 3 3 43.8% 28.6% 55.6% 50.0% 45.5% 60.0% 36.4% 40.0% 33.3% 50.0% 50.0% 33.3% 71.4% 66.7% 41.7% 37.5% 50.0%
Neither Agree nor 7 5 2 2 4 2 5 3 2 2 3 4 2 1 1 5 4 3Disagree 43.8% 71.4% 22.2% 50.0% 36.4% 40.0% 45.5% 60.0% 66.7% 25.0% 30.0% 66.7% 66.7% 14.3% 33.3% 41.7% 50.0% 50.0% C n
Disagree - - - - - - - - - - - - - - - - - -
Strongly Disagree - - - - - - - - - - - - - - - - - -
Don't know 2 1 1 1 1 - 2 1 - 1 2 - - 2 - 2 2 -
SPHA SUMMARY RATE - 9 2 7 2 7 3 6 2 1 6 7 2 1 6 2 7 4 3Strongly Agree/Agree 56.3% 28.6% 77.8% 50.0% 63.6% 60.0% 54.5% 40.0% 33.3% 75.0% 70.0% 33.3% 33.3% 85.7% 66.7% 58.3% 50.0% 50.0% B m
Comparison Groups: BC/DE/FG/HIJ/KL/MN/OP/QRIndependent Z-Test for Percentages (unpooled proportions)Uppercase letters indicate significance at the 95% level.Lowercase letters indicate significance at the 90% level.Note: When comparing groups the Z-Test is only valid for large sample sizes (generally, n >=30) Presented by SPH Analytics 770-978-3173 2016

Page 33
UMP UW MEDICINE ACCOUNTABLE CARE NETWORK 2016 CAHPS 5.0H Commercial Adult Survey (1113020)
Q73B. Please state your level of agreement with the following: The new member materials were easy to understand.
= HEALTH PLAN = = HEALTH CARE = === DOCTOR ==== = HEALTH PLAN RTNG = === CONTACT === = GOT INFO/HELP= == # DCTR/ === == CLAIMS === = RATING (Q42)= = RATING (Q13)= = RATING (Q23)= = BY GLOBAL PROP. == === CUSTOMER == == FROM CUST === === CLINIC === === (Q39) === ====== (Q42) ======= === SVC (Q34) = == SVC (Q35) === = VISITS (Q7)= Never/ Always/ Less 3 or Total 0-7 8-10 0-7 8-10 0-7 8-10 0-6 7-8 9-10 Yes No Sometime Usually than 3 More Yes No ------ ------- ------- ------- ------- ------- ------- ------ ------ ------ ------- ------- -------- ------- ------- ------ ------ ------ (A) (B) (C) (D) (E) (F) (G) (H) (I) (J) (K) (L) (M) (N) (O) (P) (Q) (R)
Total Eligible 18 8 10 5 12 5 13 6 3 9 12 6 3 9 3 14 10 6
Total Answering 17 7 10 4 12 5 12 5 3 9 11 6 3 8 3 13 9 6 100.0% 100.0% 100.0% 100.0% 100.0% 100.0% 100.0% 100.0% 100.0% 100.0% 100.0% 100.0% 100.0% 100.0% 100.0% 100.0% 100.0% 100.0%
No Answer - - - - - - - - - - - - - - - - - -
Strongly Agree 2 - 2 - 2 - 2 - - 2 2 - - 2 - 2 2 - 11.8% 20.0% 16.7% 16.7% 22.2% 18.2% 25.0% 15.4% 22.2%
Agree 10 4 6 3 7 2 8 3 2 5 6 4 1 5 1 9 4 5 58.8% 57.1% 60.0% 75.0% 58.3% 40.0% 66.7% 60.0% 66.7% 55.6% 54.5% 66.7% 33.3% 62.5% 33.3% 69.2% 44.4% 83.3% q
Neither Agree nor 5 3 2 1 3 3 2 2 1 2 3 2 2 1 2 2 3 1Disagree 29.4% 42.9% 20.0% 25.0% 25.0% 60.0% 16.7% 40.0% 33.3% 22.2% 27.3% 33.3% 66.7% 12.5% 66.7% 15.4% 33.3% 16.7% g n p
Disagree - - - - - - - - - - - - - - - - - -
Strongly Disagree - - - - - - - - - - - - - - - - - -
Don't know 1 1 - 1 - - 1 1 - - 1 - - 1 - 1 1 -
SPHA SUMMARY RATE - 12 4 8 3 9 2 10 3 2 7 8 4 1 7 1 11 6 5Strongly Agree/Agree 70.6% 57.1% 80.0% 75.0% 75.0% 40.0% 83.3% 60.0% 66.7% 77.8% 72.7% 66.7% 33.3% 87.5% 33.3% 84.6% 66.7% 83.3% f m o
Comparison Groups: BC/DE/FG/HIJ/KL/MN/OP/QRIndependent Z-Test for Percentages (unpooled proportions)Uppercase letters indicate significance at the 95% level.Lowercase letters indicate significance at the 90% level.Note: When comparing groups the Z-Test is only valid for large sample sizes (generally, n >=30) Presented by SPH Analytics 770-978-3173 2016
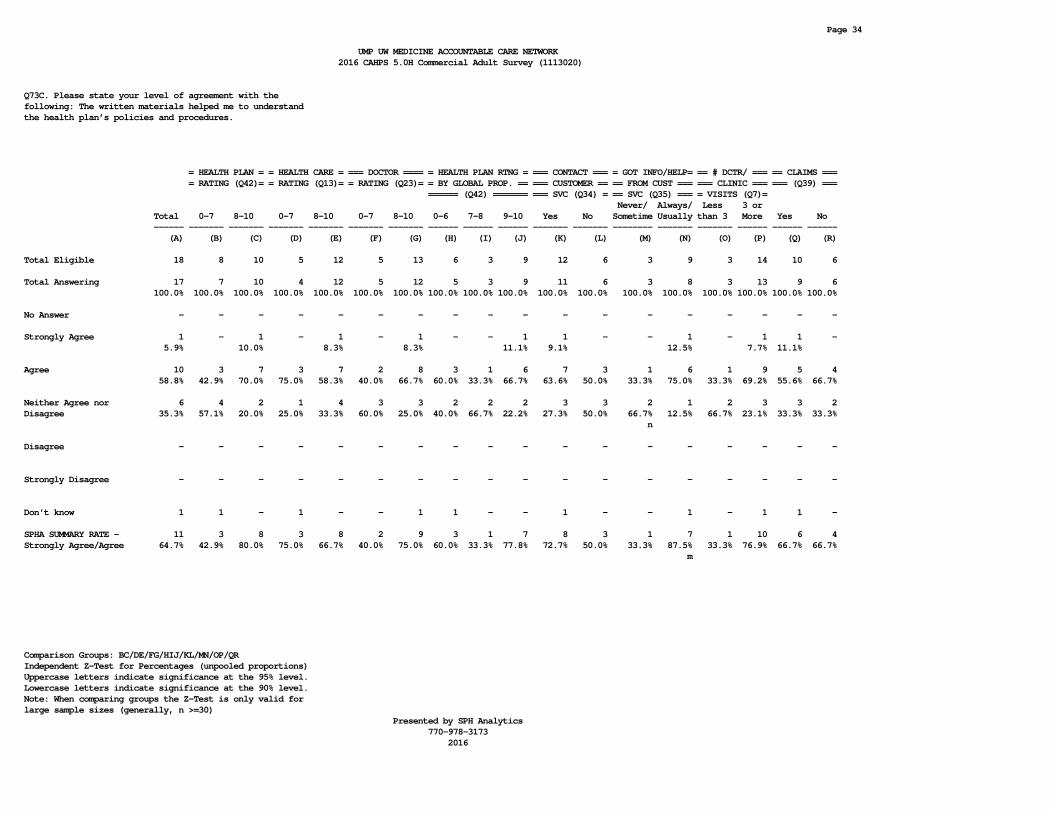
Page 34
UMP UW MEDICINE ACCOUNTABLE CARE NETWORK 2016 CAHPS 5.0H Commercial Adult Survey (1113020)
Q73C. Please state your level of agreement with the following: The written materials helped me to understand the health plan’s policies and procedures.
= HEALTH PLAN = = HEALTH CARE = === DOCTOR ==== = HEALTH PLAN RTNG = === CONTACT === = GOT INFO/HELP= == # DCTR/ === == CLAIMS === = RATING (Q42)= = RATING (Q13)= = RATING (Q23)= = BY GLOBAL PROP. == === CUSTOMER == == FROM CUST === === CLINIC === === (Q39) === ====== (Q42) ======= === SVC (Q34) = == SVC (Q35) === = VISITS (Q7)= Never/ Always/ Less 3 or Total 0-7 8-10 0-7 8-10 0-7 8-10 0-6 7-8 9-10 Yes No Sometime Usually than 3 More Yes No ------ ------- ------- ------- ------- ------- ------- ------ ------ ------ ------- ------- -------- ------- ------- ------ ------ ------ (A) (B) (C) (D) (E) (F) (G) (H) (I) (J) (K) (L) (M) (N) (O) (P) (Q) (R)
Total Eligible 18 8 10 5 12 5 13 6 3 9 12 6 3 9 3 14 10 6
Total Answering 17 7 10 4 12 5 12 5 3 9 11 6 3 8 3 13 9 6 100.0% 100.0% 100.0% 100.0% 100.0% 100.0% 100.0% 100.0% 100.0% 100.0% 100.0% 100.0% 100.0% 100.0% 100.0% 100.0% 100.0% 100.0%
No Answer - - - - - - - - - - - - - - - - - -
Strongly Agree 1 - 1 - 1 - 1 - - 1 1 - - 1 - 1 1 - 5.9% 10.0% 8.3% 8.3% 11.1% 9.1% 12.5% 7.7% 11.1%
Agree 10 3 7 3 7 2 8 3 1 6 7 3 1 6 1 9 5 4 58.8% 42.9% 70.0% 75.0% 58.3% 40.0% 66.7% 60.0% 33.3% 66.7% 63.6% 50.0% 33.3% 75.0% 33.3% 69.2% 55.6% 66.7%
Neither Agree nor 6 4 2 1 4 3 3 2 2 2 3 3 2 1 2 3 3 2Disagree 35.3% 57.1% 20.0% 25.0% 33.3% 60.0% 25.0% 40.0% 66.7% 22.2% 27.3% 50.0% 66.7% 12.5% 66.7% 23.1% 33.3% 33.3% n
Disagree - - - - - - - - - - - - - - - - - -
Strongly Disagree - - - - - - - - - - - - - - - - - -
Don't know 1 1 - 1 - - 1 1 - - 1 - - 1 - 1 1 -
SPHA SUMMARY RATE - 11 3 8 3 8 2 9 3 1 7 8 3 1 7 1 10 6 4Strongly Agree/Agree 64.7% 42.9% 80.0% 75.0% 66.7% 40.0% 75.0% 60.0% 33.3% 77.8% 72.7% 50.0% 33.3% 87.5% 33.3% 76.9% 66.7% 66.7% m
Comparison Groups: BC/DE/FG/HIJ/KL/MN/OP/QRIndependent Z-Test for Percentages (unpooled proportions)Uppercase letters indicate significance at the 95% level.Lowercase letters indicate significance at the 90% level.Note: When comparing groups the Z-Test is only valid for large sample sizes (generally, n >=30) Presented by SPH Analytics 770-978-3173 2016

Page 35
UMP UW MEDICINE ACCOUNTABLE CARE NETWORK 2016 CAHPS 5.0H Commercial Adult Survey (1113020)
Q73D. Please state your level of agreement with the following: The new member written materials are an effective way to provide health benefit information.
= HEALTH PLAN = = HEALTH CARE = === DOCTOR ==== = HEALTH PLAN RTNG = === CONTACT === = GOT INFO/HELP= == # DCTR/ === == CLAIMS === = RATING (Q42)= = RATING (Q13)= = RATING (Q23)= = BY GLOBAL PROP. == === CUSTOMER == == FROM CUST === === CLINIC === === (Q39) === ====== (Q42) ======= === SVC (Q34) = == SVC (Q35) === = VISITS (Q7)= Never/ Always/ Less 3 or Total 0-7 8-10 0-7 8-10 0-7 8-10 0-6 7-8 9-10 Yes No Sometime Usually than 3 More Yes No ------ ------- ------- ------- ------- ------- ------- ------ ------ ------ ------- ------- -------- ------- ------- ------ ------ ------ (A) (B) (C) (D) (E) (F) (G) (H) (I) (J) (K) (L) (M) (N) (O) (P) (Q) (R)
Total Eligible 18 8 10 5 12 5 13 6 3 9 12 6 3 9 3 14 10 6
Total Answering 17 7 10 4 12 5 12 5 3 9 11 6 3 8 3 13 9 6 100.0% 100.0% 100.0% 100.0% 100.0% 100.0% 100.0% 100.0% 100.0% 100.0% 100.0% 100.0% 100.0% 100.0% 100.0% 100.0% 100.0% 100.0%
No Answer - - - - - - - - - - - - - - - - - -
Strongly Agree 3 - 3 - 3 - 3 - - 3 3 - - 3 - 3 3 - 17.6% 30.0% 25.0% 25.0% 33.3% 27.3% 37.5% 23.1% 33.3%
Agree 9 3 6 2 7 1 8 2 2 5 5 4 2 3 1 8 3 5 52.9% 42.9% 60.0% 50.0% 58.3% 20.0% 66.7% 40.0% 66.7% 55.6% 45.5% 66.7% 66.7% 37.5% 33.3% 61.5% 33.3% 83.3% F Q
Neither Agree nor 4 4 - 2 1 3 1 3 1 - 2 2 1 1 1 2 3 1Disagree 23.5% 57.1% 50.0% 8.3% 60.0% 8.3% 60.0% 33.3% 18.2% 33.3% 33.3% 12.5% 33.3% 15.4% 33.3% 16.7% G
Disagree 1 - 1 - 1 1 - - - 1 1 - - 1 1 - - - 5.9% 10.0% 8.3% 20.0% 11.1% 9.1% 12.5% 33.3%
Strongly Disagree - - - - - - - - - - - - - - - - - -
Don't know 1 1 - 1 - - 1 1 - - 1 - - 1 - 1 1 -
SPHA SUMMARY RATE - 12 3 9 2 10 1 11 2 2 8 8 4 2 6 1 11 6 5Strongly Agree/Agree 70.6% 42.9% 90.0% 50.0% 83.3% 20.0% 91.7% 40.0% 66.7% 88.9% 72.7% 66.7% 66.7% 75.0% 33.3% 84.6% 66.7% 83.3% B F H o
Comparison Groups: BC/DE/FG/HIJ/KL/MN/OP/QRIndependent Z-Test for Percentages (unpooled proportions)Uppercase letters indicate significance at the 95% level.Lowercase letters indicate significance at the 90% level.Note: When comparing groups the Z-Test is only valid for large sample sizes (generally, n >=30) Presented by SPH Analytics 770-978-3173 2016

Page 36
UMP UW MEDICINE ACCOUNTABLE CARE NETWORK 2016 CAHPS 5.0H Commercial Adult Survey (1113020)
Q73E. Please state your level of agreement with the following: The written materials helped me to understand my out-of-pocket expenses.
= HEALTH PLAN = = HEALTH CARE = === DOCTOR ==== = HEALTH PLAN RTNG = === CONTACT === = GOT INFO/HELP= == # DCTR/ === == CLAIMS === = RATING (Q42)= = RATING (Q13)= = RATING (Q23)= = BY GLOBAL PROP. == === CUSTOMER == == FROM CUST === === CLINIC === === (Q39) === ====== (Q42) ======= === SVC (Q34) = == SVC (Q35) === = VISITS (Q7)= Never/ Always/ Less 3 or Total 0-7 8-10 0-7 8-10 0-7 8-10 0-6 7-8 9-10 Yes No Sometime Usually than 3 More Yes No ------ ------- ------- ------- ------- ------- ------- ------ ------ ------ ------- ------- -------- ------- ------- ------ ------ ------ (A) (B) (C) (D) (E) (F) (G) (H) (I) (J) (K) (L) (M) (N) (O) (P) (Q) (R)
Total Eligible 18 8 10 5 12 5 13 6 3 9 12 6 3 9 3 14 10 6
Total Answering 17 7 10 4 12 5 12 5 3 9 11 6 3 8 3 13 9 6 100.0% 100.0% 100.0% 100.0% 100.0% 100.0% 100.0% 100.0% 100.0% 100.0% 100.0% 100.0% 100.0% 100.0% 100.0% 100.0% 100.0% 100.0%
No Answer - - - - - - - - - - - - - - - - - -
Strongly Agree 2 - 2 - 2 - 2 - - 2 2 - - 2 - 2 2 - 11.8% 20.0% 16.7% 16.7% 22.2% 18.2% 25.0% 15.4% 22.2%
Agree 5 1 4 1 4 - 5 1 - 4 3 2 - 3 - 5 2 3 29.4% 14.3% 40.0% 25.0% 33.3% 41.7% 20.0% 44.4% 27.3% 33.3% 37.5% 38.5% 22.2% 50.0%
Neither Agree nor 7 3 4 2 5 3 4 3 1 3 5 2 2 3 3 4 3 2Disagree 41.2% 42.9% 40.0% 50.0% 41.7% 60.0% 33.3% 60.0% 33.3% 33.3% 45.5% 33.3% 66.7% 37.5% 100.0% 30.8% 33.3% 33.3% P
Disagree 2 2 - - 1 1 1 - 2 - - 2 - - - 1 1 1 11.8% 28.6% 8.3% 20.0% 8.3% 66.7% 33.3% 7.7% 11.1% 16.7%
Strongly Disagree 1 1 - 1 - 1 - 1 - - 1 - 1 - - 1 1 - 5.9% 14.3% 25.0% 20.0% 20.0% 9.1% 33.3% 7.7% 11.1%
Don't know 1 1 - 1 - - 1 1 - - 1 - - 1 - 1 1 -
SPHA SUMMARY RATE - 7 1 6 1 6 - 7 1 - 6 5 2 - 5 - 7 4 3Strongly Agree/Agree 41.2% 14.3% 60.0% 25.0% 50.0% 58.3% 20.0% 66.7% 45.5% 33.3% 62.5% 53.8% 44.4% 50.0% B h
Comparison Groups: BC/DE/FG/HIJ/KL/MN/OP/QRIndependent Z-Test for Percentages (unpooled proportions)Uppercase letters indicate significance at the 95% level.Lowercase letters indicate significance at the 90% level.Note: When comparing groups the Z-Test is only valid for large sample sizes (generally, n >=30) Presented by SPH Analytics 770-978-3173 2016

Page 37
UMP UW MEDICINE ACCOUNTABLE CARE NETWORK 2016 CAHPS 5.0H Commercial Adult Survey (1113020)
Q73F. Please state your level of agreement with the following: The written materials I received from UMP Classic Plan accurately described the health care coverage I selected.
= HEALTH PLAN = = HEALTH CARE = === DOCTOR ==== = HEALTH PLAN RTNG = === CONTACT === = GOT INFO/HELP= == # DCTR/ === == CLAIMS === = RATING (Q42)= = RATING (Q13)= = RATING (Q23)= = BY GLOBAL PROP. == === CUSTOMER == == FROM CUST === === CLINIC === === (Q39) === ====== (Q42) ======= === SVC (Q34) = == SVC (Q35) === = VISITS (Q7)= Never/ Always/ Less 3 or Total 0-7 8-10 0-7 8-10 0-7 8-10 0-6 7-8 9-10 Yes No Sometime Usually than 3 More Yes No ------ ------- ------- ------- ------- ------- ------- ------ ------ ------ ------- ------- -------- ------- ------- ------ ------ ------ (A) (B) (C) (D) (E) (F) (G) (H) (I) (J) (K) (L) (M) (N) (O) (P) (Q) (R)
Total Eligible 18 8 10 5 12 5 13 6 3 9 12 6 3 9 3 14 10 6
Total Answering 17 8 9 5 11 5 12 6 3 8 12 5 3 9 3 13 10 5 100.0% 100.0% 100.0% 100.0% 100.0% 100.0% 100.0% 100.0% 100.0% 100.0% 100.0% 100.0% 100.0% 100.0% 100.0% 100.0% 100.0% 100.0%
No Answer - - - - - - - - - - - - - - - - - -
Strongly Agree 2 - 2 - 2 - 2 - - 2 2 - - 2 - 2 2 - 11.8% 22.2% 18.2% 16.7% 25.0% 16.7% 22.2% 15.4% 20.0%
Agree 10 5 5 3 6 3 7 4 2 4 6 4 1 5 2 7 6 4 58.8% 62.5% 55.6% 60.0% 54.5% 60.0% 58.3% 66.7% 66.7% 50.0% 50.0% 80.0% 33.3% 55.6% 66.7% 53.8% 60.0% 80.0%
Neither Agree nor 3 1 2 - 3 1 2 - 1 2 2 1 1 1 1 2 - 1Disagree 17.6% 12.5% 22.2% 27.3% 20.0% 16.7% 33.3% 25.0% 16.7% 20.0% 33.3% 11.1% 33.3% 15.4% 20.0%
Disagree 1 1 - 1 - 1 - 1 - - 1 - 1 - - 1 1 - 5.9% 12.5% 20.0% 20.0% 16.7% 8.3% 33.3% 7.7% 10.0%
Strongly Disagree 1 1 - 1 - - 1 1 - - 1 - - 1 - 1 1 - 5.9% 12.5% 20.0% 8.3% 16.7% 8.3% 11.1% 7.7% 10.0%
Don't know 1 - 1 - 1 - 1 - - 1 - 1 - - - 1 - 1
SPHA SUMMARY RATE - 12 5 7 3 8 3 9 4 2 6 8 4 1 7 2 9 8 4Strongly Agree/Agree 70.6% 62.5% 77.8% 60.0% 72.7% 60.0% 75.0% 66.7% 66.7% 75.0% 66.7% 80.0% 33.3% 77.8% 66.7% 69.2% 80.0% 80.0%
Comparison Groups: BC/DE/FG/HIJ/KL/MN/OP/QRIndependent Z-Test for Percentages (unpooled proportions)Uppercase letters indicate significance at the 95% level.Lowercase letters indicate significance at the 90% level.Note: When comparing groups the Z-Test is only valid for large sample sizes (generally, n >=30) Presented by SPH Analytics 770-978-3173 2016

Page 38
UMP UW MEDICINE ACCOUNTABLE CARE NETWORK 2016 CAHPS 5.0H Commercial Adult Survey (1113020)
Q74A. Please state to what extent you agree or disagree with each statement: I know how to choose or find a doctor in my plan’s network.
= HEALTH PLAN = = HEALTH CARE = === DOCTOR ==== = HEALTH PLAN RTNG = === CONTACT === = GOT INFO/HELP= == # DCTR/ === == CLAIMS === = RATING (Q42)= = RATING (Q13)= = RATING (Q23)= = BY GLOBAL PROP. == === CUSTOMER == == FROM CUST === === CLINIC === === (Q39) === ====== (Q42) ======= === SVC (Q34) = == SVC (Q35) === = VISITS (Q7)= Never/ Always/ Less 3 or Total 0-7 8-10 0-7 8-10 0-7 8-10 0-6 7-8 9-10 Yes No Sometime Usually than 3 More Yes No ------ ------- ------- ------- ------- ------- ------- ------ ------ ------ ------- ------- -------- ------- ------- ------ ------ ------ (A) (B) (C) (D) (E) (F) (G) (H) (I) (J) (K) (L) (M) (N) (O) (P) (Q) (R)
Total Eligible 18 8 10 5 12 5 13 6 3 9 12 6 3 9 3 14 10 6
Total Answering 18 8 10 5 12 5 13 6 3 9 12 6 3 9 3 14 10 6 100.0% 100.0% 100.0% 100.0% 100.0% 100.0% 100.0% 100.0% 100.0% 100.0% 100.0% 100.0% 100.0% 100.0% 100.0% 100.0% 100.0% 100.0%
No Answer - - - - - - - - - - - - - - - - - -
Strongly Agree 9 2 7 1 8 2 7 2 - 7 7 2 2 5 2 7 5 2 50.0% 25.0% 70.0% 20.0% 66.7% 40.0% 53.8% 33.3% 77.8% 58.3% 33.3% 66.7% 55.6% 66.7% 50.0% 50.0% 33.3% B D h
Agree 8 5 3 3 4 3 5 3 3 2 4 4 1 3 1 6 4 4 44.4% 62.5% 30.0% 60.0% 33.3% 60.0% 38.5% 50.0% 100.0% 22.2% 33.3% 66.7% 33.3% 33.3% 33.3% 42.9% 40.0% 66.7% HJ
Neither Agree nor - - - - - - - - - - - - - - - - - -Disagree
Disagree - - - - - - - - - - - - - - - - - -
Strongly Disagree 1 1 - 1 - - 1 1 - - 1 - - 1 - 1 1 - 5.6% 12.5% 20.0% 7.7% 16.7% 8.3% 11.1% 7.1% 10.0%
Don't know - - - - - - - - - - - - - - - - - -
SPHA SUMMARY RATE - 17 7 10 4 12 5 12 5 3 9 11 6 3 8 3 13 9 6Strongly Agree/Agree 94.4% 87.5% 100.0% 80.0% 100.0% 100.0% 92.3% 83.3% 100.0% 100.0% 91.7% 100.0% 100.0% 88.9% 100.0% 92.9% 90.0% 100.0%
Comparison Groups: BC/DE/FG/HIJ/KL/MN/OP/QRIndependent Z-Test for Percentages (unpooled proportions)Uppercase letters indicate significance at the 95% level.Lowercase letters indicate significance at the 90% level.Note: When comparing groups the Z-Test is only valid for large sample sizes (generally, n >=30) Presented by SPH Analytics 770-978-3173 2016

Page 39
UMP UW MEDICINE ACCOUNTABLE CARE NETWORK 2016 CAHPS 5.0H Commercial Adult Survey (1113020)
Q74B. Please state to what extent you agree or disagree with each statement: I know what to do when I or a family member needs urgent or emergency care.
= HEALTH PLAN = = HEALTH CARE = === DOCTOR ==== = HEALTH PLAN RTNG = === CONTACT === = GOT INFO/HELP= == # DCTR/ === == CLAIMS === = RATING (Q42)= = RATING (Q13)= = RATING (Q23)= = BY GLOBAL PROP. == === CUSTOMER == == FROM CUST === === CLINIC === === (Q39) === ====== (Q42) ======= === SVC (Q34) = == SVC (Q35) === = VISITS (Q7)= Never/ Always/ Less 3 or Total 0-7 8-10 0-7 8-10 0-7 8-10 0-6 7-8 9-10 Yes No Sometime Usually than 3 More Yes No ------ ------- ------- ------- ------- ------- ------- ------ ------ ------ ------- ------- -------- ------- ------- ------ ------ ------ (A) (B) (C) (D) (E) (F) (G) (H) (I) (J) (K) (L) (M) (N) (O) (P) (Q) (R)
Total Eligible 18 8 10 5 12 5 13 6 3 9 12 6 3 9 3 14 10 6
Total Answering 18 8 10 5 12 5 13 6 3 9 12 6 3 9 3 14 10 6 100.0% 100.0% 100.0% 100.0% 100.0% 100.0% 100.0% 100.0% 100.0% 100.0% 100.0% 100.0% 100.0% 100.0% 100.0% 100.0% 100.0% 100.0%
No Answer - - - - - - - - - - - - - - - - - -
Strongly Agree 8 3 5 2 6 1 7 3 - 5 6 2 2 4 - 8 5 2 44.4% 37.5% 50.0% 40.0% 50.0% 20.0% 53.8% 50.0% 55.6% 50.0% 33.3% 66.7% 44.4% 57.1% 50.0% 33.3%
Agree 5 3 2 2 2 2 3 2 1 2 3 2 - 3 1 3 3 2 27.8% 37.5% 20.0% 40.0% 16.7% 40.0% 23.1% 33.3% 33.3% 22.2% 25.0% 33.3% 33.3% 33.3% 21.4% 30.0% 33.3%
Neither Agree nor 3 - 3 - 3 1 2 - 1 2 2 1 1 1 2 1 1 1Disagree 16.7% 30.0% 25.0% 20.0% 15.4% 33.3% 22.2% 16.7% 16.7% 33.3% 11.1% 66.7% 7.1% 10.0% 16.7% P
Disagree 2 2 - 1 1 1 1 1 1 - 1 1 - 1 - 2 1 1 11.1% 25.0% 20.0% 8.3% 20.0% 7.7% 16.7% 33.3% 8.3% 16.7% 11.1% 14.3% 10.0% 16.7%
Strongly Disagree - - - - - - - - - - - - - - - - - -
Don't know - - - - - - - - - - - - - - - - - -
SPHA SUMMARY RATE - 13 6 7 4 8 3 10 5 1 7 9 4 2 7 1 11 8 4Strongly Agree/Agree 72.2% 75.0% 70.0% 80.0% 66.7% 60.0% 76.9% 83.3% 33.3% 77.8% 75.0% 66.7% 66.7% 77.8% 33.3% 78.6% 80.0% 66.7%
Comparison Groups: BC/DE/FG/HIJ/KL/MN/OP/QRIndependent Z-Test for Percentages (unpooled proportions)Uppercase letters indicate significance at the 95% level.Lowercase letters indicate significance at the 90% level.Note: When comparing groups the Z-Test is only valid for large sample sizes (generally, n >=30) Presented by SPH Analytics 770-978-3173 2016

Page 40
UMP UW MEDICINE ACCOUNTABLE CARE NETWORK 2016 CAHPS 5.0H Commercial Adult Survey (1113020)
Q74C. Please state to what extent you agree or disagree with each statement: I understand what services are covered and not covered in my plan.
= HEALTH PLAN = = HEALTH CARE = === DOCTOR ==== = HEALTH PLAN RTNG = === CONTACT === = GOT INFO/HELP= == # DCTR/ === == CLAIMS === = RATING (Q42)= = RATING (Q13)= = RATING (Q23)= = BY GLOBAL PROP. == === CUSTOMER == == FROM CUST === === CLINIC === === (Q39) === ====== (Q42) ======= === SVC (Q34) = == SVC (Q35) === = VISITS (Q7)= Never/ Always/ Less 3 or Total 0-7 8-10 0-7 8-10 0-7 8-10 0-6 7-8 9-10 Yes No Sometime Usually than 3 More Yes No ------ ------- ------- ------- ------- ------- ------- ------ ------ ------ ------- ------- -------- ------- ------- ------ ------ ------ (A) (B) (C) (D) (E) (F) (G) (H) (I) (J) (K) (L) (M) (N) (O) (P) (Q) (R)
Total Eligible 18 8 10 5 12 5 13 6 3 9 12 6 3 9 3 14 10 6
Total Answering 18 8 10 5 12 5 13 6 3 9 12 6 3 9 3 14 10 6 100.0% 100.0% 100.0% 100.0% 100.0% 100.0% 100.0% 100.0% 100.0% 100.0% 100.0% 100.0% 100.0% 100.0% 100.0% 100.0% 100.0% 100.0%
No Answer - - - - - - - - - - - - - - - - - -
Strongly Agree 3 1 2 1 2 - 3 1 - 2 3 - 1 2 - 3 2 - 16.7% 12.5% 20.0% 20.0% 16.7% 23.1% 16.7% 22.2% 25.0% 33.3% 22.2% 21.4% 20.0%
Agree 10 2 8 2 8 3 7 2 1 7 8 2 2 6 3 7 5 4 55.6% 25.0% 80.0% 40.0% 66.7% 60.0% 53.8% 33.3% 33.3% 77.8% 66.7% 33.3% 66.7% 66.7% 100.0% 50.0% 50.0% 66.7% B h P
Neither Agree nor 2 2 - 1 1 - 2 2 - - - 2 - - - 2 1 1Disagree 11.1% 25.0% 20.0% 8.3% 15.4% 33.3% 33.3% 14.3% 10.0% 16.7%
Disagree 2 2 - - 1 1 1 - 2 - - 2 - - - 1 1 1 11.1% 25.0% 8.3% 20.0% 7.7% 66.7% 33.3% 7.1% 10.0% 16.7%
Strongly Disagree 1 1 - 1 - 1 - 1 - - 1 - - 1 - 1 1 - 5.6% 12.5% 20.0% 20.0% 16.7% 8.3% 11.1% 7.1% 10.0%
Don't know - - - - - - - - - - - - - - - - - -
SPHA SUMMARY RATE - 13 3 10 3 10 3 10 3 1 9 11 2 3 8 3 10 7 4Strongly Agree/Agree 72.2% 37.5% 100.0% 60.0% 83.3% 60.0% 76.9% 50.0% 33.3% 100.0% 91.7% 33.3% 100.0% 88.9% 100.0% 71.4% 70.0% 66.7% B HI L P
Comparison Groups: BC/DE/FG/HIJ/KL/MN/OP/QRIndependent Z-Test for Percentages (unpooled proportions)Uppercase letters indicate significance at the 95% level.Lowercase letters indicate significance at the 90% level.Note: When comparing groups the Z-Test is only valid for large sample sizes (generally, n >=30) Presented by SPH Analytics 770-978-3173 2016

Page 41
UMP UW MEDICINE ACCOUNTABLE CARE NETWORK 2016 CAHPS 5.0H Commercial Adult Survey (1113020)
Q74D. Please state to what extent you agree or disagree with each statement: I understand when I need a referral to a specialist.
= HEALTH PLAN = = HEALTH CARE = === DOCTOR ==== = HEALTH PLAN RTNG = === CONTACT === = GOT INFO/HELP= == # DCTR/ === == CLAIMS === = RATING (Q42)= = RATING (Q13)= = RATING (Q23)= = BY GLOBAL PROP. == === CUSTOMER == == FROM CUST === === CLINIC === === (Q39) === ====== (Q42) ======= === SVC (Q34) = == SVC (Q35) === = VISITS (Q7)= Never/ Always/ Less 3 or Total 0-7 8-10 0-7 8-10 0-7 8-10 0-6 7-8 9-10 Yes No Sometime Usually than 3 More Yes No ------ ------- ------- ------- ------- ------- ------- ------ ------ ------ ------- ------- -------- ------- ------- ------ ------ ------ (A) (B) (C) (D) (E) (F) (G) (H) (I) (J) (K) (L) (M) (N) (O) (P) (Q) (R)
Total Eligible 18 8 10 5 12 5 13 6 3 9 12 6 3 9 3 14 10 6
Total Answering 18 8 10 5 12 5 13 6 3 9 12 6 3 9 3 14 10 6 100.0% 100.0% 100.0% 100.0% 100.0% 100.0% 100.0% 100.0% 100.0% 100.0% 100.0% 100.0% 100.0% 100.0% 100.0% 100.0% 100.0% 100.0%
No Answer - - - - - - - - - - - - - - - - - -
Strongly Agree 4 2 2 1 3 - 4 2 - 2 3 1 1 2 - 4 2 1 22.2% 25.0% 20.0% 20.0% 25.0% 30.8% 33.3% 22.2% 25.0% 16.7% 33.3% 22.2% 28.6% 20.0% 16.7%
Agree 5 1 4 1 4 2 3 1 - 4 5 - - 5 1 4 2 2 27.8% 12.5% 40.0% 20.0% 33.3% 40.0% 23.1% 16.7% 44.4% 41.7% 55.6% 33.3% 28.6% 20.0% 33.3%
Neither Agree nor 2 - 2 - 2 - 2 - - 2 2 - 1 1 1 1 2 -Disagree 11.1% 20.0% 16.7% 15.4% 22.2% 16.7% 33.3% 11.1% 33.3% 7.1% 20.0%
Disagree 7 5 2 3 3 3 4 3 3 1 2 5 1 1 1 5 4 3 38.9% 62.5% 20.0% 60.0% 25.0% 60.0% 30.8% 50.0% 100.0% 11.1% 16.7% 83.3% 33.3% 11.1% 33.3% 35.7% 40.0% 50.0% C j HJ K
Strongly Disagree - - - - - - - - - - - - - - - - - -
Don't know - - - - - - - - - - - - - - - - - -
SPHA SUMMARY RATE - 9 3 6 2 7 2 7 3 - 6 8 1 1 7 1 8 4 3Strongly Agree/Agree 50.0% 37.5% 60.0% 40.0% 58.3% 40.0% 53.8% 50.0% 66.7% 66.7% 16.7% 33.3% 77.8% 33.3% 57.1% 40.0% 50.0% L
Comparison Groups: BC/DE/FG/HIJ/KL/MN/OP/QRIndependent Z-Test for Percentages (unpooled proportions)Uppercase letters indicate significance at the 95% level.Lowercase letters indicate significance at the 90% level.Note: When comparing groups the Z-Test is only valid for large sample sizes (generally, n >=30) Presented by SPH Analytics 770-978-3173 2016

Page 42
UMP UW MEDICINE ACCOUNTABLE CARE NETWORK 2016 CAHPS 5.0H Commercial Adult Survey (1113020)
Q74E. Please state to what extent you agree or disagree with each statement: I know how much I have to pay (co-pay) at the doctor’s office for a preventive care visit.
= HEALTH PLAN = = HEALTH CARE = === DOCTOR ==== = HEALTH PLAN RTNG = === CONTACT === = GOT INFO/HELP= == # DCTR/ === == CLAIMS === = RATING (Q42)= = RATING (Q13)= = RATING (Q23)= = BY GLOBAL PROP. == === CUSTOMER == == FROM CUST === === CLINIC === === (Q39) === ====== (Q42) ======= === SVC (Q34) = == SVC (Q35) === = VISITS (Q7)= Never/ Always/ Less 3 or Total 0-7 8-10 0-7 8-10 0-7 8-10 0-6 7-8 9-10 Yes No Sometime Usually than 3 More Yes No ------ ------- ------- ------- ------- ------- ------- ------ ------ ------ ------- ------- -------- ------- ------- ------ ------ ------ (A) (B) (C) (D) (E) (F) (G) (H) (I) (J) (K) (L) (M) (N) (O) (P) (Q) (R)
Total Eligible 18 8 10 5 12 5 13 6 3 9 12 6 3 9 3 14 10 6
Total Answering 18 8 10 5 12 5 13 6 3 9 12 6 3 9 3 14 10 6 100.0% 100.0% 100.0% 100.0% 100.0% 100.0% 100.0% 100.0% 100.0% 100.0% 100.0% 100.0% 100.0% 100.0% 100.0% 100.0% 100.0% 100.0%
No Answer - - - - - - - - - - - - - - - - - -
Strongly Agree 6 2 4 1 5 - 6 2 - 4 5 1 2 3 1 5 4 1 33.3% 25.0% 40.0% 20.0% 41.7% 46.2% 33.3% 44.4% 41.7% 16.7% 66.7% 33.3% 33.3% 35.7% 40.0% 16.7%
Agree 6 3 3 3 3 2 4 3 - 3 4 2 - 4 1 5 3 3 33.3% 37.5% 30.0% 60.0% 25.0% 40.0% 30.8% 50.0% 33.3% 33.3% 33.3% 44.4% 33.3% 35.7% 30.0% 50.0%
Neither Agree nor 4 1 3 - 3 2 2 - 2 2 2 2 - 2 1 2 2 1Disagree 22.2% 12.5% 30.0% 25.0% 40.0% 15.4% 66.7% 22.2% 16.7% 33.3% 22.2% 33.3% 14.3% 20.0% 16.7%
Disagree 2 2 - 1 1 1 1 1 1 - 1 1 1 - - 2 1 1 11.1% 25.0% 20.0% 8.3% 20.0% 7.7% 16.7% 33.3% 8.3% 16.7% 33.3% 14.3% 10.0% 16.7%
Strongly Disagree - - - - - - - - - - - - - - - - - -
Don't know - - - - - - - - - - - - - - - - - -
SPHA SUMMARY RATE - 12 5 7 4 8 2 10 5 - 7 9 3 2 7 2 10 7 4Strongly Agree/Agree 66.7% 62.5% 70.0% 80.0% 66.7% 40.0% 76.9% 83.3% 77.8% 75.0% 50.0% 66.7% 77.8% 66.7% 71.4% 70.0% 66.7%
Comparison Groups: BC/DE/FG/HIJ/KL/MN/OP/QRIndependent Z-Test for Percentages (unpooled proportions)Uppercase letters indicate significance at the 95% level.Lowercase letters indicate significance at the 90% level.Note: When comparing groups the Z-Test is only valid for large sample sizes (generally, n >=30) Presented by SPH Analytics 770-978-3173 2016

Page 43
UMP UW MEDICINE ACCOUNTABLE CARE NETWORK 2016 CAHPS 5.0H Commercial Adult Survey (1113020)
Q74F. Please state to what extent you agree or disagree with each statement: I know which services are subject to a deductible under my coverage plan.
= HEALTH PLAN = = HEALTH CARE = === DOCTOR ==== = HEALTH PLAN RTNG = === CONTACT === = GOT INFO/HELP= == # DCTR/ === == CLAIMS === = RATING (Q42)= = RATING (Q13)= = RATING (Q23)= = BY GLOBAL PROP. == === CUSTOMER == == FROM CUST === === CLINIC === === (Q39) === ====== (Q42) ======= === SVC (Q34) = == SVC (Q35) === = VISITS (Q7)= Never/ Always/ Less 3 or Total 0-7 8-10 0-7 8-10 0-7 8-10 0-6 7-8 9-10 Yes No Sometime Usually than 3 More Yes No ------ ------- ------- ------- ------- ------- ------- ------ ------ ------ ------- ------- -------- ------- ------- ------ ------ ------ (A) (B) (C) (D) (E) (F) (G) (H) (I) (J) (K) (L) (M) (N) (O) (P) (Q) (R)
Total Eligible 18 8 10 5 12 5 13 6 3 9 12 6 3 9 3 14 10 6
Total Answering 18 8 10 5 12 5 13 6 3 9 12 6 3 9 3 14 10 6 100.0% 100.0% 100.0% 100.0% 100.0% 100.0% 100.0% 100.0% 100.0% 100.0% 100.0% 100.0% 100.0% 100.0% 100.0% 100.0% 100.0% 100.0%
No Answer - - - - - - - - - - - - - - - - - -
Strongly Agree 3 1 2 1 2 - 3 1 - 2 3 - 1 2 - 3 2 - 16.7% 12.5% 20.0% 20.0% 16.7% 23.1% 16.7% 22.2% 25.0% 33.3% 22.2% 21.4% 20.0%
Agree 9 3 6 2 7 2 7 2 2 5 6 3 2 4 2 7 4 5 50.0% 37.5% 60.0% 40.0% 58.3% 40.0% 53.8% 33.3% 66.7% 55.6% 50.0% 50.0% 66.7% 44.4% 66.7% 50.0% 40.0% 83.3% Q
Neither Agree nor 3 1 2 - 3 1 2 1 - 2 2 1 - 2 1 2 1 1Disagree 16.7% 12.5% 20.0% 25.0% 20.0% 15.4% 16.7% 22.2% 16.7% 16.7% 22.2% 33.3% 14.3% 10.0% 16.7%
Disagree 3 3 - 2 - 2 1 2 1 - 1 2 - 1 - 2 3 - 16.7% 37.5% 40.0% 40.0% 7.7% 33.3% 33.3% 8.3% 33.3% 11.1% 14.3% 30.0%
Strongly Disagree - - - - - - - - - - - - - - - - - -
Don't know - - - - - - - - - - - - - - - - - -
SPHA SUMMARY RATE - 12 4 8 3 9 2 10 3 2 7 9 3 3 6 2 10 6 5Strongly Agree/Agree 66.7% 50.0% 80.0% 60.0% 75.0% 40.0% 76.9% 50.0% 66.7% 77.8% 75.0% 50.0% 100.0% 66.7% 66.7% 71.4% 60.0% 83.3% N
Comparison Groups: BC/DE/FG/HIJ/KL/MN/OP/QRIndependent Z-Test for Percentages (unpooled proportions)Uppercase letters indicate significance at the 95% level.Lowercase letters indicate significance at the 90% level.Note: When comparing groups the Z-Test is only valid for large sample sizes (generally, n >=30) Presented by SPH Analytics 770-978-3173 2016

Page 44
UMP UW MEDICINE ACCOUNTABLE CARE NETWORK 2016 CAHPS 5.0H Commercial Adult Survey (1113020)
Q74G. Please state to what extent you agree or disagree with each statement: I understand my right to appeal a claims or coverage decision.
= HEALTH PLAN = = HEALTH CARE = === DOCTOR ==== = HEALTH PLAN RTNG = === CONTACT === = GOT INFO/HELP= == # DCTR/ === == CLAIMS === = RATING (Q42)= = RATING (Q13)= = RATING (Q23)= = BY GLOBAL PROP. == === CUSTOMER == == FROM CUST === === CLINIC === === (Q39) === ====== (Q42) ======= === SVC (Q34) = == SVC (Q35) === = VISITS (Q7)= Never/ Always/ Less 3 or Total 0-7 8-10 0-7 8-10 0-7 8-10 0-6 7-8 9-10 Yes No Sometime Usually than 3 More Yes No ------ ------- ------- ------- ------- ------- ------- ------ ------ ------ ------- ------- -------- ------- ------- ------ ------ ------ (A) (B) (C) (D) (E) (F) (G) (H) (I) (J) (K) (L) (M) (N) (O) (P) (Q) (R)
Total Eligible 18 8 10 5 12 5 13 6 3 9 12 6 3 9 3 14 10 6
Total Answering 18 8 10 5 12 5 13 6 3 9 12 6 3 9 3 14 10 6 100.0% 100.0% 100.0% 100.0% 100.0% 100.0% 100.0% 100.0% 100.0% 100.0% 100.0% 100.0% 100.0% 100.0% 100.0% 100.0% 100.0% 100.0%
No Answer - - - - - - - - - - - - - - - - - -
Strongly Agree 2 - 2 - 2 - 2 - - 2 2 - 1 1 - 2 1 - 11.1% 20.0% 16.7% 15.4% 22.2% 16.7% 33.3% 11.1% 14.3% 10.0%
Agree 9 3 6 2 7 2 7 3 - 6 7 2 2 5 2 7 5 4 50.0% 37.5% 60.0% 40.0% 58.3% 40.0% 53.8% 50.0% 66.7% 58.3% 33.3% 66.7% 55.6% 66.7% 50.0% 50.0% 66.7%
Neither Agree nor 1 1 - 1 - - 1 1 - - - 1 - - - 1 1 -Disagree 5.6% 12.5% 20.0% 7.7% 16.7% 16.7% 7.1% 10.0%
Disagree 4 3 1 1 2 2 2 1 3 - 1 3 - 1 - 3 2 2 22.2% 37.5% 10.0% 20.0% 16.7% 40.0% 15.4% 16.7% 100.0% 8.3% 50.0% 11.1% 21.4% 20.0% 33.3% H k
Strongly Disagree 2 1 1 1 1 1 1 1 - 1 2 - - 2 1 1 1 - 11.1% 12.5% 10.0% 20.0% 8.3% 20.0% 7.7% 16.7% 11.1% 16.7% 22.2% 33.3% 7.1% 10.0%
Don't know - - - - - - - - - - - - - - - - - -
SPHA SUMMARY RATE - 11 3 8 2 9 2 9 3 - 8 9 2 3 6 2 9 6 4Strongly Agree/Agree 61.1% 37.5% 80.0% 40.0% 75.0% 40.0% 69.2% 50.0% 88.9% 75.0% 33.3% 100.0% 66.7% 66.7% 64.3% 60.0% 66.7% B h l N
Comparison Groups: BC/DE/FG/HIJ/KL/MN/OP/QRIndependent Z-Test for Percentages (unpooled proportions)Uppercase letters indicate significance at the 95% level.Lowercase letters indicate significance at the 90% level.Note: When comparing groups the Z-Test is only valid for large sample sizes (generally, n >=30) Presented by SPH Analytics 770-978-3173 2016
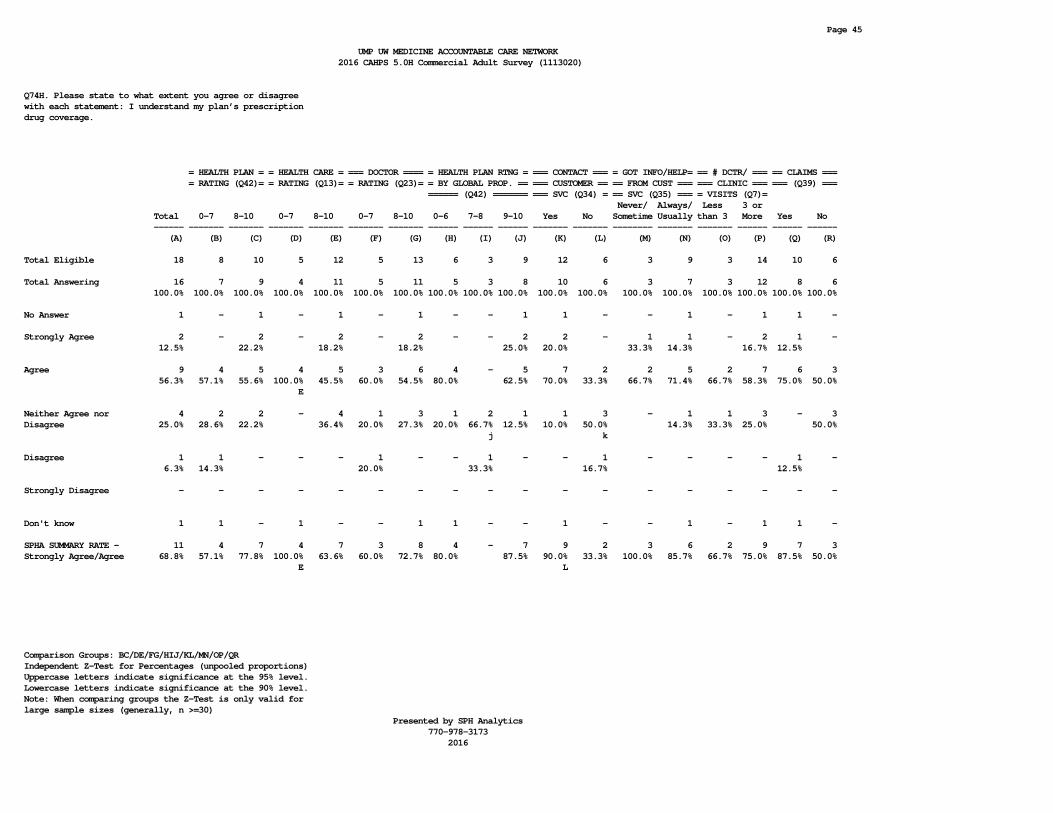
Page 45
UMP UW MEDICINE ACCOUNTABLE CARE NETWORK 2016 CAHPS 5.0H Commercial Adult Survey (1113020)
Q74H. Please state to what extent you agree or disagree with each statement: I understand my plan’s prescription drug coverage.
= HEALTH PLAN = = HEALTH CARE = === DOCTOR ==== = HEALTH PLAN RTNG = === CONTACT === = GOT INFO/HELP= == # DCTR/ === == CLAIMS === = RATING (Q42)= = RATING (Q13)= = RATING (Q23)= = BY GLOBAL PROP. == === CUSTOMER == == FROM CUST === === CLINIC === === (Q39) === ====== (Q42) ======= === SVC (Q34) = == SVC (Q35) === = VISITS (Q7)= Never/ Always/ Less 3 or Total 0-7 8-10 0-7 8-10 0-7 8-10 0-6 7-8 9-10 Yes No Sometime Usually than 3 More Yes No ------ ------- ------- ------- ------- ------- ------- ------ ------ ------ ------- ------- -------- ------- ------- ------ ------ ------ (A) (B) (C) (D) (E) (F) (G) (H) (I) (J) (K) (L) (M) (N) (O) (P) (Q) (R)
Total Eligible 18 8 10 5 12 5 13 6 3 9 12 6 3 9 3 14 10 6
Total Answering 16 7 9 4 11 5 11 5 3 8 10 6 3 7 3 12 8 6 100.0% 100.0% 100.0% 100.0% 100.0% 100.0% 100.0% 100.0% 100.0% 100.0% 100.0% 100.0% 100.0% 100.0% 100.0% 100.0% 100.0% 100.0%
No Answer 1 - 1 - 1 - 1 - - 1 1 - - 1 - 1 1 -
Strongly Agree 2 - 2 - 2 - 2 - - 2 2 - 1 1 - 2 1 - 12.5% 22.2% 18.2% 18.2% 25.0% 20.0% 33.3% 14.3% 16.7% 12.5%
Agree 9 4 5 4 5 3 6 4 - 5 7 2 2 5 2 7 6 3 56.3% 57.1% 55.6% 100.0% 45.5% 60.0% 54.5% 80.0% 62.5% 70.0% 33.3% 66.7% 71.4% 66.7% 58.3% 75.0% 50.0% E
Neither Agree nor 4 2 2 - 4 1 3 1 2 1 1 3 - 1 1 3 - 3Disagree 25.0% 28.6% 22.2% 36.4% 20.0% 27.3% 20.0% 66.7% 12.5% 10.0% 50.0% 14.3% 33.3% 25.0% 50.0% j k
Disagree 1 1 - - - 1 - - 1 - - 1 - - - - 1 - 6.3% 14.3% 20.0% 33.3% 16.7% 12.5%
Strongly Disagree - - - - - - - - - - - - - - - - - -
Don't know 1 1 - 1 - - 1 1 - - 1 - - 1 - 1 1 -
SPHA SUMMARY RATE - 11 4 7 4 7 3 8 4 - 7 9 2 3 6 2 9 7 3Strongly Agree/Agree 68.8% 57.1% 77.8% 100.0% 63.6% 60.0% 72.7% 80.0% 87.5% 90.0% 33.3% 100.0% 85.7% 66.7% 75.0% 87.5% 50.0% E L
Comparison Groups: BC/DE/FG/HIJ/KL/MN/OP/QRIndependent Z-Test for Percentages (unpooled proportions)Uppercase letters indicate significance at the 95% level.Lowercase letters indicate significance at the 90% level.Note: When comparing groups the Z-Test is only valid for large sample sizes (generally, n >=30) Presented by SPH Analytics 770-978-3173 2016

Page 46
UMP UW MEDICINE ACCOUNTABLE CARE NETWORK 2016 CAHPS 5.0H Commercial Adult Survey (1113020)
Q74I. Please state to what extent you agree or disagree with each statement: I understand my health care rights for privacy and confidentiality.
= HEALTH PLAN = = HEALTH CARE = === DOCTOR ==== = HEALTH PLAN RTNG = === CONTACT === = GOT INFO/HELP= == # DCTR/ === == CLAIMS === = RATING (Q42)= = RATING (Q13)= = RATING (Q23)= = BY GLOBAL PROP. == === CUSTOMER == == FROM CUST === === CLINIC === === (Q39) === ====== (Q42) ======= === SVC (Q34) = == SVC (Q35) === = VISITS (Q7)= Never/ Always/ Less 3 or Total 0-7 8-10 0-7 8-10 0-7 8-10 0-6 7-8 9-10 Yes No Sometime Usually than 3 More Yes No ------ ------- ------- ------- ------- ------- ------- ------ ------ ------ ------- ------- -------- ------- ------- ------ ------ ------ (A) (B) (C) (D) (E) (F) (G) (H) (I) (J) (K) (L) (M) (N) (O) (P) (Q) (R)
Total Eligible 18 8 10 5 12 5 13 6 3 9 12 6 3 9 3 14 10 6
Total Answering 17 8 9 5 11 5 12 6 3 8 11 6 3 8 3 13 9 6 100.0% 100.0% 100.0% 100.0% 100.0% 100.0% 100.0% 100.0% 100.0% 100.0% 100.0% 100.0% 100.0% 100.0% 100.0% 100.0% 100.0% 100.0%
No Answer 1 - 1 - 1 - 1 - - 1 1 - - 1 - 1 1 -
Strongly Agree 5 1 4 - 5 1 4 1 - 4 4 1 1 3 1 4 2 1 29.4% 12.5% 44.4% 45.5% 20.0% 33.3% 16.7% 50.0% 36.4% 16.7% 33.3% 37.5% 33.3% 30.8% 22.2% 16.7%
Agree 9 5 4 4 5 3 6 4 2 3 5 4 2 3 2 7 5 4 52.9% 62.5% 44.4% 80.0% 45.5% 60.0% 50.0% 66.7% 66.7% 37.5% 45.5% 66.7% 66.7% 37.5% 66.7% 53.8% 55.6% 66.7%
Neither Agree nor 2 1 1 - 1 1 1 - 1 1 1 1 - 1 - 1 1 1Disagree 11.8% 12.5% 11.1% 9.1% 20.0% 8.3% 33.3% 12.5% 9.1% 16.7% 12.5% 7.7% 11.1% 16.7%
Disagree - - - - - - - - - - - - - - - - - -
Strongly Disagree 1 1 - 1 - - 1 1 - - 1 - - 1 - 1 1 - 5.9% 12.5% 20.0% 8.3% 16.7% 9.1% 12.5% 7.7% 11.1%
Don't know - - - - - - - - - - - - - - - - - -
SPHA SUMMARY RATE - 14 6 8 4 10 4 10 5 2 7 9 5 3 6 3 11 7 5Strongly Agree/Agree 82.4% 75.0% 88.9% 80.0% 90.9% 80.0% 83.3% 83.3% 66.7% 87.5% 81.8% 83.3% 100.0% 75.0% 100.0% 84.6% 77.8% 83.3%
Comparison Groups: BC/DE/FG/HIJ/KL/MN/OP/QRIndependent Z-Test for Percentages (unpooled proportions)Uppercase letters indicate significance at the 95% level.Lowercase letters indicate significance at the 90% level.Note: When comparing groups the Z-Test is only valid for large sample sizes (generally, n >=30) Presented by SPH Analytics 770-978-3173 2016

Page 47
UMP UW MEDICINE ACCOUNTABLE CARE NETWORK 2016 CAHPS 5.0H Commercial Adult Survey (1113020)
LOYALTY
==SURVEY ADMINISTRATION= ========= MODE ========= Total Mail Phone Internet ------ ------- ------- --------
Total Eligible 175 175 - -
Total Valid Responses 175 175 - - 100.0% 100.0%
LOYALTY ZONE 77 77 - - 44.0% 44.0%
INDIFFERENT ZONE 93 93 - - 53.1% 53.1%
DEFECTION ZONE 5 5 - - 2.9% 2.9%
Presented by SPH Analytics 770-978-3173 2016

Page 48
UMP UW MEDICINE ACCOUNTABLE CARE NETWORK 2016 CAHPS 5.0H Commercial Adult Survey (1113020)
Q66. In the last 12 months, have you visited your health plan's website?
==SURVEY ADMINISTRATION= ========= MODE ========= Total Mail Phone Internet ------ ------- ------- -------- (A) (B) (C) (D)
Total Eligible 176 176 - -
Total Answering 173 173 - - 100.0% 100.0%
No Answer 2 2 - -
Yes 135 135 - - 78.0% 78.0%
No 38 38 - - 22.0% 22.0%
I don't use or have 1 1 - -convenient access to the Internet
SPHA SUMMARY RATE - Yes 135 135 - - 78.0% 78.0%
Comparison Groups: BCDIndependent Z-Test for Percentages (unpooled proportions)Uppercase letters indicate significance at the 95% level.Lowercase letters indicate significance at the 90% level.Note: When comparing groups the Z-Test is only valid for large sample sizes (generally, n >=30) Presented by SPH Analytics 770-978-3173 2016

Page 49
UMP UW MEDICINE ACCOUNTABLE CARE NETWORK 2016 CAHPS 5.0H Commercial Adult Survey (1113020)
Q67. How would you rate your understanding of the benefits your health plan offers?
==SURVEY ADMINISTRATION= ========= MODE ========= Total Mail Phone Internet ------ ------- ------- -------- (A) (B) (C) (D)
Total Eligible 176 176 - -
Total Answering 176 176 - - 100.0% 100.0%
No Answer - - - -
Excellent 17 17 - - 9.7% 9.7%
Very good 68 68 - - 38.6% 38.6%
Good 63 63 - - 35.8% 35.8%
Fair 21 21 - - 11.9% 11.9%
Poor 7 7 - - 4.0% 4.0%
SPHA SUMMARY RATE - 85 85 - -Excellent/Very good 48.3% 48.3%
Comparison Groups: BCDIndependent Z-Test for Percentages (unpooled proportions)Uppercase letters indicate significance at the 95% level.Lowercase letters indicate significance at the 90% level.Note: When comparing groups the Z-Test is only valid for large sample sizes (generally, n >=30) Presented by SPH Analytics 770-978-3173 2016

Page 50
UMP UW MEDICINE ACCOUNTABLE CARE NETWORK 2016 CAHPS 5.0H Commercial Adult Survey (1113020)
Q68. If you had a problem understanding the benefits your health plan offers, which type(s) of benefits were you unable to understand? (Mark all that apply.)
==SURVEY ADMINISTRATION= ========= MODE ========= Total Mail Phone Internet ------ ------- ------- --------
Total Eligible 176 176 - -
Total Valid Responses 211 211 - -
Total Respondents 100 100 - - 100.0% 100.0%
Copays, coinsurance, 62 62 - -deductibles 62.0% 62.0%
Pharmacy benefits and 35 35 - -the plan formulary 35.0% 35.0%
Inpatient 11 11 - -hospitalization 11.0% 11.0%
Emergency care 11 11 - - 11.0% 11.0%
In-network versus out-of- 40 40 - -network care 40.0% 40.0%
Lab and radiology 15 15 - - 15.0% 15.0%
Preventive care 18 18 - - 18.0% 18.0%
Other 19 19 - - 19.0% 19.0%
Presented by SPH Analytics 770-978-3173 2016

Page 51
UMP UW MEDICINE ACCOUNTABLE CARE NETWORK 2016 CAHPS 5.0H Commercial Adult Survey (1113020)
Q69. Would you recommend your health plan to your family or friends?
==SURVEY ADMINISTRATION= ========= MODE ========= Total Mail Phone Internet ------ ------- ------- -------- (A) (B) (C) (D)
Total Eligible 176 176 - -
Total Answering 176 176 - - 100.0% 100.0%
No Answer - - - -
Definitely yes 71 71 - - 40.3% 40.3%
Probably yes 89 89 - - 50.6% 50.6%
Probably no 11 11 - - 6.3% 6.3%
Definitely no 5 5 - - 2.8% 2.8%
SPHA SUMMARY RATE - 160 160 - -Definitely yes/Probably 90.9% 90.9% yes
Comparison Groups: BCDIndependent Z-Test for Percentages (unpooled proportions)Uppercase letters indicate significance at the 95% level.Lowercase letters indicate significance at the 90% level.Note: When comparing groups the Z-Test is only valid for large sample sizes (generally, n >=30) Presented by SPH Analytics 770-978-3173 2016

Page 52
UMP UW MEDICINE ACCOUNTABLE CARE NETWORK 2016 CAHPS 5.0H Commercial Adult Survey (1113020)
Q70. Do you intend to switch to a different health plan when you next have an opportunity?
==SURVEY ADMINISTRATION= ========= MODE ========= Total Mail Phone Internet ------ ------- ------- -------- (A) (B) (C) (D)
Total Eligible 176 176 - -
Total Answering 175 175 - - 100.0% 100.0%
No Answer 1 1 - -
Definitely no 67 67 - - 38.3% 38.3%
Probably no 83 83 - - 47.4% 47.4%
Probably yes 14 14 - - 8.0% 8.0%
Definitely yes 11 11 - - 6.3% 6.3%
SPHA SUMMARY RATE - 150 150 - -Definitely no/Probably 85.7% 85.7% no
Comparison Groups: BCDIndependent Z-Test for Percentages (unpooled proportions)Uppercase letters indicate significance at the 95% level.Lowercase letters indicate significance at the 90% level.Note: When comparing groups the Z-Test is only valid for large sample sizes (generally, n >=30) Presented by SPH Analytics 770-978-3173 2016

Page 53
UMP UW MEDICINE ACCOUNTABLE CARE NETWORK 2016 CAHPS 5.0H Commercial Adult Survey (1113020)
Q71. In the last 12 months, did you call or were you transferred by your health plan to Washington State Rx Services?
==SURVEY ADMINISTRATION= ========= MODE ========= Total Mail Phone Internet ------ ------- ------- -------- (A) (B) (C) (D)
Total Eligible 176 176 - -
Total Answering 174 174 - - 100.0% 100.0%
No Answer 2 2 - -
Yes 18 18 - - 10.3% 10.3%
No 156 156 - - 89.7% 89.7%
SPHA SUMMARY RATE - Yes 18 18 - - 10.3% 10.3%
Comparison Groups: BCDIndependent Z-Test for Percentages (unpooled proportions)Uppercase letters indicate significance at the 95% level.Lowercase letters indicate significance at the 90% level.Note: When comparing groups the Z-Test is only valid for large sample sizes (generally, n >=30) Presented by SPH Analytics 770-978-3173 2016

Page 54
UMP UW MEDICINE ACCOUNTABLE CARE NETWORK 2016 CAHPS 5.0H Commercial Adult Survey (1113020)
Q72. In the last 12 months, how often were you able to get the help you needed when you called Washington State Rx Services?
==SURVEY ADMINISTRATION= ========= MODE ========= Total Mail Phone Internet ------ ------- ------- -------- (A) (B) (C) (D)
Total Eligible 18 18 - -
Total Answering 18 18 - - 100.0% 100.0%
No Answer - - - -
Never 1 1 - - 5.6% 5.6%
Sometimes 1 1 - - 5.6% 5.6%
Usually 3 3 - - 16.7% 16.7%
Always 13 13 - - 72.2% 72.2%
SPHA SUMMARY RATE - 16 16 - -Always/Usually 88.9% 88.9%
Comparison Groups: BCDIndependent Z-Test for Percentages (unpooled proportions)Uppercase letters indicate significance at the 95% level.Lowercase letters indicate significance at the 90% level.Note: When comparing groups the Z-Test is only valid for large sample sizes (generally, n >=30) Presented by SPH Analytics 770-978-3173 2016

Page 55
UMP UW MEDICINE ACCOUNTABLE CARE NETWORK 2016 CAHPS 5.0H Commercial Adult Survey (1113020)
Q73A. Please state your level of agreement with the following: I liked the overall format and appearance of the written materials.
==SURVEY ADMINISTRATION= ========= MODE ========= Total Mail Phone Internet ------ ------- ------- -------- (A) (B) (C) (D)
Total Eligible 18 18 - -
Total Answering 16 16 - - 100.0% 100.0%
No Answer - - - -
Strongly Agree 2 2 - - 12.5% 12.5%
Agree 7 7 - - 43.8% 43.8%
Neither Agree nor 7 7 - -Disagree 43.8% 43.8%
Disagree - - - -
Strongly Disagree - - - -
Don't know 2 2 - -
SPHA SUMMARY RATE - 9 9 - -Strongly Agree/Agree 56.3% 56.3%
Comparison Groups: BCDIndependent Z-Test for Percentages (unpooled proportions)Uppercase letters indicate significance at the 95% level.Lowercase letters indicate significance at the 90% level.Note: When comparing groups the Z-Test is only valid for large sample sizes (generally, n >=30) Presented by SPH Analytics 770-978-3173 2016

Page 56
UMP UW MEDICINE ACCOUNTABLE CARE NETWORK 2016 CAHPS 5.0H Commercial Adult Survey (1113020)
Q73B. Please state your level of agreement with the following: The new member materials were easy to understand.
==SURVEY ADMINISTRATION= ========= MODE ========= Total Mail Phone Internet ------ ------- ------- -------- (A) (B) (C) (D)
Total Eligible 18 18 - -
Total Answering 17 17 - - 100.0% 100.0%
No Answer - - - -
Strongly Agree 2 2 - - 11.8% 11.8%
Agree 10 10 - - 58.8% 58.8%
Neither Agree nor 5 5 - -Disagree 29.4% 29.4%
Disagree - - - -
Strongly Disagree - - - -
Don't know 1 1 - -
SPHA SUMMARY RATE - 12 12 - -Strongly Agree/Agree 70.6% 70.6%
Comparison Groups: BCDIndependent Z-Test for Percentages (unpooled proportions)Uppercase letters indicate significance at the 95% level.Lowercase letters indicate significance at the 90% level.Note: When comparing groups the Z-Test is only valid for large sample sizes (generally, n >=30) Presented by SPH Analytics 770-978-3173 2016

Page 57
UMP UW MEDICINE ACCOUNTABLE CARE NETWORK 2016 CAHPS 5.0H Commercial Adult Survey (1113020)
Q73C. Please state your level of agreement with the following: The written materials helped me to understand the health plan’s policies and procedures.
==SURVEY ADMINISTRATION= ========= MODE ========= Total Mail Phone Internet ------ ------- ------- -------- (A) (B) (C) (D)
Total Eligible 18 18 - -
Total Answering 17 17 - - 100.0% 100.0%
No Answer - - - -
Strongly Agree 1 1 - - 5.9% 5.9%
Agree 10 10 - - 58.8% 58.8%
Neither Agree nor 6 6 - -Disagree 35.3% 35.3%
Disagree - - - -
Strongly Disagree - - - -
Don't know 1 1 - -
SPHA SUMMARY RATE - 11 11 - -Strongly Agree/Agree 64.7% 64.7%
Comparison Groups: BCDIndependent Z-Test for Percentages (unpooled proportions)Uppercase letters indicate significance at the 95% level.Lowercase letters indicate significance at the 90% level.Note: When comparing groups the Z-Test is only valid for large sample sizes (generally, n >=30) Presented by SPH Analytics 770-978-3173 2016

Page 58
UMP UW MEDICINE ACCOUNTABLE CARE NETWORK 2016 CAHPS 5.0H Commercial Adult Survey (1113020)
Q73D. Please state your level of agreement with the following: The new member written materials are an effective way to provide health benefit information.
==SURVEY ADMINISTRATION= ========= MODE ========= Total Mail Phone Internet ------ ------- ------- -------- (A) (B) (C) (D)
Total Eligible 18 18 - -
Total Answering 17 17 - - 100.0% 100.0%
No Answer - - - -
Strongly Agree 3 3 - - 17.6% 17.6%
Agree 9 9 - - 52.9% 52.9%
Neither Agree nor 4 4 - -Disagree 23.5% 23.5%
Disagree 1 1 - - 5.9% 5.9%
Strongly Disagree - - - -
Don't know 1 1 - -
SPHA SUMMARY RATE - 12 12 - -Strongly Agree/Agree 70.6% 70.6%
Comparison Groups: BCDIndependent Z-Test for Percentages (unpooled proportions)Uppercase letters indicate significance at the 95% level.Lowercase letters indicate significance at the 90% level.Note: When comparing groups the Z-Test is only valid for large sample sizes (generally, n >=30) Presented by SPH Analytics 770-978-3173 2016

Page 59
UMP UW MEDICINE ACCOUNTABLE CARE NETWORK 2016 CAHPS 5.0H Commercial Adult Survey (1113020)
Q73E. Please state your level of agreement with the following: The written materials helped me to understand my out-of-pocket expenses.
==SURVEY ADMINISTRATION= ========= MODE ========= Total Mail Phone Internet ------ ------- ------- -------- (A) (B) (C) (D)
Total Eligible 18 18 - -
Total Answering 17 17 - - 100.0% 100.0%
No Answer - - - -
Strongly Agree 2 2 - - 11.8% 11.8%
Agree 5 5 - - 29.4% 29.4%
Neither Agree nor 7 7 - -Disagree 41.2% 41.2%
Disagree 2 2 - - 11.8% 11.8%
Strongly Disagree 1 1 - - 5.9% 5.9%
Don't know 1 1 - -
SPHA SUMMARY RATE - 7 7 - -Strongly Agree/Agree 41.2% 41.2%
Comparison Groups: BCDIndependent Z-Test for Percentages (unpooled proportions)Uppercase letters indicate significance at the 95% level.Lowercase letters indicate significance at the 90% level.Note: When comparing groups the Z-Test is only valid for large sample sizes (generally, n >=30) Presented by SPH Analytics 770-978-3173 2016

Page 60
UMP UW MEDICINE ACCOUNTABLE CARE NETWORK 2016 CAHPS 5.0H Commercial Adult Survey (1113020)
Q73F. Please state your level of agreement with the following: The written materials I received from UMP Classic Plan accurately described the health care coverage I selected.
==SURVEY ADMINISTRATION= ========= MODE ========= Total Mail Phone Internet ------ ------- ------- -------- (A) (B) (C) (D)
Total Eligible 18 18 - -
Total Answering 17 17 - - 100.0% 100.0%
No Answer - - - -
Strongly Agree 2 2 - - 11.8% 11.8%
Agree 10 10 - - 58.8% 58.8%
Neither Agree nor 3 3 - -Disagree 17.6% 17.6%
Disagree 1 1 - - 5.9% 5.9%
Strongly Disagree 1 1 - - 5.9% 5.9%
Don't know 1 1 - -
SPHA SUMMARY RATE - 12 12 - -Strongly Agree/Agree 70.6% 70.6%
Comparison Groups: BCDIndependent Z-Test for Percentages (unpooled proportions)Uppercase letters indicate significance at the 95% level.Lowercase letters indicate significance at the 90% level.Note: When comparing groups the Z-Test is only valid for large sample sizes (generally, n >=30) Presented by SPH Analytics 770-978-3173 2016

Page 61
UMP UW MEDICINE ACCOUNTABLE CARE NETWORK 2016 CAHPS 5.0H Commercial Adult Survey (1113020)
Q74A. Please state to what extent you agree or disagree with each statement: I know how to choose or find a doctor in my plan’s network.
==SURVEY ADMINISTRATION= ========= MODE ========= Total Mail Phone Internet ------ ------- ------- -------- (A) (B) (C) (D)
Total Eligible 18 18 - -
Total Answering 18 18 - - 100.0% 100.0%
No Answer - - - -
Strongly Agree 9 9 - - 50.0% 50.0%
Agree 8 8 - - 44.4% 44.4%
Neither Agree nor - - - -Disagree
Disagree - - - -
Strongly Disagree 1 1 - - 5.6% 5.6%
Don't know - - - -
SPHA SUMMARY RATE - 17 17 - -Strongly Agree/Agree 94.4% 94.4%
Comparison Groups: BCDIndependent Z-Test for Percentages (unpooled proportions)Uppercase letters indicate significance at the 95% level.Lowercase letters indicate significance at the 90% level.Note: When comparing groups the Z-Test is only valid for large sample sizes (generally, n >=30) Presented by SPH Analytics 770-978-3173 2016

Page 62
UMP UW MEDICINE ACCOUNTABLE CARE NETWORK 2016 CAHPS 5.0H Commercial Adult Survey (1113020)
Q74B. Please state to what extent you agree or disagree with each statement: I know what to do when I or a family member needs urgent or emergency care.
==SURVEY ADMINISTRATION= ========= MODE ========= Total Mail Phone Internet ------ ------- ------- -------- (A) (B) (C) (D)
Total Eligible 18 18 - -
Total Answering 18 18 - - 100.0% 100.0%
No Answer - - - -
Strongly Agree 8 8 - - 44.4% 44.4%
Agree 5 5 - - 27.8% 27.8%
Neither Agree nor 3 3 - -Disagree 16.7% 16.7%
Disagree 2 2 - - 11.1% 11.1%
Strongly Disagree - - - -
Don't know - - - -
SPHA SUMMARY RATE - 13 13 - -Strongly Agree/Agree 72.2% 72.2%
Comparison Groups: BCDIndependent Z-Test for Percentages (unpooled proportions)Uppercase letters indicate significance at the 95% level.Lowercase letters indicate significance at the 90% level.Note: When comparing groups the Z-Test is only valid for large sample sizes (generally, n >=30) Presented by SPH Analytics 770-978-3173 2016

Page 63
UMP UW MEDICINE ACCOUNTABLE CARE NETWORK 2016 CAHPS 5.0H Commercial Adult Survey (1113020)
Q74C. Please state to what extent you agree or disagree with each statement: I understand what services are covered and not covered in my plan.
==SURVEY ADMINISTRATION= ========= MODE ========= Total Mail Phone Internet ------ ------- ------- -------- (A) (B) (C) (D)
Total Eligible 18 18 - -
Total Answering 18 18 - - 100.0% 100.0%
No Answer - - - -
Strongly Agree 3 3 - - 16.7% 16.7%
Agree 10 10 - - 55.6% 55.6%
Neither Agree nor 2 2 - -Disagree 11.1% 11.1%
Disagree 2 2 - - 11.1% 11.1%
Strongly Disagree 1 1 - - 5.6% 5.6%
Don't know - - - -
SPHA SUMMARY RATE - 13 13 - -Strongly Agree/Agree 72.2% 72.2%
Comparison Groups: BCDIndependent Z-Test for Percentages (unpooled proportions)Uppercase letters indicate significance at the 95% level.Lowercase letters indicate significance at the 90% level.Note: When comparing groups the Z-Test is only valid for large sample sizes (generally, n >=30) Presented by SPH Analytics 770-978-3173 2016

Page 64
UMP UW MEDICINE ACCOUNTABLE CARE NETWORK 2016 CAHPS 5.0H Commercial Adult Survey (1113020)
Q74D. Please state to what extent you agree or disagree with each statement: I understand when I need a referral to a specialist.
==SURVEY ADMINISTRATION= ========= MODE ========= Total Mail Phone Internet ------ ------- ------- -------- (A) (B) (C) (D)
Total Eligible 18 18 - -
Total Answering 18 18 - - 100.0% 100.0%
No Answer - - - -
Strongly Agree 4 4 - - 22.2% 22.2%
Agree 5 5 - - 27.8% 27.8%
Neither Agree nor 2 2 - -Disagree 11.1% 11.1%
Disagree 7 7 - - 38.9% 38.9%
Strongly Disagree - - - -
Don't know - - - -
SPHA SUMMARY RATE - 9 9 - -Strongly Agree/Agree 50.0% 50.0%
Comparison Groups: BCDIndependent Z-Test for Percentages (unpooled proportions)Uppercase letters indicate significance at the 95% level.Lowercase letters indicate significance at the 90% level.Note: When comparing groups the Z-Test is only valid for large sample sizes (generally, n >=30) Presented by SPH Analytics 770-978-3173 2016

Page 65
UMP UW MEDICINE ACCOUNTABLE CARE NETWORK 2016 CAHPS 5.0H Commercial Adult Survey (1113020)
Q74E. Please state to what extent you agree or disagree with each statement: I know how much I have to pay (co-pay) at the doctor’s office for a preventive care visit.
==SURVEY ADMINISTRATION= ========= MODE ========= Total Mail Phone Internet ------ ------- ------- -------- (A) (B) (C) (D)
Total Eligible 18 18 - -
Total Answering 18 18 - - 100.0% 100.0%
No Answer - - - -
Strongly Agree 6 6 - - 33.3% 33.3%
Agree 6 6 - - 33.3% 33.3%
Neither Agree nor 4 4 - -Disagree 22.2% 22.2%
Disagree 2 2 - - 11.1% 11.1%
Strongly Disagree - - - -
Don't know - - - -
SPHA SUMMARY RATE - 12 12 - -Strongly Agree/Agree 66.7% 66.7%
Comparison Groups: BCDIndependent Z-Test for Percentages (unpooled proportions)Uppercase letters indicate significance at the 95% level.Lowercase letters indicate significance at the 90% level.Note: When comparing groups the Z-Test is only valid for large sample sizes (generally, n >=30) Presented by SPH Analytics 770-978-3173 2016

Page 66
UMP UW MEDICINE ACCOUNTABLE CARE NETWORK 2016 CAHPS 5.0H Commercial Adult Survey (1113020)
Q74F. Please state to what extent you agree or disagree with each statement: I know which services are subject to a deductible under my coverage plan.
==SURVEY ADMINISTRATION= ========= MODE ========= Total Mail Phone Internet ------ ------- ------- -------- (A) (B) (C) (D)
Total Eligible 18 18 - -
Total Answering 18 18 - - 100.0% 100.0%
No Answer - - - -
Strongly Agree 3 3 - - 16.7% 16.7%
Agree 9 9 - - 50.0% 50.0%
Neither Agree nor 3 3 - -Disagree 16.7% 16.7%
Disagree 3 3 - - 16.7% 16.7%
Strongly Disagree - - - -
Don't know - - - -
SPHA SUMMARY RATE - 12 12 - -Strongly Agree/Agree 66.7% 66.7%
Comparison Groups: BCDIndependent Z-Test for Percentages (unpooled proportions)Uppercase letters indicate significance at the 95% level.Lowercase letters indicate significance at the 90% level.Note: When comparing groups the Z-Test is only valid for large sample sizes (generally, n >=30) Presented by SPH Analytics 770-978-3173 2016

Page 67
UMP UW MEDICINE ACCOUNTABLE CARE NETWORK 2016 CAHPS 5.0H Commercial Adult Survey (1113020)
Q74G. Please state to what extent you agree or disagree with each statement: I understand my right to appeal a claims or coverage decision.
==SURVEY ADMINISTRATION= ========= MODE ========= Total Mail Phone Internet ------ ------- ------- -------- (A) (B) (C) (D)
Total Eligible 18 18 - -
Total Answering 18 18 - - 100.0% 100.0%
No Answer - - - -
Strongly Agree 2 2 - - 11.1% 11.1%
Agree 9 9 - - 50.0% 50.0%
Neither Agree nor 1 1 - -Disagree 5.6% 5.6%
Disagree 4 4 - - 22.2% 22.2%
Strongly Disagree 2 2 - - 11.1% 11.1%
Don't know - - - -
SPHA SUMMARY RATE - 11 11 - -Strongly Agree/Agree 61.1% 61.1%
Comparison Groups: BCDIndependent Z-Test for Percentages (unpooled proportions)Uppercase letters indicate significance at the 95% level.Lowercase letters indicate significance at the 90% level.Note: When comparing groups the Z-Test is only valid for large sample sizes (generally, n >=30) Presented by SPH Analytics 770-978-3173 2016

Page 68
UMP UW MEDICINE ACCOUNTABLE CARE NETWORK 2016 CAHPS 5.0H Commercial Adult Survey (1113020)
Q74H. Please state to what extent you agree or disagree with each statement: I understand my plan’s prescription drug coverage.
==SURVEY ADMINISTRATION= ========= MODE ========= Total Mail Phone Internet ------ ------- ------- -------- (A) (B) (C) (D)
Total Eligible 18 18 - -
Total Answering 16 16 - - 100.0% 100.0%
No Answer 1 1 - -
Strongly Agree 2 2 - - 12.5% 12.5%
Agree 9 9 - - 56.3% 56.3%
Neither Agree nor 4 4 - -Disagree 25.0% 25.0%
Disagree 1 1 - - 6.3% 6.3%
Strongly Disagree - - - -
Don't know 1 1 - -
SPHA SUMMARY RATE - 11 11 - -Strongly Agree/Agree 68.8% 68.8%
Comparison Groups: BCDIndependent Z-Test for Percentages (unpooled proportions)Uppercase letters indicate significance at the 95% level.Lowercase letters indicate significance at the 90% level.Note: When comparing groups the Z-Test is only valid for large sample sizes (generally, n >=30) Presented by SPH Analytics 770-978-3173 2016

Page 69
UMP UW MEDICINE ACCOUNTABLE CARE NETWORK 2016 CAHPS 5.0H Commercial Adult Survey (1113020)
Q74I. Please state to what extent you agree or disagree with each statement: I understand my health care rights for privacy and confidentiality.
==SURVEY ADMINISTRATION= ========= MODE ========= Total Mail Phone Internet ------ ------- ------- -------- (A) (B) (C) (D)
Total Eligible 18 18 - -
Total Answering 17 17 - - 100.0% 100.0%
No Answer 1 1 - -
Strongly Agree 5 5 - - 29.4% 29.4%
Agree 9 9 - - 52.9% 52.9%
Neither Agree nor 2 2 - -Disagree 11.8% 11.8%
Disagree - - - -
Strongly Disagree 1 1 - - 5.9% 5.9%
Don't know - - - -
SPHA SUMMARY RATE - 14 14 - -Strongly Agree/Agree 82.4% 82.4%
Comparison Groups: BCDIndependent Z-Test for Percentages (unpooled proportions)Uppercase letters indicate significance at the 95% level.Lowercase letters indicate significance at the 90% level.Note: When comparing groups the Z-Test is only valid for large sample sizes (generally, n >=30) Presented by SPH Analytics 770-978-3173 2016

2016 Final Report for UMP UW MEDICINE ACCOUNTABLE CARE NETWORK Consumer Assessment of Healthcare Providers and Systems (CAHPS®) Survey
SPH Analytics Commercial Adult Survey – 2016 11-1
11. Glossary of Terms Accreditation is an official authorization or designation to an organization determined by a set of industry-derived standards.
Attributes are the questions that relate to a specific service area or composite as defined by NCQA.
Augments are stratified samples used to target specific responses in a particular segment, such as region, language, or member status. These responses are for internal use only, and are not to be included in the HEDIS® sample or reported to public entities.
Composites are the means of the Summary Rates of attributes within a given service area as specified by NCQA. Each composite category represents an overall aspect of plan quality and is comprised of similar questions.
Confidence level is the degree of confidence, expressed as a percentage, that a reported number’s true value is between the lower and upper specified range.
Correlation Coefficient is a statistical measure of how closely two variables or measures are related to each other. Coefficients are usually reported as r values.
Disposition (Disposition Category) is the final status assignment given to a member record within the sample. The category signifies both the survey administration protocol used to complete the survey (M=Mail, T=Phone, and I=Internet, if applicable) and the status of the record (for example, M10=mail complete, T22=phone, language barrier). All record code assignments of “10” are considered valid responses according to NCQA.
Global Proportions are a breakout of response option results according to the Three-Point Score definition, shown as a percentage, not a mean score. Refer to the Three-Point Score definition.
Key Drivers are composites that have been found to impact overall health plan, health care, or personal doctor ratings among the plan members as determined by a regression analysis.
NCQA 1 – 100 Benchmark is a percentile benchmark (with values ranging from the first through the one hundredth percentile) calculated by NCQA and derived from commercial PPO adult data collected by NCQA in 2016. SPH Analytics utilizes this benchmark to calculate plan-specific approximate percentile rankings in relation to the Quality Compass® All Plans benchmark. In keeping, rankings are reflective of how your plan’s Summary Rates fall relative to the NCQA 1-100 Benchmark.
NCQA HEDIS® Compliance Audit is a two-part program comprised of an information-systems capabilities assessment (IS standards) and an evaluation of the health plan’s ability to comply with HEDIS® specifications (HD standards). NCQA-Certified auditors use standard audit methodologies to enable purchasers to make reliable comparisons among health plans.
Over-sampling is sampling more than the minimum required sample size. The required sample size for adult commercial plans is 1,100 in accordance with NCQA protocol. The overall NCQA target number of complete responses is 411. Therefore, plans may choose to over-sample their population to achieve this target number if necessary. NCQA allows over-sampling of up to 30% of the database to aid plans in collecting a suitable amount of survey returns.

2016 Final Report for UMP UW MEDICINE ACCOUNTABLE CARE NETWORK Consumer Assessment of Healthcare Providers and Systems (CAHPS®) Survey
SPH Analytics Commercial Adult Survey – 2016 11-2
Public Report 2016 (PPO) is derived from NCQA’s Quality Compass® benchmark and is calculated by SPH Analytics. The benchmark is a collection of CAHPS® 5.0H mean summary ratings for those commercial adult plans (152 PPO samples) choosing to report their scores publicly, in addition to submitting their scores to be compiled anonymously into a Quality Compass® aggregate, or national summary. The scores shown in this report reflect the mean Summary Rates from these plans.
Quality Compass® 2016 (All Plans – PPO) is a collection of CAHPS® 5.0H mean summary ratings for those commercial adult plans (211 PPO samples with at least 100 valid responses per question item) allowing NCQA to use their data to be compiled into an aggregate, or national summary, without releasing their plan-level scores.
Rating questions use a scale of 0 to 10 for assessing overall experience (doctor, specialist, health care, and health plan) with zero being the worst and ten being the best.
SPH Analytics Book of Business (calculated on a plan-level) consist of all commercial adult samples (PPO) that conducted surveys with SPH Analytics and submitted data to NCQA. In 2016, there were 29 samples included in the Book of Business. This benchmark is shown throughout the report.
Significance test is a test to determine if an observed difference is too large to have occurred by chance alone.
Summary Rates are single statistics generated for a survey question. In general, Summary Rates represent the percentage of respondents who chose the most favorable response options (“Always” and “Usually;” “Yes;” or “8” to “10”). Not all questions are assigned a Summary Rate by NCQA.
Three-Point Score is the result of the process of assigning a value of 1, 2, or 3 to each question response category and then computing a numerical average based upon the valid responses for each question. The Three-Point values are assigned to question answer categories as follows:
Response Choice 1
Score Value
Response Choice
2 Score Value
Response Choice 3
Score Value
Never 1 No 1 0 – 6 1
Sometimes 1 Yes 3 7 & 8 2
Usually 2 9 & 10 3
Always 3
Trending is the practice of looking at several years of data in a comparative format to identify trends or common links.
Please refer to the Technical Notes for additional information about topics not displayed in this section.

2016 Final Report for UMP UW MEDICINE ACCOUNTABLE CARE NETWORK Consumer Assessment of Healthcare Providers and Systems (CAHPS®) Survey
SPH Analytics Commercial Adult Survey – 2016 12-1
12. Appendix A – Question Summaries The proportion of respondents that fall into each response category for all questions is shown beginning on Page A.1. Benchmark data and trend information are also presented where available. Not all questions are included in composite calculations. Therefore, the codes found in the following table are used to indicate which attributes are included in the corresponding composite calculations. These codes can be found under their respective question numbers in the charts beginning on Page A.1.
Code Composites/Measures
GNC Getting Needed Care GCQ Getting Care Quickly
HWDC How Well Doctors Communicate CS Customer Service CP Claims Processing
SDM Shared Decision Making PIOC Plan Information on Costs HPE Health Promotion and Education CC Coordination of Care PNI Providing Needed Information FOF Ease of Filling Out Forms
Charts A.1 – A.15

Question Summaries UMP UW MEDICINE ACCOUNTABLE CARE NETWORK
Urgent and Routine Care Commercial Adult CAHPS® Simulation
176 Total Respondents
SPH Analytics Book of
Business*
Public Report*
2016 2015 2016 20162016 to
20152016 to SPHA
2016 toPR
Yes No
42.3% 57.7%
4 Never Sometimes Usually Always
GCQ 2.8% 8.3% 26.4% 62.5%
Yes No
89.7% 10.3%
6 Never Sometimes Usually Always
GCQ 3.4% 16.8% 30.9% 49.0%
None 1 time 2 3 4 5 to 910 or more
times
5.7% 13.8% 23.0% 17.8% 10.9% 21.8% 6.9%
Q# Survey Item Valid
n
Plan'sSummary RateCategory Responses
(Summary Rate responses in grey)
Significance Testing**
3In the last 12 months, did you have an illness, injury, or condition that needed care right away in a clinic, emergency room, or doctor’s office?
175
7
5
In the last 12 months, when you needed care right away, how often did you get care as soon as you needed? (If "Yes" in Q3)
72
In the last 12 months, how often did you get an appointment for a check-up or routine care at a doctor’s office or clinic as soon as you needed? (If "Yes" in Q5)
149
In the last 12 months, did you make any appointments for a check-up or routine care at a doctor’s office or clinic?
174
In the last 12 months, not counting the times you went to an emergency room, how many times did you go to a doctor’s office or clinic to get health care for yourself?
174
38.8% NA Not sig.Not sig.
88.9%
79.9%
Above
Not sig.
Not sig.
NA
89.7%
42.3% 38.3%
88.8%
NA
Not sig.88.3%
NA
NA
NA Not sig.
NA
AboveNA81.1%
83.5% 82.9%
82.0%
Note: Select Summary Rates are defined by NCQA in its HEDIS 2016 CAHPS® 5.0H guidelines and generally represent the most favorable response percentage(s). Other Summary Rates were selected by SPHAnalytics to facilitate comparisons.
** Significance Testing - "Sig. decrease"/"Below" denotes the results that were found when hypothesis tests were conducted to determine if the percentage is lower. "Sig. increase"/"Above" denotes the results thatwere found when hypothesis tests were conducted to determine if the percentage is higher. "Not sig." denotes that there was insufficient support to conclude that there was a significant difference in percentages."Unable to Test" denotes that there was insufficient sample size to conduct the statistical test. All significance testing is performed at the 95% significance level.
* The 2016 SPH Analytics (SPHA) Book of Business consists of 29 commercial adult, PPO samples that conducted surveys with SPH Analytics in 2016 and submitted data to NCQA. The 2016 Public Reportbenchmark is derived from NCQA's Quality Compass® benchmark and is calculated by SPH Analytics. The Public Report benchmark is the mean of 152 PPO, plan-specific samples that submitted to NCQA in 2016.
94.3% NA AboveNA84.7% 85.3% Above
SPH Analytics Commercial Adult Survey—2016 A.1
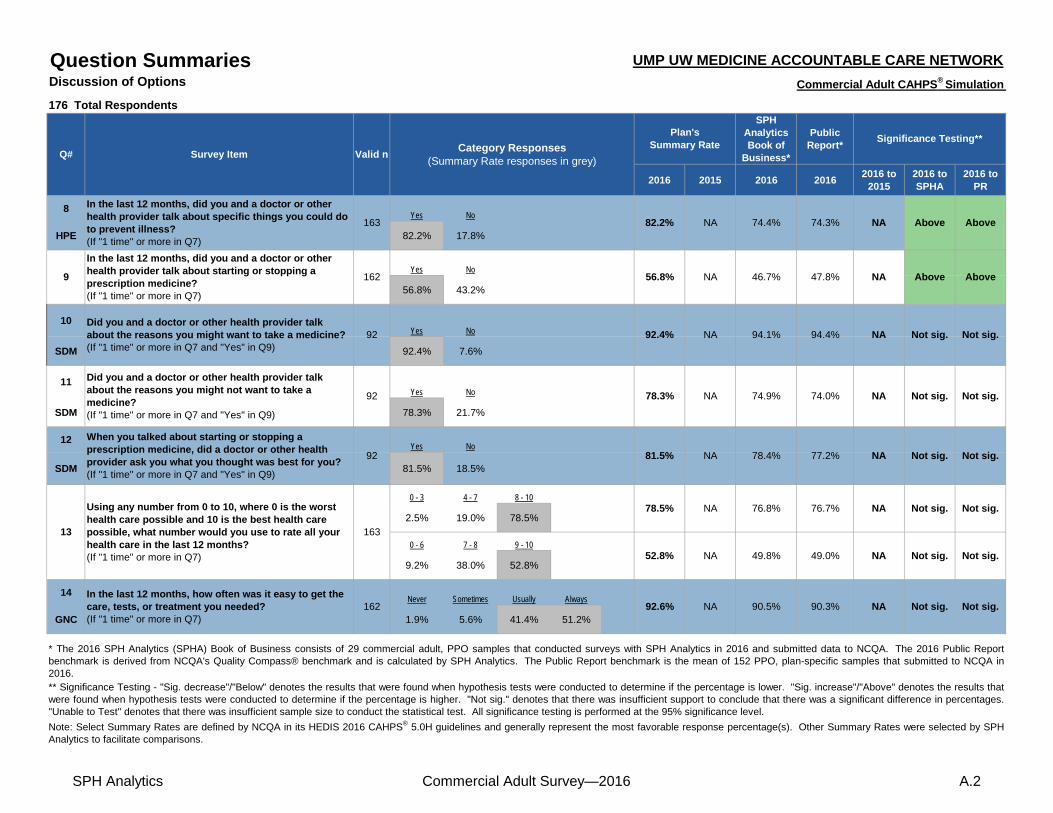
Question Summaries UMP UW MEDICINE ACCOUNTABLE CARE NETWORK
Discussion of Options Commercial Adult CAHPS® Simulation
176 Total RespondentsSPH
Analytics Book of
Business*
Public Report*
2016 2015 2016 20162016 to
20152016 to SPHA
2016 toPR
8Yes No
HPE 82.2% 17.8%
Yes No
56.8% 43.2%
10Yes No
SDM 92.4% 7.6%
11Yes No
SDM 78.3% 21.7%
12Yes No
SDM 81.5% 18.5%
0 - 3 4 - 7 8 - 10
2.5% 19.0% 78.5%
0 - 6 7 - 8 9 - 10
9.2% 38.0% 52.8%
14Never Sometimes Usually Always
GNC 1.9% 5.6% 41.4% 51.2%
Above
Significance Testing**
74.3%
NA
NA82.2%
Category Responses (Summary Rate responses in grey)
In the last 12 months, did you and a doctor or other health provider talk about specific things you could do to prevent illness? (If "1 time" or more in Q7)
163
NA
Plan'sSummary Rate
NA
94.1%92.4% NA
56.8%
92
Q#
1629
92Did you and a doctor or other health provider talk about the reasons you might want to take a medicine? (If "1 time" or more in Q7 and "Yes" in Q9)
In the last 12 months, did you and a doctor or other health provider talk about starting or stopping a prescription medicine? (If "1 time" or more in Q7)
Survey Item Valid n
74.9%
Above
Above
Not sig.
Not sig.
94.4%
Above
NA Not sig.
46.7% 47.8%
NA74.4%
74.0%
Note: Select Summary Rates are defined by NCQA in its HEDIS 2016 CAHPS® 5.0H guidelines and generally represent the most favorable response percentage(s). Other Summary Rates were selected by SPHAnalytics to facilitate comparisons.
* The 2016 SPH Analytics (SPHA) Book of Business consists of 29 commercial adult, PPO samples that conducted surveys with SPH Analytics in 2016 and submitted data to NCQA. The 2016 Public Reportbenchmark is derived from NCQA's Quality Compass® benchmark and is calculated by SPH Analytics. The Public Report benchmark is the mean of 152 PPO, plan-specific samples that submitted to NCQA in2016.
Not sig.78.3% NA
76.8% Not sig.
** Significance Testing - "Sig. decrease"/"Below" denotes the results that were found when hypothesis tests were conducted to determine if the percentage is lower. "Sig. increase"/"Above" denotes the results thatwere found when hypothesis tests were conducted to determine if the percentage is higher. "Not sig." denotes that there was insufficient support to conclude that there was a significant difference in percentages."Unable to Test" denotes that there was insufficient sample size to conduct the statistical test. All significance testing is performed at the 95% significance level.
76.7% NANA Not sig.
Did you and a doctor or other health provider talk about the reasons you might not want to take a medicine? (If "1 time" or more in Q7 and "Yes" in Q9)
78.5%
52.8% NA
13
Using any number from 0 to 10, where 0 is the worst health care possible and 10 is the best health care possible, what number would you use to rate all your health care in the last 12 months? (If "1 time" or more in Q7)
163
49.8% 49.0% NA Not sig. Not sig.
When you talked about starting or stopping a prescription medicine, did a doctor or other health provider ask you what you thought was best for you?(If "1 time" or more in Q7 and "Yes" in Q9)
92 81.5% NA 78.4% 77.2% NA Not sig. Not sig.
In the last 12 months, how often was it easy to get the care, tests, or treatment you needed?(If "1 time" or more in Q7)
162 92.6% NA 90.5% 90.3% NA Not sig. Not sig.
SPH Analytics Commercial Adult Survey—2016 A.2

Question Summaries UMP UW MEDICINE ACCOUNTABLE CARE NETWORK
Your Personal Doctor Commercial Adult CAHPS® Simulation
176 Total Respondents
SPH Analytics Book of
Business*
Public Report*
2016 2015 2016 20162016 to
20152016 to SPHA
2016 toPR
Yes No
93.2% 6.8%
None 1 time 2 3 4 5 to 910 or more
times
8.6% 35.6% 28.2% 10.4% 8.6% 8.0% 0.6%
17Never Sometimes Usually Always
HWDC 1.3% 2.7% 18.1% 77.9%
18Never Sometimes Usually Always
HWDC 1.3% 4.7% 17.4% 76.5%
19Never Sometimes Usually Always
HWDC 0.7% 2.7% 14.1% 82.6%
20Never Sometimes Usually Always
HWDC 2.0% 6.0% 21.5% 70.5%
Not sig.
Unable to Test
Above
Significance Testing**
Above15
NA
A personal doctor is the one you would see if you need a check-up, want advice about a health problem, or get sick or hurt. Do you have a personal doctor?
93.2% NA176
16
86.6%
86.9%
84.9% NA
Note: Select Summary Rates are defined by NCQA in its HEDIS 2016 CAHPS® 5.0H guidelines and generally represent the most favorable response percentage(s). Other Summary Rates were selected by SPHAnalytics to facilitate comparisons.
* The 2016 SPH Analytics (SPHA) Book of Business consists of 29 commercial adult, PPO samples that conducted surveys with SPH Analytics in 2016 and submitted data to NCQA. The 2016 Public Reportbenchmark is derived from NCQA's Quality Compass® benchmark and is calculated by SPH Analytics. The Public Report benchmark is the mean of 152 PPO, plan-specific samples that submitted to NCQA in2016.
In the last 12 months, how many times did you visit your personal doctor to get care for yourself? (If "Yes" in Q15)
** Significance Testing - "Sig. decrease"/"Below" denotes the results that were found when hypothesis tests were conducted to determine if the percentage is lower. "Sig. increase"/"Above" denotes the results thatwere found when hypothesis tests were conducted to determine if the percentage is higher. "Not sig." denotes that there was insufficient support to conclude that there was a significant difference in percentages."Unable to Test" denotes that there was insufficient sample size to conduct the statistical test. All significance testing is performed at the 95% significance level.
Not sig.163
Not sig. Not sig.
Unable to Test
NA
In the last 12 months, how often did your personal doctor spend enough time with you? (If "Yes" in Q15 and "1 time" or more in Q16)
NA 87.9%
NA
Not sig.NA
Not sig.NA Not sig.
Not sig.
Q# Survey ItemValid
nCategory Responses
(Summary Rate responses in grey)
91.9%
Plan'sSummary Rate
91.4%
96.0%
94.0%
149
149
In the last 12 months, how often did your personal doctor explain things in a way that was easy to understand? (If "Yes" in Q15 and "1 time" or more in Q16)
In the last 12 months, how often did your personal doctor listen carefully to you? (If "Yes" in Q15 and "1 time" or more in Q16)
149
96.8%
95.4%
96.7%
95.5%
NA
NA
In the last 12 months, how often did your personal doctor show respect for what you had to say? (If "Yes" in Q15 and "1 time" or more in Q16)
93.5%149
96.6% NA 96.4%96.5%
93.9%NA
SPH Analytics Commercial Adult Survey—2016 A.3

Question Summaries UMP UW MEDICINE ACCOUNTABLE CARE NETWORK
Care Coordination Commercial Adult CAHPS® Simulation
176 Total RespondentsSPH
Analytics Book of
Business*
Public Report*
2016 2015 2016 20162016 to
20152016 to SPHA
2016 toPR
Yes No
71.8% 28.2%
22
Never Sometimes Usually Always
CC 7.6% 7.6% 34.3% 50.5%
0 - 3 4 - 7 8 - 10
1.2% 9.9% 88.9%
0 - 6 7 - 8 9 - 10
6.2% 23.5% 70.4%
Q#
21
NA
NA
Category Responses (Summary Rate responses in grey)
Significance Testing**Plan's
Summary Rate
105
In the last 12 months, how often did your personal doctor seem informed and up-to-date about the care you got from these doctors or other health providers?(If "Yes" in Q15, "1 time" or more in Q16, and "Yes" in Q21)
Survey Item
67.1%
In the last 12 months, did you get care from a doctor or other health provider besides your personal doctor? (If "Yes" in Q15 and "1 time" or more in Q16)
NA149
Valid n
71.8% Not sig.
Not sig. Not sig.
Not sig.
Note: Select Summary Rates are defined by NCQA in its HEDIS 2016 CAHPS® 5.0H guidelines and generally represent the most favorable response percentage(s). Other Summary Rates were selected by SPHAnalytics to facilitate comparisons.
* The 2016 SPH Analytics (SPHA) Book of Business consists of 29 commercial adult, PPO samples that conducted surveys with SPH Analytics in 2016 and submitted data to NCQA. The 2016 Public Reportbenchmark is derived from NCQA's Quality Compass® benchmark and is calculated by SPH Analytics. The Public Report benchmark is the mean of 152 PPO, plan-specific samples that submitted to NCQA in2016.
84.8% NA
88.9% 84.6%
** Significance Testing - "Sig. decrease"/"Below" denotes the results that were found when hypothesis tests were conducted to determine if the percentage is lower. "Sig. increase"/"Above" denotes the results thatwere found when hypothesis tests were conducted to determine if the percentage is higher. "Not sig." denotes that there was insufficient support to conclude that there was a significant difference in percentages."Unable to Test" denotes that there was insufficient sample size to conduct the statistical test. All significance testing is performed at the 95% significance level.
Not sig.NA
80.3%
Not sig.
80.8%
NA 84.1%
23
Not sig.
Using any number from 0 to 10, where 0 is the worst personal doctor possible and 10 is the best personal doctor possible, what number would you use to rate your personal doctor? (If "Yes" in Q15)
162
70.4% NA 65.9% NA Not sig.
67.3%
65.6%
SPH Analytics Commercial Adult Survey—2016 A.4

Question Summaries UMP UW MEDICINE ACCOUNTABLE CARE NETWORK
Access to Specialist Commercial Adult CAHPS® Simulation
176 Total RespondentsSPH
Analytics Book of
Business*
Public Report*
2016 2015 2016 20162016 to
20152016 to SPHA
2016 toPR
Yes No
65.7% 34.3%
25Never Sometimes Usually Always
GNC 3.5% 17.5% 34.2% 44.7%
None 1 specialist 2 3 45 or more specialists
0.0% 51.8% 32.5% 9.6% 5.3% 0.9%
0 - 3 4 - 7 8 - 10
2.6% 13.2% 84.2%
0 - 6 7 - 8 9 - 10
7.0% 29.8% 63.2%
56.7%
85.6%
AboveAbove
Below Not sig.
Significance Testing**
Note: Select Summary Rates are defined by NCQA in its HEDIS 2016 CAHPS® 5.0H guidelines and generally represent the most favorable response percentage(s). Other Summary Rates were selected bySPH Analytics to facilitate comparisons.
* The 2016 SPH Analytics (SPHA) Book of Business consists of 29 commercial adult, PPO samples that conducted surveys with SPH Analytics in 2016 and submitted data to NCQA. The 2016 Public Reportbenchmark is derived from NCQA's Quality Compass® benchmark and is calculated by SPH Analytics. The Public Report benchmark is the mean of 152 PPO, plan-specific samples that submitted to NCQA in2016.
** Significance Testing - "Sig. decrease"/"Below" denotes the results that were found when hypothesis tests were conducted to determine if the percentage is lower. "Sig. increase"/"Above" denotes the resultsthat were found when hypothesis tests were conducted to determine if the percentage is higher. "Not sig." denotes that there was insufficient support to conclude that there was a significant difference inpercentages. "Unable to Test" denotes that there was insufficient sample size to conduct the statistical test. All significance testing is performed at the 95% significance level.
83.2% NA83.5% Not sig. Not sig.84.2%
63.2% NA Not sig. Not sig.
27
We want to know your rating of the specialist you saw most often in the last 12 months. Using any number from 0 to 10, where 0 is the worst specialist possible and 10 is the best specialist possible, what number would you use to rate that specialist? (If "Yes" in Q24 and "1 specialist" or more in Q26)
114
Specialists are doctors like surgeons, heart doctors, allergy doctors, skin doctors, and other doctors who specialize in one area of health care. In the last 12 months, did you make any appointments to see a specialist?
In the last 12 months, how often did you get an appointment to see a specialist as soon as you needed? (If "Yes" in Q24)
NA
26
24 175
114 78.9%
How many specialists have you seen in the last 12 months? (If "Yes" in Q24)
100.0%114
65.7%
NA
Q# Survey Item Valid nCategory Responses
(Summary Rate responses in grey)
Plan'sSummary Rate
NA 65.5% 65.1%
98.5%NA
NA
Unable to Test
NA57.1%
84.9%
NA
NA
99.1%Unable to
Test
SPH Analytics Commercial Adult Survey—2016 A.5

Question Summaries UMP UW MEDICINE ACCOUNTABLE CARE NETWORK
Written Materials Commercial Adult CAHPS® Simulation
176 Total RespondentsSPH
Analytics Book of
Business*
Public Report*
2016 2015 2016 20162016 to
20152016 to SPHA
2016 toPR
Yes No
71.4% 28.6%
29 Never Sometimes Usually Always
PNI 3.2% 25.8% 43.5% 27.4%
Above
Significance Testing**
AboveNA
Q# Survey Item Valid n
31.4%
Plan'sSummary RateCategory Responses
(Summary Rate responses in grey)
28In the last 12 months, did you look for any information in written materials or on the Internet about how your health plan works?
175 71.4% NA 36.0%
** Significance Testing - "Sig. decrease"/"Below" denotes the results that were found when hypothesis tests were conducted to determine if the percentage is lower. "Sig. increase"/"Above" denotes theresults that were found when hypothesis tests were conducted to determine if the percentage is higher. "Not sig." denotes that there was insufficient support to conclude that there was a significantdifference in percentages. "Unable to Test" denotes that there was insufficient sample size to conduct the statistical test. All significance testing is performed at the 95% significance level.
Note: Select Summary Rates are defined by NCQA in its HEDIS 2016 CAHPS® 5.0H guidelines and generally represent the most favorable response percentage(s). Other Summary Rates were selectedby SPH Analytics to facilitate comparisons.
In the last 12 months, how often did the written materials or the Internet provide the information you needed about how your health plan works?(If "Yes" in Q28)
124 71.0% NA 65.9% NA Not sig.
* The 2016 SPH Analytics (SPHA) Book of Business consists of 29 commercial adult, PPO samples that conducted surveys with SPH Analytics in 2016 and submitted data to NCQA. The 2016 PublicReport benchmark is derived from NCQA's Quality Compass® benchmark and is calculated by SPH Analytics. The Public Report benchmark is the mean of 152 PPO, plan-specific samples that submittedto NCQA in 2016.
62.7% Not sig.
SPH Analytics Commercial Adult Survey—2016 A.6

Question Summaries UMP UW MEDICINE ACCOUNTABLE CARE NETWORK
Special Equipment/Prescriptions Commercial Adult CAHPS® Simulation
176 Total Respondents
SPH Analytics Book of
Business*
Public Report*
2016 2015 2016 20162016 to
20152016 to SPHA
2016 toPR
Yes No
38.6% 61.4%
31 Never Sometimes Usually Always
PIOC 10.3% 26.5% 36.8% 26.5%
31 2016 Valid n2016 -
Always/ Usually
2015 Valid n2015 -
Always/ Usually
PIOC 68 63.2% NA NA
Yes No
26.7% 73.3%
33 Never Sometimes Usually Always
PIOC 12.8% 21.3% 29.8% 36.2%
33 2016 Valid n2016 -
Always/ Usually
2015 Valid n2015 -
Always/ Usually
PIOC 47 66.0% NA NA
58.9%
Above
Significance Testing**
Not sig.
NA
NA
Above
Not sig.
176 NA38.6%
32 176 NA
In some health plans, the amount you pay for a prescription medicine can be different for different medicines, or can be different for prescriptions filled by mail instead of at the pharmacy. In the last 12 months, did you look for information from your health plan on how much you would have to pay for specific prescription medicines?
63.2%
NA
In the last 12 months, how often were you able to find out from your health plan how much you would have to pay for specific prescription medicines? (If "Yes" in Q32)
Not sig.
Rolling Average*** (2-year rolling average) 68
17.1%
NA 58.2%
NA Above21.0%
Not sig.47
66.0% NANA 58.2%
*** For the rolling average methodology, a score can be obtained one of two ways: (1) If at least 100 responses were achieved by combining 2015 scores and 2016 scores, the rolling average score is the average of the2015 and 2016 scores. (2) If there were no scores for 2015 but there were at least 100 responses for 2016, the rolling average is the 2016 score. If the combined responses for 2015 and 2016 do not achieve at least100 responses, then the measure will receive an "NA" by NCQA.
Not sig.Rolling Average*** (2-year rolling average) 47
Note: Select Summary Rates are defined by NCQA in its HEDIS 2016 CAHPS® 5.0H guidelines and generally represent the most favorable response percentage(s). Other Summary Rates were selected by SPHAnalytics to facilitate comparisons.
** Significance Testing - "Sig. decrease"/"Below" denotes the results that were found when hypothesis tests were conducted to determine if the percentage is lower. "Sig. increase"/"Above" denotes the results that werefound when hypothesis tests were conducted to determine if the percentage is higher. "Not sig." denotes that there was insufficient support to conclude that there was a significant difference in percentages. "Unable toTest" denotes that there was insufficient sample size to conduct the statistical test. All significance testing is performed at the 95% significance level.
* The 2016 SPH Analytics (SPHA) Book of Business consists of 29 commercial adult, PPO samples that conducted surveys with SPH Analytics in 2016 and submitted data to NCQA. The 2016 Public Reportbenchmark is derived from NCQA's Quality Compass® benchmark and is calculated by SPH Analytics. The Public Report benchmark is the mean of 152 PPO, plan-specific samples that submitted to NCQA in 2016.
62.4%
57.5%
NA Not sig.
Q# Survey Item Valid nCategory Responses
(Summary Rate responses in grey)
30
Sometimes people need services or equipment beyond what is provided in a regular or routine office visit, such as care from a specialist, physical therapy, a hearing aid, or oxygen. In the last 12 months, did you look for information from your health plan on how much you would have to pay for a health care service or equipment?
In the last 12 months, how often were you able to find out from your health plan how much you would have to pay for a health care service or equipment? (If "Yes" in Q30)
68 63.2%
Plan'sSummary Rate
16.2% 18.0%
Not sig.66.0%
Not sig.
Not sig.
58.9%57.5%
NA
NA
26.7%
62.4%
SPH Analytics Commercial Adult Survey—2016 A.7

Question Summaries UMP UW MEDICINE ACCOUNTABLE CARE NETWORK
Customer Service Commercial Adult CAHPS® Simulation
176 Total RespondentsSPH
Analytics Book of
Business*
Public Report*
2016 2015 2016 20162016 to
20152016 to SPHA
2016 toPR
Yes No
37.7% 62.3%
35Never Sometimes Usually Always
CS 3.0% 13.6% 27.3% 56.1%
36Never Sometimes Usually Always
CS 1.5% 4.6% 12.3% 81.5%
Yes No
25.7% 74.3%
38Never Sometimes Usually Always***
FOF 0.0% 5.7% 10.3% 84.0%
94.3%
37.7%
37 175
175
In the last 12 months, did you get information or help from your health plan’s customer service?
In the last 12 months, how often did your health plan’s customer service give you the information or help you needed? (If "Yes" in Q34)
65
34
Not sig.Not sig.
Not sig.
Unable to Test
Not sig.
Significance Testing**
Above
Not sig.NA
NAUnable to
Test
NA
NA
Note: Select Summary Rates are defined by NCQA in its HEDIS 2016 CAHPS® 5.0H guidelines and generally represent the most favorable response percentage(s). Other Summary Rates were selected bySPH Analytics to facilitate comparisons.
* The 2016 SPH Analytics (SPHA) Book of Business consists of 29 commercial adult, PPO samples that conducted surveys with SPH Analytics in 2016 and submitted data to NCQA. The 2016 Public Reportbenchmark is derived from NCQA's Quality Compass® benchmark and is calculated by SPH Analytics. The Public Report benchmark is the mean of 152 PPO, plan-specific samples that submitted to NCQAin 2016.
Not sig.
25.7% NAIn the last 12 months, did your health plan give you any forms to fill out?
NA NA
NA
Not sig.
*** Members who responded "No" to Q37 are included in "Always" of Q38, per NCQA, Volume 3, HEDIS 2016 guidelines.
95.4%
** Significance Testing - "Sig. decrease"/"Below" denotes the results that were found when hypothesis tests were conducted to determine if the percentage is lower. "Sig. increase"/"Above" denotes the resultsthat were found when hypothesis tests were conducted to determine if the percentage is higher. "Not sig." denotes that there was insufficient support to conclude that there was a significant difference inpercentages. "Unable to Test" denotes that there was insufficient sample size to conduct the statistical test. All significance testing is performed at the 95% significance level.
In the last 12 months, how often were the forms from your health plan easy to fill out?
95.1%
In the last 12 months, how often did your health plan’s customer service staff treat you with courtesy and respect? (If "Yes" in Q34)
28.7%
23.9% 23.1%
94.5% 94.5%
80.9%
31.0%
78.9%
Q# Survey Item
93.8%
Valid n
Plan'sSummary Rate
NA
Category Responses (Summary Rate responses in grey)
83.3%
NA175
66
SPH Analytics Commercial Adult Survey—2016 A.8

Question Summaries UMP UW MEDICINE ACCOUNTABLE CARE NETWORK
Claims Processing Commercial Adult CAHPS® Simulation
176 Total RespondentsSPH
Analytics Book of
Business*
Public Report*
2016 2015 2016 20162016 to
20152016 to SPHA
2016 toPR
Yes No
71.5% 28.5%
40Never Sometimes Usually Always
CP 2.3% 8.0% 43.2% 46.6%
41Never Sometimes Usually Always
CP 0.0% 4.4% 28.9% 66.7%
89.9%
Above
Not sig.
Not sig.
86.3%
Not sig.89.7% NA
86.0%
Significance Testing**
AboveNA
NA
Q#
61.9%60.2%
Claims are sent to a health plan for payment. You may send in the claims yourself, or doctors, hospitals, or others may do this for you. In the last 12 months, did you or anyone else send in any claims for your care to your health plan?
Plan'sSummary Rate
Survey Item Valid nCategory Responses
(Summary Rate responses in grey)
151
Not sig.
95.6% NA
39
88In the last 12 months, how often did your health plan handle your claims quickly? (If "Yes" in Q39)
NA89.8%
71.5% NA
Note: Select Summary Rates are defined by NCQA in its HEDIS 2016 CAHPS® 5.0H guidelines and generally represent the most favorable response percentage(s). Other Summary Rates were selected bySPH Analytics to facilitate comparisons.
* The 2016 SPH Analytics (SPHA) Book of Business consists of 29 commercial adult, PPO samples that conducted surveys with SPH Analytics in 2016 and submitted data to NCQA. The 2016 PublicReport benchmark is derived from NCQA's Quality Compass® benchmark and is calculated by SPH Analytics. The Public Report benchmark is the mean of 152 PPO, plan-specific samples that submittedto NCQA in 2016.
** Significance Testing - "Sig. decrease"/"Below" denotes the results that were found when hypothesis tests were conducted to determine if the percentage is lower. "Sig. increase"/"Above" denotes theresults that were found when hypothesis tests were conducted to determine if the percentage is higher. "Not sig." denotes that there was insufficient support to conclude that there was a significantdifference in percentages. "Unable to Test" denotes that there was insufficient sample size to conduct the statistical test. All significance testing is performed at the 95% significance level.
In the last 12 months, how often did your health plan handle your claims correctly? (If "Yes" in Q39)
90
SPH Analytics Commercial Adult Survey—2016 A.9

Question Summaries UMP UW MEDICINE ACCOUNTABLE CARE NETWORK
Health Plan Rating, Health Status, and Flu Vaccination Commercial Adult CAHPS® Simulation
176 Total Respondents
SPH Analytics Book of
Business*
Public Report*
2016 2015 2016 20162016 to
20152016 to SPHA
2016 toPR
0 - 3 4 - 7 8 - 10
3.4% 28.4% 68.2%
0 - 6 7 - 8 9 - 10
18.8% 37.5% 43.8%
Excellent Very good Good Fair Poor
23.9% 36.9% 31.3% 6.8% 1.1%
Excellent Very good Good Fair Poor
30.5% 43.7% 20.1% 4.6% 1.1%
Yes No
79.3% 20.7%
SPH Analytics Book of
Business*
Public Report*
2016 2015 2016 20162016 to
20152016 to SPHA
2016 toPR
Yes No
79.5% 20.5%
HEDIS MeasureValid
nCategory Responses
(Summary Rate responses in grey)
Plan'sSummary Rate
Significance Testing**
Above
Not sig.
60.8%
Plan'sSummary Rate
NANA
60.1%
61.1%
Above
Not sig.
Significance Testing**
NA
61.5%
Valid n
In general, how would you rate your overall health?
17643
42
Using any number from 0 to 10, where 0 is the worst health plan possible and 10 is the best health plan possible, what number would you use to rate your health plan?
176
Category Responses (Summary Rate responses in grey)
60.8%
Note: Select Summary Rates are defined by NCQA in its HEDIS 2016 CAHPS® 5.0H guidelines and generally represent the most favorable response percentage(s). Other Summary Rates were selected bySPH Analytics to facilitate comparisons.
* The 2016 SPH Analytics (SPHA) Book of Business consists of 29 commercial adult, PPO samples that conducted surveys with SPH Analytics in 2016 and submitted data to NCQA. The 2016 Public Reportbenchmark is derived from NCQA's Quality Compass® benchmark and is calculated by SPH Analytics. The Public Report benchmark is the mean of 152 PPO, plan-specific samples that submitted to NCQAin 2016.
174Have you had either a flu shot or flu spray in the nose since July 1, 2015? (All respondents)
NA Above48.0%
** Significance Testing - "Sig. decrease"/"Below" denotes the results that were found when hypothesis tests were conducted to determine if the percentage is lower. "Sig. increase"/"Above" denotes theresults that were found when hypothesis tests were conducted to determine if the percentage is higher. "Not sig." denotes that there was insufficient support to conclude that there was a significant differencein percentages. "Unable to Test" denotes that there was insufficient sample size to conduct the statistical test. All significance testing is performed at the 95% significance level.
NA45
Q# Survey Item
Above
Above
68.2% NA
43.8% NA 35.1% NA Above
48.5%79.3%
36.3%
75.4% 74.6% NA Not sig. Not sig.44In general, how would you rate your overall mental or emotional health?
174 74.1% NA
45
Have you had either a flu shot or flu spray in the nose since July 1, 2015? (Respondents 18–64 years as of July 1 of the measurement year)
161 79.5% NA NA46.3% NA NA Above
SPH Analytics Commercial Adult Survey—2016 A.10

Question Summaries UMP UW MEDICINE ACCOUNTABLE CARE NETWORK
Medical Assistance With Smoking and Tobacco Use Cessation Commercial Adult CAHPS® Simulation
176 Total Respondents
SPH Analytics Book of
Business*
2016 2015 2016 20162016 to
20152016 to SPHA
2016 toPR
Every day Some days Not at all Don't know
2.3% 0.0% 95.4% 2.3%
Never Sometimes Usually Always
50.0% 25.0% 0.0% 25.0%
Never Sometimes Usually Always
25.0% 50.0% 0.0% 25.0%
Never Sometimes Usually Always
75.0% 25.0% 0.0% 0.0%
Note: Select Summary Rates are defined by NCQA in its HEDIS 2016 CAHPS® 5.0H guidelines and generally represent the most favorable response percentage(s). Other Summary Rates were selected bySPH Analytics to facilitate comparisons.
In the last 12 months, how often did your doctor or health provider discuss or provide methods and strategies other than medication to assist you with quitting smoking or using tobacco? Examples of methods and strategies are: telephone helpline, individual or group counseling, or cessation program. (If "Every day" or "Some days" in Q46)
39.3% NA49 39.5%NAUnable to
TestUnable to
Test
* The 2016 SPH Analytics (SPHA) Book of Business consists of 29 commercial adult, PPO samples that conducted surveys with SPH Analytics in 2016 and submitted data to NCQA. The 2016 Public Reportbenchmark is derived from NCQA's Quality Compass® benchmark and is calculated by SPH Analytics. The Public Report benchmark is the mean of 152 PPO, plan-specific samples that submitted to NCQA in2016.
** Significance Testing - "Sig. decrease"/"Below" denotes the results that were found when hypothesis tests were conducted to determine if the percentage is lower. "Sig. increase"/"Above" denotes the resultsthat were found when hypothesis tests were conducted to determine if the percentage is higher. "Not sig." denotes that there was insufficient support to conclude that there was a significant difference inpercentages. "Unable to Test" denotes that there was insufficient sample size to conduct the statistical test. All significance testing is performed at the 95% significance level.
71.3%
44.9%
4
Unable to Test
72.1%
44.4%NA75.0%
Unable to Test
25.0%
NA50.0%
In the last 12 months, how often were you advised to quit smoking or using tobacco by a doctor or other health provider in your plan? (If "Every day" or "Some days" in Q46)
48
In the last 12 months, how often was medication recommended or discussed by a doctor or health provider to assist you with quitting smoking or using tobacco? Examples of medication are: nicotine gum, patch, nasal spray, inhaler, or prescription medication.(If "Every day" or "Some days" in Q46)
47
4
4
Significance Testing**
Unable to Test
Unable to Test
NA
BelowBelow
NA
NA
Public Report*
11.0%
Category Responses (Summary Rate responses in grey)
2.3% NA
NOT Rolling Averages
Plan'sSummary Rate
11.9%
Valid n
46Do you now smoke cigarettes or use tobacco every day, some days, or not at all? (% of Current Smokers and Tobacco Users)
175
Q# Survey Item
SPH Analytics Commercial Adult Survey—2016 A.11

Question Summaries UMP UW MEDICINE ACCOUNTABLE CARE NETWORK
Aspirin Use and Discussion Commercial Adult CAHPS® Simulation
176 Total Respondents
SPH Analytics Book of
Business*
2016 2015 2016 20162016 to
20152016 to SPHA
2016 toPR
Yes No
17.6% 82.4%
Yes No
4.3% 95.7%
Yes No
29.0% 71.0%
High cholesterol
High blood pressure
Parent or sibling with heart attack before the age
of 60
46.3% 52.4% 34.1%
A heart attackAngina or
coronary heart disease
A stroke
Any kind of diabetes or high blood
sugar
0.0% 9.5% 19.0% 76.2%
Plan'sSummary Rate
NOT Rolling Averages
Q# Survey ItemValid
nCategory Responses
(Summary Rate responses in grey)
21.8% 22.2% NA Not sig. Not sig.50Do you take aspirin daily or every other day? (All respondents)
176 17.6% NA
Not sig. Not sig.
Public Report*
Significance Testing**
NA NA Below NA
Do you have a health problem or take medication that makes taking aspirin unsafe for you?
163 95.7%
Has a doctor or health provider ever discussed with you the risks and benefits of aspirin to prevent heart attack or stroke? (All respondents)
176 29.0% NA 36.1%
NA 94.3% 94.2% NA
NA NA NA NA
53Are you aware that you have any of the following conditions? (Mark one or more.)
82 NA NA
NA
* The 2016 SPH Analytics (SPHA) Book of Business consists of 29 commercial adult, PPO samples that conducted surveys with SPH Analytics in 2016 and submitted data to NCQA. The 2016 PublicReport benchmark is derived from NCQA's Quality Compass® benchmark and is calculated by SPH Analytics. The Public Report benchmark is the mean of 152 PPO, plan-specific samples thatsubmitted to NCQA in 2016. ** Significance Testing - "Sig. decrease"/"Below" denotes the results that were found when hypothesis tests were conducted to determine if the percentage is lower. "Sig. increase"/"Above" denotes theresults that were found when hypothesis tests were conducted to determine if the percentage is higher. "Not sig." denotes that there was insufficient support to conclude that there was a significantdifference in percentages. "Unable to Test" denotes that there was insufficient sample size to conduct the statistical test. All significance testing is performed at the 95% significance level.
Note: Select Summary Rates are defined by NCQA in its HEDIS 2016 CAHPS® 5.0H guidelines and generally represent the most favorable response percentage(s). Other Summary Rates were selectedby SPH Analytics to facilitate comparisons.
51
52
NA
54Has a doctor ever told you that you have any of the following conditions? (Mark one or more.)
21
NA NA NA NA
NA NA
SPH Analytics Commercial Adult Survey—2016 A.12

Effectiveness of Care Measures UMP UW MEDICINE ACCOUNTABLE CARE NETWORK
Rolling Average Methodology*Commercial Adult CAHPS® Simulation
176 Total Respondents
2016 2015 2016 20162016 to
20152016 to SPHA
2016 toPR
2016 Valid n2016 - Always/
Usually/ Sometimes
2015 Valid n2015 - Always/
Usually/ Sometimes
4 50.0% NA NA
2016 Valid n2016 - Always/
Usually/ Sometimes
2015 Valid n2015 - Always/
Usually/ Sometimes
4 75.0% NA NA
2016 Valid n2016 - Always/
Usually/ Sometimes
2015 Valid n2015 - Always/
Usually/ Sometimes
4 25.0% NA NA
2016 Valid n 2016 - Yes 2015 Valid n 2015 - Yes
23 43.5% NA NA
2016 Valid n 2016 - Yes 2015 Valid n 2015 - Yes
79 41.8% NA NA
All Summary Rates ARE Rolling Averages
44.9%
39.5%
Public Report**
Advising Smokers and Tobacco Users to Quit (Two-year rolling average of Q47)
NA
HEDIS Measure Valid nCategory Responses
(Summary Rate responses in grey)Plan's
Summary Rate
4
SPH Analytics Book of
Business**
71.3%Unable to
Test72.1%50.0% NA
Unable to Test
Significance Testing***
Note: Select Summary Rates are defined by NCQA in its HEDIS 2016 CAHPS® 5.0H guidelines and generally represent the most favorable response percentage(s). Other Summary Rates were selected by SPH Analytics tofacilitate comparisons.
Unable to Test
44.4%75.0%Discussing Cessation Medications (Two-year rolling average of Q48)
NA NAUnable to
Test4
4
NA NA Not sig.
38.0% NA NA
**** Members eligible for inclusion in the Aspirin Use measure are as follows: 1) Women 55-79 years of age with at least two risk factors for cardiovascular disease, 2) Men 45-64 years of age with at least one risk factor forcardiovascular disease, and 3) Men 65-79 years of age, regardless of risk factors.
***** Members eligible for inclusion in the Discussing Aspirin Risks and Benefits measure are as follows: 1) Women 55-79 years of age, and 2) Men 45-79 years of age.
NA
Not sig. NA
Discussing Aspirin Risks and Benefits (Two-year rolling average)*****
79 41.8% NA 44.7%
** The 2016 SPH Analytics (SPHA) Book of Business consists of 29 commercial adult, PPO samples that conducted surveys with SPH Analytics in 2016 and submitted data to NCQA. The 2016 Public Report benchmark isderived from NCQA's Quality Compass® benchmark and is calculated by SPH Analytics. The Public Report benchmark is the mean of 152 PPO, plan-specific samples that submitted to NCQA in 2016.
*** Significance Testing - "Sig. decrease"/"Below" denotes the results that were found when hypothesis tests were conducted to determine if the percentage is lower. "Sig. increase"/"Above" denotes the results that were foundwhen hypothesis tests were conducted to determine if the percentage is higher. "Not sig." denotes that there was insufficient support to conclude that there was a significant difference in percentages. "Unable to Test" denotesthat there was insufficient sample size to conduct the statistical test. All significance testing is performed at the 95% significance level.
NA
* For the rolling average methodology, a score can be obtained one of two ways: (1) If at least 100 responses were achieved by combining 2015 scores and 2016 scores, the rolling average score is the average of the 2015 and2016 scores. (2) If there were no scores for 2015, but there were at least 100 responses for 2016, the rolling average is the 2016 score. If the combined responses for 2015 and 2016 do not achieve at least 100 responses,then the measure will receive an "NA" by NCQA.
Aspirin Use (Two-year rolling average)****
23 43.5%
Unable to Test
25.0%Unable to
TestNA 39.3% NA
Discussing Cessation Strategies (Two-year rolling average of Q49)
SPH Analytics Commercial Adult Survey—2016 A.13

Question Summaries UMP UW MEDICINE ACCOUNTABLE CARE NETWORK
Chronic Conditions Commercial Adult CAHPS® Simulation
176 Total RespondentsSPH
Analytics Book of
Business*
Public Report*
2016 2015 2016 20162016 to
20152016 to SPHA
2016 toPR
Yes No
34.1% 65.9%
Yes No
87.9% 12.1%
Yes No
63.6% 36.4%
Yes No
93.6% 6.4%
Not sig.
Is this medicine to treat a condition that has lasted for at least 3 months? Do not include pregnancy or menopause. (If "Yes" in Q57)
110
176 NA26.7%
Not sig.NA
NA
59.1%
87.9%
In the last 12 months, did you get health care 3 or more times for the same condition or problem?
85.3%
59.0%
Above
Not sig.
Not sig.
Not sig.NA84.8%
Not sig.
Significance Testing**
Above26.1%
Q#
57
Is this a condition or problem that has lasted for at least 3 months? Do not include pregnancy or menopause. (If "Yes" in Q55)
58
Note: Select Summary Rates are defined by NCQA in its HEDIS 2016 CAHPS® 5.0H guidelines and generally represent the most favorable response percentage(s). Other Summary Rates were selected bySPH Analytics to facilitate comparisons.
* The 2016 SPH Analytics (SPHA) Book of Business consists of 29 commercial adult, PPO samples that conducted surveys with SPH Analytics in 2016 and submitted data to NCQA. The 2016 Public Reportbenchmark is derived from NCQA's Quality Compass® benchmark and is calculated by SPH Analytics. The Public Report benchmark is the mean of 152 PPO, plan-specific samples that submitted to NCQAin 2016.
173Do you now need or take medicine prescribed by a doctor? Do not include birth control.
NA
** Significance Testing - "Sig. decrease"/"Below" denotes the results that were found when hypothesis tests were conducted to determine if the percentage is lower. "Sig. increase"/"Above" denotes theresults that were found when hypothesis tests were conducted to determine if the percentage is higher. "Not sig." denotes that there was insufficient support to conclude that there was a significant differencein percentages. "Unable to Test" denotes that there was insufficient sample size to conduct the statistical test. All significance testing is performed at the 95% significance level.
56
55
93.6%
63.6%
58 94.5%94.3%
NA
NA
Survey Item Valid nCategory Responses
(Summary Rate responses in grey)
34.1%
Plan'sSummary Rate
NA
SPH Analytics Commercial Adult Survey—2016 A.14

Question Summaries UMP UW MEDICINE ACCOUNTABLE CARE NETWORK
Demographics/Completing this Survey Commercial Adult CAHPS® Simulation
176 Total Respondents
Q# Survey Item Valid n
18 - 24 25 - 34 35 - 44 45 - 54 55 - 64 65 - 74 75 or older
1.1% 13.7% 16.6% 19.4% 37.7% 10.9% 0.6%
Male Female
34.1% 65.9%
8th grade or lessSome high school,
but did not graduate
High school graduate/GED
Some college or 2-year degree
4-year college graduate
More than 4-year college degree
0.6% 0.6% 2.9% 22.9% 31.4% 41.7%
Yes, Hispanic or Latino
No, not Hispanic or Latino
5.3% 94.7%
WhiteBlack or African-
AmericanAsian
Native Hawaiian or other Pacific
Islander
American Indian or Alaska Native
Other
80.1% 3.5% 15.8% 0.6% 3.5% 2.9%
Yes No
2.3% 97.7%
Read the questions to me
Wrote down the answers I gave
Answered the questions for me
Translated the questions into my
language
Helped in some other way
25.0% 25.0% 50.0% 0.0% 25.0%
What is the highest grade or level of school that you have completed?
62
171
Did someone help you complete this survey?
169
What is your race? (Mark one or more.)
Are you of Hispanic or Latino origin or descent?
Note: The base for Q63 and Q65 is the total number of respondents. Members were allowed to choose more than one option; therefore, the sum of all figures may equal more than 100%.
60
59
Category Responses
What is your age? 175
Are you male or female? 176
63
17561
65How did that person help you? (Mark one or more.)(If Mail survey and "Yes" in Q64)
4
64 175
SPH Analytics Commercial Adult Survey—2016 A.15

2016 Final Report for UMP UW MEDICINE ACCOUNTABLE CARE NETWORK Consumer Assessment of Healthcare Providers and Systems (CAHPS®) Survey
SPH Analytics Commercial Adult Survey – 2016 13-1
13. Appendix B - Custom Questions Your plan’s custom questions are shown beginning on Page B.1. All custom questions are shown in this section, regardless of their placement on the survey tool. Your plan’s Summary Rate for the current year is shown alongside the Summary Rate for the identical question from the previous year (where applicable). ENTER The Summary Rates shown represent the percentage of respondents who answered in a positive way. Not all questions are designed for the assignment of Summary Rates, such as “Mark all that apply” questions. In this case, an “NA” is shown in the Summary Rate column. ENTER To the right of the Summary Rate column is a column for the SPH Analytics Book of Business Custom Question Benchmark (2015) and a column for the corresponding correlation coefficient. A correlation analysis was run using the SPH Analytics Custom Question Book of Business (2015) against Q42 (Rating of Health Plan). ENTER Please note that the benchmark for custom questions is the 2015 SPHA Commercial Adult PPO Book of Business. The 2016 SPHA Commercial Adult PPO Book of Business is used throughout the remaining sections of this report. ENTER Please note that not every custom question has a benchmark for comparison. ENTER ENTER Charts B.1 – B.5

Question Summaries UMP UW MEDICINE ACCOUNTABLE CARE NETWORK
Custom Questions Commercial Adult CAHPS® Simulation
176 Total Respondents
2016 2015Summary
RateCorrelation
with Q422016 to 2015
2016 to SPHA BoB
Yes No
I don't use or have convenient
access to the Internet
78.0% 22.0% n = 1
Excellent Very good Good Fair Poor
9.7% 38.6% 35.8% 11.9% 4.0%
Copays, coinsurance, deductibles
Pharmacy benefits and the plan formulary
Inpatient hospitalization
Emergency careIn-network
versus Out-of-network care
Lab and radiology
Preventive care
Other
62.0% 35.0% 11.0% 11.0% 40.0% 15.0% 18.0% 19.0%
Definitely yes Probably yes Probably no Definitely no
40.3% 50.6% 6.3% 2.8%
Definitely no Probably no Probably yes Definitely yes
38.3% 47.4% 8.0% 6.3%
Significance Testing**
66In the last 12 months, have you visited your health plan's website?
173 78.0% NA 39.9%
Q# Survey Item Valid nCategory Responses
(Summary Rate responses in grey)
Plan's Summary Rate
SPHA Book of Business -2015*
NA NA Above
67How would you rate your understanding of the benefits your health plan offers?
176 48.3% NA NA NA NA NA
NA NA68
If you had a problem understanding the benefits your health plan offers, which type(s) of benefits were you unable to understand? (Mark all that apply.)
100 NA NA
90.9% NA
NA NA
91.3%
* The 2015 SPH Analytics Book of Business consists of the results of 17 commercial adult samples surveyed by SPH Analytics in 2015 that submitted data to NCQA.
** Significance Testing - "Sig. decrease"/"Below" denotes the results that were found when hypothesis tests were conducted to determine if the percentage is lower. "Sig. increase"/"Above" denotes the results that were found when hypothesistests were conducted to determine if the percentage is higher. "Unable to Test" denotes that there was insufficient sample size to conduct the statistical test. All significance testing is performed at the 95% significance level.
0.659 NA Not sig.
70Do you intend to switch to a different health plan when you next have an opportunity?
175 85.7% NA 70.3%
69Would you recommend your health plan to your family or friends?
176
0.188 NA Above
SPH Analytics Commercial Adult Survey—2016 B.1

Question Summaries UMP UW MEDICINE ACCOUNTABLE CARE NETWORK
Custom Questions Commercial Adult CAHPS® Simulation
176 Total Respondents
2016 2015Summary
RateCorrelation
with Q422016 to 2015
2016 to SPHA BoB
Yes No
10.3% 89.7%
Never Sometimes Usually Always
5.6% 5.6% 16.7% 72.2%
Strongly Agree
AgreeNeither Agree nor Disagree
DisagreeStrongly Disagree
Don't know
12.5% 43.8% 43.8% 0.0% 0.0% n = 0
Strongly Agree
AgreeNeither Agree nor Disagree
DisagreeStrongly Disagree
Don't know
11.8% 58.8% 29.4% 0.0% 0.0% n = 1
Strongly Agree
AgreeNeither Agree nor Disagree
DisagreeStrongly Disagree
Don't know
5.9% 58.8% 35.3% 0.0% 0.0% n = 1
NA NA NA
* The 2015 SPH Analytics Book of Business consists of the results of 17 commercial adult samples surveyed by SPH Analytics in 2015 that submitted data to NCQA.
** Significance Testing - "Sig. decrease"/"Below" denotes the results that were found when hypothesis tests were conducted to determine if the percentage is lower. "Sig. increase"/"Above" denotes the results that werefound when hypothesis tests were conducted to determine if the percentage is higher. "Unable to Test" denotes that there was insufficient sample size to conduct the statistical test. All significance testing is performed at the95% significance level.
NA NA NA
73CThe written materials helped me to understand the health plan’s policies and procedures.
17 64.7% NA NA
73BThe new member materials were easy to understand
17 70.6% NA
NA NA
NA
NA NA73AI liked the overall format and appearance of the written materials
16 56.3% NA
NA NA NA
72In the last 12 months, how often were you able to get the help you needed when you called Washington State Rx Services?
18 88.9% NA NA NA NA NA
Significance Testing**
71In the last 12 months, did you call or were you transferred by your health plan to Washington State Rx Services?
174 10.3% NA NA
Q# Survey Item Valid nCategory Responses
(Summary Rate responses in grey)
Plan's Summary Rate
SPHA Book of Business - 2015*
SPH Analytics Commercial Adult Survey—2016 B.2
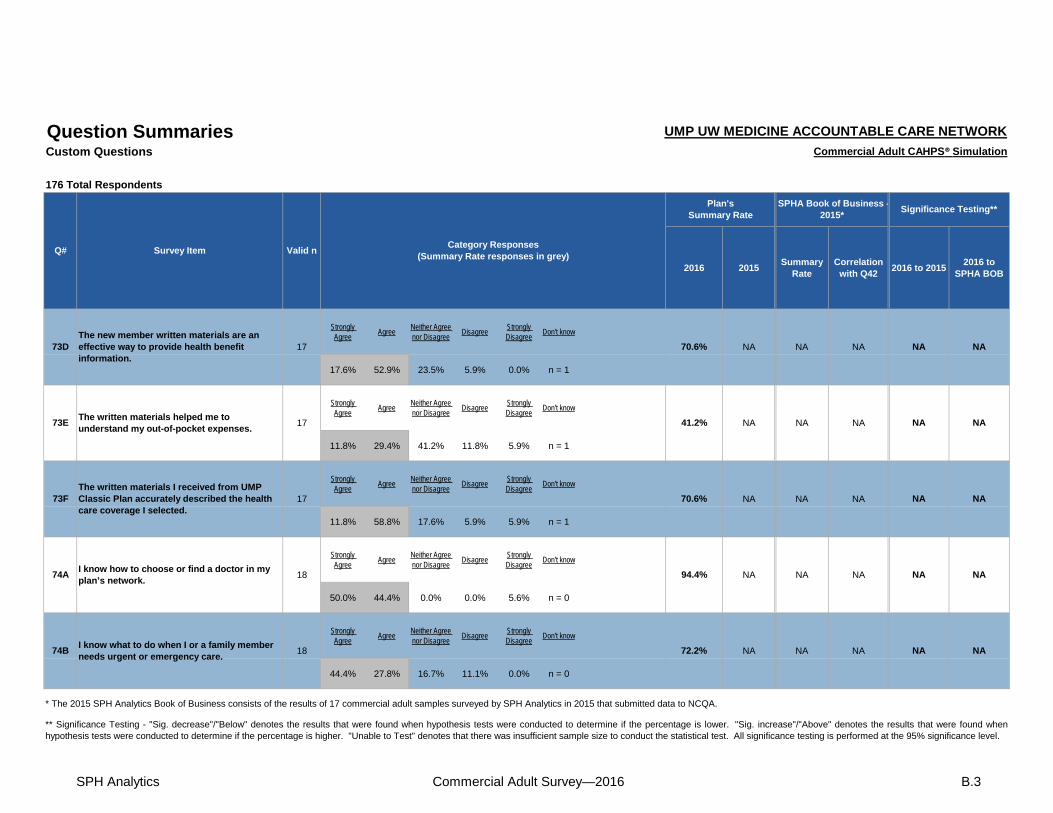
Question Summaries UMP UW MEDICINE ACCOUNTABLE CARE NETWORK
Custom Questions Commercial Adult CAHPS® Simulation
176 Total Respondents
2016 2015Summary
RateCorrelation
with Q422016 to 2015
2016 to SPHA BOB
Strongly Agree
AgreeNeither Agree nor Disagree
DisagreeStrongly Disagree
Don't know
17.6% 52.9% 23.5% 5.9% 0.0% n = 1
Strongly Agree
AgreeNeither Agree nor Disagree
DisagreeStrongly Disagree
Don't know
11.8% 29.4% 41.2% 11.8% 5.9% n = 1
Strongly Agree
AgreeNeither Agree nor Disagree
DisagreeStrongly Disagree
Don't know
11.8% 58.8% 17.6% 5.9% 5.9% n = 1
Strongly Agree
AgreeNeither Agree nor Disagree
DisagreeStrongly Disagree
Don't know
50.0% 44.4% 0.0% 0.0% 5.6% n = 0
Strongly Agree
AgreeNeither Agree nor Disagree
DisagreeStrongly Disagree
Don't know
44.4% 27.8% 16.7% 11.1% 0.0% n = 0
Significance Testing**
73DThe new member written materials are an effective way to provide health benefit information.
17 70.6% NA NA
Q# Survey Item Valid nCategory Responses
(Summary Rate responses in grey)
Plan's Summary Rate
SPHA Book of Business -2015*
NA NA NA
73EThe written materials helped me to understand my out-of-pocket expenses.
17 41.2% NA NA NA NA NA
NA NA73FThe written materials I received from UMP Classic Plan accurately described the health care coverage I selected.
17 70.6% NA
18 94.4% NA
NA NA
NA
* The 2015 SPH Analytics Book of Business consists of the results of 17 commercial adult samples surveyed by SPH Analytics in 2015 that submitted data to NCQA.
** Significance Testing - "Sig. decrease"/"Below" denotes the results that were found when hypothesis tests were conducted to determine if the percentage is lower. "Sig. increase"/"Above" denotes the results that were found whenhypothesis tests were conducted to determine if the percentage is higher. "Unable to Test" denotes that there was insufficient sample size to conduct the statistical test. All significance testing is performed at the 95% significance level.
NA NA NA
74BI know what to do when I or a family member needs urgent or emergency care.
18 72.2% NA NA
74AI know how to choose or find a doctor in my plan’s network.
NA NA NA
SPH Analytics Commercial Adult Survey—2016 B.3

Question Summaries UMP UW MEDICINE ACCOUNTABLE CARE NETWORK
Custom Questions Commercial Adult CAHPS® Simulation
176 Total Respondents
2016 2015Summary
RateCorrelation
with Q422016 to 2015
2016 to SPHA BoB
Strongly Agree
AgreeNeither Agree nor Disagree
DisagreeStrongly Disagree
Don't know
16.7% 55.6% 11.1% 11.1% 5.6% n = 0
Strongly Agree
AgreeNeither Agree nor Disagree
DisagreeStrongly Disagree
Don't know
22.2% 27.8% 11.1% 38.9% 0.0% n = 0
Strongly Agree
AgreeNeither Agree nor Disagree
DisagreeStrongly Disagree
Don't know
33.3% 33.3% 22.2% 11.1% 0.0% n = 0
Strongly Agree
AgreeNeither Agree nor Disagree
DisagreeStrongly Disagree
Don't know
16.7% 50.0% 16.7% 16.7% 0.0% n = 0
Strongly Agree
AgreeNeither Agree nor Disagree
DisagreeStrongly Disagree
Don't know
11.1% 50.0% 5.6% 22.2% 11.1% n = 0
Significance Testing**
74CI understand what services are covered and not covered in my plan.
18 72.2% NA NA
Q# Survey Item Valid nCategory Responses
(Summary Rate responses in grey)
Plan's Summary Rate
SPHA Book of Business -2015*
NA NA NA
74DI understand when I need a referral to a specialist
18 50.0% NA NA NA NA NA
NA NA74EI know how much I have to pay (co-pay) at the doctor’s office for a preventive care visit.
18 66.7% NA
18 66.7% NA
NA NA
NA
* The 2015 SPH Analytics Book of Business consists of the results of 17 commercial adult samples surveyed by SPH Analytics in 2015 that submitted data to NCQA.
** Significance Testing - "Sig. decrease"/"Below" denotes the results that were found when hypothesis tests were conducted to determine if the percentage is lower. "Sig. increase"/"Above" denotes the results that were found whenhypothesis tests were conducted to determine if the percentage is higher. "Unable to Test" denotes that there was insufficient sample size to conduct the statistical test. All significance testing is performed at the 95% significance level.
NA NA NA
74GI understand my right to appeal a claims or coverage decision.
18 61.1% NA NA
74FI know which services are subject to a deductible under my coverage plan.
NA NA NA
SPH Analytics Commercial Adult Survey—2016 B.4

Question Summaries UMP UW MEDICINE ACCOUNTABLE CARE NETWORK
Custom Questions Commercial Adult CAHPS® Simulation
176 Total Respondents
2016 2015Summary
RateCorrelation
with Q422016 to 2015
2016 to SPHA BoB
Strongly Agree
AgreeNeither Agree nor Disagree
DisagreeStrongly Disagree
Don't know
12.5% 56.3% 25.0% 6.3% 0.0% n = 1
Strongly Agree
AgreeNeither Agree nor Disagree
DisagreeStrongly Disagree
Don't know
29.4% 52.9% 11.8% 0.0% 5.9% n = 0
Significance Testing**
74HI understand my plan’s prescription drug coverage (if you have it).
16 68.8% NA NA
Q# Survey Item Valid nCategory Responses
(Summary Rate responses in grey)
Plan's Summary Rate
SPHA Book of Business -2015*
NA NA NA
74II understand my health care rights for privacy and confidentiality
17 82.4% NA NA NA NA NA
* The 2015 SPH Analytics Book of Business consists of the results of 17 commercial adult samples surveyed by SPH Analytics in 2015 that submitted data to NCQA.
** Significance Testing - "Sig. decrease"/"Below" denotes the results that were found when hypothesis tests were conducted to determine if the percentage is lower. "Sig. increase"/"Above" denotes the results that were found whenhypothesis tests were conducted to determine if the percentage is higher. "Unable to Test" denotes that there was insufficient sample size to conduct the statistical test. All significance testing is performed at the 95% significancelevel.
SPH Analytics Commercial Adult Survey—2016 B.5

2016 Final Report for UMP UW MEDICINE ACCOUNTABLE CARE NETWORK Consumer Assessment of Healthcare Providers and Systems (CAHPS®) Survey
SPH Analytics Commercial Adult Survey – 2016 14-1
14. Appendix C - Loyalty Analysis Member loyalty develops when the health plan consistently meets or exceeds the expectations of its members. Loyal members remain with the health plan, allowing the health plan to recoup its up-front investment in enrolling, orienting, and transitioning members into care. ENTER As defined in this analysis, loyal members of the health plan are: (1) satisfied with the plan, (2) not planning to switch to other plans, and (3) willing to recommend the plan to other consumers. Furthermore, loyal members are more likely to stay with the plan for a prolonged period of time. ENTER Page C.1 presents an assessment of member loyalty. Member loyalty is based upon responses to the following questions: ENTER
What number would you use to rate your health plan? Would you recommend your health plan to your family or friends if they needed care? Do you intend to switch to a different health plan when you next have an opportunity?
ENTER Loyalty Zone: Members are very satisfied, are likely to recommend the plan to others, and are not likely to switch plans in the future. ENTER Defection Zone: Members are not satisfied, are not likely to recommend the plan to others, and are likely to switch plans in the future. ENTER Indifference Zone: Members are mixed in their responses to a combination of the following: whether they are satisfied, likely to recommend the plan to others, and/or whether they will switch in the future. ENTER Loyalty Segmentation Page C.2 presents a loyalty analysis segmentation by select member demographics, which allows the health plan to identify which members are more likely to be loyal or to defect than other members. ENTER ENTER Charts C.1 – C.2

SPHA Loyalty AnalysisCommercial Adult CAHPS® Simulation
175 Total Eligible Respondents*
Valid n
Significance Testing*** 2015 SPHA Book of
Business**2015
2016 Simulation to 2016 CAHPS
PercentPercentValid nPercent
NAUnable to
Test
* Eligible Respondents are those answering all three questions.
** The 2015 SPH Analytics Book of Business consists of the results of 17 commercial adult samples surveyed by SPH Analytics in 2015 that submitted data to NCQA.
*** Significance Testing -"Sig. decrease"/"Below" denotes the result that would be found if a hypothesis test were conducted to determine if the percentage is lower. "Sig. increase"/"Above" denotes the result that would be found if a hypothesis test were conducted to determine if the percentage is higher. "Unable to Test" denotes that there was insufficient sample size to conduct the statistical test. All significance testing is performed at the 95% significance level.
Defection 5 2.9% NA NA 1.2%
NA Not sig.
Indifference 93 53.1% NA NA 61.3% NA Below
Loyalty 77 44.0% NA NA 37.5%
Loyalty Scores & Comparison
Indifference All other responses
Defection"Definitely Not" "Definitely Yes"
0, 1, 2, 3"Definitely Not" "Probably Yes""Probably Not" "Definitely Yes"
2016
Zone2016
Simulation to SPHA BOB
Loyalty"Definitely Yes" "Definitely Not"
8, 9, 10"Definitely Yes" "Probably Not""Probably Yes" "Definitely Not"
Zone Definitions
Recommend the health plan to others?
Do you intend to switch health plans?
Health Plan Rating
UMP UW MEDICINE ACCOUNTABLE CARE NETWORK
44.0%
37.5%
53.1%
61.3%
2016
SPHA BoB
Loyalty Indifference Defection
ANDANDAND
ANDANDAND
ANDANDAND
ANDANDAND
SPH Analytics Commercial Adult Survey—2016 C.1

Segmentation Analysis mmercial Adult CAHPS® Simulation
175 Total Loyalty Respondents
Valid n* % Valid n* % Valid n* %
Excellent/Very good 55 51.4% 52 48.6% - 0.0%
Good 18 33.3% 36 66.7% - 0.0%
Fair/Poor 4 28.6% 5 35.7% 5 35.7%
Excellent/Very good 60 46.5% 66 51.2% 3 2.3%
Good 14 41.2% 20 58.8% - 0.0%
Fair/Poor 2 20.0% 6 60.0% 2 20.0%
18 - 34 11 42.3% 14 53.8% 1 3.8%
35 - 44 7 24.1% 22 75.9% - 0.0%
45 - 54 19 55.9% 14 41.2% 1 2.9%
55 or older 40 47.1% 42 49.4% 3 3.5%
Male 21 35.6% 35 59.3% 3 5.1%
Female 56 48.3% 58 50.0% 2 1.7%
High school graduate or less
3 50.0% 3 50.0% - 0.0%
Some college or more 73 43.5% 90 53.6% 5 3.0%
Hispanic/Latino 3 33.3% 5 55.6% 1 11.1%
Not Hispanic/Latino 70 44.0% 85 53.5% 4 2.5%
White 57 41.9% 76 55.9% 3 2.2%
Black/African-American 3 50.0% 2 33.3% 1 16.7%
Other*** 17 43.6% 20 51.3% 2 5.1%
Mail 77 44.0% 93 53.1% 5 2.9%
Phone - 0.0% - 0.0% - 0.0%
UMP UW MEDICINE ACCOUNTABLE CARE NETWORK
ETHNICITY (Q62)
RACE (Q63)
* Valid n refers to total number of respondents answering the response item within the subgroup under the column heading.** Health Status and Mental/Emotional Health Status are defined by the member.*** "Other" includes respondents who selected "Asian," "Native Hawaiian or other Pacific Islander," "American Indian or Alaska Native," or "Other" in Q63.
DATA COLLECTION MODE
EDUCATION (Q61)
SPHA Loyalty Zones by Plan Member Demographics
HEALTH STATUS (Q43)**
MENTAL/EMOTIONAL HEALTH STATUS (Q44)**
AGE (Q59)
GENDER (Q60)
Survey Item
SPHA Loyalty Zones
Loyal Indifferent Defection
SPH Analytics Commercial Adult Survey—2016 C.2

ANALYZ EMEASUR E TAKE ACTIO N
Contact Us: 866-460-5681 SPHAnalytics.com
Empowering Healthcare Transformation
TM
Consulting ServicesSPH Analytics Can Help You Identify Opportunities to Improve Performance
SPH Analytics (SPHA) Consulting Services help evaluate initiatives for potential improvement based on the data provided and best industry practices through consultation with your organization’s team members. An in-depth analysis can help organizations identify strengths and weaknesses to improve performance.
Harnessing the Power of Information
SPHA Consulting Services help organizations develop initiatives and solutions for improved performance, patient/member satisfaction, and improvement in scores and ratings.
Action Plans for Improvement
SPHA consultants work with you to develop action plans for improvement. Our experienced consultants have extensive backgrounds in quality improvement, healthcare research, and program evaluation and development. Consultants have worked with and for leading healthcare organizations to implement process improvements and strategic initiatives.
Stars/Scores Improvement
We understand Star Ratings and scores improvement is important to your organization. As a leader in healthcare transformation, SPHA helps you evaluate your organization’s performance to develop a realistic plan for improvement. SPHA looks beyond typical measures to help you gain a more meaningful understanding of patient and member sentiment. SPHA consultants help guide your performance improvement initiatives.
The answers are not always easy to find. However, there are steps you can take to bring you closer to your goals. SPHA’s knowledgeable consultants help you develop plans that empower long-term success in the rapidly changing healthcare environment.
Benefits of SPHA’s Consulting Services:
• Gain insight and information based on overall findings
• Examine organizational strengths and weaknesses and their impact on performance
• Identify common themes, best practices, and calls to action
• Develop action plans for improvement
• Improve ratings and scores
HEDIS® is a registered trademark of the National Committee for Quality Assurance (NCQA).