2016 Sales Performance Insights by CSO Insights and Miller Heiman Group
27
Critical Research Insights on Sales Performance Sales Process driving Sales Performance Medio Waldt Consulting Partner, Sales Performance February 2017 [email protected] 610 659 3489
-
Upload
sales-performance-consultants-miller-heiman-group-exigent-strategies-llc-vistage-trusted-advisor -
Category
Sales
-
view
136 -
download
3
Transcript of 2016 Sales Performance Insights by CSO Insights and Miller Heiman Group

Critical Research Insights on Sales Performance Sales Process driving Sales Performance Medio Waldt Consulting Partner, Sales Performance February 2017 [email protected] 610 659 3489

Content Outline
2
• Critical Research Insights on Sales Performance – from CSO Insights; Methodology Agnostic
• Sales Best Practices Study: 70+ Behaviors tracked, 13 years running – B2B Buyer Behaviors and Expectations from 2015 – Top 12 Behaviors of World Class Sales Organizations from 2016 – 9 of Top 12 are NEW – Coaching, Social Selling, Analytics, Funnel Management
• Sales Performance Optimization Study: we track 450 + KPMs – Insights on on Key Performance Metrics from 2016 – Correlated to Quality of Sales Process and Customer Perceptions of your Value – What is the impact of a 5% improvement in key metrics for your Company?
• What does this mean for your Company and Sales team? – How does it connect to your CONCEPT on Sales Process & Sales Performance – What you want to Accomplish – Fix – Avoid
• Other Studies, Open Discussion, and Next Steps • Appendices: 40 Years, 5 Beliefs, Be Ready, Sales Ready Platforms
– Who we are, what we do, and how we do it

From our 2015 Sales Best Practices Study
3
The B2B Buying Process is becoming more complex
More Buyers AND Sellers involved every year; takes longer to reach a decision
Becoming more formal, with ROI required, often a Request for Proposal (RFP or RFI)
Buyer Expectations focus on Competency and Adding value even before the Sale is concluded
Sales Professionals are expected to provide a competent PERSPECTIVE and deliver VALUE (education, content, new insights) during the selling process, even before the contract is signed.

More People Involved Buyer: 5.8 2015 /4.74 5yr avg Seller: 4.4 2015 / 4.1 5yr avg
More Formalized Process Significantly formalized: 61% 2015 / 45.2% 5yr avg Average sales cycle time: + 2.82% 2015 / 2.6% 5yr avg
More Political Decisions Our Customer requires formal ROI: 61.4% 2015 / 40.2% 5yr avg Retention rate increase: + 5.4% 2015 / 4.8% 5yr avg
Tim
e
Value
EXPECTATIONS
Don’t Waste
My Time Know My Business
Know Your
Solution
Add Value
Ask Insightful Questions
The Expectation Of The Buyer Is Rising and The Process Becoming More Complex
4

OLD WORLD
NEW WORLD
Sales Process Product/Service Delivery
Client Expectation of When Value is Delivered
Client Expectation of When Value Is Delivered
► Help buyer’s navigate the purchasing process; sharing systems and methods for evaluating decisions
► Providing tools and methods for assessing/calculating ROI
► Understanding and documenting unintended consequences of various decisions
► Assisting in creating implementation plans
Providing Perspective
Signed Contract
Customers Expect The Sales Process And Seller To Provide Perspective. This Comes By Combining Expert Customer Knowledge With Expert Solution Knowledge
5

From our 2016 Sales Best Practices Study
6
• “Drawing Back the Bow: Position, Enable, Follow Through” – For the past 13 years, the message of the Sales Best Practices Study
has been the same. – The best always strive to get better.
• World-Class Sales Performers outperformed All Respondents by more than 23 % in key metrics, including … – Number of Qualified Opportunities, New Account Acquisition, Average Account
Billing, Year-Over-Year Existing Customer Growth, Quota Achievement – By identifying the behaviors and attributes of World-Class Sales Performers that
lead to results … – Our Sales Best Practices Study provides an aspirational benchmark for other sales
organizations that are working toward achieving high-performance results.
• “How do World-Class Sales Performers do these things?” – Process is the answer, hiding in plain sight in the list of top 12. – Process: repeatable, consistent, measurable, and continually improving.

From our 2016 Sales Best Practices Study
7
• Sales Process – repeatable, consistent, measurable, and continually improving
• 3 of the top 12 behaviors exhibited by World-Class Sales Performers in this year’s study were also in the top 12 last year – Sales and Marketing are aligned in what our customers want and need. – Our organization is highly effective in allocating the right resources to pursue large
deals. – We know why our top performers are successful.
• 9 of the top 12 behaviors exhibited by World-Class Sales Performers in this year’s study are brand NEW. – Social Selling Guidelines – Coaching and Professional Development – Relationship Management – Funnel Management

Critical Behaviors driving Sales Performance Source: 2016 Sales Best Practices Study, CSO Insights Top 12 Behaviors driving Performance
8
World All Class Other
1. Sales and marketing are aligned in what our customers want and need. 94% 39%
2. We have successfully implemented social media guidelines for our client-facing personnel. 71% 20%
3. Our organization is highly effective in allocating the right resources to pursue large deals 94% 40%
4. In a large deal, we always gain access to key decision makers. 90% 38%
5. We have relationships and dialog at the highest executive levels with all our strategic accounts. 97% 40%
6. We have an effective process for managing our global accounts. 91% 32%

Critical Behaviors driving Sales Performance Source: 2016 Sales Best Practices Study, CSO Insights Top 12 Behaviors driving Performance
9
World All Class Other
7. We know why our top performers are successful. 94% 44% 8. Our process for getting new hires to full productivity
is highly effective. 82% 22% 9. Our sales performance metrics are aligned with
our business objectives. 91% 51% 10. We use sales analytics to measure and predict
sales performance. 94% 30% 11. Our organizational structure allows us to easily adapt
to our customers’ changing needs. 92% 39% 12. In an average month, our sales managers definitely
spend adequate time coaching each individual on the sales team. 88% 32%

From our 2016 Sales Performance Optimization Study
10
Participants answer a series of questions on the quality of their relationship with their Customers, and on the rigor and discipline of their own Sales Process. Assigns them to one of three Performance Levels.
Participants then answer specific questions as to how well they perform against Key Performance Metrics.
Level 1 = 30%; Level 2 =44%; Level 3 =26% Level 3 Firms perform BEST on all Key Metrics Some Insights follow.
24% of all Sales Opportunities will result in NO DECISION Average Sales Funnel Win Rate is 45.8% - LESS THAN THE ODDS OF WINNING AT ROULETTE IN LAS VEGAS
Direct correlation between Quality of Sales Process with % of Sales Professionals achieving Quota and % of Companies achieving their Business Plan

Sales Relationship / Process Matrix
11
• Where do you think you are or … • Where does your Client say you are on the Relationship (vertical) Axis? • Where do you think you are on Sales Process (horizontal) Axis? • What does all this mean? … Level 3 Firms perform BEST on all Key Metrics
Medio Waldt, [email protected], 610 659 3489
Copyright © 2016 MHI Global. All Rights Reserved. No portion of this report may be reproduced or distributed in any form or by any means without the
prior written permission of the authors.
Page 11
Sales Performance Optimization Study – 2016 Key Trends Analysis
A deeper analysis of these three levels of sales performance shed light on the real power that sales process and customer relationships can have on sales results. Where a sales organization is on the SRP Matrix may well dictate whether it succeeds or fails in hitting its revenue goals as shown in the table on the following page. It starts with the percentage of salespeople achieving their quota goals. On average, only 50% of sales representatives met or exceeded their 2015 sales goals for Level 1 companies―down from the figure of 53%
11
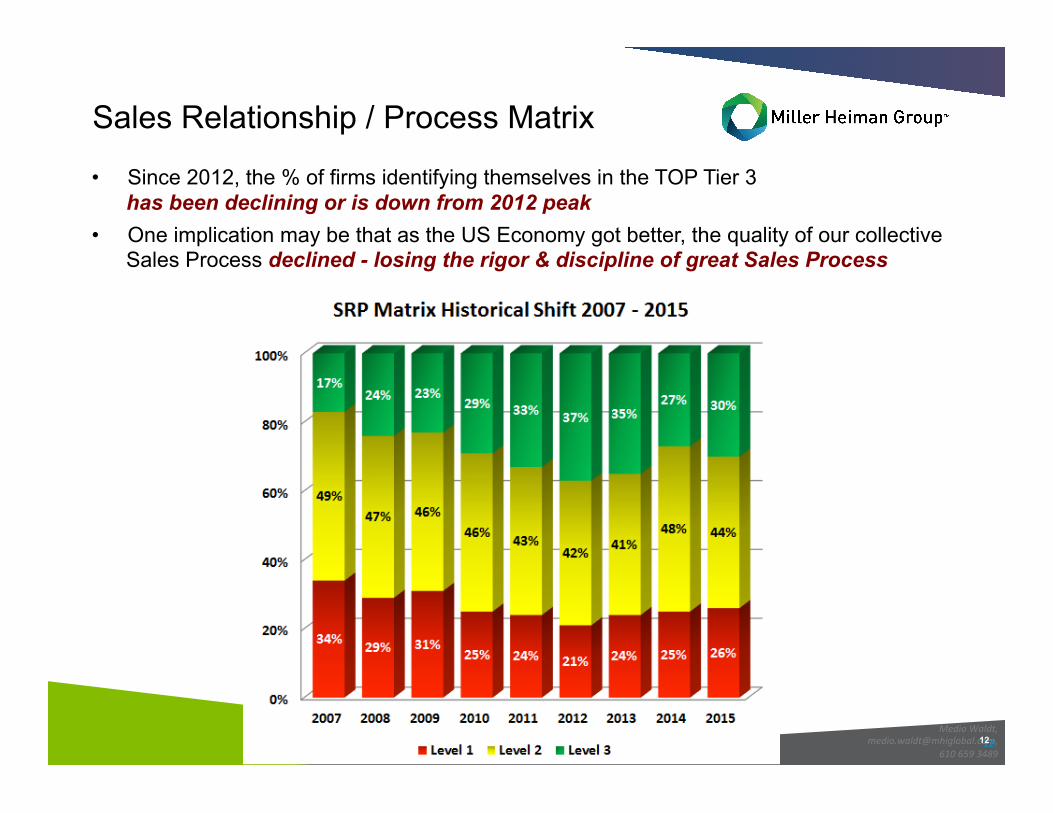
Sales Relationship / Process Matrix
12
• Since 2012, the % of firms identifying themselves in the TOP Tier 3 has been declining or is down from 2012 peak
• One implication may be that as the US Economy got better, the quality of our collective Sales Process declined - losing the rigor & discipline of great Sales Process
Medio Waldt, [email protected],
610 659 3489
Copyright © 2016 MHI Global. All Rights Reserved. No portion of this report may be reproduced or distributed in any form or by any means without the
prior written permission of the authors.
Page 13
Sales Performance Optimization Study – 2016 Key Trends Analysis
While the data clearly make a compelling business case for all to strive to move to a Level 3 sales performance position on the SRP Matrix, the chart to the right shows that while the percentage of firms that are doing so has increased from 17% in 2007 to 30% today, these sales organizations are still the exception as opposed to the rule. So, how can more companies unlock the secret that Merritt Lutz proposed? This past year, as we worked with research clients on how to leverage the SRP Matrix to chart their sales transformation course, we started creating sets of definitions and characteristics for each sales process and customer relationship level. These were tailored for each client to take into account the marketplaces it sold into. These served as useful tools for providing sales leaders with a basis of comparison across sales teams, divisions, geographies, and ultimately against other organizations within the same industry. Let’s review a sample of one of these comparisons that sales management can use to further assess where their company is in relationship to the SRP Matrix. If changes are warranted, management can also start to uncover the steps needed to get where they need to be on the SRP Matrix.
12

Copyright © 2016 MHI Global. All Rights Reserved. No portion of this report may be reproduced or distributed in any form or by any means without the
prior written permission of the authors.
Page 11
Sales Performance Optimization Study – 2016 Key Trends Analysis
A deeper analysis of these three levels of sales performance shed light on the real power that sales process and customer relationships can have on sales results. Where a sales organization is on the SRP Matrix may well dictate whether it succeeds or fails in hitting its revenue goals as shown in the table on the following page. It starts with the percentage of salespeople achieving their quota goals. On average, only 50% of sales representatives met or exceeded their 2015 sales goals for Level 1 companies―down from the figure of 53%
Improving Performance – a 5% difference
13
• Modest changes in the “right” Selling Behaviors can drive significant improvement in overall Sales Performance.
• What would be the impact on your business IF … – You could improve any one of these metrics by 5% – You could have 5% more of your Sales Reps. achieving quota – You could recycle the resources lost on the 24% of deals that result in “No Decision”

What We Study
Study Description
Sales Best Practices Study
• Identifies practices/behaviors which drive World-Class Sales Performance (e.g. implementing social media guidelines for client-facing personnel)
• Covers 70 key practices across the Sales System, Highlights top 12 differentiating items/year • 13 years running
Sales Performance Optimization Study
• Collects 100+ sales metrics (e.g. % of salespeople achieving quota); Correlates metrics (e.g. organizations consistently using a sales methodology have ># of salespeople making quota)
• Uses Sales Relationship/Process™ (SRP) framework to identify tiers of performance • Includes mini case studies throughout to illustrate concepts • Trending and comparisons to previous periods of time, 22 years running
Sales Enablement Optimization Study
• Provides organizing framework for Sales Enablement programs (sales training, content development, sales team coaching, effectively leveraging technology)
• Collects data on common challenges and best practices for execution • 2nd year
Sales Compensation and Performance Management Study
• Used to assist in the design or improvement of compensation plans • Collects data from sales leaders on how they measure, monitor, and reward sales and sales
teams’ performance (e.g. % of companies which use customer type to define territories) • 7 years running
…and more • Additional studies (Channel Management), reports (Sales Management Optimization report) and points of view (Sales Enablement Research Notes, CSO’s Guide to Transforming the Sales Organization) can be found in the CSO Insights Research library
14

Open Discussion and Next Steps
15
• What additional information do you need? • What actions do we need to complete, on both sides? • When can we meet next?

APPENDICES

18

The most important decision we make as sales people, managers and leaders is how to connect with our customers.
Talent is one thing, but a scalable, consistent selling methodology is everything.
Customers expect a perspective; not a sales pitch.
The best are always looking for ways to improve.
Those that prepare win more and win more consistently.
40 YEARS 5 BELIEFS
19
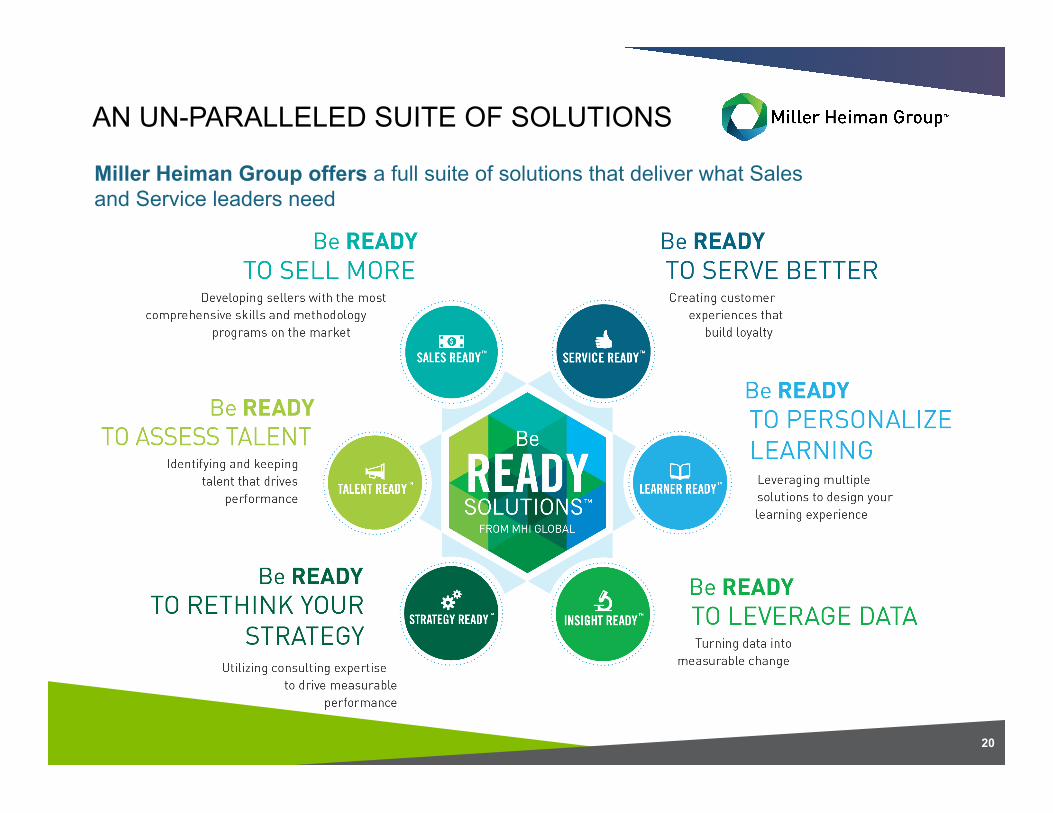
AN UN-PARALLELED SUITE OF SOLUTIONS
Miller Heiman Group offers a full suite of solutions that deliver what Sales and Service leaders need
20

Winning and Losing
WINNING FAST = GREAT
WINNING SLOW = GOOD
LOSING FAST = OK
LOSING SLOW = WORST POSSIBLE OUTCOME
NEVER, EVER LOSE SLOW
21 21

SKILLS You’re Good. You just want to get better.
EFFECTIVENESS You Need
A Recognized Problem Fixed.
And Fast.
TRANSFORMATION You Need A Strategy
and Culture Shift.
INDIVIDUAL TEAM ORGANIZATION
HOW WE HELP We uncover what the customer needs and see that requirements fit into three distinct categories
22
Sales Improvement Continuum: Where are you? Get Better Get Results Create Culture

DISCOVERY DESIGN DEVELOP IMPLEMENT SUSTAIN
Deployment Of A World Class Client Engagement Methodology Ensures That Clients And Sellers Cover All Aspects Of The Sales Journey
► Research ► Field Study
Interviews: • Executives • Management • Customers
► Assessments
► Alignment
► Identify the Team ► Change Management ► Communications
Planning ► Project Definition ► Implementation
Advice ► Sustainment Plan
► Launch ► Metrics
► Create Organizational Alignment
► Develop a Communication Strategy
► Develop Customized Learning Tools
► Ready the Organization for Change
► Develop Sustainment Tools
► Facilitator Preparation ► Program Kick Off ► Learning Transfer
► Project Status Tracking
► Share Results
► Develop a Strategy ► Train Leaders,
Coaches, and Facilitators
► Track Coaching Progress
► Reinforce Key Messages and Concepts
► Measure and Share Results

How ready to perform are you?
Getting you ready
CUSTOMER
The Miller Heiman Sales System Puts The Customer At The Center Of What We Do.
24
Diagnostic – Prescriptive - Strategic

Drivers of change for customers
The Sales Ready Sales System
The Sales Ready platform
Agenda
What We Uniquely Do … To Drive Selling Performance
25
Sales ReadyTM - Building tailored, proven solutions that help your Sales team perform

Three Levels of Engagement
26

Thank you for your active participation
Medio Waldt Consulting Partner, Sales Performance [email protected]
610 659 3489