
2016 R3 Dylan de Thomas
37
The Story of Recycling in 2016 Dylan de Thomas, Resource Recycling MassRecycle R3 2016 Recycling & Organics Conference Mar. 29, 2016
-
Upload
massrecycle- -
Category
Environment
-
view
150 -
download
0
Transcript of 2016 R3 Dylan de Thomas
The Story of Recycling in 2016
Dylan de Thomas,Resource Recycling
MassRecycle R3 2016 Recycling & Organics Conference
Mar. 29, 2016
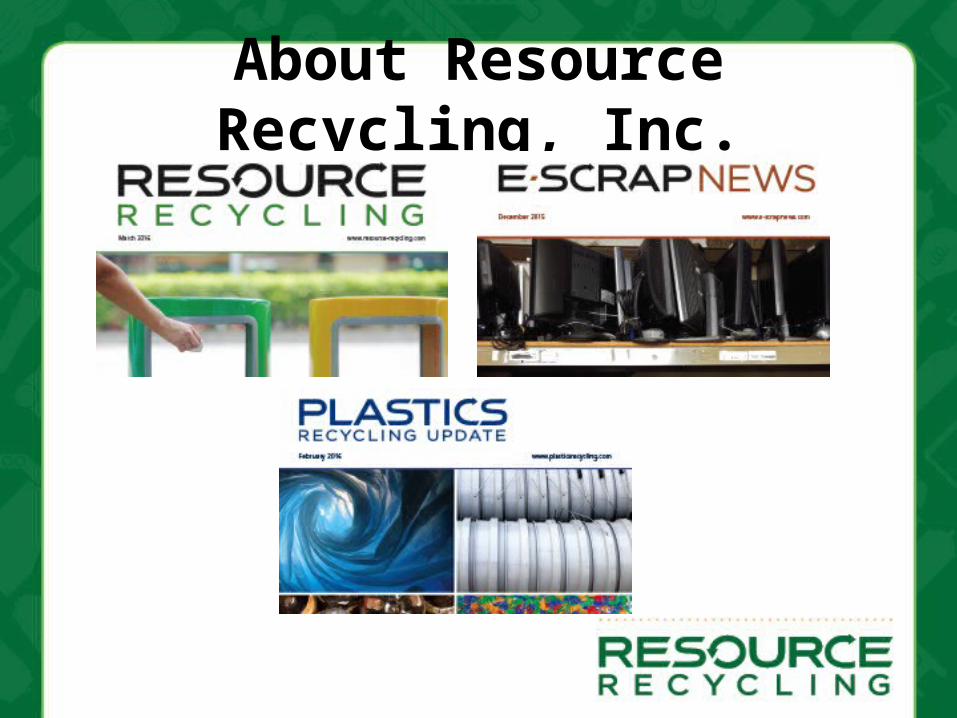
About Resource Recycling, Inc.
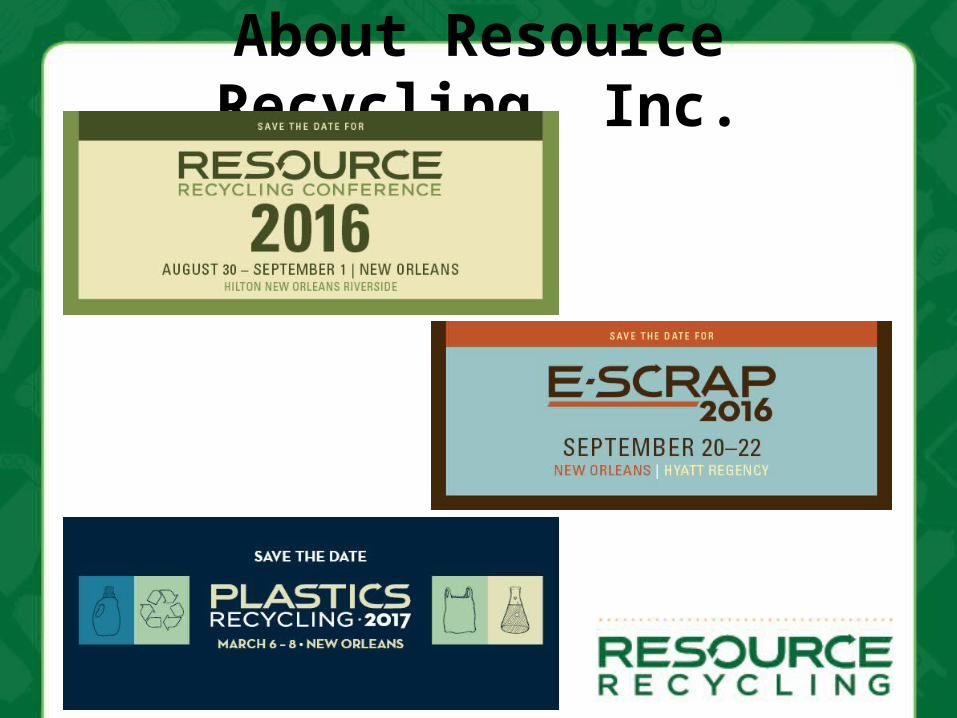
About Resource Recycling, Inc.
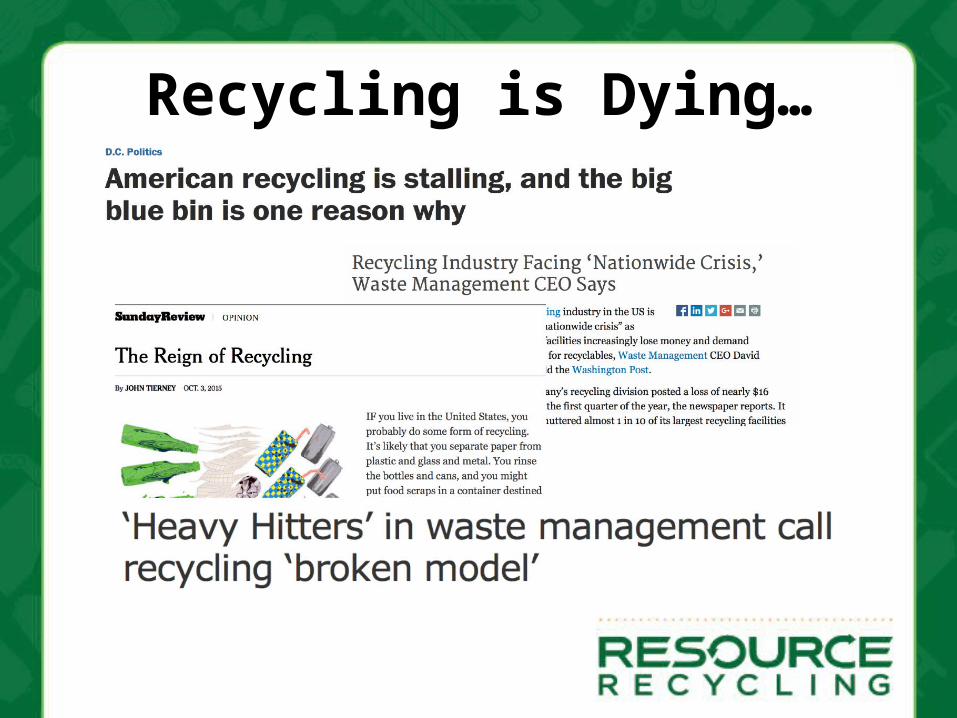
Recycling is Dying…
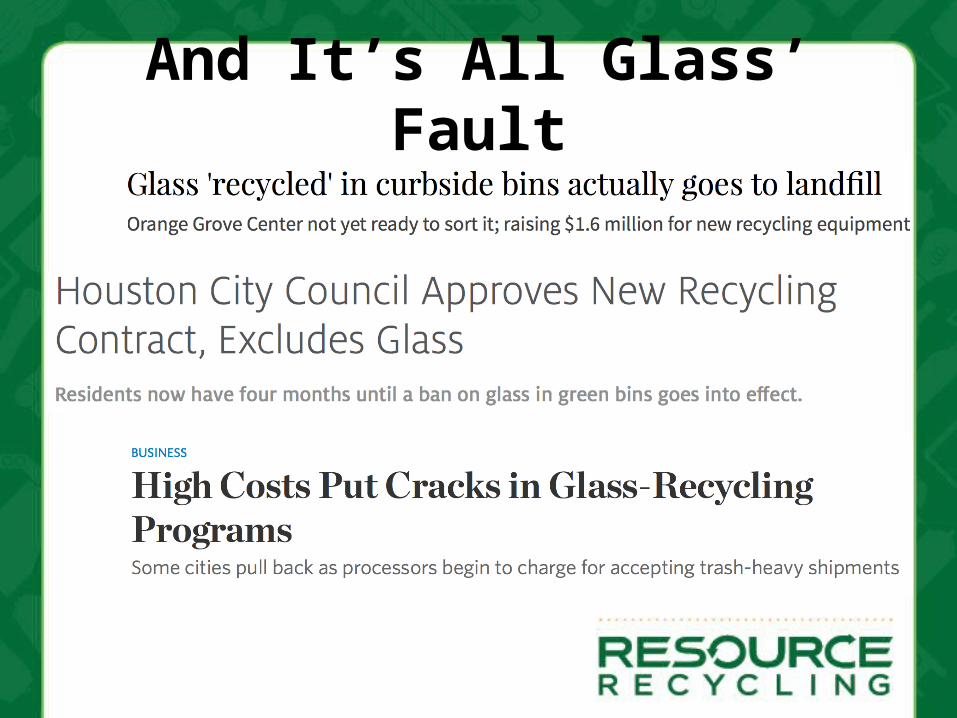
And It’s All Glass’ Fault
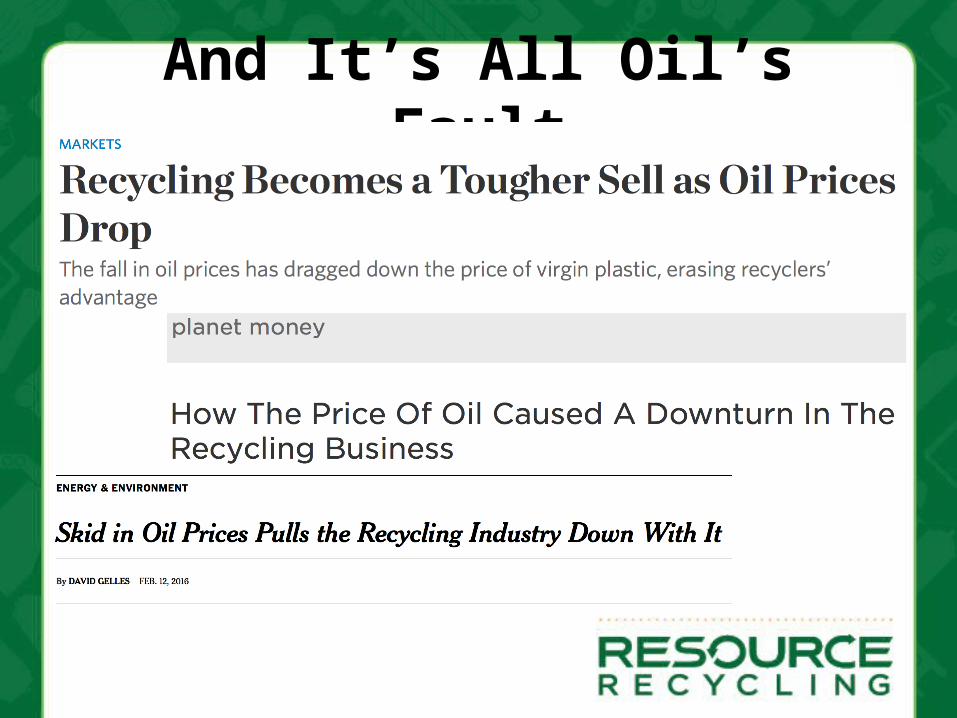
And It’s All Oil’s Fault
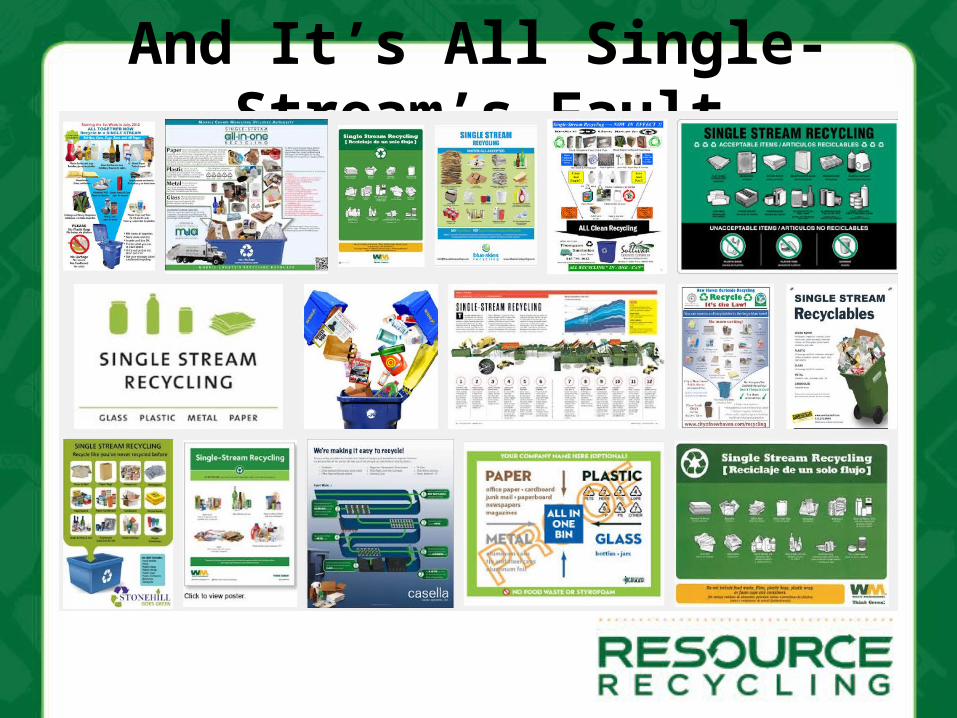
And It’s All Single-Stream’s Fault
And It’s All Our Fault?
What We’re Talking About Today• Why is the Sky Falling?• Going Global• From MRFs to Markets• Sustainable Materials
Management• Partnering Up for Next Steps
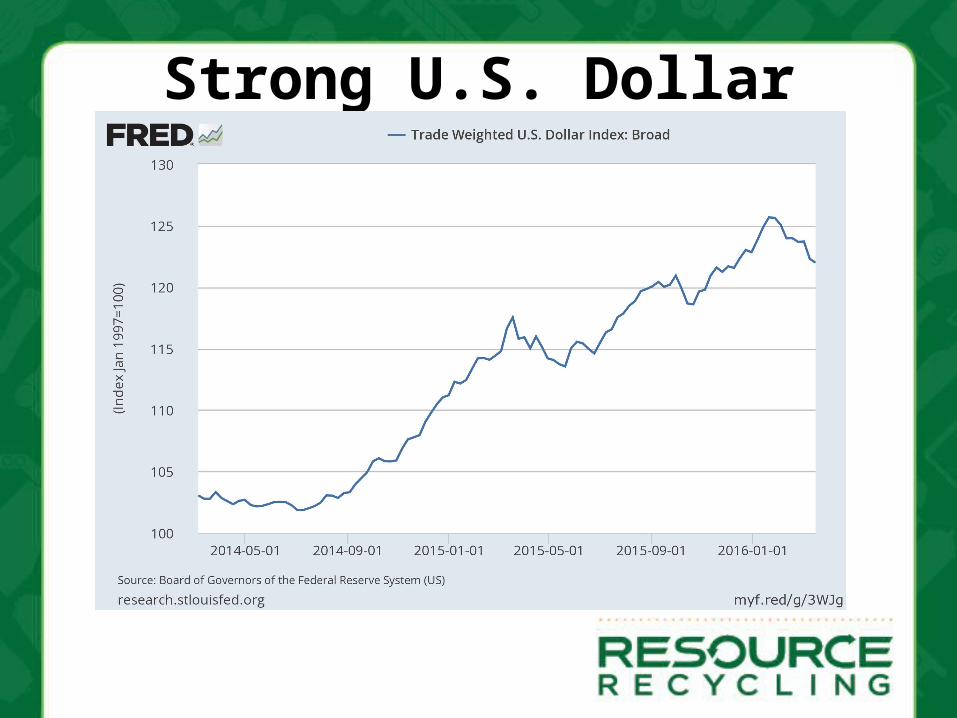
Recycling Commodity Markets Overview
The Big Picture • Strong dollar +• Excess production of crude and
other commodities +• Changes in China +• = Down market, disappearing
margins, hurting industry
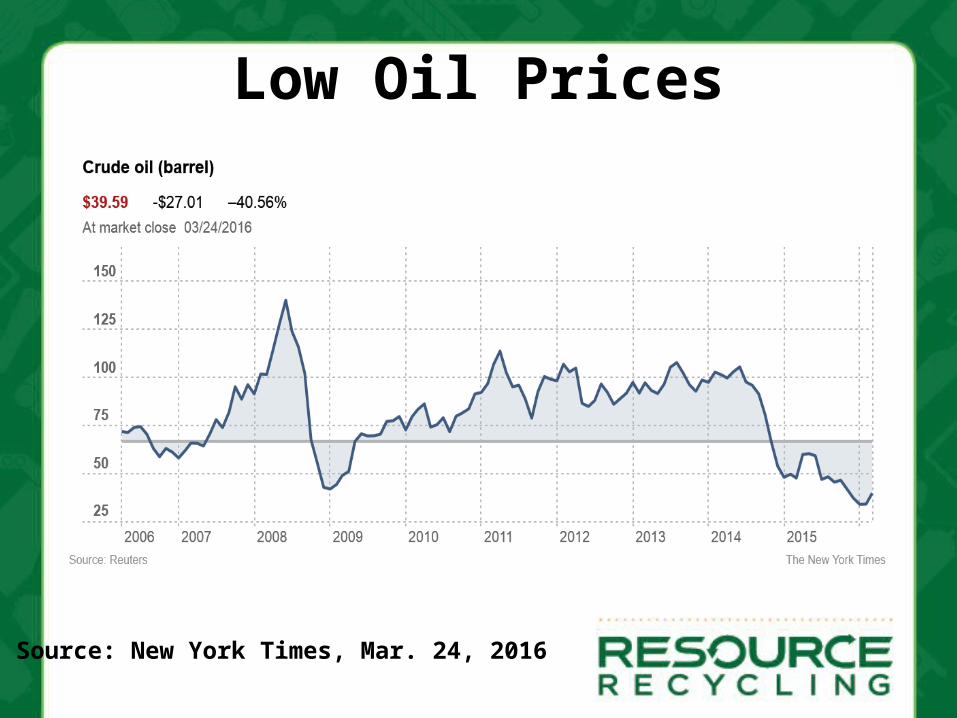
Low Oil Prices
Source: New York Times, Mar. 24, 2016
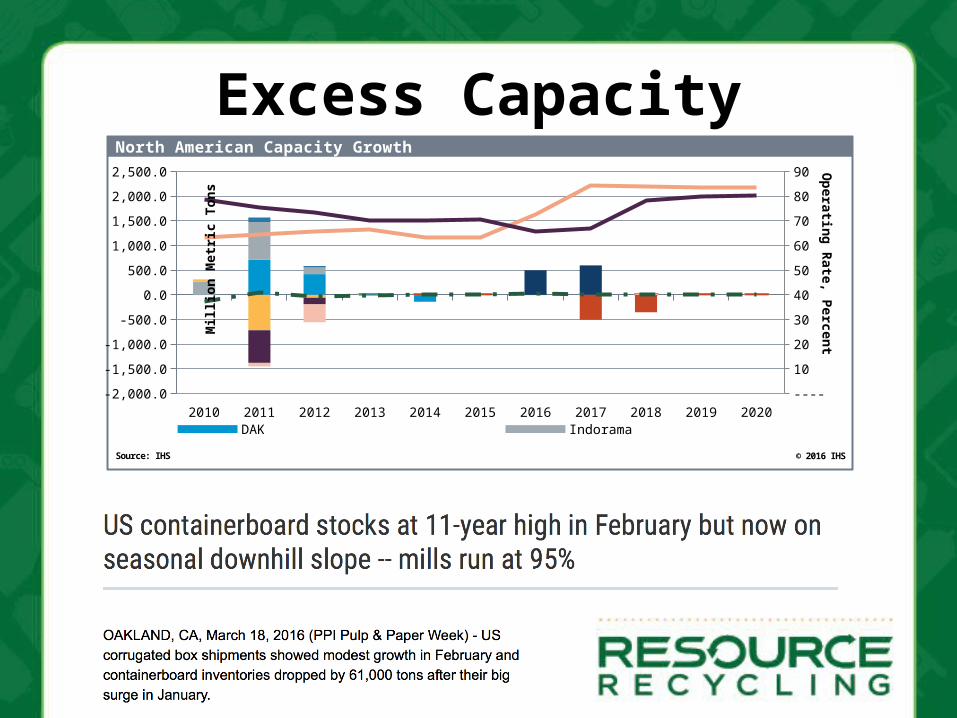
Excess Capacity
2010 2011 2012 2013 2014 2015 2016 2017 2018 2019 2020-2,000.0
-1,500.0
-1,000.0
-500.0
0.0
500.0
1,000.0
1,500.0
2,000.0
2,500.0
----
10
20
30
40
50
60
70
80
90
DAK Indorama M&GNan Ya Selenis Eastman
Operating Rate, Percent
North American Capacity Growth
© 2016 IHS
Mill
ion
Met
ric T
ons
Source: IHS
Recycling Commodity Markets Overview

It’s Not Just the Green Fence…
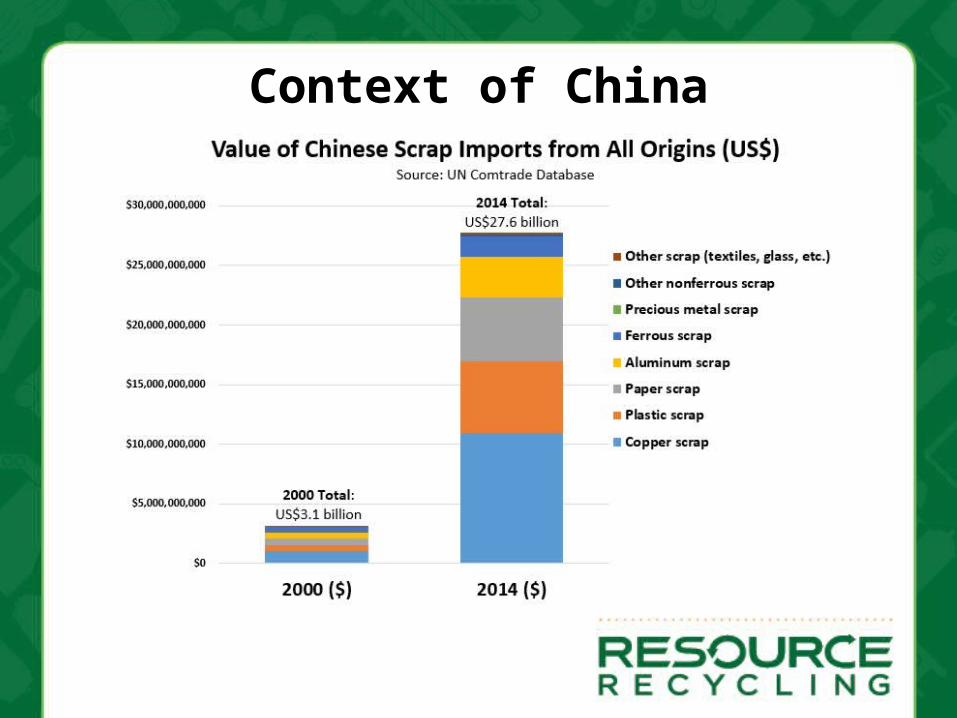
Context of China
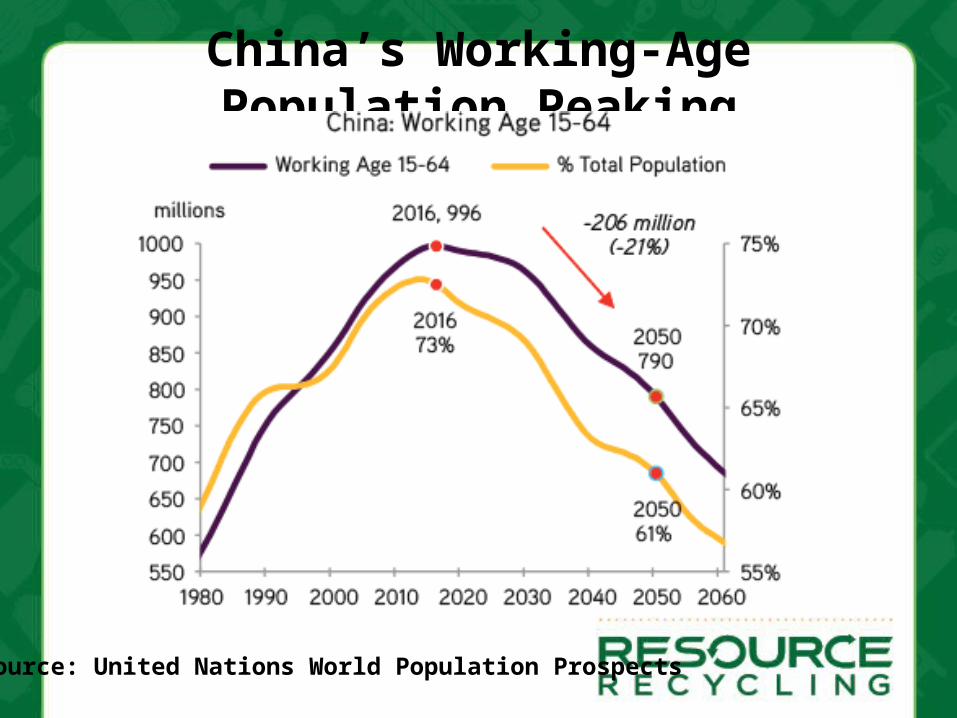
China’s Working-Age Population Peaking
Source: United Nations World Population Prospects
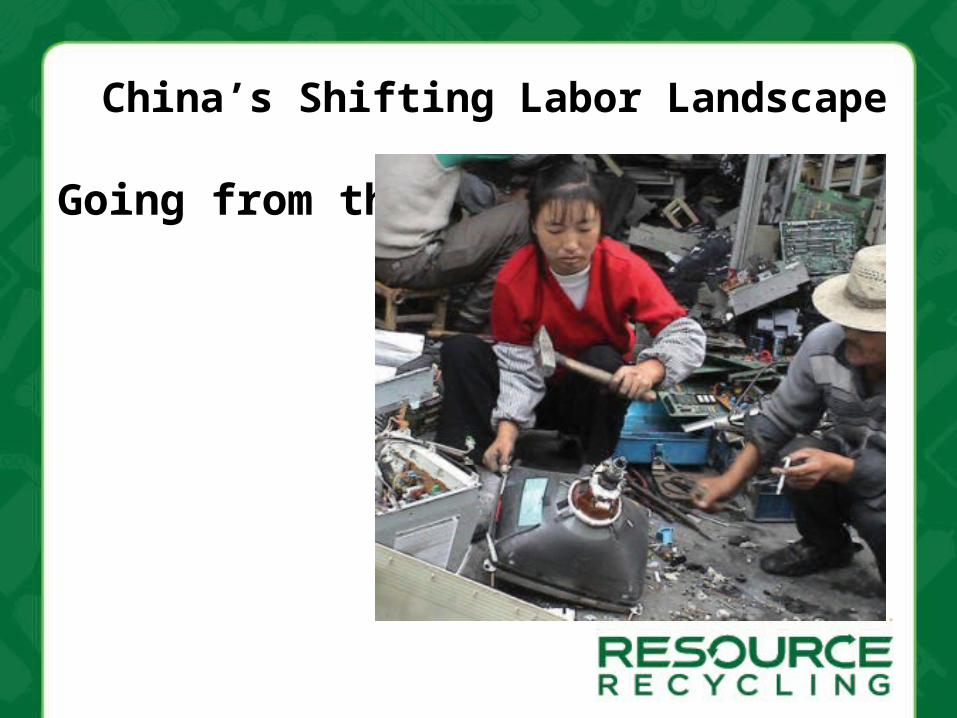
Going from this:
China’s Shifting Labor Landscape

To this:
China’s Shifting Labor Landscape
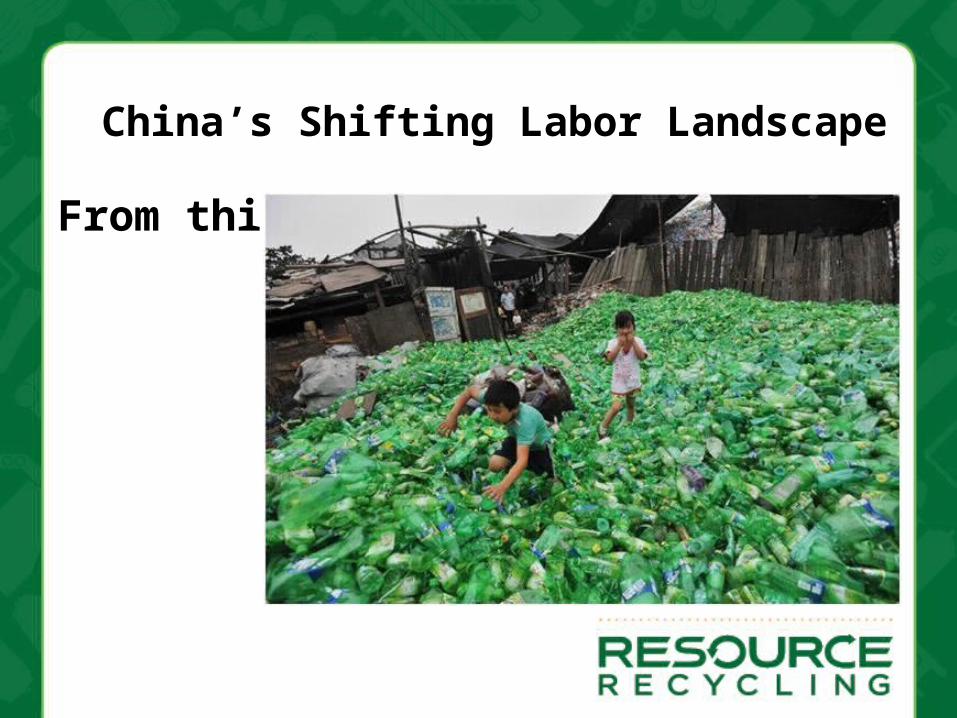
From this:
China’s Shifting Labor Landscape
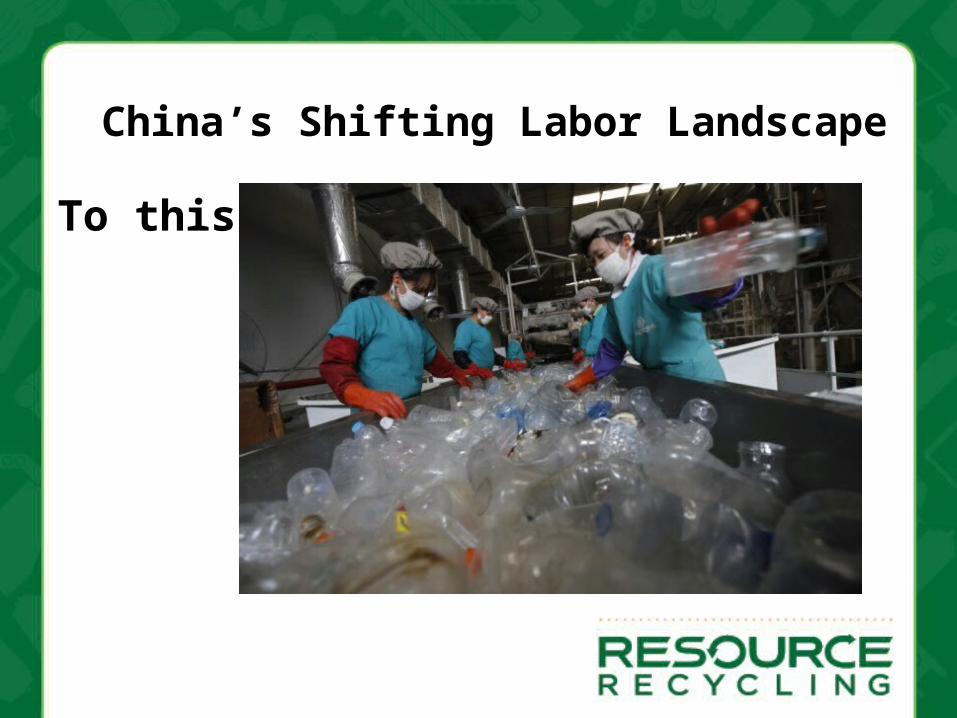
To this:
China’s Shifting Labor Landscape
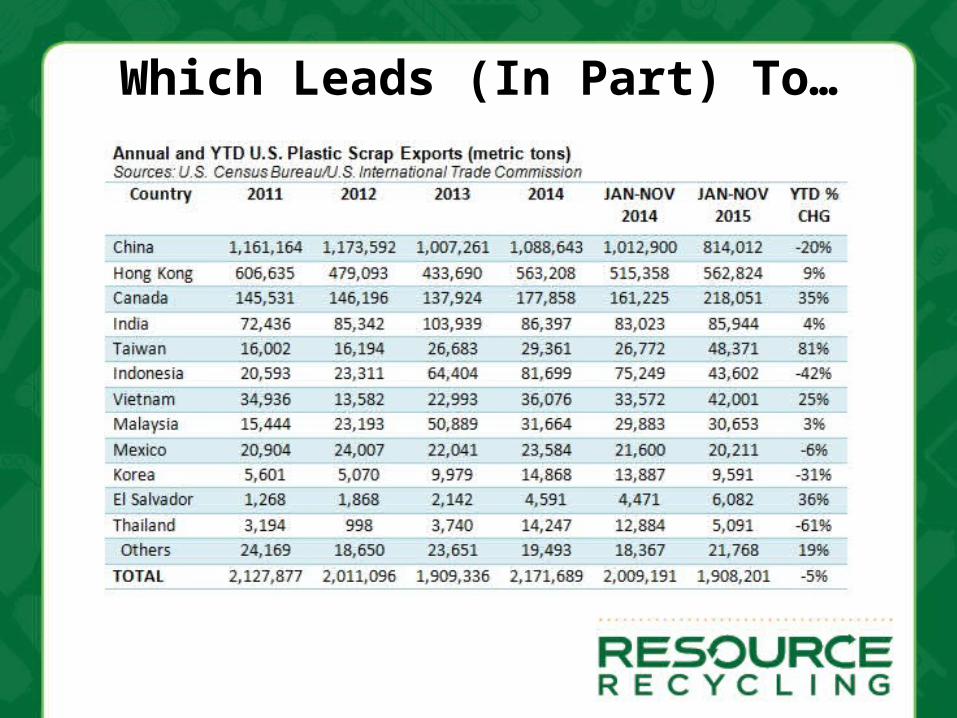
Which Leads (In Part) To…
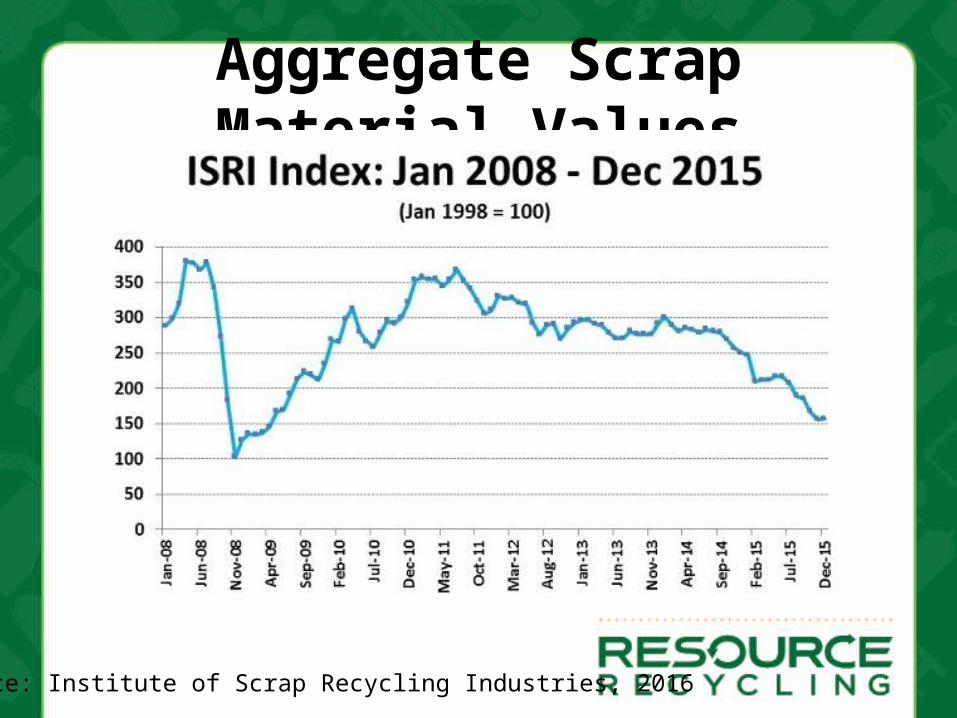
Aggregate Scrap Material Values
Source: Institute of Scrap Recycling Industries, 2016
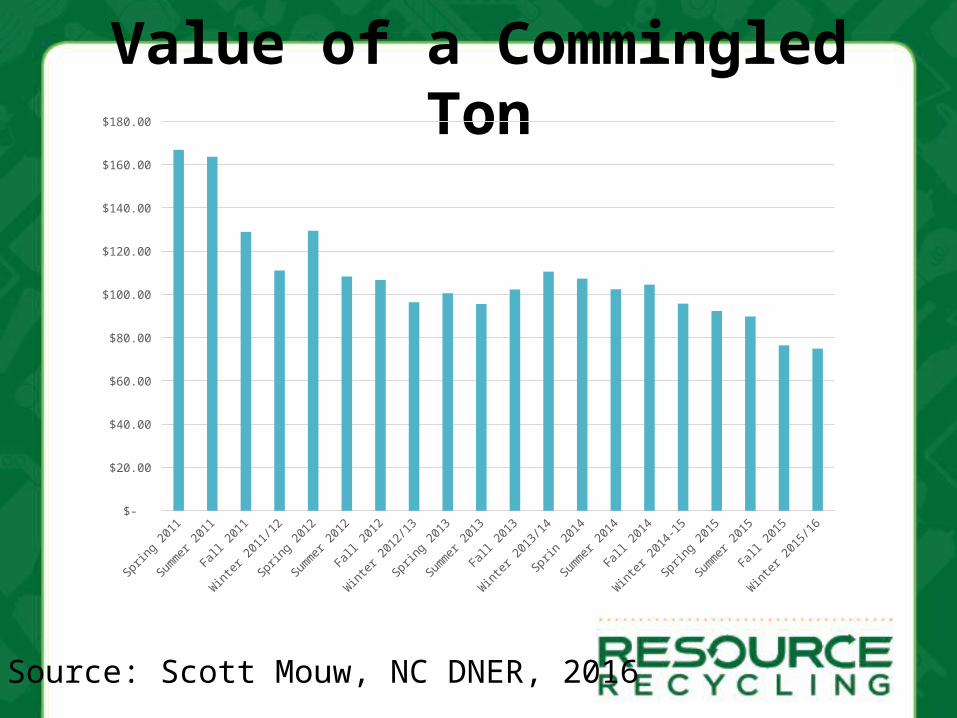
Value of a Commingled Ton
Source: Scott Mouw, NC DNER, 2016
Sprin
g 201
1
Summer
2011
Fall 2
011
Winter
2011
/12
Sprin
g 201
2
Summer
2012
Fall 2
012
Winter
2012/13
Sprin
g 201
3
Summer
2013
Fall 2
013
Winter 201
3/14
Sprin
2014
Summer
2014
Fall 2
014
Winter
2014-1
5
Sprin
g 201
5
Summer
2015
Fall 2
015
Winter
2015
/16 $-
$20.00
$40.00
$60.00
$80.00
$100.00
$120.00
$140.00
$160.00
$180.00
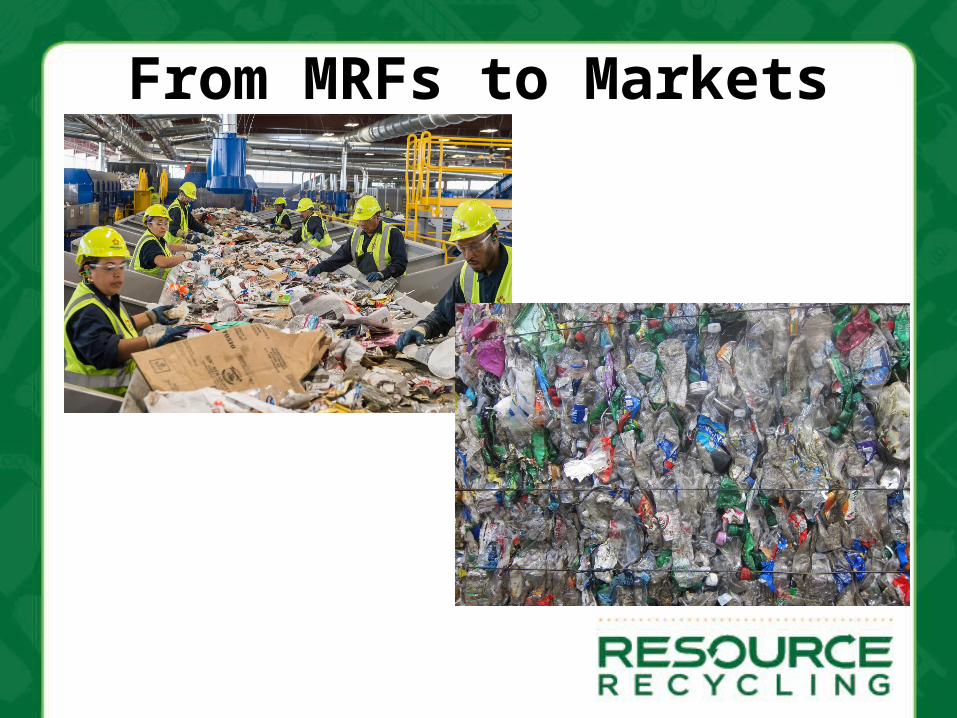
From MRFs to Markets
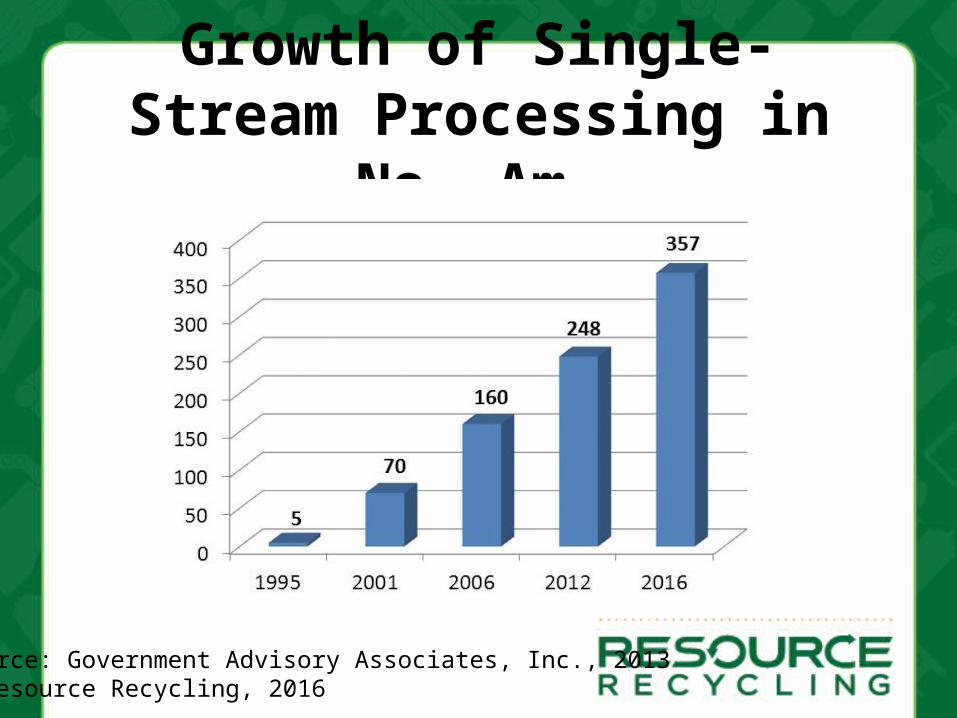
Growth of Single-Stream Processing in No. Am.
Source: Government Advisory Associates, Inc., 2013& Resource Recycling, 2016
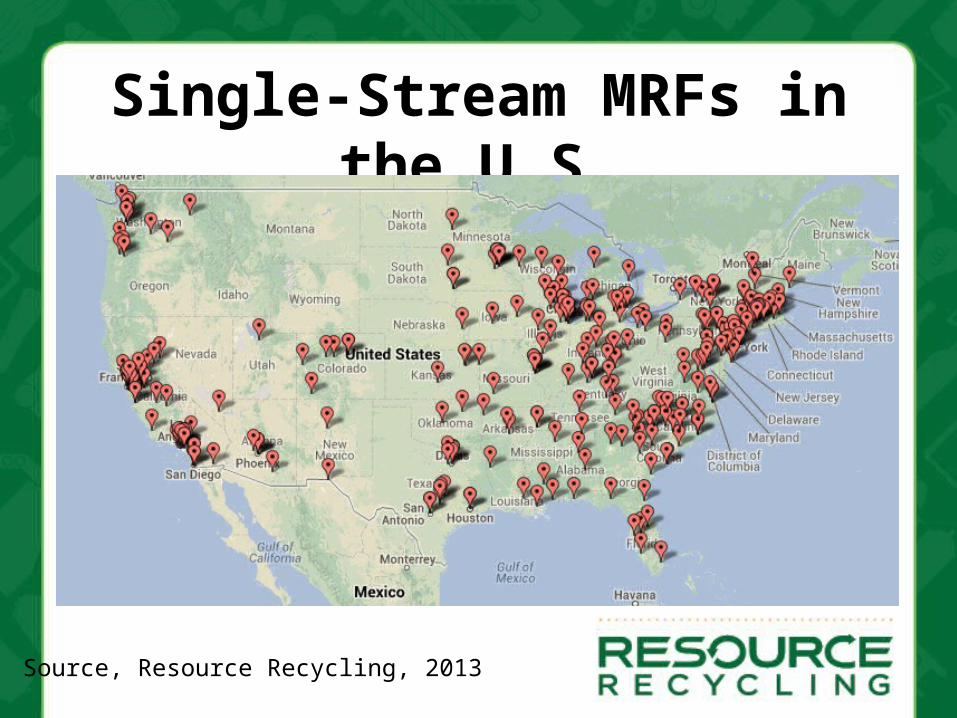
Single-Stream MRFs in the U.S.
• Map
Source, Resource Recycling, 2013

Increasing contamination
• According to WM figures, contamination of loads is an average of 16% of inbound tons.
• Contamination can be up to 50% of incoming loads• Processing costs continue to increase as markets demand reduced
contamination. This drives up cost to customers.
-
100,000
200,000
300,000
400,000
500,000
600,000
700,000
800,000
0.0%
2.0%
4.0%
6.0%
8.0%
10.0%
12.0%
14.0%
16.0%
18.0%
20.0%Contamination Percent
Inbound Tons Residue %
Source: Waste Management, 2015
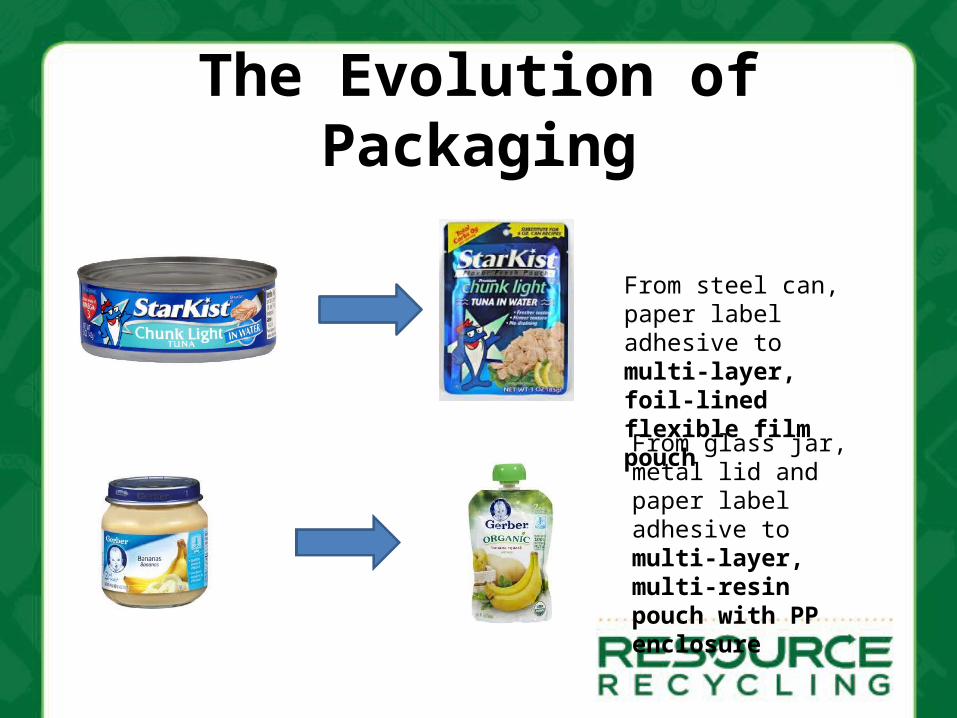
The Evolution of Packaging
From steel can, paper label adhesive to multi-layer, foil-lined flexible film pouch
From glass jar, metal lid and paper label adhesive to multi-layer, multi-resin pouch with PP enclosure
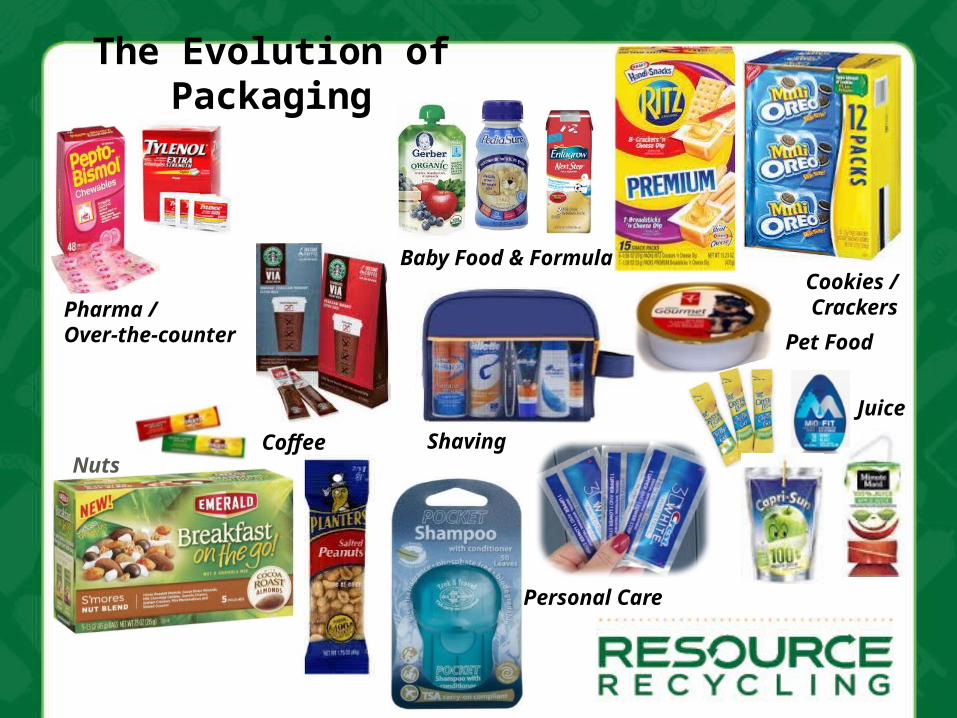
The Evolution of Packaging
Coffee
Cookies / CrackersPharma /
Over-the-counter
Personal Care
Pet Food
ShavingJuice
Baby Food & Formula
Nuts
Reframing Recycling in Sustainable Materials Management
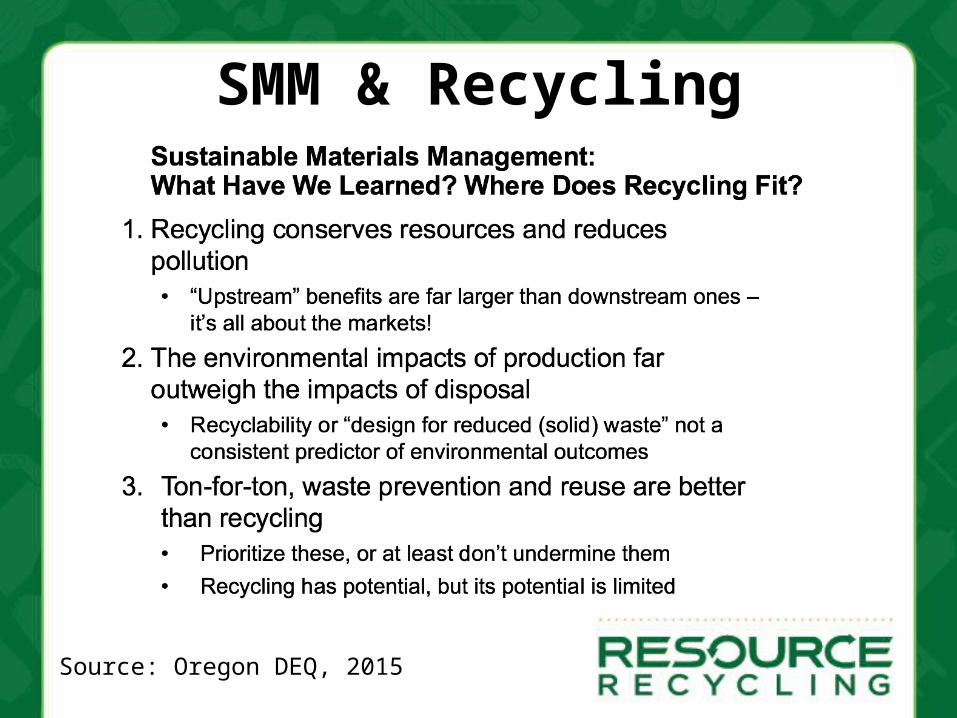
SMM & Recycling
Source: Oregon DEQ, 2015
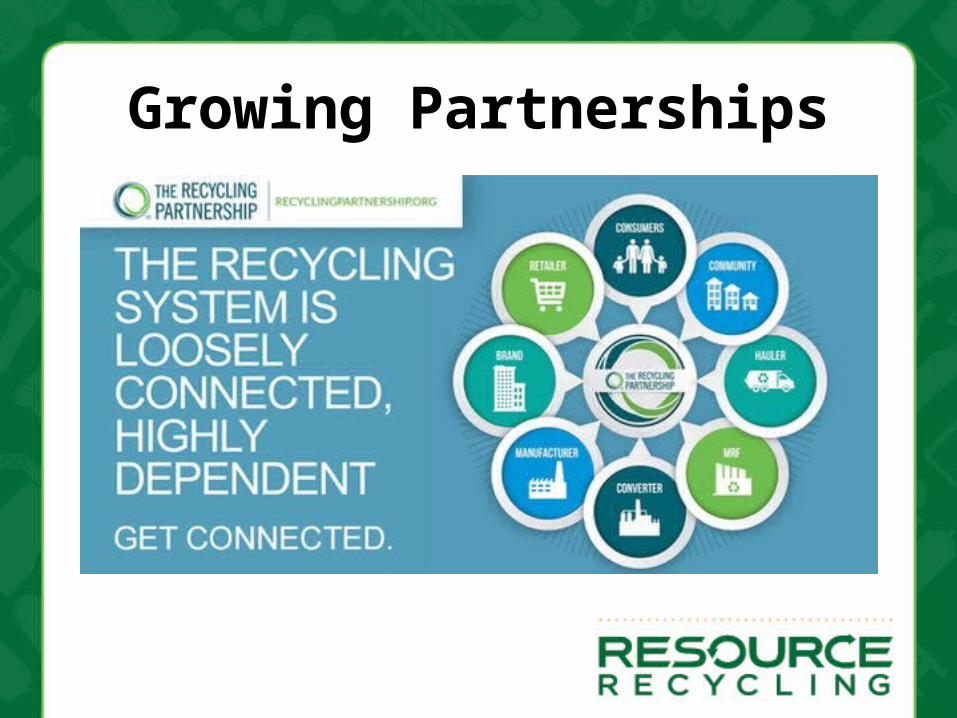
Growing Partnerships
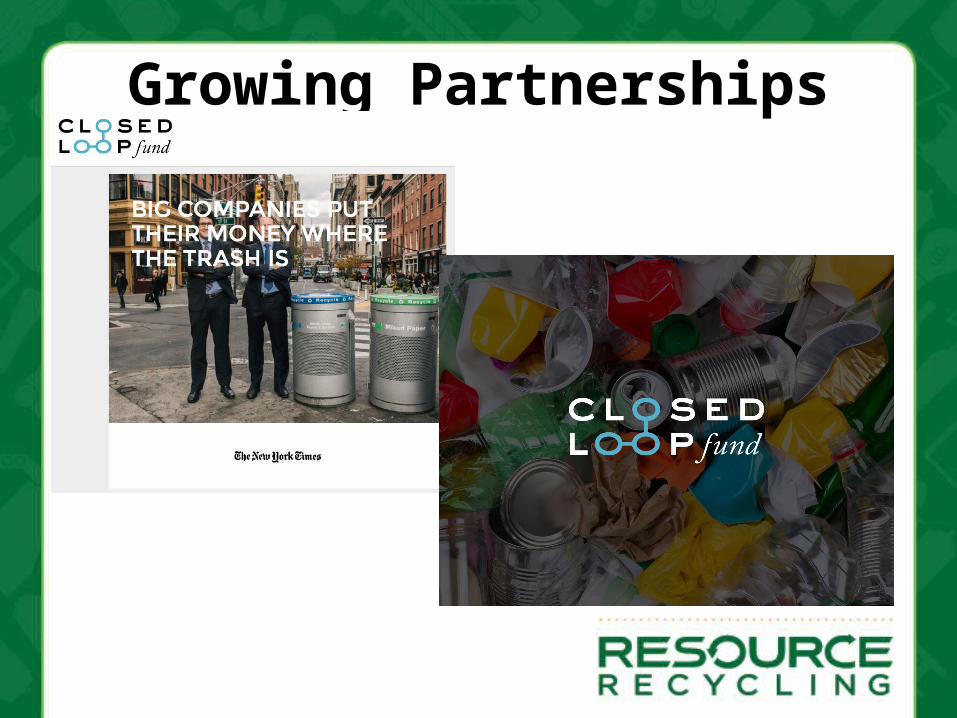
Growing Partnerships
And the Good News Is…• SE Asian Markets
Growing• Markets Cyclical• Low Oil Also Means
Fuel Savings • Increased
Partnerships/Industry Engagement
• Innovations Abound• Acting Local…
And Thank You!
Dylan de ThomasEditorial Director
Resource Recycling, [email protected]
503-309-5142Resource-Recycling.com