2016 NORTH CAROLINA TEACHER WORKING CONDITIONS SURVEY€¦ · conditions predict teacher plans to...
27
Report #IRPT-TNCTWC16-US-18-EN | www.newteachercenter.org 2016 NORTH CAROLINA TEACHER WORKING CONDITIONS SURVEY Student Achievement and Teacher Retention Analyses
Transcript of 2016 NORTH CAROLINA TEACHER WORKING CONDITIONS SURVEY€¦ · conditions predict teacher plans to...

Report #IRPT-TNCTWC16-US-18-EN | www.newteachercenter.org
2016 NORTH CAROLINA TEACHER WORKING CONDITIONS SURVEY
Student Achievement and Teacher Retention Analyses

2
In spring 2016, the North Carolina Department of Public Instruction
(NCDPI) collaborated with the North Carolina Association of
Educators and the New Teacher Center (NTC) to administer the
eighth biennial North Carolina Teacher Working Conditions (NC
TWC) Survey. The survey assesses whether educators across North
Carolina report having the resources and supports necessary to
ensure effective teaching.
The NC TWC Survey is a full-population survey based on the NTC
Teaching, Empowering, Leading and Learning (TELL) Survey first
developed in the North Carolina Governor’s Office in 2002. It has
since been replicated in more than 12 states and 10 districts to
collect critical data to support school improvement efforts.
Specifically, the survey was designed to report educators’
perceptions about the presence of teaching and learning
conditions organized into the following eight constructs: Time,
Facilities and Resources, Professional Development, School
Leadership, Teacher Leadership, Instructional Practices and
Support, Managing Student Conduct, and Community Support and
Involvement.
The purpose of this report is to help stakeholders better understand
the relationship between teaching conditions and outcomes of
interest in North Carolina. The following analyses examine the
association between 2016 survey data and student and teacher
outcomes, with an emphasis on highlighting the aspect of teaching
and learning conditions most related to student learning and
teacher attrition.
INTRODUCTION
The North Carolina TWC Survey is a full-population survey first developed in the North Carolina Governor’s Office in 2002. It has since been replicated in more than 20 states and captured the voices of more than 1.5 million educators, providing critical data to support school improvement efforts. Specifically, the survey is designed to report educators’ perceptions of teaching and learning conditions
organized into the following eight constructs:
Time
Facilities and Resources
Professional Development
School Leadership
Teacher Leadership
Instructional Practices and Support
Managing Student Conduct
Community Support and Involvement
See Appendix A for a list of survey items for
each construct.
ABOUT NC TWC

3
Connections Between Teaching Conditions and Student Learning
A positive school context, capable leadership, and a collaborative working environment facilitate teacher
success. In particular, research shows that strong, trusting relationships—both internal and external—and
supportive school leadership are linked to improved student achievement (Johnson, 2006; Bryk & Schneider,
2002). In addition, in schools where teachers talk to each other about their work and principals communicate
with the community, students have higher reading and mathematics test scores than students in schools
where these conditions are not as prevalent. Additionally, these conditions may have a greater impact on
test scores than the experience or credentials of the staff (Leana & Pil, 2006).
NTC TELL Survey data have been used to establish a link between staff perceptions of teaching and learning
conditions and student achievement (e.g., Ladd, 2009; Johnson, Kraft, and Papay, 2011; Ferguson & Hirsch,
2014). Recent work by Kraft and Papay (2014) found that teachers who work in more supportive environments
became more effective at raising student achievement on standardized tests over time than did teachers
who worked in less supportive environments, after controlling for student characteristics, prior test scores, and
teacher and school characteristics. They found that teachers in schools that had the most positive teaching
conditions (in the 75th percentile as measured by 24 questions in NTC’s TELL Survey) were 38 percent more
effective after a decade than teachers in schools in the 25th percentile. Over two years, teachers were 11
percent more effective if they worked in schools with positive teaching conditions.
Connections Between Teaching Conditions and Teacher Retention
A host of large-scale empirical studies provide evidence that contextual factors also matter in teachers’
decisions about staying or leaving schools. Results of a meta-analysis of 34 studies by Borman and Dowling
(2008) revealed that teaching and learning conditions influence teachers’ career paths more than previously
documented. Boyd et al. (2011) demonstrated that teachers’ perceptions of the school administration have
the greatest influence on teacher retention decisions. Other work finds similar effects (see, for example,
Pogodzinski, Youngs, Frank, & Belman, 2012). Several studies also find strong relationships between teachers’
perceptions of school facilities and their plans to stay or leave (Loeb, Darling-Hammond, & Luczak, 2005;
Buckley, Schneider, & Shang, 2004).
Using NTC TELL survey data, Johnson, Kraft, and Papay (2011) found that teachers were more satisfied and
planned to stay longer in schools with positive teaching conditions. Their work suggests that conditions such as
a trusting atmosphere, principal leadership, and collaborative colleagues are as important, or more
PROVIDING TEACHERS WITH THE BEST OPPORTUNITY TO BE EFFECTIVE
TEACHING AND LEARNING CONDITIONS ASSESSED BY THE NC TWC SURVEY
Elizabeth Cunningham
Highlight
Elizabeth Cunningham
Highlight
4
important, than conditions such as facilities and resources in influencing teachers’ decisions to stay in schools.
This finding holds true after controlling for student and school characteristics such as the percentage of
students categorized as low income. Ladd (2009), also using TELL data, found that teaching and learning
conditions predict teacher plans to leave a school, independent of school demographics.
This robust research foundation demonstrates a consistent link between teaching conditions and both student
achievement and teacher retention outcomes. The following analyses add to this work by analyzing 2016
North Carolina TWC Survey data. This brief provides a summary of survey participants and analyses of state-
and school-level data to help stakeholders understand which teaching conditions matter most in promoting
teacher and student success.
NTC administered the 2016 North Carolina TWC
Survey to all school-based licensed educators in
March 2016. The data for these analyses include
responses from more than 100,000 educators in
North Carolina, yielding a response rate of 86%. This
represents a three-percent decrease in response
rate compared to the 2014 administration of the
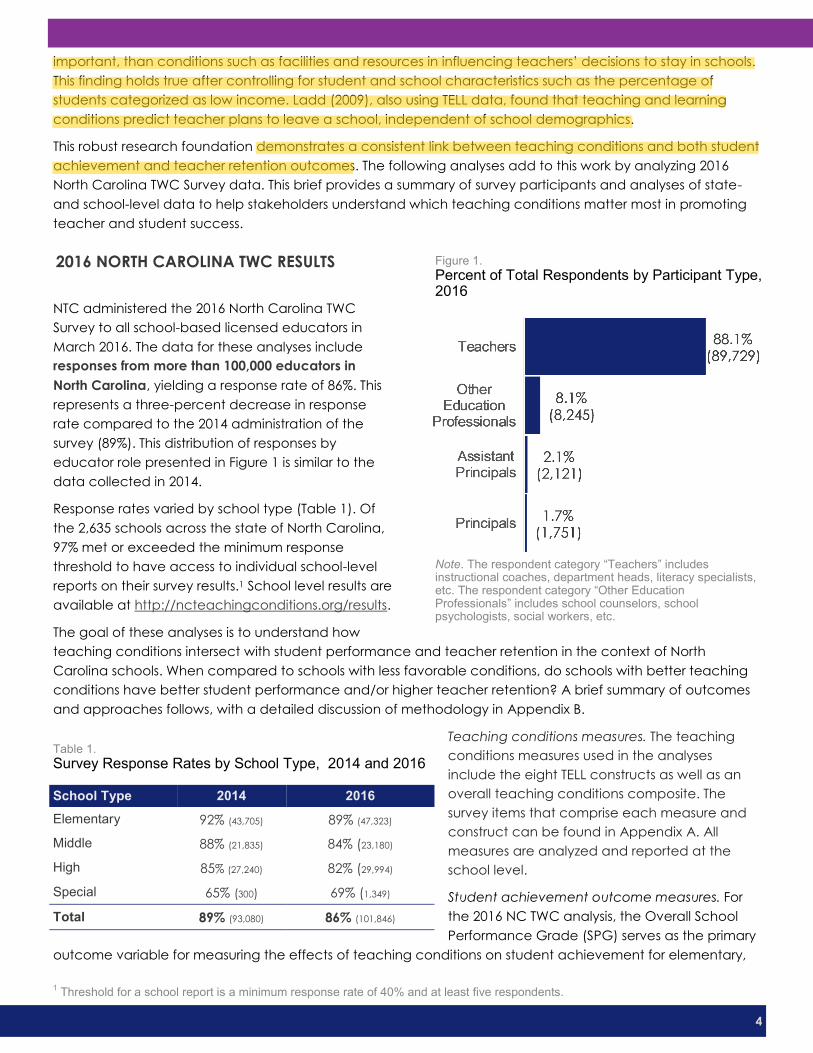
survey (89%). This distribution of responses by
educator role presented in Figure 1 is similar to the
data collected in 2014.
Response rates varied by school type (Table 1). Of
the 2,635 schools across the state of North Carolina,
97% met or exceeded the minimum response
threshold to have access to individual school-level
reports on their survey results.1 School level results are
available at http://ncteachingconditions.org/results.
The goal of these analyses is to understand how
teaching conditions intersect with student performance and teacher retention in the context of North
Carolina schools. When compared to schools with less favorable conditions, do schools with better teaching
conditions have better student performance and/or higher teacher retention? A brief summary of outcomes
and approaches follows, with a detailed discussion of methodology in Appendix B.
Teaching conditions measures. The teaching
conditions measures used in the analyses
include the eight TELL constructs as well as an
overall teaching conditions composite. The
survey items that comprise each measure and
construct can be found in Appendix A. All
measures are analyzed and reported at the
school level.
Student achievement outcome measures. For
the 2016 NC TWC analysis, the Overall School
Performance Grade (SPG) serves as the primary
outcome variable for measuring the effects of teaching conditions on student achievement for elementary,
2016 NORTH CAROLINA TWC RESULTS
Table 1.
Survey Response Rates by School Type, 2014 and 2016
School Type 2014 2016
Elementary 92% (43,705) 89% (47,323)
Middle 88% (21,835) 84% (23,180)
High 85% (27,240) 82% (29,994)
Special 65% (300) 69% (1,349)
Total 89% (93,080) 86% (101,846)
1 Threshold for a school report is a minimum response rate of 40% and at least five respondents.
Figure 1.
Percent of Total Respondents by Participant Type, 2016
Note. The respondent category “Teachers” includes instructional coaches, department heads, literacy specialists, etc. The respondent category “Other Education Professionals” includes school counselors, school psychologists, social workers, etc.
Elizabeth Cunningham
Highlight
Elizabeth Cunningham
Highlight
5
middle, and high schools. This measure is a combination of the School Achievement Score (based on student
achievement on NC EOG and EOC exams) and the school-level Growth Score (based on the EVAAS value-
added model). In addition, content-specific SPG scores are used to examine the effects of teaching
conditions on K-8 student achievement in Math and Reading. As there is no content-specific SPG score for
EOC exams, the EOC English 2 and Math 1 results for the 2015-16 school year are used in the content-specific
analyses for High Schools.
Teacher retention outcome measures. For the teacher retention analyses, school level attrition and mobility
rates were calculated using data provided by NCDPI.
Additional model variables. Regression models included additional variables of interest in order to (a) provide
a more complete picture of factors that influence both student achievement and teacher attrition, and (b) to
account for the variance attributed above and beyond those factors.
Using statistical approaches
appropriate for school-level
data, these analyses isolate the
effect of teaching conditions
from other factors that research
suggests are related to student
academic performance, such
as teacher and student
background characteristics. The
analyses combine school-level
data across elementary,
middle, and high schools for
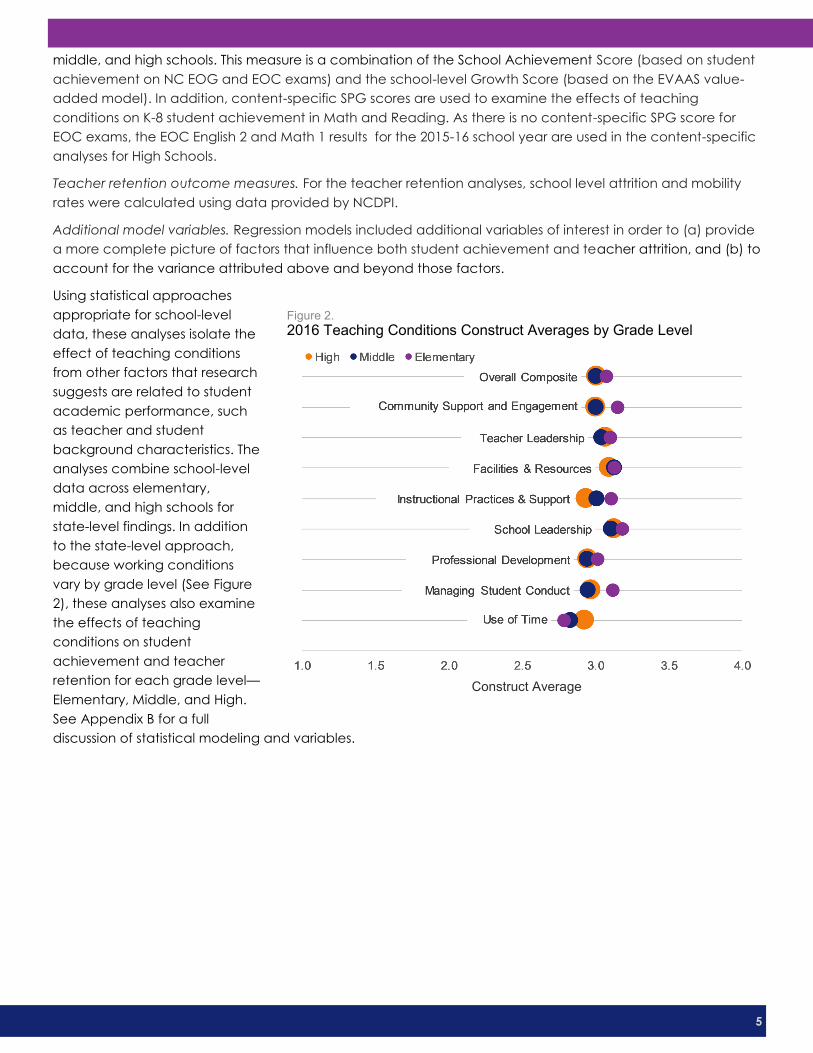
state-level findings. In addition
to the state-level approach,
because working conditions
vary by grade level (See Figure
2), these analyses also examine
the effects of teaching
conditions on student
achievement and teacher
retention for each grade level—
Elementary, Middle, and High.
See Appendix B for a full
discussion of statistical modeling and variables.
Figure 2.
2016 Teaching Conditions Construct Averages by Grade Level
Construct Average
6
HOW NORTH CAROLINA TEACHING CONDITIONS IMPACT SCHOOLS
RESULTS OF THE TEACHING CONDITIONS AND STUDENT ACHIEVEMENT ANALYSES
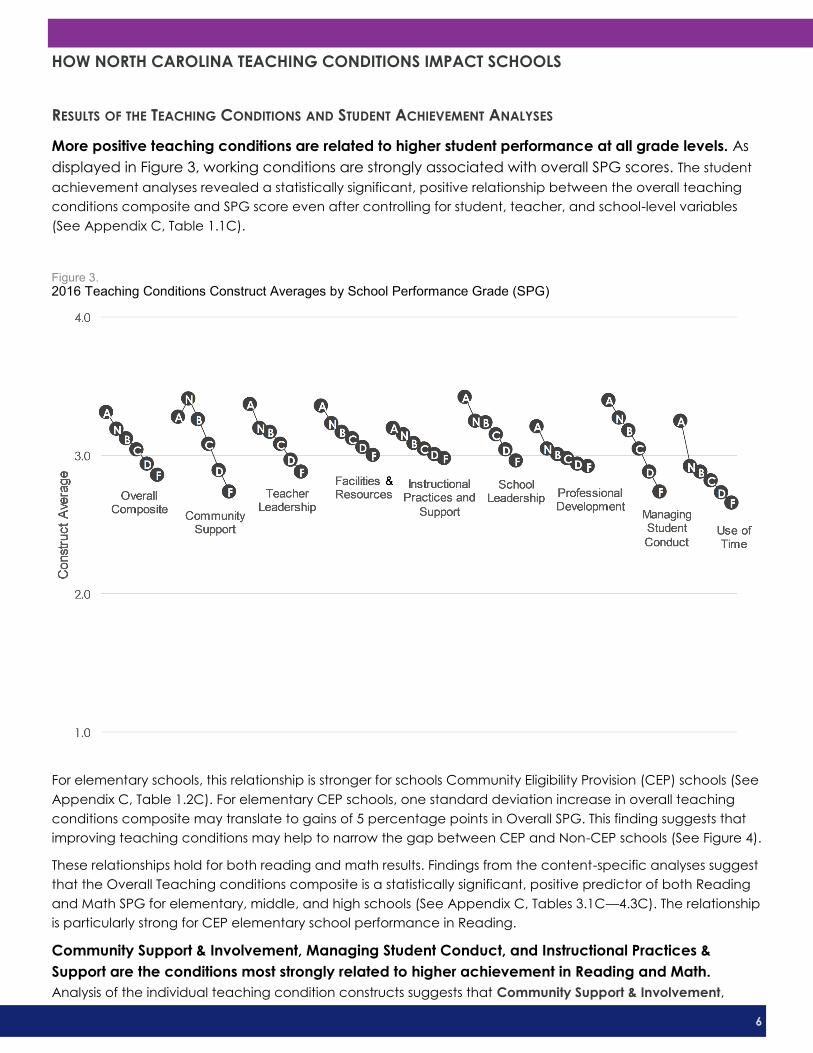
More positive teaching conditions are related to higher student performance at all grade levels. As
displayed in Figure 3, working conditions are strongly associated with overall SPG scores. The student
achievement analyses revealed a statistically significant, positive relationship between the overall teaching
conditions composite and SPG score even after controlling for student, teacher, and school-level variables
(See Appendix C, Table 1.1C).
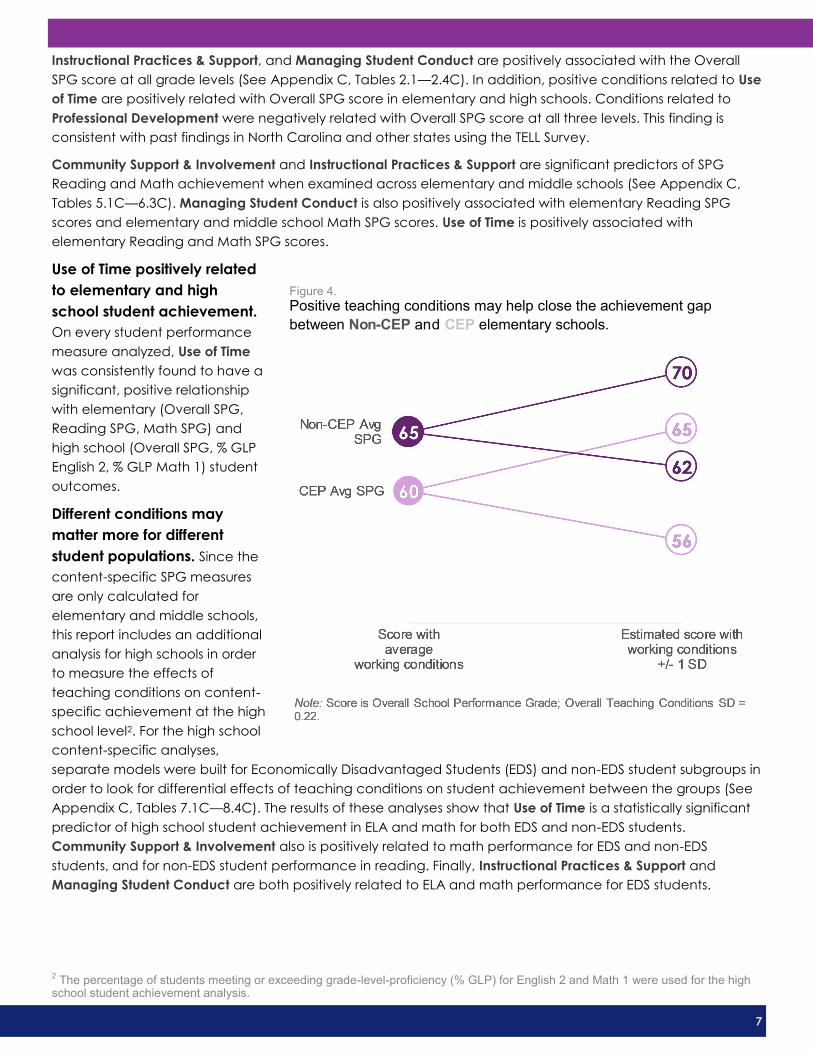
For elementary schools, this relationship is stronger for schools Community Eligibility Provision (CEP) schools (See
Appendix C, Table 1.2C). For elementary CEP schools, one standard deviation increase in overall teaching
conditions composite may translate to gains of 5 percentage points in Overall SPG. This finding suggests that
improving teaching conditions may help to narrow the gap between CEP and Non-CEP schools (See Figure 4).
These relationships hold for both reading and math results. Findings from the content-specific analyses suggest
that the Overall Teaching conditions composite is a statistically significant, positive predictor of both Reading
and Math SPG for elementary, middle, and high schools (See Appendix C, Tables 3.1C—4.3C). The relationship
is particularly strong for CEP elementary school performance in Reading.
Community Support & Involvement, Managing Student Conduct, and Instructional Practices &
Support are the conditions most strongly related to higher achievement in Reading and Math.
Analysis of the individual teaching condition constructs suggests that Community Support & Involvement,
Note: “N” represents the average for “A+NG” schools.
Figure 3.
2016 Teaching Conditions Construct Averages by School Performance Grade (SPG)
7
Instructional Practices & Support, and Managing Student Conduct are positively associated with the Overall
SPG score at all grade levels (See Appendix C, Tables 2.1—2.4C). In addition, positive conditions related to Use
of Time are positively related with Overall SPG score in elementary and high schools. Conditions related to
Professional Development were negatively related with Overall SPG score at all three levels. This finding is
consistent with past findings in North Carolina and other states using the TELL Survey.
Community Support & Involvement and Instructional Practices & Support are significant predictors of SPG
Reading and Math achievement when examined across elementary and middle schools (See Appendix C,
Tables 5.1C—6.3C). Managing Student Conduct is also positively associated with elementary Reading SPG
scores and elementary and middle school Math SPG scores. Use of Time is positively associated with
elementary Reading and Math SPG scores.
Use of Time positively related
to elementary and high
school student achievement.
On every student performance
measure analyzed, Use of Time
was consistently found to have a
significant, positive relationship
with elementary (Overall SPG,
Reading SPG, Math SPG) and
high school (Overall SPG, % GLP
English 2, % GLP Math 1) student
outcomes.
Different conditions may
matter more for different
student populations. Since the
content-specific SPG measures
are only calculated for
elementary and middle schools,
this report includes an additional
analysis for high schools in order
to measure the effects of
teaching conditions on content-
specific achievement at the high
school level2. For the high school
content-specific analyses,
separate models were built for Economically Disadvantaged Students (EDS) and non-EDS student subgroups in
order to look for differential effects of teaching conditions on student achievement between the groups (See
Appendix C, Tables 7.1C—8.4C). The results of these analyses show that Use of Time is a statistically significant
predictor of high school student achievement in ELA and math for both EDS and non-EDS students.
Community Support & Involvement also is positively related to math performance for EDS and non-EDS
students, and for non-EDS student performance in reading. Finally, Instructional Practices & Support and
Managing Student Conduct are both positively related to ELA and math performance for EDS students.
Figure 4.
Positive teaching conditions may help close the achievement gap
between Non-CEP and CEP elementary schools.
2 The percentage of students meeting or exceeding grade-level-proficiency (% GLP) for English 2 and Math 1 were used for the high school student achievement analysis.
8
TEACHING CONDITIONS AND TEACHER RETENTION ANALYSES
The relationship between teaching conditions and teacher retention was examined for all school level attrition
(“Overall Attrition”) as well as for teachers who specifically moved on as a classroom teacher at another NC
school (“Movers.”) Overall Attrition includes all Movers as well as teachers who left for any other reason (e.g.,
moved into another role, retired from teaching, decided to work in another sector, etc.)
In general, teacher working conditions matter for teacher retention—and even more so for
educators in Community Eligibility Provision (CEP) schools. Results suggest that schools with positive
teaching conditions have lower rates of teacher attrition— both in terms of Overall Attrition as well as
percentage of teachers leaving to teach at another school (Movers.) This relationship is more pronounced in
CEP schools (See Appendix D, Tables 1.1D and 3.1D).
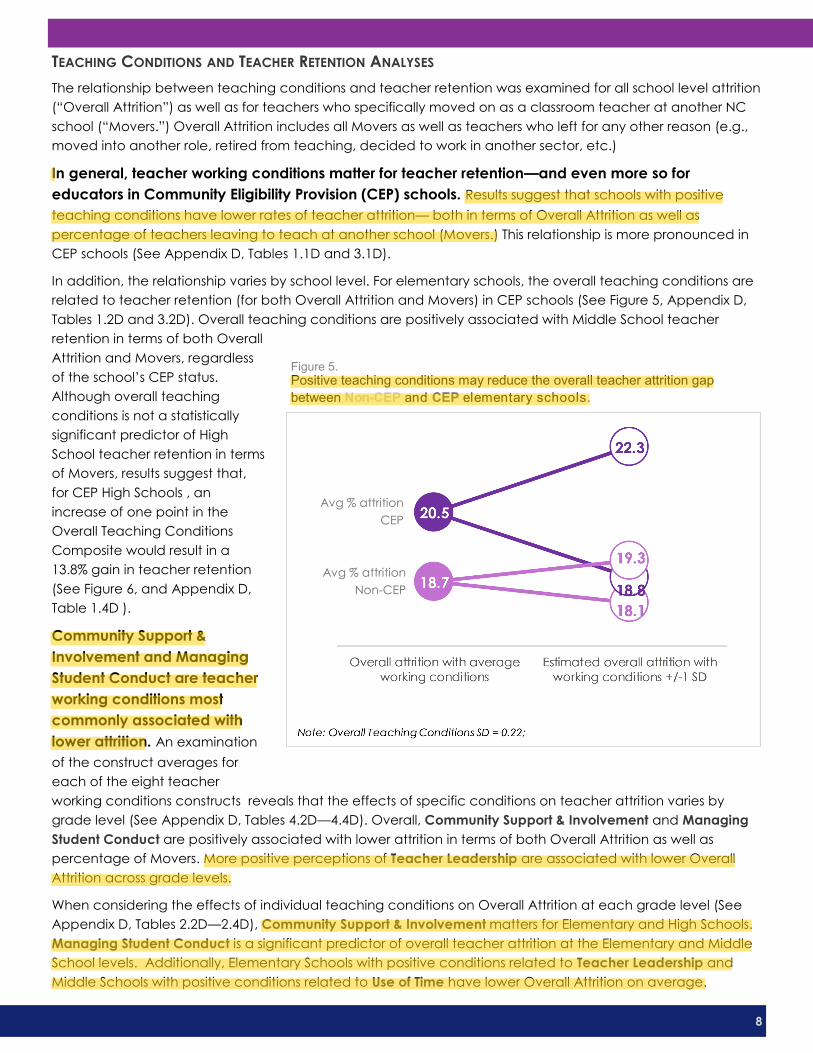
In addition, the relationship varies by school level. For elementary schools, the overall teaching conditions are
related to teacher retention (for both Overall Attrition and Movers) in CEP schools (See Figure 5, Appendix D,
Tables 1.2D and 3.2D). Overall teaching conditions are positively associated with Middle School teacher
retention in terms of both Overall
Attrition and Movers, regardless
of the school’s CEP status.
Although overall teaching
conditions is not a statistically
significant predictor of High
School teacher retention in terms
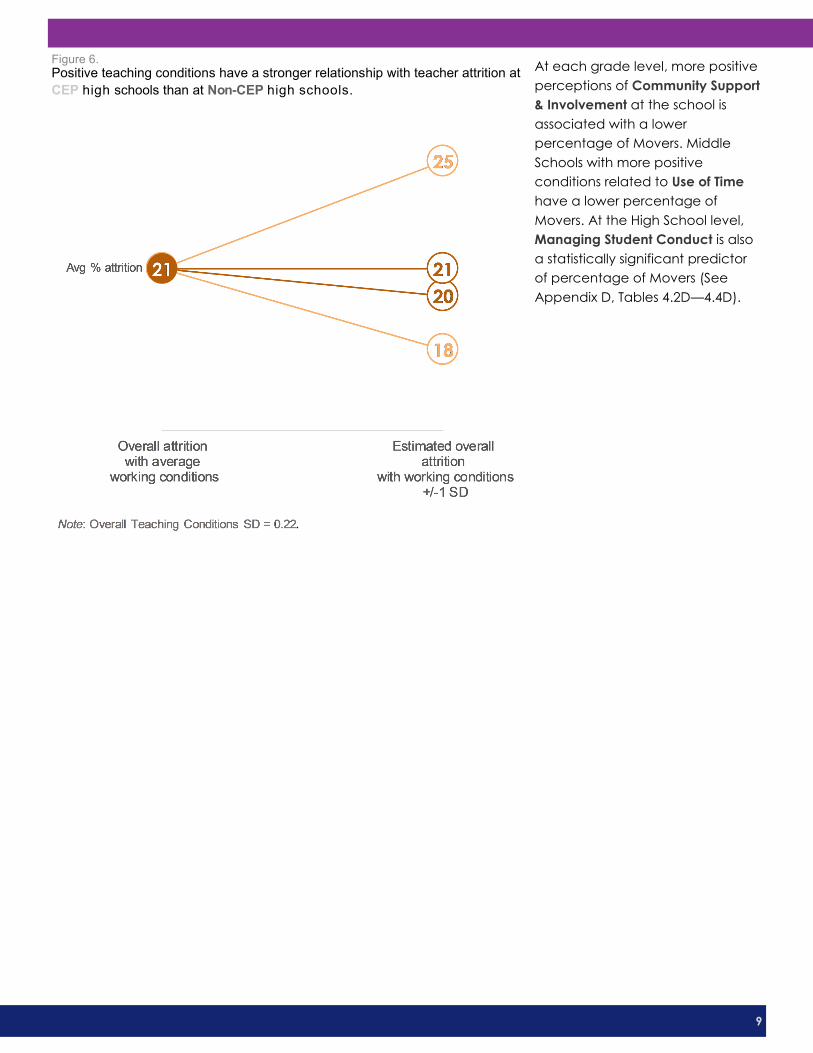
of Movers, results suggest that,
for CEP High Schools , an
increase of one point in the
Overall Teaching Conditions
Composite would result in a
13.8% gain in teacher retention
(See Figure 6, and Appendix D,
Table 1.4D ).
Community Support &
Involvement and Managing
Student Conduct are teacher
working conditions most
commonly associated with
lower attrition. An examination
of the construct averages for
each of the eight teacher
working conditions constructs reveals that the effects of specific conditions on teacher attrition varies by
grade level (See Appendix D, Tables 4.2D—4.4D). Overall, Community Support & Involvement and Managing
Student Conduct are positively associated with lower attrition in terms of both Overall Attrition as well as
percentage of Movers. More positive perceptions of Teacher Leadership are associated with lower Overall
Attrition across grade levels.
When considering the effects of individual teaching conditions on Overall Attrition at each grade level (See
Appendix D, Tables 2.2D—2.4D), Community Support & Involvement matters for Elementary and High Schools.
Managing Student Conduct is a significant predictor of overall teacher attrition at the Elementary and Middle
School levels. Additionally, Elementary Schools with positive conditions related to Teacher Leadership and
Middle Schools with positive conditions related to Use of Time have lower Overall Attrition on average.
Figure 5.
Positive teaching conditions may reduce the overall teacher attrition gap
between Non-CEP and CEP elementary schools.
Avg % attrition
CEP
Avg % attrition
Non-CEP
Elizabeth Cunningham
Highlight
Elizabeth Cunningham
Highlight
Elizabeth Cunningham
Highlight
Elizabeth Cunningham
Highlight
Elizabeth Cunningham
Highlight
Elizabeth Cunningham
Highlight
9
At each grade level, more positive
perceptions of Community Support
& Involvement at the school is
associated with a lower
percentage of Movers. Middle
Schools with more positive
conditions related to Use of Time
have a lower percentage of
Movers. At the High School level,
Managing Student Conduct is also
a statistically significant predictor
of percentage of Movers (See
Appendix D, Tables 4.2D—4.4D).
Figure 6.
Positive teaching conditions have a stronger relationship with teacher attrition at
CEP high schools than at Non-CEP high schools.
10
Summary
Overall, the analyses included in this report support the notion that teacher working conditions matter for
student achievement and teacher retention in North Carolina public schools. In particular cases, teaching
conditions appear to matter specifically for student performance and teacher retention in CEP schools.
Although results tend to vary across grade levels, there are few specific Teacher Working Conditions that
consistently rise to the top. The results from this study suggest that Community Support & Involvement is a
significant contributor to student achievement and teacher retention across grade levels. In addition,
Managing Student Conduct and Instructional Practices & Support are consistently associated with student
performance.
In addition to the importance of specific conditions varying by grade level, findings included in this report
suggest that different teaching conditions may matter for different student subgroups. Results suggest that
although Use of Time is a significant factor for both EDS and Non-EDS High School student achievement,
Community Support & Involvement is only statistically significant for the Non-EDS group, whereas Instructional
Practices & Support and Managing Student Conduct are significant predictors of EDS High School student
achievement.
Implications and Limitations
The analyses described above suggest that educators’ experience of their working conditions provide
valuable insight into some of the factors that influence student and staff success. Given these results, it would
be prudent for those in educational leadership positions to be mindful of the teacher working conditions in
their school(s) and/or district. Furthermore, the findings from these analyses highlight the importance of
understanding local context. The variation in the effects of teaching conditions across school levels and
student subgroups evidenced in this study should also serve as a reminder that there is no one-size-fits all
solution to improving teacher working conditions. There are many different aspects that make up the
conditions for any given school, each of which can have their own unique implications for the teachers and
students in the school.
The comparison of the EDS and Non-EDS High School student performance revealed differences between
student subgroups in terms of which improvements in working conditions are more likely to impact student
achievement. However, teaching conditions represent only a few of the factors that influence student
success, and future work should continue to explore these relationships.
Elizabeth Cunningham
Highlight
11
Borman, G., & Dowling, N. (2008). Teacher attrition and retention: A meta-analytic and narrative review of the
research. Review of Educational Research, 78(3), 367–409.
Boyd, D., Grossman, P., Ing, M., Lankford, H., Loeb, S., & Wyckoff, J. (2011). The influence of school administra-
tors on teacher retention decisions. American Educational Research Journal, 48(2), 303–333.
Buckley, J., Schneider, M., & Shang, Y. (2004). The effects of school facility quality on teacher retention in ur-
ban school districts. Chestnut Hill, MA: National Clearinghouse for Educational Facilities.
Bryk, A. S., & Schneider, B. (2002). Trust in schools: A core resource for improvement. New York: Russell Safe
Foundation.
Cortina, J. (2002). Big things have small beginnings: An assortment of “minor” methodological misunderstand-
ings. Journal of Management, 28(3), 339–362.
Ferguson, R., (with Hirsch, E.) (2014). How working conditions predict teaching quality and student outcomes.
In T. J. Kane, K. A. Kerr, and R. C. Pianta (Eds.), Designing teacher evaluation systems: New guidance from
the Measures of Effective Teaching project (pp. 332–381). San Francisco: Jossey-Bass.
IDRA Research Technology Group. (n.d.) Annotated SPSS output factor analysis. Retrieved from http://
www.ats.ucla.edu/stat/spss/output/factor1.htm
Ingersoll, R., Dougherty, P., & Sirinides, P. (2017). School Leadership Counts: Instructional Leadership for Student
Success. Research Report. University of Pennsylvania Consortium for Policy Research in Education.
Johnson, S., Kraft, M., & Papay, J. (2011). How context matters in high-need schools: The effects of teachers’
working conditions on their professional satisfaction and their students’ achievement. Teachers College
Record, 114(10), 1–39.
Johnson, S. M. (2006, July). The workplace matters: Teacher quality, retention, and effectiveness. NEA Working
Paper. Washington, DC: National Education Association.
Johnson, S. M., & the Project on the Next Generation of Teachers. (2004). Finders and keepers: Helping new
teachers survive and thrive in our schools. San Francisco: Jossey-Bass.
Kraft, M. A., & Papay, J. P. (2014, Jan. 30). Can professional environments in schools promote teacher devel-
opment? Explaining heterogeneity in returns to teaching experience. Educational Evaluation and Policy
Analysis, 36(4), 476–500.
Ladd, H. (2009). Teachers’ perceptions of their working conditions: How predictive of policyrelevant out-
comes? CALDER Working Paper 33. Washington, DC: National Center for Analysis of Longitudinal Data in
Education.
Leana, C. R., & Pil, F. K. (2006). Social capital and organizational performance: Evidence from urban public
schools. Organization Science, 17(3), 353–366.
Loeb, S., Darling-Hammond, L., & Luczak, J. (2005). How teaching conditions predict teacher turnover in Cali-
fornia schools. Peabody Journal of Education, 80(3), 44–70.
McLaughlin, M. W., & Talbert, J. E. (2001). Professional communities and the work of high school teaching. Chi-
cago: University of Chicago Press.
New Teacher Center. (2014). The Impact of Teaching and Learning Conditions on Student Performance and
Future Employment Plans. Santa Cruz, CA: New Teacher Center. Retrieved from http://www.tellmass.org/
uploads/File/MA12_brief_ach_ret.pdf.
Pogodzinski, B., Youngs, P., Frank, K., & Belman, D. (2012). Administrative climate and novice teachers’ intent
to remain teaching. The Elementary School Journal, 113(2), 252–275.
Steele, J., Hamilton, L., & Stecher, B. (2010). Incorporating student performance measures into teacher evalua-
tion systems. Santa Monica, CA: RAND Corporation.
REFERENCES AND ADDITIONAL READINGS
47
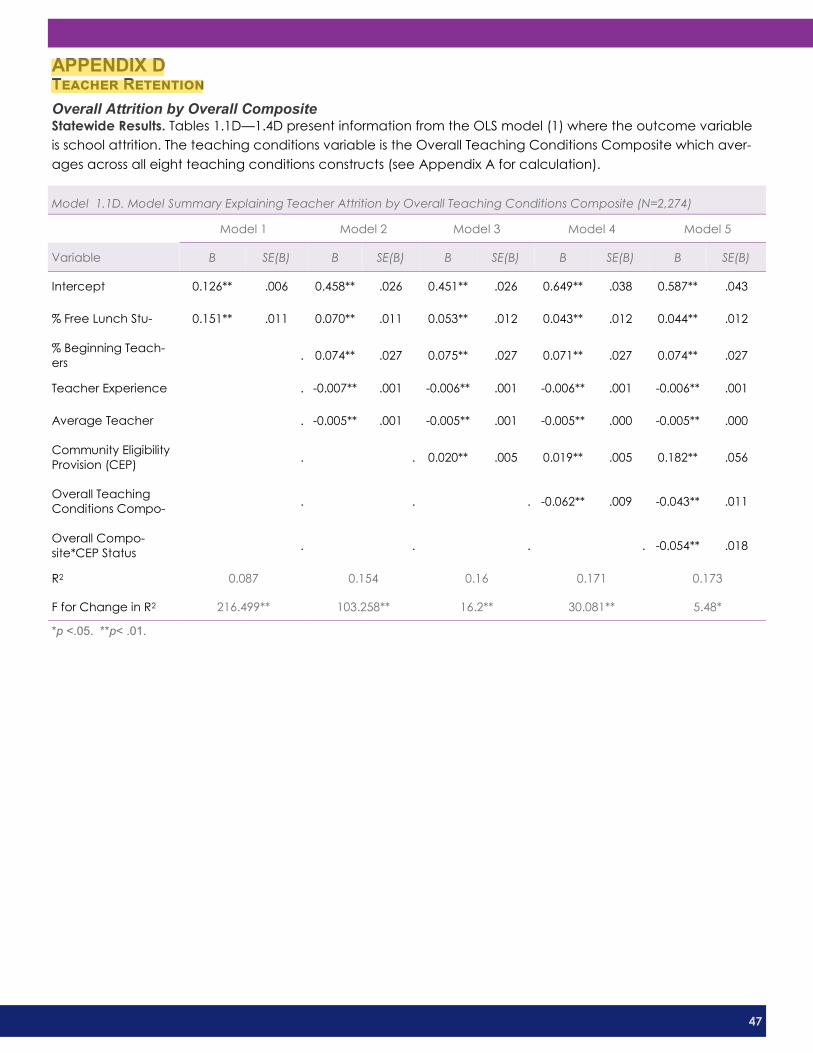
APPENDIX D Teacher Retention
Overall Attrition by Overall Composite Statewide Results. Tables 1.1D—1.4D present information from the OLS model (1) where the outcome variable
is school attrition. The teaching conditions variable is the Overall Teaching Conditions Composite which aver-
ages across all eight teaching conditions constructs (see Appendix A for calculation).
Model 1.1D. Model Summary Explaining Teacher Attrition by Overall Teaching Conditions Composite (N=2,274)
Model 1 Model 2 Model 3 Model 4 Model 5
Variable B SE(B) B SE(B) B SE(B) B SE(B) B SE(B)
Intercept 0.126** .006 0.458** .026 0.451** .026 0.649** .038 0.587** .043
% Free Lunch Stu- 0.151** .011 0.070** .011 0.053** .012 0.043** .012 0.044** .012
% Beginning Teach-
ers . 0.074** .027 0.075** .027 0.071** .027 0.074** .027
Teacher Experience . -0.007** .001 -0.006** .001 -0.006** .001 -0.006** .001
Average Teacher . -0.005** .001 -0.005** .001 -0.005** .000 -0.005** .000
Community Eligibility
Provision (CEP) . . 0.020** .005 0.019** .005 0.182** .056
Overall Teaching
Conditions Compo-. . . -0.062** .009 -0.043** .011
Overall Compo-
site*CEP Status . . . . -0.054** .018
R2 0.087 0.154 0.16 0.171 0.173
F for Change in R2 216.499** 103.258** 16.2** 30.081** 5.48*
*p <.05. **p< .01.
Elizabeth Cunningham
Highlight
48
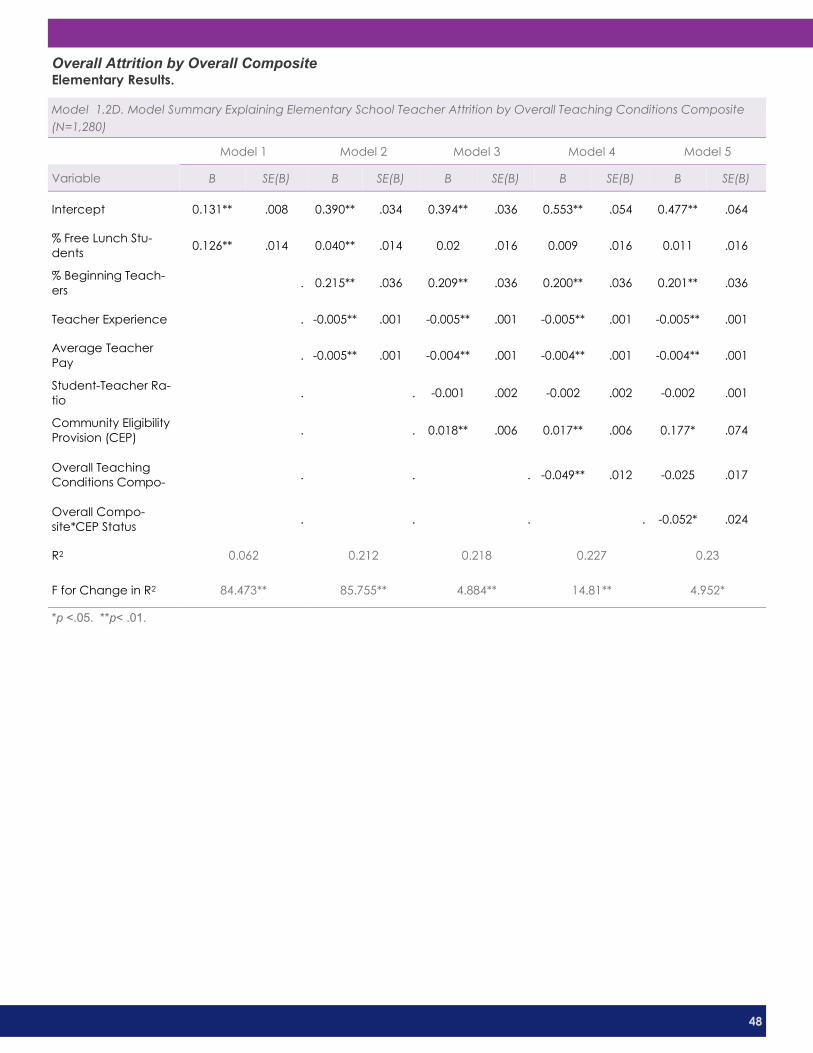
Overall Attrition by Overall Composite Elementary Results.
Model 1.2D. Model Summary Explaining Elementary School Teacher Attrition by Overall Teaching Conditions Composite
(N=1,280)
Model 1 Model 2 Model 3 Model 4 Model 5
Variable B SE(B) B SE(B) B SE(B) B SE(B) B SE(B)
Intercept 0.131** .008 0.390** .034 0.394** .036 0.553** .054 0.477** .064
% Free Lunch Stu-
dents 0.126** .014 0.040** .014 0.02 .016 0.009 .016 0.011 .016
% Beginning Teach-
ers . 0.215** .036 0.209** .036 0.200** .036 0.201** .036
Teacher Experience . -0.005** .001 -0.005** .001 -0.005** .001 -0.005** .001
Average Teacher
Pay . -0.005** .001 -0.004** .001 -0.004** .001 -0.004** .001
Student-Teacher Ra-
tio . . -0.001 .002 -0.002 .002 -0.002 .001
Community Eligibility
Provision (CEP) . . 0.018** .006 0.017** .006 0.177* .074
Overall Teaching
Conditions Compo-. . . -0.049** .012 -0.025 .017
Overall Compo-
site*CEP Status . . . . -0.052* .024
R2 0.062 0.212 0.218 0.227 0.23
F for Change in R2 84.473** 85.755** 4.884** 14.81** 4.952*
*p <.05. **p< .01.

49
Overall Attrition by Overall Composite Middle School Results.
Model 1.3D. Model Summary Explaining Middle School Teacher Attrition by Overall Teaching Conditions Composite
(N=483)
Model 1 Model 2 Model 3 Model 4
Variable B SE(B) B SE(B) B SE(B) B SE(B)
Intercept 0.100** .013 0.515** .055 0.506** .055 0.705** .079
% Free Lunch Students 0.240** .025 0.140** .027 0.116** .028 0.107** .028
Teacher Experience . -0.005** .002 -0.004* .002 -0.004* .002
Average Teacher Pay . -0.007** .001 -0.007** .001 -0.007** .001
Community Eligibility Provision (CEP) . . 0.029** .010 0.029** .010
Overall Teaching Conditions Composite . . . -0.068** .019
R2 0.162 0.256 0.267 0.286
F for Change in R2 92.986** 54.939** 7.173** 12.693**
*p <.05. **p< .01.

50
Overall Attrition by Overall Composite High School Results.
Model 1.4D. Model Summary Explaining High School Teacher Attrition by Overall Teaching Conditions Composite (N=457)
Model 1 Model 2 Model 3 Model 4 Model 5
Variable B SE(B) B SE(B) B SE(B) B SE(B) B SE(B)
Intercept 0.113** .013 0.398** .051 0.388** .051 0.510** .077 0.424** .082
% Free Lunch Stu- 0.185** .029 0.130** .029 0.121** .030 0.107** .030 0.108** .030
Teacher Experience . -0.006** .002 -0.006** .002 -0.006** .002 -0.006** .002
Average Teacher . -0.004** .001 -0.004** .001 -0.004** .001 -0.004** .001
Community Eligibility . . 0.019 .011 0.017 .011 0.426** .133
Overall Teaching
Conditions Compo-. . . -0.036* .017 -0.012 .019
Overall Compo-
site*CEP Status . . . . -0.138** .045
R2 0.085 0.163 0.168 0.176 0.193
F for Change in R2 42.268** 29.406** 2.716 4.379* 9.48**
*p <.05. **p< .01.
51
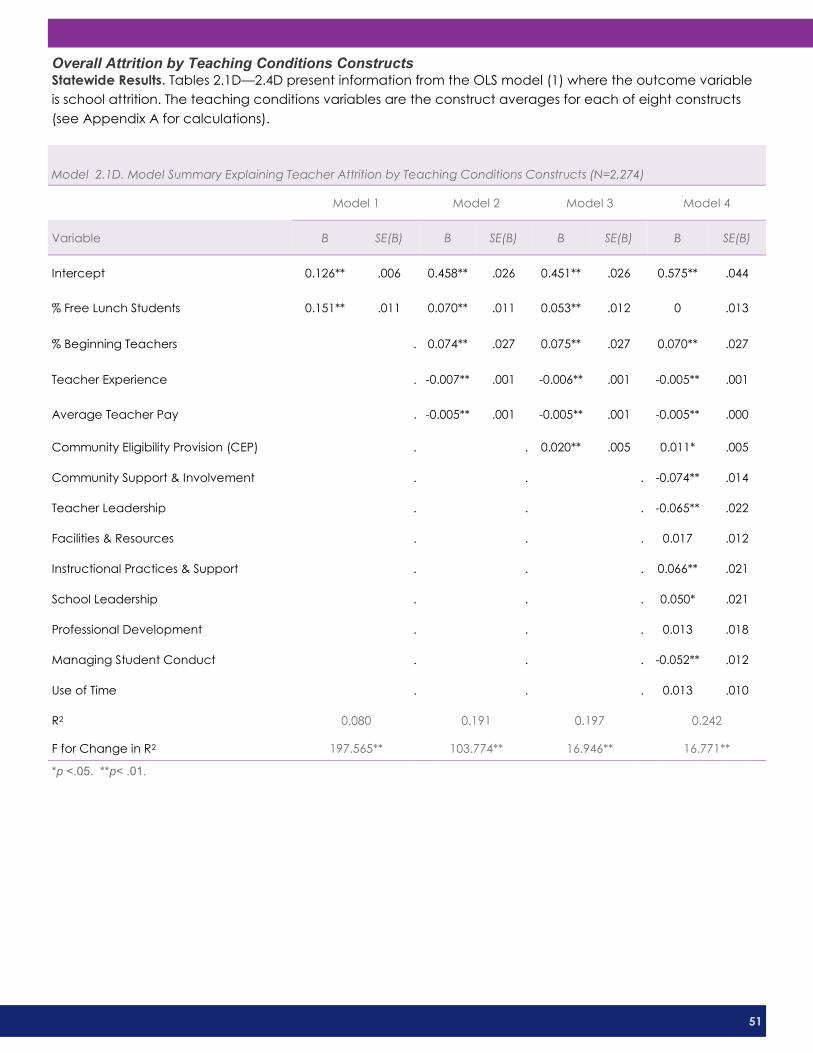
Overall Attrition by Teaching Conditions Constructs Statewide Results. Tables 2.1D—2.4D present information from the OLS model (1) where the outcome variable
is school attrition. The teaching conditions variables are the construct averages for each of eight constructs
(see Appendix A for calculations).
Model 2.1D. Model Summary Explaining Teacher Attrition by Teaching Conditions Constructs (N=2,274)
Model 1 Model 2 Model 3 Model 4
Variable B SE(B) B SE(B) B SE(B) B SE(B)
Intercept 0.126** .006 0.458** .026 0.451** .026 0.575** .044
% Free Lunch Students 0.151** .011 0.070** .011 0.053** .012 0 .013
% Beginning Teachers . 0.074** .027 0.075** .027 0.070** .027
Teacher Experience . -0.007** .001 -0.006** .001 -0.005** .001
Average Teacher Pay . -0.005** .001 -0.005** .001 -0.005** .000
Community Eligibility Provision (CEP) . . 0.020** .005 0.011* .005
Community Support & Involvement . . . -0.074** .014
Teacher Leadership . . . -0.065** .022
Facilities & Resources . . . 0.017 .012
Instructional Practices & Support . . . 0.066** .021
School Leadership . . . 0.050* .021
Professional Development . . . 0.013 .018
Managing Student Conduct . . . -0.052** .012
Use of Time . . . 0.013 .010
R2 0.080 0.191 0.197 0.242
F for Change in R2 197.565** 103.774** 16.946** 16.771**
*p <.05. **p< .01.
52
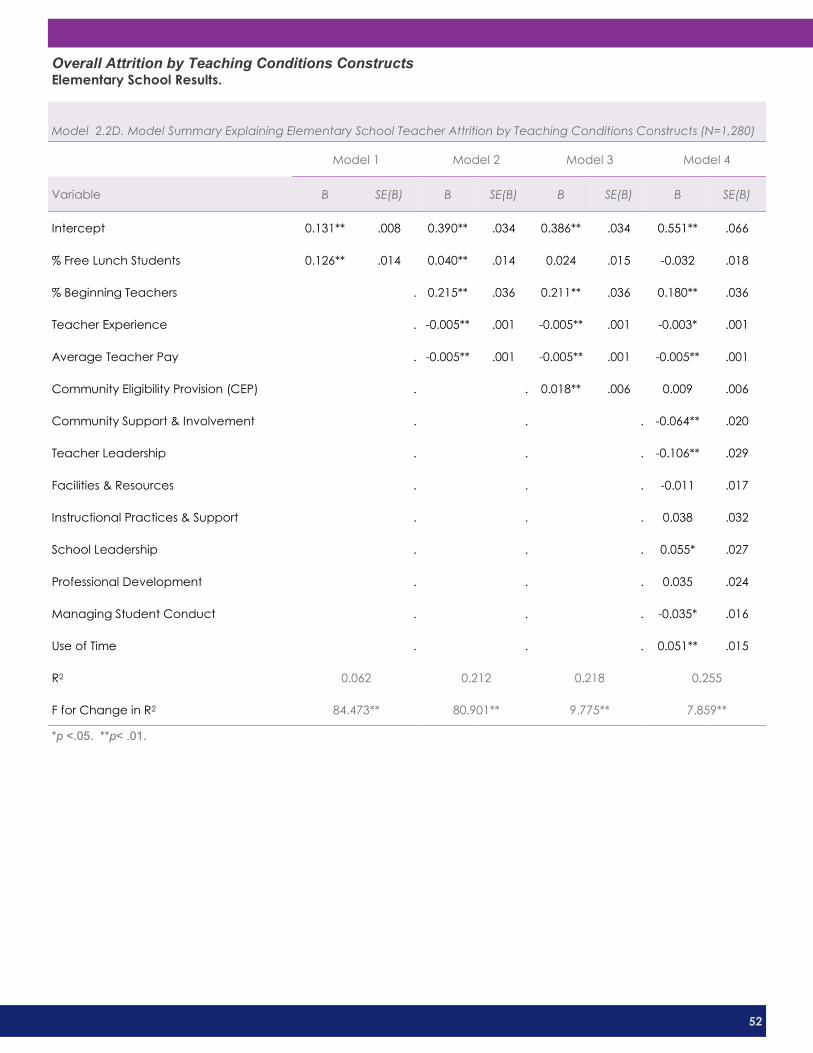
Overall Attrition by Teaching Conditions Constructs Elementary School Results.
Model 2.2D. Model Summary Explaining Elementary School Teacher Attrition by Teaching Conditions Constructs (N=1,280)
Model 1 Model 2 Model 3 Model 4
Variable B SE(B) B SE(B) B SE(B) B SE(B)
Intercept 0.131** .008 0.390** .034 0.386** .034 0.551** .066
% Free Lunch Students 0.126** .014 0.040** .014 0.024 .015 -0.032 .018
% Beginning Teachers . 0.215** .036 0.211** .036 0.180** .036
Teacher Experience . -0.005** .001 -0.005** .001 -0.003* .001
Average Teacher Pay . -0.005** .001 -0.005** .001 -0.005** .001
Community Eligibility Provision (CEP) . . 0.018** .006 0.009 .006
Community Support & Involvement . . . -0.064** .020
Teacher Leadership . . . -0.106** .029
Facilities & Resources . . . -0.011 .017
Instructional Practices & Support . . . 0.038 .032
School Leadership . . . 0.055* .027
Professional Development . . . 0.035 .024
Managing Student Conduct . . . -0.035* .016
Use of Time . . . 0.051** .015
R2 0.062 0.212 0.218 0.255
F for Change in R2 84.473** 80.901** 9.775** 7.859**
*p <.05. **p< .01.

53
Overall Attrition by Teaching Conditions Constructs Middle School Results.
Model 2.3D. Model Summary Explaining Middle School Teacher Attrition by Teaching Conditions Constructs (N=483)
Model 1 Model 2 Model 3 Model 4
Variable B SE(B) B SE(B) B SE(B) B SE(B)
Intercept 0.100** .013 0.515** .055 0.506** .055 0.439** .102
% Free Lunch Students 0.240** .025 0.140** .027 0.116** .028 0.105** .034
Teacher Experience . -0.005** .002 -0.004* .002 -0.003 .002
Average Teacher Pay . -0.007** .001 -0.007** .001 -0.008** .001
Community Eligibility Provision (CEP) . . 0.029** .010 0.023* .010
Community Support & Involvement . . . -0.004 .032
Teacher Leadership . . . -0.09 .051
Facilities & Resources . . . 0.037 .027
Instructional Practices & Support . . . 0.135** .046
School Leadership . . . 0.108* .049
Professional Development . . . -0.025 .038
Managing Student Conduct . . . -0.083** .025
Use of Time . . . -0.065* .025
R2 0.162 0.256 0.267 0.327
F for Change in R2 92.986** 30.259** 7.173** 5.238**
*p <.05. **p< .01.

54
Overall Attrition by Teaching Conditions Constructs High School Results.
Model 2.4D. Model Summary Explaining High School Teacher Attrition by Teaching Conditions Constructs (N=457)
Model 1 Model 2 Model 3
Variable B SE(B) B SE(B) B SE(B)
Intercept 0.113** .013 0.398** .051 0.491** .096
% Free Lunch Students 0.185** .029 0.130** .029 0.066 .035
Teacher Experience . -0.006** .002 -0.006** .002
Average Teacher Pay . -0.004** .001 -0.004** .001
Community Support & Involvement . . -0.071* .029
Teacher Leadership . . -0.02 .049
Facilities & Resources . . 0.034 .025
Instructional Practices & Support . . 0.051 .044
School Leadership . . 0.031 .050
Professional Development . . 0.005 .036
Managing Student Conduct . . -0.041 .026
Use of Time . . -0.016 .025
R2 0.085 0.163 0.195
F for Change in R2 42.268** 21.108** 2.211*
*p <.05. **p< .01.
55
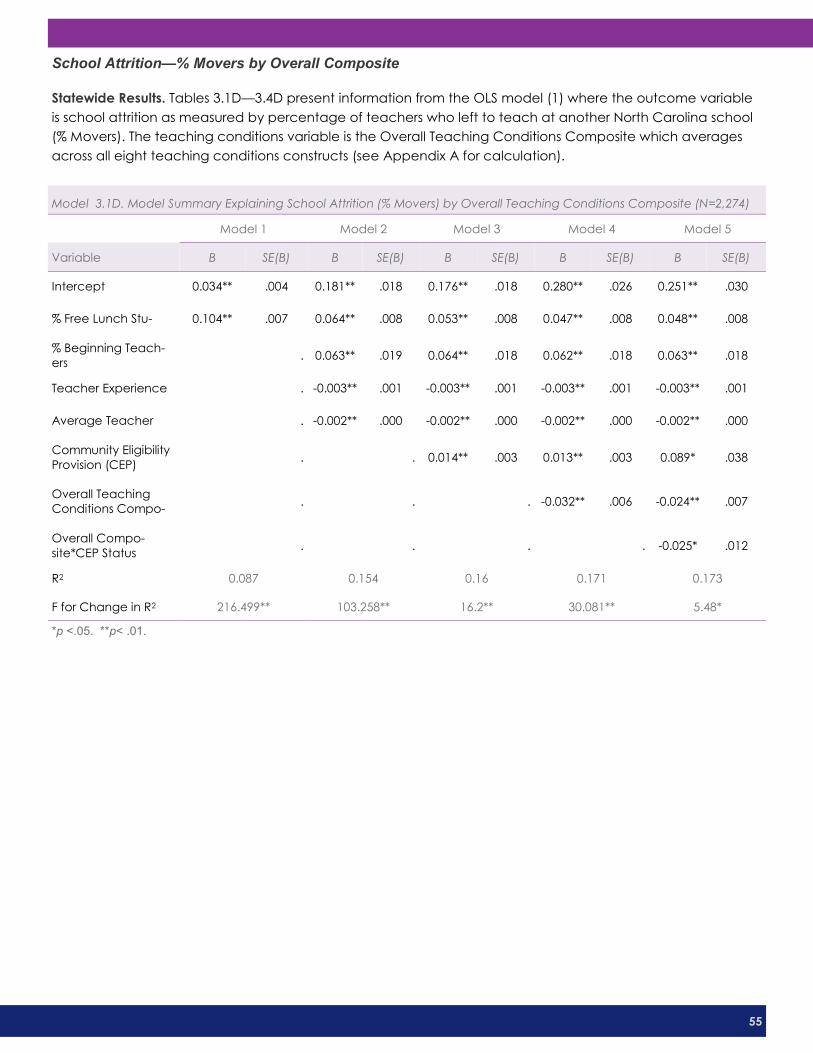
School Attrition—% Movers by Overall Composite
Statewide Results. Tables 3.1D—3.4D present information from the OLS model (1) where the outcome variable
is school attrition as measured by percentage of teachers who left to teach at another North Carolina school
(% Movers). The teaching conditions variable is the Overall Teaching Conditions Composite which averages
across all eight teaching conditions constructs (see Appendix A for calculation).
Model 3.1D. Model Summary Explaining School Attrition (% Movers) by Overall Teaching Conditions Composite (N=2,274)
Model 1 Model 2 Model 3 Model 4 Model 5
Variable B SE(B) B SE(B) B SE(B) B SE(B) B SE(B)
Intercept 0.034** .004 0.181** .018 0.176** .018 0.280** .026 0.251** .030
% Free Lunch Stu- 0.104** .007 0.064** .008 0.053** .008 0.047** .008 0.048** .008
% Beginning Teach-
ers . 0.063** .019 0.064** .018 0.062** .018 0.063** .018
Teacher Experience . -0.003** .001 -0.003** .001 -0.003** .001 -0.003** .001
Average Teacher . -0.002** .000 -0.002** .000 -0.002** .000 -0.002** .000
Community Eligibility
Provision (CEP) . . 0.014** .003 0.013** .003 0.089* .038
Overall Teaching
Conditions Compo- . . . -0.032** .006 -0.024** .007
Overall Compo-
site*CEP Status . . . . -0.025* .012
R2 0.087 0.154 0.16 0.171 0.173
F for Change in R2 216.499** 103.258** 16.2** 30.081** 5.48*
*p <.05. **p< .01.
56
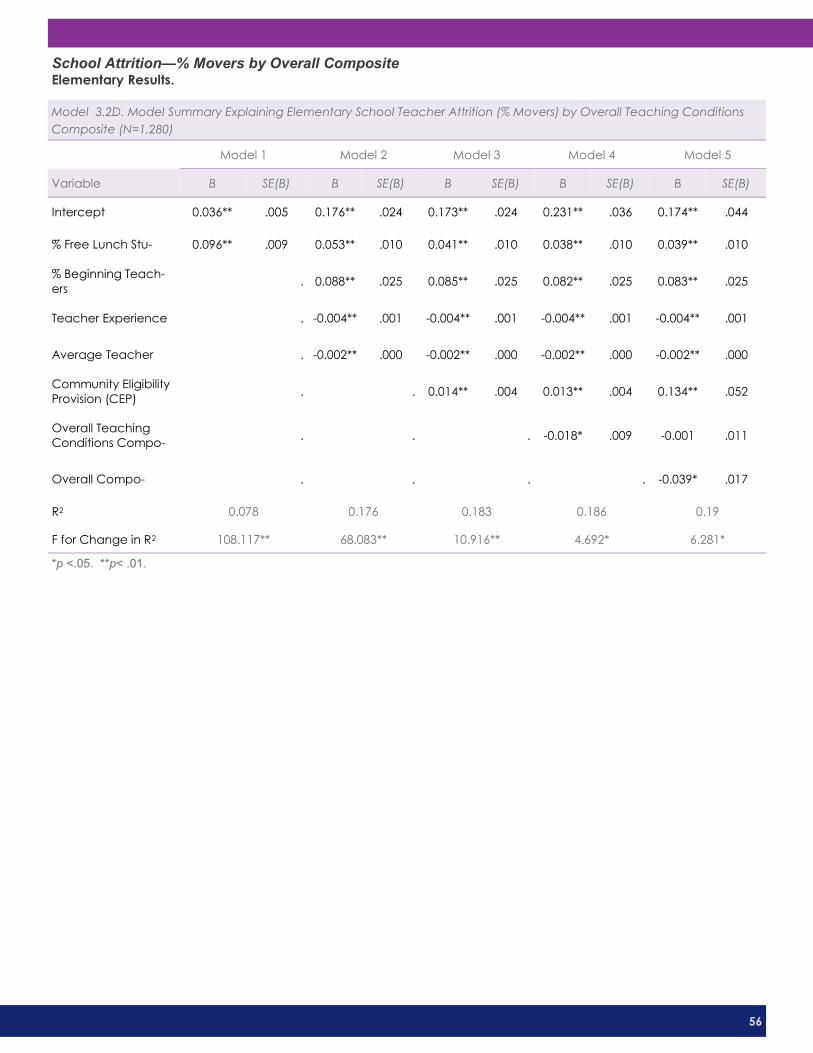
School Attrition—% Movers by Overall Composite Elementary Results.
Model 3.2D. Model Summary Explaining Elementary School Teacher Attrition (% Movers) by Overall Teaching Conditions
Composite (N=1,280)
Model 1 Model 2 Model 3 Model 4 Model 5
Variable B SE(B) B SE(B) B SE(B) B SE(B) B SE(B)
Intercept 0.036** .005 0.176** .024 0.173** .024 0.231** .036 0.174** .044
% Free Lunch Stu- 0.096** .009 0.053** .010 0.041** .010 0.038** .010 0.039** .010
% Beginning Teach-
ers . 0.088** .025 0.085** .025 0.082** .025 0.083** .025
Teacher Experience . -0.004** .001 -0.004** .001 -0.004** .001 -0.004** .001
Average Teacher . -0.002** .000 -0.002** .000 -0.002** .000 -0.002** .000
Community Eligibility
Provision (CEP) . . 0.014** .004 0.013** .004 0.134** .052
Overall Teaching
Conditions Compo- . . . -0.018* .009 -0.001 .011
Overall Compo- . . . . -0.039* .017
R2 0.078 0.176 0.183 0.186 0.19
F for Change in R2 108.117** 68.083** 10.916** 4.692* 6.281*
*p <.05. **p< .01.

57
School Attrition—% Movers by Overall Composite Middle School Results.
Model 3.3D. Model Summary Explaining Middle School Teacher Attrition (% Movers) by Overall Teaching Conditions Com-
posite (N=483)
Model 1 Model 2 Model 3
Variable B SE(B) B SE(B) B SE(B)
Intercept 0.031** .009 0.217** .036 0.353** .053
% Free Lunch Students 0.131** .016 0.085** .018 0.079** .018
Average Teacher Pay . -0.004** .001 -0.004** .001
Overall Teaching Conditions Composite . . -0.046** .013
R2 0.118 0.167 0.187
F for Change in R2 64.351** 28.235** 11.784**
*p <.05. **p< .01.
58
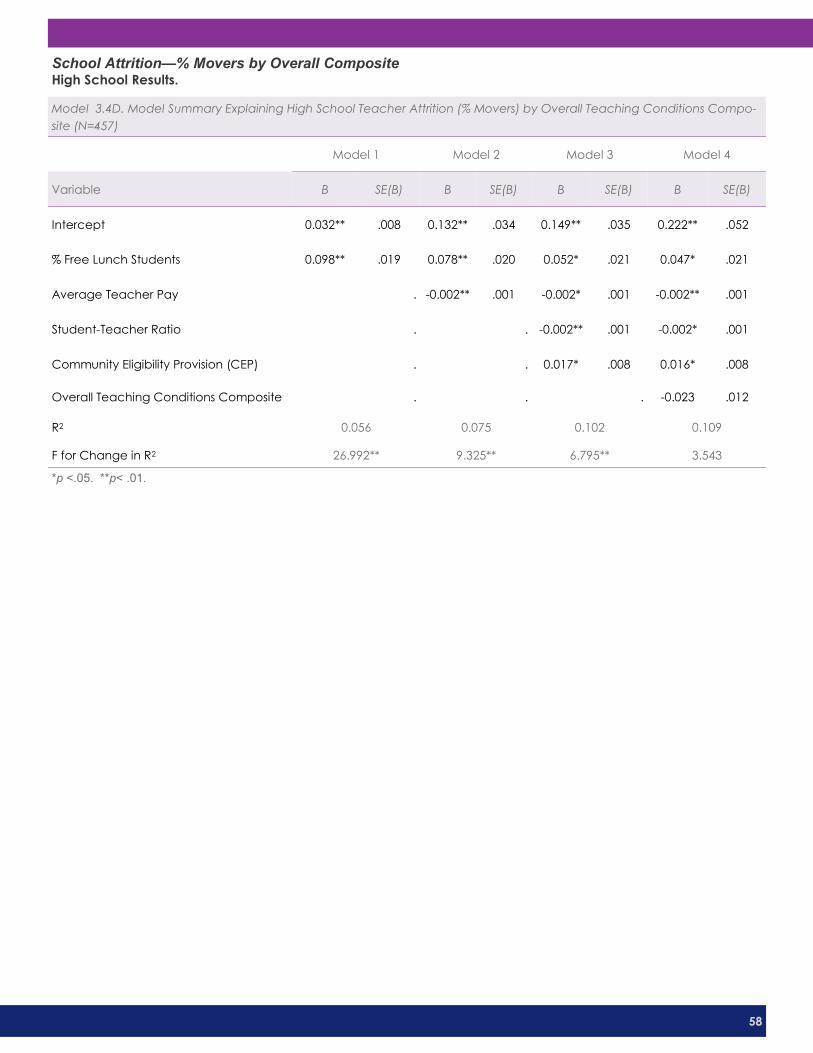
School Attrition—% Movers by Overall Composite High School Results.
Model 3.4D. Model Summary Explaining High School Teacher Attrition (% Movers) by Overall Teaching Conditions Compo-
site (N=457)
Model 1 Model 2 Model 3 Model 4
Variable B SE(B) B SE(B) B SE(B) B SE(B)
Intercept 0.032** .008 0.132** .034 0.149** .035 0.222** .052
% Free Lunch Students 0.098** .019 0.078** .020 0.052* .021 0.047* .021
Average Teacher Pay . -0.002** .001 -0.002* .001 -0.002** .001
Student-Teacher Ratio . . -0.002** .001 -0.002* .001
Community Eligibility Provision (CEP) . . 0.017* .008 0.016* .008
Overall Teaching Conditions Composite . . . -0.023 .012
R2 0.056 0.075 0.102 0.109
F for Change in R2 26.992** 9.325** 6.795** 3.543
*p <.05. **p< .01.
59
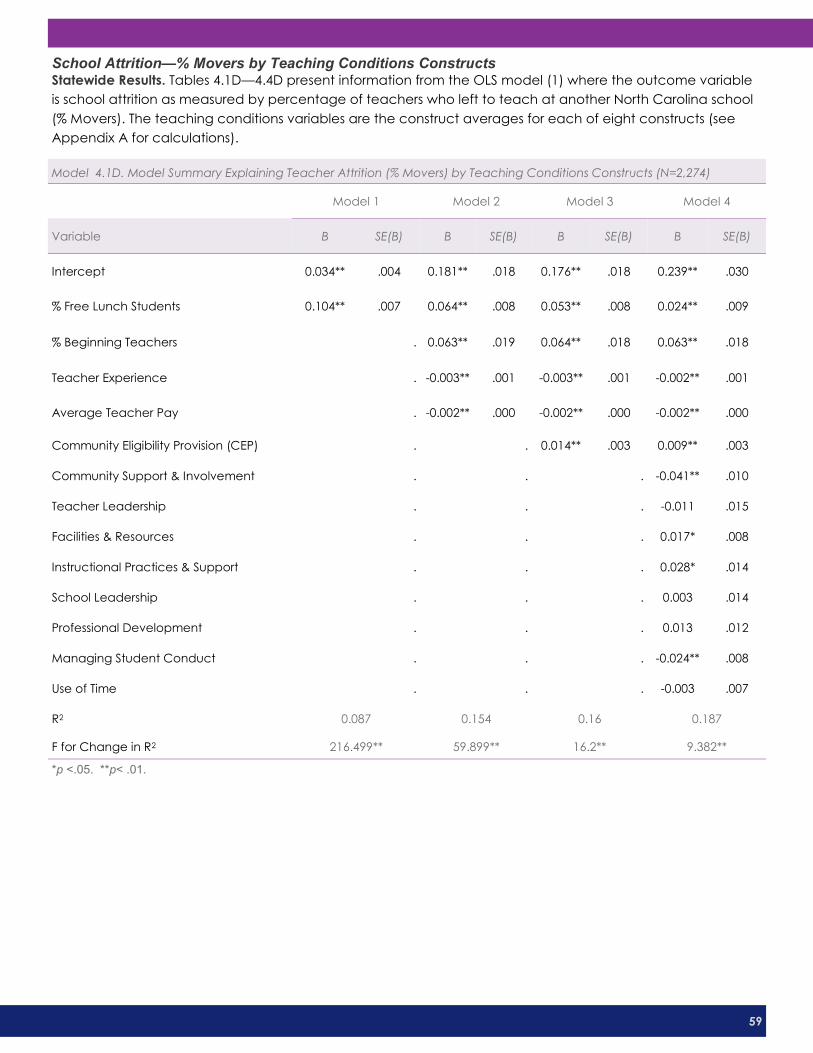
School Attrition—% Movers by Teaching Conditions Constructs Statewide Results. Tables 4.1D—4.4D present information from the OLS model (1) where the outcome variable
is school attrition as measured by percentage of teachers who left to teach at another North Carolina school
(% Movers). The teaching conditions variables are the construct averages for each of eight constructs (see
Appendix A for calculations).
Model 4.1D. Model Summary Explaining Teacher Attrition (% Movers) by Teaching Conditions Constructs (N=2,274)
Model 1 Model 2 Model 3 Model 4
Variable B SE(B) B SE(B) B SE(B) B SE(B)
Intercept 0.034** .004 0.181** .018 0.176** .018 0.239** .030
% Free Lunch Students 0.104** .007 0.064** .008 0.053** .008 0.024** .009
% Beginning Teachers . 0.063** .019 0.064** .018 0.063** .018
Teacher Experience . -0.003** .001 -0.003** .001 -0.002** .001
Average Teacher Pay . -0.002** .000 -0.002** .000 -0.002** .000
Community Eligibility Provision (CEP) . . 0.014** .003 0.009** .003
Community Support & Involvement . . . -0.041** .010
Teacher Leadership . . . -0.011 .015
Facilities & Resources . . . 0.017* .008
Instructional Practices & Support . . . 0.028* .014
School Leadership . . . 0.003 .014
Professional Development . . . 0.013 .012
Managing Student Conduct . . . -0.024** .008
Use of Time . . . -0.003 .007
R2 0.087 0.154 0.16 0.187
F for Change in R2 216.499** 59.899** 16.2** 9.382**
*p <.05. **p< .01.

60
School Attrition—% Movers by Teaching Conditions Constructs Elementary School Results.
Model 4.2D. Model Summary Explaining Elementary School Teacher Attrition (% Movers) by Teaching Conditions Con-
structs (N=1,280)
Model 1 Model 2 Model 3 Model 4
Variable B SE(B) B SE(B) B SE(B) B SE(B)
Intercept 0.036** .005 0.176** .024 0.173** .024 0.269** .047
% Free Lunch Students 0.096** .009 0.053** .010 0.041** .010 0.006 .013
% Beginning Teachers . 0.088** .025 0.085** .025 0.074** .025
Teacher Experience . -0.004** .001 -0.004** .001 -0.004** .001
Average Teacher Pay . -0.002** .000 -0.002** .000 -0.002** .000
Community Eligibility Provision (CEP) . . 0.014** .004 0.009* .004
Community Support & Involvement . . . -0.048** .014
Teacher Leadership . . . -0.005 .020
Facilities & Resources . . . 0.002 .012
Instructional Practices & Support . . . -0.004 .022
School Leadership . . . -0.003 .019
Professional Development . . . 0.031 .017
Managing Student Conduct . . . -0.014 .011
Use of Time . . . 0.017 .011
R2 0.078 0.176 0.183 0.201
F for Change in R2 108.117** 50.546** 10.916** 3.565**
*p <.05. **p< .01.
61
School Attrition—% Movers by Teaching Conditions Constructs Middle School Results.
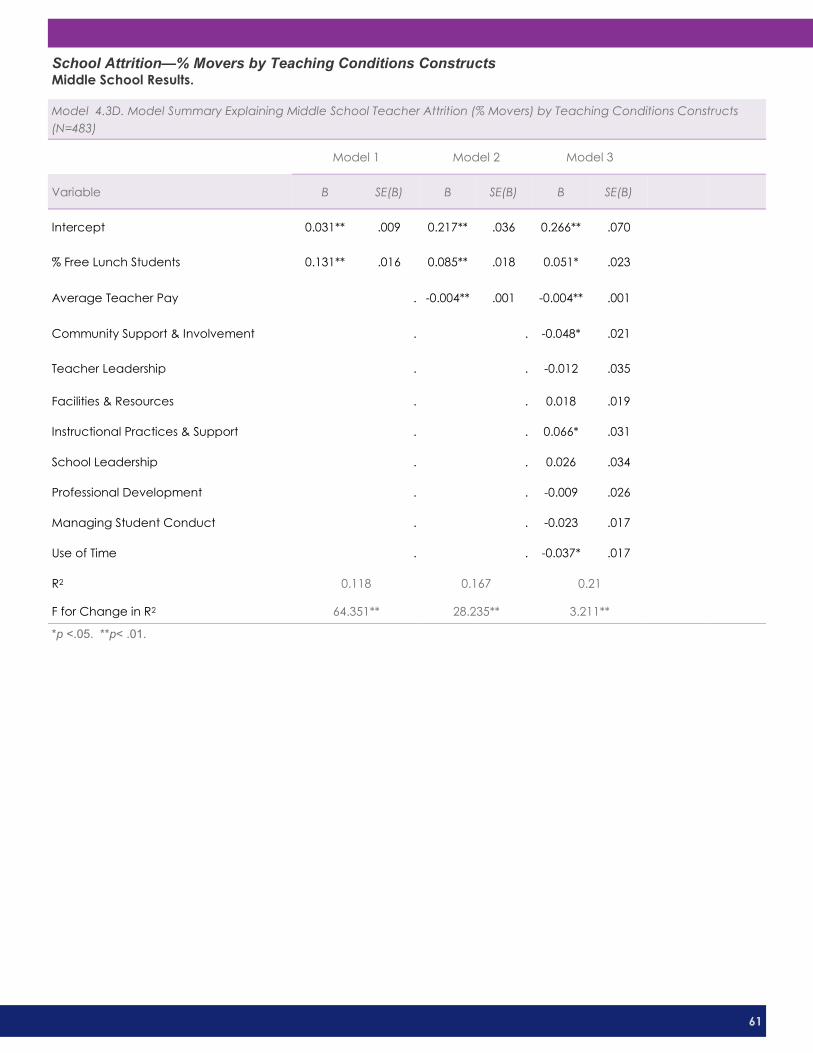
Model 4.3D. Model Summary Explaining Middle School Teacher Attrition (% Movers) by Teaching Conditions Constructs
(N=483)
Model 1 Model 2 Model 3
Variable B SE(B) B SE(B) B SE(B)
Intercept 0.031** .009 0.217** .036 0.266** .070
% Free Lunch Students 0.131** .016 0.085** .018 0.051* .023
Average Teacher Pay . -0.004** .001 -0.004** .001
Community Support & Involvement . . -0.048* .021
Teacher Leadership . . -0.012 .035
Facilities & Resources . . 0.018 .019
Instructional Practices & Support . . 0.066* .031
School Leadership . . 0.026 .034
Professional Development . . -0.009 .026
Managing Student Conduct . . -0.023 .017
Use of Time . . -0.037* .017
R2 0.118 0.167 0.21
F for Change in R2 64.351** 28.235** 3.211**
*p <.05. **p< .01.

62
School Attrition—% Movers by Teaching Conditions Constructs High School Results.
Model 4.4D. Model Summary Explaining High School Teacher Attrition (% Movers) by Teaching Conditions Constructs
(N=457)
Model 1 Model 2 Model 3 Model 4
Variable B SE(B) B SE(B) B SE(B) B SE(B)
Intercept 0.032** .008 0.132** .034 0.149** .035 0.215** .063
% Free Lunch Students 0.098** .019 0.078** .020 0.052* .021 0.002 .025
Average Teacher Pay . -0.002** .001 -0.002* .001 -0.002* .001
Student-Teacher Ratio . . -0.002** .001 -0.002** .001
Community Eligibility Provision (CEP) . . 0.017* .008 0.01 .008
Community Support & Involvement . . . -0.052* .020
Teacher Leadership . . . -0.012 .032
Facilities & Resources . . . 0.034* .017
Instructional Practices & Support . . . 0.017 .030
School Leadership . . . 0.009 .033
Professional Development . . . 0.032 .025
Managing Student Conduct . . . -0.042* .017
Use of Time . . . 0.001 .017
R2 0.056 0.075 0.102 0.155
F for Change in R2 26.992** 9.325** 6.795** 3.481**
*p <.05. **p< .01.