2016 Health Care Benchmarking Report - SHRM Online Health Care Benchmarking Report November 2016....
38
2016 Health Care Benchmarking Report November 2016
-
Upload
truongkhanh -
Category
Documents
-
view
217 -
download
1
Transcript of 2016 Health Care Benchmarking Report - SHRM Online Health Care Benchmarking Report November 2016....

2016 Health CareBenchmarking Report
November 2016

SHRM Benchmarking Service
• The data in this report can be customized for your organization by industry,
staff size, geographic or metropolitan region, profit status (for profit/nonprofit),
sector (public/private), unionized environments, and more.
• The data in this report were collected from the 2016 SHRM Human Capital
Benchmarking Survey. Additional reports available in Health Care, Paid Leave,
Employee Benefits Prevalence, and Talent Acquisition.
To view
sample
reports or
place an
order, visit
shrm.org/benchmarks
or call
(703) 535-6366
2Health Care Benchmarking Report ©SHRM 2016
Are you looking for data that is customizable by industry,
region, organization staff size, and more? SHRM’s
Benchmarking Service provides just that.

About SHRM
Founded in 1948, the Society for
Human Resource Management
(SHRM) is the world’s largest HR
membership organization devoted
to human resource management.
Representing more than 275,000
members in over 160 countries, the
Society is the leading provider of
resources to serve the needs of HR
professionals and advance the
professional practice of human
resource management. SHRM has
more than 575 affiliated chapters
within the United States and
subsidiary offices in China, India
and United Arab Emirates. Visit us
at shrm.org.
Table of Contents
Key Findings 4
Statistical Definitions 5
Health Care Benchmarking Survey Findings 6
Demographics 29
Methodology 38
Health Care Benchmarking Report ©SHRM 2016 3
Key Findings
• Health care coverage: 98 percent of
organizations offer health care coverage for
full-time employees. Twenty-three percent of
companies offer health care coverage for
part-time employees, which is down from 27
percent in 2014. Ninety-two percent offer
coverage for the spouse of employees, which
is down from 96 percent in 2011.
• High-deductible plans: On average,
employers contribute $576 to their
employees’ HSA accounts, while employers
contribute $1,885 to employee HRAs. In
2014, employers contributed an average of
$632 to HSAs and $2,829 to HRAs.
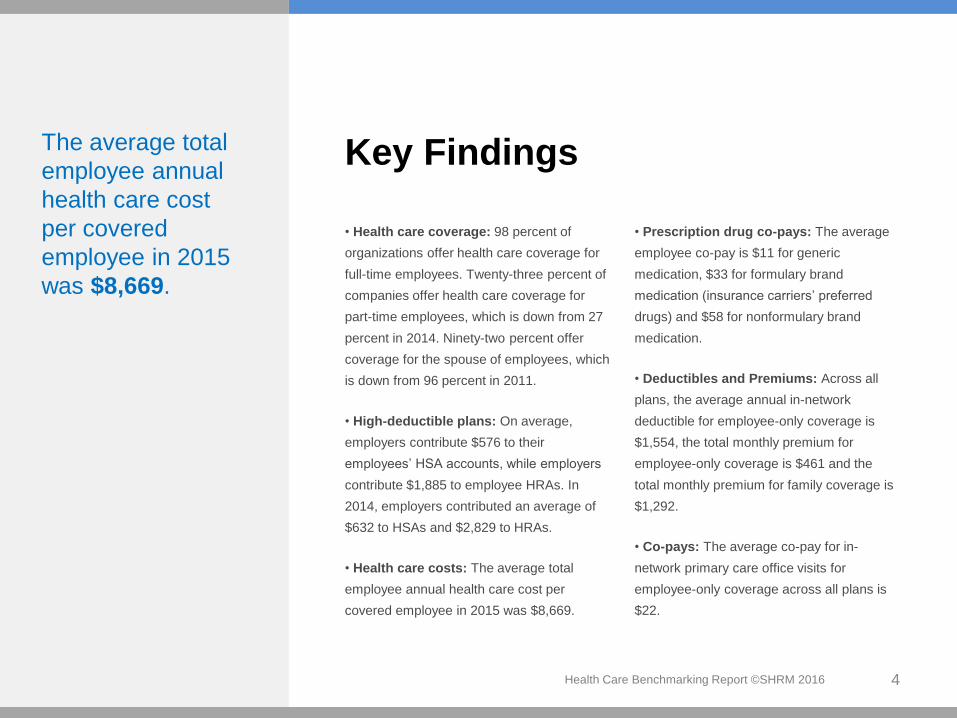
• Health care costs: The average total
employee annual health care cost per
covered employee in 2015 was $8,669.
• Prescription drug co-pays: The average
employee co-pay is $11 for generic
medication, $33 for formulary brand
medication (insurance carriers’ preferred
drugs) and $58 for nonformulary brand
medication.
• Deductibles and Premiums: Across all
plans, the average annual in-network
deductible for employee-only coverage is
$1,554, the total monthly premium for
employee-only coverage is $461 and the
total monthly premium for family coverage is
$1,292.
• Co-pays: The average co-pay for in-
network primary care office visits for
employee-only coverage across all plans is
$22.
4Health Care Benchmarking Report ©SHRM 2016
The average total
employee annual
health care cost
per covered
employee in 2015
was $8,669.

Statistical Definitions
5
“n”
The letter “n” in tables and figures indicates the number of
respondents to each question. In other words, when it is noted
that n = 25, it indicates that the number of respondents was 25.
Percentile
The percentile is the percentage of responses in a group that
have values less than or equal to that particular value. For
example, when data are arranged from lowest to highest, the
25th percentile is the point at which 75% of the data are above it
and 25% are below it. Conversely, the 75th percentile is the point
at which 25% of the data are above it and 75% are below it.
Median (50th percentile)
The median is the midpoint of the set of numbers or values
arranged in ascending order. It is recommended that the median
is used as a basis for all interpretations of the data when the
average and median are discrepant.
Average
The average is the sum of the responses divided by the total
number of responses. It is also known as the mean. This
measure is affected more than the median by the occurrence of
outliers (extreme values). For this reason, the average reported
may be greater than the 75th percentile or less than the 25th
percentile.
Health Care Benchmarking Report ©SHRM 2016

Health Care Coverage Prevalence
6Health Care Benchmarking Report ©SHRM 2016
11%
39%
49%
92%
23%
98%
Vary health care premium contributions by employeesalary (n=1,745)
Opposite-sex domestic partner health care coverage(n=1,789)
Same-sex domestic partner health care coverage(n=1,789)
Spouse health care coverage (n=1,789)
Health care coverage for part-time employees (n=1,743)
Health care coverage for full-time employees (n=1,846)

Stop Loss Coverage Prevalence
7Health Care Benchmarking Report ©SHRM 2016
89%
61%
39%
Stop loss coverage (n=499)
Fully insured health care coverage (n=1,673)
Self-funded health care coverage (n=1,673)

Employee Participation and Plans Offered
8Health Care Benchmarking Report ©SHRM 2016
19%
3%
6%
8%
13%
52%
7%
13%
20%
29%
81%
Opt out(No coverage selected)
EPO
POS
CDHP
HMO
PPO
Percentage of organizations offering plan (n=1,743) Percentage of employees enrolled (n=1,289)
Note: Percentages may not total 100% due to rounding

Employee Participation and Plans Offered
9Health Care Benchmarking Report ©SHRM 2016
36%
32%
32%
3 or more plans
2 plans
1 plan
Numbers of Health Care Plans Offered
n = 1,565

Health Care Cost and Stop Loss Coverage Amount
10Health Care Benchmarking Report ©SHRM 2016
n25th
PercentileMedian
75th
PercentileAverage
Health care cost as a
percentage of
operating expense
529 2.65% 4.93% 8.54% 7.69%
Total employee annual
health care cost per
covered employee
1,188 $5,325 $8,171 $11,062 $8,669
Amount of stop loss
coverage348 $60,000 $100,000 $200,000 $144,054

Health Care Costs for All Plans Combined
11Health Care Benchmarking Report ©SHRM 2016
n25th
PercentileMedian
75th
PercentileAverage
Total monthly premium for employee-
only coverage1,122 $340 $480 $600 $461
Total monthly premium for spouse or
domestic partner coverage1,064 $666 $996 $1,271 $959
Total monthly premium for family
coverage1,093 $946 $1,367 $1,687 $1,292
Percentage of premium employer
pays for employee-only coverage1,146 70% 80% 90% 77%
Percentage of premium employer
pays for spouse or domestic partner
coverage
1,078 47% 67% 80% 60%
Percentage of premium employer
pays for family coverage1,098 40% 66% 80% 59%
All plans is an average of each plan type.

Health Care Costs for All Plans Combined
12Health Care Benchmarking Report ©SHRM 2016
n25th
PercentileMedian
75th
PercentileAverage
Annual in-network deductible for employee-
only coverage1,152 $500 $1,250 $2,113 $1,554
Annual out-of-network deductible for
employee-only coverage967 $1,000 $2,000 $4,000 $2,450
Co-pay for in-network primary care office
visits for employee-only coverage1,067 $15 $25 $30 $22
Co-pay for out-of-network primary care
office visits for employee-only coverage583 $0 $20 $40 $27
Co-insurance for in-network primary care
office visits for employee-only coverage872 0% 20% 80% 38%
Co-insurance for out-of-network primary
care office visits for employee-only coverage907 30% 40% 60% 43%

Health Maintenance Organization Plans
13Health Care Benchmarking Report ©SHRM 2016
n25th
PercentileMedian
75th
PercentileAverage
Total monthly premium for employee-
only coverage262 $361 $479 $590 $490
Total monthly premium for spouse or
domestic partner coverage236 $750 $1,000 $1,224 $981
Total monthly premium for family
coverage248 $999 $1,364 $1,662 $1,301
Percentage of premium employer
pays for employee-only coverage271 68% 80% 92% 77%
Percentage of premium employer
pays for spouse or domestic partner
coverage
250 42% 63% 77% 57%
Percentage of premium employer
pays for family coverage256 33% 65% 77% 56%

Health Maintenance Organization Plans
14Health Care Benchmarking Report ©SHRM 2016
n25th
PercentileMedian
75th
PercentileAverage
Annual in-network deductible for employee-
only coverage256 $0 $300 $1,500 $982
Annual out-of-network deductible for
employee-only coverage142 $0 $0 $2,000 $1,374
Co-pay for in-network primary care office
visits for employee-only coverage250 $15 $20 $30 $21
Co-pay for out-of-network primary care office
visits for employee-only coverage107 $0 $15 $40 $21
Co-insurance for in-network primary care
office visits for employee-only coverage160 0% 0% 70% 30%
Co-insurance for out-of-network primary
care office visits for employee-only coverage112 0% 15% 60% 32%

Exclusive Provider Organization Plans
15Health Care Benchmarking Report ©SHRM 2016
n25th
PercentileMedian
75th
PercentileAverage
Total monthly premium for employee-
only coverage41 $284 $499 $646 $468
Total monthly premium for spouse or
domestic partner coverage40 $675 $1,030 $1,253 $952
Total monthly premium for family
coverage41 $873 $1,494 $1,811 $1,365
Percentage of premium employer
pays for employee-only coverage41 65% 80% 87% 73%
Percentage of premium employer
pays for spouse or domestic partner
coverage
40 40% 69% 80% 61%
Percentage of premium employer
pays for family coverage40 38% 69% 80% 60%

Exclusive Provider Organization Plans
16Health Care Benchmarking Report ©SHRM 2016
n25th
PercentileMedian
75th
PercentileAverage
Annual in-network deductible for employee-
only coverage65 $150 $1,000 $2,000 $1,265
Annual out-of-network deductible for
employee-only coverage39 $0 $700 $2,000 $1,322
Co-pay for in-network primary care office
visits for employee-only coverage62 $20 $25 $30 $24
Co-pay for out-of-network primary care office
visits for employee-only coverage30 $0 $0 $20 $10
Co-insurance for in-network primary care
office visits for employee-only coverage51 0% 10% 80% 31%
Co-insurance for out-of-network primary care
office visits for employee-only coverage33 0% 0% 60% 27%

Preferred Provider Organization Plans
17Health Care Benchmarking Report ©SHRM 2016
n25th
PercentileMedian
75th
PercentileAverage
Total monthly premium for employee-
only coverage910 $344 $494 $633 $478
Total monthly premium for spouse or
domestic partner coverage861 $671 $1,027 $1,317 $1,003
Total monthly premium for family
coverage886 $955 $1,404 $1,754 $1,346
Percentage of premium employer
pays for employee-only coverage927 70% 80% 90% 76%
Percentage of premium employer
pays for spouse or domestic partner
coverage
875 47% 66% 80% 60%
Percentage of premium employer
pays for family coverage893 40% 65% 79% 59%

Preferred Provider Organization Plans
18Health Care Benchmarking Report ©SHRM 2016
n25th
PercentileMedian
75th
PercentileAverage
Annual in-network deductible for employee-
only coverage915 $500 $1,000 $2,000 $1,453
Annual out-of-network deductible for
employee-only coverage782 $800 $2,000 $4,000 $2,318
Co-pay for in-network primary care office visits
for employee-only coverage847 $20 $25 $30 $23
Co-pay for out-of-network primary care office
visits for employee-only coverage452 $0 $25 $45 $30
Co-insurance for in-network primary care
office visits for employee-only coverage676 0% 20% 80% 39%
Co-insurance for out-of-network primary care
office visits for employee-only coverage736 30% 40% 60% 44%

Point of Service Plans
19Health Care Benchmarking Report ©SHRM 2016
n25th
PercentileMedian
75th
PercentileAverage
Total monthly premium for employee-
only coverage115 $400 $520 $624 $506
Total monthly premium for spouse or
domestic partner coverage109 $825 $1,143 $1,369 $1,081
Total monthly premium for family
coverage111 $1,168 $1,581 $1,807 $1,472
Percentage of premium employer
pays for employee-only coverage118 65% 80% 90% 75%
Percentage of premium employer
pays for spouse or domestic partner
coverage
113 40% 65% 80% 58%
Percentage of premium employer
pays for family coverage116 36% 70% 80% 59%

Point of Service Plans
20Health Care Benchmarking Report ©SHRM 2016
n25th
PercentileMedian
75th
PercentileAverage
Annual in-network deductible for employee-
only coverage118 $100 $1,000 $2,000 $1,238
Annual out-of-network deductible for
employee-only coverage103 $750 $2,000 $4,000 $2,486
Co-pay for in-network primary care office visits
for employee-only coverage113 $20 $25 $30 $23
Co-pay for out-of-network primary care office
visits for employee-only coverage51 $0 $30 $50 $29
Co-insurance for in-network primary care
office visits for employee-only coverage83 0% 20% 90% 39%
Co-insurance for out-of-network primary care
office visits for employee-only coverage98 30% 40% 60% 44%
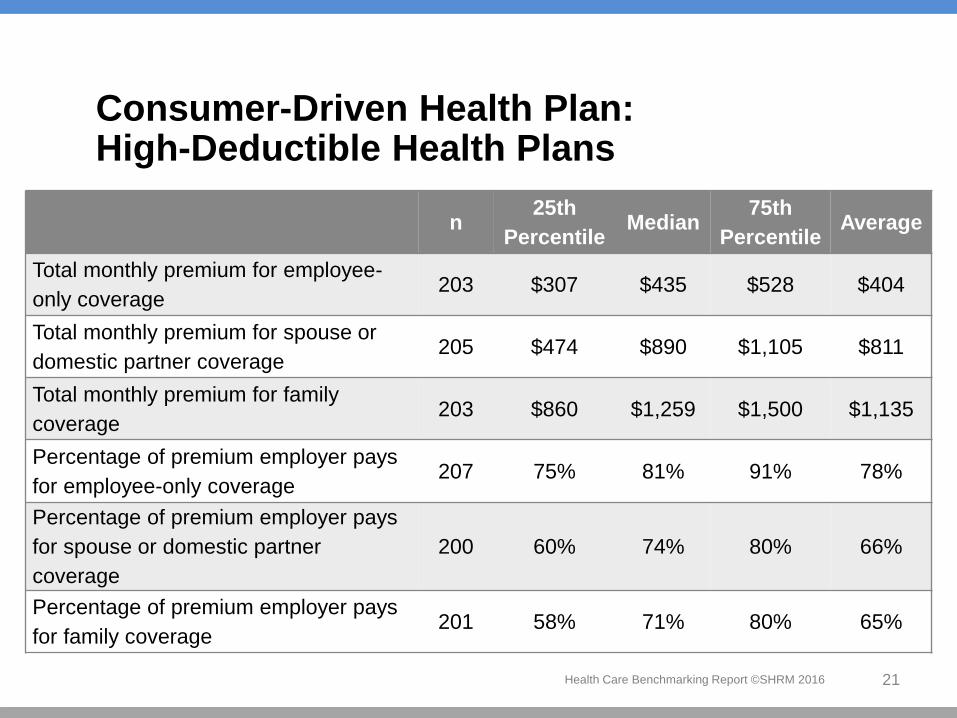
Consumer-Driven Health Plan: High-Deductible Health Plans
21Health Care Benchmarking Report ©SHRM 2016
n25th
PercentileMedian
75th
PercentileAverage
Total monthly premium for employee-
only coverage203 $307 $435 $528 $404
Total monthly premium for spouse or
domestic partner coverage205 $474 $890 $1,105 $811
Total monthly premium for family
coverage203 $860 $1,259 $1,500 $1,135
Percentage of premium employer pays
for employee-only coverage207 75% 81% 91% 78%
Percentage of premium employer pays
for spouse or domestic partner
coverage
200 60% 74% 80% 66%
Percentage of premium employer pays
for family coverage201 58% 71% 80% 65%

Consumer-Driven Health Plan: High-Deductible Health Plans
22Health Care Benchmarking Report ©SHRM 2016
n25th
PercentileMedian
75th
PercentileAverage
Annual in-network deductible for employee-
only coverage214 $1,500 $2,500 $3,000 $2,442
Annual out-of-network deductible for
employee-only coverage176 $3,000 $4,000 $5,000 $3,821
Co-pay for in-network primary care office visits
for employee-only coverage99 $0 $0 $20 $9
Co-pay for out-of-network primary care office
visits for employee-only coverage83 $0 $0 $0 $13
Co-insurance for in-network primary care
office visits for employee-only coverage171 10% 20% 85% 46%
Co-insurance for out-of-network primary care
office visits for employee-only coverage173 30% 50% 60% 47%
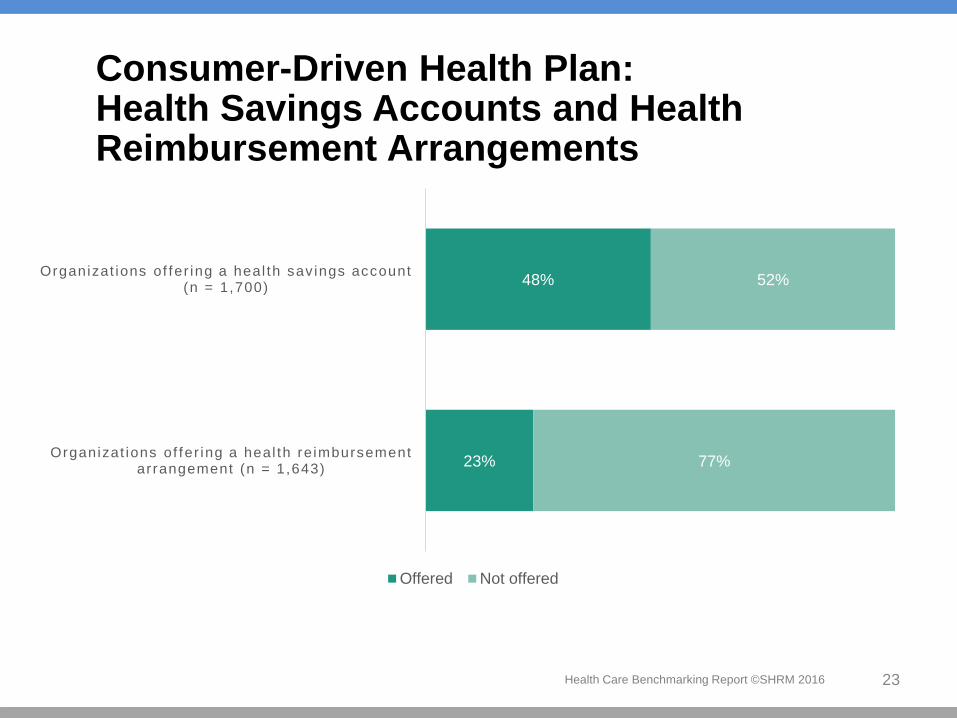
Consumer-Driven Health Plan: Health Savings Accounts and Health Reimbursement Arrangements
23Health Care Benchmarking Report ©SHRM 2016
23%
48%
77%
52%
Organizat ions of fer ing a heal th re imbursement arrangement (n = 1,643)
Organizat ions of fer ing a heal th sav ings account(n = 1,700)
Offered Not offered

Consumer-Driven Health Plan: Health Savings Accounts and Health Reimbursement Arrangements
24Health Care Benchmarking Report ©SHRM 2016
n25th
PercentileMedian
75th
PercentileAverage
Employer contribution to a
health savings account665 $0 $500 $1,000 $576
Employer contribution to a
health reimbursement
arrangement
218 $700 $1,250 $2,250 $1,885

Prescription Drug Co-Payand Co-Insurance Prevalence
25Health Care Benchmarking Report ©SHRM 2016
95%
76%
86%
92%
5%
24%
14%
8%
Organizat ions of fer ing a 90 -day mai l -order prescr ipt ion (n = 1,345)
Organizat ions of fer ing nonformulary brand prescr ipt ion (n = 1,514)
Organizat ions of fer ing formulary brandprescr ipt ion (n = 1,514)
Organizat ions of fer inggener ic pr iscr ipt ion (n = 1,514)
Offered Not offered

Prescription Drug Co-Pays
26Health Care Benchmarking Report ©SHRM 2016
n25th
PercentileMedian
75th
PercentileAverage
Employee co-pay for generic medication 1,053 $10 $10 $15 $11
Employee co-pay for formulary brand
medication962 $25 $35 $40 $33
Employee co-pay for nonformulary brand
medication855 $50 $60 $70 $58
Employee co-pay for generic medication
90-day mail-order supply821 $15 $20 $30 $24
Employee co-pay for formulary brand
medication 90-day mail-order supply755 $50 $70 $88 $71
Employee co-pay for nonformulary brand
medication 90-day mail-order supply680 $90 $120 $150 $122

Prescription Drug Co-Insurance
27Health Care Benchmarking Report ©SHRM 2016
n25th
PercentileMedian
75th
PercentileAverage
Employee co-pay for generic medication 422 0% 10% 40% 27%
Employee co-pay for formulary brand
medication406 0% 20% 50% 29%
Employee co-pay for nonformulary brand
medication372 0% 20% 50% 31%
Employee co-pay for generic medication
90-day mail-order supply324 0% 20% 50% 28%
Employee co-pay for formulary brand
medication 90-day mail-order supply312 0% 20% 50% 31%
Employee co-pay for nonformulary brand
medication 90-day mail-order supply277 0% 20% 50% 31%

Demographics: Organization Industry
28
Percentage
Services — Professional, Scientific, Technical 13%
High-Tech 9%
Health Care, Social Assistance 9%
Consulting 9%
Retail/Wholesale Trade 8%
Manufacturing (durable goods) 6%
Finance 5%
Government/Public Administration — State/Local 5%
Health Care Benchmarking Report ©SHRM 2016
Note: n = 2,106. Percentages do not total 100% due to multiple response options.

Demographics: Organization Industry
29
Percentage
Manufacturing (non-durable goods) 5%
Educational Services 4%
Publishing, Broadcasting, Other Media 3%
Religious, Grant-Making, Civic, Professional, and Similar
Organizations3%
Business Support Services 3%
Construction, Mining, Oil & Gas 3%
Insurance 2%
Health Care Benchmarking Report ©SHRM 2016
Note: n = 2,106. Percentages do not total 100% due to multiple response options.

Demographics: Organization Industry
30
Percentage
Services — Accommodation, Food & Drinking Places 2%
Transportation, Warehousing 2%
Arts, Entertainment, Recreation 2%
Real Estate, Rental, Leasing 2%
Telecommunications 2%
Utilities 1%
Repair and Maintenance 1%
Association — Professional/Trade 1%
Health Care Benchmarking Report ©SHRM 2016
Note: n = 2,106. Percentages do not total 100% due to multiple response options.

Demographics: Organization Industry
31
Percentage
Biotech 1%
Pharmaceutical <1%
Government/Public Administration — Federal <1%
Waste Management & Remediation Services <1%
Health Care Benchmarking Report ©SHRM 2016
Note: n = 2,106. Percentages do not total 100% due to multiple response options.

Demographics: Organization Sector
32Health Care Benchmarking Report ©SHRM 2016
12%
57%
21%
11%
0%
10%
20%
30%
40%
50%
60%
Publicly owned for-profit
Privately owned for-profit
Nonprofit Government
n = 2,114

Demographics: Organization Staff Size
33Health Care Benchmarking Report ©SHRM 2016
22%
18%
40%
14%
5%
1%
0%
10%
20%
30%
40%
50%
1-49 FTEs 50-99 FTEs 100-499 FTEs 500-2,499 FTEs 1,000-24,999 FTEs
25,000 or more FTEs
n = 1,975

Demographics: Organization Region
34Health Care Benchmarking Report ©SHRM 2016
Northeast19%
South34%
Midwest26%
West21%
n = 2,124

Demographics: International Workforce
35Health Care Benchmarking Report ©SHRM 2016
Yes11%
No89%
ORGANIZATIONS HAVING WORKFORCE BASED OUTSIDE THE US
n = 2,124. Responses that answered “Not sure” were not included

Demographics: HR Department Level
36Health Care Benchmarking Report ©SHRM 2016
82% 18%
Entire organization/corporate level A specific business unit/work location(s)n = 2,105

Survey Methodology
37Health Care Benchmarking Report ©SHRM 2016
Response rate = 9%
2,124 HR professionals for a randomly selected sample of SHRM’s membership participated in this survey
Margin of error +/- 2%
Survey fielded February to April 2016

Project Contributors
38Health Care Benchmarking Report ©SHRM 2016
Project Lead
Andrew Mariotti, Senior Researcher, SHRM Research
Project Contributors
John Dooney, Manager, Training, Knowledge Center
Evren Esen, Director, Workforce Analytics, SHRM Research
Wenmo Kong, Research Coordinator, SHRM Research
Lindsay Northon, Specialist, HR Competencies