“ Fundraising Cost Effectiveness and Performance Measurement ”
Fundraising Effectiveness Project (FEP)
www.afpfep.org; contact: [email protected]
A project to help nonprofit organizations measure and compare their annual growth in giving by gain/loss category and increase the net by maximizing their gains and minimizing their losses
2016 Fundraising Effectiveness Survey Report
2014-2015 Data Providers
Abila* DonorPerfect Fundraising Software*
Bloomerang* Neon*
eTapestry
* GiG Database Providers
Participating Donor Software/Services Firms
Abila* MatchMaker FundRaising Software*
Bloomerang Metafile*
Donor2/Campus Management Corporation* PhilanthrAppeal (FundTrack Software)*
DonorPerfect Fundraising Software* The Raiser’s Edge ® (Blackbaud)*
DonorTrends ROI Solutions
eTapestry* Telosa Software (Exceed!)
GiftWorks (Mission Research)* Neon
* Charter member of the AFP Donor Software Workgroup (2006 to 2014)
Nonprofit Sector Groups Endorsing the Project
Association Foundation Group (AFG) Council for Advancement and Support of Education (CASE)
Association of Fundraising Professionals (AFP)* Council for Resource Development (CRD)
Association of Donor Relations Professionals (ADRP) Lilly School of Philanthropy at Indiana University-Purdue University Indianapolis
Center on Nonprofits and Philanthropy at the Urban Institute*
Partnership for Philanthropic Planning (PPP)
Philanthropic Service for Institutions Science of Philanthropy Initiative
* Founding partners, providing resources for the project.

1 | P a g e
2016 Fundraising Effectiveness Survey Report
Contents
Executive Summary .................................................................................................................................................... 1
About the Fundraising Effectiveness Project .......................................................................................................... 2
Why Analyzing Fundraising Gains and Losses Is Important for Fundraising Effectiveness .............................. 4
Project Method ........................................................................................................................................................... 7
Summary of 2014-2015 FEP Survey Findings.......................................................................................................... 9
Overview ................................................................................................................................................. 9
Gains and Losses by Category ............................................................................................................ 10
Significance of Size of Organization................................................................................................... 11
Gains and Losses by Percentile .......................................................................................................... 12
Donor and Gift Retention Analysis by Year ...................................................................................... 16
Implications of the FEP Data for Fundraising Decision Makers ......................................................................... 19
Examining the Ratio of Gains to Losses ............................................................................................ 19
Strategies Suggested by FEP ............................................................................................................... 19
Investing to Maximize Fundraising Results ...................................................................................... 20
Setting Fundraising Goals for Doubling Annual Giving ................................................................... 20
Taking the Next Steps .......................................................................................................................... 21
Appendices ................................................................................................................................................................ 22
A. Detailed 2014-2015 Fundraising Effectiveness Survey Statistics ........................................... 22
B. Downloadable Growth-in-Giving Measurement Tools ............................................................ 30

1 | P a g e
2016 Fundraising Effectiveness Survey Report March 19, 2016
Written by: Bill Levis, The Urban Institute; Ben Miller, DonorTrends; and Cathy Williams, Association of Fundraising Professionals
Executive Summary
The 2016 Fundraising Effectiveness Project report summarizes data from 9,922 survey respondents covering year-to-year fundraising results for 2014-2015. The report shows that:
Participating organizations raised $8.628 billion dollars in 2015 compared to $8.196 billion dollars in 2014 for an overall rate of growth in giving of 5.2% ($432 million).
Participating organizations had 8.27 million donors in contributing in 2015 compared to 8.11 million donors in contributing in 2014 for an overall rate of growth in donors of 2% (160,878).
Net Change
in Revenue 5.3%
New44%
Recapture19%
Upgrade37%
REVENUE GAINSDonor Retention
2015
46%
Net Change
in Donors 2.0%
New79%
Recapture21%
DONOR GAINS

2 | P a g e
(The basic concept of the Fundraising Effectiveness Survey is that growth in giving from one year to the next is the net of gains minus losses.)
Gains of $4.695 billion in gifts were generated from new, upgraded current, and previously lapsed donors were offset by losses of $4.264 billion through reduced gifts and lapsed donors. This means that, while there was a positive $431 million) net gain-in-giving, every $100 gained in 2015 was offset by $91 in losses through gift attrition.
Gains of 4.547 million in new and previously lapsed donors were offset by losses of 4.386 million in lapsed donors. This means that there was a growth- of 161,000-donors, and every 100 donors gained in 2015 was offset by 96 lost donors through attrition.
Growth-in-giving performance varies significantly according to organization size (based on total amount raised), with larger organizations performing much better than smaller ones.
o Organizations raising $500,000 or more had a median 10.7 percent rate of growth.
o Organizations raising $100,000 to $500,000 had a median 0.6 percent rate of growth.
o Organizations in the under $100,000 groups had a median loss of -11.8 percent.
The largest growth in gift dollars/donors came from new gifts/donors, and the pattern was most pronounced in the organizations with the highest growth-in-giving ratios.
The greatest losses in gift dollars came from lapsed repeat and downgraded gifts, particularly in the organizations with the lowest growth-in-giving ratios. The greatest losses in donors came from lapsed new donors in all growth-in-giving categories.
The average donor retention rate in 2015 was 46 percent; no change from 2014’s rate. The gift or dollar retention rate 48 percent, no change from in 2014. Over the last 10 years, donor and gift or dollar retention rates have consistently been weak -- averaging below 50 percent.
o The donor retention rate was 46 percent in 2015. That is, only 46 percent of 2014 donors made repeat gifts to participating nonprofits in 2015.
o The gift retention rate was 48 percent in 2015. That is, only 48 percent of 2014 dollars raised were raised again by participating nonprofits in 2015.
About the Fundraising Effectiveness Project
In 2006 the Association of Fundraising Professionals (AFP) and the Center on Nonprofits and Philanthropy at the Urban Institute established the Fundraising Effectiveness Project to conduct research on fundraising effectiveness and help nonprofit organizations increase their fundraising results at a faster pace. Organizations listed on the cover page have joined them in endorsing the project.
The project goal is to help nonprofit organizations measure, compare, and maximize their annual growth in giving.
Making the Most of the Enormous Untapped Giving Potential
For decades, research has indicated that there is an enormous untapped potential for giving in the United States. Yet, total giving as a percentage of gross domestic product (GDP) has averaged a flat two percent for the last 40 years. In addition to the annual FEP surveys, FEP research is also addressing the question: why hasn’t the sector been able to tap this potential and increase its share of the GDP pie?
3 | P a g e
The Fundraising Effectiveness Survey
The groundbreaking annual Fundraising Effectiveness Survey, piloted in November 2006, collects fundraising data from nonprofit organizations beginning with data for 2004-2005. The Fundraising Effectiveness Survey enables participating groups to measure and compare their fundraising gain and loss ratios to those of similar organizations. Participants can use this industry data, which AFP offers free, to make better-informed, growth-oriented budget decisions to boost donor revenue.
Donor Software Firms Facilitate Nonprofits’ Participation
A critical element in the success of the Fundraising Effectiveness Survey since 2006 has been the cooperation and support of the members of the AFP Donor Software Group listed on the cover page. Collectively, they serve more than 50,000 nonprofit clients. If your donor software provider is not on this list, please ask them to participate. The four GiG Database data providers identified with “*” on the cover page have converted their data submission processes to the new gift transaction method that allows for a much broader set of performance measures than the original FEP giving data extract (2007). FEP is also planning to convert the analytics for the annual survey to take advantage of the gift transaction method.
The AFP Donor Software Workgroup (2006 to 2014) developed and recommended to AFP for endorsement the core FEP Gain/Loss Growth-in-Giving Performance Report (see Figure A1, Appendix A) for use by all nonprofits to measure their growth in giving. The content of this basic FEP report has remained unchanged since the FEP was initiated.
Note that your organization does not have to be a participant in the annual FEP surveys in order to have access to the annual FEP report and the comparative performance statistics in Appendix A.
Nonprofits Prepare Their Own Fundraising Performance Reports
The FEP project has developed two downloadable Excel-based templates that nonprofits can use to produce their own Growth-in-Giving reports, enabling them to measure their Gain/Loss performance over time and against the statistics in the appendices of the annual FEP reports. The templates and a video on how to populate the templates with your organization’s data may be found online at www.afpfep.org/tools/
In collaboration with PSI/Adventist, FEP has developed a Fundraising Fitness Test template that allows nonprofits to measure and evaluate their fundraising programs against a set of over 100 performance indicators by five donor giving levels. The fundraising performance reports are generated by inserting gift transaction data into the Fundraising Fitness Test Excel template. There are instructions for retrieving gift transaction data from donor databases and inserting the data into the Fitness Test template. The performance reports can be generated for each year as far back as your gift transactions history goes. Performance indicators include: donor retention rates (new donor retention, repeat donor retention and overall donor retention); donor gains, losses and net; dollar gains, losses and net; growth in giving ($); growth in number of donors; and donor attrition. Gift range categories are $5,000 & up, $1,000 to $4,999, $250 to $999, $100 to 249 and Under $100.
The core Growth-in-Giving Report is a second separate Excel-based template that provides a concise, yet informative picture of fundraising gains and losses--growth in giving and attrition--in simple, reader-friendly format that executive staff and board members can understand. This report, along with 6 other Growth-in-Giving Reports that are also useful, is described in detail in the article “A Better Measure of Success: How to Use AFP’s Growth-in-Giving Reports to Improve Fundraising Performance” in the March-April, 2011, issue of Advancing Philanthropy introduces the Growth-in-Giving Reports, describes them and explains how to use them with

4 | P a g e
CEOs and boards to help justify growth-oriented fundraising budgets. A copy of the article in PDF is available at http://www.afpnet.org/files/ContentDocuments/2011MarchApril_135-41FEPLevisWilliams.pdf. The Growth-in-Giving Reports are generated by inserting gift transaction data into the downloadable Excel-based Growth-in-Giving Report template in the same manner as for the Fundraising Fitness Test template. The same instructions for retrieving gift transaction data from donor databases and inserting the data into the Growth-in-Giving Reports template apply.
All the Fundraising Fitness Test reports and Growth-in-Giving Reports are growth-oriented fundraising tools for tracking growth in giving by various performance indicators, gift ranges and gain(loss) categories. Growth-in-Giving reports can show performance for the fundraising program overall, as well as for each fundraising activity, such as direct mail and major gifts. Based on these reports, fundraising managers can recommend detail-level strategies by gain/loss category for each fundraising activity.
Articles on using the Fitness Test appear in the Advancing Philanthropy
“How Fit Is Your Organization?” (Winter 2014) found at: http://www.afpnet.org/files/ContentDocuments/22-27%20How%20Fit%20is%20Your%20Organization.pdf and
“Go for the Burn!” (Fall 2014) found at http://www.afpnet.org/files/ContentDocuments/58-60%20Management%20Fall%202014.pdf.
For more information on using the Fitness Test and the Growth-in-Giving template, see Appendix B of this report.
Why Analyzing Fundraising Gains and Losses Is Important for Fundraising Effectiveness
Although nonprofit organizations usually watch their overall growth-in-giving results carefully, they seldom pay as close attention to the gains and losses that make up those results.
Looking only at the overall net performance (the “bottom line”) does not tell management and boards what is really happening in their fundraising or where to invest additional resources to improve fundraising effectiveness. Neither is it sufficient to look only at the new gifts coming in. To understand what is really happening in a way that is useful for planning and budgeting, it is necessary to analyze both the fundraising gains and the fundraising losses – in dollars and donors -- from one year to the next. Significant losses can substantially reduce or eliminate the gains. For example, an organization that has gains in annual giving of 65% from one year to the next but has annual giving losses of 55%, achieves a net growth-in-giving of only 10%.
Growth in giving is increased both by maximizing gains and minimizing losses, and management and boards need to know this to make intelligent, informed, growth-oriented planning and budgetary decisions.
The basic concept of the Fundraising Effectiveness Survey is that growth in giving from one year to the next is the net of gains minus losses. Gains consist of gifts by new donors and recaptured lapsed donors and increases in gift amounts by upgraded donors. Losses consist of decreases in gift amounts by downgraded donors and lost gifts from lapsed new and lapsed repeat donors. The net increase (or decrease) is the net of gains minus losses.

5 | P a g e
Continuing with the above example of an organization with gains of 65% and losses of 55% for a net of 10%, increasing gains by 10 percentage points—from 65% to 75%—would double the net growth from 10% to 20%.
Reducing losses by 10 percentage points—from 55% to 45%—would also double the net from 10% to 20%. And, a reduction of losses by 20 percentage points—to 35%—would triple the net to 30%.
It usually costs less to retain and motivate an existing donor than to attract a new one. For most organizations—and especially those that are sustaining losses or achieving only modest net gains in gifts and donors—taking positive steps to reduce gift and donor losses is the least expensive strategy for increasing net fundraising gains.
The data provided by the Fundraising Effectiveness Survey makes it possible for fundraisers, management, and boards of nonprofit organizations to not only compare the performance of their organization from one year to the next, but also to compare with the performance of other organizations in terms of total dollars raised and total number of donors in a variety of categories. With this information, they can make more informed, growth-oriented decisions about where to invest increased resources and effort to improve their fundraising effectiveness.

6 | P a g e
The Survey makes the following data available for each year in the database.
Total gift dollars
Gains:
$ gained from new donors in current year
$ gained from recaptured donors (former donors who did not give in previous year)
$ gained from upgraded donors (donors who increased their gift from previous year)
Same: $ from donors who gave the same amount as in previous year
Losses:
$ lost from downgraded donors (donors who gave less in the current year than in previous year)
$ lost from lapsed new donors (new donors in the previous year who did not give in current year)
$ lost from lapsed repeat donors (repeat donors in previous year who did not give in current year)
Total number of donors
Gains:
# of new donors gained in the current year
# of recaptured donors gained (former donors who did not give in the previous year)
# of upgraded donors (donors who increased their gift from the previous year)
Same: # of donors who gave the same amount as in the previous year
Losses:
# of downgraded donors (donors who gave less in the current year than in the previous year)
# of lapsed new donors (new donors in the previous year who did not give in the current year)
# of lapsed repeat donors (repeat donors in the previous year who did not give in the current year)
As the survey proceeds, data is added to the database each year, providing historical data for analysis of trends over time (see eight-year comparison of gain/loss ratios, Figure A2a and A2b, Appendix A).
The charts and tables in this report are based on data for 9,922 respondents for the year 2014-2015.
7 | P a g e
Project Method
Automatic Data Extraction
Participating donor software firms provide gift transaction data from their clients to a database at the Urban Institute. All information supplied by the software firms is kept strictly anonymous and confidential. Results are reported in aggregate form.
The FEP uses the data to calculate the gain and loss ratios of gift dollars and number of donors gained and lost from one year to the next. For example, for 2015 compared to 2014 in the gain/loss ratios illustrated below: The FEP generates the comparative gain/loss growth-in-giving performance statistics for groups of responses by size, subsector, age, region, rate of growth in gifts, percentile ranking, and survey year found in Appendix A and by growth segments (percentile ranking) in Figures 6a to 6c and 7a to 7c.
Gain/Loss Ratios
The gain or loss ratio for each category is calculated as:
Gain/Loss Ratio = survey-year gains or losses in each category
prior year total results
Illustrative gift-dollar Gain/Loss Ratios based on FEP survey data for 2014-2015 (Figure 1)
Gain ratio = $ 4,695,840,829 in total gains in giving in survey year = 57.3%
$ 8,196,569,850 total gifts in prior year
Loss ratio = $ -4,264,169,979 in total losses in giving in survey year = -52.0%
$ 8,196,569,850 total gifts in prior year
The gain and loss ratios form the basis for this report.
A Note About the Data
In the FEP database, funds raised include cash gifts, pledge payments, recurring gift payments, gifts of marketable securities, and the gift portion of special event income. These gifts are counted whether they are unrestricted or restricted. Funds raised exclude pledges and pledge balances, all in-kind donations (such as equipment, materials, services or use of facilities), deferred gifts (such as known bequests and charitable remainder trusts or annuities) and the costs-benefiting-donors portion of special event income.
Three further characteristics of the FEP database are important to understand:
First, the FEP database is not static. It continually grows and becomes more data-rich as new participating organizations join the project and add their fundraising data to the project. Some of these data are for the year the organization joins, but some are for previous years, as well. Thus, the FEP database is subject to change from year to year, even data for past years, as new data collections are added. As a result, statistics calculated at different times for any particular year may show slight differences. These differences are not significant enough to alter the general patterns in the data that show the large negative impact that donor attrition and poor retention have on fundraising results.
Second, data for any given year in the FEP database do not reflect exactly the same time period for all organizations. This is because the data reflect each organization’s fiscal year. Some organizations end their fiscal year on December 31, some on March 31, and some on June 30 or another date. These differences should have no practical effect on the findings because each organization’s performance is based on consistent 12-month intervals over time.

8 | P a g e
Third, the results reported here are not representative of the entire nonprofit sector, since the data collected for the FEP surveys are collected via voluntary submissions, not from a representative sampling of all nonprofit organizations. Most participants in the surveys are small to midsize organizations—averaging $1,043 in annual giving for the 9,922 responses reflected in this report. One reason this average is relatively low is because many large organizations with proprietary software or “enterprise” systems are not participating in the survey.
9 | P a g e
Summary of 2014-2015 FEP Survey Findings
Overview
The 2016 Fundraising Effectiveness Survey Report is based on 9,922 responses for 2014-2015 from nonprofit organizations in the United States. These responses reflect a total amount raised of $8,628,240,699, for an average of $869,607 in amount raised.
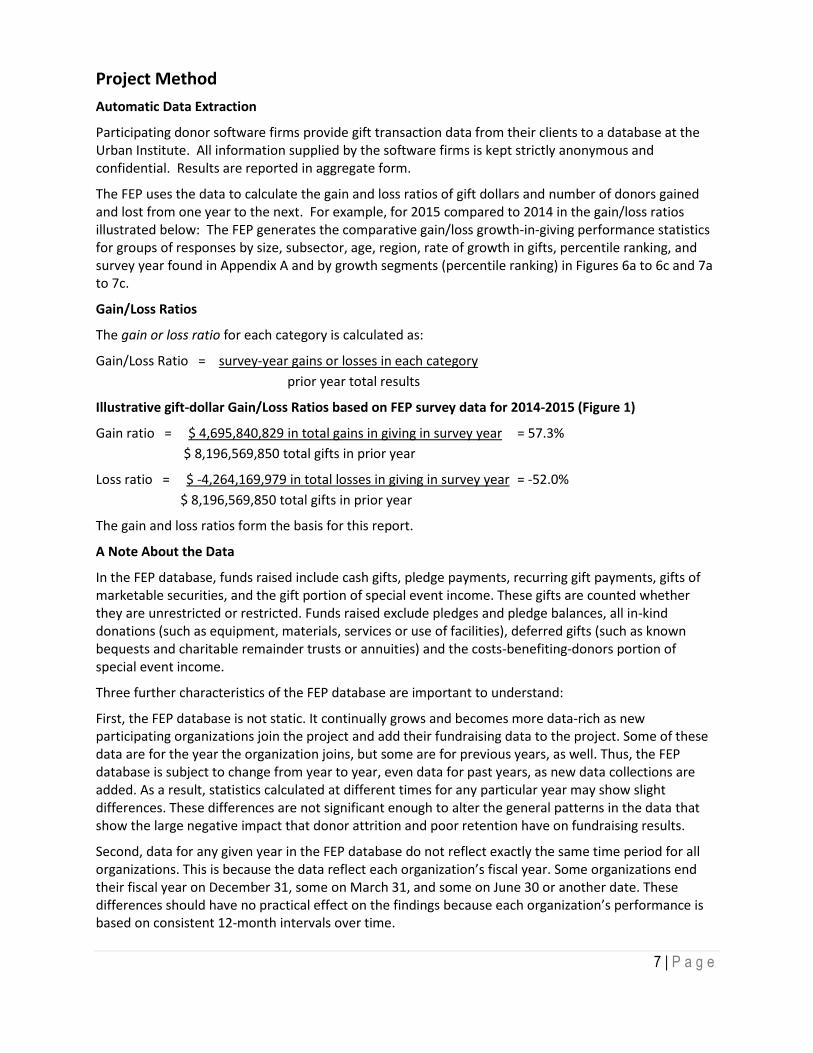
As shown in Figure 1, gains of $4.696 billion (57.3%) in gifts were offset by losses of $4.264 billion (-52.0%) through gift attrition. This means that every $100 gained in 2015 was offset by $91 in losses through gift attrition. That is, 91 percent of gains in giving were offset by losses in giving.
The overall, bottom-line, year-to-year growth in giving rate reported in the 9,922 FEP survey responses with data for 2014-2015 was 5.3 percent (Figure 1). That is, as a group, the organizations raised $8,198,569,850 in the previous year and $8,628,240,000 in the current year for an overall increase of $431,670,849. This equates to an overall growth-in-giving ratio of 5.3 percent (i.e.,57.3% --52.0%)
The basic FEP concept is that growth in giving from one year to the next is the net of gains minus losses.
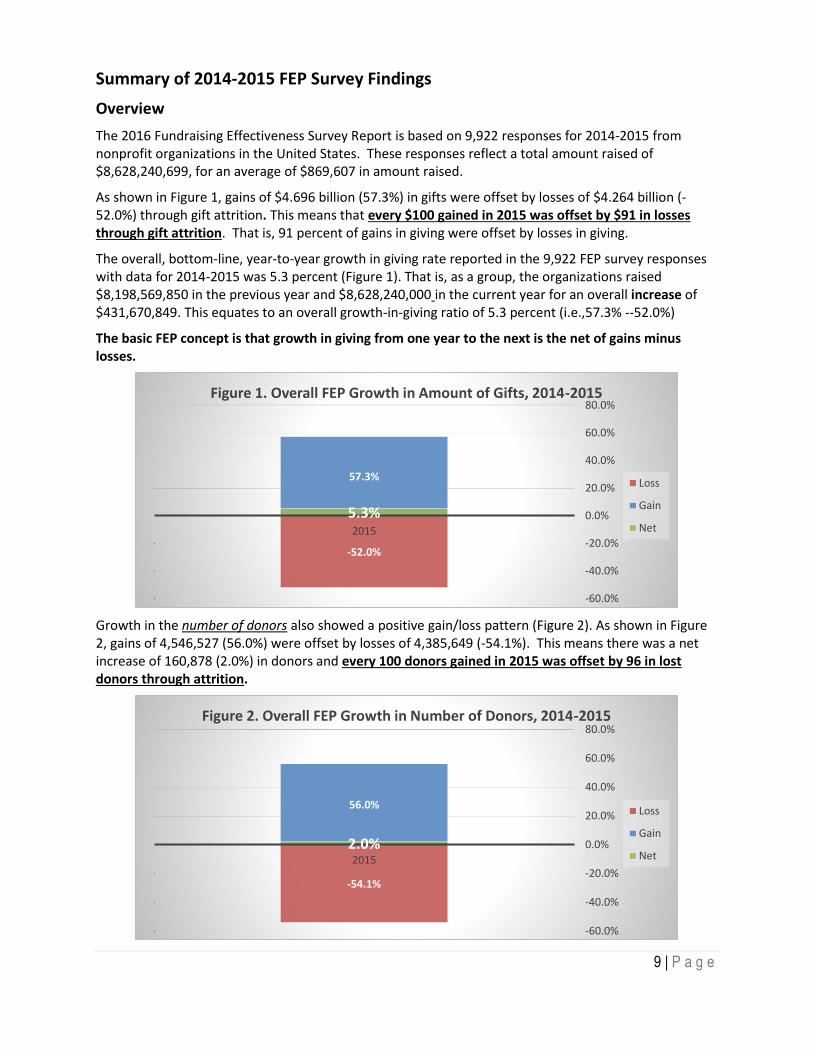
Growth in the number of donors also showed a positive gain/loss pattern (Figure 2). As shown in Figure 2, gains of 4,546,527 (56.0%) were offset by losses of 4,385,649 (-54.1%). This means there was a net increase of 160,878 (2.0%) in donors and every 100 donors gained in 2015 was offset by 96 in lost donors through attrition.
57.3%
-52.0%
5.3%
-60.0%
-40.0%
-20.0%
0.0%
20.0%
40.0%
60.0%
80.0%
2015
Figure 1. Overall FEP Growth in Amount of Gifts, 2014-2015
Loss
Gain
Net
56.0%
-54.1%
2.0%
-60.0%
-40.0%
-20.0%
0.0%
20.0%
40.0%
60.0%
80.0%
2015
Figure 2. Overall FEP Growth in Number of Donors, 2014-2015
Loss
Gain
Net

10 | P a g e
Gains and Losses by Category
The survey organizations had sizeable growth in gifts from new, upgraded, and recaptured donors. These gains were offset by losses in gifts from downgraded, lapsed new, and lapsed repeat donors. As a result, net growth in the amount of gifts was just 5.3%.
Gains in the number of new and recaptured donors were offset by losses in the number of lapsed new and lapsed repeat donors, producing a net gain in donors of just 2.0%.
Total Net Growth for 2015 5.3%
Total Net Growth for 2015 2%
11 | P a g e
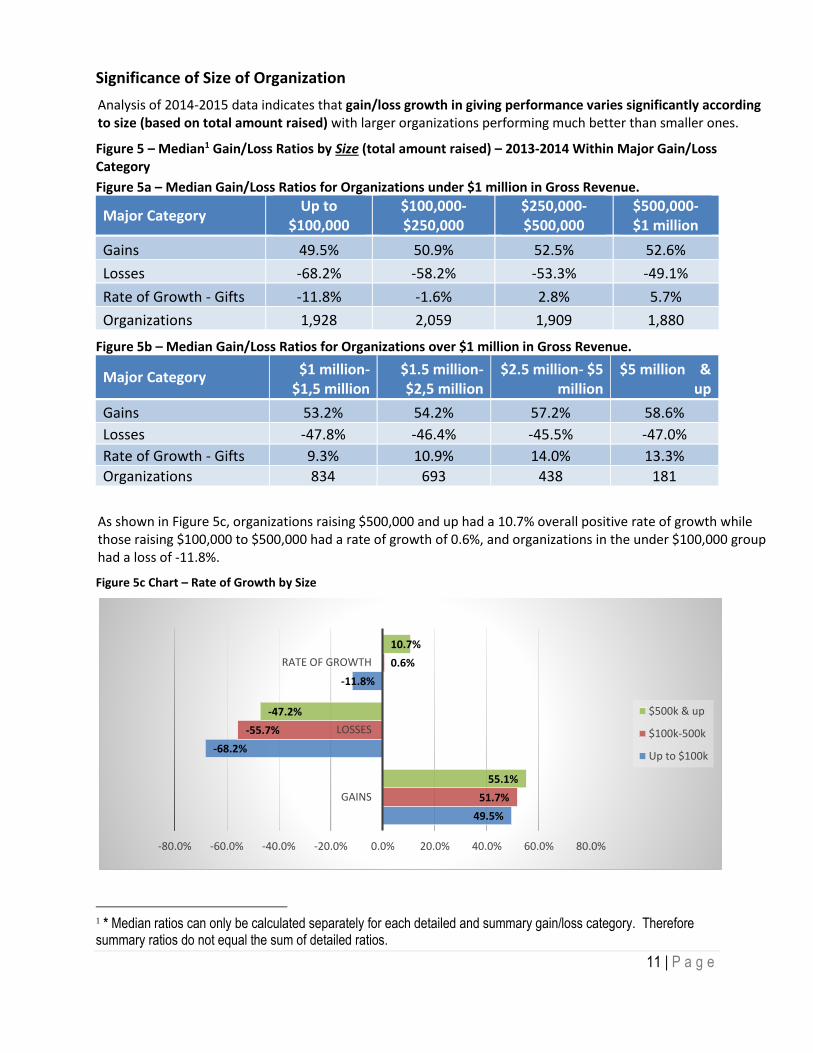
Significance of Size of Organization
Analysis of 2014-2015 data indicates that gain/loss growth in giving performance varies significantly according to size (based on total amount raised) with larger organizations performing much better than smaller ones.
Figure 5 – Median1 Gain/Loss Ratios by Size (total amount raised) – 2013-2014 Within Major Gain/Loss Category
Figure 5a – Median Gain/Loss Ratios for Organizations under $1 million in Gross Revenue.
Major Category Up to
$100,000 $100,000-$250,000
$250,000-$500,000
$500,000- $1 million
Gains 49.5% 50.9% 52.5% 52.6%
Losses -68.2% -58.2% -53.3% -49.1%
Rate of Growth - Gifts -11.8% -1.6% 2.8% 5.7%
Organizations 1,928 2,059 1,909 1,880
Figure 5b – Median Gain/Loss Ratios for Organizations over $1 million in Gross Revenue.
Major Category $1 million-$1,5 million
$1.5 million-$2,5 million
$2.5 million- $5 million
$5 million & up
Gains 53.2% 54.2% 57.2% 58.6%
Losses -47.8% -46.4% -45.5% -47.0%
Rate of Growth - Gifts 9.3% 10.9% 14.0% 13.3%
Organizations 834 693 438 181
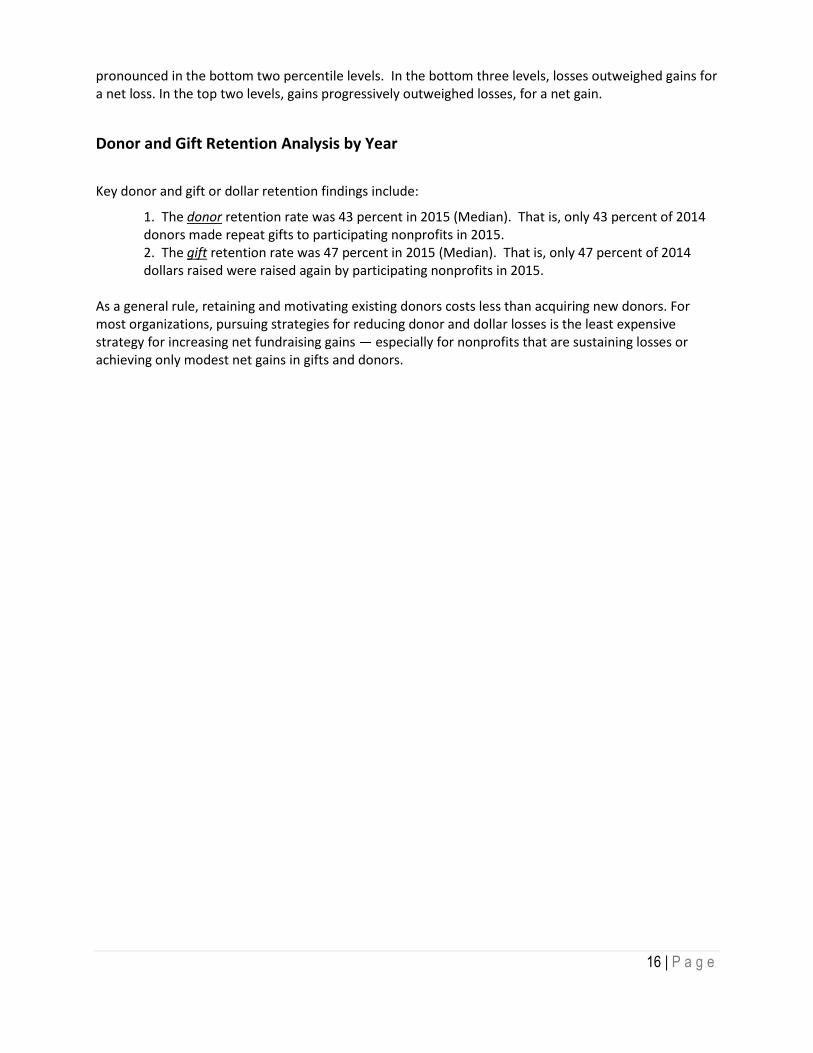
As shown in Figure 5c, organizations raising $500,000 and up had a 10.7% overall positive rate of growth while those raising $100,000 to $500,000 had a rate of growth of 0.6%, and organizations in the under $100,000 group had a loss of -11.8%.
Figure 5c Chart – Rate of Growth by Size
1 * Median ratios can only be calculated separately for each detailed and summary gain/loss category. Therefore summary ratios do not equal the sum of detailed ratios.
49.5%
-68.2%
-11.8%
51.7%
-55.7%
0.6%
55.1%
-47.2%
10.7%
-80.0% -60.0% -40.0% -20.0% 0.0% 20.0% 40.0% 60.0% 80.0%
GAINS
LOSSES
RATE OF GROWTH
$500k & up
$100k-500k
Up to $100k

12 | P a g e
See detailed statistics by size in Figure A3a, Appendix A
Further analysis of the three major gain/loss categories indicates that the gain ratios were similar (50% to 59%) for all organizations regardless of size. The variance in overall rate of growth is due mostly to differences in losses where the smaller up-to-$100,000 organizations had losses in gifts of -68.2%, the $100,000-$500,000 group had losses of -58.2% and the larger $500,000 and up organizations lost -47.2% of prior year gifts.
Gains and Losses by Percentile
Figures 6 and 7 show average gain and loss ratios for the amount of gifts and number of donors by gain and loss category for each of five percentile performance levels, from the bottom 20% to the top 20% in growth. As one might expect, the top 20% of organizations far out-performed the bottom 20% in all gain/loss categories.
The goal for any nonprofit organization should be to identify the categories where it needs to improve its fundraising effectiveness in order to move up from one percentile level to the next.
Figure 6 shows the gains and losses in amount of gifts for each of the five percentile levels. In all levels, new gifts were the largest source of gains. Losses were much greater than gains in the bottom two levels, with losses from lapsed new donors the most dramatic.
Note that the ratios for each gain and loss category are computed separately, based on separate sorts of the gain, loss and net ratios or percentages for each gain/loss category. Therefore, the ratios for the Percentile Levels for All Gains and All Losses are not subtotals, and the ratios for Net Gain (Loss) are not totals.
Figure 6a. Gain Ratios for Amount of Gifts by Percentile Level for the Three Gain Categories, 2014-2015
Figure 6a shows that in all percentile levels, the largest growth came from new gifts, and the pattern was most pronounced in the highest levels.
0%
10%
20%
30%
40%
50%
60%
70%
80%
90%
100%
BOTTOM20%
20-40% 40-60% 60-80% TOP 20%
New 5.2% 12.0% 20.5% 35.8% 88.2%
Recapture 0.2% 3.7% 7.4% 12.7% 28.5%
Upgrade 3.6% 9.2% 14.9% 22.6% 45.1%

13 | P a g e
Figure 6b. Loss Ratios for Amount of Gifts by Percentile Level for the Three Gain Categories, 2014-2015
Figure 6b shows that in the bottom 20% of organizations the sources of greatest losses were lapsed new and lapsed repeat gifts and in the top 20% the source of greatest losses was downgraded gifts. In the other percentile levels, the losses were fairly evenly distributed among downgraded, lapsed new and lapsed repeat gifts.
Figure 6c. Overall Gain/Loss Ratio for Amount of Gifts by Percentile Level, 2014-2015
-60%
-50%
-40%
-30%
-20%
-10%
0%
BOTTOM 20% 20-40% 40-60% 60-80% TOP 20%
Downgrade -30.9% -19.6% -14.2% -9.8% -4.6%
Lapsed new -48.0% -24.3% -14.3% -8.2% -3.5%
Lapsed repeat -38.6% -22.3% -14.7% -8.7% -0.5%
-46.1%
-16.5%
2.6%
25.2%
94.4%
-60%
-40%
-20%
0%
20%
40%
60%
80%
100%
120%
-100%
-50%
0%
50%
100%
150%
200%
BOTTOM20%
20-40% 40-60% 60-80% TOP 20%
All Losses -81.2% -65.7% -54.5% -43.7% -30.9%
All Gains 21.5% 37.0% 52.2% 76.3% 147.5%
Net Gain (Loss) -46.1% -16.5% 2.6% 25.2% 94.4%

14 | P a g e
Figure 6c shows the net gain in amount of gifts for each of the five percentile levels. In the bottom two levels, losses outweighed gains for a net loss. In the top three levels, gains progressively outweighed losses, for a net gain.
Figure 7a. Gain Ratios for Number of Donors by Percentile Level for the Two Gain Categories, 2014-2015
Figure 7a shows that in all percentile levels the greatest gains in number of donors came from new donors.
Figure 7b. Loss Ratios for Number of Donors by Percentile Level for the Two Gain Categories, 2014-2015
0%
20%
40%
60%
80%
100%
120%
BOTTOM20%
20-40% 40-60% 60-80% TOP 20%
New 15.3% 27.5% 39.7% 57.6% 105.7%
Recapture 0.5% 6.8% 11.5% 16.1% 24.4%

15 | P a g e
Figure 7b shows that in all percentile levels the greatest losses came from lapsed new donors.
Figure 7c. Overall Gain/Loss Ratio for Number of Donors by Percentile Level, 2014-2015
Figure 7c shows the net gain in number of donors for each of the five percentile levels. In all segments, gains came primarily from new donors. Losses came primarily from lapsed new donors and were most
-70%
-60%
-50%
-40%
-30%
-20%
-10%
0%
BOTTOM20%
20-40% 40-60% 60-80% TOP 20%
Lapsed new -64.3% -46.3% -34.7% -24.6% -14.0%
Lapsed repeat -34.2% -25.8% -21.0% -15.1% -1.0%
-39.1%
-12.8%-0.6%
14.2%
63.1%
-60%
-40%
-20%
0%
20%
40%
60%
80%
-100%
-50%
0%
50%
100%
150%
BOTTOM20%
20-40% 40-60% 60-80% TOP 20%
All Losses -80.2% -66.5% -56.9% -48.0% -36.9%
All Gains 26.5% 41.0% 53.5% 70.5% 119.5%
Net Gain (Loss) -39.1% -12.8% -0.6% 14.2% 63.1%
16 | P a g e
pronounced in the bottom two percentile levels. In the bottom three levels, losses outweighed gains for a net loss. In the top two levels, gains progressively outweighed losses, for a net gain.
Donor and Gift Retention Analysis by Year
Key donor and gift or dollar retention findings include:
1. The donor retention rate was 43 percent in 2015 (Median). That is, only 43 percent of 2014 donors made repeat gifts to participating nonprofits in 2015. 2. The gift retention rate was 47 percent in 2015 (Median). That is, only 47 percent of 2014 dollars raised were raised again by participating nonprofits in 2015.
As a general rule, retaining and motivating existing donors costs less than acquiring new donors. For most organizations, pursuing strategies for reducing donor and dollar losses is the least expensive strategy for increasing net fundraising gains — especially for nonprofits that are sustaining losses or achieving only modest net gains in gifts and donors.

17 | P a g e
Figure 8 shows the retention rates by year going back to the beginning of the FEP annual survey with the 2004-05 figures. Figure 8 – Donor and Gift Retention Analysis – 2005-2014
Year Overall Gift Retention Rate Overall Donor Retention Rate
2005 46.4% 49.7%
2006 44.5% 46.2%
2007 48.1% 46.7%
2008 43.3% 45.2%
2009 43.0% 40.5%
2010 45.1% 42.7%
2011 45.0% 41.5%
2012 43.4% 43.2%
2013 47.4% 42.8%
2014 47.2% 45.7%
2015 48.0% 45.9%
Average 45.6% 44.5%
See also “2015 FEP Donor Retention Supplement,” which can be downloaded from www.afpfep.org.
Detailed Statistics
To facilitate additional comparisons, further breakdowns of the FEP gain/loss data are presented in Appendix A. Figure A1 shows the gains, losses, and net gain/loss ratios in amount of gifts and number of donors by gain and loss categories. Figures A3 through A8 show these numbers further broken down by size of fundraising gain or loss, type of nonprofit organization, region, age of the fundraising program, rate of growth, and percentile level.
48%46%
0%
10%
20%
30%
40%
50%
60%
2005 2006 2007 2008 2009 2010 2011 2012 2013 2014 2015
Overall Gift Retention Rate Overall Donor Retention Rate
Overall Gift Retention Rate - Average Overall Donor Retention Rate - Average
Average Donor Retention – 44.5%
Average Gift Retention – 45.6%

18 | P a g e
All of the gain/loss ratio statistics in figures A3 through A8 are medians rather than means/averages. When ratios are calculated using medians, the gain/loss ratio from every response carries the same weight, regardless of size (total amount of gifts). This eliminates the need to have separate FEP reports based on size. Note that median ratios can only be calculated separately for each detailed and summary gain/loss category. Therefore summary ratios do not equal the sum of detailed ratios.

19 | P a g e
Implications of the FEP Data for Fundraising Decision Makers
Examining the Ratio of Gains to Losses
In the FEP data, clearly the most salient pattern is the extent that gains are offset by losses. Every $100 the nonprofit organizations gained in upgraded, new, and recovered gifts was offset by $91 in losses from downgraded and lapsed gifts. Every 100 new and recovered donors recruited was offset by 96 donors lost through attrition. In previous years of the study, particularly in 2005-2007, the offset ratios were more favorable (see Figure 9).
Figure 9 - FEP Gain-Loss Offset Ratios– 2005 to 2015
FEP Survey Year $ Lost for every $100 Gained Donors Lost for every 100 Donors Gained
2014-15 ($91) ($96)
2013-14 ($95) ($103)
2012-13 ($92) ($102)
2011-12 ($96) ($105)
2010-11 ($100) ($107)
2009-10 ($105) ($97)
2008-09 ($119) ($104)
2007-08 ($105) ($99)
2006-07 ($86) ($87)
2005-06 ($93) ($92)
2004-05 ($81) ($82)
Average ($96) ($97)
These findings suggest that nonprofit decision makers should examine their organizations’ net return on investment in each gift and donor category and compare the results among categories. If their donor tracking and accounting systems do not currently report the returns on fundraising investment by category, decision makers would be well advised to take steps to ensure that these systems do so in the future.
Strategies Suggested by FEP
Budgeting for fundraising that is cost effective, goal-oriented, and growth-oriented requires that, year-after-year, organizations:
1. Make significant, incremental increases in their budgets, by categories of fundraising effort.
2. Measure the corresponding incremental return on those investments (ROI), by gain/loss categories.
3. Make additional incremental increased investments in fundraising effort, category by category, based on the performance (ROI) of previous fundraising activities.
The FEP strategies are especially helpful to those fundraising professionals who could raise more money if they had the budget to employ more staff. The question every development director needs to ask is: Could I raise more money if I could hire one more fundraising professional?

20 | P a g e
To reiterate a point made earlier, usually it costs less to retain and motivate an existing donor than to attract a new one, and so taking positive steps to reduce gift and donor losses is often the best strategy to increase net fundraising gains at the least cost.
Investing to Maximize Fundraising Results
Nonprofit organizations should compare their results category-by-category with those of the FEP not only to see how they stack up but also to see where they should invest budgets and effort to maximize their fundraising net gain.
When measuring, comparing, and evaluating their organization’s growth-in-giving performance, nonprofits can compare their performance ratios, by gain/loss categories, against:
FEP Survey growth-in-giving performance statistics for peer-group organizations selected by level of giving, age of development program, location, subsector, rate of growth, and percentile level (See Figures A3 through A8 in Appendix A).
Their own prior period performance (trend analysis)
Their performance goals (income budgets)
Setting Fundraising Goals for Doubling Annual Giving
Nonprofits can use the following table for setting overall performance goals for doubling annual giving within a specific number of years. For example, to double giving in 5 years requires an average annual rate of growth of 14.9%.
Rate of Growth in Giving Table
Years to Double Rate of Growth
1 100.0%
2 41.5%
3 26.0%
4 18.9%
5 14.9%
6 12.2%
7 10.4%
8 9.1%
9 8.0%
10 7.2%*
*33-year average (7.6%, 1970-2003) Giving USA
21 | P a g e
According to Giving USA, the average annual rate of growth for all nonprofits from 1970 to 2003 was about 7.6 percent, doubling every 9 or 10 years. To keep up with the annual growth in GDP (i.e., doubling every 10 years) would require a growth rate of 7 or 8 percent per year.
Taking the Next Steps
If your donor tracking and accounting systems do not currently report fundraising investment and results by gain/loss category, you should take steps to ensure that they do so in the future.
For instructions on how to configure your donor tracking data, and use the Growth-in-Giving Report template and the Growth-in-Giving Fundraising Fitness Test to evaluate your own organization, please see Appendix B of this report.

22 | P a g e
Appendices
A. Detailed 2014-2015 Fundraising Effectiveness Survey Statistics
The numbers in the tables in this appendix reflect 9,922 responses for 2014-2015
Figure A1. Gain/Loss Growth-in-Giving Performance Report – 2014-2015
Gain/Loss Category 2014 2015 Gains (Losses) Average
Gain/Loss Ratio Median*
Gain/Loss Ratio
Amount of Gifts
Gains
New $0 $2,041,610,537 $2,041,610,537 24.91% 20.49%
Recapture $0 $898,906,398 $898,906,398 10.97% 7.45%
Upgrade $1,658,303,609 $3,413,627,502 $1,755,323,893 21.42% 14.93%
Subtotal gains $1,658,303,609 $6,354,144,437 $4,695,840,829 57.29% 52.20%
Same $833,968,262 $833,968,262 $0 0.00% 0.00%
Losses
Downgrade $3,038,183,504 $1,440,128,000 -$1,598,055,503 -19.50% -14.20%
Lapsed new $1,243,088,847 $0 -$1,243,088,847 -15.17% -14.29%
Lapsed repeat $1,423,025,629 $0 -$1,423,025,629 -17.36% -14.74%
Subtotal losses $5,704,297,980 $1,440,128,000 -$4,264,169,979 -52.02% -54.47%
Total – gifts $
8,196,569,850 $8,628,240,699 $431,670,849 5.27% 2.56%
Number of Donors
Gains
New
0 3,572,621 3,572,621 44.03% 39.71%
Recapture 0.0002 973,906 973,906 12.00% 11.48%
Upgrade 1,504,304 1,504,304 0 0.00% 0.00%
Subtotal gains 1,504,304 6,050,831 4,546,527 56.04% 53.46%
Same 1,046,345 1,046,345 0 0.00% 0.00%
Losses 0 0 0 0 0
Downgrade 1,177,024 1,177,024 0 0.00% 0.00%
Lapsed new 2,729,787 0.0002 -2,729,787 -33.65% -34.68%
Lapsed repeat 1,655,862 0.0002 -1,655,862 -20.41% -20.96%
Subtotal losses 5,562,673 1,177,024 -4,385,649 -54.05% -56.92%
Total – donors 8,113,322 8,274,200 160,878 1.98% -0.57%
Avg. gift size $ 1,043 $ 1,043
Median ratios can only be calculated separately for each detailed and summary gain/loss category. Therefore summary ratios do not equal the sum of detailed ratios.

Figure A2a. Amount of Gifts Median* Gain/Loss Ratios by Survey Year – 2005-2015 Within Gain/Loss Category
Gain/Loss Category
2015 2014 2013 2012 2011 2010 2009 2008 2007 2006 2005 Avera
ge
Gains:
New 20.5% 19.5% 20.6% 20.6% 19.6% 20.7% 20.0% 18.7% 22.6% 27.2% 25.2% 23.7% Recapture 7.4% 8.6% 8.3% 8.3% 7.1% 7.7% 7.6% 6.6% 6.9% 8.4% 8.2% 8.5%
Upgrade 14.9% 14.9% 14.9% 14.9% 12.8% 14.1% 13.6% 12.3% 13.8% 17.3% 17.3% 16.1%
All gains combined 52.2% 53.2% 54.3% 54.3% 50.7% 52.7% 53.1% 46.8% 54.4% 65.7% 62.2% 60.7%
Losses:
Downgrade -14.2% -13.9% -14.1% -14.1%
-14.3% -13.4% -14.3% -15.7% -15.2% -13.6% -14.5% -15.7%
Lapsed new -14.3% -12.3% -12.8% -12.8%
-14.4% -14.5% -14.1% -15.1% -15.5% -14.5% -14.1% -15.3%
Lapsed repeat -14.7% -15.4% -15.1% -15.1%
-17.1% -15.7% -15.2% -15.3% -14.7% -13.0% -12.4% -15.9%
All losses combined -54.5% -52.9% -53.8% -53.8%
-59.5% -57.7% -56.5% -60.4% -58.8% -54.8% -54.6% -60.9%
Rate of growth - gifts 2.6% 4.4% 4.6% 4.6% -2.5% 1.8% 1.1% -5.6% 0.6% 16.2% 13.2% 5.4%
Figure A2b. Number of Donors Median* Gain/Loss Ratios by Survey Year – 2005-2015 Within Gain/Loss Category
Gain/Loss Category
2015 2014 2013 2012 2011 2010 2009 2008 2007 2006 2005 Avera
ge
Gains:
New 39.7% 39.3% 40.6% 40.6% 38.0% 39.2% 41.0% 41.7% 43.3% 46.0% 43.7% 45.4%
Recapture 11.5% 13.0% 13.0% 13.0% 11.6% 11.6% 11.7% 11.8% 11.5% 12.2% 12.8% 13.3%
All gains combined 53.5% 53.8% 55.6% 55.6% 52.5% 52.9% 55.3% 55.8% 58.3% 60.2% 60.3%
61.2%
Losses:
Lapsed new -34.7%
-32.7% -33.6% -33.6% -34.6% -35.5% -35.6% -36.3% -35.4% -33.5% -33.3% -37.4%
Lapsed repeat -21.0%
-21.8% -21.4% -21.4% -22.4% -21.1% -20.9% -20.6% -20.3% -19.1% -19.2% -22.5%
All losses combined -56.9%
-57.1% -57.4% -57.4% -61.3% -60.1% -59.3% -59.6% -58.5% -55.0% -54.5% -62.8%
Rate of growth - donors
-0.57% 0.60% 0.73% -4.15% -0.85% -0.25% 0.56% 2.18% 7.81% 8.00% 9.43% 2.14%
* Median ratios can only be calculated separately for each detailed and summary gain/loss category. Therefore summary ratios do not equal the sum of detailed ratios
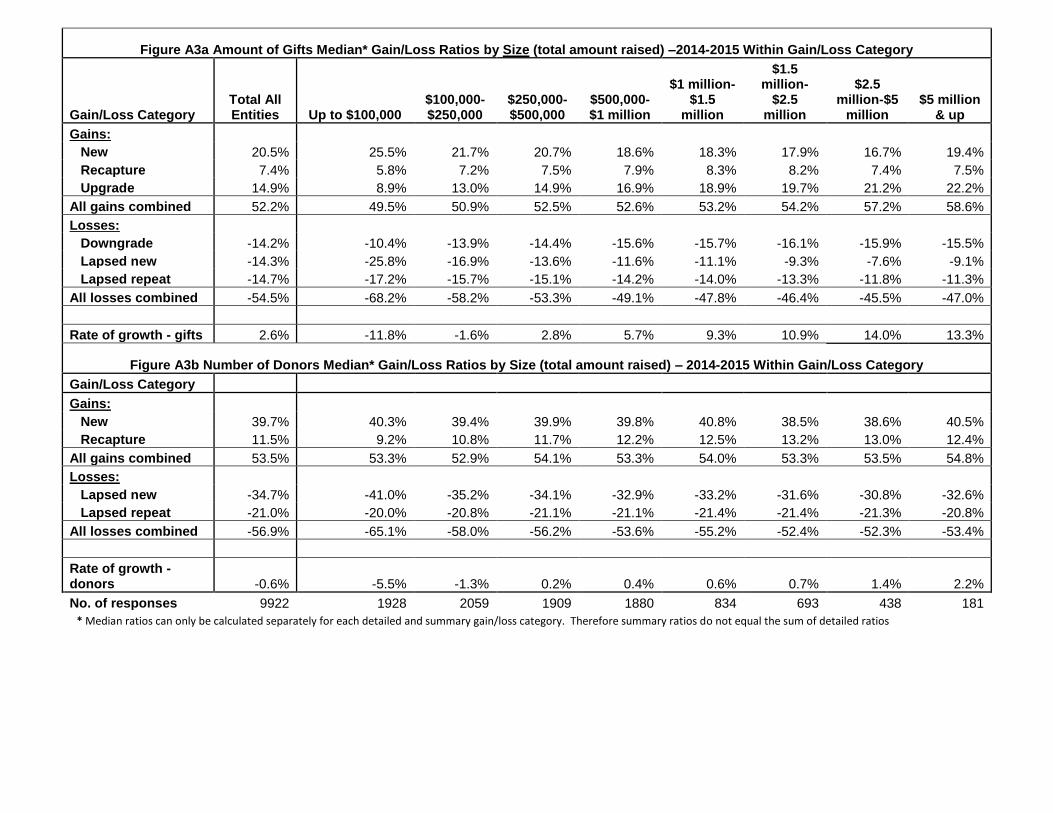
Figure A3a Amount of Gifts Median* Gain/Loss Ratios by Size (total amount raised) –2014-2015 Within Gain/Loss Category
Gain/Loss Category Total All Entities Up to $100,000
$100,000-$250,000
$250,000-$500,000
$500,000-$1 million
$1 million-$1.5
million
$1.5 million-
$2.5 million
$2.5 million-$5
million $5 million
& up
Gains:
New 20.5% 25.5% 21.7% 20.7% 18.6% 18.3% 17.9% 16.7% 19.4%
Recapture 7.4% 5.8% 7.2% 7.5% 7.9% 8.3% 8.2% 7.4% 7.5%
Upgrade 14.9% 8.9% 13.0% 14.9% 16.9% 18.9% 19.7% 21.2% 22.2%
All gains combined 52.2% 49.5% 50.9% 52.5% 52.6% 53.2% 54.2% 57.2% 58.6%
Losses:
Downgrade -14.2% -10.4% -13.9% -14.4% -15.6% -15.7% -16.1% -15.9% -15.5%
Lapsed new -14.3% -25.8% -16.9% -13.6% -11.6% -11.1% -9.3% -7.6% -9.1%
Lapsed repeat -14.7% -17.2% -15.7% -15.1% -14.2% -14.0% -13.3% -11.8% -11.3%
All losses combined -54.5% -68.2% -58.2% -53.3% -49.1% -47.8% -46.4% -45.5% -47.0%
Rate of growth - gifts 2.6% -11.8% -1.6% 2.8% 5.7% 9.3% 10.9% 14.0% 13.3%
Figure A3b Number of Donors Median* Gain/Loss Ratios by Size (total amount raised) – 2014-2015 Within Gain/Loss Category
Gain/Loss Category
Gains:
New 39.7% 40.3% 39.4% 39.9% 39.8% 40.8% 38.5% 38.6% 40.5%
Recapture 11.5% 9.2% 10.8% 11.7% 12.2% 12.5% 13.2% 13.0% 12.4%
All gains combined 53.5% 53.3% 52.9% 54.1% 53.3% 54.0% 53.3% 53.5% 54.8%
Losses:
Lapsed new -34.7% -41.0% -35.2% -34.1% -32.9% -33.2% -31.6% -30.8% -32.6%
Lapsed repeat -21.0% -20.0% -20.8% -21.1% -21.1% -21.4% -21.4% -21.3% -20.8%
All losses combined -56.9% -65.1% -58.0% -56.2% -53.6% -55.2% -52.4% -52.3% -53.4%
Rate of growth - donors -0.6% -5.5% -1.3% 0.2% 0.4% 0.6% 0.7% 1.4% 2.2%
No. of responses 9922 1928 2059 1909 1880 834 693 438 181
* Median ratios can only be calculated separately for each detailed and summary gain/loss category. Therefore summary ratios do not equal the sum of detailed ratios

Figure A4a Amount of Gifts Median* Gain/Loss Ratios by Nonprofit Subsector – 2014-2015 Within Gain/Loss Category
Gain/Loss Category Total All Entities
Arts Culture Humanities Education
Environment/ Animals Health
Human Services
Public/Soci-ety Benefit
Religion Related Other
Gains:
New 20.5% 17.7% 18.3% 22.4% 21.4% 20.2% 21.3% 15.4% 24.9%
Recapture 7.4% 7.7% 8.1% 8.2% 8.0% 8.7% 8.1% 5.8% 5.8%
Upgrade 14.9% 15.4% 15.2% 16.6% 13.6% 15.4% 14.9% 17.8% 12.9%
All gains combined 52.2% 52.2% 50.4% 56.5% 52.8% 52.4% 53.0% 45.6% 54.1%
Losses:
Downgrade -14.2% -15.3% -14.5% -14.6% -13.6% -14.2% -13.4% -16.9% -13.4%
Lapsed new -14.3% -13.0% -11.4% -14.9% -16.0% -13.9% -14.0% -8.6% -18.6%
Lapsed repeat -14.7% -15.4% -15.3% -14.3% -15.3% -15.2% -15.1% -11.5% -14.8%
All losses combined -54.5% -52.7% -53.9% -55.5% -57.5% -52.1% -52.5% -44.3% -60.2%
Rate of growth - gifts 2.6% 1.7% 2.7% 3.0% 1.8% 3.9% 4.9% 4.8% -0.7%
Figure A4b. Number of Donors Median* Gain/Loss Ratios by Nonprofit Subsector – 2014-2015 Within Gain/Loss Category
Gain/Loss Category Total All Entities
Arts Culture Humanities Education
Environment/ Animals Health
Human Services
Public/Soc-iety Benefit
Religion Related Other
Gains:
New 39.7% 36.0% 35.7% 35.8% 42.5% 41.5% 42.2% 31.8% 43.9%
Recapture 11.5% 12.8% 12.8% 12.8% 12.5% 12.5% 11.6% 11.2% 8.5%
All gains combined 53.5% 50.2% 50.5% 50.6% 56.5% 55.0% 56.1% 44.9% 56.1%
Losses:
Lapsed new -34.7% -31.1% -30.6% -29.6% -37.0% -35.9% -34.9% -24.6% -39.6%
Lapsed repeat -21.0% -21.8% -22.3% -20.9% -21.2% -21.4% -20.8% -20.1% -19.5%
All losses combined -56.9% -53.3% -53.1% -52.1% -59.7% -57.5% -57.5% -46.5% -62.5%
Rate of growth donors
-0.6% -0.7% -0.4% 0.8% 0.0% 0.2% 0.0% -0.3% -2.7%
* Median ratios can only be calculated separately for each detailed and summary gain/loss category. Therefore summary ratios do not equal the sum of detailed ratios
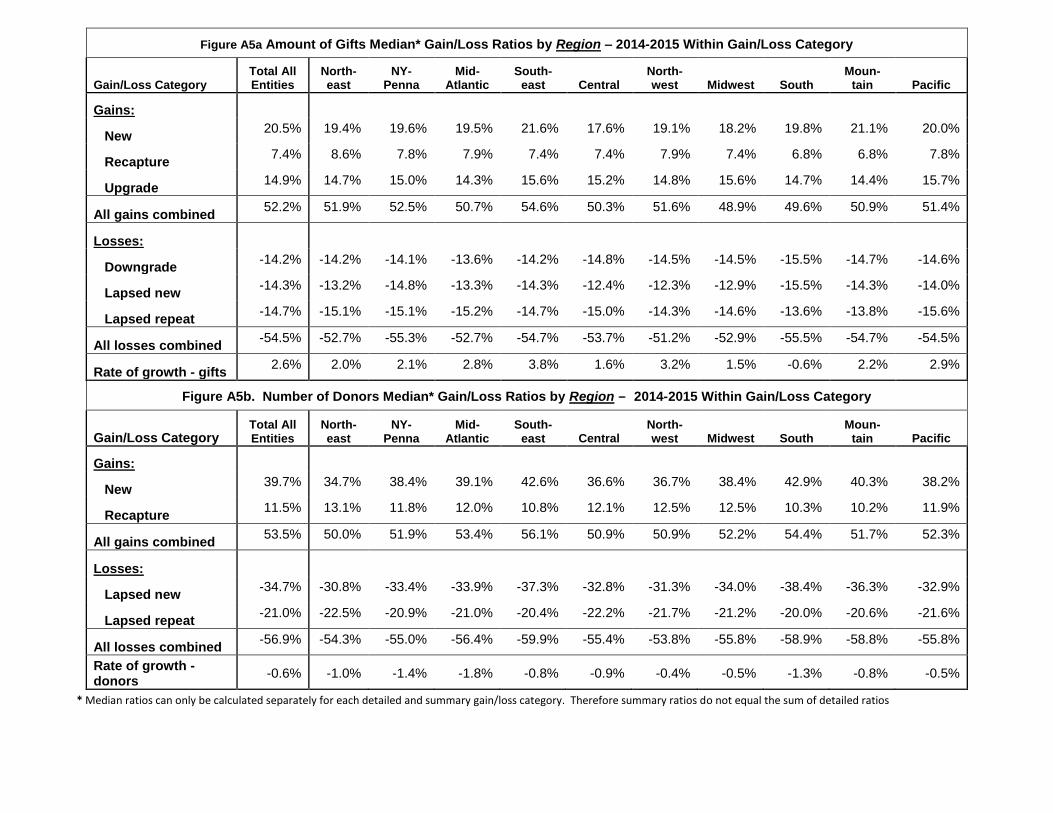
Figure A5a Amount of Gifts Median* Gain/Loss Ratios by Region – 2014-2015 Within Gain/Loss Category
Gain/Loss Category Total All Entities
North-east
NY-Penna
Mid-Atlantic
South-east Central
North-west Midwest South
Moun-tain Pacific
Gains:
New 20.5% 19.4% 19.6% 19.5% 21.6% 17.6% 19.1% 18.2% 19.8% 21.1% 20.0%
Recapture 7.4% 8.6% 7.8% 7.9% 7.4% 7.4% 7.9% 7.4% 6.8% 6.8% 7.8%
Upgrade 14.9% 14.7% 15.0% 14.3% 15.6% 15.2% 14.8% 15.6% 14.7% 14.4% 15.7%
All gains combined 52.2% 51.9% 52.5% 50.7% 54.6% 50.3% 51.6% 48.9% 49.6% 50.9% 51.4%
Losses:
Downgrade -14.2% -14.2% -14.1% -13.6% -14.2% -14.8% -14.5% -14.5% -15.5% -14.7% -14.6%
Lapsed new -14.3% -13.2% -14.8% -13.3% -14.3% -12.4% -12.3% -12.9% -15.5% -14.3% -14.0%
Lapsed repeat -14.7% -15.1% -15.1% -15.2% -14.7% -15.0% -14.3% -14.6% -13.6% -13.8% -15.6%
All losses combined -54.5% -52.7% -55.3% -52.7% -54.7% -53.7% -51.2% -52.9% -55.5% -54.7% -54.5%
Rate of growth - gifts 2.6% 2.0% 2.1% 2.8% 3.8% 1.6% 3.2% 1.5% -0.6% 2.2% 2.9%
Figure A5b. Number of Donors Median* Gain/Loss Ratios by Region – 2014-2015 Within Gain/Loss Category
Gain/Loss Category Total All Entities
North-east
NY-Penna
Mid-Atlantic
South-east Central
North-west Midwest South
Moun-tain Pacific
Gains:
New 39.7% 34.7% 38.4% 39.1% 42.6% 36.6% 36.7% 38.4% 42.9% 40.3% 38.2%
Recapture 11.5% 13.1% 11.8% 12.0% 10.8% 12.1% 12.5% 12.5% 10.3% 10.2% 11.9%
All gains combined 53.5% 50.0% 51.9% 53.4% 56.1% 50.9% 50.9% 52.2% 54.4% 51.7% 52.3%
Losses:
Lapsed new -34.7% -30.8% -33.4% -33.9% -37.3% -32.8% -31.3% -34.0% -38.4% -36.3% -32.9%
Lapsed repeat -21.0% -22.5% -20.9% -21.0% -20.4% -22.2% -21.7% -21.2% -20.0% -20.6% -21.6%
All losses combined -56.9% -54.3% -55.0% -56.4% -59.9% -55.4% -53.8% -55.8% -58.9% -58.8% -55.8%
Rate of growth - donors
-0.6% -1.0% -1.4% -1.8% -0.8% -0.9% -0.4% -0.5% -1.3% -0.8% -0.5%
* Median ratios can only be calculated separately for each detailed and summary gain/loss category. Therefore summary ratios do not equal the sum of detailed ratios

Figure A6a Amount of Gifts Median* Gain/Loss Ratios by Age of Fundraising Program (year fundraising started) – 2014-2015 Within Gain/Loss Category
Gain/Loss Category Total All Entities Up to 5 yrs-2005 6 to 15 yrs-1995 16 to 30 yrs-1980 Over 30 yrs-1979 Unknown
Gains:
New 20.5% 42.0% 18.2% 17.0% 15.0% 22.6%
Recapture 7.4% 1.6% 8.2% 9.3% 10.1% 8.4%
Upgrade 14.9% 15.4% 14.8% 14.6% 15.1% 14.6%
All gains combined 52.2% 70.8% 49.6% 47.8% 47.8% 53.3%
Losses:
Downgrade -14.2% -12.3% -14.6% -14.5% -15.2% -13.2%
Lapsed new -14.3% -29.2% -12.8% -10.7% -9.4% -14.2%
Lapsed repeat -14.7% -4.7% -16.6% -16.2% -17.4% -16.9%
All losses combined -54.5% -58.6% -54.3% -51.9% -50.4% -54.3%
Rate of growth - gifts 2.6% 15.4% 0.1% 1.8% 0.8% 5.0%
Figure A6b Number of Donors Median* Gain/Loss Ratios by Age of Fundraising Program (year fundraising started) – 2014-2015 Within Gain/Loss Category
Gain/Loss Category Total All Entities Up to 5 yrs-2005 6 to 15 yrs-1995 16 to 30 yrs-1980 Over 30 yrs-1979 Unknown
Gains:
New 39.7% 61.1% 36.6% 35.6% 32.4% 40.2%
Recapture 11.5% 2.8% 12.4% 14.1% 14.8% 13.3%
All gains combined 53.5% 68.1% 50.8% 51.5% 48.7% 56.1%
Losses:
Lapsed new -34.7% -49.7% -32.7% -29.5% -26.9% -34.0%
Lapsed repeat -21.0% -6.9% -22.4% -23.4% -24.2% -22.1%
All losses combined -56.9% -60.0% -57.2% -55.2% -52.5% -58.1%
Rate of growth - donors
-0.6% 9.7% -2.2% -0.5% -2.0% 0.0%
* Median ratios can only be calculated separately for each detailed and summary gain/loss category. Therefore summary ratios do not equal the sum of detailed ratios

.
Figure A7a. Amount of Gifts Median* Gain/Loss Ratios by Rate of Growth-Gifts – 2014-2015 Within Gain/Loss Category
Gain/Loss Category Total All Entities
Minus 30% and Lower
Minus 30% to Minus 10%
Minus 10% to 0%
0% to Plus 15%
Plus 15% to Plus 40% Plus 40% and Up
Gains:
New 20.5% 10.2% 14.6% 15.7% 19.9% 28.1% 71.4%
Recapture 7.4% 4.2% 6.8% 7.9% 8.7% 10.4% 10.6%
Upgrade 14.9% 5.8% 11.2% 14.0% 17.4% 22.6% 32.2%
All gains combined 52.2% 24.7% 37.5% 44.5% 52.7% 71.2% 136.4%
Losses:
Downgrade -14.2% -16.0% -16.8% -15.4% -14.4% -13.6% -11.7%
Lapsed new -14.3% -18.1% -14.0% -11.9% -11.0% -12.6% -17.5%
Lapsed repeat -14.7% -25.6% -18.6% -15.3% -13.2% -12.6% -9.9%
All losses combined -54.5% -74.7% -57.9% -50.0% -45.3% -45.4% -47.6%
Rate of growth - gifts 2.6% -46.5% -19.4% -5.2% 6.9% 24.7% 82.9%
Figure A7b. Number of Donors Median* Gain/Loss Ratios by Rate of Growth-Gifts – 2014-2015 Within Gain/Loss Category
Gain/Loss Category Total All Entities
Minus 30% and Lower
Minus 30% to Minus 10%
Minus 10% to 0%
0% to Plus 15%
Plus 15% to Plus 40% Plus 40% and Up
Gains:
New 39.7% 28.7% 33.1% 34.9% 39.2% 45.4% 65.1%
Recapture 11.5% 8.9% 11.7% 12.8% 12.8% 12.8% 10.8%
All gains combined 53.5% 39.9% 46.1% 48.6% 52.6% 59.2% 78.4%
Losses:
Lapsed new -34.7% -37.8% -34.2% -30.2% -30.1% -32.9% -38.3%
Lapsed repeat -21.0% -25.5% -22.7% -21.4% -21.1% -20.0% -15.9%
All losses combined -56.9% -67.4% -58.4% -54.2% -52.6% -52.8% -54.7%
Rate of growth - donors -0.6% -22.8% -8.7% -2.9% 0.8% 6.0% 23.9%
* Median ratios can only be calculated separately for each detailed and summary gain/loss category. Therefore summary ratios do not equal the sum of detailed ratios.

Figure A8a. Amount of Gifts Median* Gain/Loss Ratios by Percentile Level – 2014-2015 Within Gain/Loss Category
Gain/Loss Category All Entities BOTTOM 20% 20-40% 40-60% 60-80% TOP 20%
Gains:
New 20.5% 5.2% 12.0% 20.5% 35.8% 88.2%
Recapture 7.4% 0.2% 3.7% 7.4% 12.7% 28.5%
Upgrade 14.9% 3.6% 9.2% 14.9% 22.6% 45.1%
All gains combined 52.2% 21.5% 37.0% 52.2% 76.3% 147.5%
Losses:
Downgrade -14.2% -30.9% -19.6% -14.2% -9.8% -4.6%
Lapsed new -14.3% -48.0% -24.3% -14.3% -8.2% -3.5%
Lapsed repeat -14.7% -38.6% -22.3% -14.7% -8.7% -0.5%
All losses combined -54.5% -81.2% -65.7% -54.5% -43.7% -30.9%
Rate of growth - gifts 2.6% -46.1% -16.5% 2.6% 25.2% 94.4%
Figure A8b. Number of Donors Median* Gain/Loss Ratios by Percentile Level – 2014-2015 Within Gain/Loss Category
Gain/Loss Category All Entities BOTTOM 20% 20-40% 40-60% 60-80% TOP 20%
Gains:
New 39.7% 15.3% 27.5% 39.7% 57.6% 105.7%
Recapture 11.5% 0.5% 6.8% 11.5% 16.1% 24.4%
All gains combined 53.5% 26.5% 41.0% 53.5% 70.5% 119.5%
Losses:
Lapsed new -34.7% -64.3% -46.3% -34.7% -24.6% -14.0%
Lapsed repeat -21.0% -34.2% -25.8% -21.0% -15.1% -1.0%
All losses combined -56.9% -80.2% -66.5% -56.9% -48.0% -36.9%
Rate of growth - donors -0.6% -39.1% -12.8% -0.6% 14.2% 63.1%
* Median ratios can only be calculated separately for each detailed and summary gain/loss category. Therefore summary ratios do not equal the sum of detailed ratios
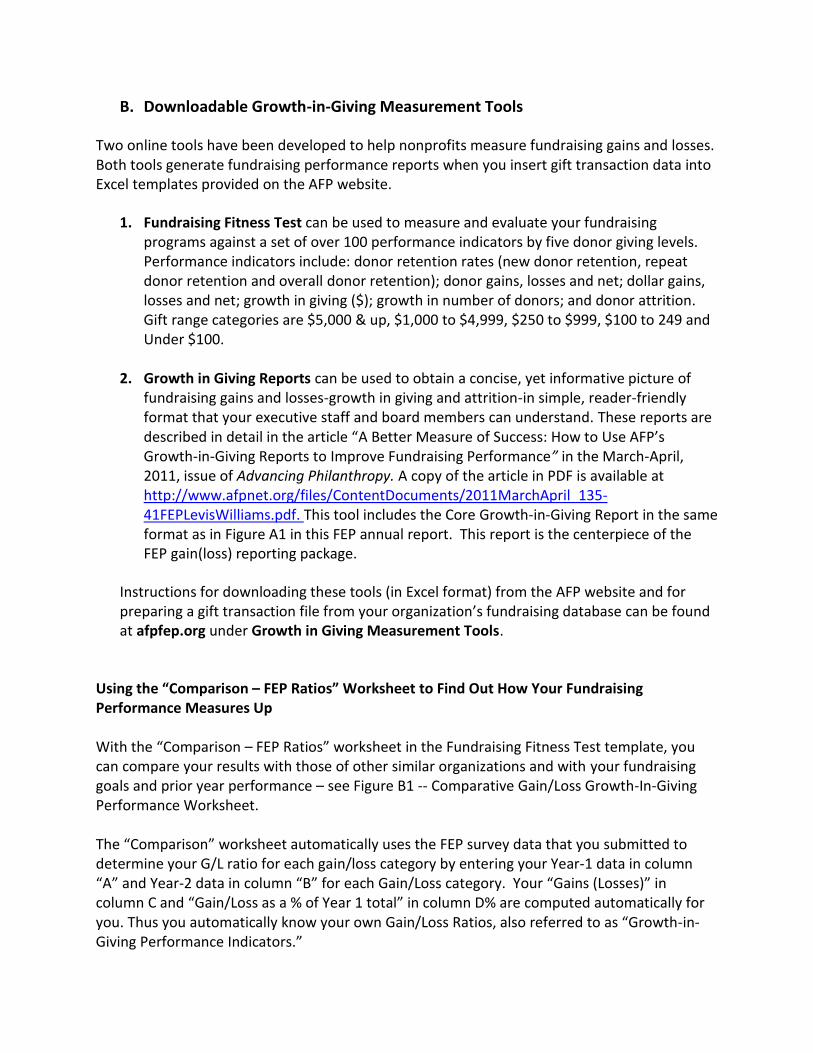
B. Downloadable Growth-in-Giving Measurement Tools
Two online tools have been developed to help nonprofits measure fundraising gains and losses. Both tools generate fundraising performance reports when you insert gift transaction data into Excel templates provided on the AFP website.
1. Fundraising Fitness Test can be used to measure and evaluate your fundraising programs against a set of over 100 performance indicators by five donor giving levels. Performance indicators include: donor retention rates (new donor retention, repeat donor retention and overall donor retention); donor gains, losses and net; dollar gains, losses and net; growth in giving ($); growth in number of donors; and donor attrition. Gift range categories are $5,000 & up, $1,000 to $4,999, $250 to $999, $100 to 249 and Under $100.
2. Growth in Giving Reports can be used to obtain a concise, yet informative picture of fundraising gains and losses-growth in giving and attrition-in simple, reader-friendly format that your executive staff and board members can understand. These reports are described in detail in the article “A Better Measure of Success: How to Use AFP’s Growth-in-Giving Reports to Improve Fundraising Performance” in the March-April, 2011, issue of Advancing Philanthropy. A copy of the article in PDF is available at http://www.afpnet.org/files/ContentDocuments/2011MarchApril_135-41FEPLevisWilliams.pdf. This tool includes the Core Growth-in-Giving Report in the same format as in Figure A1 in this FEP annual report. This report is the centerpiece of the FEP gain(loss) reporting package.
Instructions for downloading these tools (in Excel format) from the AFP website and for preparing a gift transaction file from your organization’s fundraising database can be found at afpfep.org under Growth in Giving Measurement Tools.
Using the “Comparison – FEP Ratios” Worksheet to Find Out How Your Fundraising Performance Measures Up With the “Comparison – FEP Ratios” worksheet in the Fundraising Fitness Test template, you can compare your results with those of other similar organizations and with your fundraising goals and prior year performance – see Figure B1 -- Comparative Gain/Loss Growth-In-Giving Performance Worksheet. The “Comparison” worksheet automatically uses the FEP survey data that you submitted to determine your G/L ratio for each gain/loss category by entering your Year-1 data in column “A” and Year-2 data in column “B” for each Gain/Loss category. Your “Gains (Losses)” in column C and “Gain/Loss as a % of Year 1 total” in column D% are computed automatically for you. Thus you automatically know your own Gain/Loss Ratios, also referred to as “Growth-in-Giving Performance Indicators.”

Figure B1. Comparative Gain/Loss Growth-in-Giving Performance Worksheet – Year 1 to Year 2
Strategy for improving performance using the “Comparison – FEP Ratios” worksheet in Figure B1
This template in Excel format can be found at afpfep.org under Growth in Giving Measurement Tools.
Step 1. Compare your gain/loss performance to FEP survey statistics(*). For each of the Gain/Loss categories, benchmark your organization’s Gain/Loss Ratios against those of other like organizations entering gain/loss ratios in column E, selecting comparative data from the tables in figures A1-A5 of this report. For example, if your organization:
Raises $100,000 to $249,999 per year, use the ratios in column 2, Figure A2.
Is in the human services sub-sector, use the ratios in column V, Figure A3.
Is in the NY-Penna region (USPS region 1), use the ratios in column 2, Figure A4.
Is less than 5 years old, use the ratios in column 1, Figure A5 (Age). You can also compare your Gain/Loss Ratios against performance goals you have established and/or your prior year Gain/Loss Ratios Step 2. Set your priorities for improvement. For example, establish as your objective moving up to the next performance level in the Percentile Ranking tables (Figures 6 and 7) in each gain/loss category. Step 3. To achieve your objectives, plan and budget for increased fundraising efforts for priority gain/loss categories. Step 4. Evaluate progress toward objectives for each gain/loss category.
Repeat the process outlined in this appendix every year.
-- Growth-in-Giving Performance Indicators --Gain/Loss Goal,
Gain/Loss Gains As % of Prior Year or
Category Year 1 Year 2 (Losses) Year 1 total FEP (*) Ratio Difference Objective
(A) (B) (C=B-A) (D%=C/totA) (E%) (E-D)
GainsNew 0 0 - 0.0% Improve
Recapture 0 0 - 0.0% Improve
Upgrade 0 0 - 0.0% Improve
Subtotal 0 0 - 0.0% Maximize
Same 0 0 - 0.0% Upgrade
LossesDowngrade 0 0 - 0.0% Reduce
Lapsed new 0 0 - 0.0% Reduce
Lapsed repeat 0 0 - 0.0% Reduce
Subtotal 0 0 - 0.0% Minimize
Total 0 0 - 0.0% [Net gain/loss]
Overall rate of growth