
2016 FOURTH QUARTER AND CONSOLIDATED BUDGET IMPLEMENTATION ...
148
BUDGET OFFICE OF THE FEDERATION Ministry of Budget and National Planning 2016 FOURTH QUARTER AND CONSOLIDATED BUDGET IMPLEMENTATION REPORT
Transcript of 2016 FOURTH QUARTER AND CONSOLIDATED BUDGET IMPLEMENTATION ...
BUDGET OFFICE OF THE FEDERATION
Ministry of Budget and National Planning
2016 FOURTH QUARTER AND
CONSOLIDATED BUDGET
IMPLEMENTATION REPORT

ii
FOR E WO R D
t is with great delight that I present to you this Fourth Quarter and
Consolidated Budget Implementation Report (BIR) for 2016. The Report
provides information on the allocation and utilization of public resources
by Government Agencies during the fourth quarter as well as for the entire
2016 fiscal year. It therefore serves as an instrument for evaluating the
accomplishment of the objectives of government as outlined in the Six Pillars
of the Strategic Implementation Plan (SIP) of the 2016 Budget.
The 2016 Budget was themed “Budget of Change” and was designed to
reflate and reposition the Nigerian economy on the path of sustainable
growth. It is the first full year budget of the present administration and is
geared towards the provision of stimulus for the economy, lifting of the very
poor and vulnerable segments of our society and at the same time, laying
the foundation for sustainable growth of the economy.
The publication of this report is in compliance with Sections 30 and 50 of the
Fiscal Responsibility Act, 2007, which requires the Budget Office of the
Federation (BOF) to prepare periodic Budget Implementation Reports to be
submitted to the Joint Finance Committee of the National Assembly and the
Fiscal Responsibility Council. These reports are also disseminated to the
public through electronic and print media as required by the FRA 2007.
This Report is the product of meticulous work by a dedicated team of officers
of the Budget Office of the Federation in close collaboration with the National
Monitoring and Evaluation Department as well as officials of other MDAs. I
praise the team for their hard work and dedication to duty. I also wish to
recognize the active roles of the Joint Finance Committee of the National
Assembly and the Fiscal Responsibility Commission in upholding best
practices in public financial management through their collaborative efforts
in ensuring consistent and timely production of these reports.
Lastly, I enjoin the general public and readers of this Report to maintain
active interest in government’s management of the nation’s resources and
I

iii
therefore to track progress towards attainment of Government’s promises. I
equally urge you to participate in the entire budget process.
Sen. Udoma Udo Udoma Honourable Minister of Budget and National Planning

iv
PREFACE he Budget Office of the Federation is required to produce periodic
Budget Implementation Reports detailing budget performance during
the review period. This Report, which is the fourth in the series for
the 2016 fiscal year, satisfies this requirement and therefore
provides a basis for the objective assessment of Government’s commitment
to the transparent and judicious management of public finances towards the
achievement of its objectives.
The level of exposure of the Nigerian economy to global economic
developments remains high as the ratio of total trade to the Gross Domestic
Product (GDP) of the country stood at 59.21% in 2016. Equally, the nation
continues to depend heavily on commodity export for her foreign exchange
and public revenues. Oil revenue still accounts for 51% of total revenues in
2016, while a decomposition of exports suggests high share of crude oil
component which accounted for over 92% of Nigeria’s export revenues from
2008 - 2015. The sharp fall in the prices of commodity, particularly the slump
in the price of crude oil, as well as the oil production disruptions in the Niger
Delta, have therefore impacted negatively on the country’s socio-economic
performance during the period. This exerted severe pressure on the nation’s
currency, output, and revenue and therefore budget implementation.
The implementation of the Budget in the review period was therefore given
greater attention. Available resources were directed to priority sectors of the
economy for greater and immediate impact and achievement of set targets
while still meeting government’s non-discretionary expenses. Government
continued to place greater emphasis on budget monitoring and evaluation
for better performance and results. The Monitoring and Evaluation
Department of the Budget Office of the Federation is therefore being
reinforced to enable effective monitoring of the achievement of Government
objectives and attainment of specific targets as set out in the Budget.
This Report is a product of the joint efforts of financial and statistical agencies
of government which provided necessary macro-economic data, other
relevant MDAs, and the combined efforts of various departments of the
Budget Office of the Federation, particularly Budget Monitoring and
T

v
Evaluation Department as well as the National Monitoring & Evaluation
Department. I applaud their efforts and wish them every success as they
continue to carry out this important function.
Ben Akabueze
Director General (Budget Office of the Federation)

vi
Table of Contents
F O R E W O R D .................................................................................................................................................. II
P R E F A C E ................................................................................................................................................... IV
T A B L E O F A C R O N Y M S .............................................................................................................. VIII
L I S T O F T A B L E S ............................................................................................................................... VI
L I S T O F T A B L E S .............................................................................................................................. VII
E X E C U T I V E S U M M A R Y .............................................................................................................. VIII
1.0 INTRODUCTION ......................................................................................................................................... 1
2.0 MACROECONOMIC DEVELOPMENTS AND ANALYSIS ................................................................................. 4
2.1 GLOBAL ECONOMIC DEVELOPMENTS: ........................................................................................................................... 4
2.2 DOMESTIC ECONOMIC DEVELOPMENT IN QUARTER FOUR 2016 ....................................................................................... 6
2.2.1 Trend in overall supply ................................................................................................................................. 6
2.3 ANNUAL REAL SECTOR DEVELOPMENTS.............................................................................................................. 8
2.3.1 Trend in overall supply ................................................................................................................................. 8
2.3.2 Oil Sector ...................................................................................................................................................... 8
2.3.3 Non-Oil Sector .............................................................................................................................................. 9
2.3.4 Nominal GDP ................................................................................................................................................ 9
2.4 PRICE DEVELOPMENTS ............................................................................................................................................. 10
2.5 MONETARY SECTOR ........................................................................................................................................... 11
2.6 EXTERNAL SECTOR ...................................................................................................................................... 14
2.6.1 External Trade ............................................................................................................................................ 14
3.0 FINANCIAL ANALYSIS OF THE 2016 BUDGET IMPLEMENTATION .............................................................. 20
3.1 KEY ASSUMPTIONS AND PROJECTIONS: ................................................................................................... 20
3.2 BUDGET BENCHMARK OIL PRICE AND PRODUCTION ...................................................................................................... 21
3.3 ANALYSIS OF REVENUE PERFORMANCE: .................................................................................................. 23
3.3.1 Overview of Oil Revenue Parameters: ........................................................................................................ 23
3.3.2 Oil Revenue Performance ........................................................................................................................... 24
3.3.3 Net Oil Revenue: ......................................................................................................................................... 25
3.3.4 Non-Oil Revenue Performance: .................................................................................................................. 26
3.4 COMPARATIVE REVENUE PERFORMANCE ANALYSIS: ...................................................................................................... 29
3.5 DISTRIBUTABLE REVENUE: ........................................................................................................................................ 30
3.6 EXCESS CRUDE ACCOUNT: ................................................................................................................................ 31

vii
3.7 FGN BUDGET REVENUE: .................................................................................................................................. 32
3.8 EXPENDITURE DEVELOPMENTS:.......................................................................................................................... 36
3.8.1 Non-Debt Recurrent Expenditure: .......................................................................................................... 36
3.8.2 Debt Service: .......................................................................................................................................... 37
3.8.3 Statutory Transfers: ................................................................................................................................... 40
3.8.4 Capital Expenditure Performance .............................................................................................................. 40
3.9 MDAS’ CAPITAL VOTE UTILIZATION: .......................................................................................................................... 40
3.8.4 Performance of the Financing Items: ......................................................................................................... 42
4.0 CAPITAL PROJECT IMPLEMENTATION REPORT ............................................................................................... 43
4.1 WATER RESOURCES SECTOR .............................................................................................................................. 43
4.2 INTERIOR SECTOR ....................................................................................................................................... 47
4.3 POWER, WORKS AND HOUSING SECTOR .................................................................................................... 51
4.4 WORKS SECTOR ............................................................................................................................................... 54
4.5 HOUSING SECTOR ....................................................................................................................................... 61
4.6 SCIENCE AND TECHNOLOGY SECTOR .......................................................................................................... 64
4.7 AGRICULTURE SECTOR ............................................................................................................................... 70
4.8 HEALTH SECTOR ..................................................................................................................................... 74
4.9 TRANSPORTATION SECTOR ........................................................................................................................ 80
4.10 OFFICE OF THE SECRETARY TO THE GOVERNMENT OF THE FEDERATION (OSGF) ...................................... 84
4.11 DEFENCE SECTOR ....................................................................................................................................... 89
4.12 ENVIRONMENT SECTOR ............................................................................................................................. 94
4.13 EDUCATION SECTOR ................................................................................................................................... 97
4.14 NIGER DELTA AFFAIRS .............................................................................................................................. 102
4.15 FEDERAL MINISTRY OF MINES & STEEL ..................................................................................................... 106
4.16 PRESIDENCY.............................................................................................................................................. 108
4.17 FEDERAL CAPITAL TERRITORY ADMINISTRATION ..................................................................................... 113
4.18 MINISTRY OF BUDGET AND NATIONAL PLANNING ................................................................................... 116
5.0 SUMMARY OF FINDINGS, AND RECOMMENDATIONS .................................................................................. 118
6.0 CONCLUSION................................................................................................................................................ 124

viii
T A B L E O F A C R O N Y M S
A/C: Account
AIE: Authority to Incur Expenditure
AF: Alternative Funding
B: Billion
BDC: Bureau De-Change
BOF: Budget Office of the Federation
BREXIT: Britain Exit
CBN: Central Bank of Nigeria
CIT: Company Income Tax
DMO: Debt Management Office
ECA: Excess Crude Account
EMDEs: Emerging Markets and Developing
Economies
EMEs: Emerging Markets Economies
FAAC: Federation Account Allocation
Committee
FGN: Federal Government of Nigeria
FMF: Federal Ministry of Finance
GDP: Gross Domestic Product
IMF: International Monetary Fund
INEC: Independent National Electoral
Commission
JVC: Joint Venture
LNG: Liquefied Natural Gas
M2: Money Supply
MB&NP: Ministry of Budget and National
Planning
MBPD: Million Barrels Per Day
MDAs: Ministries, Departments and
Agencies
MPR: Monetary Policy Rate
MTFF: Medium Term Fiscal Framework
N: Naira
NBS: National Bureau of Statistics
NDDC: Niger Delta Development
Commission
NHRC: National Human Rights Commission
NJC: National Judiciary Commission
NNPC: Nigerian National Petroleum
Corporation
NTB: Nigerian Treasury Bills
OAGF: Office of the Account General of the
Federation
ONSA: Office of National Security Adviser
OPEC: Organization of Petroleum Exporting
Countries
OTC-FMDQ-OTC: Over the Counter
Financial Market Dealer Quotation
PCC: Public Complaint Commission
PPT: Petroleum Profit Tax
PSC: Production Sharing Contracts
SC: Service Contracts
SWF: Sovereign Wealth Fund
TSA: Treasury Single Account
UBEC: Universal Basic Education
Commission
US: United States
VAT: Value Added Tax
ZBB: Zero Base Budgeting

vi
L I S T O F T A B L E S
3.1 Key Assumptions and Projections: ............................................................................................................ 20
Table 3.1: Key Assumptions and Targets for the 2016 Budget .................................................................................... 20
Table 3.2: Detailed Assumptions for Oil Production and Taxes (2016) ....................................................................... 23
Table 3.3: Net Distributable Revenue as at December, 2016 (Oil Revenue at Benchmark Assumptions) .................. 28
Table 3.4: Actual Performance of Non-Oil Revenue Category (2006-2015) ................................................................ 29
Table 3.5: Percentage Growth in Non-Oil Revenues (2007-2015) ............................................................................... 29
Table 3.6: Performance of Revenue in the Fourth Quarter of 2016 Vs 2015 .............................................................. 30
Table 3.7: Net Excess Crude Account .......................................................................................................................... 32
Table 3.8: Inflows to the 2016 Federal Budget as at December 2016 ......................................................................... 35
Table 3.9: FGN Budget Expenditure and Fiscal Account (in N’ Billion) as at December 2016 ..................................... 39
Table 3.10: Capital Budget Utilization by MDAs (as at 5th May, 2017) ........................................................................ 41

vii
L I S T O F T A B L E S
Figure 2.1: Quarterly GDP Growth rate (Q1 2015 - Q4 2016)........................................................................................ 7
Figure 2.2: Growth rate of Oil and Non-Oil GDP (Q1 2015 and Q4 2016) ..................................................................... 7
Figure 2.3: Quarterly Oil Sector GDP, Production and Price Q1 2014 – Q4 2016 .......................................................... 8
Figure 2.4: Growth rate of Oil and Non-Oil GDP (2015 and 2016) ................................................................................ 9
Figure 2.5: Inflation and M2 Growth Rate (December 2015–December 2016) .......................................................... 10
Figure 2.6: Growth in Aggregate Credit Indicators in Q4 2016.................................................................................... 12
Figure 2.7: Interest Rates Trend (December 2015 – December 2016) ........................................................................ 13
Figure 2.8: Growth in Export components in Quarter Four of 2016 ........................................................................... 14
Figure 2.9: Naira/US$ Exchange Rates Trend (Dec. 2015 – Dec. 2016) ....................................................................... 17
Figure 2.10: Level of External Reserves in Billion Dollars (Dec. 2015 – Dec. 2016) ..................................................... 18
Figure 3.1: 2016 Oil Production by Business Arrangement ......................................................................................... 21
Figure 3.2: Budget Oil Production by Business Arrangements 2009 – 2016 ............................................................... 22
Figure 3.3: Oil and Non-Oil Receipts for 2016 ............................................................................................................. 25
Figure 3.4: Contributions to Distributable Revenue (in the 4thQuarter of 2016) ........................................................ 31
Figure 3.5: Contributions to the FGN Budget Revenue in the Fourth Quarter of 2016 ............................................... 33
Figure 3.6: FGN Revenue (Budget Vs Actual as at December 2016) ............................................................................ 34
Figure 3.7: 2009 – 2016 Budget Expenditure Profile ................................................................................................... 36
Figure 3.8: Personnel, Overhead and Capital Expenditure Trends (2008 – 2016) ....................................................... 37
Figure 3.9: Pictorial Representation of Selected MDAs Utilization ............................................................................. 42

viii
E X E C U T I V E S U M M A RY
he 2016 Budget was themed “Budget of Change” and focused on three
inter-related issues of improving security, tackling corruption and
stimulating the national economy. The budget was prepared taking
cognizance of the prevailing global economic conditions especially the
slump in oil prices and the negative impact on external balances of countries
particularly for those of the oil-producing economies. It was therefore designed
to engender a diversified and sustainable economy through infrastructural
development; investment in real sector and social security provision for the very
poor and vulnerable in Nigeria. The Budget, while aiding industries, trade and
investments to pick up, will as a matter of importance, address the immediate
problems of youth unemployment while equally addressing the deplorable
living conditions of the extremely poor and helpless Nigerians.
The nation’s real Gross Domestic Product (GDP) contracted by -1.30% (year-
on-year) in the fourth quarter of 2016. This decline represents a moderation
from the slide of -2.24% recorded in the third quarter of 2016 but was however
lower than the 2.11% growth rate recorded in the fourth quarter of 2015. For
the full year 2016 therefore, GDP contracted by -1.51%. This contraction
reflects a decline in the oil and non-oil sectors by 13.65% and 0.22% in 2016,
from -5.45 percent and 3.75 percent, respectively, in the preceding year. The
oil sector experienced a number of challenges ranging from oil theft, price
challenges and production shutdown arising from vandalism of oil and gas
facilities in the Niger Delta region during the period under review. The non-oil
sector, on the other hand, was negatively impacted by general decline in global
economic activities, slump in public and private expenditure as well as security
challenges, among others.
Inflation continued to rise, driven by exchange rate pass-through effect arising
from imported goods; increases in electricity tariff and fuel prices as well as
higher input costs which were occasioned by the shortage of FOREX and
security challenges. Headline inflation (year-on-year) rose to 18.55% in
December from 18.48% in November, 18.33% in October and 17.85% in
T

ix
September 2016. The increase in the quarter was sustained through the year
and mirrored increases in both food and core components of inflation. Food
inflation rose steadily to 17.39% in December from 17.19% in November,
17.09% in October and 16.62% in September 2016. Core inflation equally
climbed from 17.67% in September to 18.07% in October, and 18.24% in
November before moderating slightly to 18.05% in December 2016. It is
expected that inflationary pressures would begin to subside as soon as non-oil
output improves and the naira exchange rate stabilizes.
Monetary policy in 2016 was influenced by key developments in the global
economy including weak global growth, the outcome of the June 23, 2016
Brexit vote, and weak commodity prices. Continued weak demand in the
emerging markets and contracting global productivity equally influenced
monetary policy decisions during the period. Other factors were the continued
normalization of US monetary policy which led to sustained capital flow
reversals from EMDEs, and the depreciation of currencies of the EMDEs as
commodity prices slumps, while financial conditions worsened.
Monetary aggregates generally performed above their indicative benchmarks
during the review period as the Central Bank of Nigeria (CBN) adopted tight
monetary policy stance. Aggregate credit expanded in the fourth quarter of
2016 as Broad Money (M2) grew by 5.73% to N23.39 trillion at end-December
2016 compared with the end-September 2016 level of N22.12 trillion while
Narrow Money (M1) grew by 11.38% to N11.07 trillion as at end-December
2016 from N 9.94 trillion as at end-September 2016. The growth in M2 reflects
expansion in Net Foreign Assets (NFA), Net Domestic Credit (NDC) and Other
Asset Net (OAN). NFA increased by 184.18% to N9.15 trillion as at end-
December 2016 from N7.74 trillion as at end-September 2016 reflecting
improved oil receipts. Net Domestic Credit (NDC), driven by 27.44% growth in
credit to the government, mildly grew by 1.30% to N26.65 trillion as at end-
December 2016 from N26.31 trillion as at end-September 2016. The growth in
Cg was largely attributed to government borrowing to finance budget deficit in
the face of dwindling fiscal receipts.

x
The tight monetary policy stance led to liquidity crunch resulting in overall
increase in money rates. Average interbank call rate increased from 14.5%
in September to 36.42% and 15.21% in October and November respectively
before dropping to 10.39% in December 2016. Relative to the first half of
2016, the average term deposit rate equally rose by 1.58 percentage points
to 6.96% in the second half of 2016. This outpaced the 6-month average
prime and maximum lending rates which rose in the second half of 2016 by
0.48 percentage point to 17.11% and by 0.93 percentage point to 27.75%
respectively, compared with their levels in the first half of 2016.
Consequently, the spread between the average term deposit rates and the
average maximum lending rates narrowed by 0.65 percentage point to
20.80% at the end of the second half of 2016. Real deposit and prime lending
rates were however negative given the prevailing headline inflation rate of
18.55% as at end-December 2016 while real maximum lending rates
remains positive.
Nigeria’s external trade further deteriorated in 2016 but recorded significant
improvements during the fourth quarter of the year. Total trade rose by
₦1,759.21 billion or 50.30% to ₦5,286.57 billion in the fourth quarter of 2016,
from ₦3,517.36 billion in the corresponding period in 2015. The increase was
driven by significant expansion in both imports and exports during the review
period. Imports and exports, galloped by ₦731.25 billion or 46.39% and
₦1,037.96 billion or 53.48% to ₦2,307.64 billion and ₦2,978.94 billion
respectively in the fourth quarter of 2016. The development led to the
recovery of Nigeria’s trade balance to ₦671.30 billion indicating a ₦306.71
billion or 84.12% growth in net trade from ₦364.59 billion recorded in the
corresponding period in 2016.
On annual bass, total trade equally rose by ₦1.05 trillion or 6.5% to ₦17.34
trillion in 2016, from ₦16.29 trillion in the corresponding period in 2015. The
increase was driven by import, which galloped by ₦2.12 trillion or 31.6% to
₦8.82 trillion in 2016 compared with a decline of ₦0.68 trillion or -9.2% in
2015. Export continued to decline during the review period, falling to ₦8.53
trillion in 2016 from ₦9.59 trillion in 2015. This indicates that export shed
₦1.07 trillion or 11.1% of its value slightly moderating from a decline by

xi
₦6.71 trillion or 41.2% in the corresponding period in 2015. The above
development led to the worsening of Nigeria’s trade balance to ₦-0.29 trillion
indicating a ₦3.19 trillion or 110.0% drop in net trade from ₦2.90 trillion in
2015.
The average exchange rate of the Naira/Dollar remained relatively stable at
the Official/Inter-Bank segments at ₦305.21/US$, ₦305.18/US$ and
₦305.22/US$ in October, November and December 2016 respectively from
₦305.23/US$ in September 2016. On the other hand, the average exchange
rate of the Naira/Dollar at the Bureau De-Change (BDC) depreciated from
₦431.10/US$ in September to ₦462.03/US$ in October. It however
appreciated to ₦415.36/US$ in November before depreciating again to
₦455.26/US$ in December 2016. Given the above development, the gap
between the official and Bureau De-Change rates widened by 19.22% from
₦125.85 in September 2016 to ₦150.04 in December 2016. In an effort to
expand and stabilize the foreign exchange and the financial markets, the
CBN injected more foreign exchange into the economy and broadened the
number of items/businesses allowed to purchase foreign exchange at the
official rate.
Nigeria’s gross official (external) reserve increased at the end of the fourth
quarter of 2016 from US$23.81 billion in September to US$26.99 billion as
at the end of December 2016. This represents an increase of US$3.18 billion
(or 13.36%) above the figure as at the end-September 2016. Relative to the
end of fourth quarter of 2015 level of US$28.28 billion, the external reserves
fell by US$1.29 billion (or 4.56%) at the end of fourth quarter of 2016. The
decline in Nigeria’s external reserves could be ascribed to the fall in oil price
at the international market affecting FOREX supply as well as panic buying
by speculators. Nigeria’s foreign reserves however remained robust and
could finance over 11.2 months of imports as at end-December 2016.
Domestic debt stock of the Nigerian Government stood at ₦11,058.20 billion
as at 31st December, 2016, representing an increase of ₦212.98 billion (or
1.96%) above the ₦10,845.22 billion recorded at the end of third quarter of

xii
2016. The 2016 fourth quarter debt figure was also ₦2,221.20 billion (or
25.14%) above the ₦8,837.00 billion reported in the same period of 2015.
Nigeria’s external debt stock however fell by US$176.31 million (or 1.52%) to
US$11,406.28 million as at 31st December, 2016, from US$11,582.59 million
recorded in the third quarter of 2016 but rose by US$687.85 million (or 6.42%)
compared to US$10,718.43 million in the fourth quarter of 2015. This translates
to a total public debt stock as at 31st December, 2016 of US$57,391.53 million
(or ₦17,360.01 billion). The total public Debt/GDP ratio stood at 16.27% as at
the end of December 2016 and was significantly below the country specific
threshold of 19.39% and international threshold of 56%.
The implementation of the 2016 Budget was therefore greatly affected by the
poor revenue outturn in the fourth quarter and indeed the entire 2016 fiscal
year. The net sum of ₦798.89 billion was shared among the three tiers of
government in the fourth quarter of 2016, indicating a significant shortfall of
₦631.01 billion in the quarter. A total of ₦341.18 billion, excluding revenue from
other funding sources was also received to fund the Federal Budget in the
fourth quarter of 2016 translating to a revenue shortfall of ₦622.76 billion (or
64.61%).
The above development reflects the revenue underperformance of the review
period. Net Oil Revenue that accrued into the Federation Account in the fourth
quarter of 2016 stood at ₦273.64 billion, representing a decrease of ₦96.23
billion (or 26.02%) from the estimated quarterly projection of ₦369.87 billion. It
was also lower than the ₦327.93 billion net oil revenue collected in the third
quarter of 2016 by ₦54.29 billion (or 16.55%). This could be attributed to the
persistent low oil price in the international market which reached a 10-year low
in April 2016. It could also be linked to lower oil production as a result of the
vandalism of oil facilities in the Niger Delta region, which adversely impacted
oil production. Average oil production and lifting in the fourth quarter of 2016
was 1.76mbpd indicating a shortfall of 0.37mbpd (or 16.82%) from the 2.2mbpd
projected for the 2016 Budget.
Gross non-oil revenue of ₦552.81 billion was collected in the fourth quarter of
2016. This implies a shortfall of ₦500.80 billion (or 47.53%) from the quarterly

xiii
estimate of ₦1,053.61 billion. This led to a net non-oil outturn of ₦525.25 billion
representing a ₦476.42 billion or 47.36% shortfall from ₦1,001.66 billion
projected in the 2016 Budget. This could be attributed to shortfall in all the non-
oil revenue components while the Solid Mineral sector and the Dividend from
Federation Investments yielded no revenue return during the quarter.
On annual basis, the Federal Government Revenue inflow moderated to ₦2.95
trillion in 2016, indicating a shortfall in revenue of ₦290.00 billion or 8.95% from
the ₦3.24 trillion performances in 2015. Total actual expenditure in 2016 stood
at ₦5.36 trillion, indicating an expenditure shortfall of ₦0.70 trillion or 11.57%
of the budget estimate of ₦6.06 trillion for the period. This comprises among
others total of ₦2,411.63 billion out of the ₦2,646.39 billion projected for
recurrent (non-debt) and ₦1,219.47 billion out of the ₦1,587.40 billion projected
for capital budget implementation. This translates to a deficit of ₦2.41 trillion or
45.00% of total expenditure. This indicates that budget deficit was ₦21.10
billion or 9.55% higher than the budget estimate of ₦2.20 trillion for the review
period. This also translates to a budget deficit to GDP ratio of 2.37% in the
review period, from 1.69% in 2015.
An analysis of the forty (40) MDAs reported upon by the Office of the
Accountant-General of the Federation (OAGF) reveled different levels of
utilization among the MDAs. As at 5th May, 2017 only twenty four (or 60%) of
the MDAs including: Water Resources, Agriculture, Women Affairs, Youth
Development, FCTA, Communication Technology, Interior, Mines & Steel,
ONSA, FCSC, Federal Character Commission, Fiscal Responsibility
Commission, Code of Conduct Bureau and Code of Conduct Tribunal had
utilized more than the overall average utilization rate of 97.75% of the amount
cash-backed. Five out of these, including ICPC, National Salary & Wages,
ONSA, Code of Conduct Tribunal and Federal Character Commission had
100% of their respective cash-backed funds utilized. The other remaining
sixteen (16) MDAs had utilization rates which are below the overall average
utilization rate of the total amount released and cash backed.
Overall, the Nigerian economy entered into a recession given the four
consecutive negative growths culminating in a -1.51% growth in 2016. The poor

xiv
performance was as a result of developments in international oil markets and
more importantly, the slump in oil price. Supply bottleneck as a result of the
renewed hostility in the oil producing region of the country as well as insecurity
in the North East region also impacted economic performance in 2016.
Performance of the economy is however expected to improve in the near to
medium term with the expected recovery in non-oil revenue following improved
performance of the economy and improved oil price in the international market.
In the main time, Government is committed to reflate the economy to enhance
domestic competitiveness and production and improve the general welfare of
the citizenry.

1
1.0 INTRODUCTION
he 2016 Budget was themed “Budget of Change” and focuses on
three inter-related issues of improving security, tackling corruption
and stimulating the national economy. It was the first by the present
Government, and seeks to make the Nigerian economy more
competitive by focusing on infrastructural development; delivering inclusive
growth; and prioritizing the welfare of Nigerians. The key objective of the
budget was to open up the latent capabilities of our people and communities,
while exploiting the natural endowments that abound across the country.
The Budget, while helping industries, trade and investments to pick up, would
as a matter of importance, address the immediate problems of youth
unemployment and the challenging living conditions of the extremely poor
and vulnerable Nigerians. The budget was prepared against the background
of general slowdown in global economic growth and more importantly a
significant decline in crude oil prices and outputs. It was therefore designed
to deliver the foundation for a robust economic diversification through import
substitution and export promotion.
The 2016 Budget was guided by the 2016 – 2018 Medium Term Fiscal
Frameworks and the Change Agenda of the present Administration. The
framework was prepared taking into cognizance, key local and international
developments critical to the successful implementation of the Budget.
Specifically, expected global economic activities, the dynamics in the
international oil market, and trade and financial policies of industrialized
nations particularly for Nigeria’s key trading partners, where considered.
Others include domestic factors such as the disruptions in oil production and
security as well as revenue generation capabilities of relevant Agencies of
Government.
To make the budget more the implementable, a conservative oil price
benchmark was adopted after careful analysis of prevailing global economic
condition. Efforts were therefore directed at ramping up the non-oil revenue
of the economy through improvement in revenue collection efficiency and
T

2
broadening of the tax net while upscaling compliance. Concerted and
specific efforts were made to improve budget implementation results and
value for money by ensuring that projects are linked with key objectives of
government as specified in the SIP for the 2016 Budget and are prioritized.
Special initiatives, including upscaling of the deployment of the Integrated
Payroll and Personnel Information System (IPPIS) in the MDAs as well as
the use of the Treasury Single Account, were implemented. This is expected
to increase revenue collection as well as efficiency in government
expenditure and therefore free-up resources for developmental projects.
To deliver Government’s developmental objectives, the capital expenditure
outlay of was increased from ₦557.0 billion in the 2015 budget to ₦1,587.40
billion the 2016 Budget. This translates to an increase of ₦1,030.40 billion or
184.99% over the period and a capital expenditure to total budget ratio of
26.19% in 2016. The ratio is expected to increase in subsequent budgets.
The capital expenditure was equally allocated to critical projects in Road &
Bridges, Power, Railways, Aviation, Water, Housing, Education, Health
sector as well as in Special Interventions. These investments in
infrastructure were meant to support reforms in the Agriculture, Solid
Minerals and other core job creating sectors of the economy.
Implementation of the budget was however challenged by the delay in the
presentation of the 2016 Appropriation Bill to the National Assembly. This
was occasioned by the adoption of a new budget preparation system namely
the Zero-Based Budgeting (ZBB) which required skill upgrade for relevant
officials responsible for budget preparation across MDAs. The budget
implementation was therefore negatively affected by its’ late passage and
commencement in May 2016 thereby adversely affecting capital project
execution. To hasten implementation and also ensure maximum
achievement of capital projects in the budget, government jettisoned
quarterly capital budget releases and instead, funds capital projects requests
of MDAs as money become available.
This Report provides detailed information on the 2016 fourth quarter budget
implementation. The other parts of the Report are organized as follows: a
brief analysis of the macroeconomic background under which the budget

3
was executed was carried out in chapter two, followed by a careful
examination of government’s revenue receipts and expenditure in the
quarter in chapter three. Chapter four presents the outcome of the
nationwide physical monitoring and evaluation of capital projects and
programmes, followed by a summary of findings and recommendations in
chapter six. Chapter seven concludes the Report.

4
2.0 MACROECONOMIC DEVELOPMENTS AND ANALYSIS
2.1 Global Economic Developments: lobal economic environment continued to be challenged by a combination
of political and economic developments during the 2016 fiscal year. Global
growth decelerated by 0.3 percentage point to 3.1% in 2016 from 3.4%
recorded in 2015. This was largely driven by considerable slowdown in both
the advanced economies and the Emerging Markets and Developing
Economies (EMDE). Real GDP growth in EMDEs continued to decline as
economies of large commodity-exporter countries within the block
experience sustained strains and reinforced by continued capital flow
deficits. GDP growth in EMDE stood at 4.1% in 2016, reflecting a drop from
4.2 percent and 4.6 percent in 2015 and 2014, respectively. This represents
a six years moderation in growth and indicates a 2.2 percentage points drop
in GDP growth from a peak of 6.3 percent in 2011.
Growth in the economic group recovered in the fourth quarter of 2016 and is
expected to continue in the medium-term. The expected recovery, is
however, being dragged by weaker growth expectation in several large
economies especially in Latin America and the Middle East, reflecting
continued adjustments to the decline in their terms of trade in recent years
and oil production cuts.
The advanced economies experienced a decline in real GDP growth rate in
2016 to 1.7% relative to 2.1% in 2015. This was largely attributed to the
slowdown in the United States, Europe and Asia. The United States posted
a less than expected GDP growth rate of 1.6% in 2016, significantly lower
than previously forecasted and equally lower than the 2.6% in 2015. Growth
was adversely affected in the first three quarters of 2016 due to uncertainties
in the election and the build-up of inventories constituting a drag on growth.
Economic activities however recovered in the last quarter of 2016 as
uncertainties surrounding the election wanes, while inventories started
contributing positively to growth.
The Euro Area economies equally lost momentum in economic activities as
G

5
it slipped from the recovery with growth declining to 1.7 percent in 2016,
reflecting a 0.3 percentage points decrease from 2.0 percent in 2015. The
performance reflects deceleration in growth in some of the major economies
of the Euro Area. Notably, growth in France and the United Kingdom declined
to 1.2 percent and 1.8 percent, respectively in 2016 from 1.3 percent and 2.2
percent in 2015. The Japanese economy expanded by a percent moderating
slightly from the revised growth of 1.2 percent in 2015. This was supported
by stronger-than-expected net exports in 2016 with the recovery expected to
continue into 2017, with growth forecast at 1.2 percent.
Performance of global trade was divergence across major economic blocks
in 2016 as trade indicators worsened in advanced economies, while trade
recovery was experienced in the EMDEs. Correspondingly, consumer prices
generally went up in advanced economies, but moderated slightly in the
emerging markets and developing economies in 2016. The rising prices
within the advanced economies was primarily driven by the recovery in
commodity prices especially the rallying of oil prices since the third quarter
of 2016. On the other hand, the recovering of exchange rate and terms of
trade contributed to slowing inflation in EMDEs with commodity importer
countries remaining largely neutral.
Financial markets were buoyant with policy support expected to continue in
China, while fiscal expansion and deregulation continued in the US market
as sentiments strengthened since August 2016, reflecting generally positive
outlook. Financial conditions are divergent in EMDEs, while equity market
within the group have strengthened since August, but generally remained
below their post crisis peaks. Low oil price however persisted in 2016, but
appears to be recovering alongside the pick-up in global economic activities
especially from quarter three of the year. The trends in the prices of coal and
natural gas followed with that of the oil prices.
Global growth is projected to improve from 3.1 percent in 2016 to 3.5 percent
and 3.6 percent in 2017 and 2018, respectively, and would be driven by
buoyant financial market and cyclical recovery in investment, manufacturing
and trade. Marked pickup is expected in EMDEs driven by recovering
6
conditions in commodity exporter countries as commodity prices partially
recovers. Growth is also projected to remain strong in China and other
commodity importers, while the AEs are projected pick-up primarily as a
result of higher projected growth in the US. Upward revision of growth in US
reflects expected fiscal policy easing and an uptick in confidence post
November election. Outlook also improved for Europe and Japan as a result
of cyclical recovery in global manufacturing and trade that started in 2016.
Some binding structural impediments including low productivity growth and
high inequality, as well as pressure for inward looking policies in AEs,
present risks to recovery, particularly in the medium-term. Critical downside
risk includes inward policy shift, faster than expected interest rate hike in US,
an aggressive roll back of financial regulation, financial tightening in EMDEs
and impact of some downside risk from AEs operating with high levels of
excess capacity. Non-economic factors, including geo-political tension,
domestic political discord, risk from weak governance and corruption,
extreme weather conditions, and terrorism and security concerns remain.
2.2 Domestic Economic Development in Quarter Four 2016
2.2.1 Trend in overall supply
Gross Domestic Product (GDP), in real terms, contracted by ₦0.24 trillion to
₦18.29 trillion in quarter four of 2016, from ₦18.53 trillion in the
corresponding period of 2015. This translates slowdown of GDP by -1.30%
to ₦18.29 trillion in quarter four of 2016, indicating a 3.52 percentage points
decline when compared to 2.11% growth in quarter four of 2015.

7
Figure 2.1: Quarterly GDP Growth rate (Q1 2015 - Q4 2016)
Source: NBS
Real oil and non-oil sectors GDP stood at ₦1.31 trillion and ₦16.98 trillion
respectively in quarter four of 2016, as against ₦1.49 trillion and ₦17.04
trillion in quarter four of 2015. This shows that the oil sector real GDP
contracted by ₦0.18 trillion or 12.38%, while the non-oil sector GDP equally
declined by ₦0.56 trillion or 0.33% during the reviewed period.
Figure 2.2: Growth rate of Oil and Non-Oil GDP (Q1 2015 and Q4 2016)
Source: NBS
Nominal GDP, on the other hand, stood at ₦22.29 trillion in the fourth quarter
of 2016, translating to a 12.97% expansion and higher that the 7.13% growth
it recorded in the corresponding period in 2015. This reflects a sharp rise in
3.96
2.352.84
2.11
-0.36
-2.06 -2.24
-1.30
-3.00
-2.00
-1.00
0.00
1.00
2.00
3.00
4.00
5.00
Q1 2015 Q2 2015 Q3 2015 Q4 2015 Q1 2016 Q2 2016 Q3 2016 Q4 2016
3.14
-0.33
-8.28
-12.38-14.00
-12.00
-10.00
-8.00
-6.00
-4.00
-2.00
0.00
2.00
4.00
Q4 2015 Q4 2016
Non-Oil GDP Oil GDP

8
the GDP deflator during the review period. A breakdown of this performance
into oil and non-oil sectors reveals that nominal non-oil sector GDP rose from
₦24.62 trillion in quarter four of 2015 to ₦27.25 trillion in quarter four of 2016.
The nominal oil sector GDP, in contrast to trends during the 2016 fiscal year,
expanded to ₦2.04 trillion in the fourth quarter of 2016 from ₦1.31 trillion in
the corresponding period in 2015. The recovery started in the third quarter
of the year and could largely be attributed to the rebound in oil prices.
Figure 2.3: Quarterly Oil Sector GDP, Production and Price Q1 2014 – Q4 2016
Source: CBN, NBS, NNPC
2.3 ANNUAL REAL SECTOR DEVELOPMENTS
2.3.1 Trend in overall supply
On annual basis, Real GDP contracted by ₦1.04 trillion to ₦67.98 trillion in
2016, from ₦69.02 trillion in the corresponding period of 2015. This
translates to a slowing of real Gross Domestic Product (GDP) at 2010 basic
prices to -1.51% during 2016, compared to 2.79% in 2015.
2.3.2 Oil Sector
The real oil sector GDP was down from ₦6.63 trillion in the 2015 fiscal years
to ₦5.73 trillion in 2016 translating to a decrease of ₦0.90 trillion for the
period. This reflect a contraction of the sector by 13.6%; a more significant
decline than that of 2015 decline of -5.45%. This reduced the oil sector’s
share of real GDP to 8.42% in 2016, compared to 9.61% in 2015. This
0.00
20.00
40.00
60.00
80.00
100.00
120.00
0.00
0.50
1.00
1.50
2.00
2.50
Q1 2014Q2 2014Q3 2014Q4 2014Q1 2015Q2 2015Q3 2015Q4 2015Q1 2016Q2 2016Q3 2016Q4 2016
Oil GDP (₦'trillion) Average Oil Production (mbpd) Average Quarterly Oil Price ($pb)

9
contributed significantly to the decline in overall GDP for the period under
review. It also impacted negatively on the growth rate of oil sector GDP,
which slowed to -13.65% in 2016 from the previous negative growth rate of
5.45% in 2015. The declining growth of oil GDP is attributed to weaker daily
production compared to the corresponding period.
Figure 2.4: Growth rate of Oil and Non-Oil GDP (2015 and 2016)
Source: NBS
2.3.3 Non-Oil Sector
The non-oil sector in 2016 fiscal year declined by -0.22% in real terms,
compared to a growth rate of 3.75% in 2015, a difference of 3.9 percentage
points. The depressed growth experienced in the non-oil sector during 2016
was as a result of declining economic activities on the agriculture, services,
manufacturing, solid minerals and building and construction sectors.
2.3.4 Nominal GDP
GDP at current basic prices stood at ₦101.60 trillion in 2016, translating to
an expansion of ₦7.45 trillion from ₦94.14 trillion in 2015. A breakdown of
this performance into oil and non-oil sectors reveals that nominal non-oil
sector GDP rose from ₦88.16 trillion in 2015 to ₦96.12 trillion in 2016. In
contrast, nominal oil sector GDP contracted to ₦5.48 trillion in 2016 from
₦5.99 trillion in 2015, due to the sizable drop in international oil price as well
as production during the period. This shows that the non-oil GDP expanded
by ₦7.97 trillion in the period.
(5.45)
(13.65)
3.75
(0.22)
(15.00)
(10.00)
(5.00)
-
5.00
2015 2016
Oil
non-oil

10
2.4 Price Developments Headline inflation (year-on-year) continued to rise, creeping up to 18.55% in
December from 18.48% in November, 18.33% in October and 17.85% in
September 2016. This follows the sustained upward momentum in inflation
rates that started since January 2016.The increase in headline inflation in
the quarter replicated increases in both food and core components of
inflation. Food inflation rose sharply to 17.39% in December from 17.19% in
November, 17.09% in October and 16.62% in September 2016. On the other
hand, Core inflation climbed from 17.67% in September to 18.07% in
October, 18.24% in November and moderated slightly to 18.05% in
December 2016.
Figure 2.5: Inflation and M2 Growth Rate (December 2015–December 2016)
Source: CBN & NBS, 2016
Inflation trends in the review period were driven by the continued pressure
on production costs, such as high cost of power and energy, transport, other
production factors, as well as rising prices of imports. It is expected that
inflationary pressures would begin to subside as soon as non-oil output
recovers and the naira exchange rate stabilizes.
-5
0
5
10
15
20
DEC.15 JAN.16 FEB.16 MAR.16 APR.16 MAY.16 JUN.16 JUL.16 AUG.16 SEP.16 OCT.16 NOV.16 DEC.16
HEADLINE INFLATION CORE INFLATION
FOOD INFLATION M2 GROWTH RATE

11
2.5 MONETARY SECTOR Monetary policy in 2016 was influenced by key developments in the global
economy including weak growth, Brexit vote, United State (US) general
election, continuing weak demand in the emerging markets and contracting
global productivity. Other factors were the continued normalization of US
monetary policy which led to sustained capital flow reversals and the
depreciation of currencies of the emerging market and developing
economies. At the domestic level, the sustained pressure on the exchange
rate due to the shortages of supply of foreign exchange as well as the
disruptions to supply and distribution chain due to insurgency in some parts
of the country, exerted pressure on the domestic price level. This combined
with further worsening of domestic economic environment due largely to
falling public and private consumption dampened growth in the domestic
economy.
To mitigate the impact on the economy, Government pursued Tight
Monetary Policies including raising the MPR from 11% as at February 2016
to 12% in March 2016 and further to 14% in July 2016; narrowing the
Asymmetric corridor from +200 and -700 basis points to +200 and -500 basis
points in March 2016; raising the CRR from 200% as at February 2016 to
22.5% in March 2016, a 250 basis points increment over the period; and
retaining the liquidity ratio at 30% over the review period. In addition, the
monetary authority introduced greater flexibility in the inter-bank foreign
exchange market structure while retaining a small window for critical
transactions.
Aggregate credit expanded in the fourth quarter of 2016 albeit at a slower
pace when compared to developments in the fourth quarter of 2015. Broad
Money (M2) grew by 5.73% to N23.39 trillion at end-December 2016
compared with the end-September 2016 level of N22.12 trillion. M2 grew by
7.01% in the fourth quarter of 2015. The year-on-year growth in M2 stood at
16.77% and was above the 2016 indicative growth target of 10.98%. Narrow
Money (M1) grew by 11.38% to N11.07 trillion as at end-December 2016
from N 9.94 trillion as at end-September 2016. This however compares
favorably when compared to the 19.90% growth in the corresponding period

12
in 2015. The year-on-year growth in M1 stood at 29.12% and was equally
above the indicative growth target of 11.34%.
Figure 2.6: Growth in Aggregate Credit Indicators in Q4 2016
Source: CBN
The growth in M2 reflects expansion in Net Foreign Assets (NFA), Net
Domestic Credit (NDC) and Other Asset Net (OAN). NFA increased by
184.18% to N9.15 trillion as at end-December 2016 from N7.74 trillion as at
end-September 2016. The year-on-year increase in NFA stood at 61.85% in
contrast to the indicative target of -40.58%. The observed performance of
NFA in the review period was attributed to improved oil receipts. Net
Domestic Credit (NDC), driven by substantial growth in credit to the
government, mildly grew by 1.30% to N26.65 trillion as at end-December
2016 from N26.31 trillion as at end-September 2016. Compared with the
end-December 2015 figure of N21.61 trillion, the year-on-year growth in NDC
of 23.30% was above the indicative growth target of 17.94%.
Credit to government grew by 27.44%, when compared with the end-
September 2016 figure of N3.66 trillion, which was significantly above the
indicative benchmark growth of 48.07%. The development was largely
attributed to government borrowing to finance budget deficit in the face of
dwindling fiscal receipts. Credit to the private sector (Cp) however slumped
by 2.93% to ₦21.98 trillion at end-December 2016 from ₦22.65 trillion at
end-September 2016 indicating crowding out. This however reflect a growth
of 19.37% compared to ₦18.72 trillion as at end-December 2015, which is

13
above the indicative growth target of 13.28 percent for 2016.
The tight monetary policy stance led to liquidity crunch resulting in overall
increase in money rates. Average interbank call rate increased from 14.5%
in September to 36.42% and 15.21% in October and November respectively
before dropping to 10.39% in December 2016. Relative to the first half of
2016, the average term deposit rate equally rose by 1.58 percentage points
to 6.96% in the second half of 2016. This outpaced the 6-month average
prime and maximum lending rates which rose in the second half of 2016 by
0.48 percentage point to 17.11% and by 0.93 percentage point to 27.75%
respectively, compared with their levels in the first half of 2016.
Consequently, the spread between the average term deposit rates and the
average maximum lending rates narrowed by 0.65 percentage point to
20.80% at the end of the second half of 2016. Real deposit and prime lending
rates were negative, while real maximum lending rate recorded positive trend
given the prevailing headline inflation rate of 18.55% as at end-December
2016 Figure 2.7.
Figure 2.7: Interest Rates Trend (December 2015 – December 2016)
Source: Central Bank of Nigeria, 2016
Dec.15 Jan.16 Feb.16 Mar.16 Apr.16 May.16 Jun.16 Jul.16 Aug.16 Sep.16 Oct.16 Nov.16 Dec.16
MPR 11 11 11 12 12 12 12 14 14 14 14 14 14
Prime Lending Rate 16.96 16.54 16.72 16.82 16.77 16.13 16.78 17.14 17.18 17.09 17.1 17.06 17.09
Maximum Lending Rate 26.84 26.77 26.73 26.93 26.88 26.73 26.93 27.06 27.21 27.49 27.69 28.53 28.55
Inter-Bank Call Rate 0.77 2.04 2.67 4.32 3.75 7.67 35.26 31.51 24.25 14.5 36.42 15.21 10.39
0
5
10
15
20
25
30
35
40
Pe
rce
nt

14
2.6 EXTERNAL SECTOR
2.6.1 External Trade
Nigeria’s external trade further deteriorated in 2016 but recorded significant
improvements during the fourth quarter of the year. Total trade rose by
₦1,759.21 billion or 50.30% to ₦5,286.57 billion in the fourth quarter of 2016,
from ₦3,517.36 billion in the corresponding period in 2015. The increase was
driven by significant expansion in both imports and exports during the review
period. Imports and exports, galloped by ₦731.25 billion or 46.39% and
₦1,037.96 billion or 53.48% to ₦2,307.64 billion and ₦2,978.94 billion
respectively in the fourth quarter of 2016. This compare favourbly with a
decline of ₦454.65 billion or -22.39% and ₦1,013.59 billion or -34.31% of
import and export respectively in the corresponding period in 2015.
Figure 2.8: Growth in Export components in Quarter Four of 2016
Source: NBS
The above development led to the recovery of Nigeria’s trade balance to
₦671.30 billion indicating a ₦306.71 billion or 84.12% growth in net trade
from ₦364.59 billion recorded in the corresponding period in 2016. Trade
balanced rebound was driven by the recovery in exports in the third and
fourth quarters of 2016, as oil export prices improves.
Further analysis of export indicates similar trends in crude, and non-crude
exports while non-oil exports continued to decline during the review period.
-60
-40
-20
0
20
40
60
80
Q4 2016 Q4 2015
Crude Oil Exports Non_Crude Oil Exports Non Oils Exports

15
Crude oil export improved significantly by ₦886.82 billion or 57.64% to
₦2,425.36 billion in quarter four of 2016, from ₦1,538.55 billion in quarter
four of 2015. This indicates a significant recovery from a drop of ₦700.94
billion or 31.30% in the fourth quarter of 2015. The performance of the non-
crude export improved slightly by ₦151.14 billion or 37.56% while Non-oil
export declined slightly by ₦5.43 billion or 4.02% during the review period.
Year-on-Year Total trade rose by ₦1.05 trillion or 6.5% to ₦17.34 trillion in 2016, from
₦16.29 trillion in the corresponding period in 2015. The increase was driven
by import, which galloped by ₦2.12 trillion or 31.6% to ₦8.82 trillion in 2016
compared with a decline of ₦0.68 trillion or -9.2% in 2015. Export continued
to decline during the review period, falling to ₦8.53 trillion in 2016 from ₦9.59
trillion in 2015. This indicates that export shed ₦1.07 trillion or 11.1% of its
value slightly moderating from a decline by ₦6.71 trillion or 41.2% in the
corresponding period in 2015. The above development led to the worsening
of Nigeria’s trade balance to ₦-0.29 trillion indicating a ₦3.19 trillion or
110.0% drop in net trade from ₦2.90 trillion in 2016.
Further analysis of export indicates substantial decline in both non-crude and
non-oil exports, while the value of crude exports recovers during the review
period. Crude oil export improved slightly by ₦0.19 trillion or 2.7 percent to
₦6.99 trillion in 2016, from ₦6.81 trillion in 2015. This indicates a significant
recovery from a drop of ₦5.08 trillion or 42.7 percent in 2015. The
performance of the non-crude export worsened during the review period with
a decline of ₦1.25 trillion or 45.0 percent in 2016, reflecting significant drop
in non-oil export. Non-oil export was equally heavily affected during the
review period crashing by ₦0.82 trillion or 70.4 percent to ₦0.34 trillion in
2016 from ₦1.16 trillion in 2015. This indicates the non-crude exports drove
the poor performance of export during the review period contributing 120.00
percent to the decline in total export.
Nigeria’s trade recovered across the key trading Regions apart from Asia
where trade moderated slightly. Trade with the ECOWAS sub-region
however continued to worsen during the review period. Total trade, with the

16
ECOWAS Region slightly dropped by ₦0.14 trillion or 16.60 percent to ₦0.68
trillion in 2016, from ₦0.81 trillion in 2015. The development was as a result
of the dip in both import and export during the period. Export slightly dropped
by ₦0.02 trillion or 3.9 percent to ₦0.58 trillion in 2016 from ₦0.59 trillion in
2015, while import dipped by ₦0.11 trillion or 52.3 percent to ₦0.10 trillion in
2016. Trade with the America improved by 56.63 percent to ₦2.73 trillion
reflecting improvements in trade with USA and Canada by 89.45 and 93.91
percent respectively, while trade with Europe recovered with a growth of
13.79 percent during the period.
The average exchange rate of the Naira/Dollar remained relatively stable at
the Official/Inter-Bank segments of the foreign exchange market during the
quarter under review. The Naira/Dollar exchange rate at the Official/Inter-
Bank market opened at an average of ₦305.23/US$ in September and
closed at an average of ₦305.21/US$, ₦305.18/US$ and ₦305.22/US$ in
October, November and December 2016 respectively. On the other hand,
the average exchange rate of the Naira/Dollar at the Bureau De-Change
(BDC) depreciated from ₦431.10/US$ in September to ₦462.03/US$ in
October. It however appreciated to ₦415.36/US$ in November before
depreciating again to ₦455.26/US$ in December 2016. Given the above
development, the gap between the official and Bureau De-Change rates
widened by 19.22% from ₦125.85 in September 2016 to ₦150.04 in
December 2016.

17
Figure 2.9: Naira/US$ Exchange Rates Trend (Dec. 2015 – Dec. 2016)
Source: Central Bank of Nigeria, 2016
In an effort to expand and stabilize the foreign exchange and the financial
markets, a number of policy instruments were deployed by the CBN. Some
of the tools adopted included; the injection of more foreign exchange into the
economy and broadening of the number of items/businesses allowed to
purchase foreign exchange at the official rate from the CBN.
Nigeria’s gross official (external) reserve increased at the end of the fourth
quarter of 2016 from US$23.81 billion in September to US$26.99 billion as
at the end of December 2016. This represents an increase of US$3.18 billion
(or 13.36%) above the figure as at the end-September 2016. Relative to the
end of fourth quarter of 2015 level of US$28.28 billion, the external reserves
at the end of fourth quarter of 2016 fell by US$1.29 billion (or 4.56%) (figure
2.10).
Dec.15 Jan.16 Feb.16 Mar.16 Apr.16 May.16 Jun.16 Jul.16 Aug.16 Sep.16 Oct.16 Nov.16 Dec.16
DAS/WDAS 196.99 197 197 197 197 197 231.76 294.57 309.73 305.23 305.21 305.18 305.22
IFEM 196.99 197 197 197 197 197 231.76 294.57 309.73 305.23 305.21 305.18 305.22
BDC 232.4 289.78 329.83 320.93 320.71 336.93 351.82 364.47 396.15 431.1 462.03 415.36 455.26
0
50
100
150
200
250
300
350
400
450
500
Nai
ra/U
S$

18
Figure 2.10: Level of External Reserves in Billion Dollars (Dec. 2015 – Dec. 2016)
Source: Central Bank of Nigeria, 2016
The decline in Nigeria’s external reserves could be ascribed to the interplay
of demand and supply. On the supply side, the fall in oil price at the
international market had substantially reduced the growth to external
reserves. On the demand side, the panic as a result of the changes in foreign
exchange market led to speculative actions that exerts further pressure on
Naira. These elements prompted the CBN to increased funding of the foreign
exchange market to stabilize the Naira. Nigeria’s foreign reserves as at the
end of December 2016 therefore remained robust and could finance over
11.2 months of imports which is well above the internationally endorsed
minimum threshold of 3-months import cover.
Domestic debt stock of the Nigerian Government stood at ₦11,058.20 billion
as at 31st December, 2016, representing an increase of ₦212.98 billion (or
1.96%) above the ₦10,845.22 billion recorded in the third quarter of 2016. The
2016 fourth quarter debt figure was also ₦2,221.20 billion (or 25.14%) above
the ₦8,837.00 billion reported in the same period of 2015. Nigeria’s external
debt stock (mostly low interest funds from multilateral financial institutions)
stood at US$11,406.28 million as at 31st December, 2016, representing a
21
22
23
24
25
26
27
28
29
DEC.15 JAN.16 FEB.16 MAR.16 APR.16 MAY.16 JUN.16 JUL.16 AUG.16 SEP.16 OCT.16 NOV.16 DEC.16
EXTERNAL RESERVE

19
decrease of US$176.31 million (or 1.52%) from US$11,582.59 million recorded
in the third quarter of 2016 and US$687.85 million (or 6.42%) above
US$10,718.43 million in the fourth quarter of 2015.
The total public debt stock as at 31st December, 2016 stood at US$57,391.53
million (or ₦17,360.01 billion). The breakdown consists of US$11,406.28
million (or ₦3,478.92 billion or 20.04%) for external debt and the balance of
US$45,985.25 million (or ₦13,881.09 billion or 79.96%) for domestic debt. The
total public Debt/GDP ratio stood at 16.27% (using the rebased GDP figure of
2016 Budget) as at the end of December 2016 and was significantly below the
country specific threshold of 19.39% and international threshold of 56%.

20
3.0 FINANCIAL ANALYSIS OF THE 2016 BUDGET IMPLEMENTATION
3.1 Key Assumptions and Projections:
he 2016 Budget was guided by the 2016-2018 Medium Term Fiscal
Framework (MTFF) which was prepared after series of meetings and
consultations with relevant stakeholders. Developments in both the
local and the international markets were also taken into consideration in
arriving at some of the key assumptions in the framework. The key assumption
in the Framework is highlighted as follows:
Table 3.1: Key Assumptions and Targets for the 2016 Budget
Source: BOF, NNPC, FIRS and NCS, 2016
KEY ASSUMPTION & TARGETS 2016
Projected Production (in mbpd) 2.20
Budget Benchmark Price (per barrel in US) 38
Technical Cost of JVC Pbl to Oil Companies
Operating Expenses (T1) in US $ 10.29
Capital Expenses (T2) in US $ 11.12
Technical Cost of PSC Pbl to Oil Companies
Operating Expenses (T1) in US $ 8.22
Capital Expenses (T2) in US $ 19.62
Investment Tax Credit 4.94
Technical Costs of SC pbl to Oil CompanyOperating Expenses (T1) in US $ 18.62
Capital Expenses (T2) in US $ 2.44Investment Allowances 2.996
Weighted Average Contribution Rates
Weighted Average Rate of PPT - JV Oil 85%
Weighted Average Rate of PPT - PSC Oil 50.17%
Weighted Average Rate of PPT - SC Oil 85%
Weighted Average Rate of PPT - Independent (Indigenous) 85%Weighted Average Rate of PPT - Marginal 51.6%
Royalty RatesWeighted Average Rate of Royalties - JV Oil 19.1%
Weighted Average Rate of Royalties - PSC 4.5%
Weighted Average Rate of Royalties - SC Oil 18.5%
Weighted Average Rate of Royalties -Independent 19.3%Weighted Average Rate of Royalties - Marginal 9.3%
Average Exchange Rate (NGN/US$) 197VAT Rate 5%
CIT Rate 30%
T

21
3.2 Budget Benchmark Oil Price and Production The budget benchmark price of oil for the 2016 Budget was fixed at
US$38.00/barrel while oil production was pegged at 2.2 million barrels per day
(mbpd). The projected oil production for 2016 budget reflect a reduction of
0.08mbpd (or 3.51%) from the 2.28mbpd estimated for the 2015 Budget. It also
indicates a reduction of 0.3mbpd or 12% from the estimated production
capacity of 2.5mbpd for the country. The oil price benchmark was equally
brought down by US$5 per barrel or 9.43% from US$53 per barrel in the 2015
budget.
The Joint Venture and the Production Sharing Contracts continued to dominate
the business arrangement for oil production in Nigeria. They accounted for 38%
and 40% respectively in the projected production by business arrangement in
2016 fiscal year (Figure 3.1).
Figure 3.1: 2016 Oil Production by Business Arrangement
Source: NNPC The business arrangement in 2016 is consistent with industry trends in
recent past and is projected to continue in the near to medium term Figure
3.2.
MODIFIED CARRY ARRANGEMENT,
0.252, 11%
JOINT VENTURES, 0.83, 38%
PROD. SHARING CONTRACTS, 0.878, 40%
INDEPENDENT, 0.176, 8%
SERVICE CONTRACTS,
0.006, 0%
MARGINAL FIELDS, 0.059, 3%

22
Figure 3.2: Budget Oil Production by Business Arrangements 2009 – 2016
Source: NAPIMS/NNPC, 2016
The joint venture business arrangement would continue to be given greater
preference by Government given its better fiscal terms for Nigeria (Table
3.2). Government would therefore continue to work towards improving the
funding of the business arrangement to enhance its share of oil production
in the country.

23
Table 3.2: Detailed Assumptions for Oil Production and Taxes (2016)
SHARE OF OIL PRODUCTION PERCENTAGE
JOINT VENTURES 0.83
ALTERNATIVE FUNDING 0.00
MODIFIED CARRY ARRANGEMENT 0.25
PRODUCTION SHARING CONTRACTS 0.88
INDEPENDENTS 0.18
SERVICE CONTRACTS 0.01
MARGINAL 0.06
TOTAL PRODUCTION 2.21
PPT RATES WEIGHTED AVERAGE - JV/AF/INDEPENDENT/MARGINAL 85%
WEIGHTED AVERAGE- PSC 50.17%
WEIGHTED AVERAGE -SC 85%
ROYALTIES RATES WEIGHTED AVERAGE- JV/AF/INDEPENDENT/MARGINAL 0.00%
WEIGHTED AVERAGE - PSC 4.50%
WEIGHTED AVERAGE- SC OIL 18.50%
Source: NNPC and BOF, 2016
3.3 Analysis of Revenue Performance:
3.3.1 Overview of Oil Revenue Parameters:
The price of crude oil at the international market averaged US$49.47 per barrel
in the fourth quarter of 2016, indicating an increase of US$3.61 per barrel (or
7.87%) and US$5.78 per barrel (or 13.23%) above the US$45.86per barrel and
US$43.69 per barrel recorded in the third quarter of 2016 and fourth quarter of
2015 respectively. The upswing in crude oil prices during the period could be
credited to the OPEC’s decision in the third quarter of 2016 to cut its production
to 32.5mbpd starting from about 1.2 million barrels a day reduction in January
2017.

24
Average oil production and lifting (including Condensates) in the fourth quarter
of 2016 was 1.76mbpd and 1.83mbpd respectively. The average oil lifting figure
for the review period represent a shortfall of 0.37mbpd (or 16.82%) from the
2.2mbpd projected for the 2016 Budget. The volume also reflects a 0.21mbpd
increase from the 1.62mbpd of oil lifted in the third quarter of 2016 and
0.36mbpd decline from the 2.19mbpd recorded in the fourth quarter of 2015.
The decrease in the quantity of oil lifted during the quarter as against the
anticipated budget figure could be attributed to the dynamics in the demand
and supply of oil at the international market as well as other factors including
crude oil theft, illegal bunkering, and pipeline vandalism that took place during
the period under review.
Gross Federally collectible revenue is estimate in the 2016 Fiscal Framework
at ₦9,715.19 billion, consisting of ₦3,534.83 billion (or 36.38%) oil revenue and
₦6,180.36 billion (or 63.62%) non-oil revenue. The breakdown of the actual
performance of the oil and non-oil revenue earnings in the fourth quarter of
2016 is as follow:
3.3.2 Oil Revenue Performance
An assessment of the oil revenue performance in the fourth quarter of 2016
reveals underperformance of most of the sub-heads. The Petroleum Profit Tax
and Gas Income of ₦218.42 billion and Other Oil and Gas Revenue of ₦1.33
billion surpassed their respective quarterly estimates of ₦150.64 billion and
₦0.95 billion by ₦67.78 billion (or 44.99%) and ₦0.38 billion (or 40.14%). The
other oil revenue items however fell below their respective quarterly
projections. Crude Oil Sales of ₦367.60 billion, Gas Sales of ₦11.64 billion,
Royalties (Oil &Gas) of ₦54.71 billion, Rent of ₦0.09 billion and Gas Flared
Penalty of ₦0.33 billion fell below their quarterly estimates of ₦444.57 billion,
₦161.09 billion, ₦125.43 billion, ₦0.27 billion and ₦0.76 billion by ₦76.98
billion (or 17.31%), ₦149.45 billion (or 92.78%), ₦70.72 billion (or 56.38%),
₦0.18 billion (or 66.05%) and ₦0.43 billion (or 56.91%) respectively Table 3.3.

25
3.3.3 Net Oil Revenue:
Actual Net Oil Revenue that accrued into the Federation Account in the fourth
quarter of 2016 stood at ₦273.64 billion, representing a decrease of ₦96.23
billion (or 26.02%) from the estimated quarterly projection of ₦369.87 billion.
The net oil revenue in the fourth quarter of 2016 was also lower than the
₦327.93 billion net oil revenue recorded in the third quarter of 2016 by ₦54.29
billion (or 16.55%)Table 3.3.
Year-to-Date:
Gross oil revenue stood at ₦3.04 trillion, reflecting a below budget estimates
performance by ₦489.91 billion or 13.86% in 2016. It also underperformed
when compared with the oil revenue collection in 2015 by ₦709.91 billion or
18.91%. Oil revenue has however started improving as a result of the
recovery of oil prices in the international market and the normalization of
conditions in the Niger Delta region particularly from the third quarter of the
year. This translates to an oil to total revenue ratio of 52.74 percent, as
against 61.46 percent in 2015 (figure 3.8).
Figure 3.3: Oil and Non-Oil Receipts for 2016
Source: Office of the Accountant General of the Federation
Oil Revenue53%
Non-Oil Revenue47%

26
A breakdown of oil revenue reveals that only Petroleum Profit & Gas Taxes of
₦857.54 billion and Other Oil & Gas Revenue of ₦5.95 billion exceeded their
annual projections of ₦602.56 billion and ₦3.78 billion by ₦254.97 billion (or
42.31%) and ₦2.17 billion (or 57.32%) respectively as at end-December 2016.
Other oil revenue sub-heads fell below their respective annual estimates.
Crude Oil Sales of ₦1,453.24 billion, Gas Sales of ₦42.19 billion, Royalties (Oil
& Gas) of ₦334.80 billion, Rent of ₦0.31 billion and Gas Flared Penalty of
₦1.42 billion, fell below their corresponding annual projections of ₦1,778.30
billion, ₦644.34 billion, ₦501.71 billion, ₦1.08 billion and ₦3.05 billion by
₦325.06 billion (or 18.28%), ₦602.15 billion (or 93.45%), ₦166.91 billion (or
33.27%), ₦0.78 billion (or 71.86%) and ₦1.64 billion (or 53.54%)respectively.
The general poor revenue performance especially as against the 2015 actual
could be attributed to the persistent low oil price in the international market
which reached a 10-year low in April 2016, as well as the vandalism of oil
facilities in the Niger Delta region, which adversely impacted oil production.
3.3.4 Non-Oil Revenue Performance:
Given the enormous potential for enhanced non-oil revenue generation in
the Nigerian economy, Government have redoubled its efforts towards
optimization of non-oil revenue generation in the country. Specific initiatives
include VAT Auto-collect, REMITA, E-Stamping Solution and e-tax payment,
etc. The effect of these actions as well as the Budget Office’s regular
meetings with all relevant revenue collecting agencies is expected to enable
collection of enhanced non-oil revenue in the medium to long-term.
Gross non-oil revenue of ₦552.81 billion was collected in the fourth quarter of
2016. This implies a shortfall of ₦500.80 billion (or 47.53%) from the quarterly
estimate of ₦1,053.61 billion. An analysis of the non-oil revenue items indicates
that all the non-oil revenue items fell below their quarterly expected projections.
Value Added Tax of ₦209.47 billion, Company Income Tax of ₦186.73 billion,
Customs & Excise Duties of ₦141.94billion and Special Levies of ₦14.68 billion
were below their quarterly estimates of ₦368.76 billion, ₦469.25 billion,
₦180.93 billion and ₦34.67 billion by ₦159.29 billion (or 43.2%), ₦282.53

27
billion (or 60.21%), ₦38.99billion (or 21.55%) and ₦20.00 billion (or 57.67%)
respectively.
Revenue Dividend by Companies / Investments Funded by FAAC and Solid
Minerals & Other Mining Revenue which had quarterly projections of ₦49.25
billion and ₦4.09 billion respectively however recorded zero inflow in the
quarter. Customs & Excise Duties and Special Levies surpassed their targets
by ₦4.16 billion (or 3.02%) and ₦2.31 billion (or 18.65%) respectively while
Value Added Tax and Company Income Tax fell by ₦0.88 billion (or 0.42%)
and ₦267.01 billion (or 58.85%)respectively when compared with their
corresponding third quarter performances. The improved performances of the
Customs & Excise Duties and Special Levies in the fourth quarter of 2016 can
be credited to the improvement in the performance of the Nigerian Customs
during the period. Nevertheless, it is expected that this trend together with other
remaining non-oil revenue items will get better in the first quarter of 2017
following the expected recovery of the economy.
Year-to-Date:
Gross non-oil revenues for the year amounted to ₦2,347.96 billion, depicting a
shortfall of ₦1,866.50 billion (or 44.29%) below the annual projected estimate
of ₦4,214.46 billion. The result also reveals that the receipts from all the non-
oil revenue items fell below their corresponding estimates. Value Added Tax of
₦811.00 billion, Company Income Tax of ₦988.44 billion, Customs & Excise
Duties of ₦506.84 billion and Special Levies of ₦41.69 billion respectively fell
short by ₦664.04 billion (or 45.02%), ₦888.58 billion (or 47.34%), ₦216.88
billion (or 29.97%) and ₦97.00 billion (or 69.94%) when compared with their
respective annual projections. Similarly, Solid Minerals and Other Mining
Revenues of ₦9.92 billion fell below its annual estimate of ₦16.36 billion by
₦6.43 billion (or 39.33%). On the other hand, Dividend by Companies /
Investments Funded by FAAC with an annual projection of ₦197.00 billion
yielded nothing in the year under review.

28
Table 3.3: Net Distributable Revenue as at December, 2016 (Oil Revenue at Benchmark Assumptions)
Source: OAGF and Budget Office of the Federation, 2016

29
Table 3.4: Actual Performance of Non-Oil Revenue Category (2006-2015)
Source: OAGF and BOF, 2016
Though non-oil revenue performed below target and corresponding period in
2015, the rate of slide has moderated considerably. The rate of slide in non-
oil revenue fell from -59.03% and -60.79% for Customs and CIT in 2015 to -
1.46% and -3.95% respectively in 2016 while VAT increased in the 2016
period by 4.14% as against a decline of 86.82% in 2015.
Table 3.5: Percentage Growth in Non-Oil Revenues (2007-2015)
Source: OAGF and BOF, 2016
3.4 Comparative Revenue Performance Analysis: A relative analysis of the data however suggests that the aggregate gross oil
receipts in the fourth quarter of 2016 were not only lower than their
corresponding estimates for the period, but were also below the equivalent
levels in the same period of 2015. The low performance can be ascribed to the

30
fall in the price of oil in the world market and the drop in oil lifting figures due to
cut in demand, incessant crude oil theft and vandalism of pipelines in the Niger
Delta region during the period. Similarly, the aggregate gross non-oil revenues
for the same period recorded a decline of ₦45.77 billion (or 7.65%) below the
corresponding figures reported in 2015 (Table 3.6).
Table 3.6: Performance of Revenue in the Fourth Quarter of 2016 Vs 2015
Source: OAGF and Budget Office of the Federation, 2016
3.5 Distributable Revenue: Net distributable revenue for sharing among the three tiers of government after
the deduction of all costs stood at ₦798.89 billion in the fourth quarter of 2016.
This implies a shortfall of ₦631.01 billion (or 44.13%) from budgetary targets
for the period. A breakdown of the contribution of revenue sub-heads to the
distributable revenue shows that oil revenue contributed 34% while the non-oil
revenue contributed 66% indicating a higher cost outlay for the oil sector.
Further breakdown of the non-oil sector shows that Customs & Exercise Duties,
VAT, CIT and Special Levy contributed 17%, 25%,22%, and 2% respectively
during the review period.

31
Figure 3.4: Contributions to Distributable Revenue (in the 4thQuarter of 2016)
Source: Budget Office of the Federation, 2016
3.6 Excess Crude Account: The sum of ₦145.48 billion and ₦97.24 billion were transferred to the ECA in
the third and fourth quarters of 2016. While a total of ₦85.17 billion was
withdrawn from the account in the third quarter of 2016 for distribution among
the three tiers of government. A total of US$3.34 million was the accrued
interest into the ECA in the fourth quarter of 2016. This resulted in a US$3.34
million or 0.14% increase in the ECA from US$2,453.66 million as at 1st
October, 2016 to US$2,457.00 million as at 31st December, 2016 Table 3.7.
Oil Revenue34%
Value Added Tax25%
Company Income Tax22%
Customs & Excise Duties17%
Special Levies2%

32
Table 3.7: Net Excess Crude Account
Source: Office of the Accountant General of the Federation, 2016
3.7 FGN Budget Revenue: The sum of ₦3,855.74 billion was projected to fund the Federal Budget in 2016,
translating to a prorata quarterly share of ₦963.93 billion. Actual total revenue
of ₦341.18 billion, excluding other funding sources, was received in the fourth
quarter of 2016. This amount was ₦622.76 billion (or 64.61%)and ₦235.45
billion (or 40.83%) lower than the ₦963.93 billion quarterly projection and
₦576.63 billion reported in the third quarter of 2016 respectively. The
aggregate revenue in the fourth quarter of 2016 was also ₦136.30 billion (or
28.55%) below the ₦477.48 billion recorded in the fourth quarter of 2015.

33
Figure 3.5: Contributions to the FGN Budget Revenue in the Fourth Quarter of 2016
Source: The OAGF and Budget Office of the Federation, 2016 Note: Above is excluding FGN’s Unspent Balances and FGN’s Balances in Special Accounts
Total Retained Revenue of the Federal Government in the fourth quarter of
2016 stood at ₦758.83 billion indicating a ₦205.10 or 21.28% shortfall from the
prorata budget estimate for the quarter. This was however augmented by
additional inflow of ₦40.05 billion and 6.17 billion from TSA/Pool Account and
Mopped Up Capital respectively to moderate the deficit to ₦158.88 billion or
16.48% in the quarter under review.
The oil revenue inflow for the Federal Government in the fourth quarter of 2016
stood at ₦132.72 billion indicating a decline by N46.67 billion (or 26.02%) from
the quarterly estimate of ₦179.39 billion. Further analysis indicates that all the
components of the projected non-oil revenue inflow to the Federal Government
fell below their quarterly budget estimates. FGN Share of VAT of ₦28.15 billion,
Customs & Excise Duties of ₦64.02 billion, Special Levies of ₦6.62 billion and
Oil and Gas Revenue39%
Value Added Tax8%
Company Income Tax25%
Customs & Excise Duties
19%
Special Levies2%
Independent Revenue
7%

34
Company Income Tax of ₦86.57 billion were below their corresponding
quarterly budget projections of ₦49.56 billion, ₦81.61 billion, ₦15.64 billion and
₦216.87 billion by ₦21.41 billion (or 43.2%), ₦17.59 billion (or 21.55%), ₦9.02
billion (or 57.67%) and ₦130.29 billion (or 60.08%) respectively. FGN Share of
Company Investment by FAAC, FGN Share of Solid Minerals Revenue and
Share of Actual Balances in Special Accounts, on the other hand, yielded no
revenue in the quarter Table 3.8.
Figure 3.6: FGN Revenue (Budget Vs Actual as at December 2016)
Source: The OAGF and Budget Office of the Federation, 2016

35
Table 3.8: Inflows to the 2016 Federal Budget as at December 2016
Source: Budget Office of the Federation and the OAGF, 2016
2015
Annul Quarterly
Budget
First
Quarter
Second
Quarter
Third
Quarter
Fourth
Quarter Annual
Annual
Actual
AInflow for the Federal Budget
(CRF)N'bn N'bn N'bn N'bn N'bn N'bn N'bn N'bn N'bn N'bn N'bn % N'bn % N'bn % N'bn %
1 FGN Share of Oil Revenue 717.55 179.39 236.50 169.54 159.05 132.72 697.80 1,218.22 (46.67) (26.02) (26.33) (16.55) (19.76) (2.75) (520.42) (42.72)
2 FGN Share of Non-Oil Revenue 1,567.92 391.98 169.45 154.14 309.55 185.37 818.51 824.22 (206.61) (52.71) (124.18) (40.12) (749.42) (47.80) (5.71) (0.69)
3FGN Share of Company /
Investment by FAAC95.55 23.89 - - - - - - (23.89) (100.00) - (95.55) (100.00) -
4FGN Share of Solid Minerals
Revenue6.90 1.73 - - 4.19 - 4.19 - (1.73) (100.00) (4.19) (100.00) (2.71) (39.33) 4.19
5 FGN Share of Value Added Tax 198.24 49.56 26.42 26.16 28.27 28.15 109.00 104.66 (21.41) (43.20) (0.12) (0.42) (89.24) (45.02) 4.34 4.15
6 FGN Share of Customs 326.44 81.61 56.35 46.09 62.15 64.02 228.61 232.00 (17.59) (21.55) 1.88 3.02 (97.82) (29.97) (3.39) (1.46)
7FGN Share of Special Levies
(Federation Account)62.56 15.64 4.64 1.97 5.58 6.62 18.80 14.25 (9.02) (57.67) 1.04 18.66 (43.75) (69.94) 4.55 31.96
8FGN Share of Company Income
Tax867.46 216.87 82.04 79.93 209.37 86.57 457.91 473.32 (130.29) (60.08) (122.79) (58.65) (409.55) (47.21) (15.41) (3.26)
9
FGN Share of Actual Balances
in Special Accounts as at
31/12/15
10.79 2.70 - - - - - - (2.70) (100.00) - (10.79) (100.00) -
10 FGN Independent Revenue 1,505.88 376.47 47.52 59.10 108.03 23.09 237.75 323.37 (353.38) (93.87) (84.94) (78.63) (1,268.13) (84.21) (85.62) (26.48)
11 FGN Balance of Special
Account as at 31/12/15:14.38 3.59 - - - - - 21.68 (3.59) (100.00) - (14.38) (100.00) (21.68) (100.00)
12Unspent Balance from
Previous Fiscal Year50.00 12.50 - - - - - - (12.50) (100.00) - (50.00) (100.00) -
13 Sub-Total 3,855.74 963.93 453.47 382.78 576.63 341.18 1,754.05 2,387.49 (622.76) (64.61) (235.45) (40.83) (2,101.68) (54.51) (633.44) (26.53)
B Other Financing Sources - - 30.73 78.73 339.98 417.66 867.10 388.97 417.66 77.68 22.85 867.10 478.13 122.92
14 NNPC Refund to FGN - - 11.66 17.48 17.48 23.31 69.94 69.93 23.31 5.83 33.33 69.94 0.01 0.01
15 Share from Excess PPT - - - - 21.17 87.55 108.72 87.55 66.39 313.62 108.72 108.72
16 Receipts from LNG - - 14.26 - - - 14.26 167.32 - - 14.26 (153.06) (91.48)
17 Exchange Rate Difference - - 4.81 3.39 120.22 50.80 179.23 70.09 50.80 (69.42) (57.74) 179.23 109.14 155.71
18Refund of 1st Quarter Capital
Allocations to CRF- - - 57.85 - - 57.85 - - - 57.85 57.85
19Settlement of State Component
of Coupon Payment- - - - 41.11 - 41.11 - - (41.11) (100.00) 41.11 41.11
20Transfer from Capital
Development Account to CRF- - - - 140.00 255.99 395.99 9.50 255.99 115.99 82.85 395.99 386.49 4,068.33
21Payment to FGN and Other
Statutory Benefits- - - - - - - 72.13 (72.13) (100.00)
C TOTAL RETAINED REVENUE 3,855.74 963.93 484.20 461.50 916.61 758.83 2,621.15 2,776.46 (205.10) (21.28) (157.78) (17.21) (1,234.59) (32.02) (155.31) (5.59)
22 TSA/Pool A/C - - 45.93 21.15 17.91 40.05 125.04 463.88 40.05 22.14 123.65 125.04 (338.85) (73.05)
23 Mopped Up Capital - - - 195.14 - 6.17 201.31 - 6.17 6.17 201.31 201.31
DTotal Revenue Available for
Implementation3,855.74 963.93 530.13 677.80 934.52 805.05 2,947.49 3,240.34 (158.88) (16.48) (129.47) (13.85) (908.24) (23.56) (292.85) (9.04)
2016 ACTUAL VARIANCE
ITEMSS/NO 4th Quarter Actual Vs
Quarterly Budget
4th Quarter Vs 3rd
Quarter (Actual)
Actual Vs Budget
(Annual) 2016 Vs 2015 (Actual)
BUDGET

36
3.8 Expenditure Developments: A total of ₦6,060.48 billion was appropriated for expenditure in the 2016
Budget. This comprises ₦2,646.39 billion (or 43.67%) for Recurrent (Non-Debt)
Expenditure, ₦1,475.32 billion (or 24.34%) for Debt Services, ₦351.37 billion
(or 5.8%) for Statutory Transfers and ₦1,587.40 billion (or 26.19%) for Capital
Expenditure.
3.8.1 Non-Debt Recurrent Expenditure:
In preparing the 2016 Budget, Government was resolute on its plan to cut down
the growth in recurrent expenditures as indicated in the 2016-2018 Fiscal
Framework and Fiscal Strategy Paper. Given government’s resolve not
rationalize its workforce especially as unemployment was already high, it had
introduced other measures to cut down the cost of governance. These
measures include pruning down of overhead cost through the activities of the
efficiency unit; and the continued roll-out of the Integrated Payroll and
Personnel Information System (IPPIS) across MDAs which is already making
some savings in personnel costs.
Figure 3.7: 2009 – 2016 Budget Expenditure Profile
Statutory Transfers
Debt Services
Capital ExpenditureRecurrent (Non-Debt) Expenditure
Aggregate Expenditure
0
1000
2000
3000
4000
5000
6000
7000
2009 2010 2011 2012 20132014
20152016
Nai
ra in
Bill
ion
2009 2010 2011 2012 2013 2014 2015 2016
Statutory Transfers 168.62 183.58 417.83 372.59 387.98 408.69 375.62 351.37
Debt Services 283.65 542.38 495.1 559.58 591.76 712 953.62 1,475.32
Capital Expenditure 1,280.71 1,764.69 1,146.75 1,339.99 1,621.48 1,119.62 557.00 1,587.40
Recurrent (Non-Debt) Expenditure 1,824.71 2,669.01 2,425.07 2,425.05 2,386.03 2,454.89 2,607.13 2,646.39
Aggregate Expenditure 3,557.69 5,159.66 4,484.74 4,697.21 4,987.24 4,695.19 4,493.36 6,060.48

37
Source: Budget Office of the Federation, 2016
A total of ₦730.0 billion was spent on non-debt recurrent expenditure in the
fourth quarter of 2016. This indicates an increase of ₦68.41 billion (or 10.34%)
above the quarterly estimate of ₦661.60 billion.
Figure 3.8: Personnel, Overhead and Capital Expenditure Trends (2008 – 2016)
Source: BOF and OAGF, 2016
3.8.2 Debt Service:
Debt related expenditure in the fourth quarter of 2016 stood at ₦268.5 billion
comprising of ₦245.95 billion of Debt Services and ₦22.55 billion of Sinking
Fund to retire maturing loans. A breakdown of total debt services for the quarter
shows that domestic debt services accounted for 89.81% or ₦218.60 billion
while external debt services stood at ₦27.35 billion or 10.19%. The total
expenditure on debt services fell short of the prorata budget estimate of
₦661.60 billion for the period by ₦94.52 billion or 27.76%. This however
comprises of an expenditure shortfall of ₦108.25 billion or 33.12% of the
2008Budget
2009Budget
2010Budget
2011Budget
2012Budget
2013Budget
2014Budget
2015Budget
2016Budget
Personnel Costs (MDAs) 29.88% 24.08% 28.66% 40.01% 33.89% 3.37% 4.79% 3.46% -4.47%
Capital Spending 29.66% 36.00% 34.20% 25.57% 27.47% 21.01% -30.95% -50.25% 184.99%
Overheads 12% 27.20% 23.06% 14.07% 5.57% -15.94% -17.37% -9.65% -8%
Recurrent (Non Debt) 41.88% 51.28% 51.72% 54.07% 49.72% -1.62% 2.06% 6.20% 1.51%
-100.00%
-50.00%
0.00%
50.00%
100.00%
150.00%
200.00%
Pe
rce
nt
Ch
ange
s in
Sp
en
din
g Tr
en
d

38
₦326.85 billion budgeted for domestic debt services while the external debt
service budget was surpassed by ₦13.73 billion or 100.77%.
Year-to-Date
Annual debt service was estimated at ₦1,361.88 billion in the 2016 Budget
comprising of ₦1,307.40 billion for domestic debt servicing and ₦54.48 billion
for the servicing of external debt. Actual domestic debt service in 2016 stood
at ₦1,228.76 billion indicating a shortfall of ₦78.64 billion (or 6.01%). Total
actual external debt service payment, on the other hand amounted to ₦107.69
billion indicating an increase of ₦53.21 billion (or 97.67%) above the budgeted
estimate for the year.

39
Table 3.9: FGN Budget Expenditure and Fiscal Account (in N’ Billion) as at December 2016
Source: OAGF and Budget Office of the Federation, 2016
2015
Annual Quarterly First
Quarter
Second
Quarter
Third
Quarter
Fourth
QuarterAnnual
Annual
ActualN'bn N'bn N'bn N'bn N'bn N'bn N'bn N'bn N'bn % N'bn % N'bn % N'bn %
A TOTAL RETAINED REVENUE 3,855.74 963.94 484.20 461.50 916.61 758.84 2,621.15 2,776.36 (205.10) (21.28) (157.78) (17.21) (1,234.59) (32.02) (155.21) (5.59)
B TSA/Pool A/C - - 45.93 21.15 17.91 40.05 125.04 463.88 40.05 22.14 123.65 125.04 (338.85) (73.05)
C Mopped Up Capital - - 195.14 - 6.17 201.31 6.17 6.17 201.31 201.31
D TOTAL INFLOW 3,855.74 963.94 530.13 677.79 934.52 805.05 2,947.49 3,240.24 (158.88) (16.48) (129.46) (13.85) (908.25) (23.56) (292.75) (9.03)
E EXPENDITURE: - - - - -
1 RECURRENT NON-DEBT: - - - - - 2 Personnel Cost 1,748.33 437.08 364.25 526.56 417.94 381.18 1,689.94 1,869.34 (55.90) (12.79) (36.76) (8.79) (58.40) (3.34) (179.40) (9.60)
3 Pension & Gratuities Including Service Wide Pension 298.11 74.53 31.95 47.23 59.10 46.48 184.76 208.11 (28.05) (37.64) (12.63) (21.36) (113.35) (38.02) (23.35) (11.22) 4 Overhead Cost 163.39 40.85 27.04 28.38 56.54 37.33 149.28 414.81 (3.52) (8.61) (19.21) (33.97) (14.11) (8.63) (265.53) (64.01)
5
Other Service Wide Vote Including Presidential Amnesty
(Bal Fig) 136.56 34.14 25.83 44.16 52.65 265.01 387.65 57.81 230.87 676.26 212.36 403.31 251.09 183.87 329.84 570.56 6 Special Intervention (Recurrent) 300.00 75.00 - - - - - (75.00) (100.00) - (300.00) (100.00) - 7 Sub-Total (Non-Debt) 2,646.39 661.60 449.07 646.32 586.24 730.00 2,411.63 2,550.07 68.41 10.34 143.77 24.52 (234.76) (8.87) (138.44) (5.43)
8 Domestic Debts & Int. on Ways & Means 1,307.40 326.85 349.36 218.56 449.59 218.60 1,236.11 996.80 (108.25) (33.12) (230.99) (51.38) (71.29) (5.45) 239.31 24.01 9 Foreign Debts 54.48 13.62 15.45 15.26 19.29 27.35 77.35 63.59 13.73 100.77 8.05 41.75 22.87 41.97 13.76 21.63
10 Sub-Total (Debt Services) 1,361.88 340.47 364.81 233.82 468.88 245.95 1,313.46 1,060.39 (94.52) (27.76) (222.93) (47.55) (48.42) (3.56) 253.07 23.87 11 States Deferred Loan Deductd IFO DMO April '16 - - 10.89 10.97 - 21.86 - (10.97) (100.00) 21.86 21.86
12 Sinking Fund to Retire Maturing Loans 113.44 28.36 - - 27.03 22.55 49.58 (5.81) (20.48) (4.48) (16.56) (63.86) (56.29) 49.58
13 Loan to .5% Statutory Stabilization Account 30.00 (30.00) (100.00)
14 Loan to Ex Dom Naira Account IRO Ind. Oil Marketers 187.10 (187.10) (100.00)
15 Sub-Total (Recurrent Debt) 1,475.32 368.83 364.81 244.71 506.88 268.50 1,384.90 1,277.49 (100.33) (27.20) (238.38) (47.03) (90.42) (6.13) 107.41 8.41
16 Total Recurrent 2016 4,121.71 1,030.43 813.88 891.04 1,093.12 998.51 3,796.53 3,827.56 (31.92) (3.10) (94.61) (8.66) (325.18) (7.89) (31.03) (0.81) 17 Recurrent Expenditure 2015 - - 82.09 0.52 - - 82.61 - - 82.61 82.61 18 Total Recurrent Expenditure 4,121.71 1,030.43 895.97 891.56 1,093.12 998.51 3,879.15 3,827.56 (31.92) (3.10) (94.61) (8.66) (242.56) (5.88) 51.59 1.35
19 CAPITAL EXPENDITURE: - - - - - - - - - - 20 Capital Releases 2015 - - 59.19 9.09 - - 68.28 21.68 - - 68.28 46.60 214.93 21 *Capital Releases 2016 1,587.40 396.85 12.65 78.13 - 14.03 104.82 362.39 (382.82) (96.46) 14.03 (1,482.59) (93.40) (257.58) (71.08)
22 Refund to MDAs from TSA 217.19 (217.19) (100.00) 23 Sub-Total (Capital) 1,587.40 396.85 71.84 87.22 - 14.03 173.09 601.26 (382.82) (96.46) 14.03 (1,414.31) (89.10) (428.17) (71.21)
24 TRANSFERS: - - - - - - - - - - 25 Niger Delta Development Commission (NDDC) 41.05 10.26 6.84 13.68 10.26 6.84 37.63 37.91 (3.42) (33.33) (3.42) (33.33) (3.42) (8.33) (0.28) (0.74)
26 National Judicial Council (NJC) 70.00 17.50 11.67 23.33 17.50 17.50 70.00 74.00 (0.00) (0.01) - - (0.00) (0.01) (4.00) (5.41) 27 Universal Basic Education Commission (UBEC) 77.11 19.28 12.85 25.70 19.28 19.28 77.11 56.79 0.00 0.00 - - 0.00 0.00 20.32 35.78 28 Independent National Electoral Commission (INEC) 45.00 11.25 7.50 11.25 11.25 11.25 41.25 52.21 - - - - (3.75) (8.33) (10.96) (20.99) 29 National Assembly (NASS) 115.00 28.75 19.17 38.33 28.75 28.75 115.00 114.66 (0.00) (0.00) - - (0.00) (0.00) 0.34 0.29 30 Public Complaint Commission (PCC) 2.00 0.50 0.50 0.50 0.50 0.50 2.00 1.75 0.00 0.20 - - 0.00 0.15 0.25 14.46 31 National Human Right Commission (NHRC) 1.21 0.30 0.20 0.20 0.30 0.30 1.01 1.24 0.00 0.17 - - (0.20) (16.53) (0.23) (18.55) 32 Sub-Total (Transfers) 351.37 87.84 58.73 113.01 87.84 84.42 344.00 338.56 (3.42) (3.89) (3.42) (3.89) (7.37) (2.10) 5.44 1.61 33 TOTAL ACTUAL EXPENDITURE: 6,060.48 1,515.12 1,026.54 1,091.78 1,180.96 1,096.96 4,396.24 4,767.38 (418.16) (27.60) (84.00) (7.11) (1,664.24) (27.46) (371.14) (7.79) 34 Refund to MDAs and Banks - 55.90 58.04 9.90 2.43 126.27 2.43 (7.47) (75.46) 126.27 126.27 35 Excess PPT Account - - - - - - - - - -
36 Settlement of State Component of Coupon Payment - - - 41.11 - 41.11 - (41.11) (100.00) 41.11 41.11 37 Mopped Up Capital Refunded - - 187.12 - - 187.12 - - 187.12 187.12 38 ECA Loan Deduction May 2016 - - - - 3.54 - 3.54 - (3.54) (100.00) 3.54 3.54 39 Reimbursement of Paris Club Overdeduction - - - - 387.67 387.67 387.67 387.67 387.67 387.67 40 TOTAL OUTFLOW 6,060.48 1,515.12 1,082.44 1,336.94 1,235.50 1,487.05 5,141.94 4,767.38 (28.07) (1.85) 251.55 20.36 (918.55) (15.16) 374.56 7.86 41 Fiscal Deficit (2,204.74) (551.19) (552.31) (659.14) (300.99) (682.00) (2,194.44) (1,527.14) (130.81) 23.73 (381.02) 126.59 10.30 (0.47) (667.30) 43.70
F FINANCING ITEMS - - - - - - - - - -
1 Privitization Proceeds 10.00 2.50 5.92 - - - 5.92 (2.50) (100.00) - (4.08) (40.78) 5.92
2 Signature Bonus 0.74 0.19 - - - - - (0.19) (100.00) - (0.74) (100.00) - 3 Borrowing from Special Accounts - - (3.49) - 380.00 - 376.51 17.41 - (380.00) (100.00) 376.51 359.10 2,062.62
4 Securitization of Balance of 2015 Borrowing - - - 224.60 - - 224.60 - - 224.60 224.60 5 Foreign Borrowing 635.88 158.97 - - - - - (158.97) (100.00) - (635.88) (100.00) -
6 Domestic Borrowing (FGN Bond) 1,182.80 295.70 300.00 - - - 300.00 330.00 (295.70) (100.00) - (882.80) (74.64) (30.00) (9.09)
7
Deficit Funding for 2015 Supplementary Appropriation
Act - - 300.00 - - - 300.00 - - 300.00 300.00
8 Refund to Excess Crude Account - - - (40.00) - (40.00) - 40.00 (100.00) (40.00) (40.00)
9 Refunds/Recoveries from Strategic Alliance Contracts 137.90 34.48 - - - - - (34.48) (100.00) - (137.90) (100.00) -
10 FGN share of JV AssetsTransfered to NDPC (NNPC/CBN) 162.43 40.61 - - - - - (40.61) (100.00) - (162.43) (100.00) -
11 Recoveries of Other Misappropriated Funds 50.00 12.50 - - - - - (12.50) (100.00) - (50.00) (100.00) -
12 Proceed of Sale of Government Properties 25.00 6.25 - - - - - (6.25) (100.00) - (25.00) (100.00) -
13 FGN Share from Stabilization Fund Account 6.60 (6.60) (100.00)
14 Credit Advance by CBN 615.96 (615.96) (100.00)
15 Transfer of Funds from Special Account (Monetization) 73.51 (73.51) (100.00)
16 Sub-Total 2,204.74 551.19 602.44 224.60 340.00 - 1,167.04 1,043.48 (551.19) (100.00) (340.00) (100.00) (1,037.71) (47.07) 123.56 11.84
17 Net Deficit / Surplus - - 50.12 (434.54) 39.01 (682.00) (1,027.41) (483.66) (682.00) (721.02) (1,848.05) (1,027.41) (543.75) 112.42
VARIANCE
ITEMSS/NO
BUDGET4th Quarter Actual Vs
Quarterly Budget
4th Quarter Vs 3rd
Quarter (Actual)
Actual Vs Budget
(Annual)2016 Vs 2015 (Actual)
2016 ACTUAL

40
3.8.3 Statutory Transfers:
A total of ₦84.42 billion was released as statutory transfers in the fourth quarter
of 2016. A breakdown of the actual transfers in the period shows that ₦6.84
billion was to Niger Delta Development Commission (NDDC), ₦17.50 billion
was to National Judicial Council (NJC), ₦19.28 billion was to Universal Basic
Education Commission (UBEC), ₦11.25 billion was to Independent Electoral
Commission (INEC), ₦28.75 billion was to National Assembly (NAS), ₦0.50
billion was to Public Complaint Commission (PCC) and ₦0.30billion was to the
National Human Right Commission (NHRC). It is good to note that quarterly
releases under this subhead are made on request by the beneficiaries, subject
to budgetary provisions and availability of funds.
3.8.4 Capital Expenditure Performance
Government’s reinstated its commitment to regig the structure of the Nigerian
economy by allocating greater resources to developmental projects in the
2016 Budget. As such greater resources were directed to the provision of
critical infrastructure in the roads, power, housing, rail and aviation sectors as
well as the provision of physical and food security for the nation. This led to
the allocation of a total of ₦1,587.40 billion to capital spending in the 2016
Budget as against ₦557.00 billion in 2015.
3.9 MDAs’ Capital Vote Utilization:
The analysis of the 2016 capital performance for MDAs as at 5th May, 2017
revealed that a total of ₦1,219.47 billion was released and cash backed to
MDAs for their 2016 capital projects and programmes. The sum of ₦436.22
billion was released in the first batch or warrant, ₦156.85 billion in the second
batch, ₦64.42 billion in the third batch, ₦27.26 billion in the fourth batch and
₦487.75 billion as Authority to Incur Expenditure (AIEs).
Performance as at 5th May, 2017
A total of ₦1,191.97 billion (or 97.75%) of the total amount released and cash-

41
backed was utilized by MDAs as at 5th May, 2017. A breakdown of the forty
(40) MDAs reported upon by the Office of the Accountant-General of the
Federation (OAGF) showed different levels of utilization among the MDAs.
Twenty four (or 60%) of the MDAs including: Water Resources, Agriculture,
Women Affairs, Youth Development, FCTA, Communication Technology,
Interior, Mines & Steel, ONSA, FCSC, Federal Character Commission, Fiscal
Responsibility Commission, Code of Conduct Bureau and Code of Conduct
Tribunal had utilized more than the overall average utilization rate of 97.75%
of the amount cash-backed. Five out of these, including ICPC, National Salary
& Wages, ONSA, Code of Conduct Tribunal and Federal Character
Commission had 100% of their respective cash-backed funds utilized.
The utilization report also revealed that 16 MDAs (40%) which included:
Presidency, OSGF, Defence, Education, Finance, Health, Trade & Investment,
Information, Head of Service, Labour & Productivity, Transport, Petroleum,
Budget & National Planning, ICRC, National Population Commission and
Police Service Commission utilized below the average utilization rate of
97.75% of their cash-backed funds Table 3.10.
Table 3.10: Capital Budget Utilization by MDAs (as at 5th May, 2017)
Annual Appropriation Total Amount
Released
Total Amount Cash
Backed
N N N N
As % of Annual
Capital
Appropriation
As % of Cash-
Backed Funds
As % of
Budgetary
Releases
Federal Ministry of Works, Power &
Housing 422,964,928,495 307,411,749,682 307,411,749,682 300,993,411,071 71.16 97.91 97.91
Transport 188,674,679,674 143,121,925,241 143,121,925,241 134,742,997,180 71.42 94.15 94.15
Agriculture 46,173,963,859 30,989,098,425 30,989,098,425 30,971,848,506 67.08 99.94 99.94
Water Resources 46,081,121,423 46,543,787,304 46,543,787,304 46,367,827,083 100.62 99.62 99.62
Education 35,433,487,466 22,647,178,912 22,647,178,912 20,821,588,552 58.76 91.94 91.94
Health 28,650,342,987 28,592,592,446 28,592,592,446 27,809,904,863 97.07 97.26 97.26
Science & Technology 27,006,179,074 16,017,578,814 16,017,578,814 15,740,384,379 58.28 98.27 98.27
Niger Delta 19,440,328,551 11,161,196,486 11,161,196,486 11,074,355,877 56.97 99.22 99.22
FCTA 29,297,122,872 15,000,000,000 15,000,000,000 14,996,999,670 51.19 99.98 99.98
Defence 130,864,439,542 97,255,505,952 97,255,505,952 94,618,725,002 72.30 97.29 97.29
ONSA 32,084,085,624 33,218,261,116 33,218,261,116 33,218,261,116 103.54 100.00 100.00
Interior 61,713,279,496 40,887,226,244 40,887,226,244 40,742,906,223 66.02 99.65 99.65
Presidency 23,004,199,699 27,942,012,741 27,942,012,741 25,131,628,086 109.25 89.94 89.94
Secretary to Government of the
Federation 20,319,288,049 13,407,794,563 13,407,794,563 12,338,942,418 60.73 92.03 92.03
Total Average Utilization by All MDAs
(Inclusive of Capital Supplementation) 1,832,031,188,697 1,219,471,747,443 1,219,471,747,443 1,191,974,940,054 65.06 97.75 97.75
MDA
Utilization

42
Source: OAGF and BOF, 2016
Figure 3.9: Pictorial Representation of Selected MDAs Utilization
Source: BOF and OAGF, 2016
3.8.4 Performance of the Financing Items:
46. The 2016 Fiscal Framework estimated a quarterly deficit of ₦551.19
billion to be financed through earnings from Privatization Proceeds of ₦2.50
billion, FGN’s Share of Signature Bonus of ₦0.19 billion, Recovery of
Misappropriated Funds of ₦87.58 billion, Foreign Borrowing of ₦158.97 billion,
Domestic Borrowing (FGN Bond) of ₦295.70 billion and Sale of Government
Properties of ₦6.25 billion.
In the fourth quarter of 2016, none of the projected financing items (Earnings
of Privatization Proceeds, FGN’s Share of Signature Bonus, Recovery of
Misappropriated Funds, Foreign Borrowing, Domestic Borrowing (FGN Bond)
and Sale of Government Properties materialized.

4.0 CAPITAL PROJECT IMPLEMENTATION REPORT
The Ministry of Budget and National Planning conducted physical
inspection of selected capital projects and programmes across the six (6)
geo-political zones of the country from Monday 15th to Friday 26th May,
2017. This is further to the Administration’s commitment to deliver on its
promises as well as promote transparency and accountability. The
objective of the exercise was to track projects performances and assess
their levels of completion vis-à-vis funds expended. This is to ensure that
funds released for projects are judiciously utilised and expected outcomes
delivered to the Nigerian citizenry.
Emphasis was placed on assessing the financial commitment of the
selected projects and programmes, their status of implementation, the
socio-economic impact on the immediate communities and challenges
hindering the prompt delivery of the projects. The monitoring teams
covered various projects in fifteen (15) selected MDAs/sectors namely:
Presidency; Secretary to the Government of the Federation; Agriculture;
Transport and Aviation; Power, Works and Housing; Interior; Defence;
and Water Resources. Others are: Health, Education, FCTA, Niger Delta,
Science & Technology, Solid Minerals and Women Affairs. The outcome
of the exercise in the various MDAs/sectors is as follow:
4.1 WATER RESOURCES SECTOR The sector was allocated a total of ₦56.08 billion in the 2016 budget to
execute its capital projects and programmes. Of this amount, ₦46.54
billion was released while ₦42.41billion (representing 91.99%) was
utilised as at end of the fiscal year. The following institutions/projects were
monitored:
4.1.1 OGUN/OSUN RIVER BASIN DEVELOPMENT AUTHORITY The Authority had an appropriation of ₦1.01 Billion in the 2016 Budget for
the execution of its capital projects. Out of this amount, ₦959.35 Billion
was released, while ₦551.16 Billion was utilized to achieve 89.44%
cumulative performance. The following projects were monitored:

44
i Ogbese Multipurpose Dam Project The project involves the supply of potable water, hydroelectric power
generation and irrigation, fishery and forestry development at Ogbese-Ise
in Ise and Ikere LGAs across Ogbese River at Lat. 7 27, Long. 5 18 in
Ekiti State. The scope of work includes: construction of earth
embankment, spillway, water inlet, outlet and power component. The
project had not been funded from 2013 to 2016 which resulted to stoppage
of activities.
The contract was awarded to Foundation Solid Nig. Ltd. at an initial cost
of ₦5.49 billion with an expected completion date of July 2011. However,
the contract was later revised to ₦7.80 billion with an extended completion
date of two years. The upward review was due to the addition of hydro
power component to the project. The sum of ₦500 million was
appropriated in the 2016 Budget, of which same amount was released
while ₦495.01 million was utilized. A total of ₦2.57 billion had so far been
committed to the project to achieve 31% level of completion.
Findings: At the time of visit, the contractor had just re-mobilised to site. Completed
works include: foundation treatment (grouting), clay blanket, dam wing
wall, spillway earthwork, embankment filling; reservoir dam
survey/pegging. Works in progress include: casting of spillway,
excavating of still basin and clearing the reservoir area.
Socio-economic Impact: Although, the project is still in progress, it had empowered local
businesses and youths of the area. When completed, it will alleviate
poverty among the rural population in Ekiti and adjoining communities.
Challenges: Inadequate funding over the years had slowed down the pace of work.

45
Picture 1: On going excavation of stilling basin area and clearing the
reservoir area at Ogbese multipurpose dam
4.1.2 CONSTRUCTION OF WATER TREATMENT PLANT PHASE II AT
TAFAWA BALEWA, BAUCHI STATE
The project involves the construction of new water treatment plant and the
rehabilitation of the existing dysfunctional scheme. The new scheme was
designed to solve the acute water shortage in the area. Components of
the project include: 15nos solar powered boreholes; 3nos
100m3/200m3fibre tanks; 58nos fetching points with solar lightening
system, fencing, security post and 15km networking pipe connecting the
boreholes to fetching points. Others are: rehabilitation of the existing
submersible pumps in 5nos boreholes, and repairs of 4nos existing
storage tanks and fetching points.
The contract was awarded to Messrs Yekco (Nig.) Ltd. at a cost of ₦363.6
million in November, 2016 and was expected to be completed in May,
2017. The sum of ₦400 million was appropriated in 2016 budget. Of this
amount, same was released and ₦339.6 million was utilized to achieve a
cumulative performance of 64%.
Findings: At the time of monitoring, the procurement/installation of 15nos solar
powered boreholes, 30nos fetching points, PVC pipes, 58nos solar
powered light points and batteries had been completed. Outstanding
works in the site are: rehabilitation of the existing dysfunctional scheme,
supply of 58no lightening poles and installation of submersible pump.
Picture 2: On-going Construction of water treatment plant phase II

46
at Tafawa Balewa, Bauchi State
Socio-economic Impact: The project has created employment opportunities for over 24
Technicians and other lay workers in the host community. When
completed, it is expected to solve the acute water shortage of residents
and also provide solar lightening beautification for the town.
Challenges: The team was informed that the Contractor was yet to be paid for certified
works completed.
4.1.3 LOWER NIGER RIVER BASIN DEVELOPMENT AUTHORITY A total of ₦24.33 billion was allocated to the River basin in the 2016
budget to execute its capital projects/programs. Out of this amount,
₦18.58 billion was released and cashed back as at the end of the fiscal
year. The following project was monitored:
i Construction of Orin Irrigation Project This project was conceived to provide portable water for domestic
consumption, irrigation and other economic activities for Aran-Oren
Irepodun LGA and its neighbouring communities in Kwara state. The
scope of work includes: Construction of irrigation infrastructure spillway,
concrete stilling basin, excavation of earth domestic intake and bottom
outlet works and clearing of irrigation area. Other are: provision of 10 km
access road and drainage, and 700mm diameter topographical survey.
The contract was awarded to Messrs Turning Point Engineering Ltd. in
January, 2016 at the cost of ₦249.02 million with a scheduled completion
date of December 2017. The sum of ₦160.03 million was appropriated in
the 2016 budget. Of this amount, ₦102 million was released and utilised
as at the end of the fiscal year to achieve 85% level of completion.

47
Findings:
At the time of monitoring, works completed include: The access road,
payment of compensation to the beneficiaries, construction of office, dam
filling of 2.5m by 45m length and 600mm diameter scoring pipes in
concrete cast of 4 by 1.3m of 45 length, the clearing of dam axis, reservoir
area, and excavation dam site, key trench and filling were ongoing. Others
are grading of access roads, drainage, spillway, footbridge and
constructing of steeling basin.
Socio-economic Impact: The project when completed is expected to boost food security and
provision of portable water supply to the community and the state at large.
Picture 3: The Ongoing Construction of Orin irrigation project
4.2 INTERIOR SECTOR The sector was allocated a total of ₦61.82 billion in the 2016 budget to
execute its capital projects and programmes. Out of this amount, ₦40.89
billion was released and cash backed, while ₦35.63 billion (87.13%) was
utilised at the end of the financial year. The following institutions/projects
were monitored:
4.2.1 NIGERIA SECURITY AND CIVIL DEFENCE CORPS, ABUJA In the 2016 budget, the Defence Corps was appropriated the sum of
₦5.27 billion out of which ₦4.94 billion was released and ₦4.24 billion

48
utilised. The following project was monitored:
i. Purchase of operational vehicles (pick up vans) This project involves the supply of operational vehicles for the Defence
Corps viz: 27nos. Toyota Hilux double cabin pick up vans (4x4 full option),
21nos. Hyundai Accent and 8nos. Hyundai Sonata, 2nos. Peugeot 508
(2016 model) and a Toyota Camry 2.5 liter engine (2016) model. Others
include: 3nos. each of Almera – Tekna 1.5 AT and Nissan Almera-Acenta
1.5MT (2016) model, 2nos. Toyota Coaster Buses 30-seater and
operational vehicles tires of various sizes and brands, etc.
The contract was awarded to a consortium of contractors (Messrs. MGK
Global Services Ltd. & Others) in September 2016 at a total cost of ₦1.39
billion with completion date scheduled for March 2016. In the 2016 budget,
the sum of ₦1.39 billion was appropriated while, ₦1.385 billion was
released and utilised as at the end of the fiscal year.
Findings: At the time of visit, all the vehicles had been procured. The team was
informed that some of the operational vehicles had been distributed to
some of the state commands to facilitate their operations.
Socio-economic Impact: The procurement of these vehicles has improved the operational
capabilities of the Corps to respond rapidly in fighting crimes.
Pictures 4: Some of the operational vehicles at the Corps’
warehouse, Sauka-Abuja

49
4.2.2 NIGERIA PRISON SERVICE (NPS) The NPS had an appropriation of ₦14.43 billion in the 2016 Budget for the
execution of its capital projects and programmes. Of this amount, ₦7.17
billion was released while ₦7.14 billion was utilized to achieve 99.54%
cumulative performance. The following project was monitored:
i Renovation of Cell “B” at Ilaro Prison
The project was designed to develop prison infrastructure in order to
decongest the prison, and enhance their security and safe custody of
inmates at the Ilaro prison in Ogun State. The scope of work includes:
renovation of administrative and inmates cell blocks.
The contract was awarded to Messrs Blessing & Faith Nig. Ltd. at a cost
of ₦3.29 million in May 2016 with completion date of May 2017. The sum
of ₦3.29 million was appropriated to the project in the 2016 Budget, of
which same amount was released and utilized to achieve 100% level of
completion.
Findings: At the time of monitoring, the project had been completed.
Socio-economic Impacts: The project had enhanced the prison’s aesthetics, hygiene and also
motivated the prison officers and wardens.
Picture 5: Completed renovation of adminstrative offices at Ilaro
Prison
4.2.3 NIGERIA POLICE FORMATION AND COMMANDS The sum of ₦16.11 billion was appropriated to the command in the 2016
budget. Out of this amount, ₦10.32 billion was released while ₦9.94 billion
was utilized to execute the following projects:

50
i. Completion of the Construction of NPF Finance Corps
Office, Force Headquarters, Abuja: The project entails the construction of office accommodation for officers
and men deployed to the Finance Corps of the command. The building
comprises of offices, conference rooms, conveniences et cetera. The
contract was awarded to Messrs SEM-LUC Ventures Ltd. and Messrs
BODKAK Ltd. at a total cost of N160million in June, 2016 with a
completion period of 36 months. In the 2016 budget, the sum of
N160million was appropriated. Of this amount, N82.96 million was
released and utilized to achieve 95% level completion.
Finding: At the time of monitoring, the project had been completed and put to use.
Picture 6: Completed NPF Finance Corps office, Force Headquarters,
Abuja
Socio-economic Impact: The team was informed that project had provided a conducive office
accommodation for the Officers and Men of the Finance Corps.
ii Completion of 4Nos Blocks of 8 Flats at Force
Headquarters (FHQ), Abuja: The project entails the construction of flats to provide transit
accommodation for Senor Officers of the Police deployed to the Force
Headquarters. The contract was awarded to Messrs Ranim Nigeria
Limited in June 2016 at a cost of N127million with a completion period of
36 months. In 2016 budget, the sum of N60million was appropriated,
released and utilized to achieve 100% level of completion.
Findings: At the time monitoring, the project had been completed and put to use.

51
Picture 7: Completed 4nos Blocks of 8 flats at FHQ, Abuja
Socio-economic Impact: The project had provided a conducive office accommodation for Officers
of the Force Headquarters.
4.3 POWER, WORKS AND HOUSING SECTOR The sector is critical to the change agenda of the present government in
its drive to provide infrastructures and enhance power generation and
distribution in the country. To achieve this, the sum of N422.96billion was
allocated to the sector in the 2016 budget to execute its capital projects
and programmes. Of this amount, N307.41billion was released and cash
backed while, N298.25billion (or 97.02%) was utilised at the end of the
fiscal year.
3.0.1 TRANSMISSION COMPANY OF NIGERIA The company had an appropriation of N30billion in the 2016 Budget for
the implementation of its capital projects and programmes. Of this
amount, N24.50billion was released while, N21.82billion was utilized to
achieve 89.05% cumulative performance. The following projects were
monitored:
i. Benin North-Oshogbo 330KV DC Line With one SC
Turning In and Out to New Akure Sub-Station The project was aimed at providing bulk power to Ondo, Edo and Osun
states. The contract was awarded to Messrs Gammon India Ltd. and
Messrs FCEP JV at a total cost of ₦833.45 million+$2.24 million in
November, 2010. Work commenced in October, 2011 and was scheduled
originally expected to be completed by October 2013 but was later

52
extended to January 2019 due to fund constraint.
In the 2016 Budget, the sum of ₦1.1 billion was appropriated, of which
same amount was released and utilised in the fourth quarter. A total of
$15.91 million + ₦527.24 million had so far been committed to the project
to achieve 47% cumulative performance.
Findings: At the time of monitoring, work done include: completion of the detailed
route survey, construction of 210 nos. tower foundations, erection of 165
nos. of towers and the opening of the line route between Akure and Benin
North. The outstanding works were: geotechnical investigation on the line
route, construction of the remaining 401 nos. of tower foundation, 446 nos.
of tower to be erected, the stringing of the poles and commissioning of the
sub-station.
Socio-economic Impact: The project has empowered some of the skilled and unskilled youths and
businesses in the project locations. On completion, communities in
Oshogbo, Akure and Benin will benefit from the electricity supply which
will in turn boost economic activities.
Challenges: The project execution was slowed down way leave (right of way) along
the line routes, transportation of 28 nos. of containers to be lifted from the
port and paucity of funds.
Picture 8: Benin North-Oshogbo 330KV DC Line with one SC turning
in and out to new Akure Sub-Station.

53
4.3.2 MAIDUGURI 330/132KV SUBSTATION
The project involves the completion of 1 x150MVA, 330/132KV Substation
at Maiduguri. The Scope of work includes: Additional 1x60KV, 132KV
Transformer, Movement of 1x75MVAR Shunt reactor from Lagos to
Maiduguri. The contract was awarded to Messrs Best & Cromption
Engineering Africa Ltd on 24th November 2010 at an initial cost of
US$2.067 million plus ₦792.76 million with completion date of November
2012.However, the cost was revised to US$4.59 million plus ₦1.011 billion
with a new completion date of December 2017. The upward review of the
contract was as a result of insurgency in Maiduguri.
In the 2016 Budget, the sum of ₦206.83 million was appropriated,
released and utilized bringing total commitment to US$4.27 million plus
₦683.002 million to achieve 90% level Completion.
Finding: At the time of Inspection, work completed includes: construction of 1200m
wall fence, 14 no Gantries foundations, Excavation of Equipment base
foundation, external drainage, Security-Gate, 1no Power Transformer
Plinths, 1x150MVA Transformer and Staff quarters. Others are: Cable
Trench, Drilling of borehole, 1no 75MVAR Reactor, control building and
Access road. While, Engineering Control room, Erection of Equipment and
Overhead Connection, Turn-inTurn–out on 132KV TL (Tower Erected)
were in progress and at various levels of completion. Outstanding works
includes: Cabling and termination for 1x150MVA 330/132KV Side,
Gravelling, and Completion of 1 x 60MVA, 132/33KV Transformer & its
associated Switchgears, Testing and Commissioning.
Picture 9: Maiduguri 330/132KV substation power transformer and
associated switch gear.

54
Socio-economic Impact: The project has created job opportunity to skill and unskilled workers.
When completed It will improve power supply /distribution to Maiduguri.
4.4 WORKS SECTOR
i Rehabilitation of Outstanding Of Onitsha – Enugu
Expressway Amansea – Enugu Road Contract No. 6266 The project involves the complete rehabilitation of 50km single
carriageway which comprises of 18km Enugu bound from Enugu –
`Obunofia-Amankwo – Ngwo and 40km Onitsha bound which terminates
at Amansea. The scope of work includes: 2-no bridges of 160m,
excavation for concrete and drains, construction of concrete line drains,
cement stabilization, sub base, stone base, asphaltic concrete binder and
wearing courses.
The contract was awarded to Messrs Reynolds Construction Company
(Nig) Ltd. in February 2015 at a cost of ₦24.24 billion with completion date
scheduled for February 2018. The sum of ₦5.47 billion was appropriated
in the 2016 budget, of which ₦3.54 Billion was released and utilised to
achieve 14.49% cumulative performance.
Findings At the time of monitoring, the Contractor was not on site. However, 2km
of palliative work had been carried out on the Onitsha bound. Other works
achieved included: 22km site clearance, Earthworks, scarification, sub
base, 15.7km soil cement, culvert and drains, 9.28km base and binder
course. The team was informed by the Engineers’ Representative that the
Contractor is presently carrying out skeletal services because of the
weather and fund constraints.
Picture 10: Ongoing rehabilitation of outstanding portion of Onitsha
– Enugu Expressway Amansea – Enugu Road

55
Socio-economic Impact: Although the project is still on–going, it had created employment
opportunities for about 450 skilled and unskilled labour. It has also
increase the free flow of traffic, reduced vehicle operating cost and
travelling time.
Challenges The Project Manager informed the monitoring team that the contract was
put on hold for one year after the award of the contract as the design of
the pavement was approved only in October 2016 consequently, delaying
mobilisation as at when due. Besides, the rainy season also contributed
to the slow pace of work on site.
ii Reconstruction, Rehabilitation and Expansion of Lagos –
Ibadan Expressway, Section 1 (Lagos – Shagamu):
Contract No. 6204. The project involves the reconstruction, rehabilitation and expansion of
43.6km dual carriageway from Lagos through Ogun to Oyo and other
parts of the country. The scope of work includes: construction of 36.04m
width made up of 3 – lane dual carriageways, an interchange at
Redemption Camp, 5no pedestrian bridges and maintenance of 10no.
existing bridges. Others are: construction of concrete pipe culverts and
drains, stone pitching and concrete median barriers etc.
The contract was awarded to Messrs Julius Berger Nigeria Plc in July
2013 at a cost of ₦70.8 billion with the completion date of July 2017. In
the 2016 budget, the sum of ₦40 billion was appropriated, out of which
₦10.6 billion was released and utilized as at the end of the fiscal year.
However, a total of ₦30.77 billion had so far been committed to the project
since inception to achieve 50.8% level of completion.
Findings:
At the time of monitoring, work done included: installation of pipe culverts
and catch pit, construction of trape zooidal drain, rectangular drain of
about 119.63m stretch, repair works, asphaltic base and macadam.

56
Others are: construction of 12.5km binder works with underlying crushed
rock sub-base and base material.
Socio-economic Impact:
Although the project is yet to be completed, it had facilitated the smooth
movement of vehicles and provided job opportunities for more than 600
skilled and unskilled labour. On completion, it will reduce travel time,
accident rate, and cost of vehicle maintenance as well as prolong the
road’s longevity.
Picture 11: The completion of Lagos – Ibadan Expressway, Section
1 (Lagos – Shagamu) Road
iii. Dualization of Obajana Junction to Benin Section iv, Ehor
–Benin Road This project involves the dualization of 16 km which was later revised to
cover 47 km from Benin City to Ehor in Edo State. The scope of work
includes: site clearance, scarification of the existing road, provision of
lateritic sub-base on the width and shoulders, laying of crush stone base,
binder and wearing courses, provision of concrete side drains, excavation
and demolition of an existing culvert and their reconstruction. Others
include: Laying of new underground concrete pipe culvert and two new
round abouts, provision of crash barrier and creation of U-turn at 4km with
2 pedestrian bridges.
The contract was awarded to Messrs Reynolds Construction Company
(Nig) Ltd. in December 2012, at an initial cost of ₦11.67 billion with the
completion period of 36 months. However, there was an upward review of
the contract cost by ₦23.57 billion in November 2014 bringing it to a total
of N35.25 billion with completion date scheduled for December 2018.
The sum of ₦3.28 billion was appropriated in the 2016 budget, out of
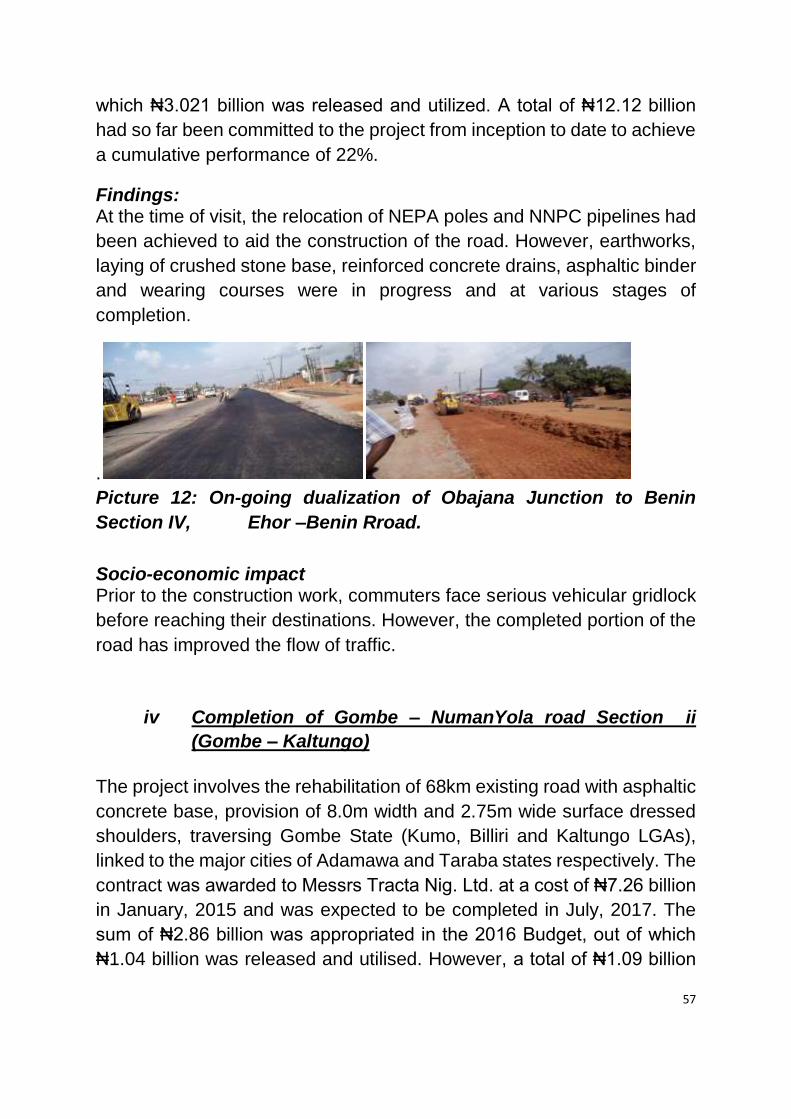
57
which ₦3.021 billion was released and utilized. A total of ₦12.12 billion
had so far been committed to the project from inception to date to achieve
a cumulative performance of 22%.
Findings: At the time of visit, the relocation of NEPA poles and NNPC pipelines had
been achieved to aid the construction of the road. However, earthworks,
laying of crushed stone base, reinforced concrete drains, asphaltic binder
and wearing courses were in progress and at various stages of
completion.
.
Picture 12: On-going dualization of Obajana Junction to Benin
Section IV, Ehor –Benin Rroad.
Socio-economic impact Prior to the construction work, commuters face serious vehicular gridlock
before reaching their destinations. However, the completed portion of the
road has improved the flow of traffic.
iv Completion of Gombe – NumanYola road Section ii
(Gombe – Kaltungo)
The project involves the rehabilitation of 68km existing road with asphaltic
concrete base, provision of 8.0m width and 2.75m wide surface dressed
shoulders, traversing Gombe State (Kumo, Billiri and Kaltungo LGAs),
linked to the major cities of Adamawa and Taraba states respectively. The
contract was awarded to Messrs Tracta Nig. Ltd. at a cost of ₦7.26 billion
in January, 2015 and was expected to be completed in July, 2017. The
sum of ₦2.86 billion was appropriated in the 2016 Budget, out of which
₦1.04 billion was released and utilised. However, a total of ₦1.09 billion

58
had so far been committed to the project since inception to achieve 28%
level of completion.
Findings: At the time of monitoring, work done includes: 23km binder and 19.5km
wearing course. Although, the construction works is still in progress, the
road has been opened for the use of commuters.
Picture 13: On-going Construction work of Gombe – Numan – Yola
road Section II,
Socio Economic Impact: The project has provided employment opportunities for over 350 skilled
and unskilled youths of the areas. It has also stimulated economic
activities at the road corridor.
v. Construction of Oshegbudu-Oweto Road in Benue State,
Contract No. 6265
The project entails the construction of a 54km road from Oshegbudu to
Oweto starting from Iga-Okpanya in Apato Oweto in Agatu Local
Government Areas of Benue State. The road is meant to provide an
important link between Loko-Oweto Bridge and Otukpo thus reducing
travel time from Nasarawa to Otukpo and Southern part of the country.
The contract for the project was awarded to Messrs CGC Nigeria Ltd. at
a cost of ₦7.96 billion in January 2015. It commenced in February 2015
with an initial completion date of February, 2016 but was later extended
to February, 2018 due to delay in release of mobilization advance to the
contractor for 16 months. In the 2016 Budget, the sum of ₦4.2 billion was
appropriated, out of which ₦1.54 billion was released and utilized to
achieve 42.13% level of completion.

59
Findings: At the time of monitoring, work done includes: construction of 15km binder
and 24km wearing course. Outstanding works included completion of
about 23km of the wearing course as well as 32km of the binder course
Picture 14: On-going construction of Oshegbudu-Oweto Road in
Benue State
Socio-economic Impact:
The project when completed would reduce travel time and rate of
accidents, open up new communities, increase the value of land and
properties along the road corridor and enhance free vehicular movements,
especially between the North and South-Eastern parts of Nigeria.
Challenges: The team was informed by the officials of the Federal Ministry of Power,
Works and Housing that inadequate budgetary provisions is delaying the
timely completion of the project.
vi Reconstruction of Sokoto-Tambuwal –Jega-Yauri -
Kotongora -Makera Section 2 (Phase 1 and Phase 2) In
Niger State. C/No6162/Code:162020970
The project entails the reconstruction of 185km single carriageway from
Sokoto-Tambuwal- Jega -Yauri –Kotongora and Makera (phase 1 covers
100km and phase 85km). The scope of work includes: site clearance,

60
scarification of failed bituminous asphaltic concrete surfaces, filling and
cutting on the carriageway and embankment, provision of 200m thick
laterite sub base and shoulder pulverization of failed asphaltic surface,
etc.
The contract was awarded to Messrs CRCC limited in April, 2013 at a cost
of ₦19.58billion with an initial completion date of April 2015 which was
later extended to April 2017. In the 2016 Budget, the sum of ₦1.66 billion
was appropriated, out of which ₦1.63 Billion was released and utilized as
at the end of Fiscal year. However, a total of ₦6.89 billion has so far been
committed to the project since inception to achieve 75% level of
completion.
Findings: At the time of visit, the palliative measures such as drainage/erosion
control, and 82km of asphalt concrete base have been completed while,
reinforcement of concrete lined drains and shoulder dressing were in
progress from km 10 – km 50. The team gathered that work at the site
stopped in 2014 due to non-payment of certified work and that the
contractor remobilised to site in July 2016.
Socio-economic Impact: Prior to the construction works, vehicle accidents and prolonged travel
time were frequently occurring in the road due to its dilapidated nature.
However, the rehabilitation of the failed portions of the road and their
partial works had so far facilitated free flow of traffic. In addition, though
the project is still in progress, it has generated employment for more than
two hundred people.

61
Picture 15: Completed portion and on-going works at
Reconstruction of Sokoto-Tambuwal-Jiga-Kontagora-Makera Road,
Section 11,Niger State.
4.5 HOUSING SECTOR
4.5.1 CONSTRUCTION OF FEDERAL SECRETARIAT COMPLEX,
AWKA, ANAMBRA STATE. The objective of this project is to address the perennial issue of
inadequate office accommodation and to provide an effective working
condition in the six (6) geo-political zones of the country for maximum
output of Federal employees. The project involves the construction of a 3
story reinforced concrete-framed structure of a total floor area of
14,639m2. Components of the project include: 402 offices, 132 toilets, 200
capacity parking spaces, a reception, banking exhibition, conference
halls, 4- no committee rooms and a post office.
The contract was awarded to Messrs Cosco Investment (Nig.) Ltd. at a
cost of ₦2.56 billion in December 2011 with a completion date scheduled
for April 2012. The date of completion was later extended to December
2017 due to structural re-design by the introduction of basement of a total
area of 1,989m2. The sum of ₦462.28 million was appropriated in the 2016
budget and same amount was released and utilised as at the end of the
fiscal year to achieve 65% level of completion.

62
Findings: At the time of the monitoring, the superstructure had been completed.
However, works in progress include: construction of the retaining walls,
tilling, fixing of doors and windows, flooring and casting of handrail. Others
are: fixing of suspended ceiling, rendering (internal & external), plumbing
piping, fixing of electrical cables, roofing trusses.
Picture 16: On-going Construction of Federal Secretariat Complex,
Awka, Anambra State.
Socio-economic Impact: The project had created employment opportunities for about 2000 skilled
and unskilled labour. It has also boosted economic activities in the host
communities from the subcontracting of reinforcement materials, supply
of timber, electrical, cement and plumbing items.
Challenges The major challenge to the early completion of the project was caused by
the introduction of the basement due to the sloppy topography and the
reorientation of the front view of the building which was not in the original
design. In addition, erosion, flooding and stoppage of work by indigenes
clamming ownership of land had also delayed the timely completion of the
contract.
4.5.2 CONSTRUCTION OF FEDERAL SECRETARIAT COMPLEX,
YANEGOA The project involves the construction of Federal Secretariat Complex,
which is to provide office accommodation for federal government agencies
located at OXBOX Lake central business district in Yenegoa.
The contract was awarded to Messrs Trenur Nig. Ltd. in March, 2012 at
the cost of ₦3.12 billion with an expected completion date of December,

63
2017. The sum of ₦451.92 million was appropriated in 2016 Budget, out
of which ₦330.93 million was released and utilized to achieve 68% level
of completion.
Findings: At the time of visit, the superstructure, pilling works and the roofing had
been completed. Works in progress include: plastering, water closets,
fixing of doors & window frames. However, electrical fittings are
outstanding.
Picture 17: Ongoing Construction of Federal Secretariat Complex,
Yenagoa, Bayelsa State
Socio-economic Impact: Although the project is yet to be completed, over 100 job opportunities had
been created for skilled and unskilled labour. On completion, it will provide
a conducive office accommodation for federal government agencies.
Challenges: The team was informed that heavy and incessant rainfall led to the
abandonment of the site during the 2012 National flood disaster. In
addition, non-release to the project in 2015 affected the timely completion
of work.
4.5.3 COMPLETION OF CONSTRUCTION OF ON-GOING FEDERAL
SECRETARIAT IN ZAMFARA STATE The project is located at Ungwar Danwan, along Sokoto bye pass at
Gusau with GPS coordinates of Longitude N6.657045 and Latitude
E12.199478. It entails the construction of a 3-storey building Secretariat
of 3 wings. Components of the project include 508 offices, Conference
room, Banking Hall, Post Office and conveniences. The key objective of
the project is to provide office accommodation for the Federal Civil
Servants for effective service delivery.

64
The contract was awarded in February 2012 to Sagato Nigeria Limited at
an initial sum of ₦2.53 billion with an expected completion period of 96
weeks. The contract sum was however reviewed to ₦2.69 billion due to
additional works. In 2016 Budget, the sum of ₦1.83 billion was
appropriated, of which same amount was released and utilized within the
period under review to achieve 72% level of completion.
Findings: At the time of physical inspection, two wings of the structure had been
roofed while the third was outstanding. External works and finishing like
plastering, installation of doors, windows, ceiling, plumbing works,
external drainages and roofing of wing A were on-going while, tiling and
painting were yet to commence.
Picture 18: Ongoing Construction of Federal Secretariat in Zamfara
State
Socio-economic Impact: The project has created jobs opportunities for the various classes of
workers engaged in the project and also to the food vendors providing
service to the workers. In addition, due to the project, the impact of the
Federal Government has also been felt in the area. On completion, it will
boost office accommodation for the Civil Servants in the area.
4.6 SCIENCE AND TECHNOLOGY SECTOR In the 2016 budget, a total of ₦27.01 billion was allocated to the sector to
execute its capital projects and programmes. Out of this amount, ₦15.99
billion was released while ₦14.54 billion (or 90.89%) was utilised as at
end of the fiscal year. The following projects were monitored:

65
4.6.1 NATIONAL SPACE RESEARCH AND DEVELOPMENT
AGENCY (NASRDA), ABUJA The Agency was allocated a total of ₦968.23 million in the 2016 budget
to execute its capital projects and programmes. Out of this amount,
₦777.75 million was released and utilised at the end of the fiscal year.
The following projects were monitored:
i. Supply and Installation of Electronic Dome, Camera,
etc.
The project involves the continuation of electrical works to power the
dome, supply of 292 auditorium chairs, external works/planets at the
Space Museum, Landscaping and horticultural works at the planet
planetarium building of the NARSDA headquarters in Abuja.
It was awarded to Messrs. Avieco Nig. Ltd. and three (3) others in August
2016 at the total cost of €3 million with an expected completion date of
December 2016. The sum of ₦142.18 million was appropriated in the
2016 budget out of which ₦80.19 million was released and utilized to
achieve 60% level of completion.
Findings: At the time of visit, the electronic panels/equipment and 292nos.
auditorium chairs had been supplied and ready for installation. In addition,
external/landscaping works at the space museum and planetarium
building have also been completed.
Picture 19: The electronic dome and completed portion of
lanscapping works at NARSDA, Abuja.

66
Socio-economic Impact: On completion, the installed facilities will provide a world class state-of-art
structure for comfortable seating arrangement for viewing astronomical
objects on projector screen. It will also aid the achievement of global
competitiveness in space research and development.
ii. Upgrade of Ground Receiving Station The project entails the upgrade of NASRDA Ground Receiving Station for
satellite control and image download. It involves supply and installation of
automatic prediction system for KEPS elements, 150KVA hybrid solar
power system to the Ground Station and Admin building. Others are: fibre
optic cabling, intranet/website development at NARSDA headquarters,
supply and installation of servers, high storage facilities to
information/data management department.
The contract was awarded to a consortium of contractors (Messrs. Blue
Band Engr. Nig. Ltd. & 4 others) in September 2016 at the total cost of
₦130.05 million and is expected to be completed in March 2018. In 2016
budget, the sum of ₦118.75 million was appropriated while ₦88.58 million
was released and utilised to achieve 75% level of completion.
Findings: At the time of this report, the fibre optic cabling, procurement of software
for the automatic prediction system and intranet/website development at
NARSDA headquarters had been completed and already in use. In
addition, batteries, panels and other accessories for the installation of
150KVA hybrid solar power system to the Ground Station and Admin
Building had been provided. However, the supply of inverter and
installation of the solar power system as well as servers/high storage
facilities to the information & data management department were
outstanding.

67
Picture 20: A section of the completed intranet/website development
at NASRDA Headquarters, Abuja
Socio-economic Impact: The completion of the project will facilitate uninterrupted power supply and
access to internet and other IT related services. It will also ensure
effectiveness in reception and transmission of information/data thereby
aiding reliability in data receiving and processing system at the Agency.
On the overall, staff performance and efficiency of service delivery will be
greatly enhanced.
4.6.2 FEDERAL INSTITUTE OF INDUSTRIAL RESEARCH, OSHODI The Institute was established to conduct and promote market - driven
research and development for the industrialization and socio-economic
development of the nation. To execute this mandate, the sum of ₦1.41
billion was appropriated in the 2016 Budget for its capital projects and
programmes. Of this amount, ₦1.069 billion was released while ₦1.068
billion was utilized to achieve 99.90% cumulative performance. The
following project was monitored:
i. Acquisition and Maintenance of Engineering Tools/ Purchase
and Supply of Molecular Laboratory, Laboratory Equipment,
Chemical, Glassware and Microbiological Media
The two related projects were designed to acquire engineering tools for
the fabrication of unit operation equipment for FIIRO developed

68
technologies, and provide various ranges of laboratory equipment and
consumables for research and development activities.
The contracts were awarded to Messrs. Nelag & Co. Ltd and three (3)
others at a total cost of ₦386.70 million in January 2016 with an expected
completion date of December 2016. In the 2016 Budget, the sum of
₦387.02 million (₦142.50 million, acquisition and maintenance of
engineering tools), and (₦244.52million, purchase and supply of
molecular laboratory, laboratory equipment, chemical, glassware and
microbiological media) were appropriated, out of which ₦386.70 million
was released and utilized to achieve 99.2% level of completion.
Findings: At the time of monitoring, components of work completed include:
acquisition of Lyophilizer for industrial enzymes, supply and installation of
agilent 710, UHPLC. Others were: water purification plant, digital fat
extractor; analytical balance; acquisition of laboratory consumables; 123
Nos. grades of chemicals, glassware & microbiological media, acquisition
of 1 No. 350KVA generator, etc.
Picture 21: Storage for uninstalled Equipment and 350KVA Sound-
proof Power Generating Set
Socio-economic Impacts: The project had bequeathed the Institute with pilot plant industrial
equipment, engineering/maintenance tools and argon welding and
plasma cutting machine. In addition, it has also provided a molecular
laboratory equipment, laboratory consumables, chemicals, glassware and
microbiological media.

69
4.6.3 NIGERIAN BUILDING AND ROAD RESEARCH INSTITUTE,
LAGOS The Institute is saddled with the responsibility of fostering cost-effective
building and road construction practice that will enhance job creation,
wealth generations and poverty reduction. In the 2016 Budget, a total of
₦3.45 billion was appropriated, out of which ₦2.02 billion was released
and cash backed, while ₦1.76 billion was utilized to achieve 86%
cumulative performance. The following project was monitored:
i. Construction of Administrative Complex, Abuja. The project entails the acquisition of a carcass building to accommodate
the Director General’s Office, a Library, ICT centre and the Finance and
Accounts units. The contract was awarded to Messrs Queuen kiddies
Shop at the cost of ₦525.3 million in January, 2016 and is expected to be
completed in December, 2017. In the 2016 budget, the sum of ₦307.6
million was appropriated, released and utilized to achieve 26% level of
completion.
Findings: At the time of monitoring, work in progress include:
renovation/reconstruction of the building, plastering, roofing and
scaffolding. The team was informed that the project would be completed
before July, 2017.
Socio-economic Impact: Although the project is yet to be completed, it has created more than 30
job opportunities for skilled and unskilled labour. On completion, it is
expected to improve office accommodation and boost staff morale.
4.6.4 CENTRE FOR SATELLITE TECHNOLOGY DEVELOPMENT (CSTD), ABUJA
The Centre was allocated a total of ₦465.83 million in the 2016 Budget for
the implementation of its capital projects/programmes. Of this amount,
₦443.82 million was released and utilized for the execution of the
following project:

70
i Completion of Space Technology Incubation Centre:
The project involves the provision of workshop, laboratories and offices
for the centre. The contract was executed through direct labour by
NASRDA/CSTD at a cost of ₦531.60 million in January 2016 with
completion date of December 2017. The sum of ₦376.77 million was
appropriated in 2016 Budget, out of which ₦337.81 million was released
and utilized to achieve 65% level of completion.
Findings:
At the time of monitoring, the team observed that major physical works
like internal & external rendering and the rafter had been completed while
fixing of windows and wiring were on-going.
Picture 22: On-going completion of Space Technology Incubation
Centre
Socio-economic Impact:
On completion, the project will improve the working environment, provide
spaces for workshop, laboratory and offices for the staff of the centre. In
addition, there will be room for the training of more Technicians, Scientist
and Engineers.
4.7 AGRICULTURE SECTOR The sector was allocated a total of ₦46.17 billion in the 2016 budget, out
of which ₦30.99 billion was released while ₦30.61 billion (or 98.77%) was
utilised as at end of the fiscal year. The following projects were monitored:

71
4.7.1 FEDERAL COLLEGE OF FISHERIES AND MARINE TECHNOLOGY, LAGOS
The College had an appropriation of ₦991.57million in the 2016 Budget
for the execution of its capital projects and programmes. Of this amount,
₦578.97 million was released, while ₦578.96 million was utilized to attain
100% cumulative performance. The following projects were monitored:
i. Construction of Hostel The project involves the construction of an additional hostel to
accommodate the growing population of students at the College located
at Victoria Island, Lagos. It comprises of 18 no rooms that can house 100
students.
The contract was awarded to Messrs Edil Nig. Ltd. at a cost of ₦99.80
million in December 2016 with an expected completion date of May 2019.
In the 2016 Budget, the sum of ₦99.37 million was appropriated, released
and utilized to achieve 100% level of completion.
Findings: At the time of visit, the project had been completed.
Socio-Economic Impact: The project had empowered local businesses and youths of the area. It
has also improved availability of students’ accommodation in the college.
ii. Provision of Library and Library Books & Equipment The project located at Victoria Island involves the procurement and
provision of library equipment and books for analogue and virtual versions
of library inputs. The contract was awarded to Messrs Dutum Com. Nig.
Ltd. at the cost of ₦143.44 million in September 2016 with an expected
completion date of December 2019. The sum of ₦43.59 million was
appropriated in the 2016 Budget, out of which ₦26.59 million was released
and utilized bringing the total commitment to ₦26.59 million to achieve
60% level of completion.
Findings: At the time of visit, the library equipment (shelves, computers, terminals,
cabling etc) had been procured and installed. Books had been supplied

72
and stacked on the shelves.
Socio-Economic Impact:
Although, the project is yet to be completed, it has enhanced academic
activities in the campus through digital bridging.
Picture 23: Provision of Library and Library Books & Equipment
4.7.1 AGRICULTURAL AND RURAL MANAGEMENT TRAINING
INSTITUTE (ARMTI), ILORIN
The sum of ₦646 million was appropriated for the Institute in the 2016
Budget to implement its capital projects/programmes. Of this amount,
₦175.29 million was released while ₦114.32 million was utilized as the
end of the fiscal year. The following projects were monitored:
i Completion of Water Reticulation and provision of Bore Hole
at ARMTI Headquarters and Abuja Centre.
The project involves the provision of portable water supply in the campus.
The contract was awarded to Messrs Radiance Express Line Ltd. at a cost
of ₦59.09 million in October, 2014 with completion date of December,
2016. The sum of ₦41.50 million was appropriated in the 2016 Budget,
out of which ₦32.32 million was released and utilized to achieve 80% level
of completion.
Findings: As at the time of this report, the Headquarter bore-hole had been sunk.
Socio-economic Impact: The project has ameliorated the problem of acute water shortage in the
centre and its environs.

73
ii. Training and Empowerment of Farmers, Women and Youth
Agro business and Marketing Management:
This project is designed to train Agriculture Graduates in the six (6)
geopolitical zones in order to provide consultancy and advisory services
to farmers in line with Government agenda.
The contract was executed directly by the Institute in October, 2016 at a
cost of ₦332.85 million with completion date scheduled for December,
2016. In 2016 budget, the sum of ₦332.85 million was appropriated, out
of which ₦100.79 million was released and utilized as at the end of the
fiscal year to achieve 68% level of completion.
Findings: As at the time of this report, 70 Agric Graduates have been trained to
provide consultancy and advisory services. Similarly, 40 extension agents
have also been trained on growing of sweet potatoes, 35 extension
managers were trained on Value Chain Development (VCD) and 350
farmers trained on marketing.
Socio-economic Impact: On completion, the project will create self-employment for the participants
and also encourage research into genetic improvement, development of
agronomic packages, storage and processing of products.
Picture 24: Completed borehole at ARMTI Ilorin

74
4.8 HEALTH SECTOR In the 2016 Budget, a total of ₦28.65 billion was allocated to this sector to
execute its capital projects and programmes. Out of this amount, ₦18.47
billion was released and ₦12.43 billion utilised as at the end of the fiscal
year. The following Institutions were monitored:
4.8.1 UNIVERSITY OF UYO TEACHING HOSPITAL The hospital was allocated the sum of ₦91.53 million in the 2016
appropriation for the execution of its projects. Out of this amount,
₦91.19`million was released and utilized to execute the following projects:
ii. Completion of the Construction of 2-storey General
Outpatient Block, Phase II The project involves the Construction of a two-Storey General Out-Patient
Building, Phase II comprising 30nos. Doctors’ consulting rooms, clinics, a
pharmacy and internal medicine store, offices for nurses and
conveniences, etc. It was awarded to Messrs Donarson Services Limited
in September, 2014 at a cost of ₦119.42 million with an expected
completion date of June, 2017.
In 2016 budget, the sum of ₦36.69 million was appropriated, released and
utilised. A total of ₦75.47 million had so far been committed to the project
since inception to achieve 60% level of completion.
Findings: At the time of visit, there was no activity at the site due to funding
constraints. However, block work and roofing, profile (aluminum windows
frames) and interior plastering had been completed. In addition,
interlocking materials were on ground for completion of the parking lots
and walkways. Outstanding works include: plumbing, fixing of doors and
windows, painting and landscaping.

75
Picture 25 : Ongoing Construction of 2-storey General Outpatient
Block, Phase II
Socio-economic Impact: On completion, the problem of congestion currently being experienced will
be grossly reduced as the project will provide a one-stop shop for out-
patients of the hospital with more consulting rooms and offices readily
available to meet the increasing number of patients for health care
delivery services.
4.8.2 FEDERAL MEDICAL CENTRE, OWERRI The medical centre had an appropriation of ₦83.48 million in the 2016
budget. Of this amount, ₦53.77 million was released, cash-backed and
utilized for the implementation of its capital projects/programmes. The
following project was monitored:
i. Upgrading of ward 10 to 2 storey building
The project involves the construction of a 2 storey building comprising: 8-
no main wards (11 beds each), 2-no private wards, 8no offices, 9-no
toilets and 3- no nursing wards. It also has a connecting ramp to the
Genetic / Surgery & Orthopaedic staircases. The contract was awarded to
Toniman Integrated Ltd. in December 2013 at a cost of ₦239.94 million
with completion date scheduled for December 2017.
The sum of ₦74.48 million was appropriated in the 2016 budget, of which
₦53.77 million was released and utilized as at the end of the fiscal year to
achieve 85% level of completion.
Findings: At the time of this report, the superstructure had been completed and
roofed. Work in progress includes: fixing of suspended ceilings, doors and

76
windows, tiling, plumbing & electrical works, and internal plastering.
Outstanding works include: floor finishing, electrical fittings and external
works.
Picture 26: On-going Upgrading of ward 10 to 2 storey building at
FMC Owerri
Socio-economic Impact: The project had created employment opportunities for Artisans and
Labourers in the host community. On completion, it will increase the
capacity for admission of patients into the hospital and improve the quality
of health care services.
8.0.3 UNIVERSITY COLLEGE HOSPITAL, IBADAN In the 2016 Budget, a total of ₦116.20 million was appropriated, out of
which ₦74.84 million was released and utilized as at the end of the fiscal
year. The following projects were monitored.
ii. Expansion of Accident and Emergency Complex The project entails the construction of a 4-storey building designed to
accommodate emergency cases in the hospital. The contract was
awarded to Julitad Nigeria Ltd. in November, 2016 at a cost of ₦92.53
million with completion period of sixteen (16) weeks. The sum of ₦56
million was appropriated in the 2016 Budget, out of which ₦52.09 million
was released and utilized to achieve 45% level of completion.
Findings At the time of monitoring, work in progress include: casting of hardcore

77
flooring (German floor), excavation of trench and columns, casting of
foundation strip and columns, earth filling and compaction.
Socio-economic Impact: The project had created employment opportunity for skilled and unskilled
labour in the immediate community. When completed, there will be
improved capacity to admit more patients with better consulting offices
and improved service delivery.
4.8.4 ABUBAKAR TAFAWA BALEWA UNIVERSITY TEACHING
HOSPITAL (ATBUTH), BAUCHI
The hospital was allocated the sum of ₦144.5 million in the 2016 budget
to implement its projects/programmes. Out of this amount, ₦72.2 million
was released, cash backed and utilized to achieve 65% cumulative
performance as at the end of the 2016 fiscal year. The following projects
were monitored:
i Expansion of Casualty wards Phase IIand
Rehabilitation Centre The project involves the construction of one-storey building comprising:
Male and Female Wards, Physiotherapy Units, Clinical offices, Stores,
and Library. Others are: Trauma centre, a Swimming Pool, Toilets
facilities and Reception area. The contract was awarded to Messrs Aswad
Investment Resources Nig. Ltd in November, 2013 at a cost of ₦157.9
million with an expected completion date of October 2017.
The sum of ₦60.5 million was appropriated in 2016 budget, out of which
₦47.6 million was released and utilized as at the end of the fiscal year. A
total of ₦93 million had so far been committed to the project since
inception to achieve 79% level of completion.
Finding:
At the time of visit, works completed include: super structure, electrical
piping, wiring and plastering while, roofing was on-going. Outstanding
works include: completion of external plastering, ramp, painting, hanging
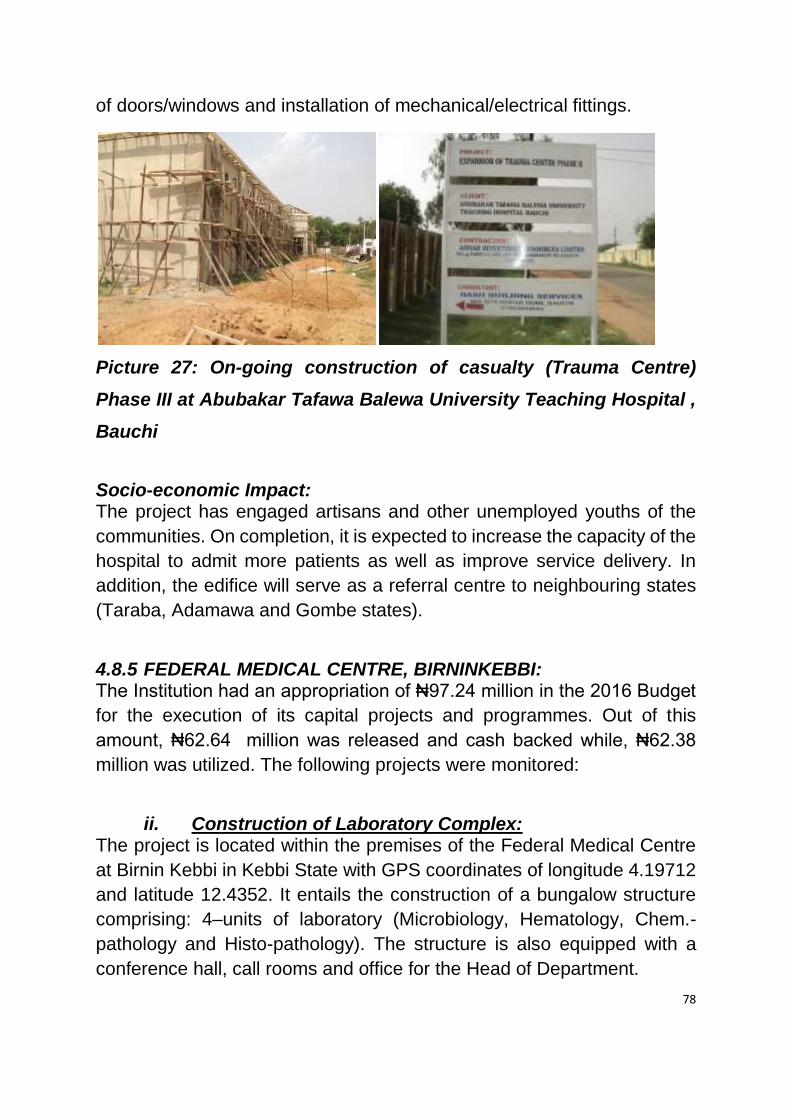
78
of doors/windows and installation of mechanical/electrical fittings.
Picture 27: On-going construction of casualty (Trauma Centre)
Phase III at Abubakar Tafawa Balewa University Teaching Hospital ,
Bauchi
Socio-economic Impact: The project has engaged artisans and other unemployed youths of the
communities. On completion, it is expected to increase the capacity of the
hospital to admit more patients as well as improve service delivery. In
addition, the edifice will serve as a referral centre to neighbouring states
(Taraba, Adamawa and Gombe states).
4.8.5 FEDERAL MEDICAL CENTRE, BIRNINKEBBI: The Institution had an appropriation of ₦97.24 million in the 2016 Budget
for the execution of its capital projects and programmes. Out of this
amount, ₦62.64 million was released and cash backed while, ₦62.38
million was utilized. The following projects were monitored:
ii. Construction of Laboratory Complex: The project is located within the premises of the Federal Medical Centre
at Birnin Kebbi in Kebbi State with GPS coordinates of longitude 4.19712
and latitude 12.4352. It entails the construction of a bungalow structure
comprising: 4–units of laboratory (Microbiology, Hematology, Chem.-
pathology and Histo-pathology). The structure is also equipped with a
conference hall, call rooms and office for the Head of Department.

79
The contract was awarded in January 2011 to Messrs. Swiss Biosat Nig.
Limited at a cost of ₦106.07million with an expected completion date of
December, 2011. Due to late releases of fund, the completion date was
reviewed and the project now has an expected date of completion
scheduled for September 2017. In 2016 Budget, the sum of ₦15.18
million was appropriated. Out of this amount, ₦15.18 million was released
and utilized to achieve 100% level of completion.
Findings:
At the time of visit, the project had been completed and already put to use.
Picture 28: The Completed Construction of Laboratory Complex at
Federal Medical Centre, Birnin Kebbi
Socio-economic Impact: The project had created employment opportunities to about 110 skilled
and unskilled workers engaged in the construction. It has also improved
the current office accommodation situation of the Medical Laboratory staff
thereby improving health service delivery.
Challenges: The project officials informed the team that funding constraint slowed
down the pace of the project.

80
4.9 TRANSPORTATION SECTOR The ministry is charged with the responsibility of formulating effective
policy co-ordination that will bring about an intermodal system that will
provide for affordable, easy and effective air, rail and water transport
system. To achieve this objective, the sector was allocated a total of
₦188.67 billion in the 2016 budget to execute its capital projects and
programmes. Out of this amount, ₦143.11billion was released while,
₦131.81billion (or 92.10%) was utilised as at end of the fiscal year. The
following projects were monitored:
4.9.1 CONSTRUCTION OF ABUJA (IDU)-KADUNA STANDARD
GAUGE RAILWAY TRACK The project is located at (IDU) along Abuja – Kaduna axis with GPS
coordinates of Longitude 7,350905 and Latitude 9,044082. The project
entails construction of 186km single standard gauge railway tracks from
Abuja (IDU) to Kaduna (Rigasa). It comprises: provision of 9nos rail
stations, 26nos railway bridges, 37nos overpass bridges, 222 nos box
culverts, earthwork and permanent ways. Other components of the project
include: IDU freight yard and ancillary building, Rigasa freight fence wall,
IDU locomotive deport, IDU cargo warehouse and platform wall and
Rigasa cargo warehouse.
The contract was awarded to Messrs CCECC Nig. Ltd. in October, 2009
at a cost of USD $849,750,903 ($500 million loan + $349.75 million +24.56
million). Actual works commenced in February, 2011. The contract sum
was later revised upward to USD $1.040 billion due to changes in the initial
design. The expected completion date was extended to December, 2017.
In 2016 Budget, the sum of ₦19.81billion was appropriated, released and
utilized.

81
Picture 29: Completed rail track and on-going construction of Idu
cargo freight yard and warehouse at Idu, rail station.
Findings: At the time of monitoring, component of work completed includes:
overpass bridges, culverts, box bridges, railway bridges, earthwork,
permanent ways and main station building. However construction of Idu
freight yard, ancillary building, full line defect rectification, 33kv
transmission line, fence wall, Idu locomotive deport, Idu cargo warehouse,
platform wall and Rigasa cargo warehouse were ongoing and at different
levels of completion.
Socio- economic impact Although the project is still ongoing, it has provided employment
opportunities for over 1200 skilled and unskilled labour. It has also
provided clinics to each camp thereby improving healthcare services to
the local communities. On completion, it is expected to boost economic
activities for people along the road corridor and the country at large.
4.9.2 THE CONSTRUCTION OF AKANU–IBIAM INTERNATIONAL
AIRPORT, ENUGU. The project involves the construction of a new terminal building at the
existing airport. The scope of work includes: provision of terminal hall,
offices, departure and arrival halls, canonical area, installation of central
chilling system (air condition), conveyer belts, escalators, lifts etc.

82
The contract was awarded to Messrs CCECC (Nig) Ltd. in March 2013 at
a cost of ₦14.24 billion with an initial completion date of December 2015.
This was however extended to December 2017 due to fund constraints.
The sum of ₦274.39 million was appropriated in the 2016 budget, of which
same amount was released and utilised as at the end of the 4th quarter. A
total of ₦5.66 billion had so far been committed to the project from
inception to date to achieve 44.81% level of completion.
Findings: At the time of monitoring, the team was informed by the Authorities of the
Airport that the contractor had demobilised from site. However, the
superstructure of the terminal building had been completed and roofed.
The outstanding works include: internal and external works, construction
of cargo terminal, mechanical work, provision of safety tank, sewage
system and installation of equipment.
Picture 30: On-going construction of new terminal building at
Akanu–Ibiam International Airport, Enugu
Social-economic Impact: The project had created employment opportunities for skilled and
unskilled labour in the host community. On completion, it will boost
economic activities and improve the movement of goods and services
both within and outside the country.
Challenges The major challenge affecting the timely completion of the project is fund

83
constraints. The supervisory Ministry should explore other sources of
intervention or go into PPP arrangement so as not to waste the colossal
amount already invested in the project.
4.9.3 THE UPGRADE AND REHABILITATION OF KADUNA
INTERNATIONAL AIRPORT: The project located in Kaduna State involves the reconstruction of the
terminal building of the Airport with GPS Coordinates of Longitude
45.10041 and Latitude 13.07019. The Scope of work includes: expansion
of the terminal, upgrading of the VIP lounge for departure and arrival
sections, construction of slippers (way to the Aircraft), provision of more
office spaces as well as the replacement of windows, tiles, ceiling, doors
and toilet facilities. The key objective of the project is to modernize the
airport facility and to enhance passenger comfort.
The contract was awarded in June, 2011 to Messrs DARI Investment
Limited at an initial cost of ₦684.28 million with an expected date of
completion of May, 2017. The contract cost was however reviewed
upward to ₦1.16 billion due to changes in the engineering design.
In 2016 Budget, the sum of ₦224 million was appropriated, released and
utilized as at the end of the fiscal year. A total of ₦908.28 million had so
far been committed to the projects since inception to achieve 82.8% level
of completion
Findings: At the time of monitoring, expansion of the terminal, upgrading of the VIP
lounge at the departure and arrival sections, replacement of windows,
tiles, ceiling, doors and toilets facilities had all been completed.
Outstanding works however include; construction of slippers and
partitioning of offices amongst others.
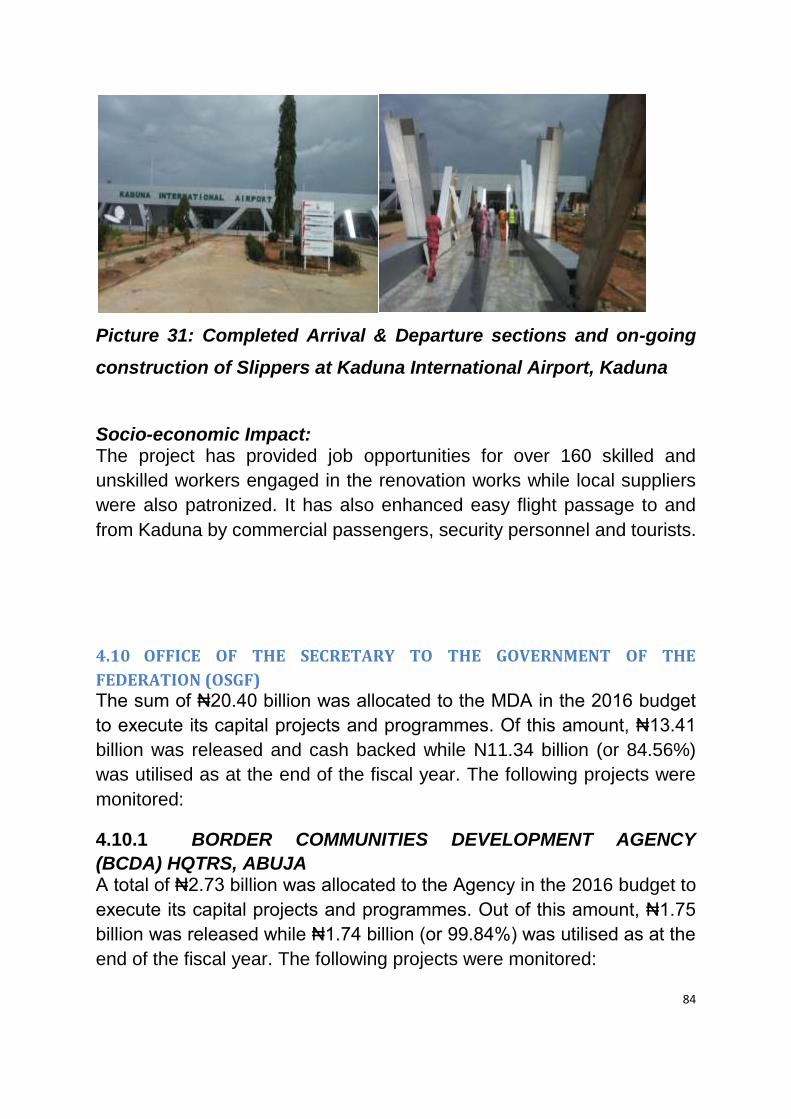
84
Picture 31: Completed Arrival & Departure sections and on-going
construction of Slippers at Kaduna International Airport, Kaduna
Socio-economic Impact: The project has provided job opportunities for over 160 skilled and
unskilled workers engaged in the renovation works while local suppliers
were also patronized. It has also enhanced easy flight passage to and
from Kaduna by commercial passengers, security personnel and tourists.
4.10 OFFICE OF THE SECRETARY TO THE GOVERNMENT OF THE
FEDERATION (OSGF) The sum of ₦20.40 billion was allocated to the MDA in the 2016 budget
to execute its capital projects and programmes. Of this amount, ₦13.41
billion was released and cash backed while N11.34 billion (or 84.56%)
was utilised as at the end of the fiscal year. The following projects were
monitored:
4.10.1 BORDER COMMUNITIES DEVELOPMENT AGENCY
(BCDA) HQTRS, ABUJA A total of ₦2.73 billion was allocated to the Agency in the 2016 budget to
execute its capital projects and programmes. Out of this amount, ₦1.75
billion was released while ₦1.74 billion (or 99.84%) was utilised as at the
end of the fiscal year. The following projects were monitored:

85
i Construction of 4-units of one-bedroom semi-detached
bungalow at Ekpiri-Ikang, Obutong camp- Bakassi, Cross
River State The project located in Ekpiri-Ikang, Obutong camp- Bakassi, Cross River
State, involves the construction of four units one-bedroom bungalow and
solar borehole tank with storage capacity of 5000 gallons to serve the
internally displaced persons affected by insurgency and border
demarcations. The objective of the project is to provide a conducive
accommodation for Bakassi returnees.
The contract was awarded to Messrs Moniet Development Company Ltd.
in September 2016 at a cost of ₦76.52 million with expected completion
date scheduled for December 2016. In the 2016 budget, the sum of
₦76.52 million was appropriated, while ₦68.26million was released and
utilised to achieve 100% completion.
At the time of visit, the project had been completed.
Picture 32: Completed 4-units of one bedroom semi-detached
bungalows at Ekpiri-Ikang, Obutong camp- Bakassi, Cross River
State.
Socio-economic impact The project had provided employment opportunity for the youths of the
area. On completion, the facility will also facilitate the resettlement of
internally displaced persons of the Bakassi communities.
ii. Construction Medical Health care with a bore hole at
Ekpiri-Ikang, Obutong camp- Bakassi, Cross River State The project involves the construction of a medical health care facility

86
comprising of offices for doctors and nurses, maternity, dispensary, male
and female wards of 7-beds capacity each, a store and five (5nos.) toilet
facilities.
The contract was awarded to Messrs. PS Rhozeta Nig. Ltd. in September
2016 at a cost of ₦33.44 million with an expected completion date of
December 2017. The sum of ₦33.44 million was appropriated in the 2016
budget, of which same amount was released and utilised to achieve 100%
level of completion.
Findings: At the time of visit, the project had been completed and ready for handing
over to Cross-River state government/community for effective utilisation.
Picture 33: Completed Medical Health Care at Ekpiri-Ikang, Obutong
camp- Bakassi, Cross River State
Socio-economic impact: The project had created temporary employment for the youths of the
community. When operational, the facility will serve as a centre for the
provision of affordable health care services for the returnees.
10.0.2 FEDERAL ROAD SAFETY COMMISSION (FRSC)
The commission had an allocation of ₦2.34 billion for the implementation
of its capital projects/programmes. Of this amount, ₦1.36 billion was
released and cash backed while ₦1.26 billion (or 92.07%) was utilised for
the execution of the following projects;

87
i Purchase of Residential Buildings This project involves the purchase of 1 block of 3 bedroom 6nos flats,
completion of Ilorin office, construction of classroom blocks, hostel and
medical centre at FRSC Academy. Others include: construction of a safety
tank, suck-away, inspection chambers and external plumbing for hostel
block at FRSC Academy, Udi, Enugu State. The contract was awarded to
Messrs CAT Construction (Nig.) Ltd. in September 2016 at a cost of ₦830
million with completion date scheduled for March 2017.
The sum of ₦830 million was appropriated in the 2016 budget, of which
₦181.30 million was released while ₦41.30 million was utilised as at the
end of the fiscal year to achieve 22.77% cumulative performance.
Finding: At the time of visit, the Residential building at Mabushi, Abuja had been
acquired, while the construction of classroom blocks hostel and medical
centre, external plumbing, suck-away, safety tank at FRSC Academy,
Enugu were on-going and at various levels of completion.
Picture 34: Purchased I Block of 3 Bedroom 6 flats at Mabushi,
Abuja.
Picture 35: Ongoing Construction of medical centre & hostel at FRSC
Academy, Enugu State

88
Socio-economic impact On completion, the project will provide a centre of excellence for the
training of corps marshals who will be responsible for the regulation,
enforcement and co-ordination of all road traffic and safety management
activities in the country.
ii Purchase of Motor Vehicles The project involves the purchase of operational vehicles and ancillary
equipment. It comprises: supply of 27 units of Peugeot 301 Access cars,
Double cabin pick up vans, and 6 units of Nissan Altima 25l cars. Others
include: supply and installation of security devices & painting works on the
new Nissan cars, supply of serviceable parts for patrol bike. 3,740 units of
FRSC branded raincoats etc.
The contract was awarded to a consortium of contractors viz: Messrs
Stallion NMN Ltd., Messrs PAN Nigeria Ltd., Messrs Innoson vehicle
manufacturing Co. Ltd. and others in September 2016 at a cost of ₦1.32
billion with completion date of March 2017. The sum of ₦981.025 million
was appropriated in the 2016 budget, of which ₦845.21 million was
released and utilised as at the end of fiscal year to achieve 97.97% level
of completion.
Findings: At the time of visit, the supply of 6 units of Nissan Altima 25L cars, 27 units
of Peugeot 301 access cars, Double cabin pick up vans, security devices&
other ancillary parts, painting and installation of security gadgets on the
newly acquired vehicles (all the vehicles and the ancillary parts) have
been procured and distributed to other FRSC outstations.
Socio – economic Impact: The project will enhance the regulation, enforcement and coordination of
all road traffic and safety management activities through sustained public
enlightenment, robust data management, prompt rescue services and
effective patrol operation.

89
4.11 DEFENCE SECTOR This sector is saddled with the responsibility of protecting lives and
properties of the citizenry as well as the territorial integrity of the nation.
To achieve this, a total of ₦130.66 billion was allocated to the sector in
the 2016 budget to execute its capital projects and programmes. Of this
amount, ₦97.25 billion was released and cash backed while, ₦93.29billion
(or 95.93%) was utilised as at the end of the fiscal year.
4.11.1 NIGERIAN ARMED FORCES RESETTLEMENT
CENTRE, LAGOS The centre had an allocation of ₦2.28 billion in the 2016 Budget. Of this
amount, ₦1.13 billion was released, cash-backed and utilized for the
implementation of its capital projects/programmes.
i Construction of 2 storey building for corporal below
quarters The project involves the construction of a 2 storey building, comprising 36
self-contained apartments for Corporals. The contract was awarded to
Messrs Joysolo and General Contractors Ltd. in October 2016 at a cost of
₦174.17 million with a planned completion date of October 2017. The sum
of ₦129.19million was appropriated in the 2016 Budget, of which same
amount was released, while ₦122.28 million was utilized to achieve 70%
level of completion.
Findings: At the time of inspection, work done includes: the super structure,
electrical piping, roofing, plastering, ceiling, fixing of doors and windows
frames, tiling, burglaries and water closets. Outstanding works include:
electrical fittings, painting and landscaping.
Socio-economic Impact: Although the project is yet to be completed, it has created employment
opportunities for skilled and unskilled labour. On completion, it will
ameliorate accommodation challenge for staff and enhance their
productivity.

90
ii Construction of Trainees Officers Mess The project was conceived to renovate and furnish Officers Mess,
Servicemen Club and Extension of Officers’ (SNCO) Mess. The contract
was awarded to Messrs Yeskantas Ltd. in partnership with the Centre in
November, 2016 at a total cost of ₦190.89 million with a planned
completion date of December, 2019. The sum of ₦766.20 million was
appropriated in the 2016 Budget, out of which, ₦257.45 million was
released and utilized to achieve 63% level of completion.
Findings: At the time of visit, work done includes: superstructure and roofing, while
flooring, interior plastering, electrical fittings/plumbing, fixing of
doors/windows etc were at various stages of completion.
Socio-economic Impact: Though the project is yet to be completed, it has generated employment
for fifty (50) skilled and unskilled residents of the area. Upon completion,
the project will provide relaxation and refreshing environment for trainees
and personnel officers during leisure hours.
11.0.2 DEFENCE SPACE AGENCY
The Defence Space Agency (DSA) was established in 2014 for the
purpose of harnessing Space resources in Support of the operations of
Armed Forces of Nigeria (AFN). The Agency was allocated a total of
₦1.68 billion in the 2016 budget for the implementation of its Capital
projects/Programmes. Out of this amount ₦1.32 billion was released while
₦1.31 billion was utilized as at the end of the fiscal year. The following
project was monitored:
i Construction/Provision of Office Building The Project which is located at Lugbe, AMAC, FCT involves the
construction of 3-storey building, Comprising of four (4) Laboratories,
Medical facilities a restaurant, Conference room, Control rooms and
offices. The Contract was awarded to Messrs Arch Expository Ltd. in July
2016 at a cost of ₦396 million with an expected completion date of

91
September 2017. In 2016 budget, the sum of ₦253.19million was
appropriated while ₦253.05 million was released and utilized to achieve
99.84% level of completion.
Finding: At the time of monitoring, work done includes: completion of Shell,
Flooring system, inner Panelling/installation of electrical, lightening,
signing, external works, Landscaping and provision of infrastructure.
Picture 36: On-going construction works of Defence Space Agency
Complex
Socio-Economic Impact: The project, though yet to be completed, has created more than 30 job
opportunities for both skilled and unskilled workers within the
communities. On completion, it will provide better accommodation,
Conducive learning atmosphere and will also enhance service delivery.
4.11.3 DEFENCE HEADQUARTERS, ABUJA The Defence Headquarters (DHQ) was appropriated a total of ₦3.65
billion to execute its capital projects and programmes in the 2016 budget.
Out of this amount, ₦1.72 billion was released and utilized to implement
its capital projects/programmes. The following project was monitored:
i. Renovation of Old Blocks for Men - 3 Blocks of 20 Flats,
7 Blocks of 36 Flats, 2Bedroon Flats: The project was designed to renovate blocks of flats at different locations
of Mogadishu Cantonment. The contract was awarded to Messrs
PavoPunda Nigeria Limited in March 2016 at a cost of ₦118.66 million
and was expected to have been completed by May, 2016. The sum of

92
₦115.07 million was appropriated in the 2016 budget of which same
amount was released and utilized on the project.
Findings: At the time of monitoring, the project had been completed.
Picture 37: The Newly Renovated Old Blocks for Men at Mogadishu
Cantonment, Abuja
Socio-economic Impact: The project had impacted positively on the occupants of the buildings as
the recurrent complaints received on the dilapidated state of the structure
had seized.
11.0.2.1 DEFENCE INDUSTRIES CORPORATION OF NIGERIA
(DICON):
The Agency had an appropriation of ₦3.88 billion in the 2016 Budget for
the execution of its capital projects and programmes of which ₦1. 71
billion was released and cash backed. The following project was
monitored:
i Construction of Primer Cap Production Line: The project is located at Kachia LGA of Kaduna State with GPS
coordinates of Longitute 7.954517 and Latitute 10.034993. The phase (I)
of the project entails the construction of primer cap production building
which consist of a 2-storey building and workshop with three (3)
components viz; primer load, mixing and explosive. Others include: 2nos
borehole, security post, security perimeter fence (Inner and Outer wall),

93
stores, offices and a laboratory. The key objective of the project is to meet
the demand for the 7.62mm X 39mm special ammunition which has
increased over the years due to the adoption of AK47 rifle as the preferred
weapon for personnel of the Armed Forces and some other security
agencies.
The contract was awarded to Messrs Poly Technologies Incorporated
(PTI) of China and Defence Integrated Resources Limited (DIRL) of
Nigeria in November 2016 at a total cost of ₦1.020 billion with an expected
date of completion of December 2017.
In the 2016 budget, the sum of ₦1.020 billion was appropriated while
₦750 million was released, cashed backed and utilized as at the end of
the fiscal year to achieve 40% level of completion.
Findings: At the time of monitoring, site clearance, first foundation of concrete wall
and columns for the primer cap load, mixer and explosive, 1km perimeter
fence (Inner and Outer Fence) had been completed. Outstanding works
include: Super structure for the project, concrete wall re-enforcement,
Security post, workshop and laboratories.
Picture 38: On-going DICON project of construction of Primer Cap
Production Line at Kachia, Kaduna State
Socio-economic Impact: Although, the project is still ongoing, it has created employment
opportunities for 220 skilled and unskilled youths of the area. When

94
completed, the factory is expected to provide the major raw materials
(primer caps) for the manufacture of 7.62X39mm ammunition used by
AK47 rifles.
Challenges: The team was informed by the management of DICON that budgetary
funding constraints affected the speed of work. In addition, the re-location
from the initial site at Kakuri within Kaduna metropolis to the outskirts of
the town due to safety reasons was also cited as a challenge.
4.12 ENVIRONMENT SECTOR In the 2016 budget, a total of ₦4.96 billion was allocated to the sector to
implement its capital projects and programmes. Out of this amount, ₦4.27
billion was released while ₦3.84 billion was utilised as at the end of the
fiscal year. The following projects were monitored:
4.12.1 COMPLETION OF EROSION CONTROL WORKS AT
MBIA BONG AND IKPEEKETNKOM, AKWA-IBOM STATE This project located at Mbiabong and Ikpe Eket Nkom in Akwa-Ibom state,
entails the construction of erosion and flood control structures, 4km drain
and culverts of a failed road of up to 15m deep valley to protect property
and restore degraded land. The contract was awarded to Messrs. Buan
Project Limited in September 2014 at a cost of ₦78 million and was
expected to be completed by December 2016. In the 2016 budget, the
sum of ₦56 million was appropriated while ₦49.21 million was released
and utilised to achieve 87% cumulative performance.
Findings: At the time of visit, the project was completed and already in use.
However, the team observed the need for surface dressing of the road
shoulder and screeding of the water channel portions to avoid collapse of
the completed works.

95
Picture 39: Completed Erosion Control works at Mbia Bong and
IkpeEketNkom, Akwa- Ibom State
Socio-economic Impact: The completion of the contract had eased movement, reduced accident
as well as protected property and restored land value in the area.
4.12.2 EROSION CONTROL WORKS IN IREPODUN-
OLORUNDA-OSOGBO-OROLU-OSUN STATE
The project entails the construction of erosion and flood control structures
to protect lives and properties, and restore degraded lands in Osogbo
town.
The contract was awarded to La-Source De Classique Nig. Ltd. at a cost
of ₦75 million in October 2016 with completion date of December 2016.
The sum of ₦49.36 million was appropriated in the 2016 Budget, out of
which ₦45.04 million was released and utilized to achieve 100% level of
completion.
Findings: At the time of monitoring, the project had been completed.
Socio-economic Impacts: The project had empowered local businesses and youths of the area,
while its successful completion had solved the menace of perennial
flooding of roads and household and also improved the community
relationship.

96
Picture 40: Completed drains and box culverts at Irepodun,
Olorunda, Osogbo, Orolu, Osun State
4.12.3 COMBATING DESERTIFICATION THROUGH
REFORESTATION FOR CLIMATE CHANGE MITIGATION AND
SUSTAINABLE LAND MANAGEMENT IN THE SHELTERBELT, GADA
LGA, SOKOTO.
The project is located at Marin Buzu, Gada Local Government Area,
Sokoto State with GPS coordinates of Latitude N15.10783 and Longitude
E 0.775996. It entails the planting of 2400 tree seedlings on 2 hectares of
acquired land, perimeter fencing on the property surrounded with wire-
gusts, installation of solar powered borehole, overhead water tank and
water reticulation for watering the seedlings to maturity. Other
components includes: provision of water trough for animals, distribution of
seedlings to the community for planting to increase vegetation cover and
rehabilitation of degraded land.
The contract was awarded to Messrs Murenco Nigeria Limited in
December 2016 at the cost of ₦105.034 million with an expected
completion date of April 2017. In 2016 Budget, the sum of ₦105.034
million was appropriated, out of which ₦91.59 million was released and
utilized within the period under review to achieve 100% level of
completion.
Findings: The team observed that the project covered only 2 hectares of land out of
the vast land encroached by desertification. Although the contractor,
project supervisor and few members of the beneficiary community were
present during the monitoring, the team also noted that there was no
sustenance plan for the project. There is also need for adequate security

97
to protect the bore-hole infrastructure provided by government.
Picture 41: The Ongoing 2400 trees plantation for Desertification
through Reforestation for Climate Change at Gada LGA, Sokoto.
Socio- Economic Impact: The project had generated 17 temporary jobs to the indigenes. The water
from the borehole component of the project also serves the community.
Challenges: The team observed that there was neither security house nor trained
security personnel to guard the project.
4.13 EDUCATION SECTOR Education is key to manpower development in the country. In its drive to
achieve this objective, government allocated a total of ₦35.99 billion to
the sector to execute its capital projects and programmes. Of this amount,
₦22.65 billion was released and fully cash backed while ₦18.61billion was
utilised at the end of the fiscal year. The following projects were visited:
4.13.1 UNIVERSITY OF PORTHARCOURT In the 2016 budget, the sum of ₦43.69 million was allocated, released and
utilised to execute its capital projects and programmes. The following
projects were monitored.

98
i Construction of Pharmacy Lecture Complex The project involves the construction of a 2-storey building for the Faculty
of Pharmacy comprising seventeen (17) classrooms with sitting capacity
ranging between 120-150, offices, a 1500-capacity main lecture theatre,
conveniences, etc.
It was awarded to Messrs. Mek Builders Ltd. in June 2012 at a cost of
₦353.08 million and is expected to be completed in May 2017. In the 2016
budget, a sum of ₦18.69 million was appropriated, released and utilised.
A total of ₦286.73 million had so far been committed to the project since
inception to achieve 85% level of completion.
Findings: At the time of visit, the superstructure and roofing had been completed.
Outstanding works include: completion of toilets, sanitary walls and tilling
of the ground floor.
Picture 42 : Ongoing Construction of Pharmacy Lecture Complex at
UniPort.
Socio- Economic Impact: The project when completed will reduce congestion on the existing
facilities as well as increase students’ intake in the Faculty.
4.13.2 ALVAN IKOKU COLLEGE OF EDUCATION, OWERRI The institution had an appropriation of ₦59.18 million in the 2016 budget.
Of this amount, ₦29.59 million was released, cash-backed and utilized for
the implementation of its capital projects/programmes. The following
project was monitored.

99
i Construction of 2 Storey (Senate) Building. The project involves the construction of a 2 storey office building
comprising: provost, deputy provost, Registrars, Board Chairman, Board
Room, Bursary, Budget and Cash offices. It was designed to create more
office space and ensure conducive working environment for optimum
performance.
The contract was awarded to Messrs Onsite Construction Company Ltd.
in January 2012 at a cost of ₦205 million with completion date scheduled
for January 2015. However, this was not achieved because of paucity of
funds.
The sum ₦59.18 million was appropriated in the 2016 budget, of which
₦29.59 million was released and utilized. A total of ₦168.24 million had
so far been committed to the project from inception to date to achieve 85%
level of completion.
Findings: At the time of monitoring, the superstructure had been completed, roofed
and plastered. Work in progress includes: external block walling,
plastering, fixing of PVC ceiling, tiling of the floor, Terrazzo and fixing of
handrails. Outstanding works were electrical & mechanical plumbing,
painting and decorations.
Picture 43: On-going Construction of 2 Storey (Senate) Building at
FCE, Owerri.

100
Socio-economic Impact: The project had created employment opportunities for about forty (40)
skilled and unskilled labourers. On completion, it will moderate the
challenge of office accommodation and enhance the productivity of staff.
Challenges: The major challenge affecting the timely completion of the project is fund
constraints. The team was informed that though the project is at the
finishing stages, the Contractor had applied for variation because of
fluctuation in the price of building materials in the market due to time lag.
4.13.3 UNIVERSITY OF LAGOS The university had an appropriation of ₦43.69 million in the 2016 Budget,
of which same amount was released and utilised for the implementation
of its capital projects and programmes. The following project was
monitored:
i Rehabilitation of Main Auditorium Roof The project entails the rehabilitation of the main university Auditorium. The
contract was awarded to Messrs FBG Nig. Ltd. at a cost of ₦81.54 million
in July 2014 with an expected completion date of September 2015. This
was however not achieved due to funding constraints. The sum of ₦43.69
million was appropriated in the 2016 Budget, of which same amount
released while, ₦15.80 million was utilized as at the end of the fiscal year.
A total of ₦81.54 million had so far been committed to the project since
inception to achieve 100% level of completion.
Findings: At the time of visit, the dilapidated roof of the Main Auditorium building had
been removed and replaced with long span aluminium sheet.
Socio-economic Impact: The project had empowered local businesses and youths of the
community. It has also provided a conducive atmosphere for learning and
enhanced the security of the environment.

101
Picture 44: Rehabilitated Auditorium building at University of
Lagos
4.13.4 USMANU DAN FODIO UNIVERSITY, SOKOTO The Institution had an appropriation of ₦43.69 million in the 2016 Budget,
of which same amount was released and utilized for the implementation
of its capital projects/programmes. The following project was monitored:
i Completion of Civil Engineering Complex The project entails the construction of a storey building comprising: 4 nos
Laboratories, 2 nos Drawing Studios, 5 nos Classrooms, 1no Department
Library, 14 nos offices and conveniences.
The contract was awarded to Messrs Prodebes Nigeria Limited in 2006 at
a cost of ₦277.45 million with an expected completion date of December
2017. The sum of ₦43.69million was appropriated in the 2016 budget, of
which same amount was released and utilized in the period under review.
A total of ₦134.094 million had so far been committed to the project since
inception to achieve 80 % level of completion.
Findings: At the time of monitoring, completed works includes: superstructure,
plumbing, electrical fittings, plastering and railings. While outstanding
works include: painting, doors, windows and electrical works.

102
Picture 45: On-going construction of Faculty of Civil Engineering
complex at Usman Danfodio University, Sokoto
Socio-Economic Impact: The project had created employment opportunities for all classes of
workers engaged in the construction work. On completion, it will provide
office accommodation for the Department of Civil Engineering and
enhance teaching, learning and research works in the Institution.
Challenges: The major challenge was the encroachment on the University land by the
surrounding villages. Besides, the team was informed that increase in the
cost of building materials and paucity of funds is affecting the timely
completion of the project.
4.14 NIGER DELTA AFFAIRS This MDA was allocated a total of ₦19.44 billion in the 2016 budget for
the implementation of its capital projects/programmes. Out of this amount,
₦11.16 billion was released and ₦10.31 billion utilised (or 92.39%) as at
end of the fiscal year. The following projects were monitored:
4.14.1 DUALIZATIONOF EAST-WEST ROAD SECTION 1:
WARRI-KAIAMA CONTRACT NO. 5867. The Project involves the provision of a new 87km asphaltic concrete

103
carriageway and the rehabilitation/reconstruction of the existing road from
Warri in Delta State to Kaiama in Bayelsa State. The scope of works
includes: sand filling, cement stabilisation, 250mm sub- base & crushed
stone base, 60mm asphaltic concrete binder and 40mm wearing courses
respectively. Others include: construction of new bridges, box and pipes
culverts across various rivers, streams and canals, adding of inner
shoulder of 250mm sub-base and crushed stone, relocation of petroleum
and gas pipe lines installation, etc.
The contract was awarded to Messrs Setraco Nig. Ltd. in August 2006 at
a cost of ₦120.89 billion with an initial completion date of July 2015 which
was later extended to December 2016 because of paucity of funds. The
sum of ₦1.20 billion was appropriated in the 2016 budget, out of which
₦400 million was released and utilized. A total of ₦118.86 billion had so
far been committed to the project since inception to achieve 100%
cumulative performance.
Findings At the time of monitoring, the project had been completed, commissioned
and handed over to the Supervisory Ministry.
Picture 46: Completed dualisation of East-West Road, Section I
Socio-economic Impact: The project had created employment opportunities for over 1500 skilled
and unskilled workers. It has also assisted in training the indigenes in iron
bending and welding works. In addition, it has boosted economic activities
along the road corridor particularly in the transportation of petroleum
products, oil exploration and industrial activities

104
4.14.2 DUALIZATION OF EAST WEST ROAD SECTION II The project involves the construction of 101.6km, 2-lane dual carriageway
road from Kaiama in Bayelsa State and passes through Ahoada and
endsin Port-Harcourt (Eleme Junction) Rivers State. The contract was
initially awarded in August, 2006 to Messrs Julius Berger (Nig.) PLC but
was later terminated out of convenience some months after
commencement. However, it was subsequently re-awarded in May 2009
to Messrs Setraco Nigeria Limited in two sub-sections namely:
4.14.3 DUALISATION OF EAST WEST ROAD: SECTION II
(SUB-SECTION I) CONTRACT NO. ID/09/003 The project starts from Eleme junction (Portharcourt) and ends in Ahoada
in Rivers State. The scope of works include: bush clearing, removal of
unsuitable top soil, importation of new fill materials, expansion of the
existing 47km length of road into a standard dual 2-lane with asphaltic
concrete surfacing, sub-base, 60mm asphaltic concrete binder and 40mm
asphaltic wearing courses. Others are: construction of a new bridge over
Choba River, concrete lined drains, concrete median barrier, box pipe
culverts, median drain and roadway furniture on the road alignment.
The contract was awarded to Messrs Setraco Nigeria Limited in May 2009
at an original cost of ₦29.92 billion but was later revised to ₦55.07 billion
with an expected completion date of October2016. The upward review of
the contract sum was due to changes in the engineering design. However,
the Contractor has applied for a new completion date which is still being
processed.
The sum of ₦3.13 billion was appropriated in the 2016 Budget, out of
which ₦2.75 billion was released and utilized. A total of ₦41.56 billion had
so far been committed to the project since inception to achieve 78.33%
level of performance.
Findings: At the time of monitoring, payment of compensation for farmlands and
construction of 133nos culverts had been completed. However, works on
the new Choba bridge, Site clearing, earthworks, construction of culverts
and drains, and cement stabilisation at Ogbakiri Junction in Emuohua

105
were in progress and at different levels of completion.
4.14.4 DUALIZATION OF EAST WEST ROAD SECTION II SUB-
SECTION II (AHOADA– KAIAMA) RIVERS STATES, CONTRACT
NO. ID/09/002: The project involves the expansion of the existing 54.50km length of road
into a standard dual 2-lane with asphaltic concrete surfacing. It also
comprises: construction of 11nos. bridges, 420nos. culverts, etc.
The contract was awarded to Messrs Setraco Nigeria Limited in June
2009 at an initial cost of ₦44.88 billion but was later revised to ₦93.41
billion with an expected completion date of March, 2017. In the 2016
budget, the sum of ₦3.65 billion was appropriated while ₦2.60 billion was
released and utilized. A total of ₦61.35 billion had so far been committed
to the project since inception to achieve 69.51% cumulative performance.
Findings: At the time of the visit, completed works include: 10nos. Bridges, 400nos.
culverts, 90km works on Portharcourt and Kaiama bound while
construction of parapets, concrete and pedestrians walkways at Kaiama
bridge were in progress.
Picture 47: Concrete works/a bridge segment being conveyed at
Kaiama Bridge
Socio-economic Impact:
The completed portion of the road has facilitated increase in vehicular
movement. On completion, it will promote rapid integrated infrastructural
development and enhance economic activities in the Niger Delta region.

106
4.15 FEDERAL MINISTRY OF MINES & STEEL The Ministry was allocated a total of ₦7.33 billion in the 2016 budget for
the implementation of its capital projects/programmes. Of this amount,
₦4.53 billion was released and cash-backed while, ₦4.18 billion (or
92.26%) was utilised as at the end of the fiscal year.
4.15.1 METALLURGICAL TRAINING INSTITUTE ONITSHA The institute had an allocation of ₦230.18 million in the 2016 budget. Of
this amount, ₦217.71 million was released and cash-backed while,
₦208.6 million (or 95.82%) was utilised for the implementation of its
capital projects/programmes. The following projects were monitored:
i Refurbishing & Repairs of Training Equipment/Machines The project involves the reconstruction of 40 no of workshops benches,
repairs and refurbishing of machines and equipment, electrical,
instrumentation and control system, mechanical maintenance, wielding
and fabrication. Others include: industrial metallurgy & foundry, heavy
mobile & steel fabrication and wielding departments.
The contract was awarded to Messrs Vuco Consults Limited in August
2016 at a cost of ₦51.24 million and was to be completed by December
2016. The sum of ₦40.99 million was appropriated in the 2016 budget, of
which ₦38.06 million was released and utilised to achieve 74% level of
completion.
Findings: At the time of monitoring, all the spare parts needed to be sourced outside
the country have been procured while the repairs were in progress.
However, the contractor had applied for variation of the contract price
because of the fluctuation in foreign exchange to facilitate the timely
completion of work.

107
Picture 48: Refurbished & Repaired Training Equipment/Machines
at Metallurgical Training Institute Onitsha
ii Flood and Erosion Control The project involves the construction of reinforced concrete drain and
reinforced concrete rectangular box culvert. The scope of works include:
site clearance, excavation of drainage trench, casting of concrete blinding
layer, reinforcement bar, bending & fitting, form work erection and
structural concrete work.
The contract was awarded to Messrs Cejtech Projects limited in August
2016 at a cost of ₦78.37 million with completion date scheduled for
December 2017. The sum of ₦57.23 million was appropriated in the 2016
budget, of which ₦49.84 million was released and utilised to achieve 50%
level of completion.
Findings: At the time of this report, excavation of drainage trench had been
completed while casting of the concrete blinding layer, reinforcement bar
bending & fitting, form work excavation and structural concrete bar were
in progress.
Picture 49: On-going Flood and Erosion Control at Metallurgical
Training Institute, Onitsha.

108
Socio-economic Impact: The Project has improved facilities for the training of youths in low and
middle level technical skills in metal and allied products.
Challenges: Most of the projects are facing variation because of fluctuation in the price
of goods in the market.
4.16 PRESIDENCY The Presidency had an allocation of ₦28.39 billion in the 2016 budget for
the implementation of its capital projects/programmes. Of this amount,
₦27.94 billion was released and cash backed while, ₦22.2 billion (or
79.45%) was utilised for the execution of its project as at the end of the
fiscal year. The following project was monitored:
4.16.1 NATIONAL EMERGENCY MANAGEMENT AGENCY
(NEMA) The office had an allocation of ₦834.47 million for capital projects and
programmes in the 2016 Budget. Of this amount, ₦507.56 million plus
₦3.75 billion Authority to Incur Expenditure (AIE) was released and cash
backed while, ₦3.39 billion (or 90.24%) was utilised for the execution of
the project as at the end the fiscal year. The following project were
monitored:
4.16.1.1 CONSTRUCTION OF SOUTH EAST ZONAL OFFICE
FOR NATIONAL EMERGENCY MANAGEMENT AGENCY The project located at Independence Layout of Enugu city involves the
construction of a 2 storey building with a roof of total build up area of
687.68m2. The scope of works include: the provision of 23- no. offices, 26-
no toilets, 17- no external doors, 3- no conference rooms, a switch room,
canteen, kitchen, internal and external staircases and a lift.
The contract was awarded to Messrs Pitch Global services Ltd in
November 2013 at a cost of ₦267.8 million with completion date
scheduled for December 2017.The sum of ₦91.48 million was
appropriated in the 2016 budget, of which same amount was released

109
while, ₦21.58 million was utilised as at 4th quarter. A total of ₦223 million
had so far been committed to the project since inception to achieve 70%
level of completion.
Findings: At the time of monitoring, the superstructure had been completed, roofed
and plastered. Components of works in progress include: electrical,
telephone & data cabling, CCTV conduit piping, steel roof
structure/roofing sheet, and mechanical piping and installation. Others
are: construction of retaining wall, partitioning, fixing of doors and tiling.
Picture 50: Ongoing construction of South East Zonal office for
NEMA, Enugu
Socio-economic Impact: The project had created employment opportunities for about 78 skilled and
unskilled labour in the host community. On completion, it will reposition
the staff to co-ordinate and manage man-made and natural disaster in
Enugu and its environs.
Challenges: The contractor’s representative informed the monitoring team that inflation
rate in the country had affected the price of materials and cost of labour
thereby making the cost of construction higher than what was originally
estimated. This had delayed the timely completion of the project.

110
4.16.1.2 THE CONSTRUCTION OF AGENCY’S NORTH WEST
ZONAL OFFICE, KADUNA: The project located along Kaduna International Airport road involves the
construction of a 2-Storey building. It comprises: a generator house,
perimeter fence, security room, electrical powering and staff quarters. The
contract was awarded in January, 2014 to Messrs Star Plaza Limited at
an initial cost of ₦293.17 million which was later revised to N336.49 million
with date of completion of June 2017.
The sum of ₦20.097 million was appropriated in the 2016 Budget, out of
which same amount was released and utilized. A total of ₦330.63 million
had so far been committed to the project since inception to achieve 95%
level of completion.
Findings: At the time of monitoring, the super- structure (Ground floor),
Superstructure has been completed, roofed and plastered. Outstanding
works include: Construction of Generator house, electrical powering,
perimeter fencing, helipad hanger, storage facility, external
works/landscaping and staff quarters.
Picture 51: On-going Construction of NEMA North West Zonal Office,
Kaduna
Socio-economic Impact: Though, the project is still yet to be completed, it has provided
employment opportunities for over 120 skilled and unskilled labourers.

111
When completed, it is expected to bring disaster management closer to
the grass root and improve the performance of NEMA staff.
4.16.1.3 NATIONAL INSTITUTE FOR POLICY AND
STRATEGIC STUDIES, KURU The Institute had an appropriation of ₦600 million in 2016 Budget. Of this
amount, ₦388.15 million was released and utilized as at the end of the
fiscal year for the implementation its capital projects/programmes. The
following projects were monitored:
i Renovation 9 Blocks of Senior Research Fellows Chalets: The project involves the renovation of 9nos 4-Bedroom flats for senior
staff of the Institute. The contract was awarded to Messrs Wall Tall
Integrated Series Ltd., Messrs Techno- Kat Const. Ltd, Messrs D-Kolus
Nigeria Limited, et al, at a total cost of ₦61.41 million in October 2016 with
a completion date of January 2017. The sum of ₦61.64 million was
appropriated in the 2016 budget, of which same was released while
₦61.41 million was utilized to complete the project.
Findings: At the time of monitoring, the project had been completed and put to use.
Picture 52: Completed Renovation Work of One of the 9 Blocks of Senior Research Fellows Chalets in NIPSS, Jos
Socio – economic Impact: The renovation works had given a face lift to the Institute, reduced the
series of complaints lodged by staff on account of dilapidated houses and

112
roof leakages.
ii Renovation of 14Nos Participants Chalets: The project was embarked upon to provide a conducive and habitable
learning environment for the participants of the Senior Executive Course
(SEC) program. The renovation works entails: rehabilitation of 14nos
semi-detached one-bedroom flats.
The contract was awarded to Messrs Vinna Technology Ltd & Messrs
Phil–On–Brown and KEE Items Ltd. at a total cost of ₦72.01 million in
October 2016 with completion date of January 2017. The sum of ₦72.71
million was appropriated in the 2016 budget, out of which same amount
was released while ₦72.01 million was utilized to complete the project.
Findings: At the time of monitoring, the project has been completed.
Picture 53: Completed Renovation Works of a Section of the 12Nos
Participants Chalets in NIPSS, Jos.
Socio – economic Impact: The renovation works had given a face lift to the Institute. The number of
complaint by participants of dilapidation of the chalets had reduced. The
participants now have a better atmosphere to concentrate on their studies.

113
4.17 FEDERAL CAPITAL TERRITORY ADMINISTRATION The Ministry had an allocation of ₦29.29 billion in the 2016 Budget for the
implementation of its capital projects/programme. Of this amount, ₦15
billion was released and cash backed while, ₦9.79 billion (or 65.24%) was
utilized as at the end of the fiscal year. The following project was
monitored:
17.0.1 ABUJA RAIL MASS TRANSIT (LOTS 1 & 3)
The project involves the construction of a 45.245km standard gauge
railway tracks and associated permanent way within the FCT with
designated station buildings, bridges, culverts, communication and
signalling equipment. The contract was awarded to Messrs CCECC (Nig.)
Ltd. at a cost of US$823.54 in May 2007 while actual work commenced in
May 2009 with initial completion date scheduled for May 2013. This was
not achieved due to time lag and fund constraints.
The sum of ₦5.6 billion (National/Budget) and ₦11 billion (FCT Statutory
Budget) were appropriated in 2016, of which ₦12.54 billion ₦11 billion
(FCT Statutory) & ₦1.54 billion (National Budget) were released. The
funds utilised include ₦15.11 billion China Exim Bank & ₦12.54 billion
(FCT & National Budget) as at 4th quarter 2016. However, a total of ₦44.12
billion (FCT Statutory & National Budget) and ₦64.42 billion (China Exim
Bank loan) had so far been committed to the project from inception to date
to achieve 91% level of completion.
Findings: At the time of inspection, works completed include; Construction of
45.245km length of rail tracks, 10 railway stations, 50- no. culverts, 13- no
railway bridges, 9- no pedestrian overpasses and 15- no flyover bridges.
However, the Airport and Abuja Metro stations were in progress and at
various levels of completion.

114
Picture 54: Completed Idu Station at Abuja Rail Mass Transit
Socio-economic impact The project had created employment opportunities for about 2,000 skilled
and unskilled labourers. On completion, it will assuage the difficulties
currently being experienced by commuters in FCT and improve enhance
business environment in the nation’s capital city. In addition, the
sustainable integration of the satellite town into the metropolitan transport
system will increase employment opportunities as well as boost economic
activities in the city centre.
17.0.2 REHABILITATION AND EXPANSION OF OUTER
NORTHERN EXPRESSWAY LOT 1
The project involves the rehabilitation of the existing 19.5km carriageways
and construction of additional lanes to the main carriageways from Zuba
interchange to Dutse junction. Other components include: construction of
4 nos. railway crossing bridges, 5nos. pedestrian bridges, 8 way telecom
ducts, power supply and street lighting, stone pitching and grass planting
for slope protection.
The contract was awarded to Messrs Dantata and Sawoe Construction
Company Nigeria Limited in May 2009 at a cost of ₦66.83 billion with an
initial completion date of November, 2014 which was later reviewed to
December, 2016. In the 2016 Budget, the sum of ₦2.24 billion was
appropriated, out of which ₦1.7 billion was released and utilized as at the
end of the fiscal year. So far, N66.8 billion had been committed to the
project since inception to achieve 100% level of completion.

115
Findings: At the time of monitoring, the project had been completed.
Socio- economic impact:
The project created employment opportunities for over 700 skilled and
unskilled labour. It has also improved the flow of traffic and reduced
vehicle operating cost along the route. In addition, it has attracted the
building of estates, schools, filling stations, automobile dealers and
increased the value of properties along the route.
17.0.3 REHABILITATION AND EXPANSION OF OUTER
SOUTHERN EXPRESSWAY (OSEX) PHASE I PROJECT:
The project entails the rehabilitation of 6.75km of 10-lanes of 4 dual
carriage ways starting from the Villa Roundabout to Apo Roundabout. The
scope of work include: site clearance, earthworks, 4nos. interchange
structure, trumpet interchanges structure at OSEX/Shehu Shagari way,
etc.
The contract was awarded to Messrs (C.G.C) Nig. limited in December,
2013 at a cost of ₦39.83 billion with a completion period of 36 months.
The sum of ₦2.56 billion was appropriated in 2016 Budget, of which same
amount was released and utilized to achieve 18.5% level of completion.
Findings: At the time of monitoring, the following percentages of works has been
attained: 22% of earthwork, 70% of outcrops rock blasting; 34% of
geological survey, 31% of culvert, 16% of bridge works while excavation
work on the pedestrian bridge was in progress.
Picture 55: Pictorial view of completed work on PRIOSEX

116
interchange
Socio-economic Impact: Although the project is yet to be completed, over 150 jobs have been
created for skilled and unskilled labourers. On completion, the project will
ensure decongestion of traffic. It will also reduce travel time, increase
economic activities along the road corridor.
Challenges: The relocation of structures within the interchange area and rock blasting
at very close range to residential houses slowed the pace of work.
4.18 MINISTRY OF BUDGET AND NATIONAL PLANNING The Ministry was allocated a total of ₦2.32 billion in the 2016 Budget
which was fully released and utilized as at the end of the fiscal year to
implement its capital projects/ programmes. The following project was
monitored.
4.18.1 NATIONAL INSTITUTE FOR SOCIAL & ECONOMIC
RESEARCH The Institute was allocated a total of ₦224.49 million in the 2016 budget
to implement its projects/programmes. Out of this amount, ₦224.39 million
was released, while ₦224.20 was cash-backed and utilized to achieve
99.91% project implementation. The following project was monitored:
i Rehabilitation of NISER Library
The project involves the renovation of the Library complex which consists
of the replacement of roof with long span aluminium sheets. The contract
was awarded to Messrs Samsoj Engineering Service Nig. Limited at a cost
of ₦10.40 million in July 2017 with completion date of April 2017. In the
2016 Budget, ₦10.40million was appropriated, released and utilized to
achieve 100% level of completion.
Findings: At the time of visit, the project had been completed.

117
Socio-economic Impacts: The project had empowered local businesses and youths of the area,
while its successful completion had solved the menace of perennial
flooding of the library reading rooms and offices.
Picture 56: Completed re-roofing of NISER library

118
5.0 SUMMARY OF FINDINGS, AND RECOMMENDATIONS The 2016 Budget implementation and performance monitoring exercises
conducted between 28th November - 9th December 2016 and 8th– 26th May
2017 gives an insight into the performance of the sampled MDAs in their
efforts at achieving the annual planned deliverables as set out in the
MTEF and MTSS sessions.
The MBNP teams inspected and evaluated the MDAs’ capital projects and
programmes spread across the six geo-political zones to determine the
value for the tax payers’ funds allocated to them and identify challenges
and valuable lessons from the MDAs in the course of implementation. The
key findings and recommendations are therefore summarized as follows:
A. NASS ROLE IN CAPITAL APPROPRIATION
The National Assembly remains very crucial to budget implementation in
Nigeria given their role in not only the appropriation processes but also in
oversight and control. It was observed that the late passage of the 2016
budget in May 2016 greatly impacted budget implementation during the
period. In addition, there were complaints by MDAs of projects added at
the NASS that they were not fully prepared to commence implementation
and more importantly those that were outside of the respective
MDAs’/Federal Government’s mandate.
Recommendation
i. The Budget preparation process should commence early and
therefore MDAs should be reminded of the need for strict adherence
to the Executive Order recently issued by Government.
ii. The Executive and the Legislative arm of Government should
collaborate more during the pre-budget preparation processes
including meeting of MDAs and relevant Committees of the NASS
before submission of the budget. This is to ensure alignment of
projects to MDAs’ mandate and appropriate phrasing and costing of

119
the projects.
B. Project Narration and Fund Virements
There were several discrepancies observed in the narration of some line
items from what is in the Appropriation Act of some MDAs including
UNILAG, DIA, UNIMAID etc. This includes classification of on-going
projects as new, and new projects as on-going. It was also observed that
some MDAs resorted to virement without appropriate authorization.
Recommendations:
i. The relevant Department of the MBNP/BOF should intensify efforts
at sensitizing MDAs and the Appropriation Committee of NASS on
the dangers of budget distortion, project repetition, misleading and
vague narrations, unauthorized virements and other unwholesome
practices.
ii. The Ministry should also create incentive measures to dissuade
MDAs and relevant officers from such practices.
C. MDAs Capacity to Implement Projects/Programmes
While the Procurement Act is being reviewed to address some of its
shortcomings in terms of cumbersomeness, MDAs were also found to
plan the process very late despite SGF circular Ref. No.
SGF/OP/I/S.3/VOL.XI/833 of 5th January 2016 directing them to
commence procurement activities on time so as to ensure greater project
performance.
Also, hiding under the procurement process, some MDAs were found to
have wantonly warehoused their releases delaying the conclusion of the
contracts tendering namely Sokoto Rima River Basin Development
Authority, Sokoto, Nigeria Immigration Service, National Bio-
Technological Dev’t Agency, Abuja Project Dev’t Institute, Enugu,
Scientific Equipment Dev’t Institute (SEDI), Enugu etc. Conversely, while
trying to mop-up funds, some MDAs indulged in unapproved virement
while some were found not to have instituted effective M&E mechanism

120
for project tracking, data collection and reporting.
In the same vein, MDAs in some sectors, were found to be in the habit of
splitting appropriations and contracts through wanton insertion of new
projects and programmes instead of prioritizing the completion of on-going
ones. Project costs were, at times, revised and timelines extended
improperly while releases were thinly shared over several projects and
programmes and by so doing critical projects were out-rightly denied
funding.
It was also observed that these actions were most times done to beat the
inherently slow procurement process which has adversely affected
effective implementation of the capital budget over the years. As an
instance, the Regional Centre for Commercial Arbitration in Lagos under
the Justice Sector converted the N10m budgetary releases from the 2016
budget towards renovating the Centre’s old building to avoid paying
N400m rent that was above the N20m Appropriation for that year.
Recommendations
i. In the event of virement, MDAs must be requested to tender evidence
of processing for NASS approval and those willfully engaged in
unapproved virement, contract splitting, over-invoicing, cost
variation, timeline extension should be made to return allocated
funds, and also to face appropriate sanctions.
ii. MDAs should be made to plan ahead by accelerating the
procurement cycle and submission of annual procurement plan to
align their actions with the directive contained in the SGF circular
Ref. No. SGF/OP/I/S.3/VOL.XI/833 of 5th January 2016 as a
precondition for capital releases.
iii. The ongoing review of the public procurement should be fast-
tracked and the contract approval threshold reduced and the
committee enlarged, while MDAs should be encouraged to imbibe
best practices by adopting best practices in the project prioritization

121
and selection criteria such as that of the Ministry of Power, Works
and Housing.
D. Inadequate Budgetary Provision for Projects
Too many MDAs’ projects were admitted into the Appropriation Bill by the
Executive Arm of Government including admission of projects that are not
capital in nature. The Appropriation Act was therefore over burdened with
unimplementable projects and programmes from the MDAs upon which
conversely the performance of the capital budget is determined whether
funded or not.
MDAs have also complained of late, and inappropriate timing of budget
releases not minding that projects are affected by inclement weather such
as those in Agriculture, Works and Housing sectors. This leads to slowed
down of execution in the peak period only for such funds to be later
mopped-up or the MDAs accused of lacking in capacity to utilize the funds.
Project funds were equally not set aside for critical projects as they are
left to compete with non-priority projects and programmes. Some turnkey
projects with huge capital outlay were at times completed and left without
furnishing or equipment including those in Health and Education sectors
eg construction of lecture and hospital theaters (Yabatech, OAUTH, Il Ife
etc)
Dollar/Euro currency were included in local project contracts without legal
consideration in a way that later constitute impediments to effective
implementation of the projects.
Government continued to rely heavily on oil for revenue and foreign
exchange despite the huge potentials of the non-oil sector. This greatly
affects the certainty of budget implementation given the volatility inherent
in the sector.
Recommendations
i. The current efforts by BOF to develop a dynamic framework for the

122
termination of abandoned and moribund projects and programmes,
should be sustained.
ii. Priority and timeliness in funding selected flagship and turnkey
projects should be developed for every Appropriation Act to address
the shortcomings of the envelop system.
iii. Government should also intensify efforts to diversify the economy
through agriculture, solid minerals as well as revival of comatose
industries. These would help diversify the revenue base of the
country, improve revenue collection and budget implementation.
iv. The BPP should ensure that the MDAs’ implementation plan for
construction of building complex contains the furnishing/equipping
of the facility to increase the timely impact of the project when
completed.
E. Project Location and Community Responsiveness
There is obvious lack of synergy between implementing MDAs with
MOI/LGC/State Governments and local communities in the execution of
high capital projects as qualified indigenous contractors and professionals
from the area were not usually selected. This was identified as a key
reason why completed projects are left to rot and vandalized due to
absence of institutional arrangement to involve host communities and
project beneficiaries in the conception and execution of Federal
Government projects.
Recommendations
i. MDAs should be directed to explore participatory budgeting so that
the priority needs of the community is align with the aspirations of
the MDAs for inclusive governance,
ii. To deepen the involvement of stakeholders, the procurement
Council should be composed and inaugurated to handle all
contracts above the threshold of the Departments and Agencies as

123
provided for in the Procurement Act.
iii. The federal character stipulation should also be adhered to so as to
favour host community in employment and business offers, while
adequate security should be organized for project by liaising with
the appropriate security arm for coverage.
iv. Overall, Government should continue to explore other project
financing windows such as PPP and privatization in order to
enhance projects funding and infrastructure development in the
country.

124
6.0 CONCLUSION The slump in oil price which reached a 10-year low in April 2016 as well
as the lower oil production occasioned by production disruptions in the
Niger Delta region, impacted the nation’s revenue performance during the
review period. This, combined with the continued security challenges
being experienced in North Eastern Nigeria, resulted in the economy
slipping into recession during the 2016 fiscal year. This also impacted
budget implementation during the period. However, significant progress
was made particularly in capital expenditure budget implementation
leading to 76.82% achievement of the ₦1,587.40 billion projected for
capital expenditure in 2016. This was achieved as a result of
government’s initiatives to enhance fiscal transparency and accountability
in the management of public resources in Nigeria.
Though projected to recover in the near to medium term, overall
macroeconomic environment of Nigeria remained fragile given the
negative growths in all four quarters of 2016 and persistence of some
headwinds. There are upside and downside risks that would determine
near term developments in the economy. Legacy issues including
deepened reforms in various sectors of the economy particularly in the
areas of fiscal management, renewed fight against corruption, continued
fiscal consolidation, and innovative sectoral and activity-specific
government interventions are expected to support economic growth and
prosperity in the near term. Conversely, a weak external environment,
lower commodity prices as well as low production of crude oil, and
insecurity resulting from the continued threat of terrorism, are some of the
events that could pose a threat to the good outlook and prospects of the
economy and could act as a drag on growth and prosperity.
The nation’s economic outlook and prospects in the medium term
therefore remain stable, despite negative developments in the domestic
economy as well as continued uncertainty and sluggish global economic
recovery. The economy went into recession in 2016 with a -1.5% growth
as a result of the challenging fiscal environment during the review period.
The development also resulted in the deterioration of Nigeria’s external
balance with adverse impact on trade balance and exchange rates. This

125
has equally resulted in higher government borrowing to increase
expenditure which is needed to reflate the economy given the reduced
private consumption and investment expenditure. The year-on-year
headline inflation therefore witnessed a sharp upward trend as FOREX
demand pressure intensified resulting in the depreciation of Naira.
The MBNP will continue to promote openness, transparency and
accountability in project execution to enhance the delivery of dividends of
democracy to all Nigerians. This will involve the strict implementation of
the budget implementation guidelines and the governance framework on
monitoring capital budget implementation. It will also point-out these
issues to the MDAs and work-out a way forward by interacting with them
regularly, while engendering effective project management planning
geared towards improving the level of capital budget implementation in
2017.

Appendices APPENDIX A: OSGF Circular (Ref. No. SGF/OP/I/S.3/VOL.XI/833)
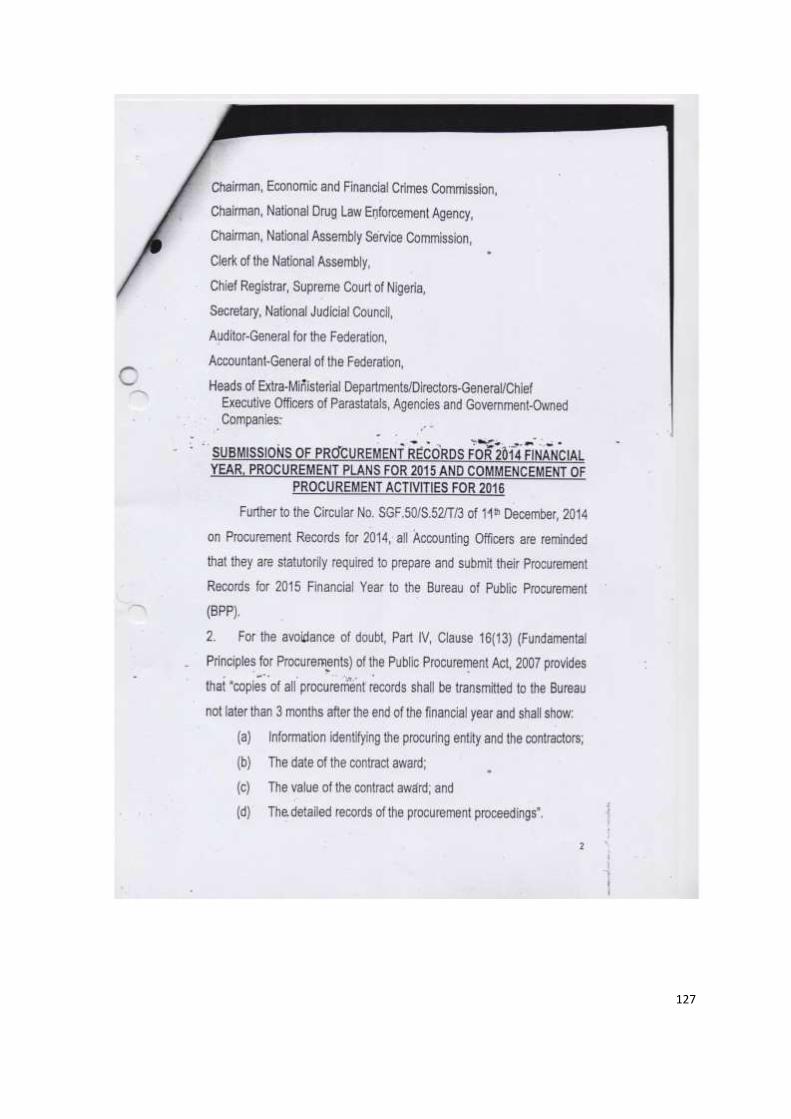
127

128

129
APPENDIX B: OSGF Circular (Ref. No. SGF/OP/I/S.3/VOL.XI/833)

130

131