2016 first six-months results - IAB2016 first six-months results First six-months and quarterly...
24
IAB internet advertising revenue report 2016 first six-months results www.pwc.com www.iab.net Any trademarks included are trademarks of their respective owners and are not affiliated with, nor endorsed by, PricewaterhouseCoopers LLP.
Transcript of 2016 first six-months results - IAB2016 first six-months results First six-months and quarterly...

PwC
IAB internet advertising revenue report
2016 first six-months results
www.pwc.com
www.iab.net
Any trademarks included are trademarks of their respective owners and are not affiliated with, nor endorsed by, PricewaterhouseCoopers LLP.

PwCPwC
Agenda
2
November 2016
Survey methodology
2016 first six-months results
First six-months and quarterly trends
Advertising formats
Social media
Pricing models
Industry category spending
About PwC

PwCPwC
Survey Methodology
3
November 2016
Survey Scope
The IAB Internet Advertising Revenue Report is part of an ongoing IAB mission to provide an accurate barometer of Internet advertising growth.
To achieve differentiation from existing estimates and accomplish industry-wide acceptance, key aspects of the survey include:
• Obtaining historical data directly from companies generating internet (desktop and mobile) advertising revenues;
• Making the survey as inclusive as possible, encompassing all forms of internet advertising, including websites, consumer online services, ad networks and exchanges, mobile devices; and
• Ensuring and maintaining a confidential process, only releasing aggregate data.
Methodology
Throughout the reporting process, PwC:
• Compiles a database of industry participants selling internet advertising revenues.
• Conducts a quantitative mailing survey with leading industry players, including web publishers, ad networks, commercial online service providers, mobile providers, and other online media companies.
• Requests and compiles several specific data items, including monthly gross commissionable advertising revenue by industry category and transaction.
• Acquires supplemental data through the use of publicly disclosed information.
• Identifies non-participating companies and applies a conservative revenue estimate based on available public sources.
• Analyzes the findings, identifies and reports key trends.

PwCPwC
Half year revenues totaled …
4
November 2016
In b
illi
on
s
$27.48
$32.7
HY 2015 HY 2016
PwCPwC 5
November 2016
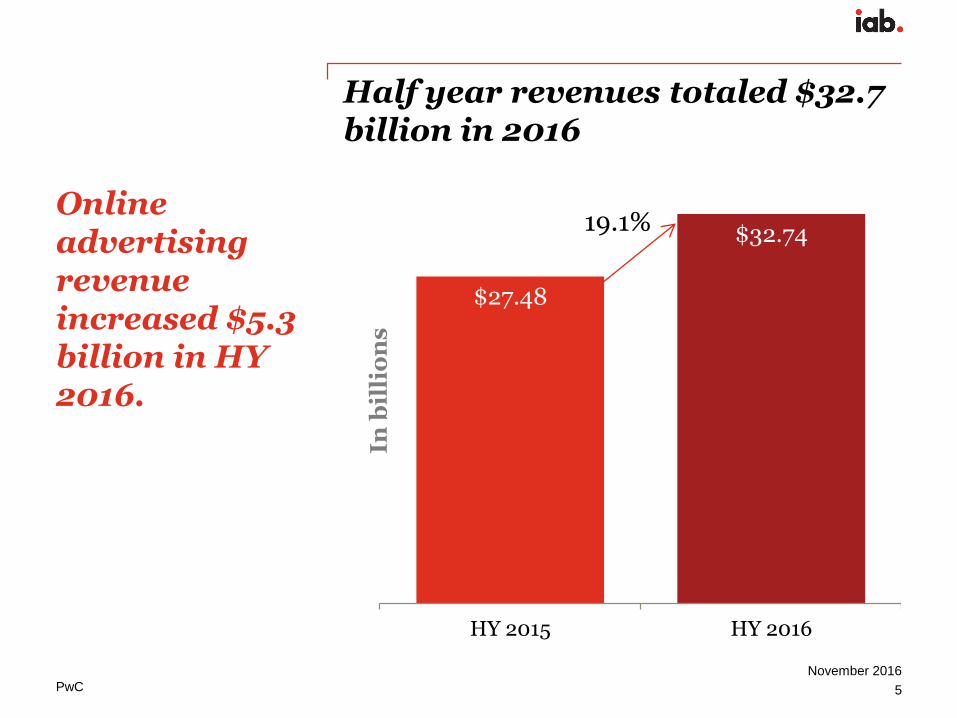
Half year revenues totaled $32.7billion in 2016
Online advertising revenue increased $5.3 billion in HY 2016.
In b
illi
on
s
$27.48
$32.74
HY 2015 HY 2016
19.1%

PwCPwC 6
November 2016
2016 second quarter revenues totaled ….
In b
illi
on
s
$14.30
$16.9
Q2 2015 Q2 2016
Source: IAB Internet Advertising Revenue Report, HY 2016

PwCPwC 7
November 2016
2016 second quarter revenues totaled $16.89 billion
Revenue in Q2 2016 was $2.6 billion higher than in Q2 2015.
In b
illi
on
s
$14.30
$16.89
Q2 2015 Q2 2016
18.1%
Source: IAB Internet Advertising Revenue Report, HY 2016

PwCPwC 8
November 2016
Strong Growth between Q1 2016 and Q2 2016
In b
illi
on
s
$15.85$16.9
Q1 2016 Q2 2016
Source: IAB Internet Advertising Revenue Report, HY 2016

PwCPwC 9
November 2016
Strong Growth between Q1 2016 and Q2 2016
Revenue in Q2 2016 was $1.0 billion higher than in Q1 2016.
In b
illi
on
s
$15.85$16.89
Q1 2016 Q2 2016
6.6%
Source: IAB Internet Advertising Revenue Report, HY 2016

PwCPwC 10
November 2016
Since 2010, a strong seasonal trend has emerged for internet advertising revenuesQuarterly growth comparison, 1996–HY 2016
In b
illi
on
s
’96

PwCPwC 11
November 2016
First six-months 2016 shows record revenues Historical revenue mix, first half vs. second half
In b
illi
on
s
$3.3 $4.6 $5.8 $7.9 $10.0 $11.5 $10.9 $12.1$14.9 $17.0
$20.1$23.1
$27.5$32.7
$4.0$5.0
$6.8$9.0
$11.2$11.9 $11.8
$13.9
$16.8
$19.5
$22.7
$26.4
$32.1
?
$0
$10
$20
$30
$40
$50
$60
$70
2003 2004 2005 2006 2007 2008 2009 2010 2011 2012 2013 2014 2015 2016
Last 6 months
First 6 months
* CAGR: Compound Annual Growth Rate

PwCPwC
Industry concentration – the long tail
12
November 2016
Top 10 Companies = 74% of HY 2016 Revenues
Next 15 Companies = 10% of HY 2016 Revenues
Remaining Companies = 16% of HY Revenue

PwCPwC
$8.9 $1.1 $0.9 $15.5 $2.3 $3.4 $0.2 $0.4
-12%
-29%
2%
89%
13%
-10%
-47%
-29%
-60%
-40%
-20%
0%
20%
40%
60%
80%
100%
$-
$2
$4
$6
$8
$10
$12
$14
$16
Search Classifieds &Directories
LeadGeneration
Mobile Digital VideoCommercials
Banners Ads Sponsorship Rich Media
HY 2016 Revenue HY 2016 vs. HY 2015 % Growth
$10.1
13
November 2016
Mobile shows the strongest growthAdvertising formats – HY 2016 results and growth rates
In b
illi
on
s

PwCPwC 14
November 2016
Historical trends in internet advertising formatsRevenue share by major ad formats, 2006–HY 2016
0%
5%
10%
15%
20%
25%
30%
35%
40%
45%
50%
Search Mobile Banner Ads Digital Video Classifieds LeadGeneration
Sponsorship
2006 2007 2008 2009 2010 2011 2012 2013 2014 2015 HY 2016
% o
f to
tal
re
ve
nu
e
Source: IAB Internet Advertising Revenue Report, HY 2016

PwCPwC 15
November 2016
Mobile represents a significant percentage of advertising formats
For the half year in 2016, Mobile revenue totaled $15.5 billion
Source: IAB Internet Advertising Revenue Report, HY 2016
27%
12%
7%
47%
6%
Search Display / BannerVideo MobileOther
48%
39%
10%
3%
Mobile Search
Mobile Display / Banner
MobileVideo
Mobile Other

PwC
Distributing Mobile across formats demonstrates its importance to Search and Display
Formats – HY 2016(Mobile separated)
Formats – HY 2016(Mobile included)
Source: IAB Internet Advertising Revenue Report, HY 2016
27%
12%
7%7%
47%
Search Display Video Other Mobile
50%
31%
12%
8%
Search Display Video Other

PwCPwC 17
November 2016
Ad Formats – Mobile allocated comparison to PYVideo across formats demonstrate strongest growth
50%
31%
9%
10%
HY 2015
Search Display Banner
Display Video Hybrid Other
50%
31%
12%
8%
HY 2016
Search Display Banner
Display Video Hybrid Other
Total – $27.5 billion Total – $32.7 billion
Source: IAB Internet Advertising Revenue Report, HY 2016
PwCPwC
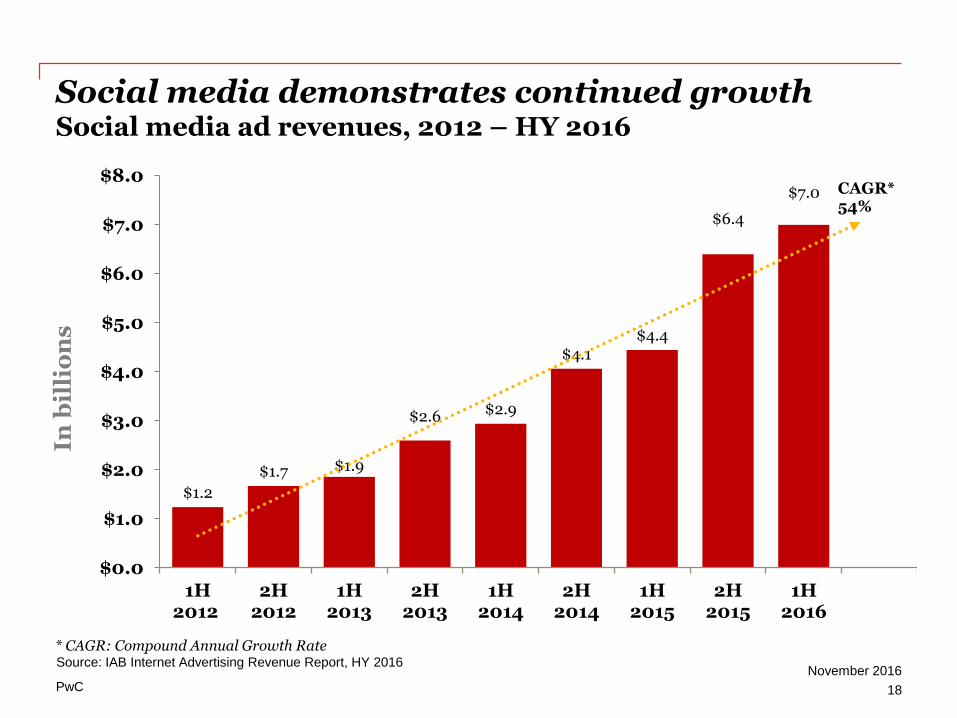
$1.2
$1.7 $1.9
$2.6 $2.9
$4.1$4.4
$6.4
$7.0
$0.0
$1.0
$2.0
$3.0
$4.0
$5.0
$6.0
$7.0
$8.0
1H2012
2H2012
1H2013
2H2013
1H2014
2H2014
1H2015
2H2015
1H2016
CAGR* 54%
Social media demonstrates continued growthSocial media ad revenues, 2012 – HY 2016
18
November 2016
In b
illi
on
s
* CAGR: Compound Annual Growth RateSource: IAB Internet Advertising Revenue Report, HY 2016

PwCPwC 19
November 2016
Pricing modelsInternet ad revenues by pricing model, HY 2015 vs. HY 2016
32%
66%
2%
HY 2015
Impression-based Performance-based
Hybrid
34%
65%
1%
HY 2016
Impression-based Performance-based
Hybrid
Total – $27.5 billion Total – $32.7 billion
Source: IAB Internet Advertising Revenue Report, HY 2016

PwC
Historical pricing model trendsInternet ad revenues by pricing model, 2005–HY 2016
46% 48%
45%
39%37%
33%31% 32% 33% 34%
32%34%
41%
47%
51%
57%59%
62%65% 66% 65% 65% 66% 65%
13%
5% 4% 4% 4% 5% 4%2% 2% 1% 2% 1%
0%
10%
20%
30%
40%
50%
60%
70%
2005 2006 2007 2008 2009 2010 2011 2012 2013 2014 2015 HY2016
CPM Performance Hybrid
% o
f to
tal
re
ve
nu
e
Note: Pricing model definitions may have changed over the time period depicted both within the survey process and as interpreted by respondents

PwC
Internet ad revenues by major industry category$27.5 B in HY 2015 vs. $32.7 in HY 2016
21%
13%12%
9% 9%
7% 7%
5% 5%4%
21%
13%12%
9%8%
6%7%
6%5%
4%
Retail FinancialServices
Auto Telecom LeisureTravel
PackagedGoods
Tech /Computing
Media Pharma &Healthcare
Entertain-ment
HY 2015 HY 2016
% o
f to
tal
re
ve
nu
e †
† Amounts do not total to 100% as minor categories are not displayed.

PwCPwCNovember 2016
PwC’s Technology and Entertainment, Media, and Communications practices
As business, accounting, and tax advisors to many of the world’s leading Entertainment, Media, and Communications (EMC) and Technology (Tech) companies, PwC (www.pwc.com) has an insider’s view of trends and developments driving the industry. With approximately 1,200 practitioners serving EMC and Tech clients in the United States, PwC is deeply committed to providing clients with industry experience and resources. In recent years, our pioneering work in EMC and Tech has included developing strategies to leverage digital technology, identifying new sources of financing, and marketplace positioning in industries characterized by consolidation and transformation. Our experience reaches across all geographies and segments of the EMC and Tech sectors, including broadband, wireless, the internet, music, film, television, publishing, advertising, gaming, theme parks, computers and networking, and software. With thousands of practitioners around the world, we're always close at hand to provide deep industry knowledge and resources.
Our services include:
• Business assurance services
• Web audience measurement and advertising delivery auditing and advisory
• IAB Measurement Certification Compliance auditing
• Privacy policy structuring, attestation, and compliance advisory
• Mergers & acquisitions assistance
• Tax planning and compliance
• Capital sourcing and IPO assistance
• Marketing & Media operations enablement
22November 2016

PwCPwCNovember 2016
For information, contact one of the following PwC professionals:New York
David SilvermanPartner, Assurance [email protected]
Russ SapienzaPrincipal, Advisory [email protected]
Brian GaffneyManager, Advisory [email protected]
23
Technology and Entertainment, Media, and Communications practicesContacts

PwC
www.pwc.com/e&m
PricewaterhouseCoopers has exercised reasonable care in the collecting, processing, and reporting of this information but has not independently verified, validated, or audited the data to verify the accuracy or completeness of the information. PricewaterhouseCoopers gives no express or implied warranties, including but not limited to any warranties of merchantability or fitness for a particular purpose or use and shall not be liable to any entity or person using this document, or have any liability with respect to this document. This report is for general purposes only, and is not a substitute for consultation with professional advisors.
© 2016 PwC. All rights reserved. PwC refers to the US member firm or one of its subsidiaries or affiliates, and may sometimes refer to the PwC network. Each member firm is a separate legal entity. Please see www.pwc.com/structure for further details.