2016 Engineering & Construction Conference - Deloitte US · 2016 Engineering & Construction...
34
2016 Engineering & Construction Conference June 15–17, 2016 The Westin Austin Downtown Austin, Texas
Transcript of 2016 Engineering & Construction Conference - Deloitte US · 2016 Engineering & Construction...

2016 Engineering & Construction Conference
June 15–17, 2016 The Westin Austin DowntownAustin, Texas

General Session:M&A Trends and Drivers
J. Mark Andrews Managing Director, M&A Transaction Services
Eric AndreozziManaging Director, Deloitte Advisory Deloitte Transactions and Business Analytics LLP
Bruce GribensPartner, Tax Deloitte Tax LLP
Bryan Johnson Senior Manager, Deloitte Advisory Deloitte & Touche LLP
Kevin Lynch Partner Deloitte Consulting LLP
Todd Wilson Managing Director, M&A Transaction Services Deloitte & Touche LLP
10:15 – 11:45 a.m.

i. M&A Trends and Drivers• Macro perspective• Engineering & Construction industry
ii. Overview of M&A Lifecycle & Process• Financial due diligence• Tax due diligence• Carve-outs and divestitures• Transition service agreements• Integration Planning
iii. Q&A
Contents

Macro PerspectiveM&A Trends and Drivers

Current M&A Markets
Global M&A Volume and Value (US$B)
Global M&A Activity – YTD Mar-16
U.S. M&A Volume and Value (US$B)
U.S. M&A Activity – YTD Mar-16
0
10,000
20,000
30,000
40,000
50,000
0
750
1,500
2,250
3,000
3,750
4,500
2007 2008 2009 2010 2011 2012 2013 2014 2015 2015YTD
2016YTD
No. Deals$Bil
Enterprise Value ($ Bil) Number of Deals
0
3,000
6,000
9,000
12,000
0
400
800
1,200
1,600
2,000
2007 2008 2009 2010 2011 2012 2013 2014 2015 2015YTD
2016YTD
No. Deals$Bil
Enterprise Value ($ Bil) Number of Deals
Value: $1,630.6B
(+16.5.0% YoY)
Volume: 9,516
(-4.2% YoY)Volume:9,524
(-6.4% YoY)
Value:$599B
(-25.0% YoY)
Volume:2,025
(-21.1% YoY)
Value:$210B
(-40.5% YoY)

Select Macro Considerations
U.S. Economic Growth (GDP)
S&P 500 Performance
Acquisition Multiples (Strategic vs. Financial buyer)
Major Currencies vs. U.S. Dollar
60.0%
80.0%
100.0%
120.0%
140.0%
160.0%
Q1-11 Q3-11 Q1-12 Q3-12 Q1-13 Q3-13 Q1-14 Q3-14 Q1-15 Q3-15 Q1-16
USD/USD EUR/USD JPY/USD GBP/USD
1,000
1,250
1,500
1,750
2,000
2,250
2,500
Q1-11Q3-11Q1-12Q3-12Q1-13Q3-13Q1-14Q3-14Q1-15Q3-15Q1-16
S&P Share Price Price to USD
Source: Capital IQ, Bureau of Economic Statistics
100%
109%
50%
75%
100%
125%
150%
175%
Q1 - 11 Q3 - 11 Q1 - 12 Q3 - 12 Q1 - 13 Q3 - 13 Q1 - 14 Q3 - 14 Q1 - 15 Q3 - 15 Q1 - 16Strategic Financial Sponsor

Financial Buyers Activity
Global Financial Buyers Volume and Value (US$B)
Leverage Multiples for LBOs
U.S. Financial Buyers Volume and Value (US$B)
US Private Equity Fundraising (US$B)
0
250
500
750
1,000
0
30
60
90
120
150
2007 2008 2009 2010 2011 2012 2013 2014 2015 2015YTD
2016YTD
No. Deals$Bil
Enterprise Value ($ Bil) Number of Deals
0
2,000
4,000
6,000
8,000
0
200
400
600
800
2007 2008 2009 2010 2011 2012 2013 2014 2015 2015YTD
2016YTD
No. Deals$Bil
Enterprise Value ($ Bil) Number of Deals
3.4x 3.8x 3.8x4.6x 5.1x 5.1x
0.8x 0.5x 0.8x 0.2x0.1x 0.2x4.2x 4.3x 4.5x 4.8x5.3x 5.3x
0.0x
1.0x
2.0x
3.0x
4.0x
5.0x
6.0x
7.0x
2010 2011 2012 2013 2014 2015Senior Debt Subordinated Debt
$64.1 $74.6 $79.7
$130.9
$174.8 $167.7
$0.0
$50.0
$100.0
$150.0
$200.0
2010 2011 2012 2013 2014 2015

Deloitte M&A Trends Report 2015Using survey responses from 2,300 executives from U.S. corporations and private equity firms, the report provides insights into future M&A activity as well as deal dynamics. Key findings from the survey include the following:
• M&A momentum continuesRespondents expect the pace of M&A activity to sustain or ramp up from 2015 levels in the next 12 months
• Increased transformational focus Compared to 2015, corporate executives indicate a 2% increase in Transformative Deals as a leading strategic M&A driver.
• Continued effort to expand customer bases, including via overseas expansionChina, Canada, and the UK are the top foreign markets for Corporate and PEI respondents.
• Exits and divestitures poised to grow• About 77% of PEI respondents anticipate an
accelerated level of exits in the next 12 months. • About 52% of corporate respondents reported they
anticipate divesting a business in 2016.
85%
Corporate Respondents
94%
PEI Respondents
Corporate – 23%PEI – 26%
Corporate – 20%PEI – 24%
Corporate – 23%PEI – 27%
Smaller strategic deals
Reactive to opportunities
Major transformational deals
N/A - No Strategy
Other
Corporate Respondents

M&A Trends and DriversEngineering & Construction Industry

Industry Consolidation Continues
25.6%
11.4%
17.6%
12.5%
32.9%
2016 Top 500 Design Firms
Top 1-5
Top 6-10
Top 11-25
Top 26-50
Top 51-500
23.0%
9.9%
15.6% 12.4%
39.1%
2015 Top 400 Contractors
Top 1-5
Top 6-10
Top 11-25
Top 26-50
Top 51-500
25.1%
6.1%
11.0%
10.6%
47.2%
2015 Top 600 Specialty Contractors
Top 1-5
Top 6-10
Top 11-25
Top 26-50
Top 51-500
29.9%
14.3%
22.7%
13.9%
19.2%
2015 Top 200 Environmental Firms
Top 1-5
Top 6-10
Top 11-25
Top 26-50
Top 51-500
Source: ENR, CapitalIQ, Deloitte analysis.Note: ENR’s “Top 500 Design Firms” list is published with the title reflecting year of publication,
while the other lists publish titles reflecting latest full calendar year.

Industry Consolidation Continues
Desire/ need for growth
Integrated service offering
Geographic expansion
Access to industry verticals
Economies of scale
Talent acquisition
Factors Driving
Consolidation

Top 50 Design (2016)
Top 50 Design Firms1 AECOM 26 LOUIS BERGER2 JACOBS 27 GHD INC.3 CH2M 28 KIMLEY-HORN4 FLUOR CORP 29 CDI CORP.5 AMEC FOSTER WHEELER 30 TRC COS. INC.6 CB&I INC. 31 SARGENT & LUNDY LLC7 TETRA TECH INC. 32 TERRACON CONSULTANTS INC.8 BECHTEL 33 FUGRO USA9 HDR 34 HATCH MOTT MACDONALD10 PARSONS 35 MICHAEL BAKER INTERNATIONAL11 WSP | PARSONS BRINCKERHOFF 36 PERKINS+WILL12 ARCADIS NORTH AMERICA - CALLISONRTKL 37 LEIDOS13 WOOD GROUP - MUSTANG INC. 38 HOK14 BURNS & MCDONNELL 39 EXP US SERVICES INC.15 BLACK & VEATCH 40 STV GROUP INC.16 GENSLER 41 POWER ENGINEERS INC.17 KBR 42 ATKINS NORTH AMERICA18 STANTEC INC. 43 KIEWIT CORP.19 INTERTEK - PSI 44 HKS INC.20 WORLEYPARSONS 45 SKIDMORE OWINGS & MERRILL LLP21 HNTB COS. 46 DEWBERRY22 MWH GLOBAL 47 BROWN AND CALDWELL23 CDM SMITH 48 KLEINFELDER24 BUREAU VERITAS 49 GANNETT FLEMING25 S&B ENGINEERS AND CONSTRUCTORS LTD. 50 T.Y. LIN INTERNATIONAL
38% Public4% PEI
Note: Blue shading denotes publicly traded entities or entities with publicly-traded parent company; Red shading denotes private equity owned entities.

Top 50 Contractors (2015)
Note: Blue shading denotes publicly traded entities or entities with publicly-traded parent company; Red shading denotes private equity owned entities.
32% Public0% PEI
Top 50 Contractors1 Bechtel 26 Granite Construction Inc.2 Fluor Corp. 27 Brasfield & Gorrie LLC3 The Turner Corp. 28 Primoris Services Corp.4 CB&I 29 Zachry Group5 Kiewit Corp. 30 David E. Harvey Builders Inc.6 PCL Construction Enterprises Inc. 31 Suffolk Construction Co.7 AECOM 32 China Construction America8 Skanska USA 33 Michels Corp.9 The Whiting-Turner Contracting Co. 34 Swinerton Inc.10 Jacobs 35 Austin Industries11 Balfour Beatty US 36 Holder Construction Co.12 KBR 37 Hoffman Corp.13 The Walsh Group Ltd. 38 Walbridge14 Tutor Perini Corp. 39 Black & Veatch15 Clark Construction Group 40 Ferrovial US Construction Corp.16 Gilbane Building Co. 41 Lane Industries Inc.17 Structure Tone 42 Barton Malow Co.18 Mortenson Construction 43 Matrix Service Co.19 Lend Lease 44 Day & Zimmermann20 McCarthy Holdings Inc. 45 Colas USA21 DPR Construction 46 Performance Contractors Inc.22 JE Dunn Construction Group 47 Manhattan Construction Group23 Hensel Phelps 48 M+W U.S. Inc.24 Turner Industries Group LLC 49 Devcon Construction Inc.25 The Yates Cos. Inc. 50 Webcor Builders

Top 50 Environmental Firms (2015)
Top 50 Environmental Firms1 CH2M 26 GHD INC.2 AECOM 27 RAMBOLL ENVIRON INC.3 BECHTEL CORP. 28 ANTEA GROUP4 VEOLIA NORTH AMERICA 29 ICF INTERNATIONAL5 CLEAN HARBORS INC. 30 MCCARTHY HOLDINGS INC.6 TETRA TECH INC. 31 BROWN AND CALDWELL7 ARCADIS NV 32 CARDNO INC.8 FLUOR CORP. 33 LOUIS BERGER9 MWH GLOBAL 34 PCL CONSTRUCTION ENTERPRISES INC.10 SUEZ ENVIRONNEMENT NORTH AMERICA 35 BABCOCK & WILCOX ENTERPRISES11 AMEC FOSTER WHEELER 36 LEIDOS12 GOLDER ASSOCIATES 37 WEEKS MARINE INC.13 CDM SMITH 38 TRC COMPANIES INC.14 BLACK & VEATCH 39 BARNARD CONSTRUCTION CO. INC.15 ENVIRON. RESOURCES MANAGEMENT INC. (ERM) 40 WSP/PARSONS BRINCKERHOFF16 HDR 41 ALBERICI CORP.17 CB&I 42 BOWEN ENGINEERING CORP.18 STANTEC INC. 43 KLEINFELDER19 THE WALSH GROUP LTD. 44 WESTON SOLUTIONS INC.20 PARSONS CORP. 45 GREAT LAKES DREDGE & DOCK21 KIEWIT CORP. 46 NATIONAL RESPONSE CORP.22 GARNEY HOLDING CO. 47 GEOSYNTEC CONSULTANTS INC.23 LAYNE CHRISTENSEN CO. 48 PC CONSTRUCTION CO.24 NORTHSTAR GROUP SERVICES INC. 49 ULLIMAN SCHUTTE CONSTRUCTION LLC25 AEGION CORP. 50 BURNS & MCDONNELL
40% Public6% PEI
Note: Blue shading denotes publicly traded entities or entities with publicly-traded parent company; Red shading denotes private equity owned entities.

Top 50 Specialty Contractors (2015)20% Public10% PEI
Note: Blue shading denotes publicly traded entities or entities with publicly-traded parent company; Red shading denotes private equity owned entities.
Top 50 Specialty Contractors1 QUANTA SERVICES INC. 26 SCHUFF INTERNATIONAL2 EMCOR GROUP INC. 27 SOUTHLAND INDUSTRIES3 MASTEC INC. 28 BERGELECTRIC CORP.4 BRAND ENERGY & INFRASTRUCTURE SERVICES INC. 29 NOOTER CONSTRUCTION CO.5 THE BROCK GROUP 30 STEELFAB INC.6 SAFWAY GROUP - MOBLEY 31 THE NEWTRON GROUP LLC7 COMFORT SYSTEMS USA INC. 32 TD INDUSTRIES8 MDU CONSTRUCTION SERVICES GROUP INC. 33 ENERGY SERVICES HOLDINGS LLC9 HENKELS & MCCOY INC. 34 TERRA MILLENNIUM CORP.10 ROSENDIN ELECTRIC 35 VALLEYCREST LANDSCAPE COS.11 PERFORMANCE CONTRACTING GROUP INC. 36 ALDRIDGE ELECTRIC12 MYR GROUP INC. 37 THE BRANDT COS.13 MMR GROUP 38 STRUCTURAL GROUP14 CUPERTINO ELECTRIC 39 GERDAU REINFORCING STEEL15 TEAM INDUSTRIAL SERVICES INC. 40 HELIX ELECTRIC16 BAKER CONCRETE CONSTRUCTION INC. 41 FAITH TECHNOLOGIES INC.17 ACCO ENGINEERED SYSTEMS 42 HARDER MECHANICAL CONTRACTORS INC.18 M.C. DEAN INC. 43 JH KELLY19 NORTHSTAR GROUP SERVICES INC. 44 WDF INC.20 CECO CONSTRUCTION GROUP 45 E-J ELECTRIC INSTALLATION CO.21 HAYWARD BAKER INC., A KELLER CO. 46 FISK ELECTRIC CO.22 MCKINSTRY 47 MORROW-MEADOWS CORP.23 FIVE STAR ELECTRIC CORP. 48 CONTI CORP.24 CENTIMARK CORP. 49 REDWOOD ELECTRIC GROUP INC.25 FURMANITE CORP. 50 TEAM FISHEL

$0.0
$50,000.0
$100,000.0
$150,000.0
$200,000.0
$250,000.0
Dec-10 Dec-11 Dec-12 Dec-13 Dec-14 Dec-15 Mar-16
Total Book Value of Equity less Cash Total Cash Additional Market Equity
Expectations for GrowthTop 50 Lists – Public Companies*
* Represents the public companies or their public parents from each of the four preceding “Top 50” lists, excluding MDU Resources, China National Construction, Leidos, and Lend Lease, as well as any company with public parent already on the list.
Total Cash Available$27.7B
($, in Millions)Market Equity Value Premium
Source: ERN, CapitalIQ, Deloitte Analysis

Valuation Trading MetricsTop 50 Lists – Public Companies*
Source: ERN, CapitalIQ, Deloitte Analysis
8.0x
6.9x 6.9x
8.6x7.9x
7.2x
8.5x
0.0x
2.0x
4.0x
6.0x
8.0x
10.0x
Dec-10 Dec-11 Dec-12 Dec-13 Dec-14 Dec-15 Mar-16
Median Enterprise Value/LTM EBITDA Multiple
* Represents the public companies or their public parents from each of the four preceding “Top 50” lists, excluding MDU Resources, China National Construction Bank, Leidos, and Lend Lease, as well as any company with a public parent already on the list.

Engineering & Construction M&A TransactionsTop 50 Lists – All Companies
M&A Volume and Value (US$B) M&A Volume by Region (Target HQ)
Source: Capital IQ

M&A Valuation MetricsTop 50 Lists – All Companies (Announced)
Source: Capital IQ
Date Target Buyer
Deal Size (US $m)
Total Revenue (US $m)
EBITDA Margin EV/EBITDA
5/6/16 MWH Global, Inc. Stantec Inc. (TSX:STN) $793.0 $1,215.2 6.4% 10.3x3/1/16 Stork Holding B.V. Fluor Corporation (NYSE:FLR) 753.7 1,735.1 6.3% 6.9x2/29/16 Furmanite Corporation Team, Inc. (NYSE:TISI) 359.7 518.4 6.6% 9.2x1/15/16 Coffey International Limited Tetra Tech, Inc. (NasdaqGS:TTEK) 145.6 404.1 3.8% 8.2x11/11/15 Professional Service Industries, Inc. Intertek Group plc (LSE:ITRK) 330.0 254.0 15.7% 8.3x11/2/15 Cardno Limited (ASX:CDD) Crescent Capital Investments Pty Limited 85.3 1,008.9 5.8% 8.9x7/7/15 Qualspec Inc. Team, Inc. (NYSE:TISI) 265.0 170.4 12.4% 12.5x11/12/14 Aena, S.A. (BME:AENA) Corporación Financiera Alba, S.A. (BME:ALB); Ferrovial, S.A. (BME:FER) 1,266.4 3,792.5 57.7% 8.8x11/12/14 Foster Wheeler AG Amec Foster Wheeler plc (LSE:AMFW) 3,307.9 3,306.5 7.8% 10.6x11/7/14 Fugro NV (ENXTAM:FUR) Royal Boskalis Westminster NV (ENXTAM:BOKA) 211.1 3,113.7 14.9% 5.2x11/3/14 Magnus Pacific Corporation Great Lakes Dredge & Dock Corporation (NasdaqGS:GLDD) 77.0 102.0 10.8% 7.0x10/17/14 Callison, LLC ARCADIS NV (ENXTAM:ARCAD) 144.9 167.0 15.0% 5.8x10/17/14 URS Corporation AECOM (NYSE:ACM) 5,867.3 10,487.7 7.3% 7.3x10/16/14 Hyder Consulting PLC ARCADIS NV (ENXTAM:ARCAD) 482.7 484.2 7.2% 12.9x10/7/14 Schuff International, Inc. (OTCPK:SHFK) HC2 Holdings, Inc. (AMEX:HCHC) 23.1 460.7 7.8% 4.2x8/14/14 Schuff International, Inc. (OTCPK:SHFK) HC2 Holdings, Inc. (AMEX:HCHC) 6.0 438.4 7.3% 4.5x5/29/14 Schuff International, Inc. (OTCPK:SHFK) HC2 Holdings, Inc. (AMEX:HCHC) 98.8 438.4 7.3% 4.7x4/10/14 The Focus Corporation Ltd. WSP Global Inc. (TSX:WSP) 329.3 255.7 14.4% 8.9x3/17/14 PPI Technology Services, LLC Cardno Limited (ASX:CDD) 145.0 133.0 16.2% 6.7x2/19/14 ACEA S.p.A. (BIT:ACE) Suez Environnement Company SA (ENXTPA:SEV) 103.5 4,840.0 16.3% 8.0x1/31/14 Cofiroute SA VINCI SA (ENXTPA:DG) 1,067.1 1,830.3 65.6% 8.8x11/28/13 Proactiva Medio Ambiente, S.A. Veolia Environnement S.A. (ENXTPA:VIE) 198.8 714.6 17.6% 3.2x2/28/13 Rosenberg WorleyParsons AS WorleyParsons Limited (ASX:WOR) 195.6 268.1 11.8% 5.0x2/13/13 The Shaw Group Inc. Chicago Bridge & Iron Company N.V. (NYSE:CBI) 4,909.2 6,032.8 2.7% 20.4x1/28/13 Fugro NV, Geoscience Division CGG (ENXTPA:CGG) 1,548.9 994.2 16.1% 9.7x12/28/12 Safety-Kleen, Inc. Clean Harbors, Inc. (NYSE:CLH) 1,526.5 1,383.0 10.7% 10.0x10/1/12 Sociedad Concesionaria Vespucio Norte Express S.A. Brookfield Asset Management Inc. (TSX:BAM.A) 289.2 95.0 61.2% 23.6x8/1/12 WSP Group plc WSP Global Inc. (TSX:WSP) 589.4 1,133.1 6.0% 8.1x5/30/12 Costa Fortuna del Uruguay S/A Layne Christensen Company (NasdaqGS:LAYN) 27.5 49.5 28.1% 3.1x4/5/12 FYFE Asia Pte. Ltd. Aegion Corporation (NasdaqGS:AEGN) 40.7 25.8 16.7% 9.2xMedian $277.1 $501.3 11.3% 8.2xAverage $839.6 $1,528.4 16.1% 8.7x

Overview of M&A Lifecycle & Process

M&A LifecycleManagement should adopt a multi-disciplinary approach to maintain focus on the most critical elements of a deal on a real-time basis.
Industry Specialists
Accounting/Tax Specialists
OperationsSpecialists
ITSpecialists
HRSpecialists
IntegrationSpecialistsTransaction Execution
Board or Steering
Committee approval
Completed letter of intent
Term sheet
Executed purchase
agreement
Transfer of ownership/
closing documentation
Integration
Divestiture
Implementation PlanningMerger
Strategy Development
TargetScreening and Identification
PreliminaryDue Diligence
Synergy and Value Driver
Quantification
Negotiationof Letter of Intent
Implementation and Transaction
Closing Preparation
Closing and Execution of
ImplementationPlan
Target Screening
Due Diligence
M&A Strategy
Financial Modeling
Negotiation of Final
Transaction
DefinitiveDue
Diligence

Due Diligence Process ConsiderationsDue Diligence requires a real-time cross-functional approach.
Financial Due Diligence
Tax Due Diligence
Carve-outs
TSA’s
Integration Planning
Tran
sact
ion
Exec
utio
n Su
cces
s

Financial Due DiligenceDiligence teams focus on the most critical elements on a real-time basis to quickly identify issues and potential solutions.Typical accounting issues
• Quality of earnings− Revenue recognition− Impact of significant customers− Vendor rebates and allowances− Significant accounting policies
• Working capital− Significant trends− Terms for significant
customers/vendors− Adequacy of allowances and
reserves• Commitments and contingencies• Stock/options/warrants issued to
employees, advisors, and others
Continued consultation• Closing balance sheet procedures• Purchase price allocations and
valuation methodologies• Application of accounting principles• Purchase price adjustments• Transition to expanded integration
consulting services
Financial Due Diligence
Tax Due Diligence
Carve-outs
TSA’s
Integration Planning
Tran
sact
ion
Exec
utio
n Su
cces
s
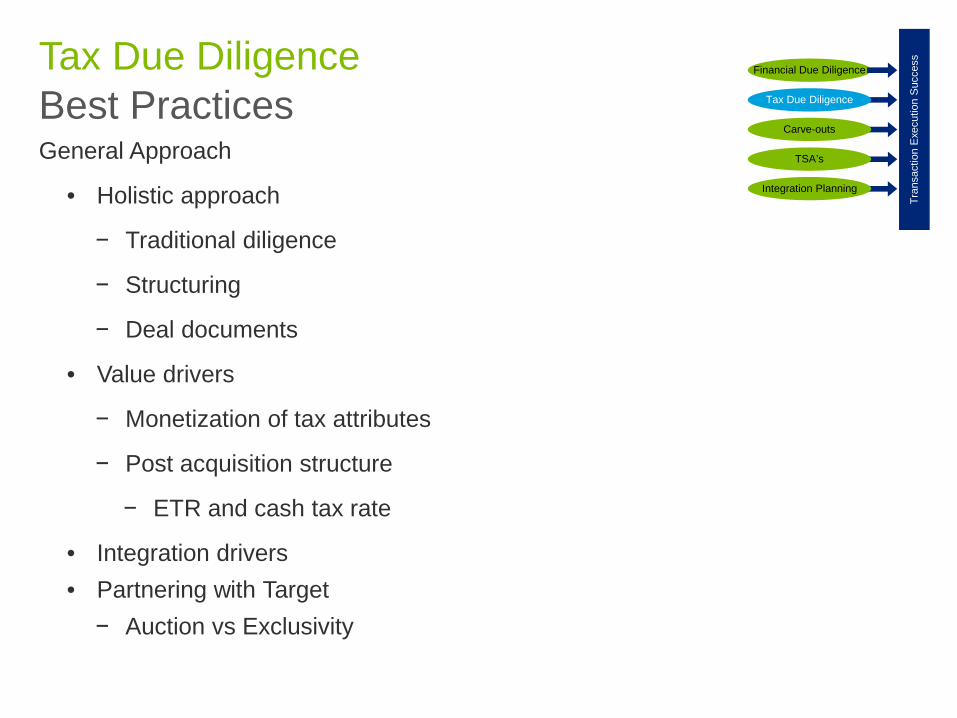
Tax Due DiligenceBest PracticesGeneral Approach
• Holistic approach
− Traditional diligence
− Structuring
− Deal documents
• Value drivers
− Monetization of tax attributes
− Post acquisition structure
− ETR and cash tax rate
• Integration drivers• Partnering with Target
− Auction vs Exclusivity
Financial Due Diligence
Tax Due Diligence
Carve-outs
TSA’s
Integration Planning
Tran
sact
ion
Exec
utio
n Su
cces
s

Tax Due DiligenceTriaging critical issues in a time sensitive environmentTypical tax issues
• Review / analysis of tax returns• Status of tax examinations• Focus on unusual transactions• Transfer pricing (state and foreign)• Determination of booking of proper
reserves• Material tax attributes, including
NOLs, credits, etc.• Tax rulings, changes in accounting
methods, elections, reportable transactions, etc.
• Non-US taxes, i.e., countries to include
Industry Specific Tax Issues• Revenue Recognition• SOFA• Domestic Production Activities• State Apportionment• Meals and Entertainment• Deferred Revenue
Financial Due Diligence
Tax Due Diligence
Carve-outs
TSA’s
Integration Planning
Tran
sact
ion
Exec
utio
n Su
cces
s

The primary goal when divesting a business is to capture the highest value possible in the most efficient process.
• To achieve the highest value possible the divestiture approach should focus on (1) expediting the sale process, (2) managing regulatory pathways, and (3) pro-actively tackling separation issues.
• Well-prepared sellers are in a better position to withstand the challenges that are raised by potential buyers during the process.
Divestiture Goals and Strategy
Quality ofearnings
Tax Structure
Workingcapital
Financialcarve-outconsiderations
• Being prepared with accurate, well-presented financial information is critical to avoiding surprises and keeping buyers engaged in the sales process.
• Presenting cohesive, consistent financial data, including audited financials where needed by buyers or regulators, is necessary to meet all stakeholders’ needs.
Financial Due Diligence
Tax Due Diligence
Carve-outs
TSA’s
Integration Planning
Tran
sact
ion
Exec
utio
n Su
cces
s
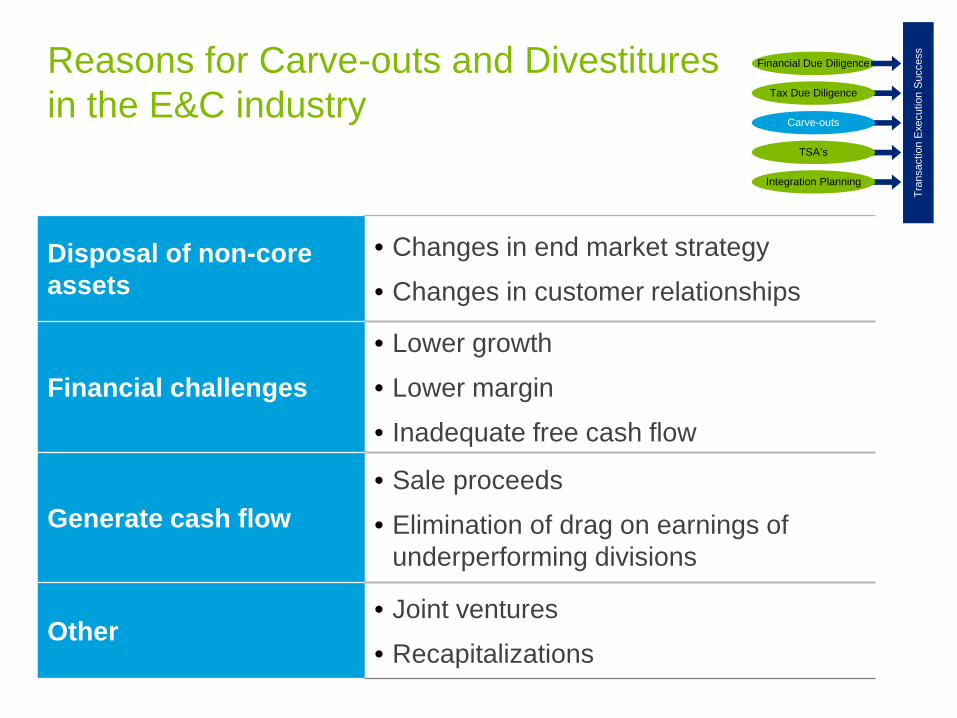
Disposal of non-core assets
• Changes in end market strategy• Changes in customer relationships
Financial challenges• Lower growth• Lower margin• Inadequate free cash flow
Generate cash flow• Sale proceeds• Elimination of drag on earnings of
underperforming divisions
Other• Joint ventures• Recapitalizations
Reasons for Carve-outs and Divestitures in the E&C industry
Financial Due Diligence
Tax Due Diligence
Carve-outs
TSA’s
Integration Planning
Tran
sact
ion
Exec
utio
n Su
cces
s

Questions to consider when divesting a business
Financial Due Diligence
Tax Due Diligence
Carve-outs
TSA’s
Integration Planning
Tran
sact
ion
Exec
utio
n Su
cces
s
• How is the business operated currently?
• How involved will the management team be in the prep process?
• What issues exist within the business that add complexity?
• What type of sale process is going to be run?
• What timeline factors exist that may drive process?
• Who is going to be the likely type of buyer?
• Will seller or vendor due diligence be required
• Are external resources needed?

When preparing for a Carve Out, the use of a TSA (Transition Service Agreement) can be highly effective.
Transition Service Agreements (TSAs)
• When purchasing a “Carve Out”, the division is often incomplete
• Numerous functions and services may be currently provided by the parent, or another division
− Human Resources
− Legal Services
− Information Technology
− Facilities
• A TSA can be used to have the Seller (and it’s providers) continue to provide services to the divested business unit
Carved Out DivisionRemaining Division A
Division “Carved out”
Financial Due Diligence
Tax Due Diligence
Carve-outs
TSA’s
Integration Planning
Tran
sact
ion
Exec
utio
n Su
cces
s

In a Carve-out situation, you have to plan for every function post separation: who, what, where, why, and how.
Planning for your Carve Out –Using TSAs
Typical Day 1 considerationsFunction Covered by TSA
Finance • Financial reporting applications / systems
• Treasury Management / Banking and cash management agreements / processes
• Procurement
• Yes
• No
• No
Human Resources
• Salary Administration / Payroll
• Benefit Plans
• HR and benefits systems
• Employee communications for New Co
• No
• Yes
• Yes
• No
Information Technology
• Electronic communications / email
• Internet connectivity
• Custom Software Suite development toolkit
• Helpdesk operations
• No
• Yes
• No
• No
Facilities • Office space
• Data center space
• Yes
• Yes
Financial Due Diligence
Tax Due Diligence
Carve-outs
TSA’s
Integration Planning
Tran
sact
ion
Exec
utio
n Su
cces
s

There are numerous considerations when structuring TSAs (or TSA schedules); timing, cost, other obligations, etc.
TSAs – Leading Practices
• How long will it take to replace the service?• How long can the parent provide the service?• What if we can take over the function sooner?• Should this be a permanent arrangement?
Timing Considerations
• How much will the Seller charge? • Will the cost escalate over time?• How much does it cost to provide?• How much will it cost to replace?
Cost Considerations
• Outsourcing vs. TSAs – any advantage?• Other Services required? (System conversion assistance for
example)• Other providers involved? (IT and HR third party providers)
Other Areas to Consider
Financial Due Diligence
Tax Due Diligence
Carve-outs
TSA’s
Integration Planning
Tran
sact
ion
Exec
utio
n Su
cces
s
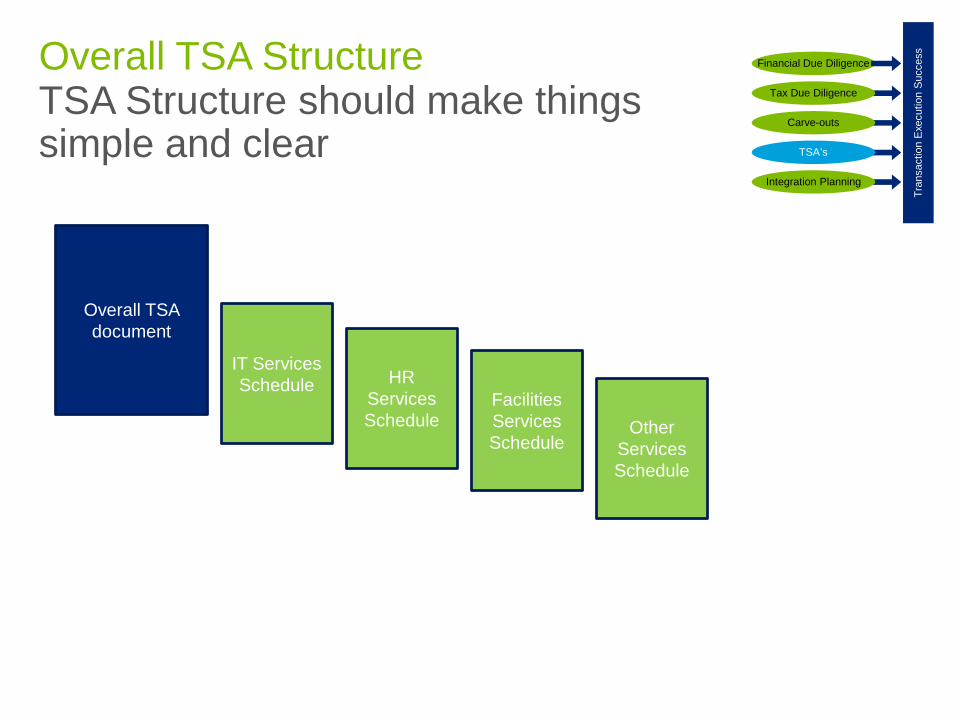
Overall TSA StructureTSA Structure should make things simple and clear
Overall TSA document
IT Services Schedule HR
Services Schedule
Facilities Services Schedule
Other Services Schedule
Financial Due Diligence
Tax Due Diligence
Carve-outs
TSA’s
Integration Planning
Tran
sact
ion
Exec
utio
n Su
cces
s

Launch a command & control Integration Management Office
Develop clear project governance, structure and planning process Establish guiding principles to set boundaries for the integration process Establish a dedicated integration team (advisors and management) Empower team members to lead decision making with the business / functions
Develop clear vision of end-state, aligned with integration vision and key objectives Address near-term, mid-term and long term integration financial targets; develop a
view on practical steps to drive to end-state Integrate dependencies across business and functions
Set a Rigorous Pace and Cadence
Adopt a deliberate and aggressive pace within the integration program Speed doesn’t mean rushing to make bad decisions, or languishing in uncertainty
based on less than perfect information Drive routine and regular program reviews focused on collaboration and transparency
Develop integration blueprint and define end-state
Focus to build agrowth platform
Maintain continuity and ensure revenue preservation Assess strategic investment plans of acquired business, refocus investments to fastest
growing areas Identify underserved markets and exploit market expertise across brands
1
2
3
5
Leading Practices Key Considerations / Actions
Create an employee experience that facilitates organizational and change management
Customize message delivery and content across all stakeholders to reduce uncertainty and manage risk
Draft the next generation of leaders through the organizational selection approach Retain key leaders and talent; and identify change management needs
6
Drive synergy opportunities, while managing business risk
Develop cost baselines and aggressively identify synergy opportunities Focus on quick wins and stretch targets to support longer-term synergy opportunities Maximize value through tax efficient integration Develop holistic budget upfront; and build synergies into financial plans
4
Leading practices serve as the foundation for managing a successful integration and maximizing value capture Integration Planning & Execution

Panel DiscussionQ&A