2016 DBIR: Understand Your Cybersecurity Threats | Verizon ...
85
2016 Data Breach Investigations Report 89% of breaches had a financial or espionage motive.
Transcript of 2016 DBIR: Understand Your Cybersecurity Threats | Verizon ...
2016 Data Breach Investigations Report89% of breaches had a financial or espionage motive.
Verizon 2016 Data Breach Investigations Report i
2016 DBIR Contributors(See Appendix B for a detailed list.)
Verizon 2016 Data Breach Investigations Report ii
Verizon 2016 Data Breach Investigations Report iii
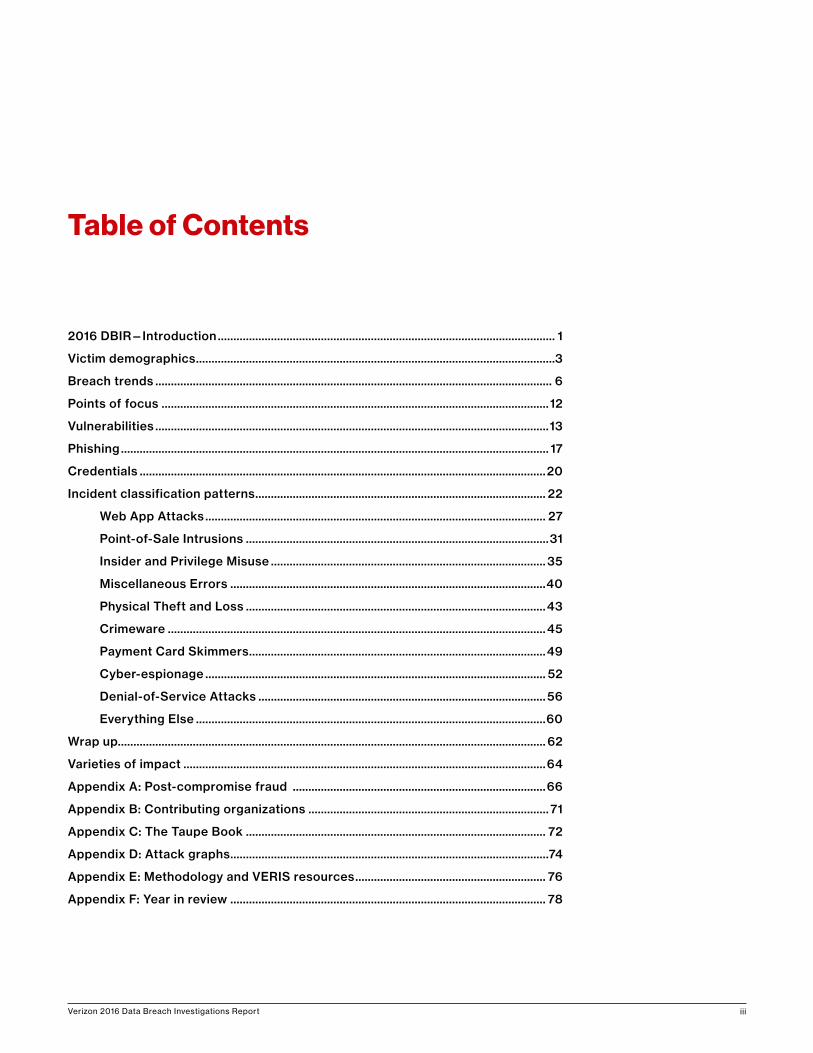
Table of Contents
2016 DBIR—Introduction ............................................................................................................ 1
Victim demographics ...................................................................................................................3
Breach trends ............................................................................................................................... 6
Points of focus ............................................................................................................................ 12
Vulnerabilities ..............................................................................................................................13
Phishing ......................................................................................................................................... 17
Credentials ..................................................................................................................................20
Incident classification patterns ............................................................................................. 22
Web App Attacks ............................................................................................................. 27
Point-of-Sale Intrusions .................................................................................................31
Insider and Privilege Misuse ........................................................................................ 35
Miscellaneous Errors .....................................................................................................40
Physical Theft and Loss ................................................................................................43
Crimeware .........................................................................................................................45
Payment Card Skimmers ...............................................................................................49
Cyber-espionage ............................................................................................................. 52
Denial-of-Service Attacks ............................................................................................ 56
Everything Else ................................................................................................................60
Wrap up......................................................................................................................................... 62
Varieties of impact ....................................................................................................................64
Appendix A: Post-compromise fraud .................................................................................66
Appendix B: Contributing organizations ............................................................................. 71
Appendix C: The Taupe Book ................................................................................................ 72
Appendix D: Attack graphs ......................................................................................................74
Appendix E: Methodology and VERIS resources ............................................................. 76
Appendix F: Year in review ..................................................................................................... 78
Verizon 2016 Data Breach Investigations Report 1
Well here we are again, and it is time to take the annual journey into our collection of real-world data breaches and information security incidents from the prior year. We have published this report nine times1 and we truly appreciate you spending your valuable time with us, whether you have been with us since our humble, pie-chart-centric beginnings or if this is your first read.
We would be remiss if we did not begin by acknowledging the organizations that contributed data (and time) to this publication. Simply stated, we thank you for helping to make this possible. For a full list of contributors, mosey over to Appendix B.
The incident data is the workhorse of this report and is used to build out all the information within the Breach Trends and Incident Classification Patterns sections. We use non-incident security data to paint a fuller picture in the patterns as well as in stand-alone research. Any opportunity to take several organizations’ data and combine them for a research topic was pursued. The Gestalt principles in action!
The nine incident classification patterns we identified back in the 2014 report still reign supreme. And while there are no drastic shifts that have established a show-stopping talking point when looking at the patterns as a whole, we have searched for interesting tidbits in the actions that comprise them.
This year’s dataset is made up of over 100,000 incidents, of which 3,141 were confirmed data breaches. Of these, 64,199 incidents and 2,260 breaches comprise the finalized dataset that was used in the analysis and figures throughout the report. We address the reasons for culling the dataset in Victim Demographics and provide additional details when we discuss motives in Breach Trends. Of course, we would never suggest that every last security event of 2015 is in this report. We acknowledge sample bias, and provide information about our methodology as well as links to resources that we encourage you to look into to help collect and analyze incident data within your own organization, in Appendix E.
We will also acknowledge what isn’t in this report. For those looking for proclamations about this being the year that mobile attacks bring us to our knees or that the Internet of Things (IoT) is coming to kill us all, you will be disappointed. We still do not have significant real-world data on these
1 Nine times? Nine times.
2016 DBIR—Introduction
“It’s like déjà vu, all over again.” —Yogi Berra
The nine incident classification patterns we identified in 2014 still reign supreme.
Verizon 2016 Data Breach Investigations Report 2
technologies as the vector of attack on organizations.2 If you feel we are in error, put down the torches and pitchforks and share any breach data that you have. We are always looking for avenues to shine lights into areas in which we may not have sufficient illumination. Also, their absence is not a suggestion to ignore these areas in your risk management decision-making.
The report is designed so you can enjoy it like a prog-rock concept album, from beginning to end, or feel free to bounce around (the room). Enjoy the Breach Trends section for all your figure and chart needs. Get some knowledge on a few of the concepts that stretch across several patterns in our Points of Focus section and for those who want more factoids, pop over to the appendices and give our Taupe Book section a look.
2 Yes, we are aware of the xCode hack, but without confirmed organizations that suffered an attribute loss it will not be an influencer of this report.
Verizon 2016 Data Breach Investigations Report 3
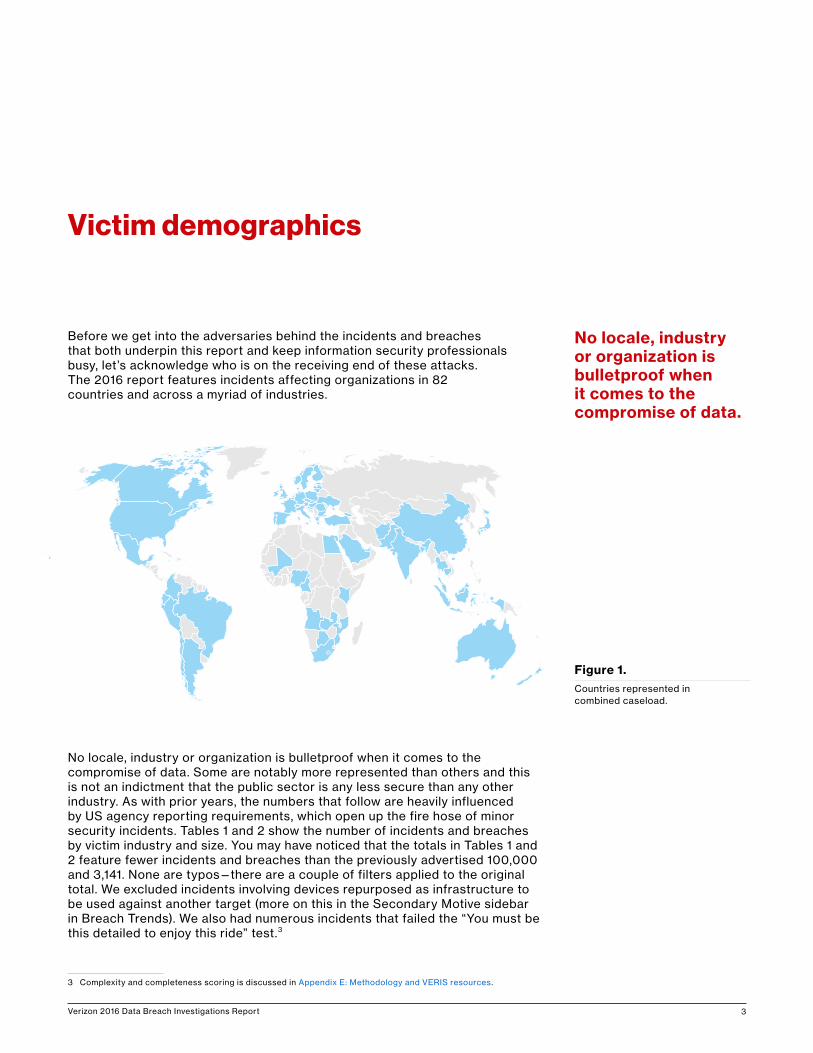
Before we get into the adversaries behind the incidents and breaches that both underpin this report and keep information security professionals busy, let’s acknowledge who is on the receiving end of these attacks. The 2016 report features incidents affecting organizations in 82 countries and across a myriad of industries.
No locale, industry or organization is bulletproof when it comes to the compromise of data. Some are notably more represented than others and this is not an indictment that the public sector is any less secure than any other industry. As with prior years, the numbers that follow are heavily influenced by US agency reporting requirements, which open up the fire hose of minor security incidents. Tables 1 and 2 show the number of incidents and breaches by victim industry and size. You may have noticed that the totals in Tables 1 and 2 feature fewer incidents and breaches than the previously advertised 100,000 and 3,141. None are typos—there are a couple of filters applied to the original total. We excluded incidents involving devices repurposed as infrastructure to be used against another target (more on this in the Secondary Motive sidebar in Breach Trends). We also had numerous incidents that failed the “You must be this detailed to enjoy this ride” test.3
3 Complexity and completeness scoring is discussed in Appendix E: Methodology and VERIS resources.
Victim demographics
Figure 1.Countries represented in combined caseload.
No locale, industry or organization is bulletproof when it comes to the compromise of data.
Verizon 2016 Data Breach Investigations Report 4
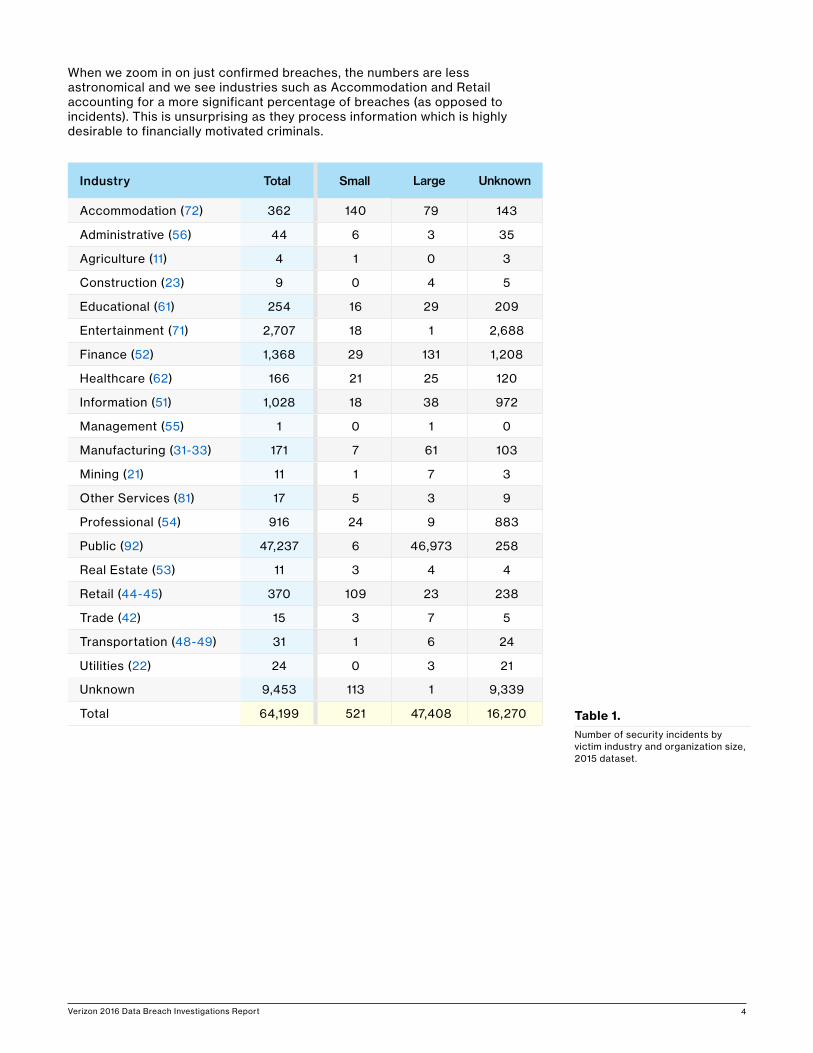
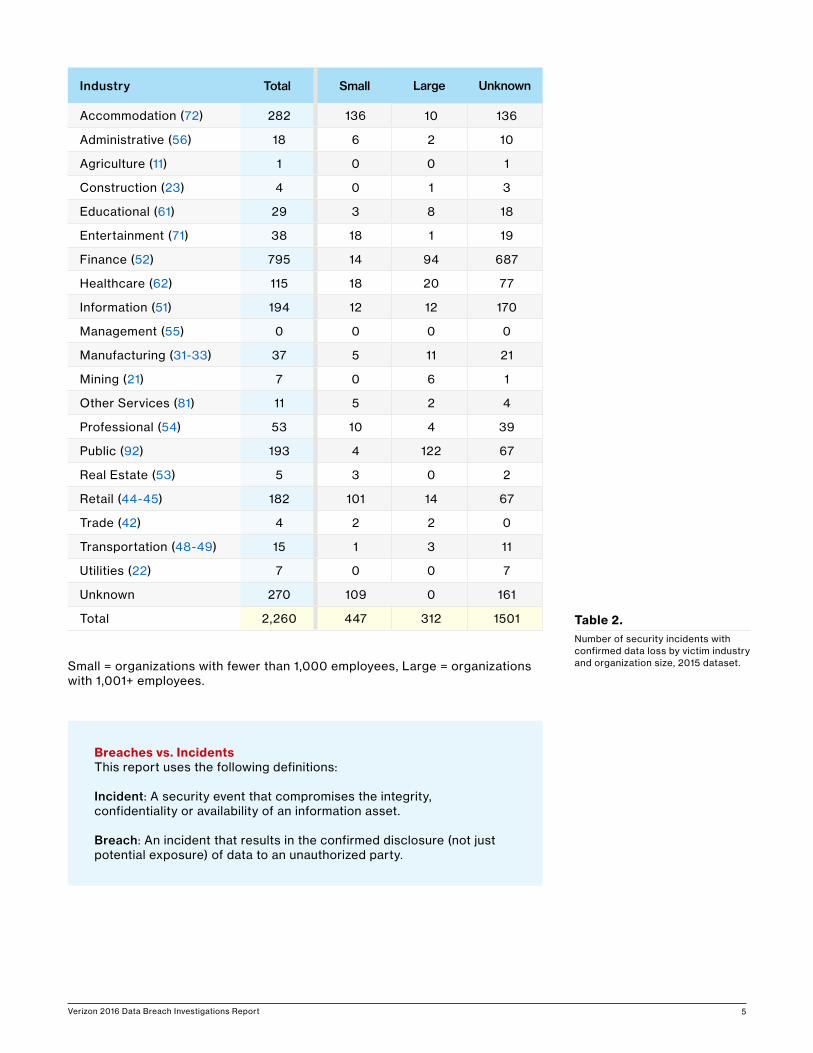
When we zoom in on just confirmed breaches, the numbers are less astronomical and we see industries such as Accommodation and Retail accounting for a more significant percentage of breaches (as opposed to incidents). This is unsurprising as they process information which is highly desirable to financially motivated criminals.
Industry Total Small Large Unknown
Accommodation (72) 362 140 79 143
Administrative (56) 44 6 3 35
Agriculture (11) 4 1 0 3
Construction (23) 9 0 4 5
Educational (61) 254 16 29 209
Entertainment (71) 2,707 18 1 2,688
Finance (52) 1,368 29 131 1,208
Healthcare (62) 166 21 25 120
Information (51) 1,028 18 38 972
Management (55) 1 0 1 0
Manufacturing (31-33) 171 7 61 103
Mining (21) 11 1 7 3
Other Services (81) 17 5 3 9
Professional (54) 916 24 9 883
Public (92) 47,237 6 46,973 258
Real Estate (53) 11 3 4 4
Retail (44-45) 370 109 23 238
Trade (42) 15 3 7 5
Transportation (48-49) 31 1 6 24
Utilities (22) 24 0 3 21
Unknown 9,453 113 1 9,339
Total 64,199 521 47,408 16,270 Table 1.Number of security incidents by victim industry and organization size, 2015 dataset.
Verizon 2016 Data Breach Investigations Report 5
Industry Total Small Large Unknown
Accommodation (72) 282 136 10 136
Administrative (56) 18 6 2 10
Agriculture (11) 1 0 0 1
Construction (23) 4 0 1 3
Educational (61) 29 3 8 18
Entertainment (71) 38 18 1 19
Finance (52) 795 14 94 687
Healthcare (62) 115 18 20 77
Information (51) 194 12 12 170
Management (55) 0 0 0 0
Manufacturing (31-33) 37 5 11 21
Mining (21) 7 0 6 1
Other Services (81) 11 5 2 4
Professional (54) 53 10 4 39
Public (92) 193 4 122 67
Real Estate (53) 5 3 0 2
Retail (44-45) 182 101 14 67
Trade (42) 4 2 2 0
Transportation (48-49) 15 1 3 11
Utilities (22) 7 0 0 7
Unknown 270 109 0 161
Total 2,260 447 312 1501
Small = organizations with fewer than 1,000 employees, Large = organizations with 1,001+ employees.
Table 2.Number of security incidents with confirmed data loss by victim industry and organization size, 2015 dataset.
Breaches vs. IncidentsThis report uses the following definitions:
Incident: A security event that compromises the integrity, confidentiality or availability of an information asset.
Breach: An incident that results in the confirmed disclosure (not just potential exposure) of data to an unauthorized party.
Verizon 2016 Data Breach Investigations Report 6
Breach trends
Playing a part on the blue team in information security can, to a very small degree, be compared to the lot of a hapless soldier. The soldier is told to guard a certain hill and to keep it at all costs. However, he is not told who his enemy may be, what they look like, where they are coming from, or when (or how) they are likely to strike. To ride this analogous horse a bit further, the soldier is given a hand-me-down rifle with only a few rounds of ammunition to fulfill his task. It seems a bit unfair really—even the American Revolution got Paul Revere.
With that in mind, we hope that this section and the facts and figures contained in it will go some way toward making you better prepared than our friend mentioned above. After all, “forewarned is forearmed.”
A brief primer on VERISThis section, and many that follow, are based on the Vocabulary for Event Recording and Incident Sharing, or VERIS for short. VERIS is a framework to record and share your security events, incidents and breaches in a repeatable manner. It asks the question, what threat Actor took what Action on what Asset compromising what Attribute? We commonly refer to those as the 4As. In addition to the 4As, it captures timeline, victim demographics, discovery method, impact data and much more.
There are a lot of tools available for VERIS. Methods for creating, importing and analyzing the data are all freely available. More on that in Appendix E: Methodology and VERIS resources.
Be prepared: forewarned is forearmed.
Verizon 2016 Data Breach Investigations Report 7
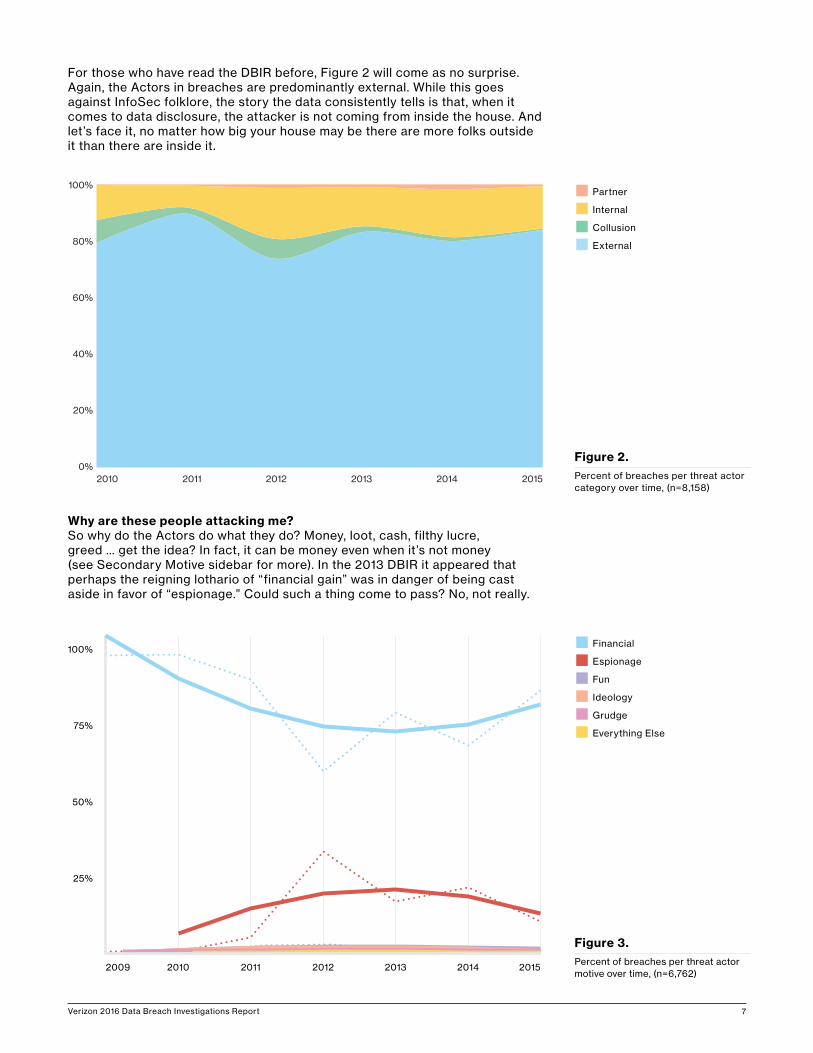
Figure 2.Percent of breaches per threat actor category over time, (n=8,158)
Figure 3.Percent of breaches per threat actor motive over time, (n=6,762)
For those who have read the DBIR before, Figure 2 will come as no surprise. Again, the Actors in breaches are predominantly external. While this goes against InfoSec folklore, the story the data consistently tells is that, when it comes to data disclosure, the attacker is not coming from inside the house. And let’s face it, no matter how big your house may be there are more folks outside it than there are inside it.
Why are these people attacking me? So why do the Actors do what they do? Money, loot, cash, filthy lucre, greed … get the idea? In fact, it can be money even when it’s not money (see Secondary Motive sidebar for more). In the 2013 DBIR it appeared that perhaps the reigning lothario of “financial gain” was in danger of being cast aside in favor of “espionage.” Could such a thing come to pass? No, not really.
2010 2011 2012 2013 2014 20150%
20%
40%
60%
80%
100%
25%
50%
75%
100%
2009 2010 2011 2012 2013 2014 2015
n Financial
n Espionage
n Fun
n Ideology
n Grudge
n Everything Else
n Partner
n Internal
n Collusion
n External
Verizon 2016 Data Breach Investigations Report 8
There was never any real danger of the financial motive losing its prominence, as even at its peak, espionage remained a far distant second. As illustrated by Figure 3, breaches with a financial motive dominate everything else, including espionage and fun.
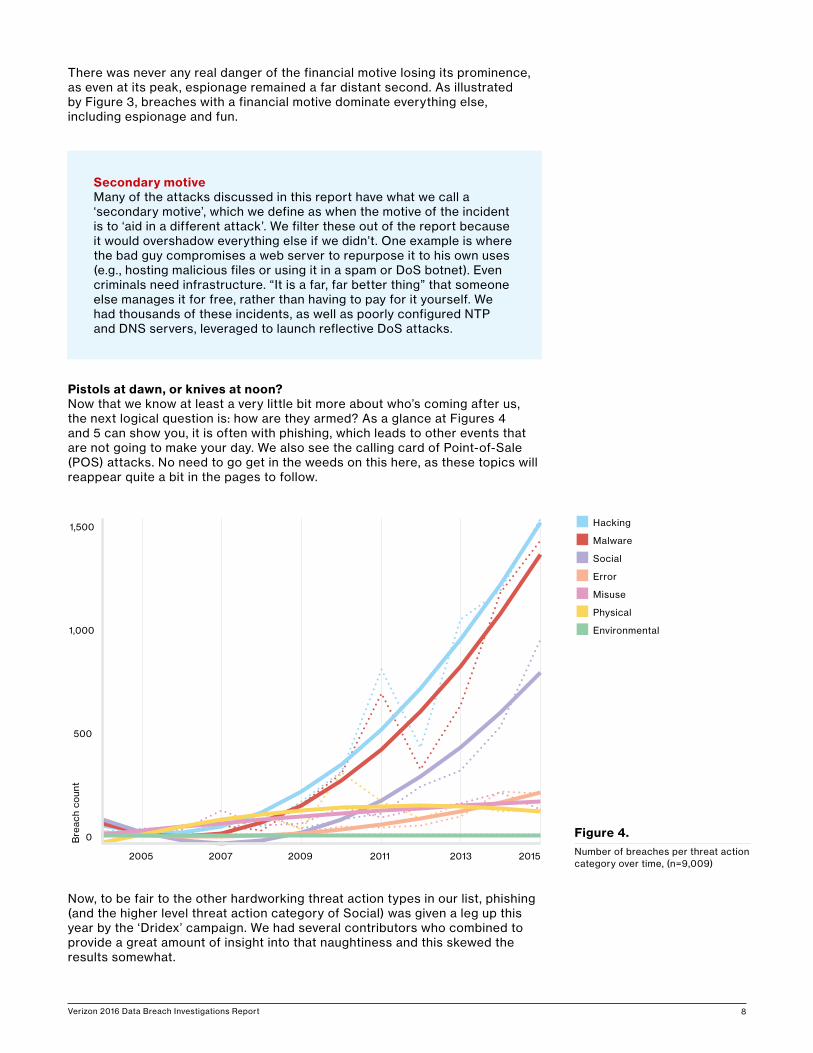
Pistols at dawn, or knives at noon?Now that we know at least a very little bit more about who’s coming after us, the next logical question is: how are they armed? As a glance at Figures 4 and 5 can show you, it is often with phishing, which leads to other events that are not going to make your day. We also see the calling card of Point-of-Sale (POS) attacks. No need to go get in the weeds on this here, as these topics will reappear quite a bit in the pages to follow.
Now, to be fair to the other hardworking threat action types in our list, phishing (and the higher level threat action category of Social) was given a leg up this year by the ‘Dridex’ campaign. We had several contributors who combined to provide a great amount of insight into that naughtiness and this skewed the results somewhat.
Figure 4.Number of breaches per threat action category over time, (n=9,009)
Secondary motiveMany of the attacks discussed in this report have what we call a ‘secondary motive’, which we define as when the motive of the incident is to ‘aid in a different attack’. We filter these out of the report because it would overshadow everything else if we didn’t. One example is where the bad guy compromises a web server to repurpose it to his own uses (e.g., hosting malicious files or using it in a spam or DoS botnet). Even criminals need infrastructure. “It is a far, far better thing” that someone else manages it for free, rather than having to pay for it yourself. We had thousands of these incidents, as well as poorly configured NTP and DNS servers, leveraged to launch reflective DoS attacks.
0
500
1,000
1,500
2005 2007 2009 2011 2013 2015
Bre
ach
coun
t
n Hacking
n Malware
n Social
n Error
n Misuse
n Physical
n Environmental
Verizon 2016 Data Breach Investigations Report 9
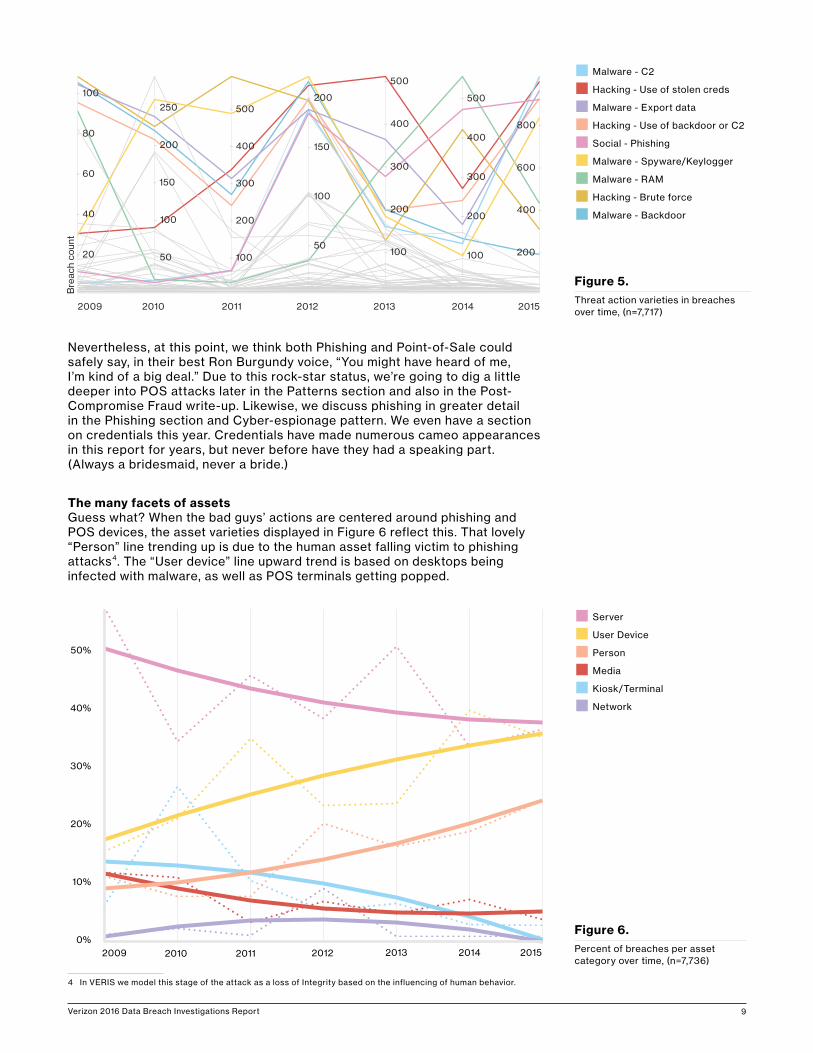
Nevertheless, at this point, we think both Phishing and Point-of-Sale could safely say, in their best Ron Burgundy voice, “You might have heard of me, I’m kind of a big deal.” Due to this rock-star status, we’re going to dig a little deeper into POS attacks later in the Patterns section and also in the Post-Compromise Fraud write-up. Likewise, we discuss phishing in greater detail in the Phishing section and Cyber-espionage pattern. We even have a section on credentials this year. Credentials have made numerous cameo appearances in this report for years, but never before have they had a speaking part. (Always a bridesmaid, never a bride.)
The many facets of assetsGuess what? When the bad guys’ actions are centered around phishing and POS devices, the asset varieties displayed in Figure 6 reflect this. That lovely “Person” line trending up is due to the human asset falling victim to phishing attacks4. The “User device” line upward trend is based on desktops being infected with malware, as well as POS terminals getting popped.
4 In VERIS we model this stage of the attack as a loss of Integrity based on the influencing of human behavior.
Figure 5.Threat action varieties in breaches over time, (n=7,717)2009 2012 2015
Bre
ach
coun
t
2010 2011 2013 2014
- 20
- 40
- 60
- 80
- 100
- 50
- 100
- 150
- 200
- 250
- 100
- 200
- 300
- 400
- 500
- 50
- 100
- 150
- 200
- 100
- 200
- 300
- 400
- 500
- 100
- 200
- 300
- 400
- 500
200 -
400 -
600 -
800 -
n Malware - C2
n Hacking - Use of stolen creds
n Malware - Export data
n Hacking - Use of backdoor or C2
n Social - Phishing
n Malware - Spyware/Keylogger
n Malware - RAM
n Hacking - Brute force
n Malware - Backdoor
0%
10%
20%
30%
40%
50%
2009 20122010 2011 2013 2014 2015
Figure 6.Percent of breaches per asset category over time, (n=7,736)
n Server
n User Device
n Person
n Media
n Kiosk/Terminal
n Network
Verizon 2016 Data Breach Investigations Report 10
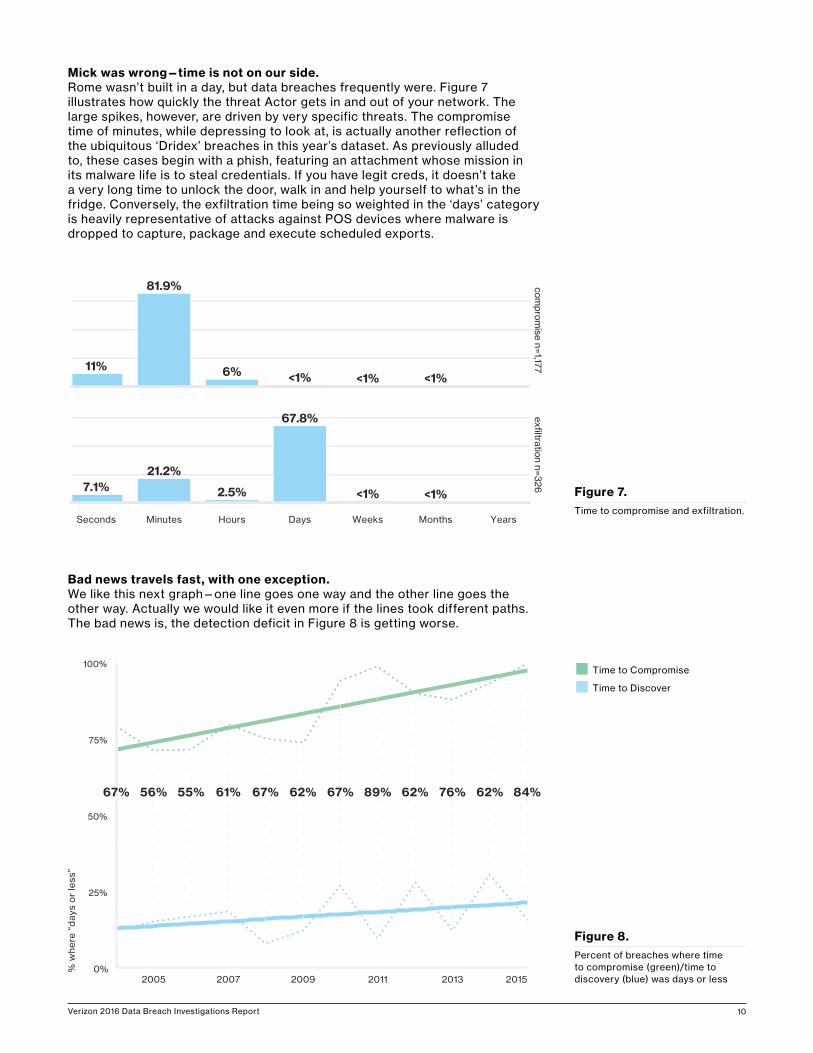
Mick was wrong—time is not on our side. Rome wasn’t built in a day, but data breaches frequently were. Figure 7 illustrates how quickly the threat Actor gets in and out of your network. The large spikes, however, are driven by very specific threats. The compromise time of minutes, while depressing to look at, is actually another reflection of the ubiquitous ‘Dridex’ breaches in this year’s dataset. As previously alluded to, these cases begin with a phish, featuring an attachment whose mission in its malware life is to steal credentials. If you have legit creds, it doesn’t take a very long time to unlock the door, walk in and help yourself to what’s in the fridge. Conversely, the exfiltration time being so weighted in the ‘days’ category is heavily representative of attacks against POS devices where malware is dropped to capture, package and execute scheduled exports.
Bad news travels fast, with one exception.We like this next graph—one line goes one way and the other line goes the other way. Actually we would like it even more if the lines took different paths. The bad news is, the detection deficit in Figure 8 is getting worse.
Figure 7.Time to compromise and exfiltration.
<1%6%
81.9%
<1%11%
<1%
67.8%
2.5%
21.2%
<1%7.1% <1%
comprom
ise n=1,177exfiltration n=326
Seconds Minutes Hours Days Weeks Months Years
0%
25%
50%
75%
100%
% w
here
“d
ays
or
less
”
67% 56% 55% 61% 67% 62% 67% 89% 62% 76% 62% 84%
2005 2007 2009 2011 2013 2015
Figure 8.Percent of breaches where time to compromise (green)/time to discovery (blue) was days or less
n Time to Compromise
n Time to Discover
Verizon 2016 Data Breach Investigations Report 11
In the 2015 report, we mentioned that there was some improvement in discovery in the ‘days or less’ category, however, that improvement was short-lived. We also pointed out that we would need more than one year’s data to verify that as a definite trend and sadly we did not get that verification. Moreover, readers with excellent memories will notice that the deficit in 2014 grew from last year’s report. Data for the year-to-year graphs is filtered by incident year (i.e., when the compromise occurred). We continue to add incidents and breaches to prior calendar years post-report to enrich our data. Also, some breaches will occur late in the year and are discovered the next year.
To add another ray to this sunbeam, attackers are getting even quicker at compromising their victims. When you review the leading threat actions again, this really won’t come as a surprise. The phishing scenario is going to work quickly, with the dropping of malware via malicious attachments occurring within seconds. Physical compromises of ATMs and gas pumps also happen in seconds. In the majority of confirmed data breaches, the modus operandi of nation-states as well as financially motivated attackers is to establish control via malware and, when successful, it is lightning fast. As this figure is for confirmed breaches only, it makes sense that the time to compromise is almost always days or less (if not minutes or less). If—and some have called “if” the biggest word in the language—there’s any good news, it’s that the number of breaches staying open months or more continues to decline slightly.
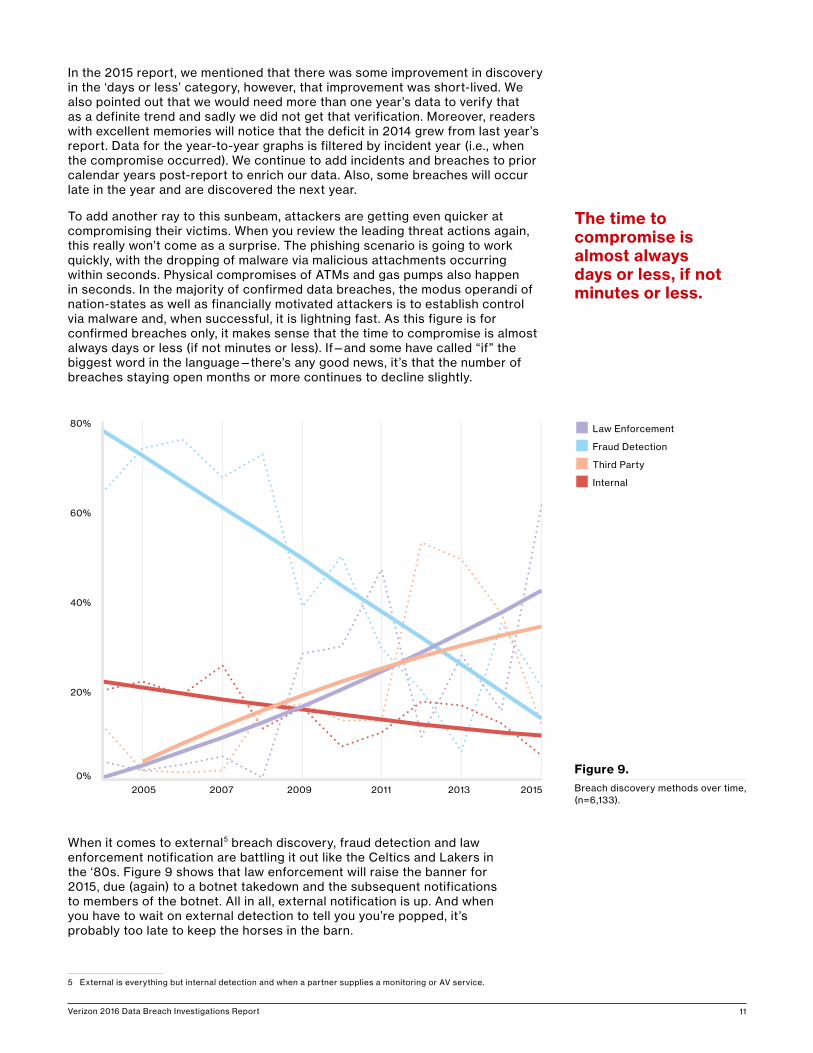
When it comes to external5 breach discovery, fraud detection and law enforcement notification are battling it out like the Celtics and Lakers in the ‘80s. Figure 9 shows that law enforcement will raise the banner for 2015, due (again) to a botnet takedown and the subsequent notifications to members of the botnet. All in all, external notification is up. And when you have to wait on external detection to tell you you’re popped, it’s probably too late to keep the horses in the barn.
5 External is everything but internal detection and when a partner supplies a monitoring or AV service.
The time to compromise is almost always days or less, if not minutes or less.
0%
20%
40%
60%
80%
2005 2007 2009 2011 2013 2015
Figure 9.Breach discovery methods over time, (n=6,133).
n Law Enforcement
n Fraud Detection
n Third Party
n Internal
Verizon 2016 Data Breach Investigations Report 12
One last thing before we get to the patterns. There are a couple of topics that are omnipresent in many of the patterns that we use to classify incidents. While they will receive credit where credit is due, in the pattern sections, we feel that we also need to put the spotlight on them here.
We have numerous breaches where we can infer that some Common Vulnerabilities and Exposures (CVE) were used in order for the attack to advance. Hey, we’re looking at you, drive-by downloads! Unfortunately, we don’t have a tremendous amount of CVE data in our corpus, either because it was not measured or was unable to be identified. This lack of detail makes us an embarrassment of sad pandas. (Yes, we wanted to say “sleuth”, but apparently we can’t. Look it up.) Luckily we have contributors in the vulnerability space that can lighten our mood.
Phishing has continued to trend upward (like spawning salmon?) and is found in the most opportunistic attacks as well as the sophisticated nation state tomfoolery. We feature a section where we dive into the human element a bit deeper, with some data on our innate need to click stuff.
Lastly, we strike a deceased equine a bit more with a section on credentials (of the static variety). Don’t get us wrong—passwords are great, kind of like salt. Wonderful as an addition to something else, but you wouldn’t consume it on its own.
Points of focus
We don’t have a tremendous amount of CVE data because it wasn’t measured or was unable to be identified.
Verizon 2016 Data Breach Investigations Report 13
MethodologyThe visualizations and statements regarding rates of exploitation in this section are underpinned by vulnerability exploitation data provided by Kenna Security. This dataset spans millions of successful real-world exploitations, and is derived from hunting down exploitation signatures in security information and event management (SIEM) logs and correlating those with vulnerability scan data to find pairings that would be indicative of a successful exploitation.
The tortoise and the hareVulnerability management has been a Sisyphean endeavor for decades. Attacks come in millions, exploits are automated and every enterprise is subject to the wrath of the quick-to-catch-on hacker. What’s worse, new vulnerabilities come out every day. Since the first DBIR, we’ve been advocating the turtle’s approach to vulnerability management (slow and steady wins the race).
This year we revisit this data to see whether the trends hold, but in typical DBIR fashion, we dig a little deeper, to look at not just how attackers are interacting with vulnerabilities (exploitation), but also how well and how fast enterprises are executing remediation. If we can measure both of these routinely, then we can provide much-needed answers about how the tortoise won the race—and so learn how to close the gap between attackers and enterprises.
Vulnerabilities
New vulnerabilities come out every day.
At a glance
DescriptionA look into software vulnerabilities, whether we are making any progress in addressing them and ways to improve.
Contributors
Kenna Security (formerly Risk I/O) collaborated with us again to leverage their vulnerability and exploitation data. We also utilized vulnerability scan data provided by Beyond Trust, Qualys and Tripwire in support of this section.
Key findings
Older vulnerabilities are still heavily targeted; a methodical patch approach that emphasizes consistency and coverage is more important than expedient patching.
Verizon 2016 Data Breach Investigations Report 14
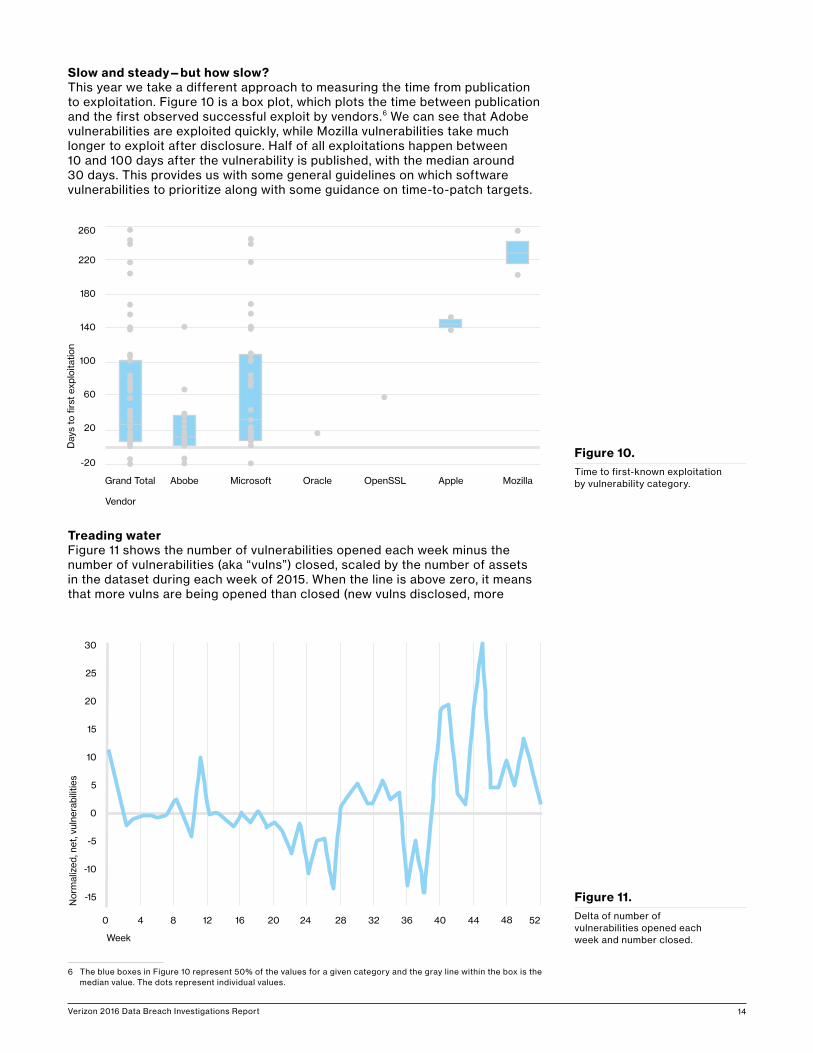
Slow and steady—but how slow?This year we take a different approach to measuring the time from publication to exploitation. Figure 10 is a box plot, which plots the time between publication and the first observed successful exploit by vendors.6 We can see that Adobe vulnerabilities are exploited quickly, while Mozilla vulnerabilities take much longer to exploit after disclosure. Half of all exploitations happen between 10 and 100 days after the vulnerability is published, with the median around 30 days. This provides us with some general guidelines on which software vulnerabilities to prioritize along with some guidance on time-to-patch targets.
Treading waterFigure 11 shows the number of vulnerabilities opened each week minus the number of vulnerabilities (aka “vulns”) closed, scaled by the number of assets in the dataset during each week of 2015. When the line is above zero, it means that more vulns are being opened than closed (new vulns disclosed, more
6 The blue boxes in Figure 10 represent 50% of the values for a given category and the gray line within the box is the median value. The dots represent individual values.
Figure 10.Time to first-known exploitation by vulnerability category.
-20
20
60
100
140
180
220
260
MozillaAppleOpenSSLOracleMicrosoft
Vendor
Day
s to
firs
t ex
ploi
tatio
n
AbobeGrand Total
0
-15
-10
-5
0
5
10
15
20
25
30
4 8 12 16 20 24 3228 36 40 44 48 52
Week
Nor
mal
ized
, net
, vul
nera
bilit
ies
Figure 11.Delta of number of vulnerabilities opened each week and number closed.
Verizon 2016 Data Breach Investigations Report 15
machines entering the environment, new software installed). When it’s below zero, remediation efforts are driving down vulnerability counts faster than new vulns are entering the enterprise.
Basically, we confirmed across multiple datasets that we are treading water—we aren’t sinking in new vulnerabilities, but we’re also not swimming to the land of instantaneous remediation and vuln-free assets. However, all that patching is for naught if we’re not patching the right things. If we’re going to tread, let’s tread wisely.
What should we mitigate? Hacker economics.So what are the right things? The 2015 DBIR gave us an idea and since then, not much has changed.
Revisiting last year’s trends, we find that the two golden rules of vulnerabilities still hold.
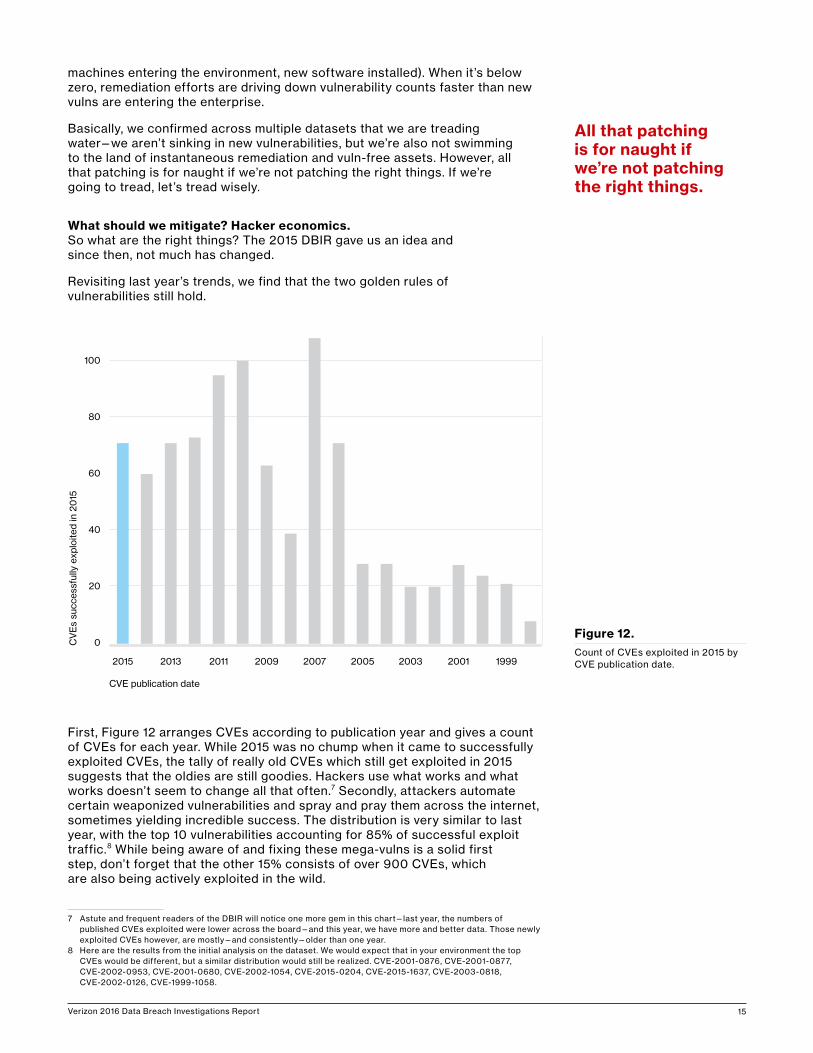
First, Figure 12 arranges CVEs according to publication year and gives a count of CVEs for each year. While 2015 was no chump when it came to successfully exploited CVEs, the tally of really old CVEs which still get exploited in 2015 suggests that the oldies are still goodies. Hackers use what works and what works doesn’t seem to change all that often.7 Secondly, attackers automate certain weaponized vulnerabilities and spray and pray them across the internet, sometimes yielding incredible success. The distribution is very similar to last year, with the top 10 vulnerabilities accounting for 85% of successful exploit traffic.8 While being aware of and fixing these mega-vulns is a solid first step, don’t forget that the other 15% consists of over 900 CVEs, which are also being actively exploited in the wild.
7 Astute and frequent readers of the DBIR will notice one more gem in this chart—last year, the numbers of published CVEs exploited were lower across the board—and this year, we have more and better data. Those newly exploited CVEs however, are mostly—and consistently—older than one year.
8 Here are the results from the initial analysis on the dataset. We would expect that in your environment the top CVEs would be different, but a similar distribution would still be realized. CVE-2001-0876, CVE-2001-0877, CVE-2002-0953, CVE-2001-0680, CVE-2002-1054, CVE-2015-0204, CVE-2015-1637, CVE-2003-0818, CVE-2002-0126, CVE-1999-1058.
CVE publication date
CV
Es
succ
essf
ully
exp
loite
d in
20
15
100
80
60
40
20
0
2015 2013 2011 2009 2007 2005 2003 2001 1999
Figure 12.Count of CVEs exploited in 2015 by CVE publication date.
All that patching is for naught if we’re not patching the right things.
Verizon 2016 Data Breach Investigations Report 16
We have received several criticisms on the data behind the exploitation rates, and how it has been presented in this section. It is not our intent for anyone to rely on the individual CVEs listed in Footnote 8 to base their vulnerability management strategy on (or any external list of CVE’s for that matter). Our full response to the criticisms as well as links to Kenna’s responses can be found here: https://securityblog.verizonenterprise.com/?p=7544
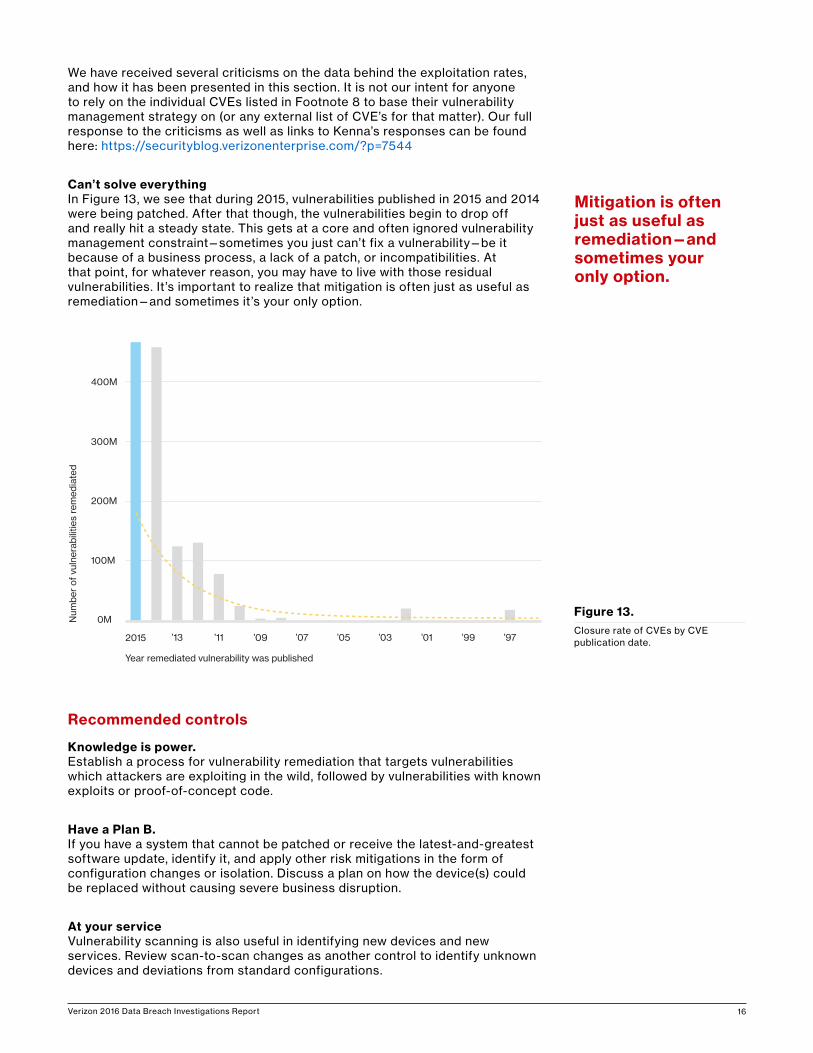
Can’t solve everythingIn Figure 13, we see that during 2015, vulnerabilities published in 2015 and 2014 were being patched. After that though, the vulnerabilities begin to drop off and really hit a steady state. This gets at a core and often ignored vulnerability management constraint—sometimes you just can’t fix a vulnerability—be it because of a business process, a lack of a patch, or incompatibilities. At that point, for whatever reason, you may have to live with those residual vulnerabilities. It’s important to realize that mitigation is often just as useful as remediation—and sometimes it’s your only option.
Recommended controls
Knowledge is power.Establish a process for vulnerability remediation that targets vulnerabilities which attackers are exploiting in the wild, followed by vulnerabilities with known exploits or proof-of-concept code.
Have a Plan B.If you have a system that cannot be patched or receive the latest-and-greatest software update, identify it, and apply other risk mitigations in the form of configuration changes or isolation. Discuss a plan on how the device(s) could be replaced without causing severe business disruption.
At your serviceVulnerability scanning is also useful in identifying new devices and new services. Review scan-to-scan changes as another control to identify unknown devices and deviations from standard configurations.
400M
300M
200M
100M
0M
Year remediated vulnerability was published
Num
ber
of v
ulne
rabi
litie
s re
med
iate
d
2015 ’13 ’11 ’09 ’07 ’05 ’03 ’01 ’99 ’97
Figure 13.Closure rate of CVEs by CVE publication date.
Mitigation is often just as useful as remediation—and sometimes your only option.
Verizon 2016 Data Breach Investigations Report 17
Phishing
You can’t fool all the people all the time. Or can you? Social engineering in its basic form is simply to dupe or trick someone into doing something they would not otherwise do (not unlike some online dating). Social tactics can take many forms such as pretexting,9 elicitation (the subtle art of extracting information from a subject via conversation), baiting (planting infected media in victim areas), and a myriad of other lowdown and dirty tricks. However, by far its most successful variety is phishing, which as the name implies is malicious correspondence trying to get the recipient to take the bait in the form of an attachment or embedded link. It is important to note that ‘pretexting’ via email (a back-and-forth dialogue leveraging an invented scenario to gain a certain end) and a phishing email are similar, but not the same. In the case of a pretexting email, the criminal is primarily purporting to be someone they are not, usually within the victim organization (e.g., the CFO who instructs the victim to approve a fraudulent Automated Clearing House (ACH) transfer).
Bummed is what you are… …when you click on that attachment and get owned. The basic structure of phishing attacks remains the same—user clicks, malware drops, foothold is
9 I’m Frieda's boss.
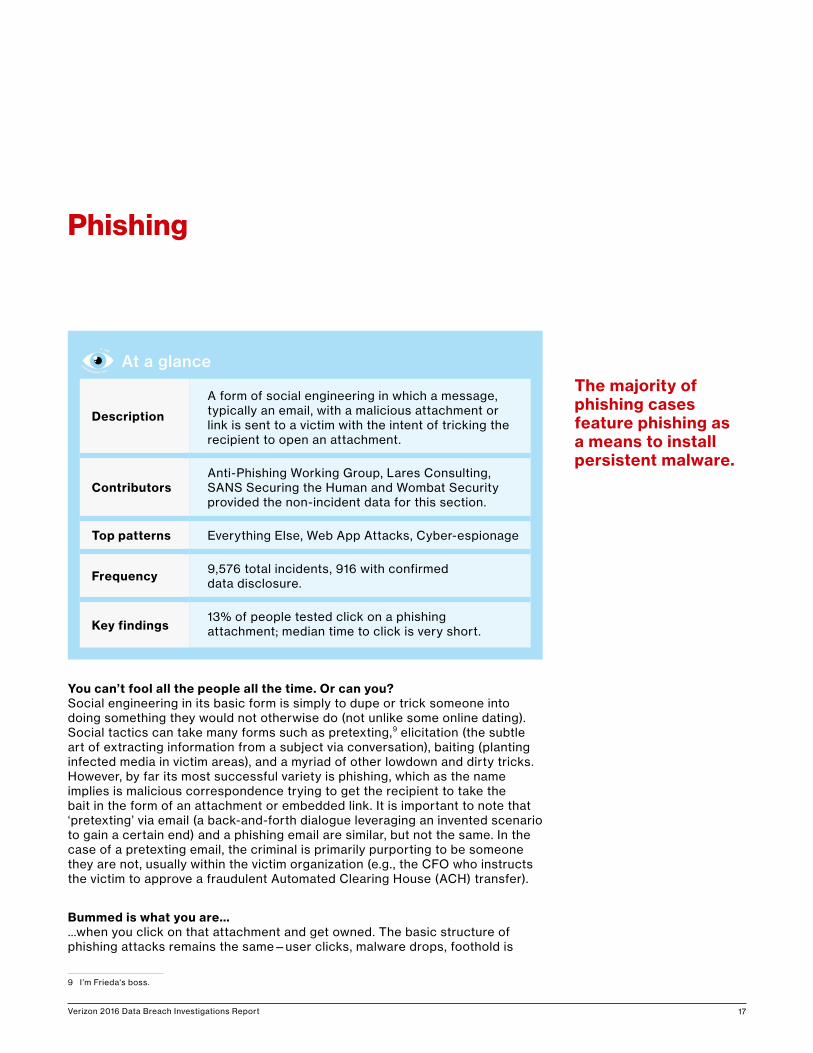
The majority of phishing cases feature phishing as a means to install persistent malware.
At a glance
Description
A form of social engineering in which a message, typically an email, with a malicious attachment or link is sent to a victim with the intent of tricking the recipient to open an attachment.
ContributorsAnti-Phishing Working Group, Lares Consulting, SANS Securing the Human and Wombat Security provided the non-incident data for this section.
Top patterns Everything Else, Web App Attacks, Cyber-espionage
Frequency 9,576 total incidents, 916 with confirmed data disclosure.
Key findings13% of people tested click on a phishing attachment; median time to click is very short.
Verizon 2016 Data Breach Investigations Report 18
gained. There are still cases where the phishing email leads users to phony sites, which are used to capture user input, but the majority of phishing cases in our data feature phishing as a means to install persistent malware. The victim opens the email, sees the attachment that contains the malware du jour and says “That file looks good, I’ll have that”. What happens next is dictated by the end goal of the phisher.
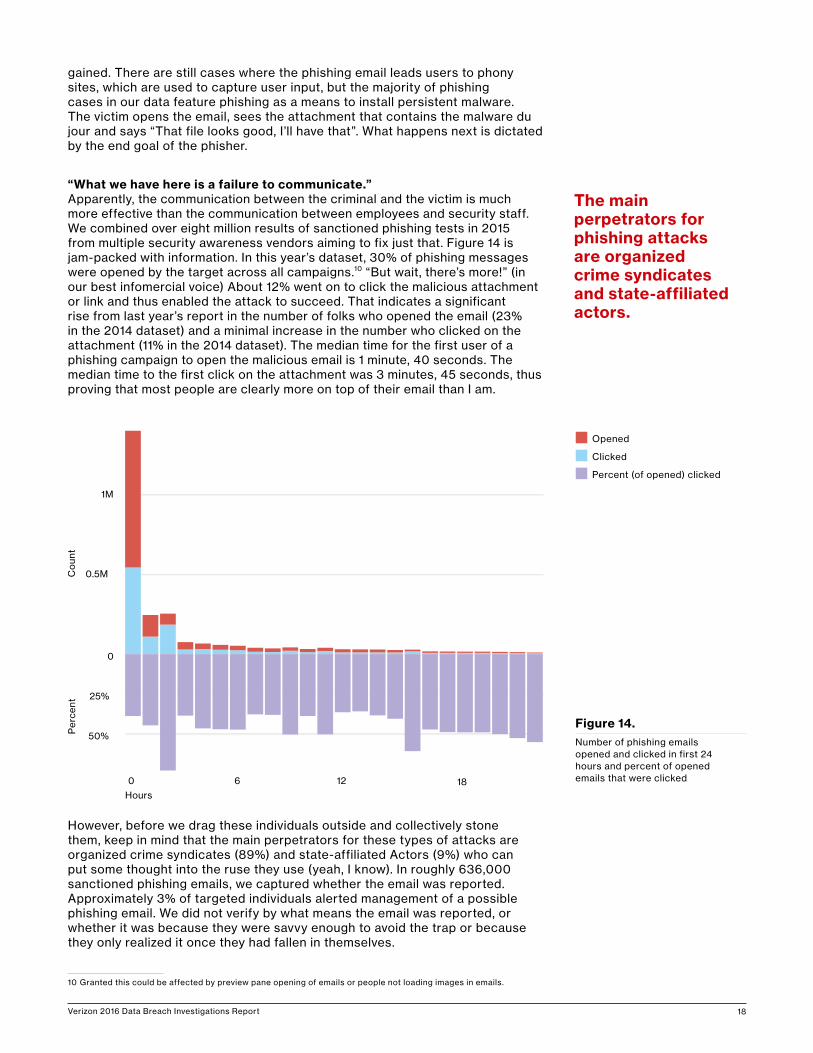
“What we have here is a failure to communicate.”Apparently, the communication between the criminal and the victim is much more effective than the communication between employees and security staff. We combined over eight million results of sanctioned phishing tests in 2015 from multiple security awareness vendors aiming to fix just that. Figure 14 is jam-packed with information. In this year’s dataset, 30% of phishing messages were opened by the target across all campaigns.10 “But wait, there’s more!” (in our best infomercial voice) About 12% went on to click the malicious attachment or link and thus enabled the attack to succeed. That indicates a significant rise from last year’s report in the number of folks who opened the email (23% in the 2014 dataset) and a minimal increase in the number who clicked on the attachment (11% in the 2014 dataset). The median time for the first user of a phishing campaign to open the malicious email is 1 minute, 40 seconds. The median time to the first click on the attachment was 3 minutes, 45 seconds, thus proving that most people are clearly more on top of their email than I am.
However, before we drag these individuals outside and collectively stone them, keep in mind that the main perpetrators for these types of attacks are organized crime syndicates (89%) and state-affiliated Actors (9%) who can put some thought into the ruse they use (yeah, I know). In roughly 636,000 sanctioned phishing emails, we captured whether the email was reported. Approximately 3% of targeted individuals alerted management of a possible phishing email. We did not verify by what means the email was reported, or whether it was because they were savvy enough to avoid the trap or because they only realized it once they had fallen in themselves.
10 Granted this could be affected by preview pane opening of emails or people not loading images in emails.
Figure 14.Number of phishing emails opened and clicked in first 24 hours and percent of opened emails that were clicked
50%
25%
0
0.5M
1M
0 12
Hours
Co
unt
Per
cent
6 18
n Opened
n Clicked
n Percent (of opened) clicked
The main perpetrators for phishing attacks are organized crime syndicates and state-affiliated actors.
Verizon 2016 Data Breach Investigations Report 19
As an aside, the smaller proportion of nation-state Actors in this year’s data is due to a large contribution from a particular contributor who saw a great deal of ‘Dridex’ campaigns which skewed the data toward organized crime. We should not conclude from this that certain groups from East Asia have had a crisis of conscience and mended their wicked ways.
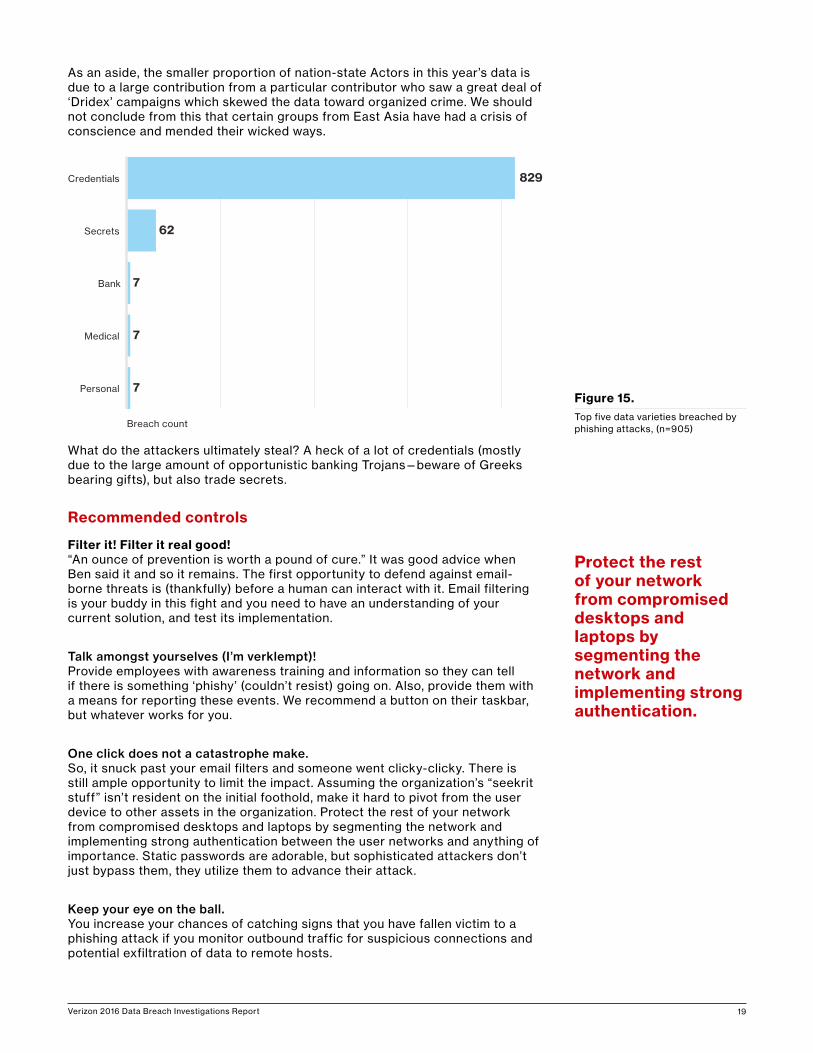
What do the attackers ultimately steal? A heck of a lot of credentials (mostly due to the large amount of opportunistic banking Trojans—beware of Greeks bearing gifts), but also trade secrets.
Recommended controls
Filter it! Filter it real good!“An ounce of prevention is worth a pound of cure.” It was good advice when Ben said it and so it remains. The first opportunity to defend against email-borne threats is (thankfully) before a human can interact with it. Email filtering is your buddy in this fight and you need to have an understanding of your current solution, and test its implementation.
Talk amongst yourselves (I’m verklempt)!Provide employees with awareness training and information so they can tell if there is something ‘phishy’ (couldn’t resist) going on. Also, provide them with a means for reporting these events. We recommend a button on their taskbar, but whatever works for you.
One click does not a catastrophe make.So, it snuck past your email filters and someone went clicky-clicky. There is still ample opportunity to limit the impact. Assuming the organization’s “seekrit stuff” isn’t resident on the initial foothold, make it hard to pivot from the user device to other assets in the organization. Protect the rest of your network from compromised desktops and laptops by segmenting the network and implementing strong authentication between the user networks and anything of importance. Static passwords are adorable, but sophisticated attackers don’t just bypass them, they utilize them to advance their attack.
Keep your eye on the ball.You increase your chances of catching signs that you have fallen victim to a phishing attack if you monitor outbound traffic for suspicious connections and potential exfiltration of data to remote hosts.
829
62
7
7
7Personal
Medical
Bank
Secrets
Credentials
Breach count
Figure 15.Top five data varieties breached by phishing attacks, (n=905)
Protect the rest of your network from compromised desktops and laptops by segmenting the network and implementing strong authentication.
Verizon 2016 Data Breach Investigations Report 20
We’re not mad, just disappointed.The use of stolen, weak or default credentials in breaches is not new, is not bleeding edge, is not glamorous, but boy howdy it works. Static authentication mechanisms have been attacked for as long as we can remember. Password guessing from an InfoSec perspective has been around at least as long as the Morris worm, and has evolved to prominent malware families like Dyre and Zeus that are designed to (among other bad things) capture keystrokes from an infected device. All those efforts to get users to use special characters, upper/lower case numbers and minimum lengths are nullified by this ubiquitous malware functionality.
The capture and/or reuse of credentials is used in numerous incident classification patterns. It is used in highly targeted attacks as well as in opportunistic malware infections. It is in the standard toolkit of organized criminal groups and state-affiliated attackers alike. Even fraud committed with stolen payment card data often relies on the static Card Verification Value (CVV) information on the magnetic stripe.11
We are realists here, we know that implementation of multi-factor authentication is not easy. We know that a standard username and password combo may very well be enough to protect your fantasy football league. We also know that implementation of stronger authentication mechanisms is a bar
11 More on this in the Post-Compromise Fraud appendix.
Credentials
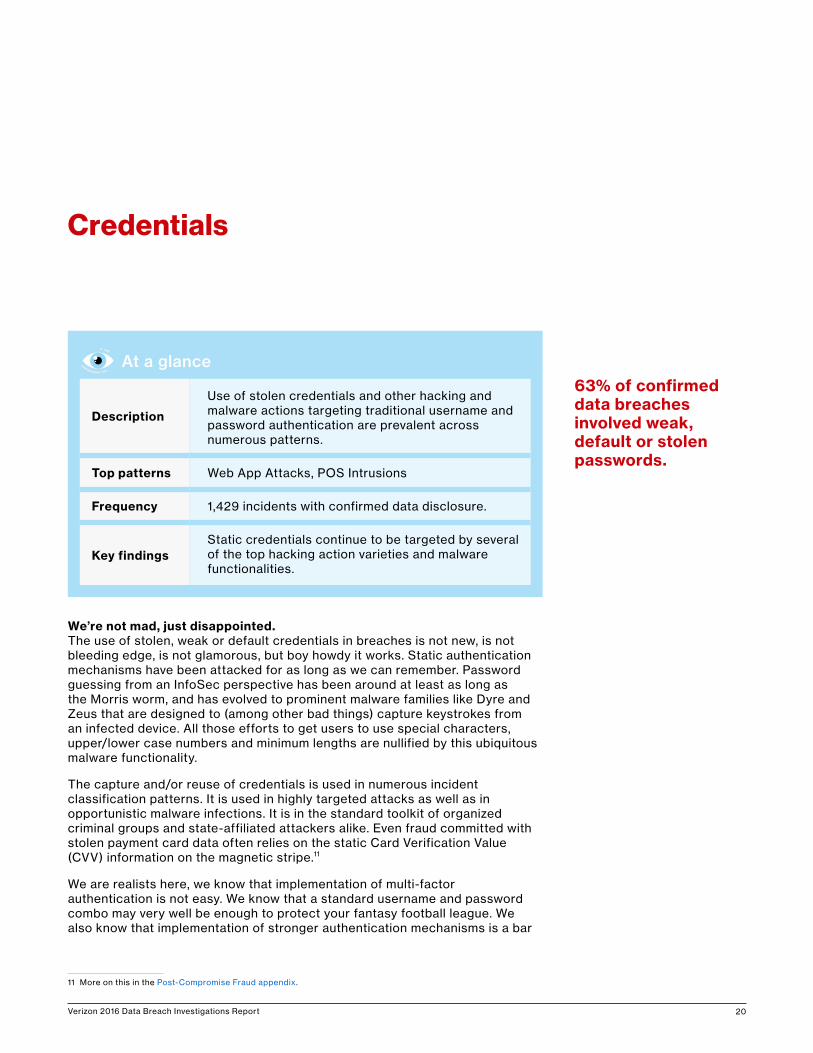
63% of confirmed data breaches involved weak, default or stolen passwords.
At a glance
Description
Use of stolen credentials and other hacking and malware actions targeting traditional username and password authentication are prevalent across numerous patterns.
Top patterns Web App Attacks, POS Intrusions
Frequency 1,429 incidents with confirmed data disclosure.
Key findingsStatic credentials continue to be targeted by several of the top hacking action varieties and malware functionalities.
Verizon 2016 Data Breach Investigations Report 21
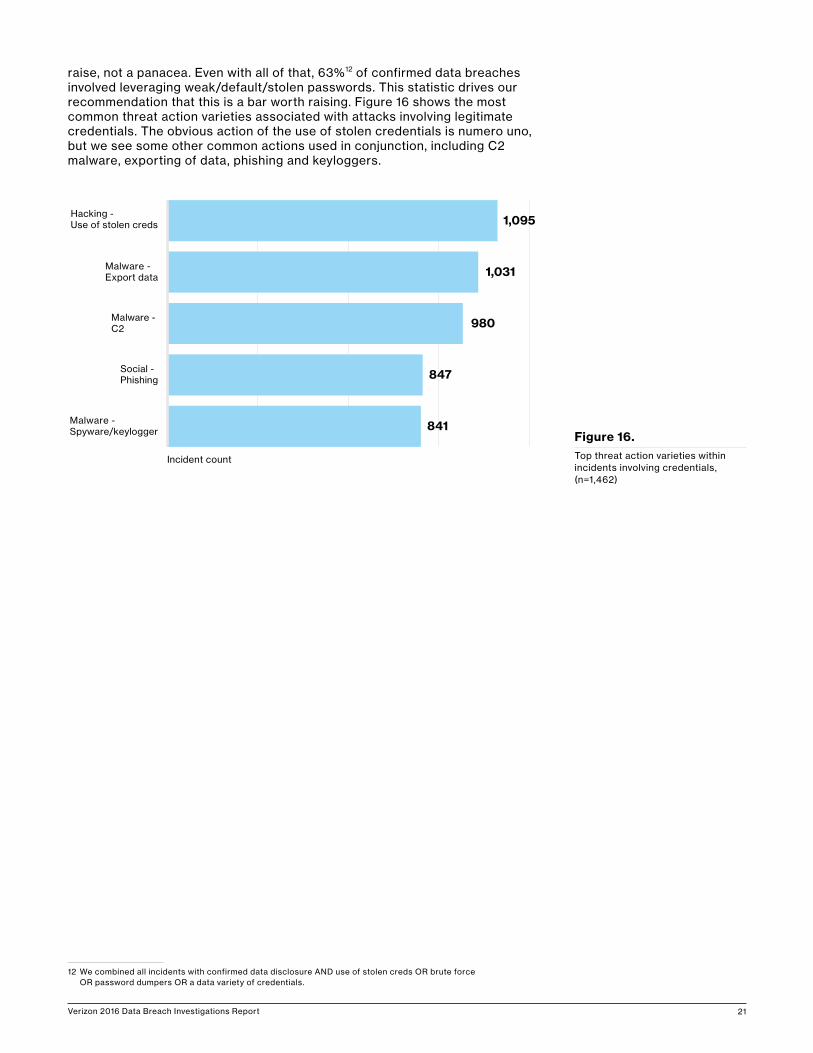
raise, not a panacea. Even with all of that, 63%12 of confirmed data breaches involved leveraging weak/default/stolen passwords. This statistic drives our recommendation that this is a bar worth raising. Figure 16 shows the most common threat action varieties associated with attacks involving legitimate credentials. The obvious action of the use of stolen credentials is numero uno, but we see some other common actions used in conjunction, including C2 malware, exporting of data, phishing and keyloggers.
12 We combined all incidents with confirmed data disclosure AND use of stolen creds OR brute force OR password dumpers OR a data variety of credentials.
1,095
1,031
980
847
841Malware - Spyware/keylogger
Social - Phishing
Malware - C2
Malware - Export data
Hacking - Use of stolen creds
Incident count
n=1462
Figure 16.Top threat action varieties within incidents involving credentials, (n=1,462)
Verizon 2016 Data Breach Investigations Report 22
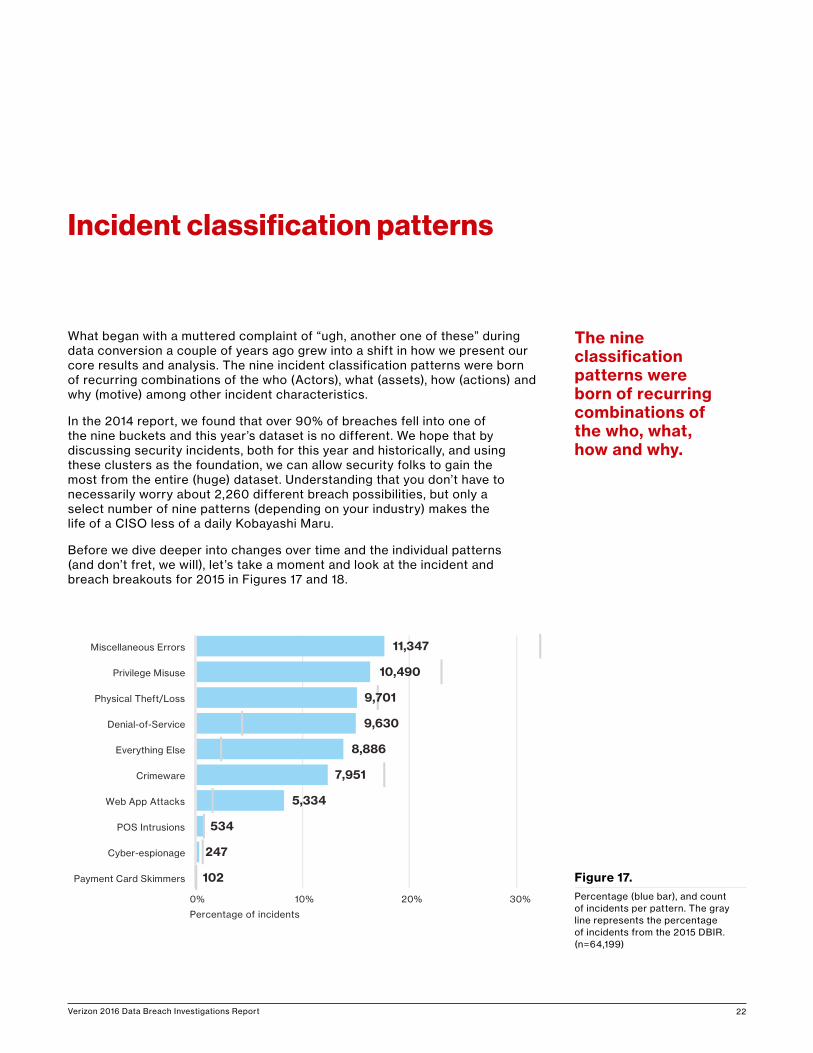
What began with a muttered complaint of “ugh, another one of these” during data conversion a couple of years ago grew into a shift in how we present our core results and analysis. The nine incident classification patterns were born of recurring combinations of the who (Actors), what (assets), how (actions) and why (motive) among other incident characteristics.
In the 2014 report, we found that over 90% of breaches fell into one of the nine buckets and this year’s dataset is no different. We hope that by discussing security incidents, both for this year and historically, and using these clusters as the foundation, we can allow security folks to gain the most from the entire (huge) dataset. Understanding that you don’t have to necessarily worry about 2,260 different breach possibilities, but only a select number of nine patterns (depending on your industry) makes the life of a CISO less of a daily Kobayashi Maru.
Before we dive deeper into changes over time and the individual patterns (and don’t fret, we will), let’s take a moment and look at the incident and breach breakouts for 2015 in Figures 17 and 18.
Incident classification patterns
||
||
||
|||
11,347
10,490
9,701
9,630
8,886
7,951
5,334
534
247
102Payment Card Skimmers
Cyber-espionage
POS Intrusions
Web App Attacks
Crimeware
Everything Else
Denial-of-Service
Physical Theft/Loss
Privilege Misuse
Miscellaneous Errors
Percentage of incidents
0% 10% 20% 30%
| Figure 17.Percentage (blue bar), and count of incidents per pattern. The gray line represents the percentage of incidents from the 2015 DBIR. (n=64,199)
The nine classification patterns were born of recurring combinations of the who, what, how and why.
Verizon 2016 Data Breach Investigations Report 23
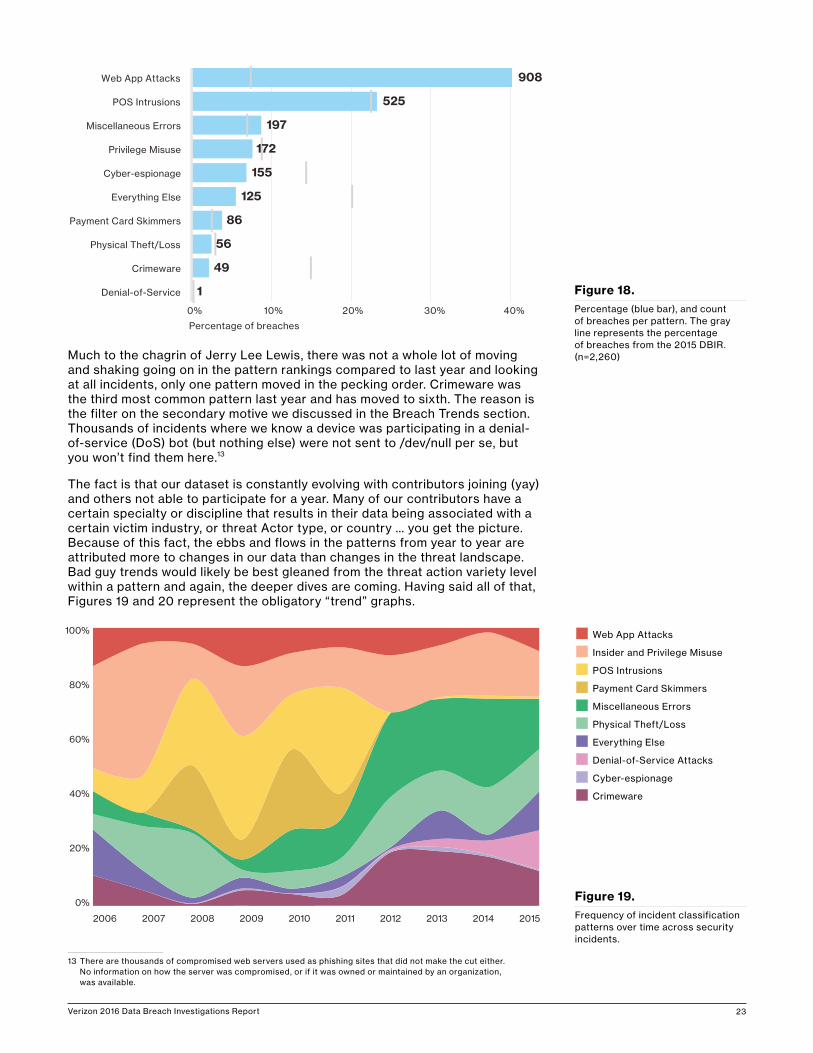
Much to the chagrin of Jerry Lee Lewis, there was not a whole lot of moving and shaking going on in the pattern rankings compared to last year and looking at all incidents, only one pattern moved in the pecking order. Crimeware was the third most common pattern last year and has moved to sixth. The reason is the filter on the secondary motive we discussed in the Breach Trends section. Thousands of incidents where we know a device was participating in a denial-of-service (DoS) bot (but nothing else) were not sent to /dev/null per se, but you won’t find them here.13
The fact is that our dataset is constantly evolving with contributors joining (yay) and others not able to participate for a year. Many of our contributors have a certain specialty or discipline that results in their data being associated with a certain victim industry, or threat Actor type, or country … you get the picture. Because of this fact, the ebbs and flows in the patterns from year to year are attributed more to changes in our data than changes in the threat landscape. Bad guy trends would likely be best gleaned from the threat action variety level within a pattern and again, the deeper dives are coming. Having said all of that, Figures 19 and 20 represent the obligatory “trend” graphs.
13 There are thousands of compromised web servers used as phishing sites that did not make the cut either. No information on how the server was compromised, or if it was owned or maintained by an organization, was available.
||
||
||
||
|
908
525
197
172
155
125
86
56
49
1Denial-of-Service
Crimeware
Physical Theft/Loss
Payment Card Skimmers
Everything Else
Cyber-espionage
Privilege Misuse
Miscellaneous Errors
POS Intrusions
Web App Attacks
Percentage of breaches
|0% 10% 20% 30% 40%
Figure 18.Percentage (blue bar), and count of breaches per pattern. The gray line represents the percentage of breaches from the 2015 DBIR. (n=2,260)
Figure 19.Frequency of incident classification patterns over time across security incidents.
2006 2007 2008 2009 2010 2011 2012 2013 2014 2015
0%
20%
40%
60%
80%
100% n Web App Attacks
n Insider and Privilege Misuse
n POS Intrusions
n Payment Card Skimmers
n Miscellaneous Errors
n Physical Theft/Loss
n Everything Else
n Denial-of-Service Attacks
n Cyber-espionage
n Crimeware
Verizon 2016 Data Breach Investigations Report 24
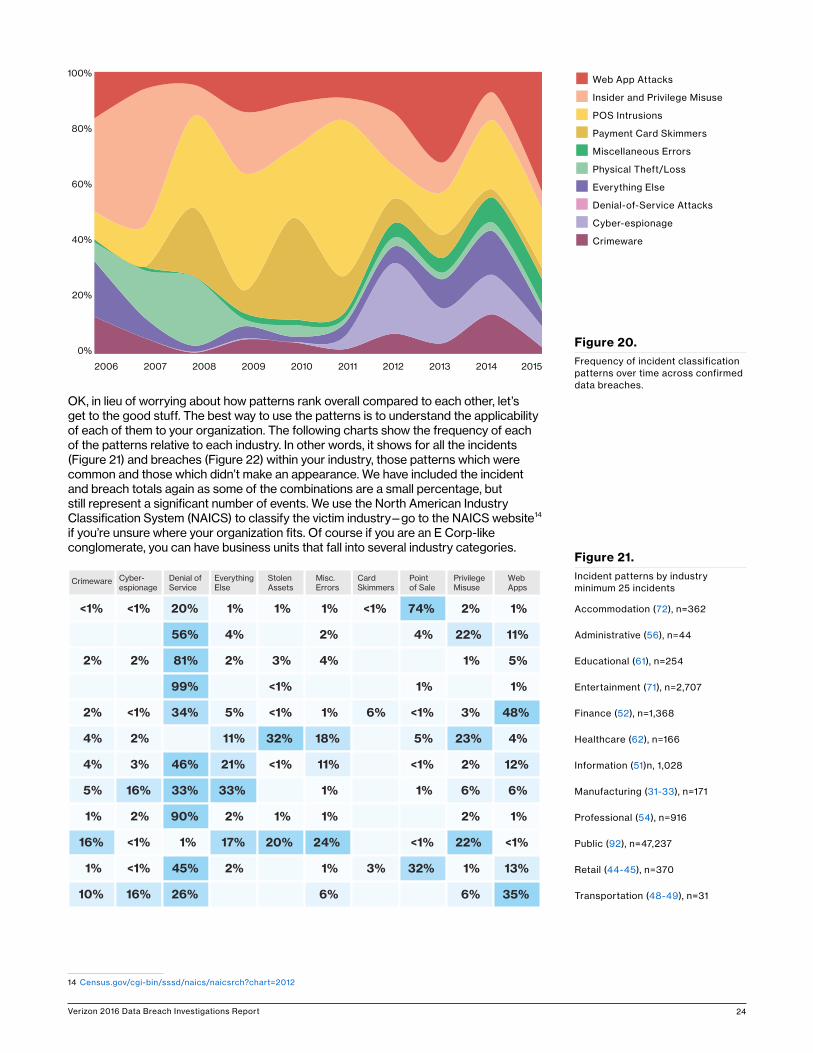
Figure 20.Frequency of incident classification patterns over time across confirmed data breaches.
OK, in lieu of worrying about how patterns rank overall compared to each other, let’s get to the good stuff. The best way to use the patterns is to understand the applicability of each of them to your organization. The following charts show the frequency of each of the patterns relative to each industry. In other words, it shows for all the incidents (Figure 21) and breaches (Figure 22) within your industry, those patterns which were common and those which didn’t make an appearance. We have included the incident and breach totals again as some of the combinations are a small percentage, but still represent a significant number of events. We use the North American Industry Classification System (NAICS) to classify the victim industry—go to the NAICS website14 if you’re unsure where your organization fits. Of course if you are an E Corp-like conglomerate, you can have business units that fall into several industry categories.
14 Census.gov/cgi-bin/sssd/naics/naicsrch?chart=2012
2006 2007 2008 2009 2010 2011 2012 2013 2014 2015
0%
20%
40%
60%
80%
100%
Crimeware Cyber-espionage
Denial of Service
Everything Else
Stolen Assets
Misc.Errors
Card Skimmers
Point of Sale
Privilege Misuse
Web Apps
<1%
2%
2%
4%
4%
5%
1%
16%
1%
10%
<1%
2%
<1%
2%
3%
16%
2%
<1%
<1%
16%
20%
56%
81%
99%
34%
46%
33%
90%
1%
45%
26%
1%
4%
2%
5%
11%
21%
33%
2%
17%
2%
1%
3%
<1%
<1%
32%
<1%
1%
20%
1%
2%
4%
1%
18%
11%
1%
1%
24%
1%
6%
<1%
6%
3%
74%
4%
1%
<1%
5%
<1%
1%
<1%
32%
2%
22%
1%
3%
23%
2%
6%
2%
22%
1%
6%
1%
11%
5%
1%
48%
4%
12%
6%
1%
<1%
13%
35%
Figure 21.Incident patterns by industry minimum 25 incidents
Accommodation (72), n=362
Administrative (56), n=44
Educational (61), n=254
Entertainment (71), n=2,707
Finance (52), n=1,368
Healthcare (62), n=166
Information (51)n, 1,028
Manufacturing (31-33), n=171
Professional (54), n=916
Public (92), n=47,237
Retail (44-45), n=370
Transportation (48-49), n=31
n Web App Attacks
n Insider and Privilege Misuse
n POS Intrusions
n Payment Card Skimmers
n Miscellaneous Errors
n Physical Theft/Loss
n Everything Else
n Denial-of-Service Attacks
n Cyber-espionage
n Crimeware
Verizon 2016 Data Breach Investigations Report 25
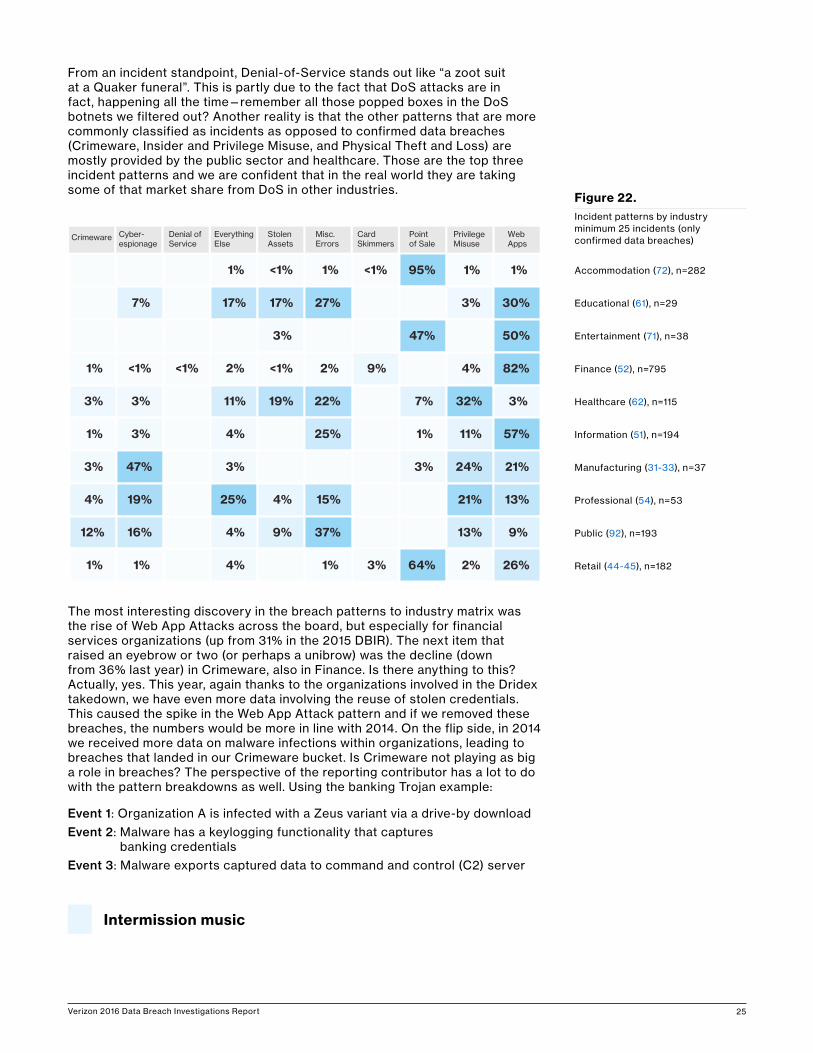
From an incident standpoint, Denial-of-Service stands out like “a zoot suit at a Quaker funeral”. This is partly due to the fact that DoS attacks are in fact, happening all the time—remember all those popped boxes in the DoS botnets we filtered out? Another reality is that the other patterns that are more commonly classified as incidents as opposed to confirmed data breaches (Crimeware, Insider and Privilege Misuse, and Physical Theft and Loss) are mostly provided by the public sector and healthcare. Those are the top three incident patterns and we are confident that in the real world they are taking some of that market share from DoS in other industries.
The most interesting discovery in the breach patterns to industry matrix was the rise of Web App Attacks across the board, but especially for financial services organizations (up from 31% in the 2015 DBIR). The next item that raised an eyebrow or two (or perhaps a unibrow) was the decline (down from 36% last year) in Crimeware, also in Finance. Is there anything to this? Actually, yes. This year, again thanks to the organizations involved in the Dridex takedown, we have even more data involving the reuse of stolen credentials. This caused the spike in the Web App Attack pattern and if we removed these breaches, the numbers would be more in line with 2014. On the flip side, in 2014 we received more data on malware infections within organizations, leading to breaches that landed in our Crimeware bucket. Is Crimeware not playing as big a role in breaches? The perspective of the reporting contributor has a lot to do with the pattern breakdowns as well. Using the banking Trojan example:
Event 1: Organization A is infected with a Zeus variant via a drive-by download
Event 2: Malware has a keylogging functionality that captures banking credentials
Event 3: Malware exports captured data to command and control (C2) server
Crimeware Cyber-espionage
Denial of Service
Everything Else
Stolen Assets
Misc.Errors
Card Skimmers
Point of Sale
Privilege Misuse
Web Apps
1%
3%
1%
3%
4%
12%
1%
7%
<1%
3%
3%
47%
19%
16%
1%
<1%
1%
17%
2%
11%
4%
3%
25%
4%
4%
<1%
17%
3%
<1%
19%
4%
9%
1%
27%
2%
22%
25%
15%
37%
1%
<1%
9%
3%
95%
47%
7%
1%
3%
64%
1%
3%
4%
32%
11%
24%
21%
13%
2%
1%
30%
50%
82%
3%
57%
21%
13%
9%
26%
Figure 22.Incident patterns by industry minimum 25 incidents (only confirmed data breaches)
Intermission music
Accommodation (72), n=282
Educational (61), n=29
Entertainment (71), n=38
Finance (52), n=795
Healthcare (62), n=115
Information (51), n=194
Manufacturing (31-33), n=37
Professional (54), n=53
Public (92), n=193
Retail (44-45), n=182
Verizon 2016 Data Breach Investigations Report 26
Event 4: Credentials are used to log into Organization B web server
Event 5: Fraudulent transaction is initiated
Organization B may be quick to say “We didn’t have a malware incident” and if events 4–5 are provided to us, the incident would find a good home in the Web App Attacks section. But if we received data from Organization A and only events 1–3 are documented, it now becomes a newly minted Crimeware breach.
It is important to realize that there are interrelations between the incident patterns that aren’t always evident. Crimeware in one organization leads to DoS against another; or to fraudulent transactions on another’s application. Remember we’re all in this together: the security ecosystem, Kumbaya and trust falls folks…
Verizon 2016 Data Breach Investigations Report 27
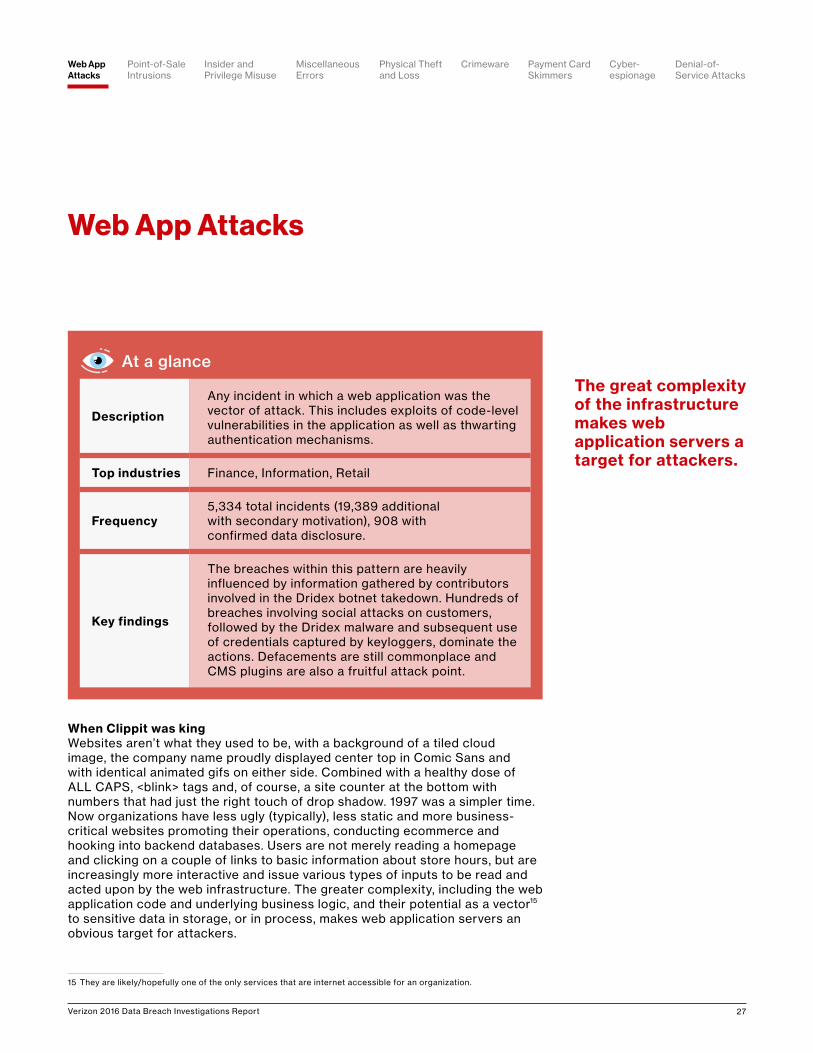
When Clippit was kingWebsites aren’t what they used to be, with a background of a tiled cloud image, the company name proudly displayed center top in Comic Sans and with identical animated gifs on either side. Combined with a healthy dose of ALL CAPS, <blink> tags and, of course, a site counter at the bottom with numbers that had just the right touch of drop shadow. 1997 was a simpler time. Now organizations have less ugly (typically), less static and more business-critical websites promoting their operations, conducting ecommerce and hooking into backend databases. Users are not merely reading a homepage and clicking on a couple of links to basic information about store hours, but are increasingly more interactive and issue various types of inputs to be read and acted upon by the web infrastructure. The greater complexity, including the web application code and underlying business logic, and their potential as a vector15 to sensitive data in storage, or in process, makes web application servers an obvious target for attackers.
15 They are likely/hopefully one of the only services that are internet accessible for an organization.
Web App Attacks
The great complexity of the infrastructure makes web application servers a target for attackers.
At a glance
Description
Any incident in which a web application was the vector of attack. This includes exploits of code-level vulnerabilities in the application as well as thwarting authentication mechanisms.
Top industries Finance, Information, Retail
Frequency5,334 total incidents (19,389 additional with secondary motivation), 908 with confirmed data disclosure.
Key findings
The breaches within this pattern are heavily influenced by information gathered by contributors involved in the Dridex botnet takedown. Hundreds of breaches involving social attacks on customers, followed by the Dridex malware and subsequent use of credentials captured by keyloggers, dominate the actions. Defacements are still commonplace and CMS plugins are also a fruitful attack point.
Point-of-Sale Intrusions
Payment Card Skimmers
CrimewareWeb App Attacks
Denial-of-Service Attacks
Physical Theft and Loss
Insider and Privilege Misuse
MiscellaneousErrors
Cyber- espionage
Verizon 2016 Data Breach Investigations Report 28
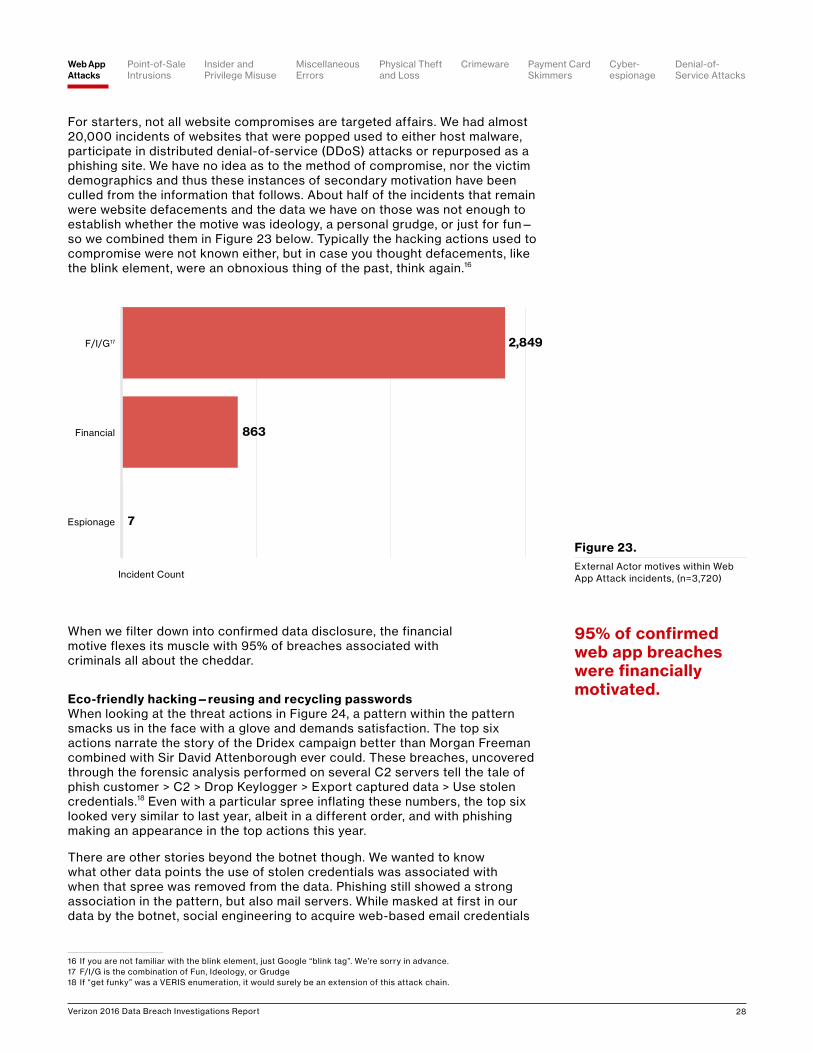
For starters, not all website compromises are targeted affairs. We had almost 20,000 incidents of websites that were popped used to either host malware, participate in distributed denial-of-service (DDoS) attacks or repurposed as a phishing site. We have no idea as to the method of compromise, nor the victim demographics and thus these instances of secondary motivation have been culled from the information that follows. About half of the incidents that remain were website defacements and the data we have on those was not enough to establish whether the motive was ideology, a personal grudge, or just for fun—so we combined them in Figure 23 below. Typically the hacking actions used to compromise were not known either, but in case you thought defacements, like the blink element, were an obnoxious thing of the past, think again.16
When we filter down into confirmed data disclosure, the financial motive flexes its muscle with 95% of breaches associated with criminals all about the cheddar.
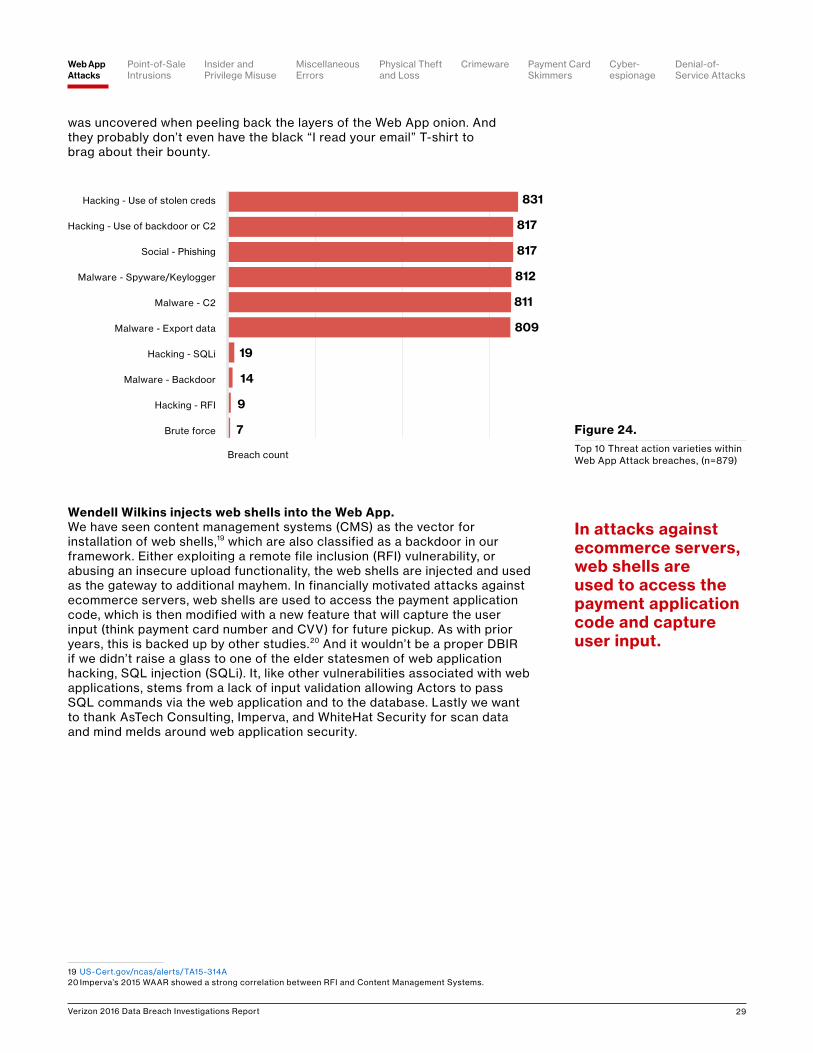
Eco-friendly hacking—reusing and recycling passwordsWhen looking at the threat actions in Figure 24, a pattern within the pattern smacks us in the face with a glove and demands satisfaction. The top six actions narrate the story of the Dridex campaign better than Morgan Freeman combined with Sir David Attenborough ever could. These breaches, uncovered through the forensic analysis performed on several C2 servers tell the tale of phish customer > C2 > Drop Keylogger > Export captured data > Use stolen credentials.18 Even with a particular spree inflating these numbers, the top six looked very similar to last year, albeit in a different order, and with phishing making an appearance in the top actions this year.
There are other stories beyond the botnet though. We wanted to know what other data points the use of stolen credentials was associated with when that spree was removed from the data. Phishing still showed a strong association in the pattern, but also mail servers. While masked at first in our data by the botnet, social engineering to acquire web-based email credentials
16 If you are not familiar with the blink element, just Google “blink tag”. We’re sorry in advance.17 F/I/G is the combination of Fun, Ideology, or Grudge18 If “get funky” was a VERIS enumeration, it would surely be an extension of this attack chain.
Figure 23.External Actor motives within Web App Attack incidents, (n=3,720)
2,849
863
7Espionage
Financial
F/I/G17
Incident Count
95% of confirmed web app breaches were financially motivated.
Point-of-Sale Intrusions
Payment Card Skimmers
CrimewareWeb App Attacks
Denial-of-Service Attacks
Physical Theft and Loss
Insider and Privilege Misuse
MiscellaneousErrors
Cyber- espionage
Verizon 2016 Data Breach Investigations Report 29
Figure 24.Top 10 Threat action varieties within Web App Attack breaches, (n=879)
was uncovered when peeling back the layers of the Web App onion. And they probably don’t even have the black “I read your email” T-shirt to brag about their bounty.
Wendell Wilkins injects web shells into the Web App.We have seen content management systems (CMS) as the vector for installation of web shells,19 which are also classified as a backdoor in our framework. Either exploiting a remote file inclusion (RFI) vulnerability, or abusing an insecure upload functionality, the web shells are injected and used as the gateway to additional mayhem. In financially motivated attacks against ecommerce servers, web shells are used to access the payment application code, which is then modified with a new feature that will capture the user input (think payment card number and CVV) for future pickup. As with prior years, this is backed up by other studies.20 And it wouldn’t be a proper DBIR if we didn’t raise a glass to one of the elder statesmen of web application hacking, SQL injection (SQLi). It, like other vulnerabilities associated with web applications, stems from a lack of input validation allowing Actors to pass SQL commands via the web application and to the database. Lastly we want to thank AsTech Consulting, Imperva, and WhiteHat Security for scan data and mind melds around web application security.
19 US-Cert.gov/ncas/alerts/TA15-314A20 Imperva’s 2015 WAAR showed a strong correlation between RFI and Content Management Systems.
831
817
817
812
811
809
19
14
9
7Brute force
Hacking - RFI
Malware - Backdoor
Hacking - SQLi
Malware - Export data
Malware - C2
Malware - Spyware/Keylogger
Social - Phishing
Hacking - Use of backdoor or C2
Hacking - Use of stolen creds
Breach count
In attacks against ecommerce servers, web shells are used to access the payment application code and capture user input.
Point-of-Sale Intrusions
Payment Card Skimmers
CrimewareWeb App Attacks
Denial-of-Service Attacks
Physical Theft and Loss
Insider and Privilege Misuse
MiscellaneousErrors
Cyber- espionage
Verizon 2016 Data Breach Investigations Report 30
Recommended controls
Factor, meet factor. Like that song you can’t get out of your head. Here is another shot across the bow of single-factor, password-based authentication for anything of criticality. If you are securing a web application, don’t base the integrity of authentication on the assumption that your customers won’t get owned with keylogging malware. They do and will.
I value your input, I just don’t trust it. Validate inputs, whether it is ensuring that the image upload functionality makes sure that it is actually an image and not a web shell, or that users can’t pass commands to the database via the customer name field.21
Unplug. Worrying about OS and core application code is hard enough, but third-party plugins are also gray-hair-inducing. Establish a patch process for CMS platforms and third-party plugins.
21 Still great: XKCD.com/327/
Point-of-Sale Intrusions
Payment Card Skimmers
CrimewareWeb App Attacks
Denial-of-Service Attacks
Physical Theft and Loss
Insider and Privilege Misuse
MiscellaneousErrors
Cyber- espionage
Verizon 2016 Data Breach Investigations Report 31
Point-of-Sale Intrusions
The well, revisitedIt should be no surprise to anyone that this pattern is alive and well in the 2015 dataset. There are still folks out there seeking to get paid and looking to stolen payment card data as the means to meet their greedy objectives.
22 Personal Identification Number (PIN) Entry Device
At a glance
Description
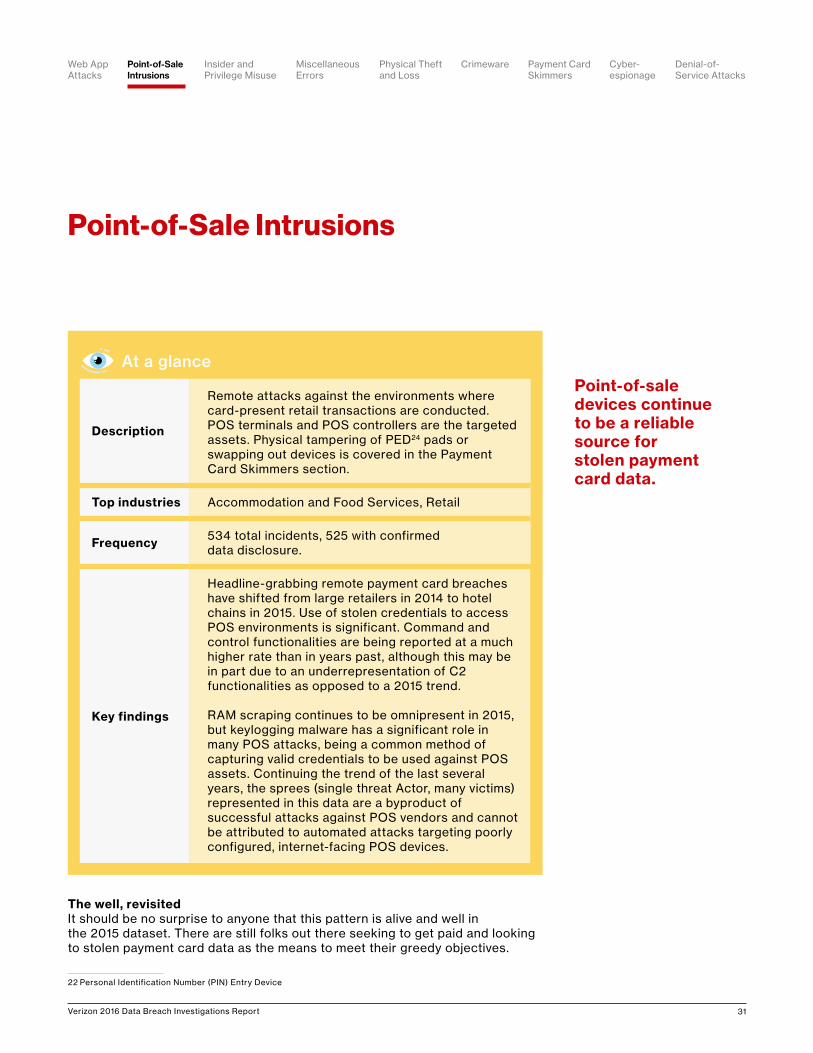
Remote attacks against the environments where card-present retail transactions are conducted. POS terminals and POS controllers are the targeted assets. Physical tampering of PED24 pads or swapping out devices is covered in the Payment Card Skimmers section.
Top industries Accommodation and Food Services, Retail
Frequency 534 total incidents, 525 with confirmed data disclosure.
Key findings
Headline-grabbing remote payment card breaches have shifted from large retailers in 2014 to hotel chains in 2015. Use of stolen credentials to access POS environments is significant. Command and control functionalities are being reported at a much higher rate than in years past, although this may be in part due to an underrepresentation of C2 functionalities as opposed to a 2015 trend.
RAM scraping continues to be omnipresent in 2015, but keylogging malware has a significant role in many POS attacks, being a common method of capturing valid credentials to be used against POS assets. Continuing the trend of the last several years, the sprees (single threat Actor, many victims) represented in this data are a byproduct of successful attacks against POS vendors and cannot be attributed to automated attacks targeting poorly configured, internet-facing POS devices.
Point-of-sale devices continue to be a reliable source for stolen payment card data.
Point-of-Sale Intrusions
Payment Card Skimmers
CrimewareWeb App Attacks
Denial-of-Service Attacks
Physical Theft and Loss
Insider and Privilege Misuse
MiscellaneousErrors
Cyber- espionage
Verizon 2016 Data Breach Investigations Report 32
Point-of-sale devices continue to be a reliable source for this data, notably the POS terminals that directly consume magnetic stripe information from customers, or POS controllers that typically act as an aggregator of transactional data from the terminals in a server-to-client relationship.
In small businesses, the POS environment may have a population of one, with a lone computer processing payments and communicating out to the payment processor. This device might also (unfortunately) be used for checking personal email, social media breaks and other interwebby activities that introduce more risk to the POS application which is all alone, with no anti-virus or host-based firewall to talk to.
Four or five years ago, our findings were dominated by POS breaches—simplistic and automated in nature and making full use of known default vendor credentials. We lovingly called these POS Smash and Grabs, and this attack method was one that we saw over and over again and helped drive us to the development of incident classification patterns. The gist of these, if this is your first DBIR rodeo, is: 1) POS server is visible to the entire internet, 2) POS has default login, 3) Bad guy leverages 1) and 2) to install malware and 4) Malware grabs the payment card data as it is processed. This scenario was, and still is, a small business problem. It did, however, offer some insight into what was to come for larger organizations.
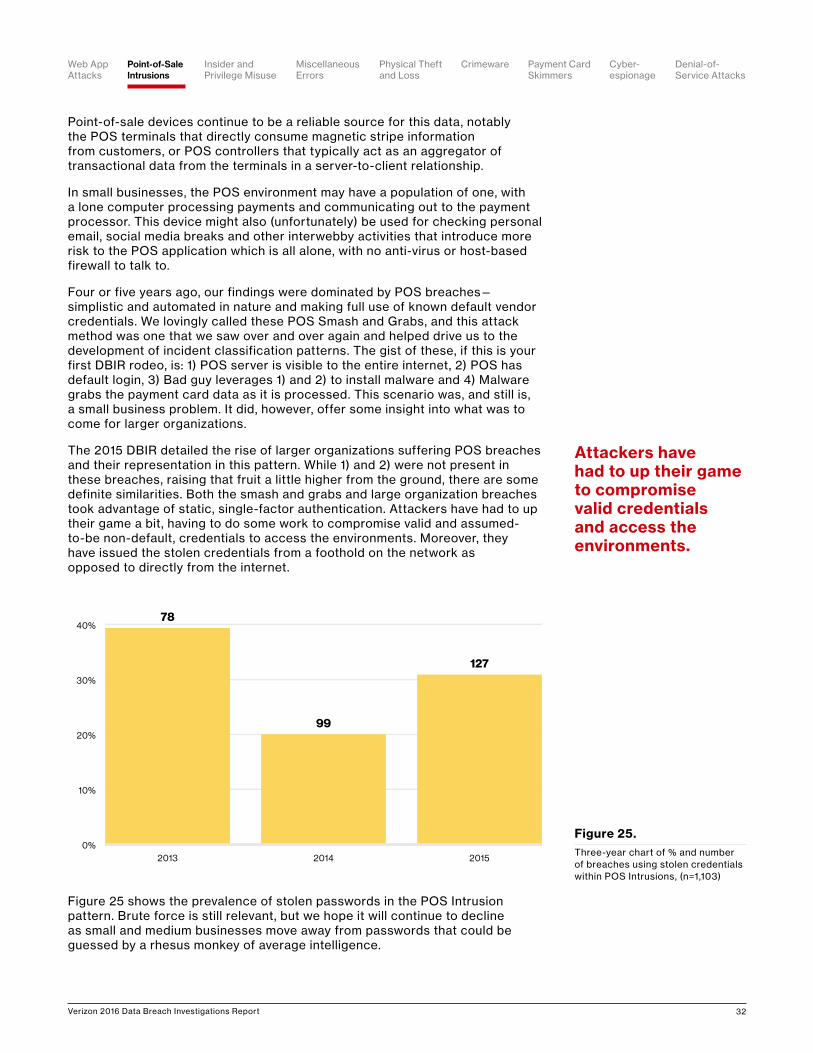
The 2015 DBIR detailed the rise of larger organizations suffering POS breaches and their representation in this pattern. While 1) and 2) were not present in these breaches, raising that fruit a little higher from the ground, there are some definite similarities. Both the smash and grabs and large organization breaches took advantage of static, single-factor authentication. Attackers have had to up their game a bit, having to do some work to compromise valid and assumed-to-be non-default, credentials to access the environments. Moreover, they have issued the stolen credentials from a foothold on the network as opposed to directly from the internet.
Figure 25 shows the prevalence of stolen passwords in the POS Intrusion pattern. Brute force is still relevant, but we hope it will continue to decline as small and medium businesses move away from passwords that could be guessed by a rhesus monkey of average intelligence.
Figure 25.Three-year chart of % and number of breaches using stolen credentials within POS Intrusions, (n=1,103)
127
99
78
0%
10%
20%
30%
40%
2013 2014 2015
Attackers have had to up their game to compromise valid credentials and access the environments.
Point-of-Sale Intrusions
Payment Card Skimmers
CrimewareWeb App Attacks
Denial-of-Service Attacks
Physical Theft and Loss
Insider and Privilege Misuse
MiscellaneousErrors
Cyber- espionage
Verizon 2016 Data Breach Investigations Report 33
Vendor as a vectorThe vector associated with the hacking actions tells an interesting story as well. Ninety-seven percent of breaches featuring use of stolen credentials also had a vector of Partner. This is selected when the Actor uses legitimate partner access in the hacking action. This year continued the trend of the criminal sprees in our data being associated with attacks against POS vendors followed by using their access into their customer base.23 Bill Gates once said “Your most unhappy customers are your greatest source of learning.” With all of their customers equally unhappy, the amount of learning some POS vendors have acquired must have been like Neo’s martial arts training.24
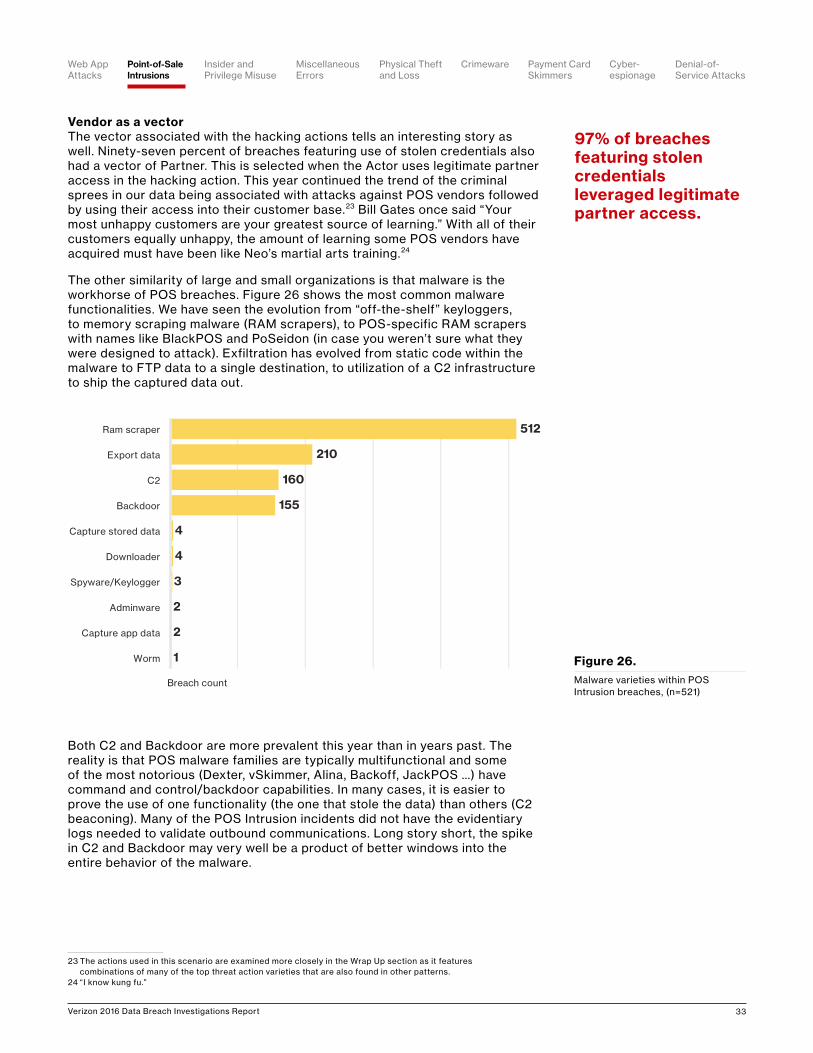
The other similarity of large and small organizations is that malware is the workhorse of POS breaches. Figure 26 shows the most common malware functionalities. We have seen the evolution from “off-the-shelf” keyloggers, to memory scraping malware (RAM scrapers), to POS-specific RAM scrapers with names like BlackPOS and PoSeidon (in case you weren’t sure what they were designed to attack). Exfiltration has evolved from static code within the malware to FTP data to a single destination, to utilization of a C2 infrastructure to ship the captured data out.
Both C2 and Backdoor are more prevalent this year than in years past. The reality is that POS malware families are typically multifunctional and some of the most notorious (Dexter, vSkimmer, Alina, Backoff, JackPOS …) have command and control/backdoor capabilities. In many cases, it is easier to prove the use of one functionality (the one that stole the data) than others (C2 beaconing). Many of the POS Intrusion incidents did not have the evidentiary logs needed to validate outbound communications. Long story short, the spike in C2 and Backdoor may very well be a product of better windows into the entire behavior of the malware.
23 The actions used in this scenario are examined more closely in the Wrap Up section as it features combinations of many of the top threat action varieties that are also found in other patterns.
24 “I know kung fu.”
512
210
160
155
4
4
3
2
2
1Worm
Capture app data
Adminware
Spyware/Keylogger
Downloader
Capture stored data
Backdoor
C2
Export data
Ram scraper
Breach count
Figure 26.Malware varieties within POS Intrusion breaches, (n=521)
97% of breaches featuring stolen credentials leveraged legitimate partner access.
Point-of-Sale Intrusions
Payment Card Skimmers
CrimewareWeb App Attacks
Denial-of-Service Attacks
Physical Theft and Loss
Insider and Privilege Misuse
MiscellaneousErrors
Cyber- espionage
Verizon 2016 Data Breach Investigations Report 34
Recommended controls
Not trying to give you static, but...Static single authentication is a weakness that is used in spades by the attackers. If possible, improve this with a second factor such as a hardware token or mobile app, and monitor login activity with an eye out for unusual patterns. Have a conversation with your vendors and ensure that they are using strong authentication to access your POS environment.
Who can it be, knocking at my door?Find out what monitoring options are available for your POS environment and validate their implementation. Track remote logins and verify any and all that are against the norm.
Segmentation, seriously Separate the POS environment from the corporate LAN and ensure that it is not visible to the entire internet.
Point-of-Sale Intrusions
Payment Card Skimmers
CrimewareWeb App Attacks
Denial-of-Service Attacks
Physical Theft and Loss
Insider and Privilege Misuse
MiscellaneousErrors
Cyber- espionage
Verizon 2016 Data Breach Investigations Report 35
The disgruntled insider—we all have an idea in our minds of what this person looks like. Perhaps it is the software developer who is frustrated with management; maybe it is the healthcare worker who has been recruited by organized crime; or maybe it is that guy in the basement grieving the loss of his red stapler. Regardless of what they look like, the fact is they are inside our carefully constructed defenses and they are wreaking havoc with our data.
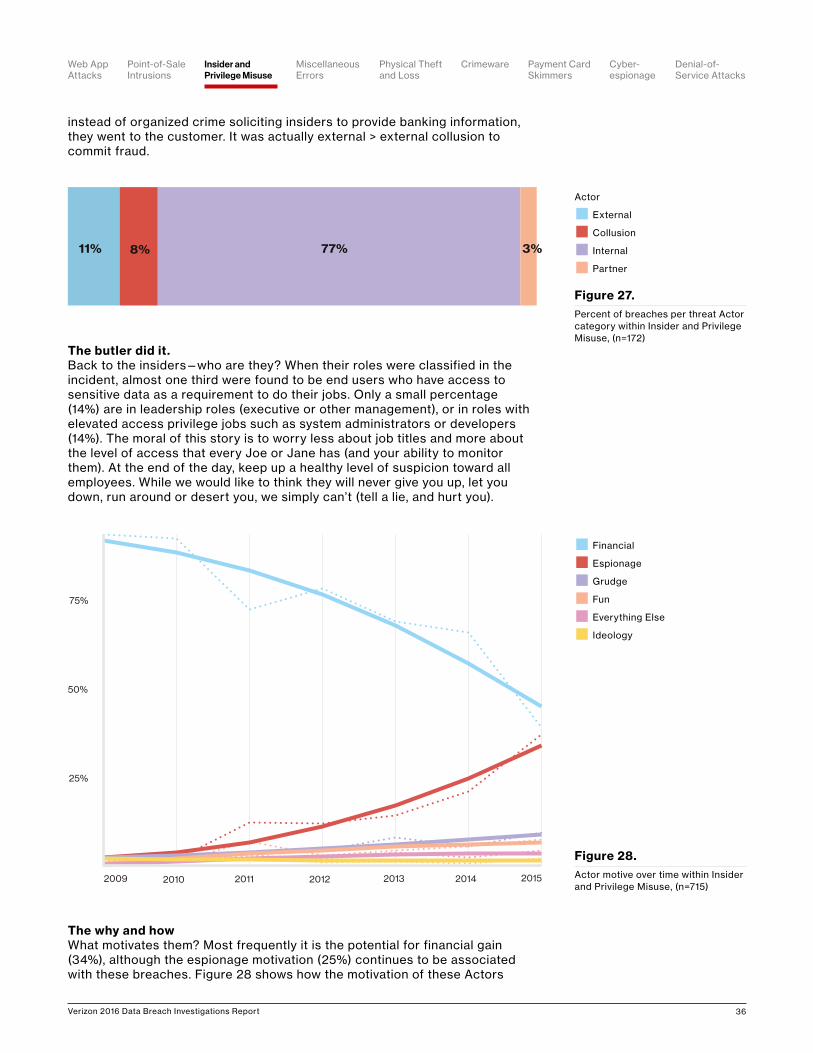
The Insider and Privilege Misuse pattern is one of the few that sees collusion between internal and external (or even partner) Actors. Figure 27 shows the percentage of these breaches where multiple Actors are present.
These are most frequently an external/internal pairing, but ruling out partners as potential colluders is a mistake. The break from the norm that we saw was the rise in misuse breaches tied to external Actors only. This was normally solely associated with TGYFBFTDHRA,25 but this year we had cases where
25 That guy you fired but forgot to disable his remote access.
Insider and Privilege Misuse
The Privilege Misuse pattern is one of the few that includes collusion between internal and external Actors.
At a glance
Description
All incidents tagged with the action category of Misuse—any unapproved or malicious use of organizational resources—fall within this pattern. This is mainly insider-only misuse, but outsiders (due to collusion) and partners (because they are granted privileges) show up as well.
Top industries Public, Healthcare, Finance
Frequency 10,489 total incidents, 172 with confirmed data disclosure.
Key findings
They’re behind your firewall, getting all up in your data. They are often end users and they are comfortable exfiltrating data out in the open on the corporate LAN. Insider incidents are the hardest (and take the longest) to detect. Of all the incidents, these insider misuse cases are the most likely to take months or years to discover.
Point-of-Sale Intrusions
Payment Card Skimmers
CrimewareWeb App Attacks
Denial-of-Service Attacks
Physical Theft and Loss
Insider and Privilege Misuse
MiscellaneousErrors
Cyber- espionage
Verizon 2016 Data Breach Investigations Report 36
instead of organized crime soliciting insiders to provide banking information, they went to the customer. It was actually external > external collusion to commit fraud.
The butler did it.Back to the insiders—who are they? When their roles were classified in the incident, almost one third were found to be end users who have access to sensitive data as a requirement to do their jobs. Only a small percentage (14%) are in leadership roles (executive or other management), or in roles with elevated access privilege jobs such as system administrators or developers (14%). The moral of this story is to worry less about job titles and more about the level of access that every Joe or Jane has (and your ability to monitor them). At the end of the day, keep up a healthy level of suspicion toward all employees. While we would like to think they will never give you up, let you down, run around or desert you, we simply can’t (tell a lie, and hurt you).
The why and howWhat motivates them? Most frequently it is the potential for financial gain (34%), although the espionage motivation (25%) continues to be associated with these breaches. Figure 28 shows how the motivation of these Actors
Figure 27.Percent of breaches per threat Actor category within Insider and Privilege Misuse, (n=172)
11% 77% 3%8%
25%
50%
75%
2009 2013 201520142010 2011 2012
Figure 28.Actor motive over time within Insider and Privilege Misuse, (n=715)
n Financial
n Espionage
n Grudge
n Fun
n Everything Else
n Ideology
Actor
n External
n Collusion
n Internal
n Partner
Point-of-Sale Intrusions
Payment Card Skimmers
CrimewareWeb App Attacks
Denial-of-Service Attacks
Physical Theft and Loss
Insider and Privilege Misuse
MiscellaneousErrors
Cyber- espionage
Verizon 2016 Data Breach Investigations Report 37
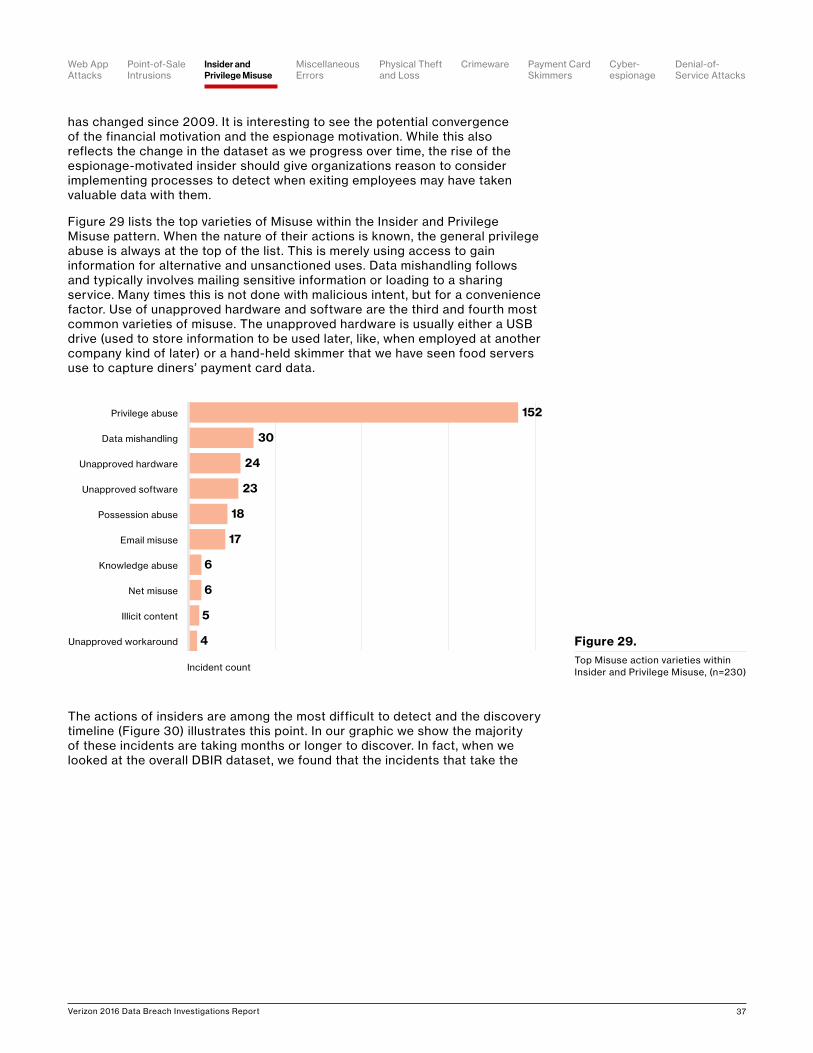
has changed since 2009. It is interesting to see the potential convergence of the financial motivation and the espionage motivation. While this also reflects the change in the dataset as we progress over time, the rise of the espionage-motivated insider should give organizations reason to consider implementing processes to detect when exiting employees may have taken valuable data with them.
Figure 29 lists the top varieties of Misuse within the Insider and Privilege Misuse pattern. When the nature of their actions is known, the general privilege abuse is always at the top of the list. This is merely using access to gain information for alternative and unsanctioned uses. Data mishandling follows and typically involves mailing sensitive information or loading to a sharing service. Many times this is not done with malicious intent, but for a convenience factor. Use of unapproved hardware and software are the third and fourth most common varieties of misuse. The unapproved hardware is usually either a USB drive (used to store information to be used later, like, when employed at another company kind of later) or a hand-held skimmer that we have seen food servers use to capture diners’ payment card data.
The actions of insiders are among the most difficult to detect and the discovery timeline (Figure 30) illustrates this point. In our graphic we show the majority of these incidents are taking months or longer to discover. In fact, when we looked at the overall DBIR dataset, we found that the incidents that take the
152
30
24
23
18
17
6
6
5
4Unapproved workaround
Illicit content
Net misuse
Knowledge abuse
Email misuse
Possession abuse
Unapproved software
Unapproved hardware
Data mishandling
Privilege abuse
Incident count
Figure 29.Top Misuse action varieties within Insider and Privilege Misuse, (n=230)
Point-of-Sale Intrusions
Payment Card Skimmers
CrimewareWeb App Attacks
Denial-of-Service Attacks
Physical Theft and Loss
Insider and Privilege Misuse
MiscellaneousErrors
Cyber- espionage
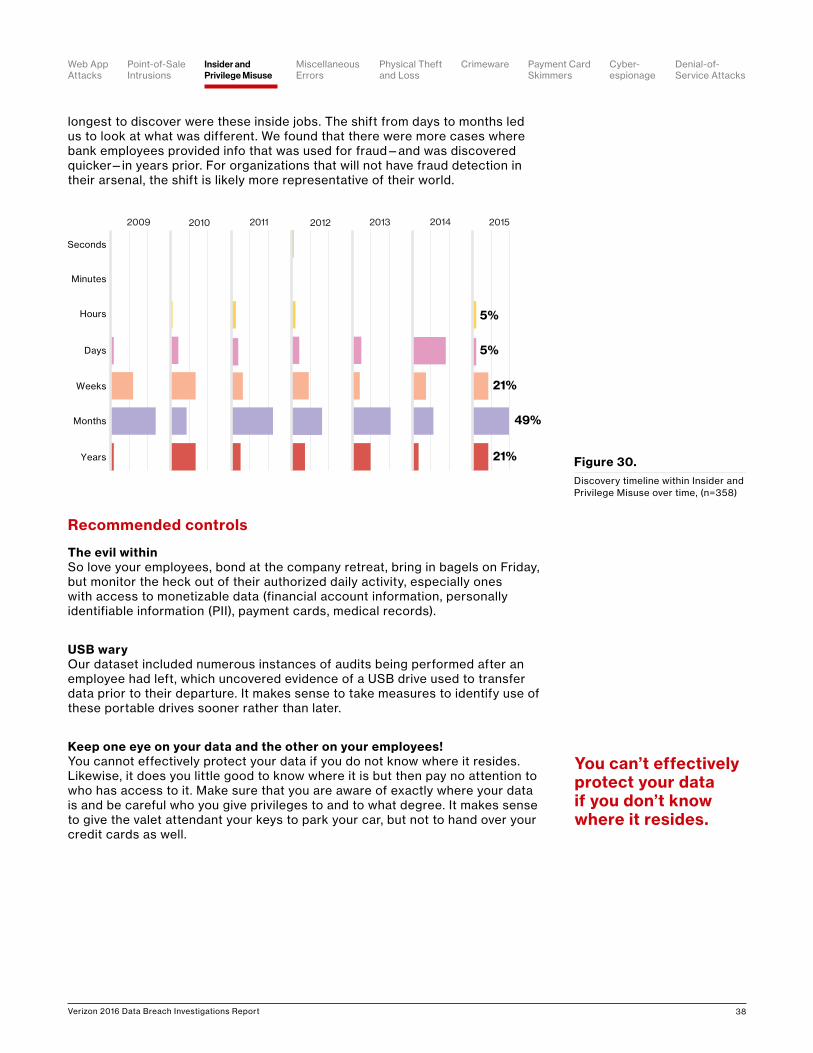
Verizon 2016 Data Breach Investigations Report 38
longest to discover were these inside jobs. The shift from days to months led us to look at what was different. We found that there were more cases where bank employees provided info that was used for fraud—and was discovered quicker—in years prior. For organizations that will not have fraud detection in their arsenal, the shift is likely more representative of their world.
Recommended controls
The evil withinSo love your employees, bond at the company retreat, bring in bagels on Friday, but monitor the heck out of their authorized daily activity, especially ones with access to monetizable data (financial account information, personally identifiable information (PII), payment cards, medical records).
USB waryOur dataset included numerous instances of audits being performed after an employee had left, which uncovered evidence of a USB drive used to transfer data prior to their departure. It makes sense to take measures to identify use of these portable drives sooner rather than later.
Keep one eye on your data and the other on your employees!You cannot effectively protect your data if you do not know where it resides. Likewise, it does you little good to know where it is but then pay no attention to who has access to it. Make sure that you are aware of exactly where your data is and be careful who you give privileges to and to what degree. It makes sense to give the valet attendant your keys to park your car, but not to hand over your credit cards as well.
Figure 30.Discovery timeline within Insider and Privilege Misuse over time, (n=358)
2009 2011 2013 2015
5%
5%
49%
21%
21%Years
Months
Weeks
Days
Hours
Minutes
Seconds
201420122010
You can’t effectively protect your data if you don’t know where it resides.
Point-of-Sale Intrusions
Payment Card Skimmers
CrimewareWeb App Attacks
Denial-of-Service Attacks
Physical Theft and Loss
Insider and Privilege Misuse
MiscellaneousErrors
Cyber- espionage
Verizon 2016 Data Breach Investigations Report 39
Tougher penalties for data breaches Almost without exception, every international fraud and business crime case that Mishcon de Reya LLP has advised on in the past 12 months involved the use of computer equipment and electronic data. For a company that falls victim to cybercrime, there are immediate financial ramifications from loss of revenue while systems are down, the unlawful exploitation of valuable data that has been stolen, or possible claims faced from the queue of litigants seeking compensation. Additionally, there can be a broader impact on customer trust and confidence following an incident that can lead to reputational damage that is more difficult to quantify.
Yet, there is huge inconsistency and discrepancy in the way that governments are tackling this problem. Many believe that the legislation is out of date with technology and too weak to combat the problem with any meaningful sanction. There is widespread confusion and enhanced regulatory risk as businesses are forced to comply with radically different laws as their data passes from one country to the next.
In the US, there are a multitude of privacy and data security laws but no specific and comprehensive federal law, and no official national authority responsible for enforcing it. As a member of the European Union, the UK implemented the European Union’s 1995 Data Protection Directive 95/46/EC with the Data Protection Act 1998. The Information Commissioner’s Office is responsible for enforcing it and upholding information rights, but the ICO is championing tougher sanctions, including prison sentences rather than fines, to deter theft and trading of personal data. At the moment, there is no mandatory reporting obligation in the UK under the data protection legislation and the toughest penalty that the ICO can impose is a £500,000 fine (about $700,000) for the most serious of data breaches. As such, the legislation lacks the necessary teeth to properly deter misuse of personal data.
While there is other criminal legislation law enforcement can use to combat cybercrime more broadly, the authorities in the UK and elsewhere face difficult and expensive jurisdiction hurdles as offences routinely cross borders, requiring authorities to cooperate internationally to investigate acts, then extradite and prosecute criminals. With huge volumes of encrypted data, proxy servers masking true IP addresses, secure VPNs and anonymous currency exchanges used by criminals, many authorities are falling at the first hurdle in terms of finding the necessary evidence to support a prosecution. Unfortunately, there is still a long way to go before the scale and rate of cyberattacks is brought under control by effective legislation.
Hugo Plowman and Rob Wynn Jones, Partners—Mishcon de Reya LLP
Point-of-Sale Intrusions
Payment Card Skimmers
CrimewareWeb App Attacks
Denial-of-Service Attacks
Physical Theft and Loss
Insider and Privilege Misuse
MiscellaneousErrors
Cyber- espionage
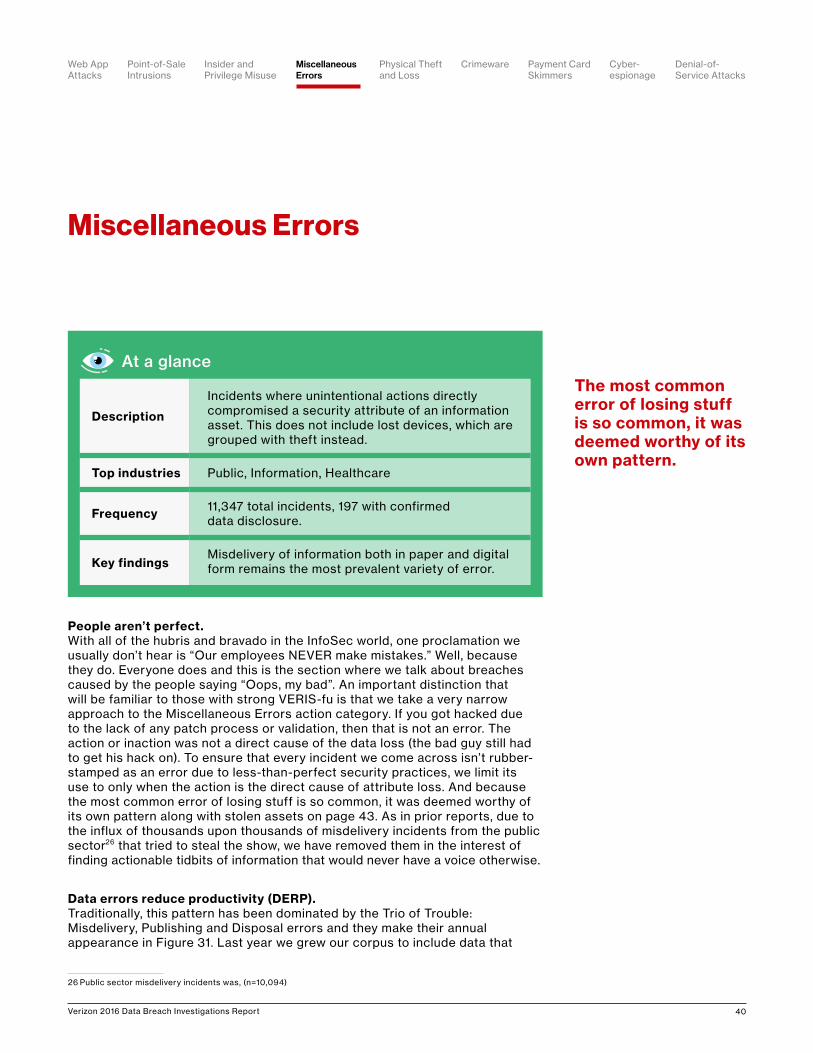
Verizon 2016 Data Breach Investigations Report 40
People aren’t perfect.With all of the hubris and bravado in the InfoSec world, one proclamation we usually don’t hear is “Our employees NEVER make mistakes.” Well, because they do. Everyone does and this is the section where we talk about breaches caused by the people saying “Oops, my bad”. An important distinction that will be familiar to those with strong VERIS-fu is that we take a very narrow approach to the Miscellaneous Errors action category. If you got hacked due to the lack of any patch process or validation, then that is not an error. The action or inaction was not a direct cause of the data loss (the bad guy still had to get his hack on). To ensure that every incident we come across isn’t rubber-stamped as an error due to less-than-perfect security practices, we limit its use to only when the action is the direct cause of attribute loss. And because the most common error of losing stuff is so common, it was deemed worthy of its own pattern along with stolen assets on page 43. As in prior reports, due to the influx of thousands upon thousands of misdelivery incidents from the public sector26 that tried to steal the show, we have removed them in the interest of finding actionable tidbits of information that would never have a voice otherwise.
Data errors reduce productivity (DERP).Traditionally, this pattern has been dominated by the Trio of Trouble: Misdelivery, Publishing and Disposal errors and they make their annual appearance in Figure 31. Last year we grew our corpus to include data that
26 Public sector misdelivery incidents was, (n=10,094)
Miscellaneous Errors
The most common error of losing stuff is so common, it was deemed worthy of its own pattern.
At a glance
Description
Incidents where unintentional actions directly compromised a security attribute of an information asset. This does not include lost devices, which are grouped with theft instead.
Top industries Public, Information, Healthcare
Frequency 11,347 total incidents, 197 with confirmed data disclosure.
Key findingsMisdelivery of information both in paper and digital form remains the most prevalent variety of error.
Point-of-Sale Intrusions
Payment Card Skimmers
CrimewareWeb App Attacks
Denial-of-Service Attacks
Physical Theft and Loss
Insider and Privilege Misuse
Miscellaneous Errors
Cyber- espionage
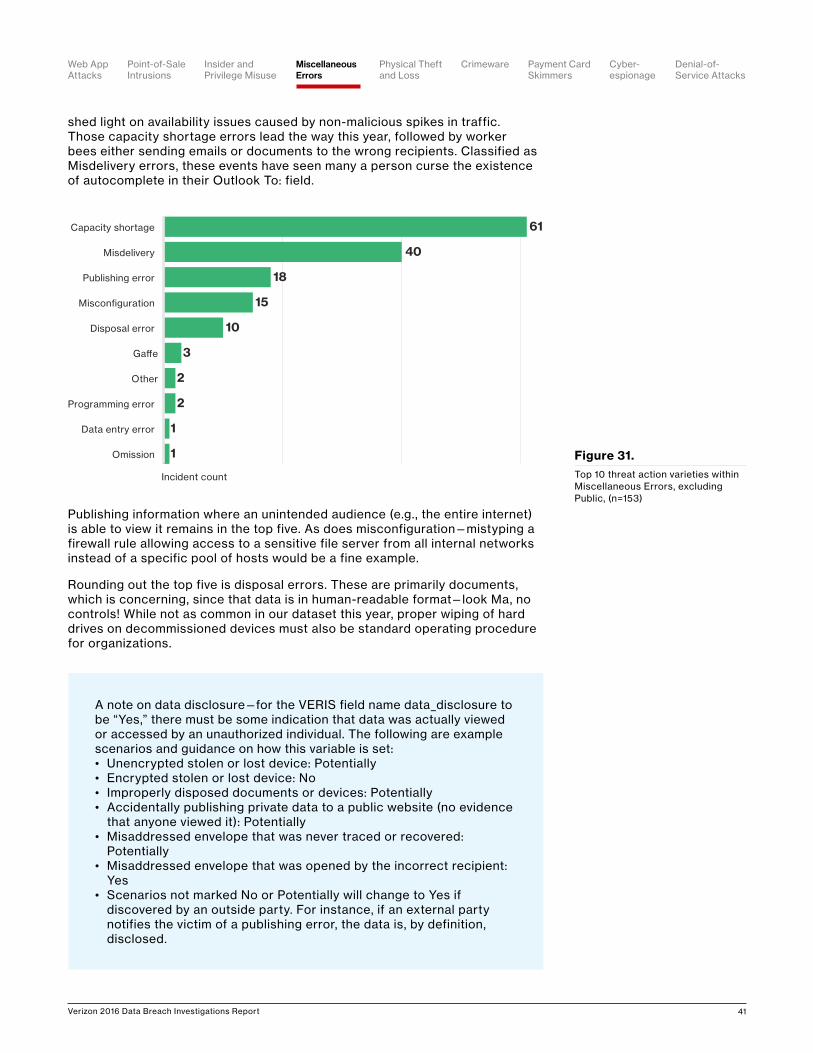
Verizon 2016 Data Breach Investigations Report 41
shed light on availability issues caused by non-malicious spikes in traffic. Those capacity shortage errors lead the way this year, followed by worker bees either sending emails or documents to the wrong recipients. Classified as Misdelivery errors, these events have seen many a person curse the existence of autocomplete in their Outlook To: field.
Publishing information where an unintended audience (e.g., the entire internet) is able to view it remains in the top five. As does misconfiguration—mistyping a firewall rule allowing access to a sensitive file server from all internal networks instead of a specific pool of hosts would be a fine example.
Rounding out the top five is disposal errors. These are primarily documents, which is concerning, since that data is in human-readable format—look Ma, no controls! While not as common in our dataset this year, proper wiping of hard drives on decommissioned devices must also be standard operating procedure for organizations.
61
40
18
15
10
3
2
2
1
1Omission
Data entry error
Programming error
Other
Ga�e
Disposal error
Misconfiguration
Publishing error
Misdelivery
Capacity shortage
Incident count
Figure 31.Top 10 threat action varieties within Miscellaneous Errors, excluding Public, (n=153)
A note on data disclosure—for the VERIS field name data_disclosure to be “Yes,” there must be some indication that data was actually viewed or accessed by an unauthorized individual. The following are example scenarios and guidance on how this variable is set:• Unencrypted stolen or lost device: Potentially• Encrypted stolen or lost device: No• Improperly disposed documents or devices: Potentially• Accidentally publishing private data to a public website (no evidence
that anyone viewed it): Potentially• Misaddressed envelope that was never traced or recovered:
Potentially• Misaddressed envelope that was opened by the incorrect recipient:
Yes• Scenarios not marked No or Potentially will change to Yes if
discovered by an outside party. For instance, if an external party notifies the victim of a publishing error, the data is, by definition, disclosed.
Point-of-Sale Intrusions
Payment Card Skimmers
CrimewareWeb App Attacks
Denial-of-Service Attacks
Physical Theft and Loss
Insider and Privilege Misuse
Miscellaneous Errors
Cyber- espionage
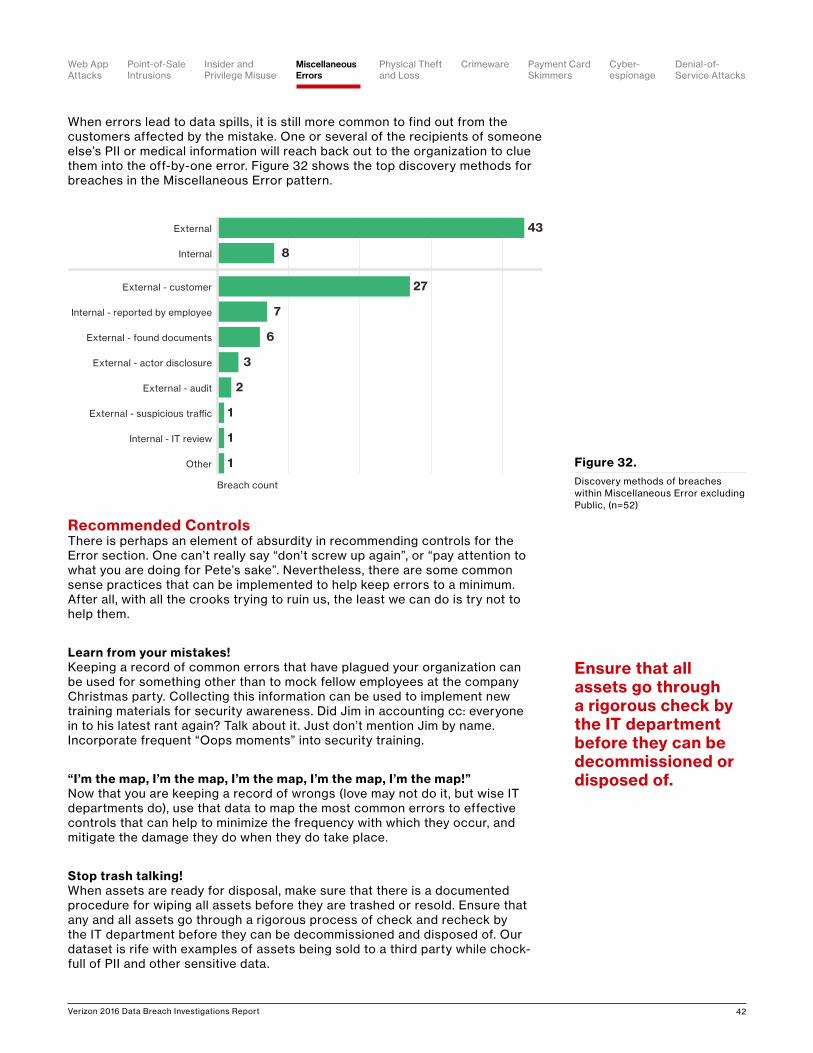
Verizon 2016 Data Breach Investigations Report 42
When errors lead to data spills, it is still more common to find out from the customers affected by the mistake. One or several of the recipients of someone else’s PII or medical information will reach back out to the organization to clue them into the off-by-one error. Figure 32 shows the top discovery methods for breaches in the Miscellaneous Error pattern.
Recommended ControlsThere is perhaps an element of absurdity in recommending controls for the Error section. One can’t really say “don’t screw up again”, or “pay attention to what you are doing for Pete’s sake”. Nevertheless, there are some common sense practices that can be implemented to help keep errors to a minimum. After all, with all the crooks trying to ruin us, the least we can do is try not to help them.
Learn from your mistakes! Keeping a record of common errors that have plagued your organization can be used for something other than to mock fellow employees at the company Christmas party. Collecting this information can be used to implement new training materials for security awareness. Did Jim in accounting cc: everyone in to his latest rant again? Talk about it. Just don’t mention Jim by name. Incorporate frequent “Oops moments” into security training.
“I’m the map, I’m the map, I’m the map, I’m the map, I’m the map!”Now that you are keeping a record of wrongs (love may not do it, but wise IT departments do), use that data to map the most common errors to effective controls that can help to minimize the frequency with which they occur, and mitigate the damage they do when they do take place.
Stop trash talking!When assets are ready for disposal, make sure that there is a documented procedure for wiping all assets before they are trashed or resold. Ensure that any and all assets go through a rigorous process of check and recheck by the IT department before they can be decommissioned and disposed of. Our dataset is rife with examples of assets being sold to a third party while chock-full of PII and other sensitive data.
43
27
8
7
6
3
2
1
1
1Other
Internal - IT review
External - suspicious trac
External - audit
External - actor disclosure
External - found documents
Internal - reported by employee
External - customer
Internal
External
Breach count
Figure 32.Discovery methods of breaches within Miscellaneous Error excluding Public, (n=52)
Ensure that all assets go through a rigorous check by the IT department before they can be decommissioned or disposed of.
Point-of-Sale Intrusions
Payment Card Skimmers
CrimewareWeb App Attacks
Denial-of-Service Attacks
Physical Theft and Loss
Insider and Privilege Misuse
Miscellaneous Errors
Cyber- espionage
Verizon 2016 Data Breach Investigations Report 43
Humans, what are you gonna do?If you have young children, the next time you are in their school take a gander at the horror show known as Lost and Found. You will see what appears to be at least 2.5 articles of clothing per student shoved in a bin and left there long enough to form a single brick of coats, hats, gloves and unidentifiable pieces of fabric that entered—but like Charlie on the MTA—never returned home. People lose things all the time—this is not new or particularly newsworthy. It is, however, a real-world pain in the neck for organizations that are at best replacing Scooter’s laptop, or at worse scrambling around to figure out if there was PII on the device and whether encryption had been implemented. And if the fallibility of Scooter weren’t enough, there are still people that want something and don’t wanna pay for it. So to sum this pattern up in haiku form:
Same old story, same old song and danceWe defined more specific guidelines on data disclosure in the sidebar featured in the Miscellaneous Error pattern. For non-encrypted devices, the
Physical Theft and Loss
For non-encrypted devices, the determination of a breach can be tough, given that you no longer have custody.
Employees lose things Bad guys also steal your stuff Full disk encryption
At a glance
DescriptionPretty much what it sounds like—any incident where an information asset went missing, whether through misplacement or malice.
Top industries Public, Healthcare
Frequency 9,701 total incidents, 56 with confirmed data disclosure.
Key findings
When we look at all incidents, laptops are the top asset affected by this pattern. However, for confirmed breaches, it is the documents, with their lack of controls, which result in the most confirmed disclosures. Lost assets were over 100 times more prevalent than theft.
Point-of-Sale Intrusions
Payment Card Skimmers
CrimewareWeb App Attacks
Denial-of-Service Attacks
Physical Theft and Loss
Insider and Privilege Misuse
Miscellaneous Errors
Cyber- espionage
Verizon 2016 Data Breach Investigations Report 44
determination of a breach can be tough, given that you no longer have custody of the computer in question. Is the data on that system at risk? Certainly, since it is trivial to bypass the sole control—the password. Still, we cannot by our definition, in most cases of lost computing devices, label them as a confirmed data breach. This discrepancy between the number of confirmed breaches and the number of incidents in this pattern shows that there is quite a bit more data in the at-risk category than the number of confirmed breaches implies.
Based on all the incidents in this pattern, laptops are the most common target. However, when we narrowed our research to confirmed breaches, documents are in the lead due to the ability to infer that the finder or thief can read the language in which the information is written.
Physical theft is a problem that we have seen time and again, and these incidents most commonly occur in the victim’s own work area (39%) or from the personal vehicle of the employee (33.9%). That said, these items are being lost far more often than they are being stolen. In this year’s data, an asset is lost over 100 times more frequently than it is stolen. At the end of the day, the impact is the same—the laptop is gone and likely wasn’t turned into Lost and Found.
Recommended controls
Just do it. Full disk encryption on all mobile devices and removable media—make it part of the standard build.
Changes in attitudes Keep hope alive that security and situational awareness will become ingrained in your users. Include physical security of corporate assets as part of their orientation and ongoing training. Reiterate that cars are not an appropriate place to leave laptops. Cars have windows which thieves have proven that they can not only see through, but also break to get what they want.
Dead treesRein in the paper as much as feasible given your business. Establish data classification and make it a policy violation, with potential consequences, to print and transport sensitive data. Consider tokenizing to replace sensitive information with an alternate unique identifier when printed copies are required.
In this year’s data, an asset is lost over 100 times more frequently than it is stolen.
Point-of-Sale Intrusions
Payment Card Skimmers
CrimewareWeb App Attacks
Denial-of-Service Attacks
Physical Theft and Loss
Insider and Privilege Misuse
Miscellaneous Errors
Cyber- espionage
Verizon 2016 Data Breach Investigations Report 45
Since the expansion of our data contributors and the advent of the patterns, Crimeware has historically been generous in the number of cases, but not so rich in detail. The majority of the incidents found in this neck of the woods come (in bulk) from CERT/CSIRT organizations, who receive them from a wide variety of organizations. These are typically high-frequency, low-impact annoyances that will not receive a full forensics investigation and/or be documented and categorized. We focus on the smaller subset of incidents where the fidelity is higher and use those as predictors into the nature of the rest. This year we also will be delving into malware data received from our security vendor contributors (many thanks to Cylance, Fortinet, ICSA Labs, Palo Alto Networks and Tenable) to shed some light on certain areas.
When the functionality of the malware was known, C2, ransomware, spyware/keylogger, and backdoor and export data were the top five functionalities (see Figure 33). Notably absent is malware designed to DoS another target—these were culled with the secondary motive filter discussed on page 8. Over
Crimeware
Typically, these are high-frequency, low-impact annoyances that will not receive a full forensics investigation.
At a glance
Description
Any incident involving malware that did not fit into a more specific pattern. The majority of the incidents that comprise this pattern are opportunistic in nature and have a financial motivation behind them. This pattern frequently affects consumers and is where “typical” malware infections will land.
Top industries Public, Information, Finance
Frequency7,951 total incidents (6,858 additional with secondary motivation), 49 with confirmed data disclosure.
Key findings
The Crimeware pattern continues to be driven by external organized criminal groups that are financially motivated. Establishment of control over a device using C2 malware followed by ransomware, then the targeting of credentials or enrollment into a botnet accounts for the majority of the incidents.
Point-of-Sale Intrusions
Payment Card Skimmers
CrimewareWeb App Attacks
Denial-of-Service Attacks
Physical Theft and Loss
Insider and Privilege Misuse
Miscellaneous Errors
Cyber- espionage
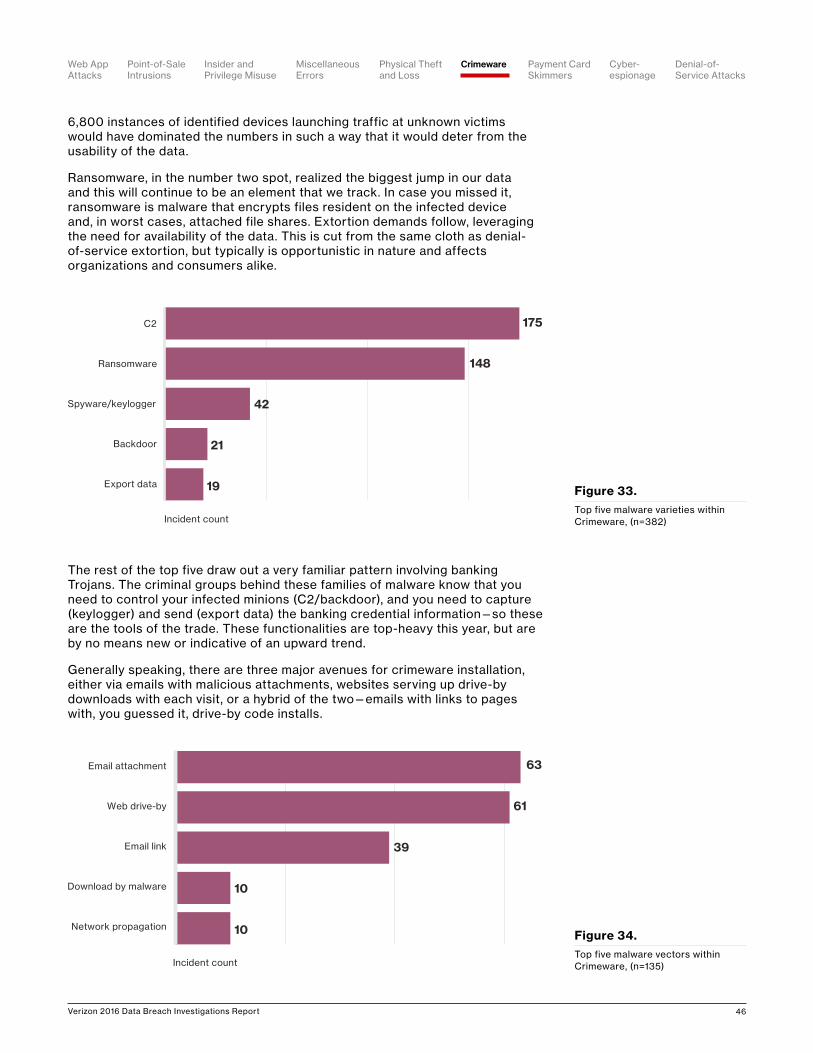
Verizon 2016 Data Breach Investigations Report 46
6,800 instances of identified devices launching traffic at unknown victims would have dominated the numbers in such a way that it would deter from the usability of the data.
Ransomware, in the number two spot, realized the biggest jump in our data and this will continue to be an element that we track. In case you missed it, ransomware is malware that encrypts files resident on the infected device and, in worst cases, attached file shares. Extortion demands follow, leveraging the need for availability of the data. This is cut from the same cloth as denial-of-service extortion, but typically is opportunistic in nature and affects organizations and consumers alike.
The rest of the top five draw out a very familiar pattern involving banking Trojans. The criminal groups behind these families of malware know that you need to control your infected minions (C2/backdoor), and you need to capture (keylogger) and send (export data) the banking credential information—so these are the tools of the trade. These functionalities are top-heavy this year, but are by no means new or indicative of an upward trend.
Generally speaking, there are three major avenues for crimeware installation, either via emails with malicious attachments, websites serving up drive-by downloads with each visit, or a hybrid of the two—emails with links to pages with, you guessed it, drive-by code installs.
175
148
42
21
19Export data
Backdoor
Spyware/keylogger
Ransomware
C2
Incident count
Figure 33.Top five malware varieties within Crimeware, (n=382)
Figure 34.Top five malware vectors within Crimeware, (n=135)
63
61
39
10
10Network propagation
Download by malware
Email link
Web drive-by
Email attachment
Incident count
Point-of-Sale Intrusions
Payment Card Skimmers
CrimewareWeb App Attacks
Denial-of-Service Attacks
Physical Theft and Loss
Insider and Privilege Misuse
Miscellaneous Errors
Cyber- espionage
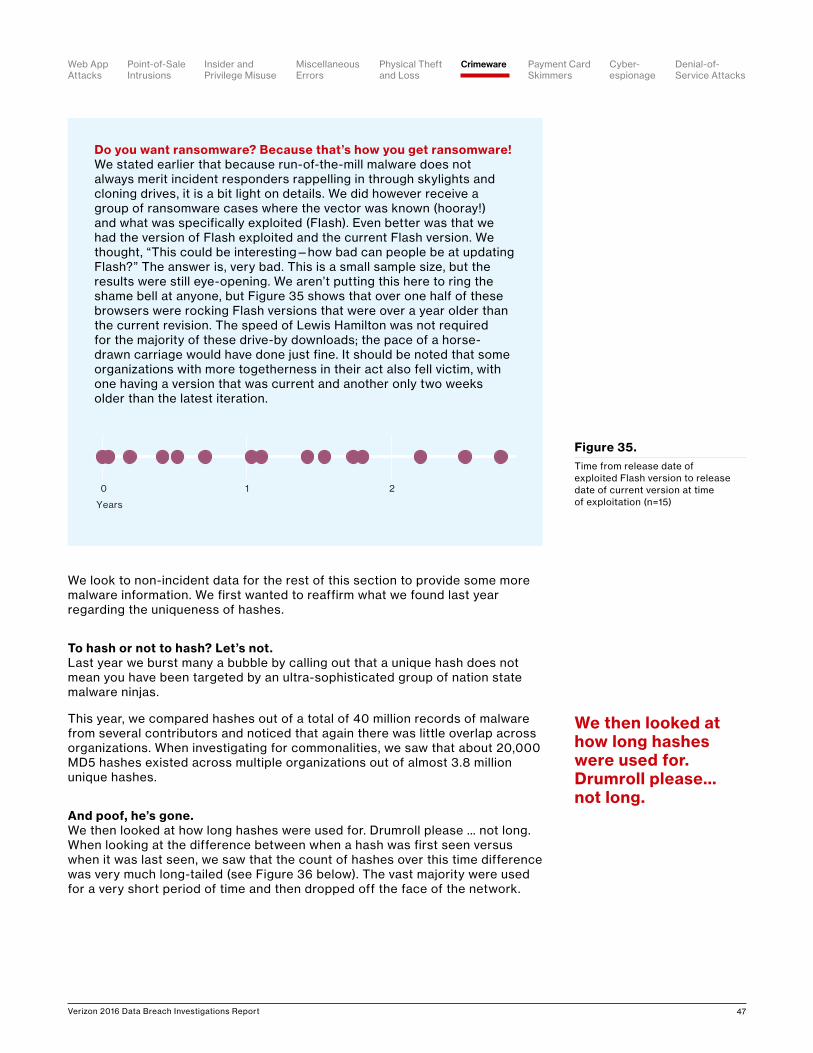
Verizon 2016 Data Breach Investigations Report 47
We look to non-incident data for the rest of this section to provide some more malware information. We first wanted to reaffirm what we found last year regarding the uniqueness of hashes.
To hash or not to hash? Let’s not.Last year we burst many a bubble by calling out that a unique hash does not mean you have been targeted by an ultra-sophisticated group of nation state malware ninjas.
This year, we compared hashes out of a total of 40 million records of malware from several contributors and noticed that again there was little overlap across organizations. When investigating for commonalities, we saw that about 20,000 MD5 hashes existed across multiple organizations out of almost 3.8 million unique hashes.
And poof, he’s gone.We then looked at how long hashes were used for. Drumroll please … not long. When looking at the difference between when a hash was first seen versus when it was last seen, we saw that the count of hashes over this time difference was very much long-tailed (see Figure 36 below). The vast majority were used for a very short period of time and then dropped off the face of the network.
Do you want ransomware? Because that’s how you get ransomware!We stated earlier that because run-of-the-mill malware does not always merit incident responders rappelling in through skylights and cloning drives, it is a bit light on details. We did however receive a group of ransomware cases where the vector was known (hooray!) and what was specifically exploited (Flash). Even better was that we had the version of Flash exploited and the current Flash version. We thought, “This could be interesting—how bad can people be at updating Flash?” The answer is, very bad. This is a small sample size, but the results were still eye-opening. We aren’t putting this here to ring the shame bell at anyone, but Figure 35 shows that over one half of these browsers were rocking Flash versions that were over a year older than the current revision. The speed of Lewis Hamilton was not required for the majority of these drive-by downloads; the pace of a horse-drawn carriage would have done just fine. It should be noted that some organizations with more togetherness in their act also fell victim, with one having a version that was current and another only two weeks older than the latest iteration.
0 1 2
Years
Figure 35.Time from release date of exploited Flash version to release date of current version at time of exploitation (n=15)
We then looked at how long hashes were used for. Drumroll please… not long.
Point-of-Sale Intrusions
Payment Card Skimmers
CrimewareWeb App Attacks
Denial-of-Service Attacks
Physical Theft and Loss
Insider and Privilege Misuse
Miscellaneous Errors
Cyber- espionage
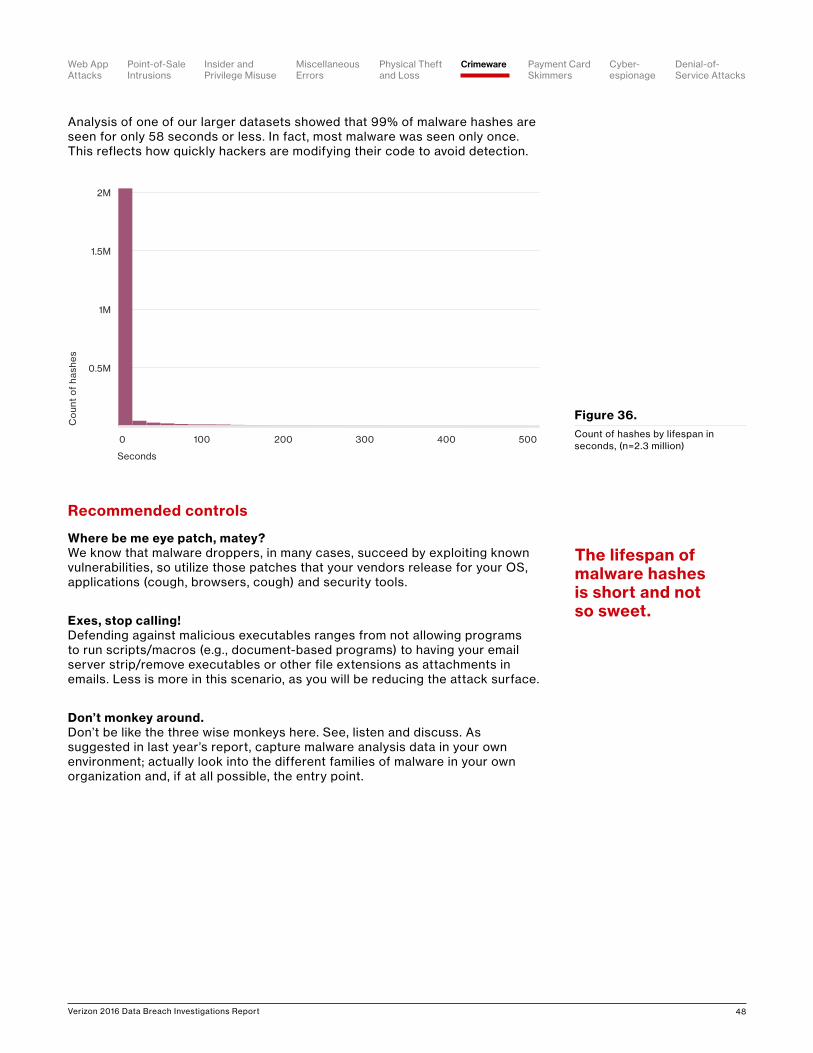
Verizon 2016 Data Breach Investigations Report 48
Analysis of one of our larger datasets showed that 99% of malware hashes are seen for only 58 seconds or less. In fact, most malware was seen only once. This reflects how quickly hackers are modifying their code to avoid detection.
Recommended controls
Where be me eye patch, matey? We know that malware droppers, in many cases, succeed by exploiting known vulnerabilities, so utilize those patches that your vendors release for your OS, applications (cough, browsers, cough) and security tools.
Exes, stop calling!Defending against malicious executables ranges from not allowing programs to run scripts/macros (e.g., document-based programs) to having your email server strip/remove executables or other file extensions as attachments in emails. Less is more in this scenario, as you will be reducing the attack surface.
Don’t monkey around. Don’t be like the three wise monkeys here. See, listen and discuss. As suggested in last year’s report, capture malware analysis data in your own environment; actually look into the different families of malware in your own organization and, if at all possible, the entry point.
0.5M
1M
1.5M
2M
0 200 400
Seconds
Co
unt
of
hash
es
100 300 500
Figure 36.Count of hashes by lifespan in seconds, (n=2.3 million)
The lifespan of malware hashes is short and not so sweet.
Point-of-Sale Intrusions
Payment Card Skimmers
CrimewareWeb App Attacks
Denial-of-Service Attacks
Physical Theft and Loss
Insider and Privilege Misuse
Miscellaneous Errors
Cyber- espionage
Verizon 2016 Data Breach Investigations Report 49
Payment Card Skimmers
“Third verse, same as the first”In a world full of chaos and change, it is a comfort to know that you can rely on certain things to stay relatively constant. For instance, your bread will always fall buttered-side down, your distance from a bathroom will remain in direct proportion to the urgency of your need for one and skimming won’t really change much from year to year. That is probably because the crooks were raised in the “If it ain’t broke, don’t fix it” school. Payment card skimming remains one of the most lucrative and easy to pull off crimes, both for organized criminals and the occasional independent pilferer (he’s just a poor boy, from a poor family).
Due to the fact that these incidents come mainly from US-based law enforcement, our data is almost entirely US-centric with regard to victim location. However, since the bulk of it can be blamed on criminal organizations
At a glance
Description
All incidents in which a skimming device was physically implanted (tampering) on an asset that reads magnetic stripe data from a payment card (e.g., ATMs, gas pumps, POS terminals, etc.).
Top industries Finance, Retail
Frequency 102 total incidents, 86 with confirmed data disclosure.
Key findings
There continues to be little variation in this pattern. Actors from Eastern Europe favor this attack type, with ATMs the target of choice and the discovery method remains largely external.
70% of Payment card skimming incidents in our dataset can be blamed on criminal organizations.
Point-of-Sale Intrusions
Payment Card Skimmers
CrimewareWeb App Attacks
Denial-of-Service Attacks
Physical Theft and Loss
Insider and Privilege Misuse
Miscellaneous Errors
Cyber- espionage
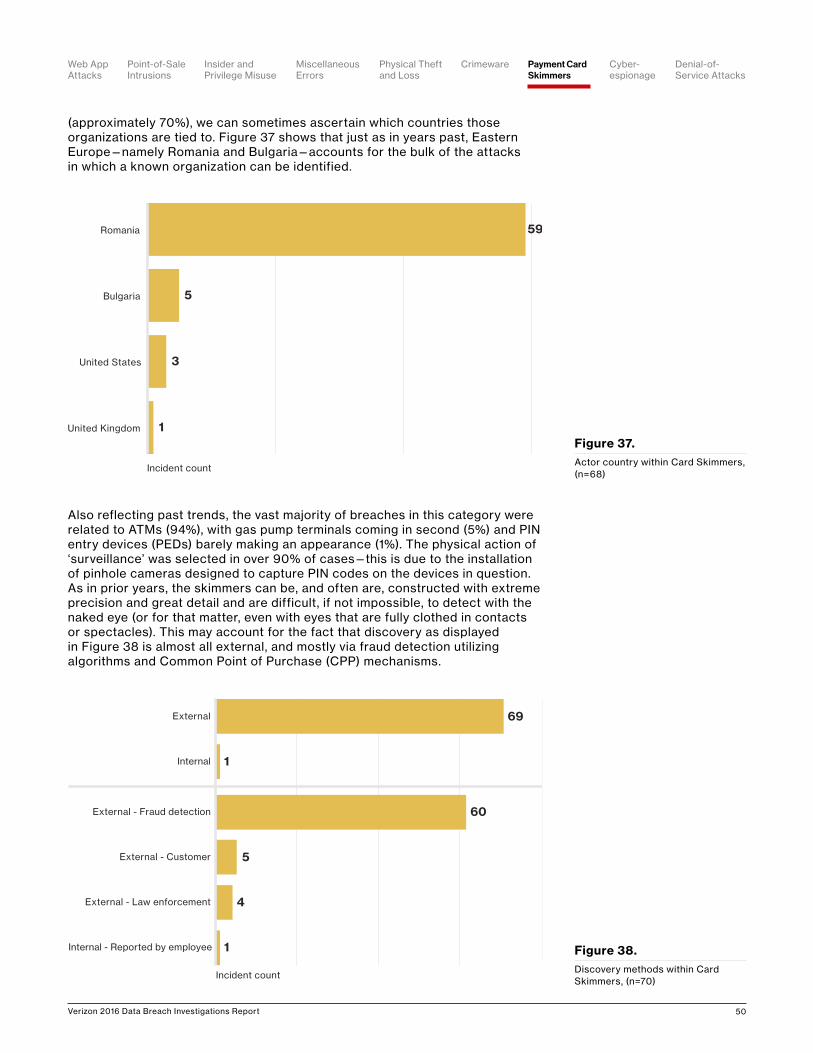
Verizon 2016 Data Breach Investigations Report 50
(approximately 70%), we can sometimes ascertain which countries those organizations are tied to. Figure 37 shows that just as in years past, Eastern Europe—namely Romania and Bulgaria—accounts for the bulk of the attacks in which a known organization can be identified.
Also reflecting past trends, the vast majority of breaches in this category were related to ATMs (94%), with gas pump terminals coming in second (5%) and PIN entry devices (PEDs) barely making an appearance (1%). The physical action of ‘surveillance’ was selected in over 90% of cases—this is due to the installation of pinhole cameras designed to capture PIN codes on the devices in question. As in prior years, the skimmers can be, and often are, constructed with extreme precision and great detail and are difficult, if not impossible, to detect with the naked eye (or for that matter, even with eyes that are fully clothed in contacts or spectacles). This may account for the fact that discovery as displayed in Figure 38 is almost all external, and mostly via fraud detection utilizing algorithms and Common Point of Purchase (CPP) mechanisms.
59
5
3
1United Kingdom
United States
Bulgaria
Romania
Incident count
Figure 37.Actor country within Card Skimmers, (n=68)
69
60
5
4
1
1
Internal - Reported by employee
External - Law enforcement
External - Customer
External - Fraud detection
Internal
External
Incident count
Figure 38.Discovery methods within Card Skimmers, (n=70)
Point-of-Sale Intrusions
Payment Card Skimmers
CrimewareWeb App Attacks
Denial-of-Service Attacks
Physical Theft and Loss
Insider and Privilege Misuse
Miscellaneous Errors
Cyber- espionage
Verizon 2016 Data Breach Investigations Report 51
“And finally... some bad news”With regard to discovery timelines, we discussed last year that detection times were getting better, and were leaning heavily toward the ‘days’ category rather than ‘weeks’ or ‘months’. This year, we do not see that shift continuing. On the contrary, discovery times are firmly entrenched in the ‘weeks’ this year. There is a dramatic decline in internal discovery and a corresponding increase in discovery by fraud detection in our dataset this year. It is not clear whether the employees of victim organizations all need a better prescription vision plan, or whether it is simply that those victims who discover the tampering themselves quickly remove the devices without reporting it to law enforcement (or not to the agencies that partner in this research). Naturally, it is quicker to discover skimming-related theft when you see it with your own eyes than it is to wait for signs of CPP to appear, so the relative change in each category would make sense.
Recommended controls
Merchants• Purchase tamper-resistant terminals: Certain designs are more susceptible to
tampering than others. Some models of ATMs are designed with this in mind. Look to those when purchasing new equipment.
• Use tamper-evident controls: When possible, do things that will help to make it clearer when tampering occurs. For instance, apply stickers over the door of the terminals and monitor video footage of the ATMs and gas pumps to see if anyone has tampered with the equipment.
• Time for a checkup: Establish a process to check the physical integrity of ATMs. Employees can be trained on how to spot evidence of tampering and seek it out as a scheduled task.
Consumers• Guard your PIN: When entering your PIN, cover your hand so that any pinhole
camera can’t see what you are entering. • Trust your gut: If you think that something looks odd or out of place, don’t use
it. While it is increasingly difficult to find signs of tampering, it is not impossible. If you think a device may have been tampered with, move on to another location, after reporting to the merchant or bank staff.
There is a dramatic decline in internal discovery and a corresponding increase in discovery by fraud detection.
Point-of-Sale Intrusions
Payment Card Skimmers
CrimewareWeb App Attacks
Denial-of-Service Attacks
Physical Theft and Loss
Insider and Privilege Misuse
Miscellaneous Errors
Cyber- espionage
Verizon 2016 Data Breach Investigations Report 52
Espionage, cyber-espionageUnlike Bond movies, Cyber-espionage has a glaring lack of machine-gun umbrellas, henchmen with razor-rimmed hats and tear-gas-laden briefcases.
It does, however, have a diverse victim demographic, and while the villains may not be exfiltrating data to an underground fortress disguised as a volcano, they are certainly more skilled and patient than your script kiddies. If you want to dig into some dossiers, see the research studies by some DBIR contributors and others wearing the white hats in the Cyber-espionage Research sidebar.
First, let’s define the pattern for you. Cyber-espionage features external threat Actors infiltrating victim networks seeking sensitive internal data and trade secrets. Incidents where an employee steals the customer database and sets up his own lemonade stand will fall into the Privilege Misuse pattern. The Actors are predominantly state-affiliated groups, although organized criminal groups,
Cyber-espionage
The Actors are predominantly state-affiliated groups. Competitors and nation states are also mixing it up.
At a glance
DescriptionIncidents in this pattern include unauthorized network or system access linked to state-affiliated Actors and/or exhibiting the motive of espionage.
Top industries Public, Information, Manufacturing
Frequency 247 total incidents, 155 with confirmed data disclosure.
Key findingsEspionage begins with the same threat actions as many other patterns to gain access, but will deviate as needed once the initial compromise occurs.
Point-of-Sale Intrusions
Payment Card Skimmers
CrimewareWeb App Attacks
Denial-of-Service Attacks
Physical Theft and Loss
Insider and Privilege Misuse
Miscellaneous Errors
Cyber- espionage
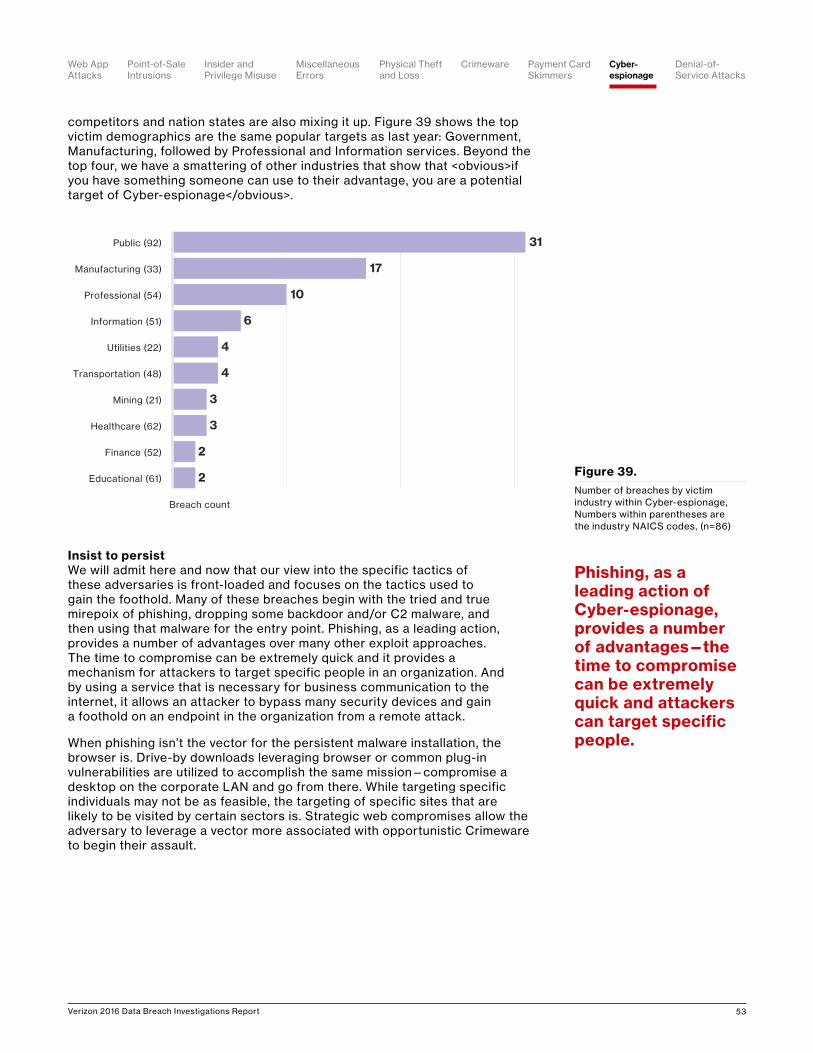
Verizon 2016 Data Breach Investigations Report 53
competitors and nation states are also mixing it up. Figure 39 shows the top victim demographics are the same popular targets as last year: Government, Manufacturing, followed by Professional and Information services. Beyond the top four, we have a smattering of other industries that show that <obvious>if you have something someone can use to their advantage, you are a potential target of Cyber-espionage</obvious>.
Insist to persistWe will admit here and now that our view into the specific tactics of these adversaries is front-loaded and focuses on the tactics used to gain the foothold. Many of these breaches begin with the tried and true mirepoix of phishing, dropping some backdoor and/or C2 malware, and then using that malware for the entry point. Phishing, as a leading action, provides a number of advantages over many other exploit approaches. The time to compromise can be extremely quick and it provides a mechanism for attackers to target specific people in an organization. And by using a service that is necessary for business communication to the internet, it allows an attacker to bypass many security devices and gain a foothold on an endpoint in the organization from a remote attack.
When phishing isn’t the vector for the persistent malware installation, the browser is. Drive-by downloads leveraging browser or common plug-in vulnerabilities are utilized to accomplish the same mission—compromise a desktop on the corporate LAN and go from there. While targeting specific individuals may not be as feasible, the targeting of specific sites that are likely to be visited by certain sectors is. Strategic web compromises allow the adversary to leverage a vector more associated with opportunistic Crimeware to begin their assault.
31
17
10
6
4
4
3
3
2
2Educational (61)
Finance (52)
Healthcare (62)
Mining (21)
Transportation (48)
Utilities (22)
Information (51)
Professional (54)
Manufacturing (33)
Public (92)
Breach count
Figure 39.Number of breaches by victim industry within Cyber-espionage, Numbers within parentheses are the industry NAICS codes, (n=86)
Phishing, as a leading action of Cyber-espionage, provides a number of advantages—the time to compromise can be extremely quick and attackers can target specific people.
Point-of-Sale Intrusions
Payment Card Skimmers
CrimewareWeb App Attacks
Denial-of-Service Attacks
Physical Theft and Loss
Insider and Privilege Misuse
Miscellaneous Errors
Cyber- espionage
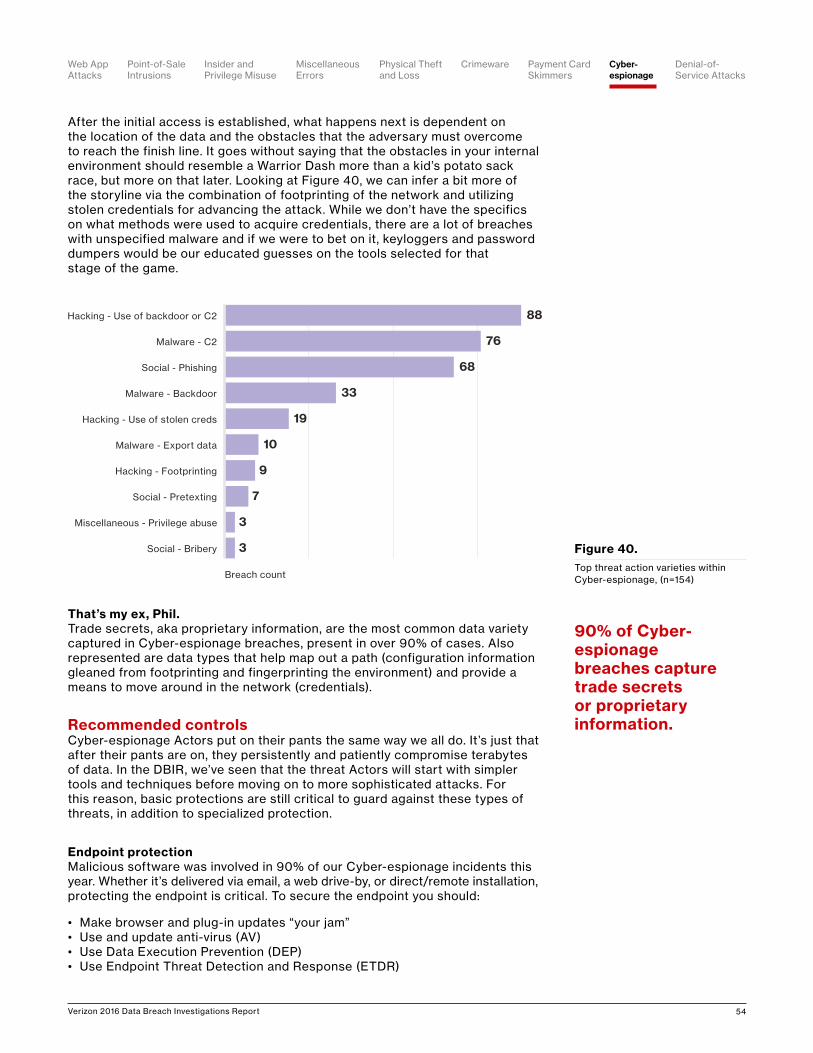
Verizon 2016 Data Breach Investigations Report 54
After the initial access is established, what happens next is dependent on the location of the data and the obstacles that the adversary must overcome to reach the finish line. It goes without saying that the obstacles in your internal environment should resemble a Warrior Dash more than a kid’s potato sack race, but more on that later. Looking at Figure 40, we can infer a bit more of the storyline via the combination of footprinting of the network and utilizing stolen credentials for advancing the attack. While we don’t have the specifics on what methods were used to acquire credentials, there are a lot of breaches with unspecified malware and if we were to bet on it, keyloggers and password dumpers would be our educated guesses on the tools selected for that stage of the game.
That’s my ex, Phil.Trade secrets, aka proprietary information, are the most common data variety captured in Cyber-espionage breaches, present in over 90% of cases. Also represented are data types that help map out a path (configuration information gleaned from footprinting and fingerprinting the environment) and provide a means to move around in the network (credentials).
Recommended controlsCyber-espionage Actors put on their pants the same way we all do. It’s just that after their pants are on, they persistently and patiently compromise terabytes of data. In the DBIR, we’ve seen that the threat Actors will start with simpler tools and techniques before moving on to more sophisticated attacks. For this reason, basic protections are still critical to guard against these types of threats, in addition to specialized protection.
Endpoint protectionMalicious software was involved in 90% of our Cyber-espionage incidents this year. Whether it’s delivered via email, a web drive-by, or direct/remote installation, protecting the endpoint is critical. To secure the endpoint you should:
• Make browser and plug-in updates “your jam”• Use and update anti-virus (AV)• Use Data Execution Prevention (DEP)• Use Endpoint Threat Detection and Response (ETDR)
88
76
68
33
19
10
9
7
3
3Social - Bribery
Miscellaneous - Privilege abuse
Social - Pretexting
Hacking - Footprinting
Malware - Export data
Hacking - Use of stolen creds
Malware - Backdoor
Social - Phishing
Malware - C2
Hacking - Use of backdoor or C2
Breach count
Figure 40.Top threat action varieties within Cyber-espionage, (n=154)
90% of Cyber-espionage breaches capture trade secrets or proprietary information.
Point-of-Sale Intrusions
Payment Card Skimmers
CrimewareWeb App Attacks
Denial-of-Service Attacks
Physical Theft and Loss
Insider and Privilege Misuse
Miscellaneous Errors
Cyber- espionage
Verizon 2016 Data Breach Investigations Report 55
Email protectionAs phishing remains a dominant Cyber-espionage attack vector, protecting this means of communication is critical. To protect against email-based attacks, implement defenses that incorporate:
• Spam protection• Block lists• Header analysis• Static/Dynamic email attachment and URL analysis• Reporting procedures for suspected phishing attempts
Network protectionProtecting the network is critical to securing your internal systems, even if a foothold has been established. To defend the network, work to:
• Use two-factor authentication• Segment the network• Block C2 communications and remediate compromises
Monitoring/LoggingInternal monitoring of networks, devices and applications is necessary to learn the lessons from all these hacks. At a minimum, work to implement:
• Account monitoring• Audit log monitoring• Network/IDS monitoring
Cyber-espionage research published in 2015/Q1 2016The DBIR focuses on overall trends and statistics related to Cyber-espionage incidents and breaches. Several organizations that have contributed to this publication over the years have done some writing of their own and published in-depth research and analysis on the Actors that are on the hunt for intellectual property.• APT28 (FireEye)• APT30 (FireEye)• Duqu Threat Actor (Kaspersky)• Morpho Group (McAfee)• Various Actors/Campaigns (Kaspersky)• Project CameraShy (Threat Connect)• Various Actors/Campaigns (CrowdStrike)
Point-of-Sale Intrusions
Payment Card Skimmers
CrimewareWeb App Attacks
Denial-of-Service Attacks
Physical Theft and Loss
Insider and Privilege Misuse
Miscellaneous Errors
Cyber- espionage
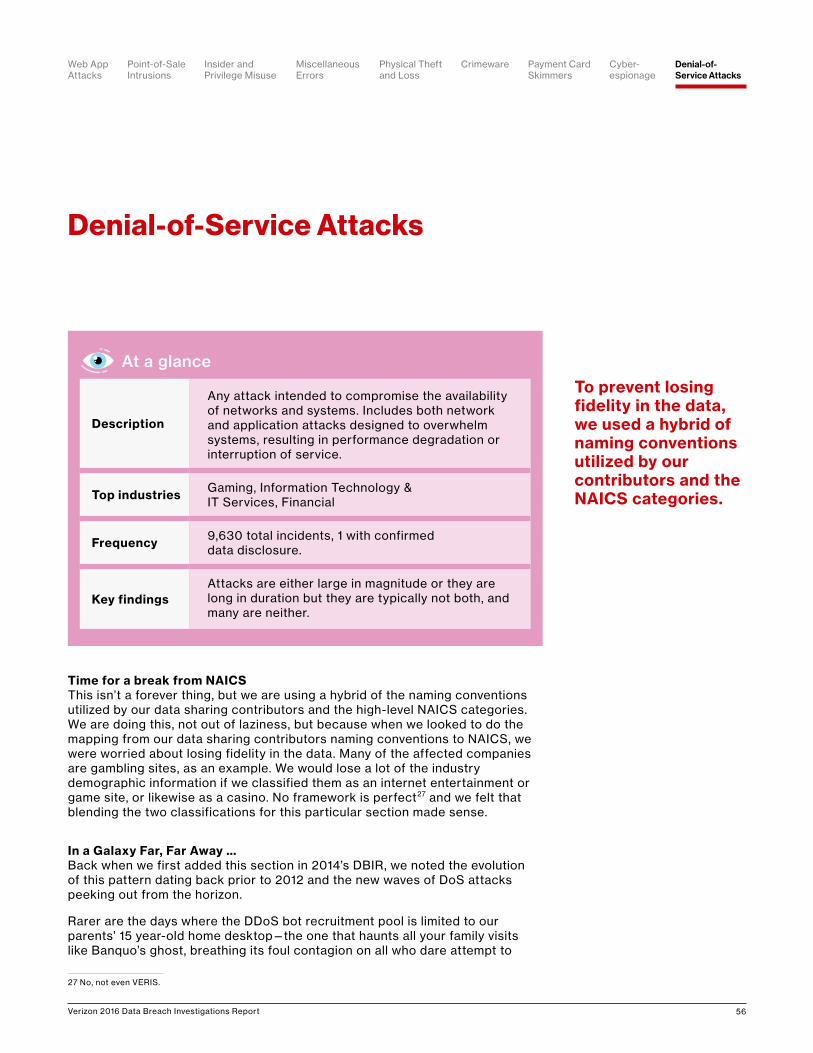
Verizon 2016 Data Breach Investigations Report 56
Time for a break from NAICSThis isn’t a forever thing, but we are using a hybrid of the naming conventions utilized by our data sharing contributors and the high-level NAICS categories. We are doing this, not out of laziness, but because when we looked to do the mapping from our data sharing contributors naming conventions to NAICS, we were worried about losing fidelity in the data. Many of the affected companies are gambling sites, as an example. We would lose a lot of the industry demographic information if we classified them as an internet entertainment or game site, or likewise as a casino. No framework is perfect27 and we felt that blending the two classifications for this particular section made sense.
In a Galaxy Far, Far Away …Back when we first added this section in 2014’s DBIR, we noted the evolution of this pattern dating back prior to 2012 and the new waves of DoS attacks peeking out from the horizon.
Rarer are the days where the DDoS bot recruitment pool is limited to our parents’ 15 year-old home desktop—the one that haunts all your family visits like Banquo’s ghost, breathing its foul contagion on all who dare attempt to
27 No, not even VERIS.
Denial-of-Service Attacks
To prevent losing fidelity in the data, we used a hybrid of naming conventions utilized by our contributors and the NAICS categories.
At a glance
Description
Any attack intended to compromise the availability of networks and systems. Includes both network and application attacks designed to overwhelm systems, resulting in performance degradation or interruption of service.
Top industries Gaming, Information Technology & IT Services, Financial
Frequency 9,630 total incidents, 1 with confirmed data disclosure.
Key findingsAttacks are either large in magnitude or they are long in duration but they are typically not both, and many are neither.
Point-of-Sale Intrusions
Payment Card Skimmers
CrimewareWeb App Attacks
Denial-of-Service Attacks
Physical Theft and Loss
Insider and Privilege Misuse
Miscellaneous Errors
Cyber- espionage
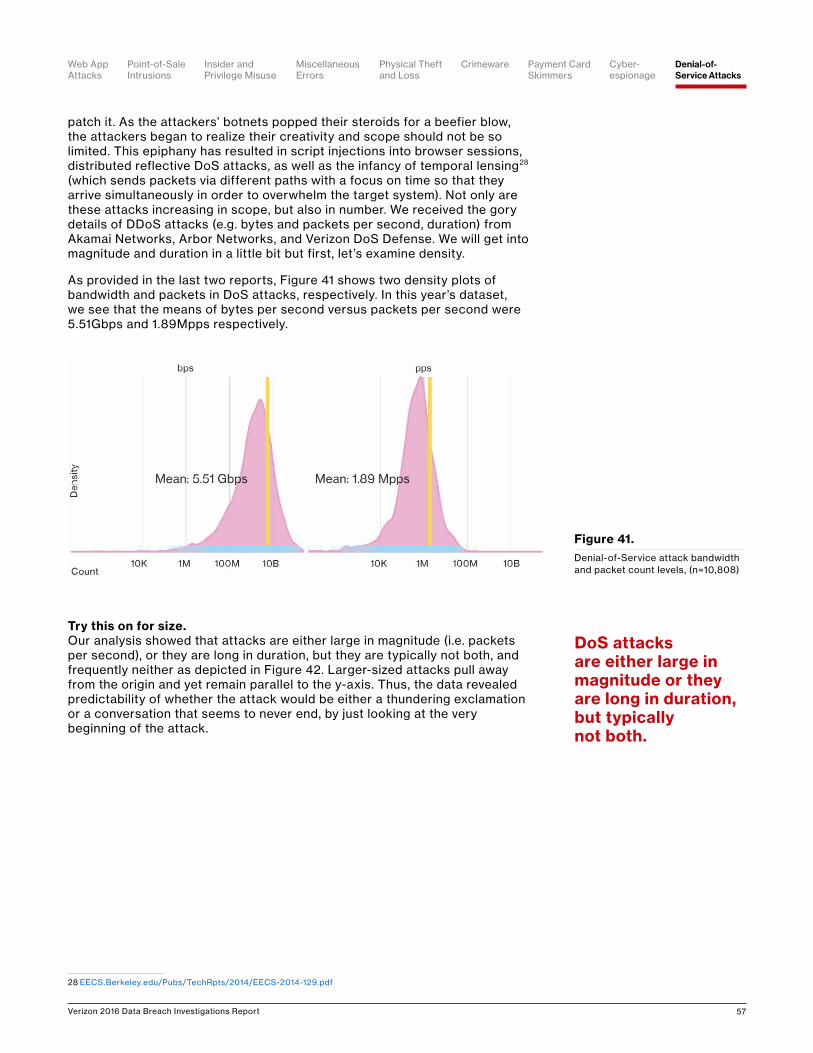
Verizon 2016 Data Breach Investigations Report 57
patch it. As the attackers’ botnets popped their steroids for a beefier blow, the attackers began to realize their creativity and scope should not be so limited. This epiphany has resulted in script injections into browser sessions, distributed reflective DoS attacks, as well as the infancy of temporal lensing28 (which sends packets via different paths with a focus on time so that they arrive simultaneously in order to overwhelm the target system). Not only are these attacks increasing in scope, but also in number. We received the gory details of DDoS attacks (e.g. bytes and packets per second, duration) from Akamai Networks, Arbor Networks, and Verizon DoS Defense. We will get into magnitude and duration in a little bit but first, let’s examine density.
As provided in the last two reports, Figure 41 shows two density plots of bandwidth and packets in DoS attacks, respectively. In this year’s dataset, we see that the means of bytes per second versus packets per second were 5.51Gbps and 1.89Mpps respectively.
Try this on for size. Our analysis showed that attacks are either large in magnitude (i.e. packets per second), or they are long in duration, but they are typically not both, and frequently neither as depicted in Figure 42. Larger-sized attacks pull away from the origin and yet remain parallel to the y-axis. Thus, the data revealed predictability of whether the attack would be either a thundering exclamation or a conversation that seems to never end, by just looking at the very beginning of the attack.
28 EECS.Berkeley.edu/Pubs/TechRpts/2014/EECS-2014-129.pdf
Figure 41.Denial-of-Service attack bandwidth and packet count levels, (n=10,808)
DoS attacks are either large in magnitude or they are long in duration, but typically not both.
Point-of-Sale Intrusions
Payment Card Skimmers
CrimewareWeb App Attacks
Denial-of-Service Attacks
Physical Theft and Loss
Insider and Privilege Misuse
Miscellaneous Errors
Cyber- espionage
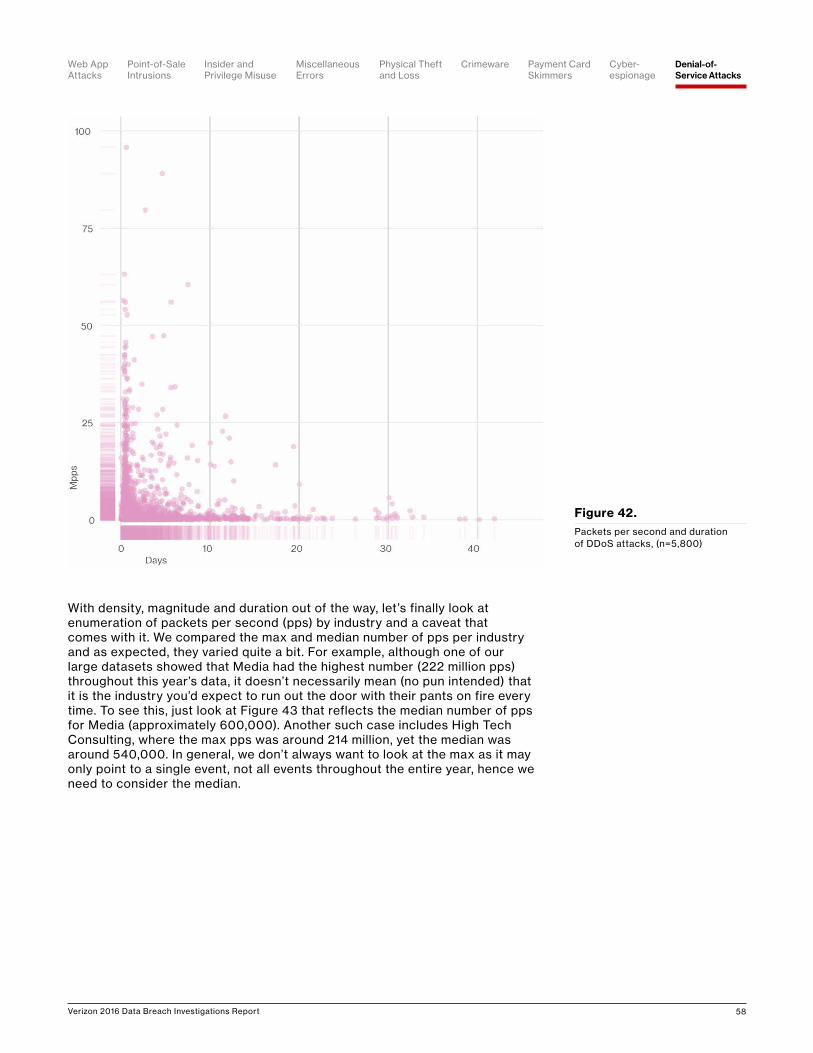
Verizon 2016 Data Breach Investigations Report 58
Figure 42.Packets per second and duration of DDoS attacks, (n=5,800)
With density, magnitude and duration out of the way, let’s finally look at enumeration of packets per second (pps) by industry and a caveat that comes with it. We compared the max and median number of pps per industry and as expected, they varied quite a bit. For example, although one of our large datasets showed that Media had the highest number (222 million pps) throughout this year’s data, it doesn’t necessarily mean (no pun intended) that it is the industry you’d expect to run out the door with their pants on fire every time. To see this, just look at Figure 43 that reflects the median number of pps for Media (approximately 600,000). Another such case includes High Tech Consulting, where the max pps was around 214 million, yet the median was around 540,000. In general, we don’t always want to look at the max as it may only point to a single event, not all events throughout the entire year, hence we need to consider the median.
Point-of-Sale Intrusions
Payment Card Skimmers
CrimewareWeb App Attacks
Denial-of-Service Attacks
Physical Theft and Loss
Insider and Privilege Misuse
Miscellaneous Errors
Cyber- espionage
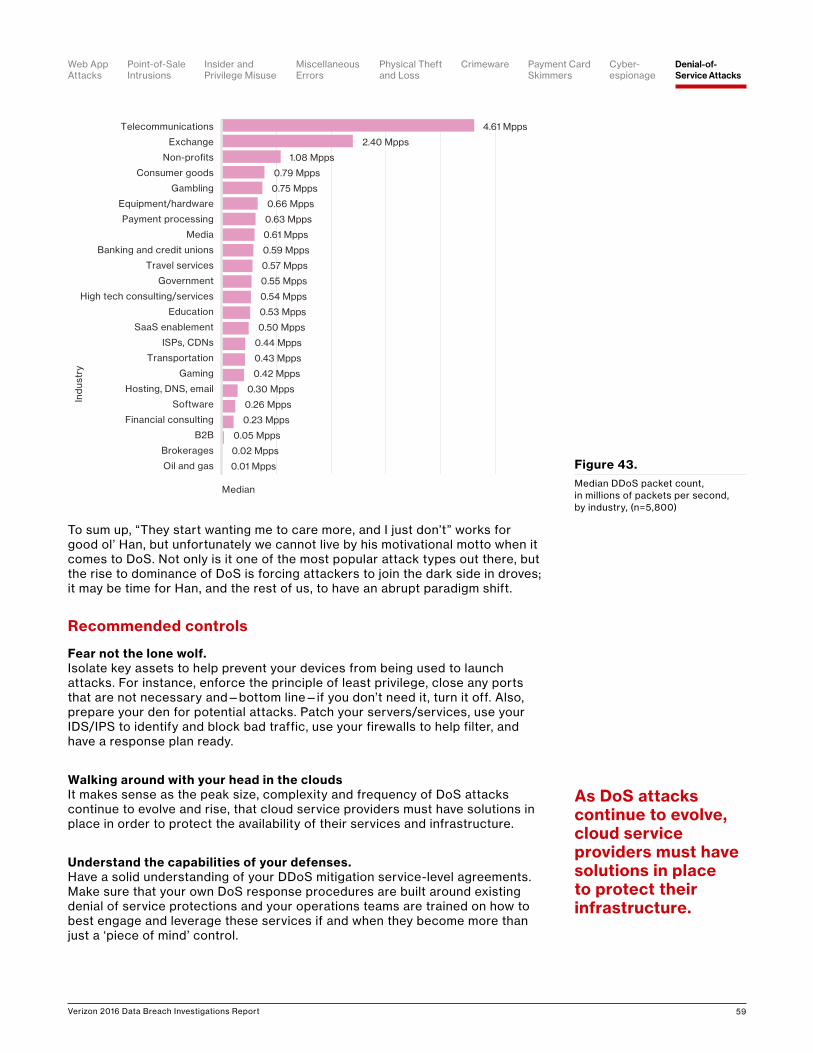
Verizon 2016 Data Breach Investigations Report 59
Figure 43.Median DDoS packet count, in millions of packets per second, by industry, (n=5,800)
To sum up, “They start wanting me to care more, and I just don’t” works for good ol’ Han, but unfortunately we cannot live by his motivational motto when it comes to DoS. Not only is it one of the most popular attack types out there, but the rise to dominance of DoS is forcing attackers to join the dark side in droves; it may be time for Han, and the rest of us, to have an abrupt paradigm shift.
Recommended controls
Fear not the lone wolf.Isolate key assets to help prevent your devices from being used to launch attacks. For instance, enforce the principle of least privilege, close any ports that are not necessary and—bottom line—if you don’t need it, turn it off. Also, prepare your den for potential attacks. Patch your servers/services, use your IDS/IPS to identify and block bad traffic, use your firewalls to help filter, and have a response plan ready.
Walking around with your head in the cloudsIt makes sense as the peak size, complexity and frequency of DoS attacks continue to evolve and rise, that cloud service providers must have solutions in place in order to protect the availability of their services and infrastructure.
Understand the capabilities of your defenses.Have a solid understanding of your DDoS mitigation service-level agreements. Make sure that your own DoS response procedures are built around existing denial of service protections and your operations teams are trained on how to best engage and leverage these services if and when they become more than just a ‘piece of mind’ control.
4.61 Mpps
2.40 Mpps
1.08 Mpps
0.79 Mpps
0.75 Mpps
0.66 Mpps
0.63 Mpps
0.61 Mpps
0.59 Mpps
0.57 Mpps
0.55 Mpps
0.54 Mpps
0.53 Mpps
0.50 Mpps
0.44 Mpps
0.43 Mpps
0.42 Mpps
0.30 Mpps
0.26 Mpps
0.23 Mpps
0.05 Mpps
0.02 Mpps
0.01 MppsOil and gas
Brokerages
B2B
Financial consulting
Software
Hosting, DNS, email
Gaming
Transportation
ISPs, CDNs
SaaS enablement
Education
High tech consulting/services
Government
Travel services
Banking and credit unions
Media
Payment processing
Equipment/hardware
Gambling
Consumer goods
Non-profits
Exchange
Telecommunications
Median
Ind
ustr
y
As DoS attacks continue to evolve, cloud service providers must have solutions in place to protect their infrastructure.
Point-of-Sale Intrusions
Payment Card Skimmers
CrimewareWeb App Attacks
Denial-of-Service Attacks
Physical Theft and Loss
Insider and Privilege Misuse
Miscellaneous Errors
Cyber- espionage
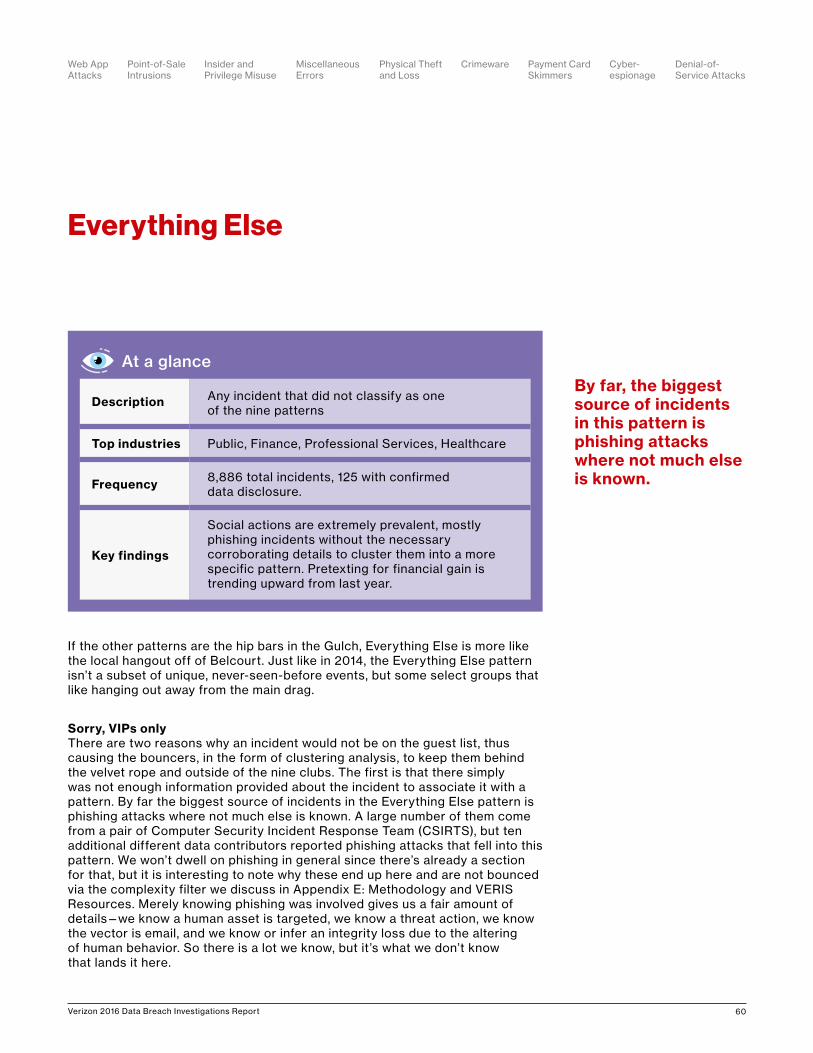
Verizon 2016 Data Breach Investigations Report 60
If the other patterns are the hip bars in the Gulch, Everything Else is more like the local hangout off of Belcourt. Just like in 2014, the Everything Else pattern isn’t a subset of unique, never-seen-before events, but some select groups that like hanging out away from the main drag.
Sorry, VIPs onlyThere are two reasons why an incident would not be on the guest list, thus causing the bouncers, in the form of clustering analysis, to keep them behind the velvet rope and outside of the nine clubs. The first is that there simply was not enough information provided about the incident to associate it with a pattern. By far the biggest source of incidents in the Everything Else pattern is phishing attacks where not much else is known. A large number of them come from a pair of Computer Security Incident Response Team (CSIRTS), but ten additional different data contributors reported phishing attacks that fell into this pattern. We won’t dwell on phishing in general since there’s already a section for that, but it is interesting to note why these end up here and are not bounced via the complexity filter we discuss in Appendix E: Methodology and VERIS Resources. Merely knowing phishing was involved gives us a fair amount of details—we know a human asset is targeted, we know a threat action, we know the vector is email, and we know or infer an integrity loss due to the altering of human behavior. So there is a lot we know, but it’s what we don’t know that lands it here.
Everything Else
By far, the biggest source of incidents in this pattern is phishing attacks where not much else is known.
At a glance
Description Any incident that did not classify as one of the nine patterns
Top industries Public, Finance, Professional Services, Healthcare
Frequency 8,886 total incidents, 125 with confirmed data disclosure.
Key findings
Social actions are extremely prevalent, mostly phishing incidents without the necessary corroborating details to cluster them into a more specific pattern. Pretexting for financial gain is trending upward from last year.
Point-of-Sale Intrusions
Payment Card Skimmers
CrimewareWeb App Attacks
Denial-of-Service Attacks
Physical Theft and Loss
Insider and Privilege Misuse
Miscellaneous Errors
Cyber- espionage
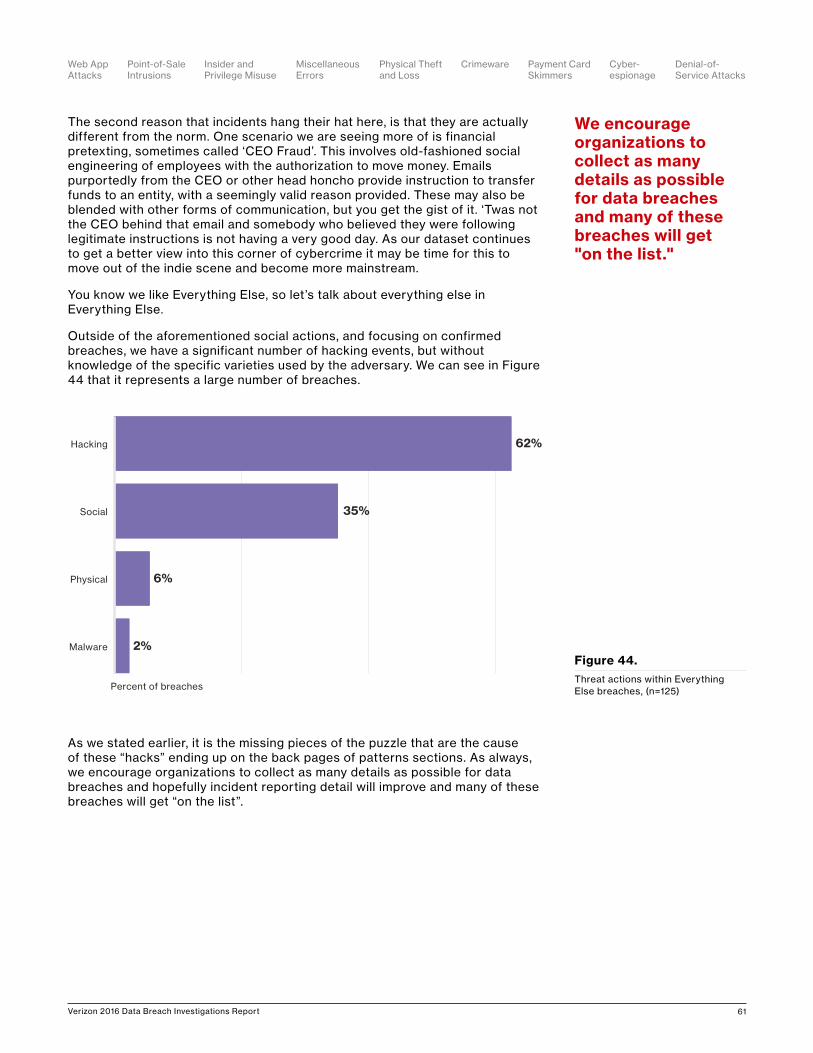
Verizon 2016 Data Breach Investigations Report 61
The second reason that incidents hang their hat here, is that they are actually different from the norm. One scenario we are seeing more of is financial pretexting, sometimes called ‘CEO Fraud’. This involves old-fashioned social engineering of employees with the authorization to move money. Emails purportedly from the CEO or other head honcho provide instruction to transfer funds to an entity, with a seemingly valid reason provided. These may also be blended with other forms of communication, but you get the gist of it. ‘Twas not the CEO behind that email and somebody who believed they were following legitimate instructions is not having a very good day. As our dataset continues to get a better view into this corner of cybercrime it may be time for this to move out of the indie scene and become more mainstream.
You know we like Everything Else, so let’s talk about everything else in Everything Else.
Outside of the aforementioned social actions, and focusing on confirmed breaches, we have a significant number of hacking events, but without knowledge of the specific varieties used by the adversary. We can see in Figure 44 that it represents a large number of breaches.
As we stated earlier, it is the missing pieces of the puzzle that are the cause of these “hacks” ending up on the back pages of patterns sections. As always, we encourage organizations to collect as many details as possible for data breaches and hopefully incident reporting detail will improve and many of these breaches will get “on the list”.
Figure 44.Threat actions within Everything Else breaches, (n=125)
62%
35%
6%
2%Malware
Physical
Social
Hacking
Percent of breaches
We encourage organizations to collect as many details as possible for data breaches and many of these breaches will get "on the list."
Point-of-Sale Intrusions
Payment Card Skimmers
CrimewareWeb App Attacks
Denial-of-Service Attacks
Physical Theft and Loss
Insider and Privilege Misuse
Miscellaneous Errors
Cyber- espionage
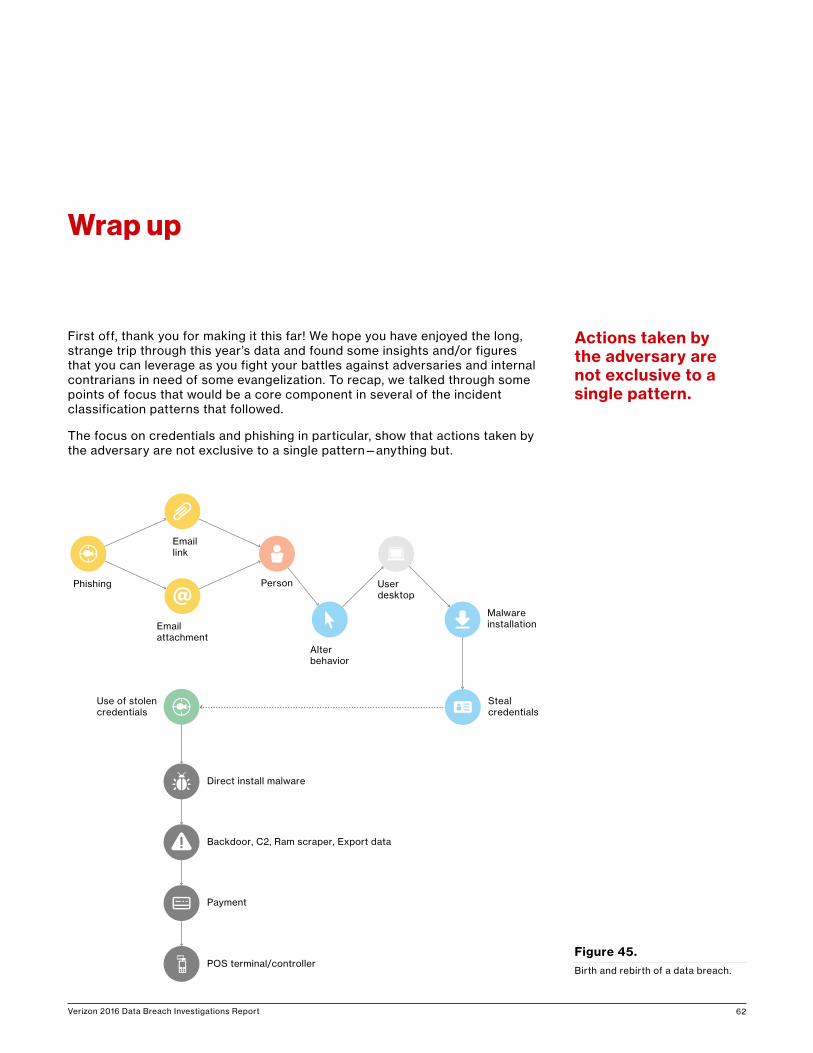
Verizon 2016 Data Breach Investigations Report 62
First off, thank you for making it this far! We hope you have enjoyed the long, strange trip through this year’s data and found some insights and/or figures that you can leverage as you fight your battles against adversaries and internal contrarians in need of some evangelization. To recap, we talked through some points of focus that would be a core component in several of the incident classification patterns that followed.
The focus on credentials and phishing in particular, show that actions taken by the adversary are not exclusive to a single pattern—anything but.
Wrap up
Emaillink
Malwareinstallation
Stealcredentials
Emailattachment
Phishing Person Userdesktop
Alterbehavior
Use of stolencredentials
Direct install malware
Backdoor, C2, Ram scraper, Export data
Payment
POS terminal/controllerFigure 45.Birth and rebirth of a data breach.
Actions taken by the adversary are not exclusive to a single pattern.
Verizon 2016 Data Breach Investigations Report 63
And while we tend to stray from focusing on particular trees in the data breach forest, the scenario depicted in Figure 45 is interesting to walk though as it features many of the most common threat actions, vectors and assets from our corpus. What you are looking at is a progression of a breach involving the targeting of a POS vendor and subsequent collection of sensitive data used against a second group of victims. The birth and rebirth of a breach is established above.
The attack begins with a targeted phishing campaign against the vendor. The person on the other end interacts with the email (clicks) and malware installation on the user device occurs. While the end of this story is stolen payment cards, those who aren’t flipping their collective wigs trying to comply with PCI should still pay close attention. Up to this point we could be talking about the beginnings of a state-affiliated Cyber-espionage breach, or even a totally opportunistic Crimeware attack. Once the initial access has been established the attacker’s motivation influences which street they choose to drive down.
In the above case the foothold is used to harvest credentials to be used against B2B customers. We can even infer some likely suspects as far as malware varieties here, notably some level of control and access (backdoor/C2) and a means to establish the first confirmed data disclosure (keylogger).
So for the adversary, great success. User duped, device compromised, data captured—time to yell “Yabba dabba doo” and slide down the dinosaur tail to signify the end of another productive work day? Not quite.
The breach is reborn as an attack on the customer using the stolen credentials against a static authentication factor. With the second network compromised, malware is installed directly (after system access). Malware functionalities of scraping RAM and exporting data, as well as establishment of control and persistence, make their appearance. They combine to capture, package and exfiltrate payment card data, thus completing the breach.
Having an understanding of how patterns can complement each other and share portions of event chains can help direct your efforts as to what to prioritize your limited resources against. That is, knowing the processes used by the Actors, the tools (Actions) to accomplish their goals and how many of these patterns begin with the same or similar bag of tricks.
Having an understanding of how patterns complement each other can help direct your efforts as to what to prioritize your limited resources against.
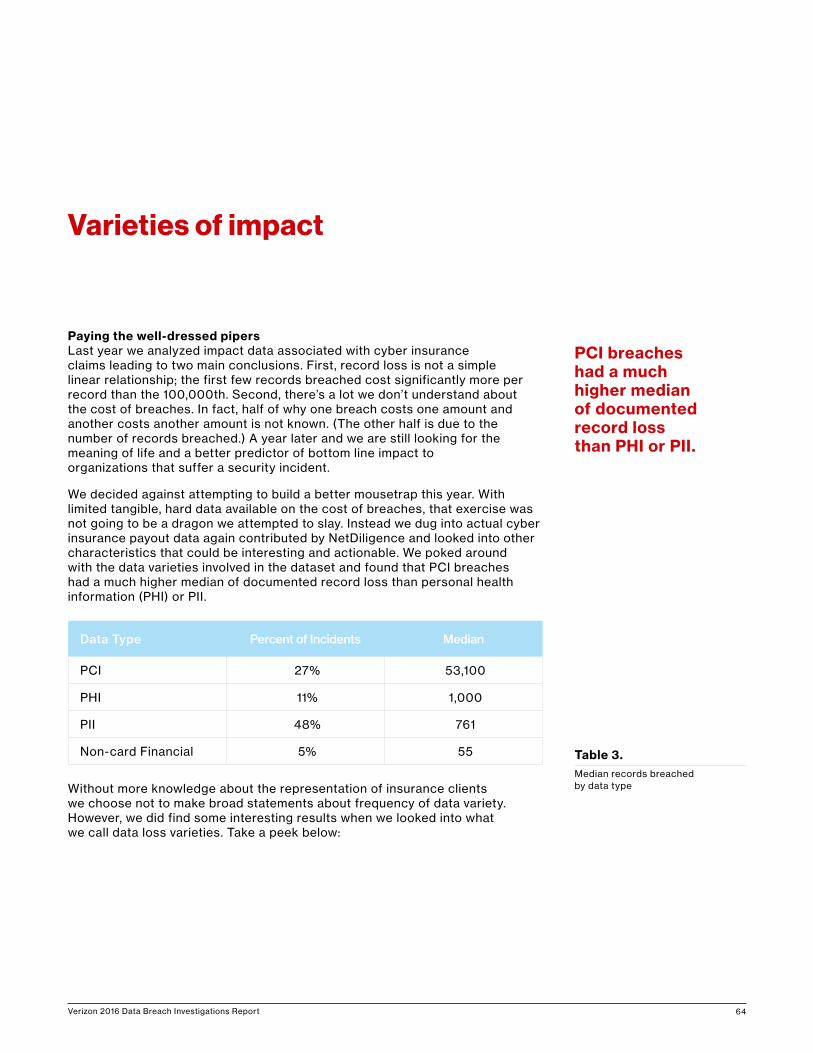
Verizon 2016 Data Breach Investigations Report 64
Varieties of impact
Paying the well-dressed pipersLast year we analyzed impact data associated with cyber insurance claims leading to two main conclusions. First, record loss is not a simple linear relationship; the first few records breached cost significantly more per record than the 100,000th. Second, there’s a lot we don’t understand about the cost of breaches. In fact, half of why one breach costs one amount and another costs another amount is not known. (The other half is due to the number of records breached.) A year later and we are still looking for the meaning of life and a better predictor of bottom line impact to organizations that suffer a security incident.
We decided against attempting to build a better mousetrap this year. With limited tangible, hard data available on the cost of breaches, that exercise was not going to be a dragon we attempted to slay. Instead we dug into actual cyber insurance payout data again contributed by NetDiligence and looked into other characteristics that could be interesting and actionable. We poked around with the data varieties involved in the dataset and found that PCI breaches had a much higher median of documented record loss than personal health information (PHI) or PII.
Data Type Percent of Incidents Median
PCI 27% 53,100
PHI 11% 1,000
PII 48% 761
Non-card Financial 5% 55
Without more knowledge about the representation of insurance clients we choose not to make broad statements about frequency of data variety. However, we did find some interesting results when we looked into what we call data loss varieties. Take a peek below:
Table 3.Median records breached by data type
PCI breaches had a much higher median of documented record loss than PHI or PII.
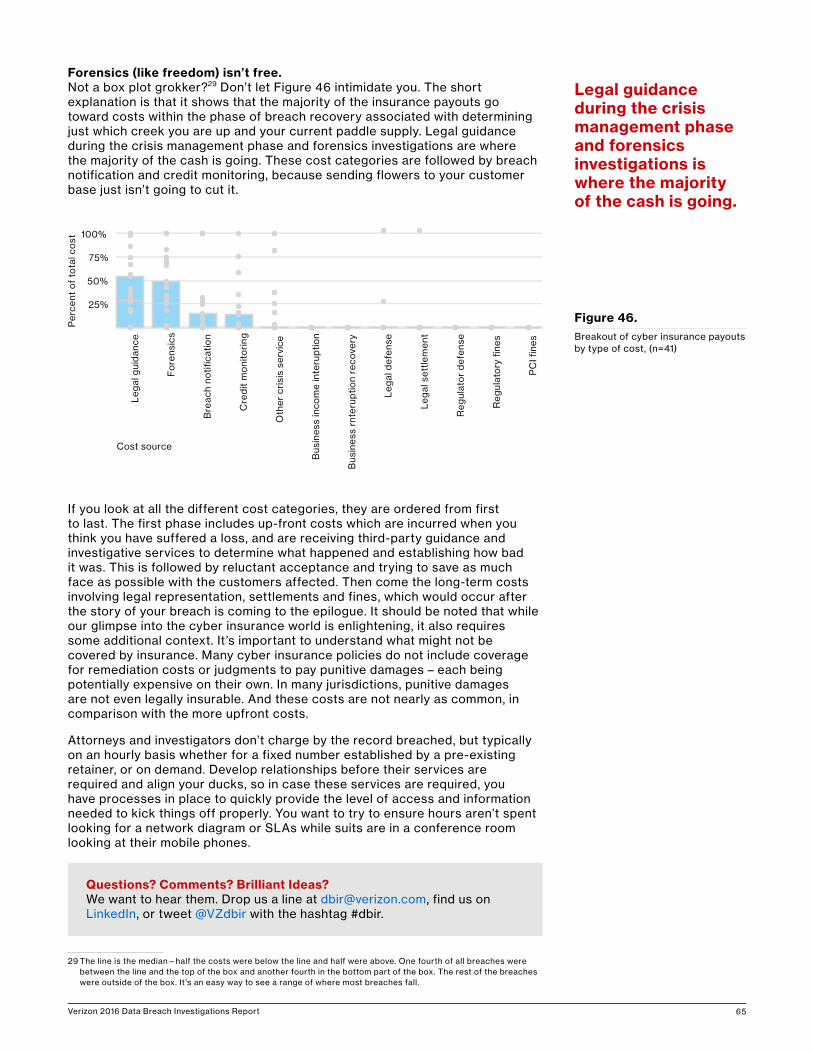
Verizon 2016 Data Breach Investigations Report 65
Forensics (like freedom) isn’t free.Not a box plot grokker?29 Don’t let Figure 46 intimidate you. The short explanation is that it shows that the majority of the insurance payouts go toward costs within the phase of breach recovery associated with determining just which creek you are up and your current paddle supply. Legal guidance during the crisis management phase and forensics investigations are where the majority of the cash is going. These cost categories are followed by breach notification and credit monitoring, because sending flowers to your customer base just isn’t going to cut it.
If you look at all the different cost categories, they are ordered from first to last. The first phase includes up-front costs which are incurred when you think you have suffered a loss, and are receiving third-party guidance and investigative services to determine what happened and establishing how bad it was. This is followed by reluctant acceptance and trying to save as much face as possible with the customers affected. Then come the long-term costs involving legal representation, settlements and fines, which would occur after the story of your breach is coming to the epilogue. It should be noted that while our glimpse into the cyber insurance world is enlightening, it also requires some additional context. It’s important to understand what might not be covered by insurance. Many cyber insurance policies do not include coverage for remediation costs or judgments to pay punitive damages – each being potentially expensive on their own. In many jurisdictions, punitive damages are not even legally insurable. And these costs are not nearly as common, in comparison with the more upfront costs.
Attorneys and investigators don’t charge by the record breached, but typically on an hourly basis whether for a fixed number established by a pre-existing retainer, or on demand. Develop relationships before their services are required and align your ducks, so in case these services are required, you have processes in place to quickly provide the level of access and information needed to kick things off properly. You want to try to ensure hours aren’t spent looking for a network diagram or SLAs while suits are in a conference room looking at their mobile phones.
29 The line is the median—half the costs were below the line and half were above. One fourth of all breaches were between the line and the top of the box and another fourth in the bottom part of the box. The rest of the breaches were outside of the box. It ’s an easy way to see a range of where most breaches fall.
25%
50%
75%
100%
Leg
al g
uid
ance
Fo
rens
ics
Bre
ach
notifi
catio
n
Cre
dit
mo
nito
ring
Oth
er c
risi
s se
rvic
e
Bus
ines
s in
com
e in
teru
ptio
n
Bus
ines
s rn
teru
ptio
n re
cove
ry
Leg
al d
efen
se
Leg
al s
ettle
men
t
Reg
ulat
or
def
ense
Reg
ulat
ory
fine
s
PC
I fine
s
Cost source
Per
cent
of
tota
l co
st
Figure 46.Breakout of cyber insurance payouts by type of cost, (n=41)
Legal guidance during the crisis management phase and forensics investigations is where the majority of the cash is going.
Questions? Comments? Brilliant Ideas?We want to hear them. Drop us a line at [email protected], find us on LinkedIn, or tweet @VZdbir with the hashtag #dbir.
Verizon 2016 Data Breach Investigations Report 66
Whatcha doin’ in these waters?If cybercriminals were anglers, they would not be practicing “catch and release.” No, when they hook a live one, that bad boy is going into a cooler. With the help of Intel Security, this section will discuss what the threat Actors do with all the data they compromise once they land it, in particular:
• Analysis of the monetization of stolen data• A look into the market(s) for compromised records
Methods of monetizationThere are seemingly endless types of stolen data available for sale from an equally endless variety of sources. However, this document is not “War and Peace,” so we will attempt to shorten and simplify our analysis by limiting the scope to the data types that are easily understood and where a significant volume of stolen data is available through reasonably well-understood marketplaces. The following broad categories are presented but we recognize that this list is anything but exhaustive:
• Payment card information• Financial account information• Personal information (PII)
Other data types such as intellectual property or access to enterprise systems can also be stolen and monetized, and often are. However, while we commonly see services related to the theft of a variety of data, transactional details are not commonly seen on the open market and it is therefore difficult to quantify its market value. Some data may be more valuable to keep rather than re-sell on the markets. It is probable that those who steal IP are actually using it themselves to create a better widget without the laborious and costly R & D otherwise required. So, we will focus on the areas where we do have sufficient visibility—the categories mentioned above.
Payment card monetizationThere are multiple methods by which stolen cards are obtained and cashed out. Furthermore, there are several factors that influence how compromised payment card data will be used for financial gain once it is purloined. A few of those are listed here:
• The actions taken by the criminal to acquire the data and to what type of asset. How data is stolen will often influence what information in addition to the primary account number (PAN) is captured. We will use the pertinent incident classification patterns where possible to better explain the attack methods.
Appendix A: Post-compromise fraud
There are seemingly endless types of stolen data available for sale from an equally endless variety of sources.
Verizon 2016 Data Breach Investigations Report 67
• How many payment records are captured in a breach or a spree of breaches. • The threat Actor behind the breach. (Are they a one-man wolf pack, or an
organized criminal group?)
The initial decision made by the threat Actor is whether to sell the data they have acquired, or to engage in the post-compromise fraud themselves. In large breaches with record losses in the millions, it may be advantageous to act as a wholesaler and sell in bulk to intermediaries who will ultimately initiate the fraudulent transactions. The “This little piggy went to market” section below digs deeper into the black market for stolen data.
Methods available to monetize stolen payment card information (like the Wonder Twins) can take many forms. We can, however, begin with a simplistic breakout of possible fraud mechanisms into two distinct and commonly used categorizations, card-present and card not-present fraud.
Bueller, Bueller … Bueller? We will start with card not-present (CNP) fraud. Obviously, this fraud is associated with purchases made either online or over the phone. At first thought, it seems like this would be a desirable fraud action to take. It can be done remotely with no need to physically travel to a store and show your face. But there is a catch. Namely, the lack of the 3 or 4 digit number on the physical cards, known as the Card Verification Value (CVV2). The CVV2 code is a required field on the vast majority of ecommerce sites. In a blatant demonstration of pure pigheaded obstinacy, the issuing banks do not place the CVV2 code on the magnetic stripe of the card, thereby forcing criminals to actually work for their money. Therefore, the necessary piece of information to perpetrate CNP transactions is typically gathered in attacks against legitimate CNP transactions. The two main patterns associated with capturing CNP data are:
Crimeware installed on consumer devices with spyware or form grabber functionalities to capture (client-side) the PAN+Expiration+ CVV2 combo which are needed in addition to billing information to “prove” possession of the physical card.
Web App Attacks leading to compromise of the payment application and subsequent code modification to collect and exfiltrate the same information.
Profiting from stolen CNP transactional data is similar to old school fencing of stolen goods. Think of goodfellas handing out cartons of cigarettes off the back of a truck at a “discounted” price. CNP orders for goods or services are placed online and then delivered through a network of intermediaries to obfuscate the true recipient of the shipment. At the end of the shipping chain the goods are delivered to warehouses where the goods are then sold through local websites.
Present and accounted for!POS Intrusions and Payment Card Skimmers: Two great tastes that go great together—91% of payment card breaches fall into these two patterns. Both patterns feature specific assets that are targeted due to their role in processing payment card information and both involve card-present transactional data. And the data captured in a card-present transaction is highly likely to be reused in card-present fraud. Some of you at this point are noticing a lack of Chip and PIN mentions, and we will get to that in a bit, we promise.
Both of these attacks, if successful—and let’s be real, they frequently are—result in the compromise of magnetic stripe information and are detailed more thoroughly in their respective sections. Let’s focus on the stripes, shall we? That bold black stripe on the back of your card holds some key pieces of information: the PAN, expiration date and discretionary data (most notably the CVV) that was designed to help establish "proof" that the physical card is legitimate.
Profiting from stolen card not-present (CNP) transactional data is similar to old school fencing of stolen goods.
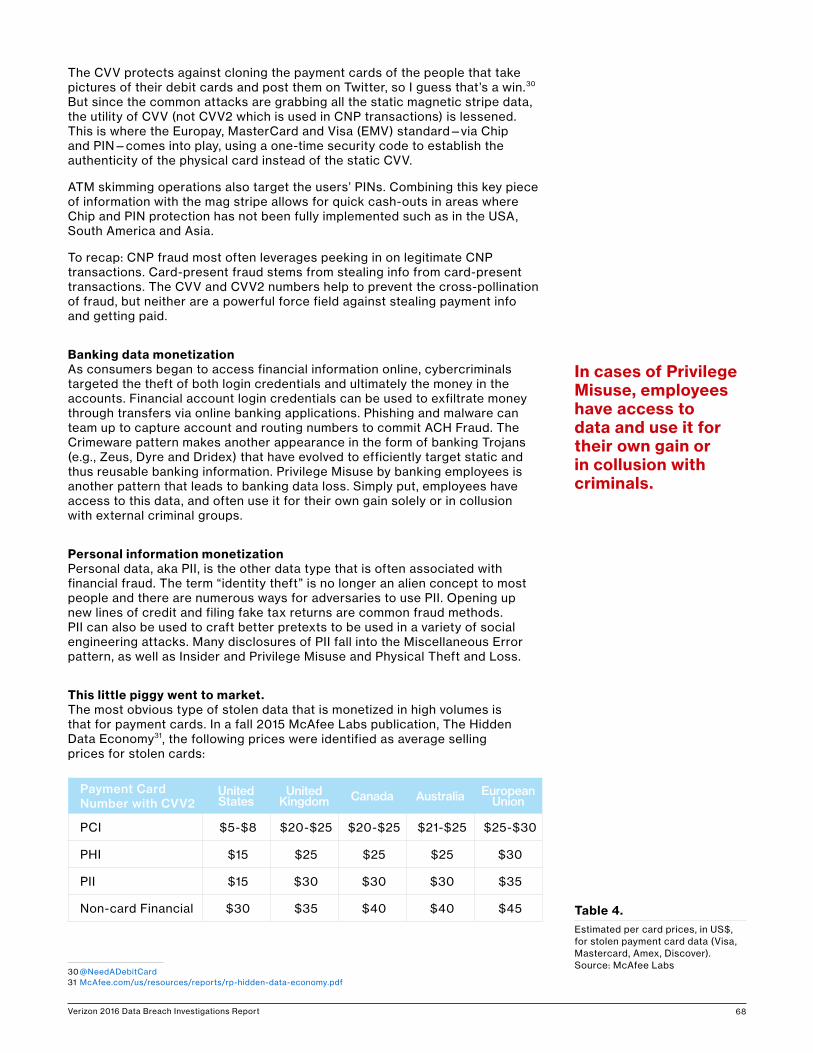
Verizon 2016 Data Breach Investigations Report 68
The CVV protects against cloning the payment cards of the people that take pictures of their debit cards and post them on Twitter, so I guess that’s a win.30 But since the common attacks are grabbing all the static magnetic stripe data, the utility of CVV (not CVV2 which is used in CNP transactions) is lessened. This is where the Europay, MasterCard and Visa (EMV) standard—via Chip and PIN—comes into play, using a one-time security code to establish the authenticity of the physical card instead of the static CVV.
ATM skimming operations also target the users’ PINs. Combining this key piece of information with the mag stripe allows for quick cash-outs in areas where Chip and PIN protection has not been fully implemented such as in the USA, South America and Asia.
To recap: CNP fraud most often leverages peeking in on legitimate CNP transactions. Card-present fraud stems from stealing info from card-present transactions. The CVV and CVV2 numbers help to prevent the cross-pollination of fraud, but neither are a powerful force field against stealing payment info and getting paid.
Banking data monetizationAs consumers began to access financial information online, cybercriminals targeted the theft of both login credentials and ultimately the money in the accounts. Financial account login credentials can be used to exfiltrate money through transfers via online banking applications. Phishing and malware can team up to capture account and routing numbers to commit ACH Fraud. The Crimeware pattern makes another appearance in the form of banking Trojans (e.g., Zeus, Dyre and Dridex) that have evolved to efficiently target static and thus reusable banking information. Privilege Misuse by banking employees is another pattern that leads to banking data loss. Simply put, employees have access to this data, and often use it for their own gain solely or in collusion with external criminal groups.
Personal information monetizationPersonal data, aka PII, is the other data type that is often associated with financial fraud. The term “identity theft” is no longer an alien concept to most people and there are numerous ways for adversaries to use PII. Opening up new lines of credit and filing fake tax returns are common fraud methods. PII can also be used to craft better pretexts to be used in a variety of social engineering attacks. Many disclosures of PII fall into the Miscellaneous Error pattern, as well as Insider and Privilege Misuse and Physical Theft and Loss.
This little piggy went to market.The most obvious type of stolen data that is monetized in high volumes is that for payment cards. In a fall 2015 McAfee Labs publication, The Hidden Data Economy31, the following prices were identified as average selling prices for stolen cards:
Payment Card Number with CVV2
United States
United Kingdom Canada Australia European
Union
PCI $5-$8 $20-$25 $20-$25 $21-$25 $25-$30
PHI $15 $25 $25 $25 $30
PII $15 $30 $30 $30 $35
Non-card Financial $30 $35 $40 $40 $45
30 @NeedADebitCard31 McAfee.com/us/resources/reports/rp-hidden-data-economy.pdf
Table 4.Estimated per card prices, in US$, for stolen payment card data (Visa, Mastercard, Amex, Discover). Source: McAfee Labs
In cases of Privilege Misuse, employees have access to data and use it for their own gain or in collusion with criminals.
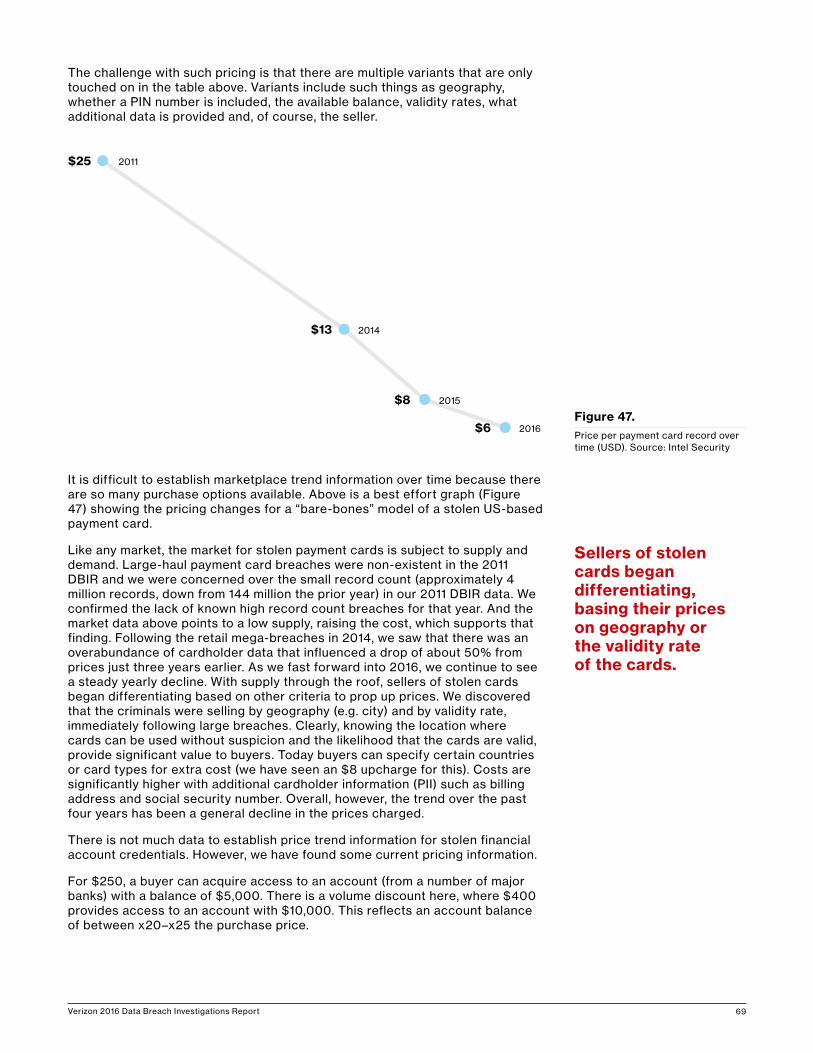
Verizon 2016 Data Breach Investigations Report 69
The challenge with such pricing is that there are multiple variants that are only touched on in the table above. Variants include such things as geography, whether a PIN number is included, the available balance, validity rates, what additional data is provided and, of course, the seller.
It is difficult to establish marketplace trend information over time because there are so many purchase options available. Above is a best effort graph (Figure 47) showing the pricing changes for a “bare-bones” model of a stolen US-based payment card.
Like any market, the market for stolen payment cards is subject to supply and demand. Large-haul payment card breaches were non-existent in the 2011 DBIR and we were concerned over the small record count (approximately 4 million records, down from 144 million the prior year) in our 2011 DBIR data. We confirmed the lack of known high record count breaches for that year. And the market data above points to a low supply, raising the cost, which supports that finding. Following the retail mega-breaches in 2014, we saw that there was an overabundance of cardholder data that influenced a drop of about 50% from prices just three years earlier. As we fast forward into 2016, we continue to see a steady yearly decline. With supply through the roof, sellers of stolen cards began differentiating based on other criteria to prop up prices. We discovered that the criminals were selling by geography (e.g. city) and by validity rate, immediately following large breaches. Clearly, knowing the location where cards can be used without suspicion and the likelihood that the cards are valid, provide significant value to buyers. Today buyers can specify certain countries or card types for extra cost (we have seen an $8 upcharge for this). Costs are significantly higher with additional cardholder information (PII) such as billing address and social security number. Overall, however, the trend over the past four years has been a general decline in the prices charged.
There is not much data to establish price trend information for stolen financial account credentials. However, we have found some current pricing information.
For $250, a buyer can acquire access to an account (from a number of major banks) with a balance of $5,000. There is a volume discount here, where $400 provides access to an account with $10,000. This reflects an account balance of between x20–x25 the purchase price.
2011
2014
2015
2016
$25
$13
$8
$6Figure 47.Price per payment card record over time (USD). Source: Intel Security
Sellers of stolen cards began differentiating, basing their prices on geography or the validity rate of the cards.
Verizon 2016 Data Breach Investigations Report 70
PayPal accounts are also a common target for those who wish to steal financial account login credentials. We have seen markets with even greater discounting, where 60 bucks will get you $4,000 in PayPal credit (x67 the purchase price).
The value of something is what someone is willing to pay for it, and if there is a demand for something there will always be someone willing to supply it in order to obtain a profit. The rules of the market can be perfectly applied to the cybercrime marketplaces. Through the operations coordinated through Europol, we have seen how all kinds of illegal goods are traded through black market digital sites, some on the dark net, taking advantage of the anonymization possibilities given by the technology, and many of them on the open net. There is a clear demand for stolen data and, therefore, there will always be criminals ready to supply and satisfy this demand, especially if we take into account the disproportion between the risk-cost-profit, as data can be easily stolen and transmitted.
The whole internet community, from citizens to companies or governments, is a target for cybercriminals looking for protected data. Private users are victims of phishing/spam campaigns aiming at stealing online banking credentials or sensitive documents. Small, medium and large companies, for which data is one of the most important assets (information on its customers, their market strategy or industrial information) are constantly targeted through sophisticated technical attacks or basic social engineering techniques. As stated in Europol’s iOCTA (Internet Organised Crime Threat Assessment) 2015, the media commonly referred to 2014 as the “Year of the data breach.” With record numbers of network attacks recorded, this is a constant trend and the future scenario doesn’t look any better.
The law enforcement community is constantly fighting against these criminal markets, its administrators and the criminals trading the stolen data. However, only through a coordinated effort involving all the parties involved; law enforcement, private sector, financial institutions, internet security industry, we will be in position to properly tackle this threat.
Fernando Ruiz—Head of Operations—European Cybercrime Centre (EC3)—Europol
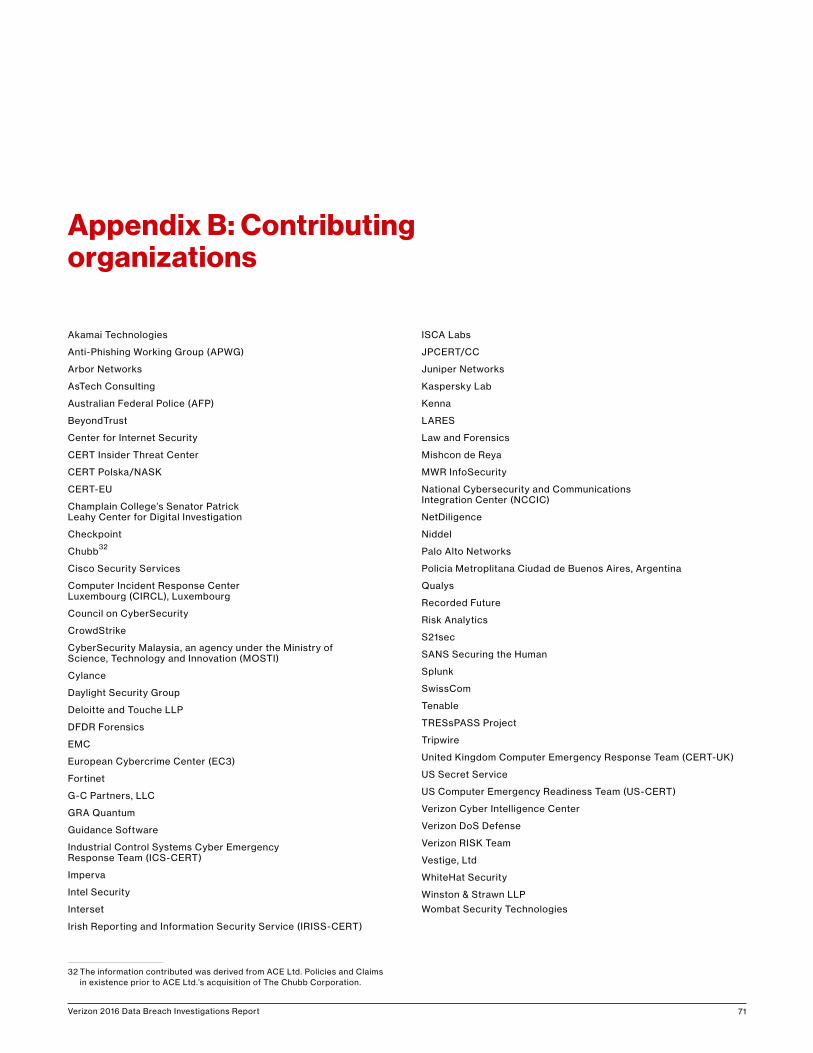
Verizon 2016 Data Breach Investigations Report 71
Akamai Technologies
Anti-Phishing Working Group (APWG)
Arbor Networks
AsTech Consulting
Australian Federal Police (AFP)
BeyondTrust
Center for Internet Security
CERT Insider Threat Center
CERT Polska/NASK
CERT-EU
Champlain College’s Senator Patrick Leahy Center for Digital Investigation
Checkpoint
Chubb32
Cisco Security Services
Computer Incident Response Center Luxembourg (CIRCL), Luxembourg
Council on CyberSecurity
CrowdStrike
CyberSecurity Malaysia, an agency under the Ministry of Science, Technology and Innovation (MOSTI)
Cylance
Daylight Security Group
Deloitte and Touche LLP
DFDR Forensics
EMC
European Cybercrime Center (EC3)
Fortinet
G-C Partners, LLC
GRA Quantum
Guidance Software
Industrial Control Systems Cyber Emergency Response Team (ICS-CERT)
Imperva
Intel Security
Interset
Irish Reporting and Information Security Service (IRISS-CERT)
32 The information contributed was derived from ACE Ltd. Policies and Claims in existence prior to ACE Ltd.’s acquisition of The Chubb Corporation.
ISCA Labs
JPCERT/CC
Juniper Networks
Kaspersky Lab
Kenna
LARES
Law and Forensics
Mishcon de Reya
MWR InfoSecurity
National Cybersecurity and Communications Integration Center (NCCIC)
NetDiligence
Niddel
Palo Alto Networks
Policia Metroplitana Ciudad de Buenos Aires, Argentina
Qualys
Recorded Future
Risk Analytics
S21sec
SANS Securing the Human
Splunk
SwissCom
Tenable
TRESsPASS Project
Tripwire
United Kingdom Computer Emergency Response Team (CERT-UK)
US Secret Service
US Computer Emergency Readiness Team (US-CERT)
Verizon Cyber Intelligence Center
Verizon DoS Defense
Verizon RISK Team
Vestige, Ltd
WhiteHat Security
Winston & Strawn LLP
Wombat Security Technologies
Appendix B: Contributing organizations
Verizon 2016 Data Breach Investigations Report 72
Prepared based on security incident data collected from all of our contributors, this document pays homage to the Federal Reserve System Beige Book.33 All statements are written in the parlance of this financial document and are made against a filtered set of data that only includes confirmed malicious data breaches. The Physical Theft and Loss as well as Miscellaneous Errors patterns are not included. This is based on an incident date of 2015, not the year of DBIR publication, although we would expect little-to-moderate fluctuation due to this method.
Threat Actor activityExternal Actors reported a slight growth in percentage of breaches from last year but not outside of historic norms. Internal Actors realized a similar decline in percentage and count from 2014. Collusion between internal and external Actors is still sluggish since its above average 2012 mark. Diversification of data and less breaches involving solicitation of banking workers has contributed to its decline. Partner Actors have remained flat.
Organized criminal activity reports an overall increase benefiting from high levels of reported botnet activities and stable levels of POS intrusions in 2015. Shifts in data contributions were cited as a cause of a slight decline in state-affiliated Actor prevalence last year.
Activist group activity review showed that breach levels were down and noted a continued moderate shift in focus from SQLi to denial-of-service campaigns.
Threat action trendsHacking and Malware activity was characterized as growing rapidly and was similar to 2011 numbers. A botnet takedown contributed to this growth as well as an upward trend in the social threat action category. Phishing had a stronger association to known Crimeware breaches in 2015.
Physical actions cited the significant increase of non-law-enforcement data contributors as the principle reason for their decline from 2013 levels. Skimming operations have realized flat to slightly declining activity from 2014.
Conditions for use of stolen credentials and use of backdoor or C2 have continued to show growth in 2015. A partnership of the two varieties in a banking Trojan campaign was cited as a reason for increased activity. Brute force activity continued to be subdued as stolen credentials continued to establish growth in the POS Intrusion market.
33 FederalReserve.gov/monetarypolicy/beigebook
Appendix C: The Taupe Book
Organized criminal activity increased due to high levels of botnet activities and stable levels of POS intrusions.
Verizon 2016 Data Breach Investigations Report 73
The continued use of Web App Attacks has allowed SQLi and RFI to report stable activity in 2015. Contacts indicated that spikes in Crimeware breaches have resulted in significant gains in C2 and keylogging data malware functionalities. Data exports via malware also have a positive outlook.
RAM scrapers continue to show significant usage overall, but are showing signs of decreasing activity. The victim population in associated scaled remote attacks on guessable POS credentials is showing signs of overall decline.
Penetration into several incident classification patterns in 2015 is credited for the growth of phishing in the breach dataset. Social threat actions are showing stable growth. Pretexting activity has increased and was seen at a higher percentage than solicitation/bribery—this is a significant change from 2014 and was last seen in 2011. A positive growth in the use of pretexting in financially motivated breaches was reported in 2015 contributing to the rise in activity. This gain was offset by a sluggish performance by the Misuse variety of use of unapproved hardware. Reports suggest that the majority of these breaches involve use of USB drives to steal data and are related to espionage motives. Financially motivated uses of hand-held skimmers have realized a slowdown from 2014, which was stable when compared to 2013.
Financial, Information and Online Retail industries showed growth in their representation in the report. Accommodation showed moderate activity slightly up from 2014. Public, Retail (not online), Healthcare and Professional Services’ presence softened in 2015. This is likely due to changes in the contributing organizations and several breach sprees that influenced numerous 4A (see Breach Trends section for definition) aspects in 2015.
No breaches have been attributed to vermin or any other environmental action, remaining flat.
The majority of use of unapproved hardware in breaches involve use of USB drives to steal data and are motivated by espionage.
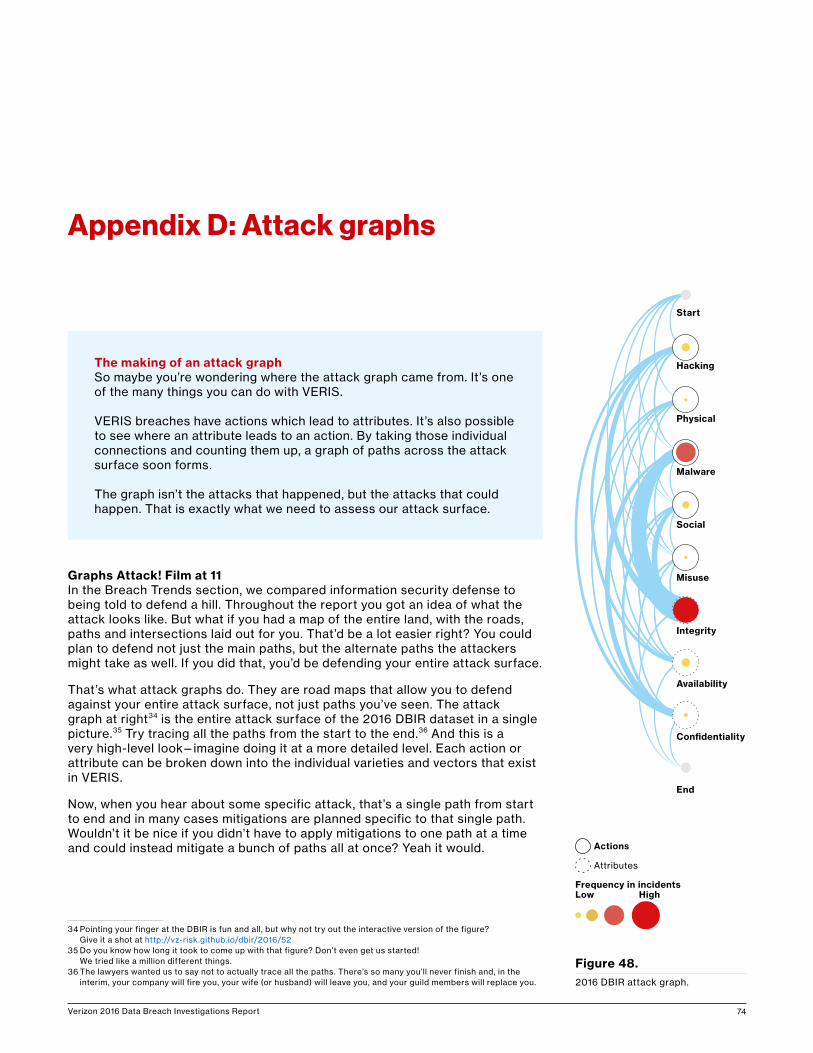
Verizon 2016 Data Breach Investigations Report 74
Graphs Attack! Film at 11In the Breach Trends section, we compared information security defense to being told to defend a hill. Throughout the report you got an idea of what the attack looks like. But what if you had a map of the entire land, with the roads, paths and intersections laid out for you. That’d be a lot easier right? You could plan to defend not just the main paths, but the alternate paths the attackers might take as well. If you did that, you’d be defending your entire attack surface.
That’s what attack graphs do. They are road maps that allow you to defend against your entire attack surface, not just paths you’ve seen. The attack graph at right34 is the entire attack surface of the 2016 DBIR dataset in a single picture.35 Try tracing all the paths from the start to the end.36 And this is a very high-level look—imagine doing it at a more detailed level. Each action or attribute can be broken down into the individual varieties and vectors that exist in VERIS.
Now, when you hear about some specific attack, that’s a single path from start to end and in many cases mitigations are planned specific to that single path. Wouldn’t it be nice if you didn’t have to apply mitigations to one path at a time and could instead mitigate a bunch of paths all at once? Yeah it would.
34 Pointing your finger at the DBIR is fun and all, but why not try out the interactive version of the figure? Give it a shot at http://vz-risk.github.io/dbir/2016/52
35 Do you know how long it took to come up with that figure? Don’t even get us started! We tried like a million different things.
36 The lawyers wanted us to say not to actually trace all the paths. There’s so many you’ll never finish and, in the interim, your company will fire you, your wife (or husband) will leave you, and your guild members will replace you.
Appendix D: Attack graphs
The making of an attack graphSo maybe you’re wondering where the attack graph came from. It’s one of the many things you can do with VERIS.
VERIS breaches have actions which lead to attributes. It’s also possible to see where an attribute leads to an action. By taking those individual connections and counting them up, a graph of paths across the attack surface soon forms.
The graph isn’t the attacks that happened, but the attacks that could happen. That is exactly what we need to assess our attack surface.
Actions
Frequency in incidentsLow
Attributes
High
Start
Hacking
Physical
Malware
Misuse
Availability
End
Confidentiality
Social
Integrity
Actions
Frequency in incidentsLow
Attributes
High
Start
Hacking
Physical
Malware
Misuse
Availability
End
Confidentiality
Social
Integrity
Figure 48.2016 DBIR attack graph.
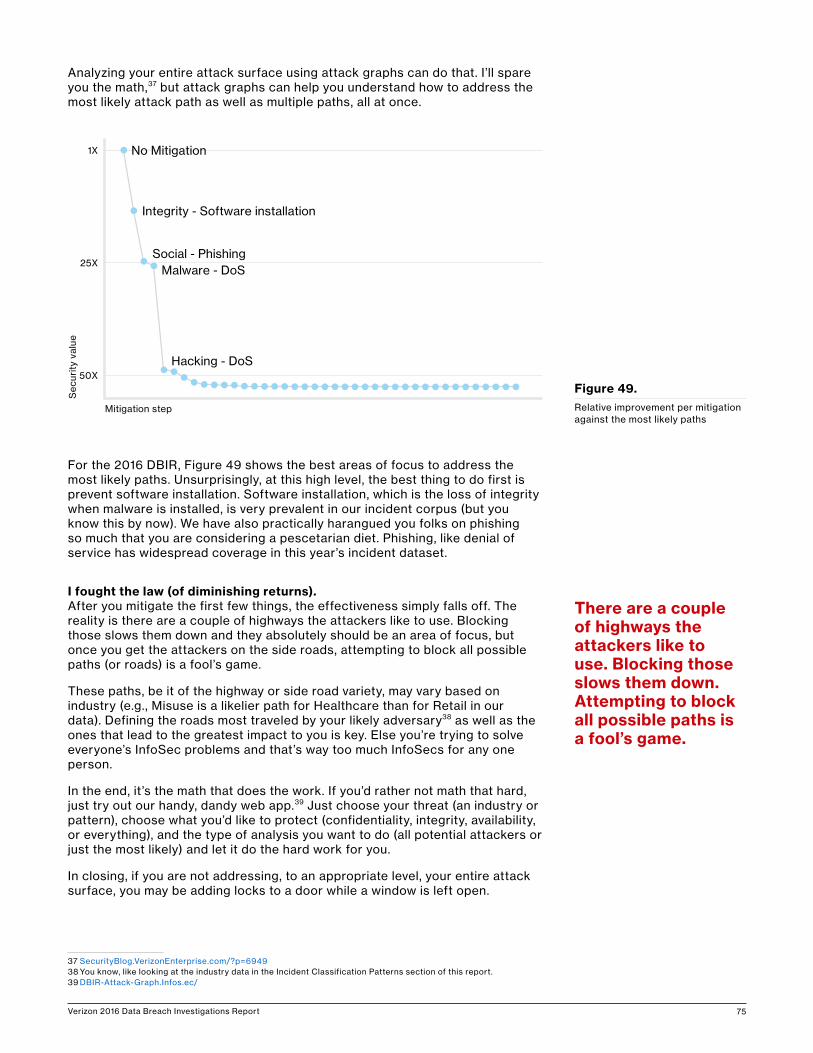
Verizon 2016 Data Breach Investigations Report 75
Figure 49.Relative improvement per mitigation against the most likely paths
Analyzing your entire attack surface using attack graphs can do that. I’ll spare you the math,37 but attack graphs can help you understand how to address the most likely attack path as well as multiple paths, all at once.
For the 2016 DBIR, Figure 49 shows the best areas of focus to address the most likely paths. Unsurprisingly, at this high level, the best thing to do first is prevent software installation. Software installation, which is the loss of integrity when malware is installed, is very prevalent in our incident corpus (but you know this by now). We have also practically harangued you folks on phishing so much that you are considering a pescetarian diet. Phishing, like denial of service has widespread coverage in this year’s incident dataset.
I fought the law (of diminishing returns).After you mitigate the first few things, the effectiveness simply falls off. The reality is there are a couple of highways the attackers like to use. Blocking those slows them down and they absolutely should be an area of focus, but once you get the attackers on the side roads, attempting to block all possible paths (or roads) is a fool’s game.
These paths, be it of the highway or side road variety, may vary based on industry (e.g., Misuse is a likelier path for Healthcare than for Retail in our data). Defining the roads most traveled by your likely adversary38 as well as the ones that lead to the greatest impact to you is key. Else you’re trying to solve everyone’s InfoSec problems and that’s way too much InfoSecs for any one person.
In the end, it’s the math that does the work. If you’d rather not math that hard, just try out our handy, dandy web app.39 Just choose your threat (an industry or pattern), choose what you’d like to protect (confidentiality, integrity, availability, or everything), and the type of analysis you want to do (all potential attackers or just the most likely) and let it do the hard work for you.
In closing, if you are not addressing, to an appropriate level, your entire attack surface, you may be adding locks to a door while a window is left open.
37 SecurityBlog.VerizonEnterprise.com/?p=694938 You know, like looking at the industry data in the Incident Classification Patterns section of this report.39 DBIR-Attack-Graph.Infos.ec/
No Mitigation
Integrity - Software installation
Social - PhishingMalware - DoS
Hacking - DoS
1X
25X
50X
Mitigation step
Sec
urity
val
ue
There are a couple of highways the attackers like to use. Blocking those slows them down. Attempting to block all possible paths is a fool’s game.
Verizon 2016 Data Breach Investigations Report 76
Based on feedback, one of the things readers value most about this report is the level of rigor and integrity we employ when collecting, analyzing and presenting data. Knowing our readership cares about such things and consumes this information with a keen eye helps keep us honest. Detailing our methods is an important part of that honesty.
Our overall methodology remains intact and largely unchanged from previous years. All incidents included in this report were reviewed and converted (if necessary) into the VERIS framework to create a common, anonymous aggregate dataset. But the collection method and conversion techniques differed between contributors.
All contributors received instructions to omit any information that might identify organizations or individuals involved, since such details are not necessary to create the DBIR.
Non-incident dataThe 2016 DBIR includes sections that required the analysis of data that did not fit into our usual categories of “incident” or “breach.” For each, we aligned data elements to the VERIS framework (where appropriate) and validated our assumptions and approaches with each of the respective contributors throughout the analysis process. The analyses were performed using reproducible research methodologies and multiple team members validated all results.
Completeness and complexitySince each contributor records incident or breach data for different purposes, not all VERIS enumerations are present for each record. The fewer the enumerations, the more difficult it is to use the records in any meaningful way in analyses. We employed an automated selection algorithm that separated out low-quality incidents where almost all enumerations were not measured
Appendix E: Methodology and VERIS resources
In general, three basic methods (expounded below) were used to accomplish this:
1. Direct recording of paid external forensic investigations and related intelligence operations conducted by Verizon using VERIS.
2. Direct recording by contributors using VERIS.3. Converting contributor’s existing schema into VERIS.
We performed analysis using reproducible research methodologies. Multiple team members validated all results.
Verizon 2016 Data Breach Investigations Report 77
from those that would support more informed analyses. The algorithm we used assigned a score to each record based on two main criteria: “completeness” (i.e., “was each core section—Actor, action, assets, attribute, victim, timeline, discovery method, and targeted—filled out”) and “complexity” (i.e., “how well was each section populated”). The result is more meaningful, descriptive and actionable findings. Any deviation from this strategy is documented where it occurred in the report.
Another important point is that when looking at the findings, “unknown” is equivalent to “unmeasured.” Which is to say that if a record (or collection of records) contains elements that have been marked as “unknown” (whether it is something as basic as the number of records involved in the incident, or as complex as what specific capabilities a piece of malware contained), it means that we cannot make statements about that particular element as it stands in the record. That said, it is important to realize when we have 10,000 cases where the motive of an Actor was “unknown,” 500 cases where the motive is “financial gain” and 100 cases where the motive is “fun,” readers should not infer that those 10,000 cases are implying anything about the cases where we have measurable values.
A word on sample biasWhile we believe many of the findings presented in this report to be appropriate, generalization, bias and methodological flaws undoubtedly exist. Even though the combined records from all our contributors more closely reflect reality than any of them in isolation, it is still a sample. And although we believe many of the findings presented in this report to be appropriate for generalization (and our confidence in this grows as we gather more data and compare it to that of others), bias undoubtedly exists. Unfortunately, we cannot measure exactly how much bias exists (i.e., in order to give a precise margin of error). We have no way of knowing what proportion of all data breaches are represented because we have no way of knowing the total number of data breaches across all organizations in 2015. Many breaches go unreported (though our sample does contain many of those). Many more are as yet unknown by the victim (and thereby unknown to us).
VERIS resourcesVERIS is free to use and we encourage people to integrate it into their existing incident response reporting, or at least kick the tires.
VerisCommunity.net provides general information on the framework with some examples and enumeration listings.
GitHub.com/vz-risk/veris features the full schema as well as access to our database on publicly disclosed breaches, the VERIS Community Database (VCDB).
Splunkbase.Splunk.com/app/2708/ is a community-supported application for Splunk that maps to the incident classification patterns.
When looking at the findings, “unknown” is equivalent to “unmeasured” where we have too little information.
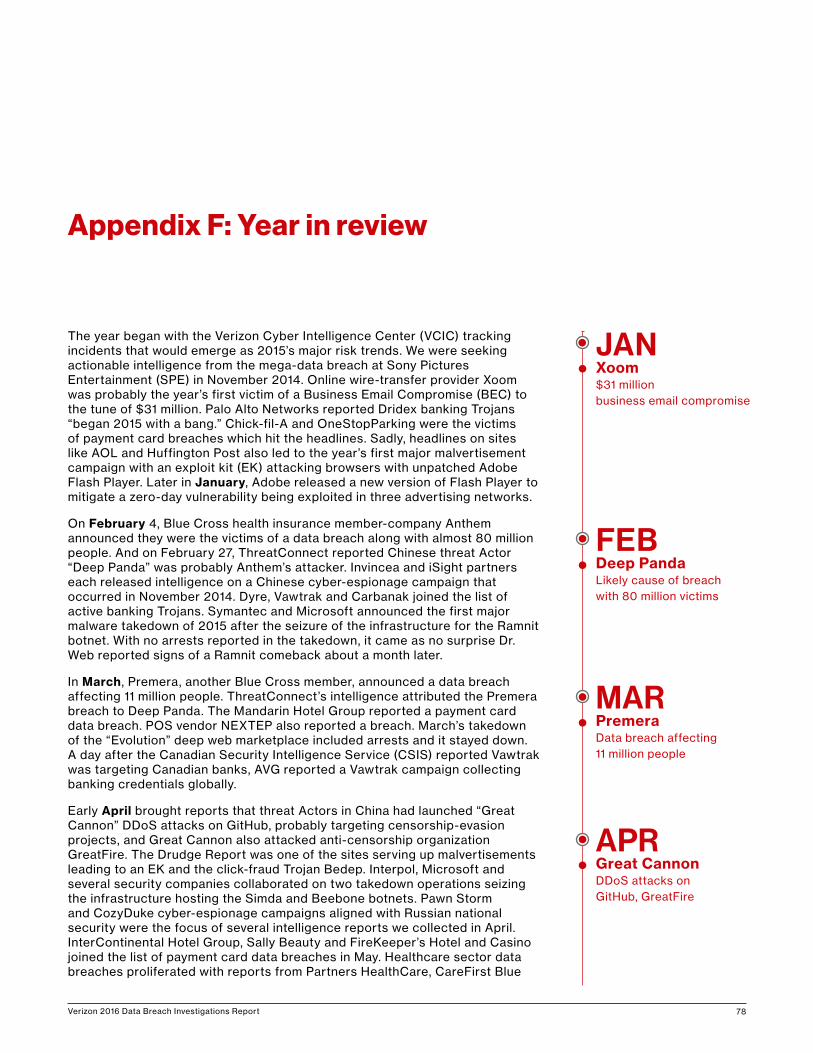
Verizon 2016 Data Breach Investigations Report 78
The year began with the Verizon Cyber Intelligence Center (VCIC) tracking incidents that would emerge as 2015’s major risk trends. We were seeking actionable intelligence from the mega-data breach at Sony Pictures Entertainment (SPE) in November 2014. Online wire-transfer provider Xoom was probably the year’s first victim of a Business Email Compromise (BEC) to the tune of $31 million. Palo Alto Networks reported Dridex banking Trojans “began 2015 with a bang.” Chick-fil-A and OneStopParking were the victims of payment card breaches which hit the headlines. Sadly, headlines on sites like AOL and Huffington Post also led to the year’s first major malvertisement campaign with an exploit kit (EK) attacking browsers with unpatched Adobe Flash Player. Later in January, Adobe released a new version of Flash Player to mitigate a zero-day vulnerability being exploited in three advertising networks.
On February 4, Blue Cross health insurance member-company Anthem announced they were the victims of a data breach along with almost 80 million people. And on February 27, ThreatConnect reported Chinese threat Actor “Deep Panda” was probably Anthem’s attacker. Invincea and iSight partners each released intelligence on a Chinese cyber-espionage campaign that occurred in November 2014. Dyre, Vawtrak and Carbanak joined the list of active banking Trojans. Symantec and Microsoft announced the first major malware takedown of 2015 after the seizure of the infrastructure for the Ramnit botnet. With no arrests reported in the takedown, it came as no surprise Dr. Web reported signs of a Ramnit comeback about a month later.
In March, Premera, another Blue Cross member, announced a data breach affecting 11 million people. ThreatConnect’s intelligence attributed the Premera breach to Deep Panda. The Mandarin Hotel Group reported a payment card data breach. POS vendor NEXTEP also reported a breach. March’s takedown of the “Evolution” deep web marketplace included arrests and it stayed down. A day after the Canadian Security Intelligence Service (CSIS) reported Vawtrak was targeting Canadian banks, AVG reported a Vawtrak campaign collecting banking credentials globally.
Early April brought reports that threat Actors in China had launched “Great Cannon” DDoS attacks on GitHub, probably targeting censorship-evasion projects, and Great Cannon also attacked anti-censorship organization GreatFire. The Drudge Report was one of the sites serving up malvertisements leading to an EK and the click-fraud Trojan Bedep. Interpol, Microsoft and several security companies collaborated on two takedown operations seizing the infrastructure hosting the Simda and Beebone botnets. Pawn Storm and CozyDuke cyber-espionage campaigns aligned with Russian national security were the focus of several intelligence reports we collected in April.InterContinental Hotel Group, Sally Beauty and FireKeeper’s Hotel and Casino joined the list of payment card data breaches in May. Healthcare sector data breaches proliferated with reports from Partners HealthCare, CareFirst Blue
Appendix F: Year in review
JANXoom $31 millionbusiness email compromise
FEBDeep PandaLikely cause of breach with 80 million victims
MARPremeraData breach affecting 11 million people
APRGreat CannonDDoS attacks on GitHub, GreatFire
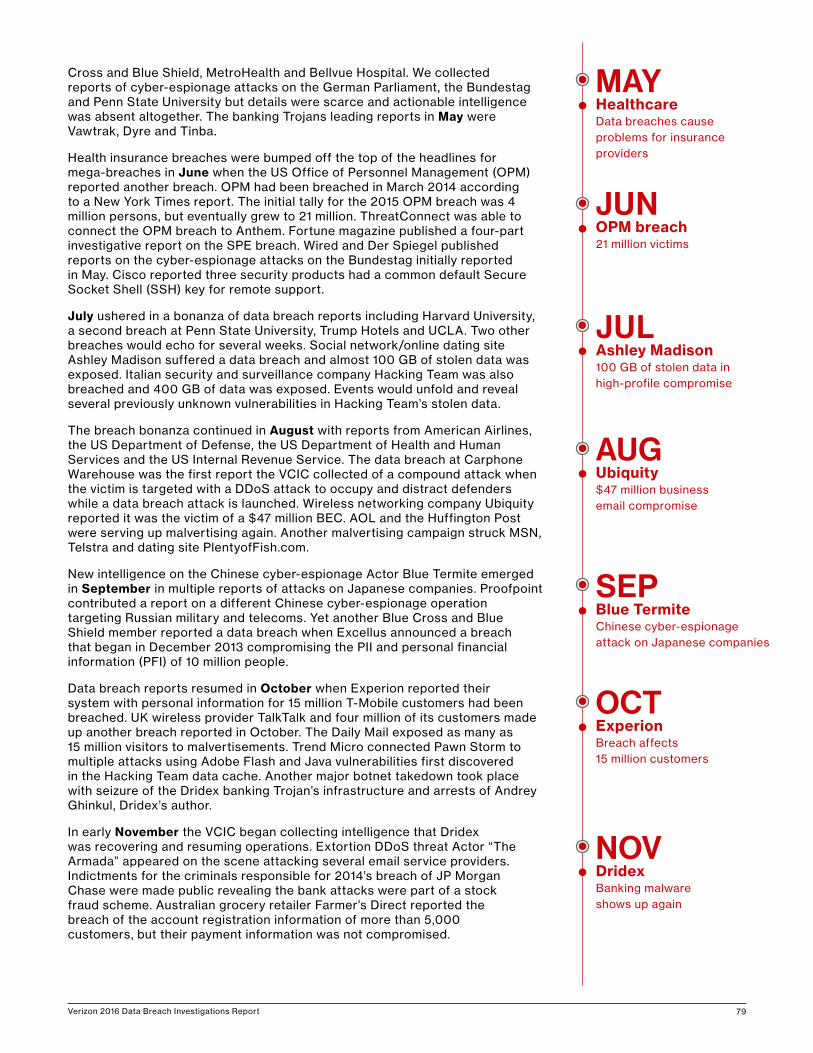
Verizon 2016 Data Breach Investigations Report 79
Cross and Blue Shield, MetroHealth and Bellvue Hospital. We collected reports of cyber-espionage attacks on the German Parliament, the Bundestag and Penn State University but details were scarce and actionable intelligence was absent altogether. The banking Trojans leading reports in May were Vawtrak, Dyre and Tinba.
Health insurance breaches were bumped off the top of the headlines for mega-breaches in June when the US Office of Personnel Management (OPM) reported another breach. OPM had been breached in March 2014 according to a New York Times report. The initial tally for the 2015 OPM breach was 4 million persons, but eventually grew to 21 million. ThreatConnect was able to connect the OPM breach to Anthem. Fortune magazine published a four-part investigative report on the SPE breach. Wired and Der Spiegel published reports on the cyber-espionage attacks on the Bundestag initially reported in May. Cisco reported three security products had a common default Secure Socket Shell (SSH) key for remote support.
July ushered in a bonanza of data breach reports including Harvard University, a second breach at Penn State University, Trump Hotels and UCLA. Two other breaches would echo for several weeks. Social network/online dating site Ashley Madison suffered a data breach and almost 100 GB of stolen data was exposed. Italian security and surveillance company Hacking Team was also breached and 400 GB of data was exposed. Events would unfold and reveal several previously unknown vulnerabilities in Hacking Team’s stolen data.
The breach bonanza continued in August with reports from American Airlines, the US Department of Defense, the US Department of Health and Human Services and the US Internal Revenue Service. The data breach at Carphone Warehouse was the first report the VCIC collected of a compound attack when the victim is targeted with a DDoS attack to occupy and distract defenders while a data breach attack is launched. Wireless networking company Ubiquity reported it was the victim of a $47 million BEC. AOL and the Huffington Post were serving up malvertising again. Another malvertising campaign struck MSN, Telstra and dating site PlentyofFish.com.
New intelligence on the Chinese cyber-espionage Actor Blue Termite emerged in September in multiple reports of attacks on Japanese companies. Proofpoint contributed a report on a different Chinese cyber-espionage operation targeting Russian military and telecoms. Yet another Blue Cross and Blue Shield member reported a data breach when Excellus announced a breach that began in December 2013 compromising the PII and personal financial information (PFI) of 10 million people.
Data breach reports resumed in October when Experion reported their system with personal information for 15 million T-Mobile customers had been breached. UK wireless provider TalkTalk and four million of its customers made up another breach reported in October. The Daily Mail exposed as many as 15 million visitors to malvertisements. Trend Micro connected Pawn Storm to multiple attacks using Adobe Flash and Java vulnerabilities first discovered in the Hacking Team data cache. Another major botnet takedown took place with seizure of the Dridex banking Trojan’s infrastructure and arrests of Andrey Ghinkul, Dridex’s author.
In early November the VCIC began collecting intelligence that Dridex was recovering and resuming operations. Extortion DDoS threat Actor “The Armada” appeared on the scene attacking several email service providers. Indictments for the criminals responsible for 2014’s breach of JP Morgan Chase were made public revealing the bank attacks were part of a stock fraud scheme. Australian grocery retailer Farmer’s Direct reported the breach of the account registration information of more than 5,000 customers, but their payment information was not compromised.
JULAshley Madison100 GB of stolen data inhigh-profile compromise
AUGUbiquity$47 million business email compromise
SEPBlue TermiteChinese cyber-espionageattack on Japanese companies
OCTExperionBreach affects15 million customers
NOVDridexBanking malware shows up again
MAYHealthcare Data breaches cause problems for insurance providers
JUNOPM breach21 million victims
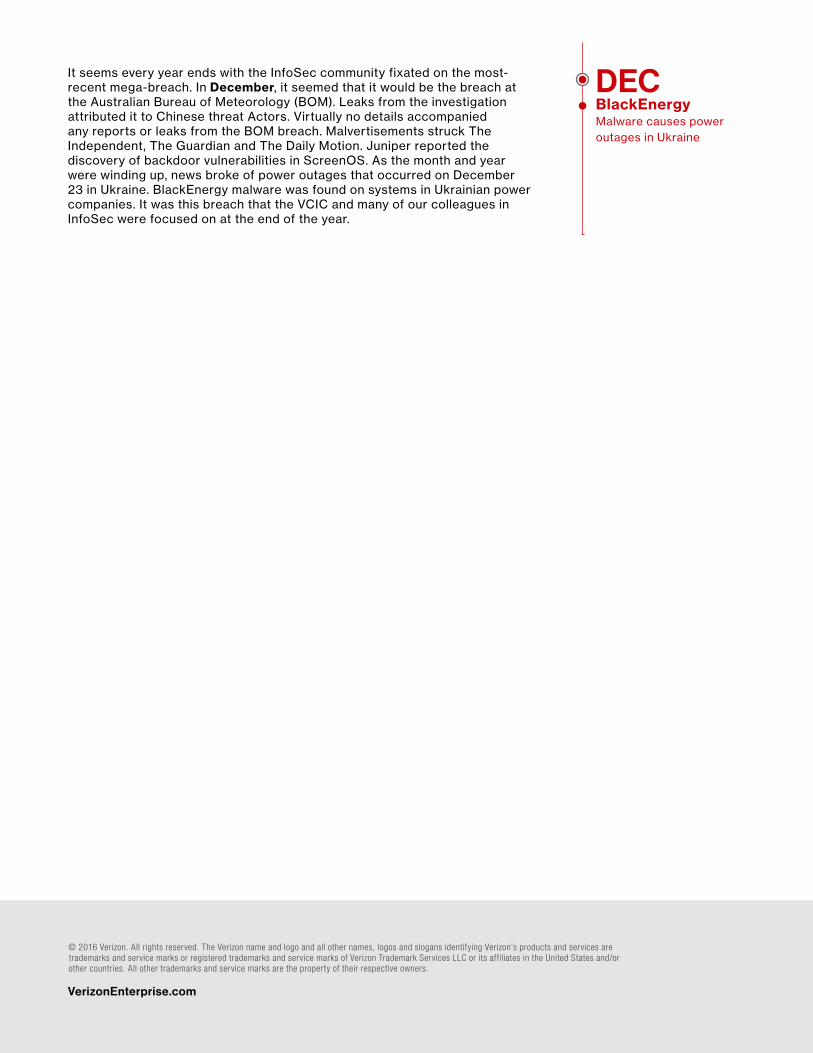
Verizon 2016 Data Breach Investigations Report 80
It seems every year ends with the InfoSec community fixated on the most-recent mega-breach. In December, it seemed that it would be the breach at the Australian Bureau of Meteorology (BOM). Leaks from the investigation attributed it to Chinese threat Actors. Virtually no details accompanied any reports or leaks from the BOM breach. Malvertisements struck The Independent, The Guardian and The Daily Motion. Juniper reported the discovery of backdoor vulnerabilities in ScreenOS. As the month and year were winding up, news broke of power outages that occurred on December 23 in Ukraine. BlackEnergy malware was found on systems in Ukrainian power companies. It was this breach that the VCIC and many of our colleagues in InfoSec were focused on at the end of the year.
© 2016 Verizon. All rights reserved. The Verizon name and logo and all other names, logos and slogans identifying Verizon’s products and services are trademarks and service marks or registered trademarks and service marks of Verizon Trademark Services LLC or its affiliates in the United States and/or other countries. All other trademarks and service marks are the property of their respective owners.
VerizonEnterprise.com
DECBlackEnergyMalware causes poweroutages in Ukraine
About the coverThe ccover features three separate visualizations. The datay visualizations use the incident corpus bof the 2016 DBIR.e64,199 incidents and r2,260 breaches represent the .finalized dataset used in this year’s report.pa
Thetwhite lines in the background are a tree map that segments the cover into eight sections.hEach box represents an action or attribute ocount within the data. The top three sections, clockwise beginning with the upper left, are based on the number of incidents with confidentiality, integrity and availability losses. The five remainingg sections in the lower half represent (clockwise from the left-most section) incidents featuring the following threat actions: error, hacking, social, malware and misuse. Thee area of each box represents how many incidents featured that enumeration relative ton the other enumerations..aThe second image is the pyramid from the back of ai United States dollar bill. It represents the strong financial motivation of breaches in the report this year. It also implies the high cost to businesses and, potentially, the consumer when it comes to protecting oneself from cybercrime. The all-seeing eye, altered to look slightly downward, also has a double meaning in that it represents both the unseen attackers that sometimes feel omnipresent to cyber security defenders, and the need for those defenders to keep an eye on their data represented by the final visualization.
The bricks within the pyramid are a waffle chart representing the number of breaches grouped by the variety of data disclosed. The chart also includes a group of bricks. depicting breaches that resulted in a loss of availability. Each block (including partial edge blocks) represents roughly 78 incidents (78 chosen to match the number of blocks on the pyramid). From bottom to top, the attribute types are: credentials (mauve), payment card data (purple), personal data (pink), trade secrets (blue), loss of availability (green), medical data(dark yellow), banking data (light yellow), internal organization information (dark purple) and the orange brick in the upper right is the catch-all data variety of “all else.”