2016 CHINA-US INBOUND INVESTMENT CAPITAL WATCH · A Cushman & Wakefield Publication 2016 CHINA-US...
8
Xinyi McKinny Senior Managing Director China Direct Investment San Francisco Bay Area and Los Angeles +1 415 773 3555 [email protected] cushmanwakefield.com A Cushman & Wakefield Publication 2016 CHINA-US INBOUND INVESTMENT CAPITAL WATCH
Transcript of 2016 CHINA-US INBOUND INVESTMENT CAPITAL WATCH · A Cushman & Wakefield Publication 2016 CHINA-US...

Xinyi McKinnySenior Managing Director China Direct Investment San Francisco Bay Area and Los Angeles+1 415 773 [email protected]
cushmanwakefield.com
A Cushman & Wakefield Publication
2016 CHINA-US INBOUND INVESTMENT CAPITAL WATCH

MARKET HIGHLIGHTS
Source: RCA, Cushman & Wakefield Research
China / HK Investments in U.S. CRE by Location: 2011 - PresentVolume (Dollars in billions)
2,028 1,576
4,4965,623
17,296
19,251
0
2,000
4,000
6,000
8,000
10,000
12,000
14,000
16,000
18,000
20,000
2011 2012 2013 2014 2015 2016Other Seattle Chicago Los Angeles SF Bay Area Manhattan
Source: RCA, Cushman & Wakefield Research
China / HK Investments in U.S. CRE: 2011 - PresentVolume (Dollars in mllions), Percent (%)
29% 30% 29%
59%62%
0%
10%
20%
30%
40%
50%
60%
70%
0
2,000
4,000
6,000
8,000
10,000
12,000
14,000
16,000
18,000
20,000
2011 2012 2013 2014 2015 2016
Trailing 12 Months Deals >$1 Billion Trailing 12 Months Deals <$1 Billion % Deals >$1 Billion
China / HK Investments in U.S. CRE: 2011 - Present Volume (Dollars in millions), Percent (%)
China / HK Investments in U.S. CRE by Location: 2011 - Present Volume (Dollars in millions)
Trailing 12 Months Deals >$1 Billion
Other
Trailing 12 Months Deals <$1 Billion
Seattle Chicago Los Angeles SF Bay Area Manhattan
% Deals >$1 Billion
20,000
18,000
16,000
14,000
12,000
10,000
8,000
6,000
4,000
2,000
0
20,000
18,000
16,000
14,000
12,000
10,000
8,000
6,000
4,000
2,000
0
Source: RCA, Cushman & Wakefield Research
Source: RCA, Cushman & Wakefield Research
70%
60%
50%
40%
30%
20%
10%
0%2011
2011
2012
2012
2013
2013
2014
2014
2015
2015
2016
2016
2
Compared to other countries, China ranked No. 1 among foreign investors in commercial real estate within the U.S. in 2016. China inbound investment deal volumes have grown rapidly, reaching $19.2 billion USD in 2016, a record high. Sixty-two percent of the
investments, which equated to $11.9 billion USD, were deals over $1 billion USD. The five largest Chinese investment transactions were among the top ten largest transactions in the U.S. in 2016.
The U.S. East and West Coasts have historically been primary recipients of significant Chinese investment. These are also the most expensive markets in the U.S. The top 5 markets for Chinese investment are New York City (46%), San Francisco Bay Area (15%), Los Angeles (7%),
Chicago (5%) and Seattle (2%). Chicago experienced significant growth, from $377 million USD in 2014 to over $1 billion USD in 2016. The top 5 U.S. markets made up 76% of the total investment.

Source: RCA, Cushman & Wakefield Research
China / HK Investments in U.S. CRE by Investor Type: 2011 - PresentPercent of total (%)
35%
50%
10%
40% 6%
26%
11%
36%
36%
8%
11%
24%49%
18%
38%
7%
14%
0%
15%
17%
20%
13%
11%7%
29%12%
33%
2%3% 9% 5% 4%
2011 2012 2013 2014 2015 2016Other High Net Worth Equity Fund Sovereign Wealth Fund Developer/Owner/Operator
Real Estate Operating Company Investment Manager Insurance
Source: RCA, Cushman & Wakefield Research
China/HK Inbound Investments in the U.S. by Asset Class: 2012 - PresentDollars in millions
0
1,000
2,000
3,000
4,000
5,000
6,000
7,000
8,000
9,000
10,000
Hotel Office Dev Site Industrial Apartment Retail2012 2013 2014 2015 2016
China / HK Investments in U.S. CRE by Investor Type: 2011 - Present Percent of total (%)
China/HK Inbound Investments in the U.S. by Asset Class: 2012 - Present Dollars in millions
OtherReal Estate Operating Company
High Net Worth Equity FundInvestment Manager
Sovereign Wealth FundInsurance
Developer/Owner/Operator
10,000
9,000
8,000
7,000
6,000
5,000
4,000
3,000
2,000
1,000
0
Source: RCA, Cushman & Wakefield Research
Source: RCA, Cushman & Wakefield Research
2011 2012
Hotel
2012
2013
Office
2013
2014
Dev Site
2014
2015
Industrial
2015
2016
Apartment Retail
2016
3
Office and hotel investment remained the most popular investment assets, while industrial investment slowed significantly. Hotel investment was $8.6 billion USD in 2016, compared to $2.8 billion USD in 2015. The largest transaction in 2016 was a hotel deal from Anbang Insurance Group.
San Francisco Bay Area
15%
New York City
46%
Los Angeles
7%
Chicago
5%
Seattle
2%
The investment sources have become more diverse. Since 2012, Chinese insurance companies have been allowed by the China Insurance Regulatory Commission (CIRC) to invest in overseas real estate markets.
China’s insurance industry is valued at approximately $1.83 trillion USD, according to figures from the CIRC. Only a fraction of funds are invested in U.S. real estate at this time. In 2015 and 2016, more than half of the investments came from Chinese life insurers.
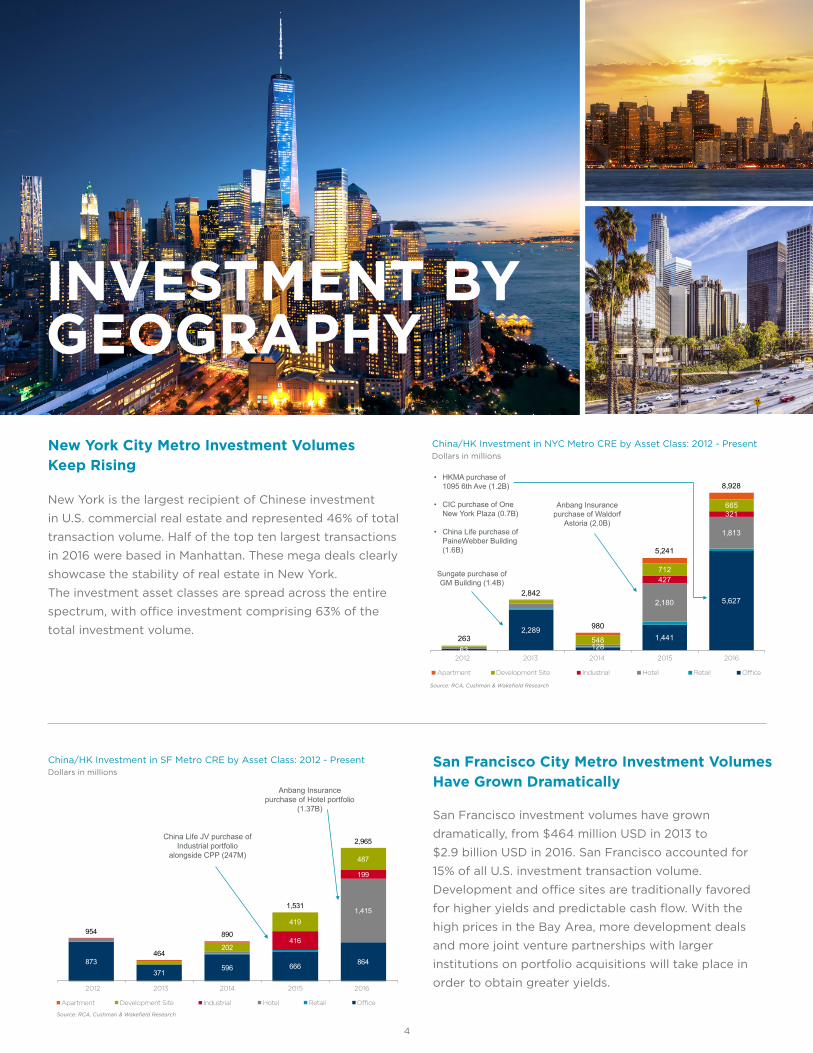
INVESTMENT BY GEOGRAPHY
4
New York is the largest recipient of Chinese investment
in U.S. commercial real estate and represented 46% of total
transaction volume. Half of the top ten largest transactions
in 2016 were based in Manhattan. These mega deals clearly
showcase the stability of real estate in New York.
The investment asset classes are spread across the entire
spectrum, with office investment comprising 63% of the
total investment volume.
San Francisco investment volumes have grown
dramatically, from $464 million USD in 2013 to
$2.9 billion USD in 2016. San Francisco accounted for
15% of all U.S. investment transaction volume.
Development and office sites are traditionally favored
for higher yields and predictable cash flow. With the
high prices in the Bay Area, more development deals
and more joint venture partnerships with larger
institutions on portfolio acquisitions will take place in
order to obtain greater yields.
New York City Metro Investment Volumes Keep Rising
San Francisco City Metro Investment Volumes Have Grown Dramatically
China/HK Investment in NYC Metro CRE by Asset Class: 2012 - PresentDollars in millions
63
2,289
1281,441
5,6272,180
1,813
427
321
548
712
665
263
2,842
980
5,241
8,928
2012 2013 2014 2015 2016
Apartment Development Site Industrial Hotel Retail Office
Anbang Insurance purchase of Waldorf
Astoria (2.0B)
• HKMA purchase of 1095 6th Ave (1.2B)
• CIC purchase of One New York Plaza (0.7B)
• China Life purchase of PaineWebber Building (1.6B)
Sungate purchase of GM Building (1.4B)
Source: RCA, Cushman & Wakefield Research
China/HK Investment in NYC Metro CRE by Asset Class: 2012 - Present Dollars in millions
Apartment Development Site Industrial Hotel Retail Office
Source: RCA, Cushman & Wakefield Research
2012 2013 2014 2015 2016
China/HK Investment in SF Metro CRE by Asset Class: 2012 - PresentDollars in millions
873371
596 666 864
1,415
416
199
202
419
487
954
464
890
1,531
2,965
2012 2013 2014 2015 2016
Apartment Development Site Industrial Hotel Retail Office
China Life JV purchase of Industrial portfolio
alongside CPP (247M)
Anbang Insurance purchase of Hotel portfolio
(1.37B)
Source: RCA, Cushman & Wakefield Research
China/HK Investment in SF Metro CRE by Asset Class: 2012 - Present Dollars in millions
Apartment Development Site Industrial Hotel Retail Office
Source: RCA, Cushman & Wakefield Research
2012 2013 2014 2015 2016

5
Chicago experienced
significant growth in 2015
and 2016. The investment
volume jumped from
$377 million USD in 2014 to
$1 billion USD in both 2015
and 2016. Chicago had the
fourth-highest volume of
Chinese investment
in 2016.
Compared to the low cap
rate in Manhattan and San
Francisco, Chicago is very
attractive for investors.
In return for higher yields
(compared to Manhattan
and San Francisco),
investors are willing to
take on the higher risk
of owning property
in Chicago.
Historically considered a
second-tier city to foreign
interests, Seattle/Bellevue
is now being scrutinized
much more closely by
overseas developers and
commercial real-estate
investors. In June 2015,
Hong Kong-based Gaw
Capital Partners spent
$711 million USD to buy
Columbia Center, Seattle’s
tallest building, in what was
one of the largest deals in
the region’s history. Tenants
like Amazon, Microsoft, and
now Facebook’s growth in
the area has spurred the
belief that more technology
giants will migrate to this
region. As a result, Seattle/
Bellevue has surpassed Los
Angeles as the third most
sought after city in the U.S.
Chicago and Seattle
China/HK Investment in Chicago/Seattle Metro CRE by Asset Class: 2012 - PresentDollars in millions
354
1,624
234
84
1,014
780
100
59 36
480
2,552
1,433
2012 2013 2014 2015 2016
Anbang Insurance purchase of Blackstone Hotel Portfolio
in Chicago (1.0B)• GLP / China Life purchase of Industrial portfolio in Chicago / Seattle (0.5B)
• GLP purchase of Industrial portfolio in Chicago / Seattle (0.3B)
Source: RCA, Cushman & Wakefield Research
• COS Capital purchase of Aon Center in Chicago (0.7B)
• Gaw Capital purchase of Columbia Center in Seattle (0.7B)
Apartment Development Site Industrial Hotel Retail Office
The Los Angeles market continues to be a primary
recipient of significant Chinese investment. A number of
mega deals came to fruition in LA in the last three years.
These mega deals, if isolated, indicate steadiness in
Chinese investment volume in LA, despite the
development spike in 2014. Considerable Chinese
development projects such as Greenland Metropolis,
Oceanwide Plaza and Hazens LA Center are
transforming LA’s skyline, revitalizing neighborhoods
and inspiring additional investment.
Los Angeles Metro Investment Continues, While Volume Has Declined In Recent Years
China/HK Investment in LA Metro CRE by Asset Class: 2012 - PresentDollars in millions
113
1,696
448
222
307
136
1,175
1,266
175
145
290
74
525
2,625
1,578 1,586
2012 2013 2014 2015 2016
Anbang Insurance purchase of Blackstone Hotel Portfolio (1.1B)
• GLP / China Life purchase of Industrial portfolio (0.7B)
• CIC purchase of Industrial portfolio (0.5B)
HKMA purchase of Century Park Office
portfolio (1.6B)
Source: RCA, Cushman & Wakefield Research
Apartment Development Site Industrial Hotel Retail Office
China/HK Investment in LA Metro CRE by Asset Class: 2012 - Present Dollars in millions
China/HK Investment in Chicago/Seattle Metro CRE by Asset Class: 2012 - Present Dollars in millions
Apartment
Apartment
Development Site
Development Site
Industrial
Industrial
Hotel
Hotel
Retail
Retail
Office
Office
Source: RCA, Cushman & Wakefield Research
Source: RCA, Cushman & Wakefield Research
2012
2012
2013
2013
2014
2014
2015
2015
2016
2016

6
With pressure from a slowing
Chinese economy, the attraction of
overseas investment and the strength
of Chinese enterprises, Chinese
inbound investment deal volumes
reached a record high in 2016.
However, in late 2016, China
tightened its monetary policy and
capital outflow restrictions.
According to media news sources,
Also affected by the ban are mergers
and acquisitions valued at more than
$1 billion USD outside of a Chinese
investor’s core business, and foreign
real estate deals by state-owned
enterprises involving more than
$1 billion USD. The Chinese
government is cracking down on
extra-large deals. Submitting
paperwork to Beijing for special
clearance before proceeding is not
new to Chinese enterprises doing
massive investment overseas.
Since 2013, the overseas investment
approval limit has been at $1 billion
USD. In 2016, 62% of the investments
were over $1 billion. The approval
process will take longer in 2017.
“Until September of 2017, Beijing would ban all deals involving investment of more than $10 billion USD.”
REGULATORY ENVIRONMENT

7
Chinese real estate purchases in the U.S. are likely to continue
in the face of declining economic and financial conditions in
China. Growth will experience a slowing phase until September
2017 due to Chinese government capital outflow restrictions.
The Chinese government has been taking longer to approve
investments abroad in recent months, signaling an effort to
staunch the flow of funds overseas. The new policy is aimed to
regulate the international investment for the next nine months.
Chinese development will focus more on strategic asset
allocation, with an increase in office buildings, while hotel and
residential developments reach new peaks. They will need
locally based partners to assist in this expansion and this is
where enormous opportunity lies for the U.S. commercial real
estate community, if harnessed correctly.
More Chinese insurers will issue offshore debt to mitigate some
of its currency risk. The low liquidity, value-added potential and
stable cash flow of prime office and retail assets offer a perfect
match for these investors.
Aside from the traditional East and West Coast gateway cities,
Chinese investors will become more widely distributed across
the U.S.
2017 OUTLOOK
Property Name Region Investor Type Price (US$million)
Size (SF/Units)
Date
Various Various Anbang Insurance Group Hotel 5,500 Sep-16
11 Madison Avenue NYC Metro PGIM Real Estate Office 2,600 2,285,043 Aug-16
Fashion Show Mall Las Vegas TIAA-CREF Retail 2,500 836,006 Jul-16
1095 Sixth Avenue NYC Metro HKMA Office 2,353 1,116,129 Jul-16
fmr McGraw-Hill HQ NYC Metro Invesco RE, CIC Office 2,290 2,625,640 Dec-16
Various Various GIC (Govt of Singapore) Other 2,150 44,600 Aug-16
10 Hudson Yards NYC Metro Allianz RE of America Office 2,150 1,813,465 Aug-16
Starwood SS US Hotels Various China Life Insurance Hotel 2,000 Oct-16
787 Seventh Avenue NYC Metro CommonWealth Partners, CalPERS Office 1,941 1,706,007 Jan-16
Citigroup HQ NYC Metro CommonWealth Partners, CalPERS Office 1,884 2,634,670 Jun-16
Top 10 U.S. Commercial Real Estate Transactions of 2016
Source: RCA, Cushman & Wakefield Research *Transactions involving a cross-border investor from China or Hong Kong highlighted
Property Name Region Inbound Investor Type Price (US$million)
Size (SF/Units)
Date
Various Various Anbang Insurance Group Hotel 5,500 Sep-16
PaineWebber Building Various RXR Realty Office 1,650 1,749,000 May-16
Starwood SS US Hotels Various China Life Insurance Hotel 1,500 Oct-16
1095 Sixth Avenue NYC Metro HKMA Office 1,153 1,116,129 Jul-16
fmr McGraw-Hill HQ NYC Metro China Investment Corp Office 1,031 2,625,640 Dec-16
One New York Plaza NYC Metro China Investment Corp Office 700 2,545,000 May-16
850 Third Avenue NYC Metro HNA Group Office 463 613,664 Mar-16
Lipstick Building (Land Only) NYC Metro Shanghai Municipal Office 453 592,000 Feb-16
Medical Office Kansas Taikang Life Insurance Office 399 Nov-16
Various Various Ping An Insurance Industrial 390 Nov-16
Top Ten China/Hong Kong Inbound Transactions of 2016
Source: RCA, Cushman & Wakefield Research Note: Price reflect partial interest volume of the China/HK investor
About Cushman & Wakefield
Cushman & Wakefield is a global leader in commercial real estate services,
helping clients transform the way people work, shop, and live. The firm’s 43,000
employees in more than 60 countries provide deep local and global insights
that create significant value for occupiers and investors around the world.
Cushman & Wakefield is among the largest commercial real estate services firms
in the world with revenues of $5 billion across core services of agency leasing,
asset services, capital markets, facilities services (branded C&W Services),
global occupier services, investment management (branded DTZ Investors),
tenant representation and valuations & advisory. To learn more, visit www.
cushmanwakefield.com or follow @Cushwake on Twitter.
Copyright © 2017 Cushman & Wakefield. All rights reserved. The information contained within this report is gathered from multiple sources considered to be reliable. The information may contain errors or omissions and is presented without any warranty or representations as to its accuracy.
Xinyi McKinnySenior Managing Director China Direct Investment San Francisco Bay Area and Los Angeles
Direct: +1 415 773 3555 Mobile: +1 720 238 5460 [email protected]