2016 ANNUAL REPORT & ACCOUNTS - POLA2012 · Gordon Coates, died following an accident while...
92
2016 / ANNUAL REPORT & ACCOUNTS CUSTODIANS OF THE TIDAL THAMES
Transcript of 2016 ANNUAL REPORT & ACCOUNTS - POLA2012 · Gordon Coates, died following an accident while...

2016 / ANNUAL REPORT & ACCOUNTS
CUSTODIANS OF THE TIDAL THAMES

The River Thames is the UK’s busiest inland waterway for passengers and freight.It is one of the main arteries that feeds our capital city and the south east, supporting trade, travel, leisure and sporting activities.
It is also a thing of beauty and majesty which delivers great pleasure to millions of people, on the water and on its banks.
As Custodians of the tidal Thames, everything we do is designed to ensure that the river is, and remains, at its best. Our mission is to maintain a safe river to support London and the south east in a wide range of activities, at work, rest and play. We also focus on maintaining the Thames, its surroundings and the wildlife it supports, for the benefit and enjoyment of many generations to come.
Through developing the Thames Vision with stakeholders, we have established a shared blueprint for ensuring that the river reaches its full potential, generating jobs, enjoyment and wellbeing. Our activities in 2016 were consistent with the goal we share with our stakeholders: a vibrant, safe and sustainable River Thames.
This Annual Report centres on the activities we undertake which generate most value:
• River navigation and safety
• Planning consultation and technical expertise
• Bringing people together and promoting the river
• Environmental stewardship
We hope you find the report of interest and if you want to find out more, visit our website: www.pla.co.uk
Contents2016 Key indicators 12016 Highlights 2
Strategic report 4 Chairman’s statement 5Chief executive’s statement 7
Business model 12
PLA strategy 13Income 14Stakeholder benefits 15 River navigation and safety 16 Planning consultation and technical expertise 18 Bringing people together and promoting the river 20 Environmental stewardship 22 PLA in the community 24PLA people 26 River use statistics 28PLA activity indicators 30Stakeholder benefit statistics 32Port trade statistics 33Risk management 36
Governance 40
Corporate governance report 41Board members 43Board members’ biographies 44PLA board – summary statistics 47Committees 48
Financial statements 50
Consolidated income statement 51Consolidated statement of other
comprehensive income 51Consolidated and company balance sheet 52Consolidated and company statements
of changes in equity 53Consolidated statement of cash flows 54Notes to the consolidated and company
financial statements 55Statement of Members’ responsibilities 87Independent auditor’s report 88
// cover photo The Thames and attractions on its banks like the London Eye are a magnet for tourists and Londoners, with over ten million drawn to travel on the river a year.

ANNUAL REPORT & ACCOUNTS / 1
2016 Key indicators
PLA in the community
219people attending public meetings
10 Events attended by riverside code safety trailer
Environmental stewardship
14 Thames21 clean-ups supported
175 Tonnes of driftwood recovered
Finance
£12.5mOperating surplus
£4.3mCash invested
£40.2mStakeholder benefit
PLA personal Health & Safety
5Lost Time Accidents
58Near miss reports
Navigation & Safety
13,123Pilotage Acts
10 Significant navigational incidents
River use
50.4mTonnes of goods handled
10.6mPassenger journeys
3.0m Tonnes of inland waterways freight
99Sporting events
2 / PORT OF LONDON AUTHORITY
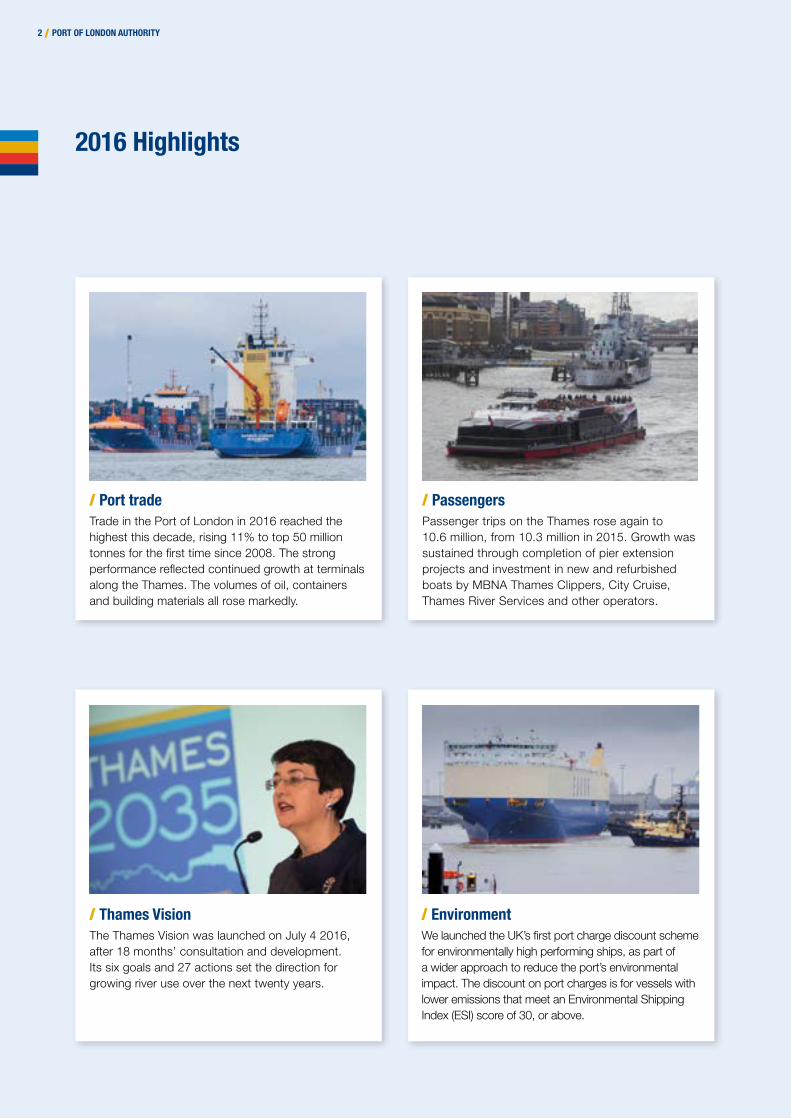
2016 Highlights
/ Port tradeTrade in the Port of London in 2016 reached the highest this decade, rising 11% to top 50 million tonnes for the first time since 2008. The strong performance reflected continued growth at terminals along the Thames. The volumes of oil, containers and building materials all rose markedly.
/ Thames VisionThe Thames Vision was launched on July 4 2016, after 18 months’ consultation and development. Its six goals and 27 actions set the direction for growing river use over the next twenty years.
/ PassengersPassenger trips on the Thames rose again to 10.6 million, from 10.3 million in 2015. Growth was sustained through completion of pier extension projects and investment in new and refurbished boats by MBNA Thames Clippers, City Cruise, Thames River Services and other operators.
/ Environment We launched the UK’s first port charge discount scheme for environmentally high performing ships, as part of a wider approach to reduce the port’s environmental impact. The discount on port charges is for vessels with lower emissions that meet an Environmental Shipping Index (ESI) score of 30, or above.

ANNUAL REPORT & ACCOUNTS / 3
/ EventsWe hosted the official naming of cruise ship Viking Sea on our Greenwich moorings. Other Thames events included a pageant to mark the Queen’s 90th birthday; the Clipper Round the World Race finish; and a commemoration of the 350th anniversary of the Great Fire of London.
/ London Gateway PortLondon Gateway welcomed what was at the time the world’s most loaded container ship, UASC Al Muraykh, carrying a recorded 18,601 TEU. By the end of the year, testing of facilities on Berth Three was underway, with new quayside cranes delivered by sea from China.
/ Port of Tilbury The Port of Tilbury started developing a new two million square foot warehouse for Amazon, the cruise terminal attracted over 100,000 passengers for the second year in a row and planning for the Tilbury 2 extension project continued.
/ Peruvian WharfCompleted the acquisition of Peruvian Wharf, a strategically important site safeguarded for port operations. The wharf will be developed as a building materials hub ideally placed to serve the development of East London.

4 / PORT OF LONDON AUTHORITY
// 2016 was a great year for river use, as the ambitions of the Thames Vision started to take shape on the river.
Strategic Report
ANNUAL REPORT & ACCOUNTS / 5
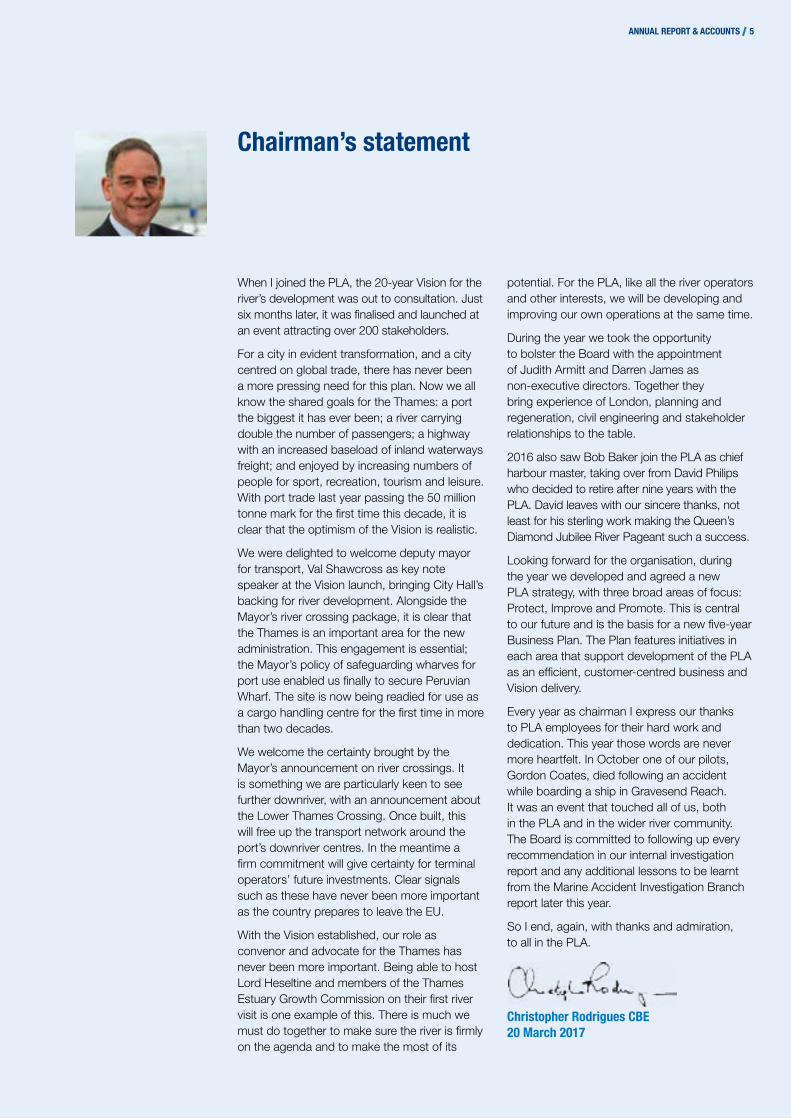
Chairman’s statement
When I joined the PLA, the 20-year Vision for the river’s development was out to consultation. Just six months later, it was finalised and launched at an event attracting over 200 stakeholders.
For a city in evident transformation, and a city centred on global trade, there has never been a more pressing need for this plan. Now we all know the shared goals for the Thames: a port the biggest it has ever been; a river carrying double the number of passengers; a highway with an increased baseload of inland waterways freight; and enjoyed by increasing numbers of people for sport, recreation, tourism and leisure. With port trade last year passing the 50 million tonne mark for the first time this decade, it is clear that the optimism of the Vision is realistic.
We were delighted to welcome deputy mayor for transport, Val Shawcross as key note speaker at the Vision launch, bringing City Hall’s backing for river development. Alongside the Mayor’s river crossing package, it is clear that the Thames is an important area for the new administration. This engagement is essential; the Mayor’s policy of safeguarding wharves for port use enabled us finally to secure Peruvian Wharf. The site is now being readied for use as a cargo handling centre for the first time in more than two decades.
We welcome the certainty brought by the Mayor’s announcement on river crossings. It is something we are particularly keen to see further downriver, with an announcement about the Lower Thames Crossing. Once built, this will free up the transport network around the port’s downriver centres. In the meantime a firm commitment will give certainty for terminal operators’ future investments. Clear signals such as these have never been more important as the country prepares to leave the EU.
With the Vision established, our role as convenor and advocate for the Thames has never been more important. Being able to host Lord Heseltine and members of the Thames Estuary Growth Commission on their first river visit is one example of this. There is much we must do together to make sure the river is firmly on the agenda and to make the most of its
potential. For the PLA, like all the river operators and other interests, we will be developing and improving our own operations at the same time.
During the year we took the opportunity to bolster the Board with the appointment of Judith Armitt and Darren James as non-executive directors. Together they bring experience of London, planning and regeneration, civil engineering and stakeholder relationships to the table.
2016 also saw Bob Baker join the PLA as chief harbour master, taking over from David Philips who decided to retire after nine years with the PLA. David leaves with our sincere thanks, not least for his sterling work making the Queen’s Diamond Jubilee River Pageant such a success.
Looking forward for the organisation, during the year we developed and agreed a new PLA strategy, with three broad areas of focus: Protect, Improve and Promote. This is central to our future and is the basis for a new five-year Business Plan. The Plan features initiatives in each area that support development of the PLA as an efficient, customer-centred business and Vision delivery.
Every year as chairman I express our thanks to PLA employees for their hard work and dedication. This year those words are never more heartfelt. In October one of our pilots, Gordon Coates, died following an accident while boarding a ship in Gravesend Reach. It was an event that touched all of us, both in the PLA and in the wider river community. The Board is committed to following up every recommendation in our internal investigation report and any additional lessons to be learnt from the Marine Accident Investigation Branch report later this year.
So I end, again, with thanks and admiration, to all in the PLA.
Christopher Rodrigues CBE20 March 2017
6 / PORT OF LONDON AUTHORITY
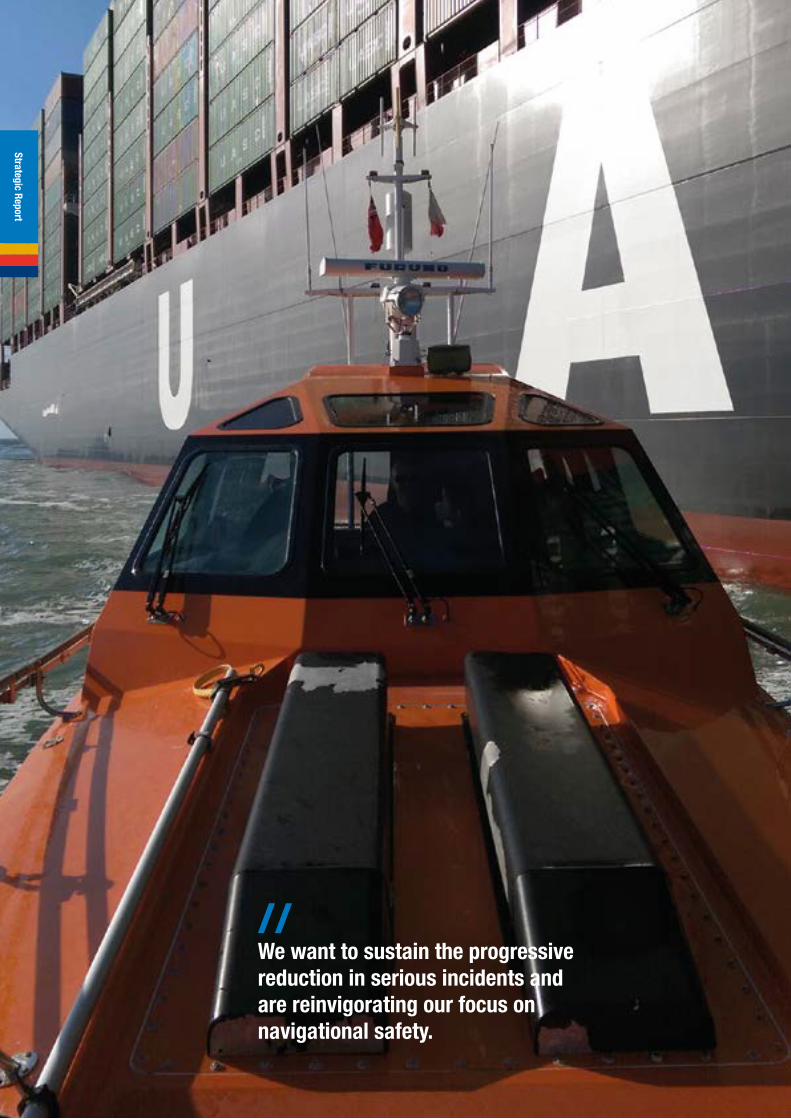
// We want to sustain the progressive reduction in serious incidents and are reinvigorating our focus on navigational safety.
Strategic Report

ANNUAL REPORT & ACCOUNTS / 7
Chief Executive’s statement
For many of us in the PLA, 2016 will be remembered as the year in which our colleague Gordon Coates lost his life while carrying out his job on the Thames. Gordon was a PLA pilot for over 20 years, he was well known and a good friend to many within the PLA and in the river community. He died after an accident boarding a ship in Gravesend Reach in October and is very much missed.
Health & Safety
The loss of Gordon Coates was the first fatality in the PLA for more than 20 years. We undertook our own investigation into the accident and the report sets out recommendations and actions to be followed up. The actions are all being progressed as a matter of urgency. The Marine Accident Investigation Branch (MAIB) will also report on the incident during 2017 and we will follow up on any additional recommendations made by the MAIB.
The accident involving Gordon was one of five Lost Time Accidents (LTAs) during the year, compared to none during 2015 and one in 2014. Although our overall accident rate remains below the port sector average, the increase is concerning and we will be giving priority in 2017 to reinforcing our Golden Rules for safety for all PLA staff and contractors. Part of this will be continuing to build on the culture of near miss reporting, with a year-on-year increase in near miss reports again in 2016 being an important part of our people being safety aware.
River navigation
Overall safety performance on the river was the best in seven years. Ten serious incidents during 2016 compared to 14 in 2015 and 38 in 2014.
We want to sustain the progressive reduction in serious incidents and are reinvigorating our focus on navigational safety to achieve this. New initiatives in hand are a ‘Red Tape Challenge’ to make our rules and regulations simpler for everyone to understand; and a commitment to complete and publish accident investigation findings more quickly on our website. That means that anything we learn from an accident is identified and shared as soon as possible, reducing the risk of similar accidents happening again.
Port trade
Trade during 2016 was particularly strong, rising more than 10% to top 50 million tonnes for the first time since 2008. This strong performance reflected continued growth at terminals along the Thames. The volumes of oil, containers and building materials all rose markedly. Prior to 2016, port throughput had been increasing at between two to three per cent a year.
Forth Ports continued to develop the Port of Tilbury, the biggest terminal on the tidal Thames. A dedicated new chill store for NFT was officially opened and work started on a new, two million square foot, fulfilment centre for Amazon, which is expected to generate 1,500 new jobs. Future development of the port estate will be to the east on the site of the former RWE power station site, which Forth acquired early in 2016.
£56.9mRevenue (2015: £49.9m)
£12.5m Operating surplus (2015: £7.6m)
£4.3mCash invested (2015: £3.9m)
5Lost time accidents (2015: 0)
8 / PORT OF LONDON AUTHORITY
London Gateway Port demonstrated its capabilities further, handling increasing numbers of ultra-large container ships - operating between Asia and Europe - benefiting from its operational resilience in bad weather. Testing of facilities on Berth Three started at the end of 2016.
Other major terminals on the Thames enjoying a strong year included Navigator’s West Thurrock oil storage operation, acquired from Vopak in early 2016 and CLdN’s freight ferry business. CLdN announced plans for a large expansion of their Rotterdam and Zeebrugge/London service, with two of the largest ro-ro freight ferries set be delivered during 2017.
The first cargoes were delivered to Thames Oil Port, the former Coryton oil refinery site, now redeveloped as a fuel terminal. The Thames also hosted the naming ceremony for new cruise ship, Viking Sea on our specially extended moorings at Greenwich.
The rapid growth in overall port trade was ahead of expectations. Combined with an increasing number of smaller vessels calling on the Thames, against the trend of previous years, it created challenging peaks in demand for our pilotage services. Whilst we continued to serve more than 94% of vessels without delay, there were a significant and unacceptable number of delays at peak times. We worked closely with our customers over this. With the support of our pilots and co-ordinators, we put in place a number of short-term measures to respond to this challenge and worked hard to minimise delays. We also embarked on a major pilot recruitment drive, with 12 new pilots joining
us for training during the year and a further 12 being recruited in 2017. With delays peaking in the summer, the number was falling by the end of 2016. We are improving our forecasting to be better prepared for future increases in demand.
River use
River passenger travel grew steadily, with more than 10.6 million passenger trips taken on the Thames in 2016 (2015: 10.3 million). Investment that will underpin future growth included pier extensions at Bankside and Westminster; and a new Blackfriars Pier was built as part of the Tideway project. MBNA Thames Clippers ordered two further new ferries, these being built at a shipyard on the Isle of Wight.
The tonnage of goods and materials moved between Thames terminal increased by more than 10% to 3.0 million tonnes (2015: 2.7 million tonnes). Projects making use of the Thames included the Northern Line extension, where the volume of materials planned to be moved by river was increased to almost one million tonnes. Cory Riverside Energy, one of the longest-standing Thames inland freight operators introduced three new barges to their fleet.
The first major Tideway movements of materials started with riverside sites established at Chambers Wharf and Carnwath Road in Fulham. The site set-up process involved river transport of office units to both wharves from Tilbury. A new, extended passenger pier was also installed east of Blackfriars Bridge to replace the current Blackfriars Pier.
Chief Executive’s statement / continued /
Strategic Report

ANNUAL REPORT & ACCOUNTS / 9
During 2016 the PLA achieved a major success with our work to bring unused, safeguarded wharves back into port use, acquiring Peruvian Wharf in east London from its owners for £3 million. Contractors are now busy with enabling works including access road construction and site clearance, creating a platform for Brett Group to build a dedicated building materials terminal. In addition to this, Tideway’s operation at Hurlingham Wharf and at the other safeguarded wharves in west London brings long term targets for reactivation back into use. We continue to pursue the reactivation of Orchard Wharf in east London too.
Finances
Port trade grew by 11%, increasing revenues to £56.9 million (2015: £49.9 million). We also saw growth in rental income as a number of river works licences were renegotiated to market values and royalties increased from our landfill site at Rainham.
Cost growth was contained to 5.1%, reflecting the additional work carried out to service growing trade volumes.
The combined impact of revenue increases and good cost control was that income from operations for the financial year grew to £12.5 million (2015: £7.6 million). Income from operations is used to finance our cash requirements for sustaining investment as well as contributions to the pensions deficit repair programmes.
We invest to maintain our assets and improve the efficiency of our operations as well as to support growth in the wider port. Our principal assets include boats, radars, piers and pontoons.
During the year we invested £4.3 million, with the main capital expenditures being a new boat lift for our Denton Wharf operation and the acquisition of Peruvian Wharf, which will be leased to generate a rental income and support additional freight volumes on the river.
We also continued to upgrade our core navigation systems. The main 2016 work was to our Broadness radar, and in 2017 the focus will be the construction and fit out of a new radar station at Northfleet, serving the heart of the commercial port.
The financing of our pension obligations is a significant commitment. Under the deficit repair agreement with the PLA Pension Scheme Trustees, we make annual payments of £4 million, over and above normal employer’s pensions contributions.
The need for this payment was underscored by a fall in our comprehensive income (which includes pension liability adjustments) from a £17.4 million surplus in 2015 to a loss of £11.7 million in 2016.
This very significant reduction was caused by a 1% reduction in the discount rate used by our advisers to calculate our liabilities which increased the net deficit from £80 million in 2015 to £101 million in 2016.
The net cash position on our balance sheet at the year-end increased by £3.6 million (2015 increase: £3 million).
10 / PORT OF LONDON AUTHORITY
Environment
2016 saw strong progress across our environmental agenda. Air quality in cities is an increasingly important issue and a focus for us. We became the first UK port to introduce a ‘green tariff’ discount on port charges for vessels with lower emissions. Work is also underway with the Greater London Authority on a programme to establish a stronger evidence base on river related air emissions. From this we will develop an action plan for implementation with river operators.
We are concluding the development of a streamlined approach to regulating development on the Thames with the Marine Management Organisation. Delegation of this authority will be a major benefit for river users, again giving them a one-stop shop for Thames licensing. We aim for this process to be completed ready for early 2018.
Opportunities and challenges
Thames Vision, the plan for the river’s development over the next 20 years was launched in July 2016. It sets out an ambitious future to strive for. The Vision covers six goals for growth, with actions to deliver the goals. Since the launch we have been working with the many stakeholders who will join us in taking actions to make the Vision come alive. During 2017 this will include completing our survey of recreational use of the river so we can encourage more participation in the future; recruiting additional planners to engage with boroughs and ensure that they think ‘river first’ in development plans; and establishing a new Port of London Infrastructure Group.
We are closely watching preparations to leave the European Union. Alongside the British port associations we will be pressing for the benefits of Single Market-style trading arrangements to be maintained.
Increasing levels of traffic, particularly in the area around London Gateway and Thames Oil Port, provides challenge and opportunity. As a port authority our pilotage and port control teams are now familiar with handling the world’s largest container ships on the Thames. As trade grows and operations intensify in this part of the river, traffic management will be especially important.
The development of the Thames Tideway Tunnel is the biggest single project in the London reaches of the Thames since the construction of the Embankment in the 1800s. With eleven construction sites in and alongside the river, this provides a major challenge for our harbour masters and licensing teams. The project is generating more than double the normal number of river works licence applications and, once tunnelling starts in 2018, the tonnage of materials being moved on the Thames is likely to reach new peaks too. In the long term the project will deliver a cleaner river and a new generation of tugs and barges for future deployment.
The official launch of the Thames Skills Academy (TSA) is a testament to the increasing confidence in the river’s future. Supported at launch by Tideway, it is set to transform the provision of a skilled Thames workforce of the future. We have supported the TSA since its inception; the organisation is part funded by a levy we raise on river operators.
Strategic Report
Chief Executive’s statement / continued /
ANNUAL REPORT & ACCOUNTS / 11
PLA Strategy
A review of our strategy was completed during 2016 and provides the basis for our work going forward. It established three clear roles for the PLA:
Protect – targeting zero harm and improved sustainability
Improve – running efficient operations and investing to support growing river use
Promote – leading the Thames Vision to unlock the potential of the Thames
To achieve our new strategic goals, we developed a five year business plan which was approved by the Board in December. The Business Plan features a comprehensive suite of strategic initiatives, including: a Red Tape Challenge to simplify our rules and regulations, development of an air quality strategy, outreach to riverside boroughs’ planning teams and developing sporting use of the river, alongside developments to improve the efficiency of our own operations.
The new strategy frames our approach to running the business and we will track progress against it in future reports.
Finally, I would like to add my thanks to the Chairman’s for the enormous dedication and hard work of the PLA team throughout the year. The tragedy in October brought home the risks that are always present for those working in a maritime environment and we must do all we can to make the Thames as safe as it possibly can be as river use continues to grow into the future.
Robin Mortimer 20 March 2017

12 / PORT OF LONDON AUTHORITY
Business Model
// Our new strategy is centred on three core roles for the PLA: Protect, Improve and Promote.
ANNUAL REPORT & ACCOUNTS / 13
As a Trust Port, we hold the Thames in trust for future generations. We have no shareholders, so operate for the benefit of stakeholders now and in the future.
Stakeholders’ ambition, as set out in the Thames Vision, is to see the river play a much greater role in the life of London and the south east, from trade and travel to sport and recreation. To support this ambition, our new strategy is centred on three core roles for the PLA:
Protect – targeting Zero Harm and improved sustainability
Improve – running efficient operations and investing to support growing river use
Promote – leading the Thames Vision to unlock the potential of the Thames
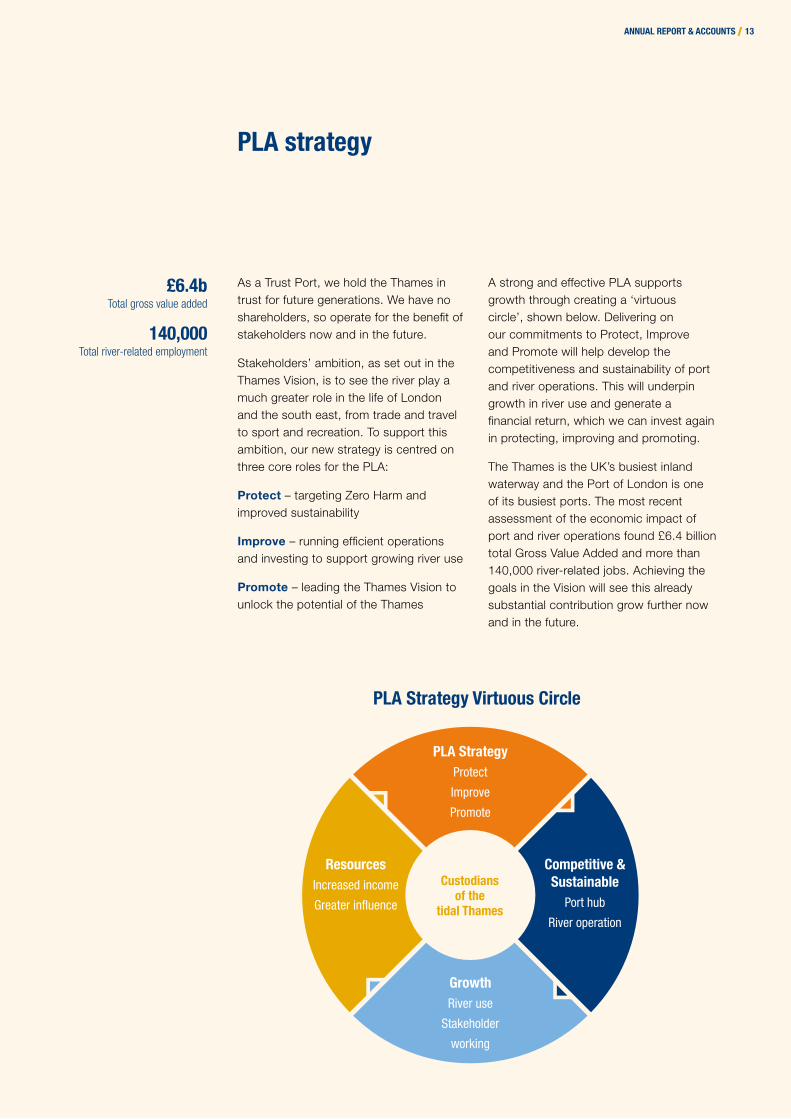
A strong and effective PLA supports growth through creating a ‘virtuous circle’, shown below. Delivering on our commitments to Protect, Improve and Promote will help develop the competitiveness and sustainability of port and river operations. This will underpin growth in river use and generate a financial return, which we can invest again in protecting, improving and promoting.
The Thames is the UK’s busiest inland waterway and the Port of London is one of its busiest ports. The most recent assessment of the economic impact of port and river operations found £6.4 billion total Gross Value Added and more than 140,000 river-related jobs. Achieving the goals in the Vision will see this already substantial contribution grow further now and in the future.
PLA strategy
PLA Strategy Virtuous Circle
Custodians of the
tidal Thames
PLA StrategyProtect
Improve
Promote
GrowthRiver use
Stakeholder
working
Competitive & Sustainable
Port hub
River operation
ResourcesIncreased income
Greater influence
£6.4bTotal gross value added
140,000 Total river-related employment
14 / PORT OF LONDON AUTHORITY14 / PORT OF LONDON AUTHORITY
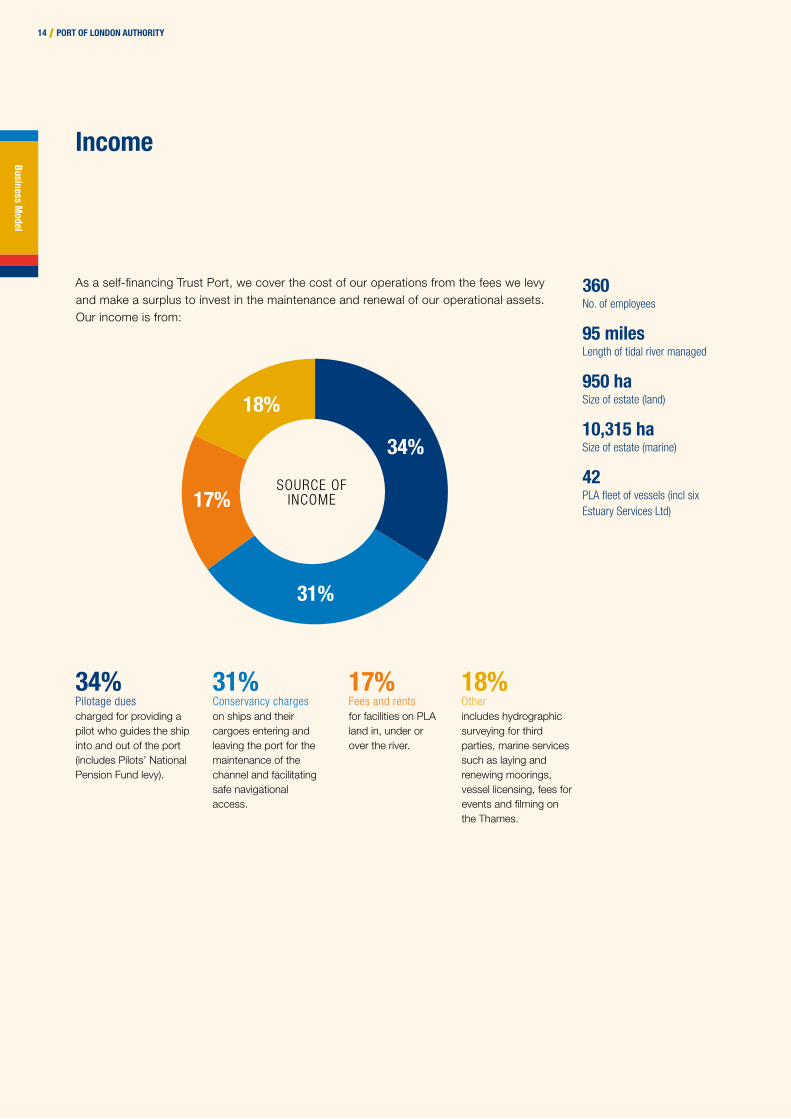
360 No. of employees
95 milesLength of tidal river managed
950 haSize of estate (land)
10,315 ha Size of estate (marine)
42PLA fleet of vessels (incl six Estuary Services Ltd)
Income
As a self-financing Trust Port, we cover the cost of our operations from the fees we levy and make a surplus to invest in the maintenance and renewal of our operational assets. Our income is from:
31%Conservancy chargeson ships and their cargoes entering and leaving the port for the maintenance of the channel and facilitating safe navigational access.
34%Pilotage duescharged for providing a pilot who guides the ship into and out of the port (includes Pilots’ National Pension Fund levy).
17%Fees and rentsfor facilities on PLA land in, under or over the river.
18%Other includes hydrographic surveying for third parties, marine services such as laying and renewing moorings, vessel licensing, fees for events and filming on the Thames.
SOURCE OF INCOME
34%
31%
18%
17%
Business Model

Independent research we commissioned in 2014 identified the things we do that stakeholders most value. One particular aspect people wanted to see was increased river advocacy. A logical step on from this was creating the Thames Vision, a framework for the river’s development over the next 20 years.
The Vision was finalised during the first half of 2016 and our new strategy ensures that we are continuing to improve as an organisation and deliver our actions under the Thames Vision.
Stakeholders most value our contributions in:
River Navigation and Safety:Our port control centres, harbour masters, pilots and river patrol crews help keep river users safe. Our salvage operations and divers keep the river clear of obstructions and open for business. We are responsible for river traffic control and navigational safety, including buoys, beacons, bridge lights and channel surveys.
Planning consultation and technical expertise:We provide information, support and significant technical expertise to help river users and investors maximise the value of the river, and to do it safely. We license river works and dredging on the river, applying our expertise to keep river users safe and protect the environment.
Bringing people together and promoting the river:We bring people together to discuss how to make the best use of the Thames and advocate its potential. We work with, and for, a wide range of stakeholders and partners on commercial freight, investment, property, safety, conservation, leisure, tourism, passenger transport, sporting
pursuits and major events. We try hard to be a ‘listening’ organisation as well as one that delivers what our stakeholders need and want.
Environmental stewardship:We hold the tidal Thames in trust, with the remit to hand it on to succeeding generations in the same, or better condition. A major part of our work is conservancy of the Thames, dredging and maintaining the main navigation channels on the river. As stewards of the marine environment, we carefully look after the river’s many assets, conserving wildlife, keeping the river clean and free of rubbish. We also promote the use of the river as a natural, low-carbon transport route.
Community benefit
Set alongside the economic and amenity benefits that our operations underpin, we also generate a substantial benefit to the community, estimated to be £40.2 million in 2016.
The benefit we generate derives from discretionary and non-discretionary spend. Our discretionary spend totals over £1 million. It includes: major charitable donations to organisations including the Sea Change Sailing Trust and Tilbury Seafarers Centre; activities required for our core responsibilities such as making our archive publicly available at the Museum of London Docklands; and support for organisations like the Thames Skills Academy.
More than £39 million is paid in taxes, wages and other employment costs which contribute directly to the local economy. The full breakdown of our stakeholder benefit calculation is on page 32.
Stakeholder benefits
ANNUAL REPORT & ACCOUNTS / 15
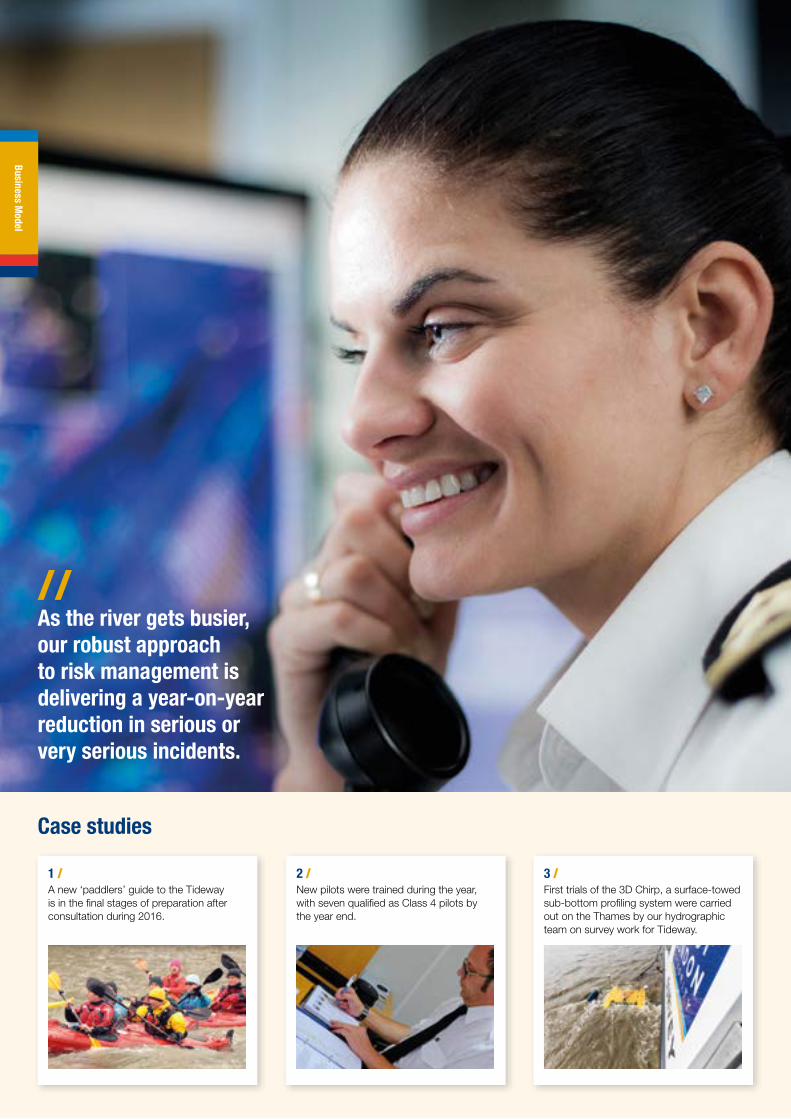
// As the river gets busier, our robust approach to risk management is delivering a year-on-year reduction in serious or very serious incidents.
Case studies
1 /A new ‘paddlers’ guide to the Tideway is in the final stages of preparation after consultation during 2016.
2 /New pilots were trained during the year, with seven qualified as Class 4 pilots by the year end.
3 /First trials of the 3D Chirp, a surface-towed sub-bottom profiling system were carried out on the Thames by our hydrographic team on survey work for Tideway.
Business Model

ANNUAL REPORT & ACCOUNTS / 17
Our main responsibility is maintaining the Thames river channels and managing safe navigation along 95 miles of the tidal Thames, downstream of Teddington Lock. Using our Marine Safety Management System we regularly review the hazards and risks to safe navigation and put measures in place to address them. These include navigation lights and buoys, charting services, pilotage and Vessel Traffic Services (VTS) control centres at Woolwich and Gravesend, which oversee safe navigation over 400 square miles.
As the river gets busier, our robust approach to risk management, consistent with the Port Marine Safety Code, is delivering a year-on-year reduction in serious or very serious incidents. Safety performance improved in 2016, with ten serious or very serious incidents in the year, compared to 13 in 2015.
Demand for our pilotage service was unexpectedly and exceptionally high last year as we completed over 1,000 more acts than the previous year. Immediately the scale of this leap in demand became apparent, we introduced short-term measures to maximise the availability of our existing pilots and started recruiting trainees. Twelve trainee pilots joined us during 2016, a further 12 will be recruited in 2017 and we will monitor the situation closely so we can better ensure resources match demand.
Pilot development and training remained a focus through the year. We completed a successful trial with a group of 20 pilots using automatically updated electronic charts on tablet computers. In light of the trial results, we invested £130,000 in the tablets
and associated equipment for all our pilots. Further investment was made in adding full tug simulation capability to our ships’ bridge simulator to improve pilot training and vessel/berth design assessments.
Our hydrographic team continued its pioneering work. The team was among the first to trial 3D Chirp, a surface-towed sub-bottom profiling system capable of imaging the upper tens of metres of the sub-surface in three dimensions with remarkable resolution. The system was developed at the National Oceanography Centre, Southampton, in collaboration with GeoAcoustics Ltd, Great Yarmouth, and was used on survey work for Tideway.
This new technology was trialled from our new hydrographic survey boat, Maplin. Maplin entered service at the beginning of the year and has proved a flexible, reliable and safe platform for our survey teams.
As we start to adopt the Zero Harm approach of the new PLA strategy, a Red Tape Challenge – a thorough review of all our rules and regulations to make them as user-friendly as possible – is one of our first priorities.
Recreational use of the Thames is growing and an important focus for the Vision. During the year we launched our latest recreational users’ guide to the tidal river, an easy-to-read river guide providing practical tips for safe navigation, points of interest for leisure users as well as details of visitor moorings.
Thames Rowing Club was the winner of our annual Rowing Safety Award, now in its tenth year. The awards were introduced to encourage take up of the Rowing Code of Practice when it was introduced in 2006.
River navigation and safety
10Serious or very serious incidents / (2015: 13)
13,123 Pilotage acts / (2015: 11,745)

// 2016 was a landmark year for our work on river freight.
Case studies
1 /Contractors for the Northern Line extension increased the tunnelling spoil volumes they are moving by river to almost one million tonnes.
3 /The Thames hosted a commemoration of the 350th anniversary of the Great Fire of London in September, in an event drawing heavily on PLA harbour masters, licensing and marine services.
2 /The safeguarded Hurlingham Wharf was brought back into use by Tideway for its Thames Tunnel development project.
Business Model

ANNUAL REPORT & ACCOUNTS / 19
Our planning and technical expertise is a touchstone for the work we do to promote the use of the river. It is widely drawn on as we make sure wharves are maintained and reactivated for port use; provide expert advice to people looking to use the river, whether for trade, travel or leisure; and oversee major events on the Thames.
Promoting the movement of goods and materials on the Thames draws heavily on this expertise. Encouraging freight movement by water is an important focus as the river provides an uncongested, low carbon route for bulk materials. Switching deliveries from road to river improves safety, reduces emissions, cuts congestion and improves air quality for local communities.
2016 was a landmark year for our work on river freight. There are 50 wharves safeguarded for port use on the Thames and we have been working to bring three of them back into use. By year end, we had completed the acquisition of Peruvian Wharf in East London and work was commencing on Hurlingham Wharf in West London to bring it back into use for the Tideway project.
The successful acquisition of Peruvian Wharf was the culmination of a 17-year battle to secure the wharf for port use. We are currently investing around £2 million in building an access road and installing services, ready for tenant Brett Group to develop a building materials operation. We are re-commencing legal work to secure the third safeguarded site, Orchard Wharf also in East London.
Our planning, environment and harbour masters teams are heavily involved with the Thames Tideway Tunnel scheme. This has multiple, sizeable river construction sites along the tidal Thames. Our goals working with them are to ensure the prompt assessment of applications for approval and to encourage maximum use of the river. During the year the dedicated PLA project team approved and oversaw major developments at Chambers Wharf and Blackfriars Pier. The pace of work is ramping up with tunnelling due to start within the next year.
Development projects making use of the Thames during the year included the Northern Line extension and Battersea Power Station development. Northern Line extension contractors have increased the volume of materials to be moved away from site on the Thames to almost one million tonnes.
2016 was a year of consolidation for river travel and pier operations. We are engaging with Transport for London and operators on the expected next wave of pier developments as river services track the development of London to the east.
The year saw us reach agreement in principle with the Department for Environment, Food & Rural Affairs, the Department for Transport and the Marine Management Organisation on a streamlined approach to regulating development in the Thames. Work remains to be done to implement the agreement, which will see us providing local expert licensing for operators on the Thames, working within a common national framework.
Planning consultation and technical expertise
31Permanent river works licences / (2015: 23)
81Temporary river works licences
/ (2015: 70)
16Dredging licences
/ (2015: 19)
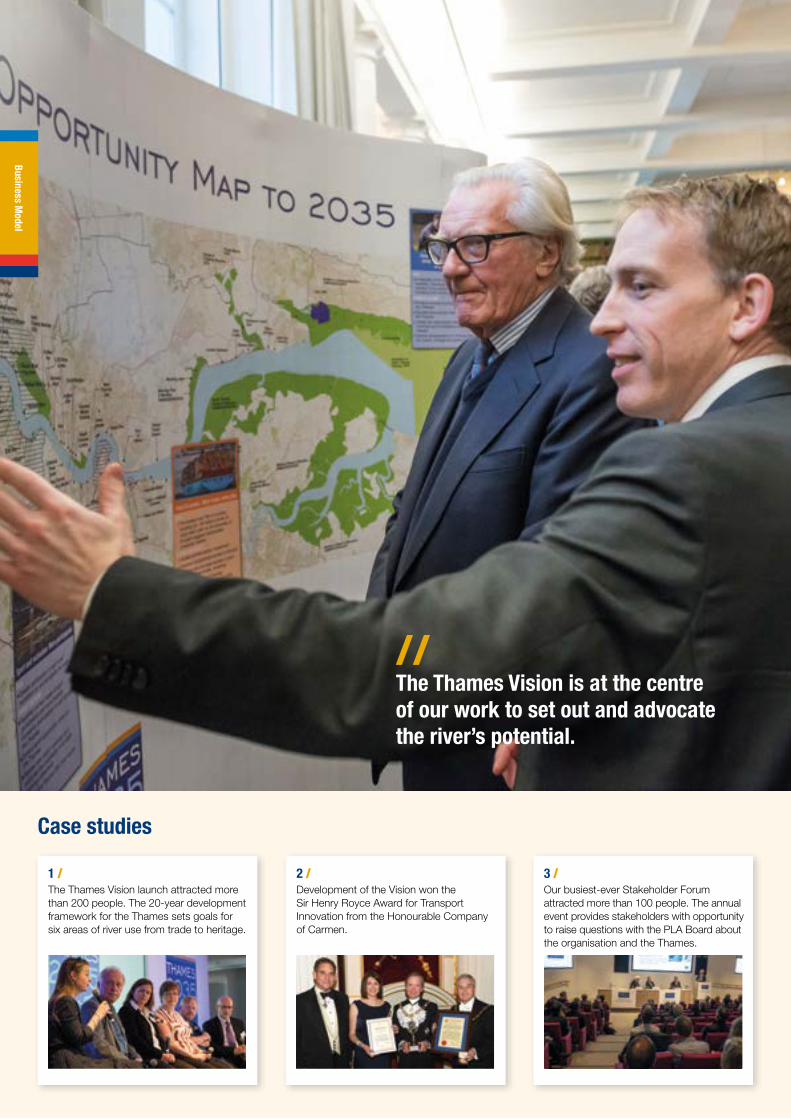
// The Thames Vision is at the centre of our work to set out and advocate the river’s potential.
Case studies
1 /The Thames Vision launch attracted more than 200 people. The 20-year development framework for the Thames sets goals for six areas of river use from trade to heritage.
3 /Our busiest-ever Stakeholder Forum attracted more than 100 people. The annual event provides stakeholders with opportunity to raise questions with the PLA Board about the organisation and the Thames.
2 /Development of the Vision won the Sir Henry Royce Award for Transport Innovation from the Honourable Company of Carmen.
Business Model
ANNUAL REPORT & ACCOUNTS / 21
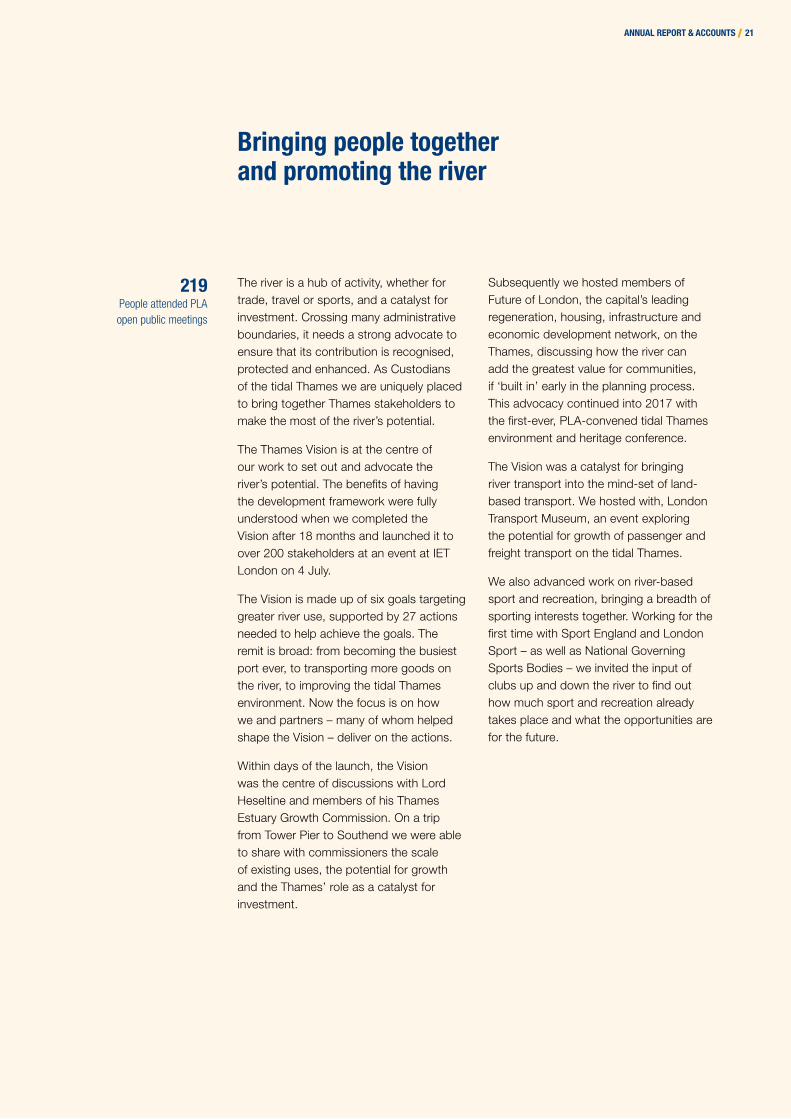
The river is a hub of activity, whether for trade, travel or sports, and a catalyst for investment. Crossing many administrative boundaries, it needs a strong advocate to ensure that its contribution is recognised, protected and enhanced. As Custodians of the tidal Thames we are uniquely placed to bring together Thames stakeholders to make the most of the river’s potential.
The Thames Vision is at the centre of our work to set out and advocate the river’s potential. The benefits of having the development framework were fully understood when we completed the Vision after 18 months and launched it to over 200 stakeholders at an event at IET London on 4 July.
The Vision is made up of six goals targeting greater river use, supported by 27 actions needed to help achieve the goals. The remit is broad: from becoming the busiest port ever, to transporting more goods on the river, to improving the tidal Thames environment. Now the focus is on how we and partners – many of whom helped shape the Vision – deliver on the actions.
Within days of the launch, the Vision was the centre of discussions with Lord Heseltine and members of his Thames Estuary Growth Commission. On a trip from Tower Pier to Southend we were able to share with commissioners the scale of existing uses, the potential for growth and the Thames’ role as a catalyst for investment.
Subsequently we hosted members of Future of London, the capital’s leading regeneration, housing, infrastructure and economic development network, on the Thames, discussing how the river can add the greatest value for communities, if ‘built in’ early in the planning process. This advocacy continued into 2017 with the first-ever, PLA-convened tidal Thames environment and heritage conference.
The Vision was a catalyst for bringing river transport into the mind-set of land-based transport. We hosted with, London Transport Museum, an event exploring the potential for growth of passenger and freight transport on the tidal Thames.
We also advanced work on river-based sport and recreation, bringing a breadth of sporting interests together. Working for the first time with Sport England and London Sport – as well as National Governing Sports Bodies – we invited the input of clubs up and down the river to find out how much sport and recreation already takes place and what the opportunities are for the future.
Bringing people together and promoting the river
219People attended PLA open public meetings
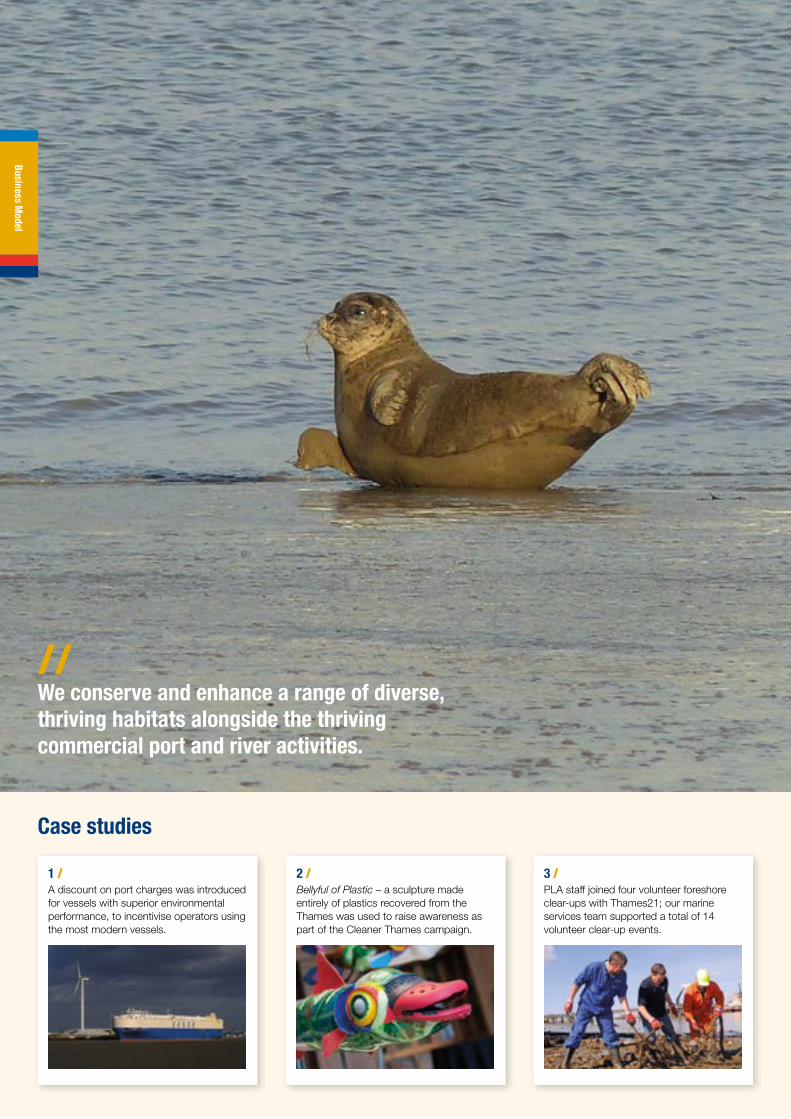
// We conserve and enhance a range of diverse, thriving habitats alongside the thriving commercial port and river activities.
Case studies
1 /A discount on port charges was introduced for vessels with superior environmental performance, to incentivise operators using the most modern vessels.
3 /PLA staff joined four volunteer foreshore clear-ups with Thames21; our marine services team supported a total of 14 volunteer clear-up events.
2 /Bellyful of Plastic – a sculpture made entirely of plastics recovered from the Thames was used to raise awareness as part of the Cleaner Thames campaign.
Business Model
ANNUAL REPORT & ACCOUNTS / 23
We conserve and enhance a range of diverse, thriving habitats for many different species of fish, birds, seals and other wildlife alongside the thriving commercial port and river activities. Within our area of jurisdiction there are nine Sites of Special Scientific Interest (SSSI), many with further European environmental designations as Special Protection Areas (SPA) or Special Areas of Conservation (SAC), or international designation as RAMSAR sites.
Air quality is becoming an increasingly important focus as congestion in urban areas increases. During the year we took major steps to address this. London became the first UK port to offer a ‘green’ discount on charges for ships using cleaner technology, as measured by their Environmental Shipping Index score. We also started work on an air quality strategy for the Thames with the Greater London Authority and Transport for London teams.
We work continuously to improve the environmental performance of our operation. In 2016 our carbon footprint was 2,101 CO2 equivalent tonnes, marginally down on 2015 (2,124 CO2 equivalent tonnes). Increased emissions from more pilotage operations were offset by the addition of the fuel efficient Maplin to the hydrographic fleet.
Innovations to further reduce carbon emissions included buying a hybrid petrol/electric 4x4 for our navigation systems team. We will also shortly purchase a low power, low emission vehicle for running supplies to and from the end of Denton Jetty, which will reduce fuel consumption and air emissions.
The River Thames provides a low emission route for the movement of materials and helps reduce congestion on London’s roads. During 2016 the equivalent of 150,000 lorry loads of material was moved by river as projects including the Northern Line extension made use of the Thames.
Over 90% of our estate enjoys environmentally-protected status. This includes Rainham Silt Lagoons. The lagoons have traditionally been used for the disposal of dredged materials, which created a valuable habitat for the dabbling duck, a teal. After a decade when no material was disposed there, the habitat has declined into a poor condition. We have now appointed Land & Water to operate the lagoons and are seeking dredged materials for disposal, which will help improve the site condition.
The Cleaner Thames campaign, launched in September 2015, made a significant impact raising awareness of the increasing problem of plastic bottles in the rubbish and driftwood that we clear from the river. During 2016 we presented to the All Parliamentary Maritime Group on the issue. A specially commissioned sculpture, Bellyful of Plastic, made from plastics recovered from the river was exhibited at many of our stakeholders’ offices, including those of campaign partners Thames21, Totally Thames and Tideway.
PLA staff joined volunteer Thames21 clean-ups at Wandsworth, Denton and Woolwich during the year. BBC Countryfile filmed at the Denton clean-up which, was in partnership with the City of London Corporation Port Health Authority. The Woolwich clean-up was with members of the Tideway team.
Environmental stewardship
10,315 hectares Riverbed estate
950 hectares Land estate
9Sites of special scientific
interest within PLA jurisdiction
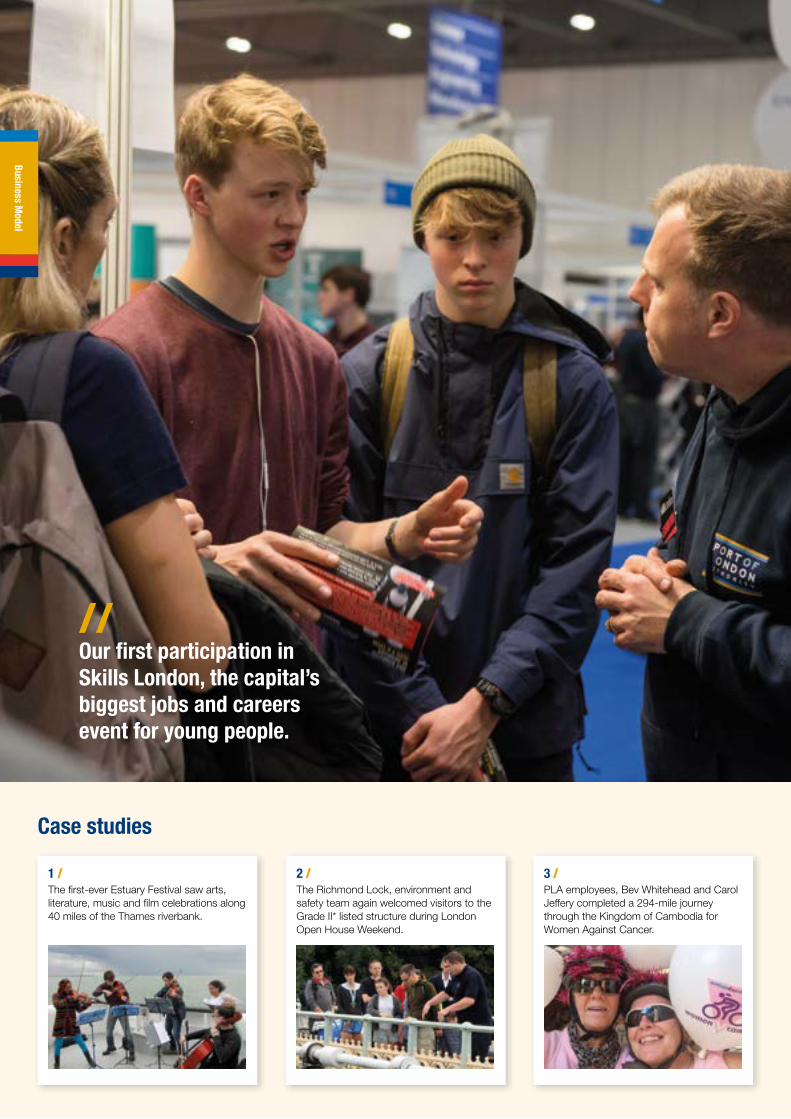
// Our first participation in Skills London, the capital’s biggest jobs and careers event for young people.
Case studies
1 /The first-ever Estuary Festival saw arts, literature, music and film celebrations along 40 miles of the Thames riverbank.
3 /PLA employees, Bev Whitehead and Carol Jeffery completed a 294-mile journey through the Kingdom of Cambodia for Women Against Cancer.
2 /The Richmond Lock, environment and safety team again welcomed visitors to the Grade II* listed structure during London Open House Weekend.
Business Model

ANNUAL REPORT & ACCOUNTS / 25
As a Trust Port, we look after the river for the benefit of many stakeholders and, ultimately, future generations. We are active members of the river and wider communities, generating benefits beyond those of our core operations.
Our operations support activity on the river that generates Gross Value Added (GVA) of more than £4 billion and in excess of 43,000 full-time jobs. An assessment of the amenity value of the Thames enjoyed by people identified a further GVA of £2.4 billion and the number of tourism jobs in riverside wards to be 99,000.
In addition to the broad GVA, our operations generate substantial direct stakeholder benefits, through payments including wages, taxes, supplies bought in and charitable donations. In 2016 we calculate this totalled £40.2 million (2015: £37.2 million). A full breakdown of our stakeholder benefit figures for 2016 can be found on page 32.
The river and local communities benefit from our work maintaining riverbanks, causeways and trees under our stewardship. During 2016 we completed a comprehensive, £30,000 refurbishment of the vessel maintenance grid at Strand on the Green. With new timber cross beams, this facility is now ready to serve the river community for a further 20 years. We also completed further riverbank repairs to revetment walls in Hammersmith and Kew. The programme of tree management to ensure navigational safety, the maintenance of the flood defence and the longevity of the trees themselves along the tow path between Beverley Brook and Kew also continued.
The year saw several ‘firsts’, including the inaugural Estuary Festival and our first participation in Skills London, the capital’s biggest jobs and careers event for young people. The biennial Estuary Festival was a huge success, attracting many thousands of people to events celebrating the Estuary region, along 40 miles of the north and south shorelines and on the river itself. We hosted a series of Port Control Centre visits as part of the Festival which were ‘sold out’ within hours of being offered. At Skills London we shared a stand with the Thames Skills Academy, promoting Thames training and careers to young people who visited the ExCel event.
Our charitable contributions are to organisations including the Museum of London Docklands, where our archive is stored, and Thames21. We are Thames21’s single biggest contributor, providing HR and financial administration support, alongside practical assistance with collection and disposal of rubbish from foreshore clear-ups. We also support the Tilbury Seafarers Centre and during the year made an additional donation towards a new TV as the refurbished centre opened to serve seafarers 24 hours a day.
Our support for employees’ fundraising includes match funding money they raise, up to £250 per person. This year’s contributions under the scheme topped £1,000. Employees benefiting included: Bev Whitehead and Carol Jeffery who completed a 294-mile journey through the Kingdom of Cambodia for Women Against Cancer; and Keith Cliffe and Russell Boland who undertook a 2,096-mile lap of Britain by motor bike, starting and ending at Gravesend, to raise money for Ellenor Lions Hospice and the Alzheimer’s Society.
PLA in the community
£40.2mEstimated stakeholder
benefit / (2015: £37m)
10Riverside code trailer events / (2015: 12)
3Public meetings / (2015: 4)
128People attending stakeholder
forum / (2015: 116)

// Our 360-strong team helps many thousands of people use the river safely every year.
Case studies
1 /The PLA men’s team won their class in the Cork Harbour Festival Ocean to City race; we took two Thames cutters to compete in the race for the first time.
3 /Jack Harrison is completing his electrical apprenticeship with the PLA; two more apprentices are being recruited in 2017.
2 /Work underway on new shore side accommodation for our harbour launch, pilot cutter and hydrographic vessel crews at Royal Terrace Pier.
Business Model

ANNUAL REPORT & ACCOUNTS / 27
Our 360-strong team helps many thousands of people use the river safely every year. In our work we draw on seafaring and marine expertise, complemented by that of skilled electrical and marine engineers, planners, civil engineers, hydrographers, environmental and many other experts.
In total, there were five Lost Time Accidents (LTAs) at the PLA in 2016, compared to none in 2015. This increase is concerning and we will be giving priority in 2017 to reinforcing our Golden Rules for safety for all PLA staff and contractors.
The tragic death of our pilot, Gordon Coates, following an accident boarding a cargo ship, was the first fatality for the PLA in over 20 years. His loss has been deeply felt across the organisation and river community. The accident has brought a renewed focus to our work to maintain a safe operation. The recommendations from our internal accident investigation are being taken forward as a priority.
There were a record 58 near miss reports, compared to 45 the previous year. We share the lessons learnt from near misses, which helps build a stronger safety culture and, ultimately, reduce the number of serious accidents.
In early 2016 we completed our second staff survey. Started as part of the people strategy, Our PLA, the survey helps us gauge staff engagement and identify areas for improvement.
Staff engagement remains high, with the overall score moving up to 81/100, from 79/100 in 2015. Scores for enjoying working at the PLA and being proud of what we do also remain high. We continue to score slightly less than average for cross-team working, and this is an area we are looking to improve.
The original staff survey identified issues around accommodation for staff who work afloat and a desire to see salary sacrifice offered for cycle to work schemes and child care vouchers. Work is now well underway with refurbishing staff accommodation on Royal Terrace Pier and Denton Wharf, with completion due shortly. Twenty-two people are now benefiting from the child care vouchers and cycle to work scheme after changes to the PLA Pension Scheme rules made this possible.
We continue to recruit and develop apprentices. Currently we have two in the third year of their training and we will be taking on two more during 2017, in line with the introduction of the Government’s Apprenticeship Levy.
Our support for our employees includes an active Sports and Social Club. In 2016 the Club, with additional PLA support, enabled two teams to compete in the Cork Harbour Festival Ocean to City race. The first-ever Thames cutters to take part, the men’s team won their class.
PLA People
360Employees / (2015: 343)
1Fatality / (2015: 0)
5Lost Time Accidents / (2015: 0)
58Near miss reports / (2015: 45)

River use statistics
Port trade / 50.4 million tonnes of cargo handled (+11%)Trade in the Port of London in 2016 reached the highest this decade, rising 11% to 50.4 million tonnes (2015: 45.4 million tonnes). Growth was highest in oil trades which rose by 22% from 10.9 million tonnes in 2015 to 13.3 million tonnes in 2016. Containers and trailers (unitised traffic) was up 7% to 18 million tonnes; aggregates and cement increased again from 10.7 million tonnes (16%) up to 12.4 million tonnes. Cereal volumes also increased by 15% to one million tonnes.
Passenger travel / 10.6 million passenger journeys (+2%)The number of passenger trips on the river in 2016 reached 10.6 million, a steady 300,000 increase on the figure for 2015 (10.3 million). The 2016 performance was underpinned by continued investment in pier extensions, new vessels and promotional campaigns.
13.3 million tonnesOil, crude & products
18.0 million tonnesContainers & trai lers
12.4 million tonnes Aggregates/cement
5.9 million tonnesOther cargoes
0.8 million tonnes Vehicles
50.4 million tonnesTotal trade
28 / PORT OF LONDON AUTHORITY
Business Model

ANNUAL REPORT & ACCOUNTS / 29
Inland waterways freight / 3.0 million tonnes of inland waterways freight (+11%)The tonnage of freight moved between terminals on the Thames increased to 3.0 million tonnes in 2016, from 2.7 million tonnes in 2015. A strong baseload of river use was sustained and bolstered with project related cargoes for Battersea and Tideway enabling works. Cory Riverside Energy invested in its fleet of barges and other operators added to their fleets as they geared up for the Thames Tideway Tunnel project. Tideway will prompt much higher cargo volumes, particularly through the tunnelling phase.
Sport and recreation / 99 major sporting eventsIn 2016, 99 major sporting events were held on the river. These included the University Boat Race, Head of the River races and the Great River Race. We are encouraging the growing interest in sport and recreation on the Thames as part of the Thames Vision. Our practical support included the production of an updated guide for recreational river users and development of a new paddlers code, due for publication in 2017.

PLA activity indicators / as at 31 December 2016 /
Environmental Stewardship 2016 2015 2014
Water use (litres)
Rainwater harvesting (Marine House) 107,000 70,000 118,000
PLA carbon footprint (CO2 equivalent tonnes) Carbon emissions 2101 2,124 2,054
PLA Energy Use (kilowatt hours)
Electricity consumed 1,506,492 1,343,138 1,623.067
Electricity generated 48,946 30,400 51,792
Gas 556,756 586,940 536,872
PLA waste generation and recycling (tonnes)
Pre-segregated recyclable 44 88 44
General waste 38 34 38
Hazardous waste 15 7 15
Miscellaneous waste 3 1 3
Driftwood recovered (tonnes)
Tonnage of material recovered from the river 175 211 176
Thames Oil Spill Clearance Association (TOSCA)
Call-outs 3 4 6
Reportable spills 10 8 2
Oil encountered (including sheen) 7 8 4
False alarms (nothing found) 0 2 2
Other call outs (safety of life, etc.,) 0 - -
Financial Highlights £m 2016 2015 2014
Revenue 56.9 49.9 50.7
Operating surplus 12.5 7.6 11.6
Net cash inflow from operating activities 7.6 6.8 10.5
River Navigation and Safety 2016 2015 2014
Navigational Safety
Navigational incidents 238 287 287
Pilotage Service
No. of pilotage acts 13,123 11,745 11,188
No. of pilotage delays 778 154 41
Vessels served without delay (%) 94.1 98.7 99.6
Total no. of pilotage exemption certificates 153 150 163
New pilotage exemption certificates issued 23 13 16
Hydrographic Surveys
Hydrographic surveys completed 274 314 313
Diving Operations
Diving operations 44 60 75
Sporting events
No. of sporting events held on river 99 89 83
30 / PORT OF LONDON AUTHORITY
Business Model

ANNUAL REPORT & ACCOUNTS / 31
PLA activity indicators / continued /
PLA People 2016 2015 2014
Personal Health & Safety Statistics
Lost Time Accidents 5* 0 1
Near miss reports 58 45 26
Workforce Diversity
% of workforce that are women 18.9 18.2 17.0
% of workforce who are women in senior positions 20.6 23.0 20.0
% total Black, Minority or Ethnic origin 4.7 4.3 10.0
Customer Feedback
Positive feedback 111 69 49
Complaints 19 8 2
* includes one fatality
Convening Stakeholders & River Advocacy 2016 2015 2014
Stakeholder Meetings
No. of public meetings held 3 4 3
No. of people attending public meetings 91 208 92
No. of stakeholder forums 1 1 1
No. of people attending stakeholder forums 128 81 116
PLA in the Community 2016 2015 2014
Riverside Code trailer
No. of events attended by Riverside Code Trailer/Gazebo 10 12 12
No. of children through Riverside Code Trailer 5,500 5,000 6,000
Planning and technical expertise 2016 2015 2014
River Works Licences
Permanent River Works 31 23 28
Temporary River Works 81 70 60
Dredging 16 19 15
Since 2007 we have periodically benchmarked stakeholder views of our performance. This graph shows the evolution of views since then; the next survey will be in 2017. (Assessment of accountability and modernity started from the 2010 survey.)
10
8
6
4
2
0
Navigational safety
Environmental sensitivity
Promoting economy and
enterprise
Helpful (responsiveness)
Accountable Modern
Sco
re o
ut o
f 10,
w
ith 1
0 b
eing
mos
t p
ositi
ve
Assessing our performance
/ 2007 / 2010 / 2013 / 2015
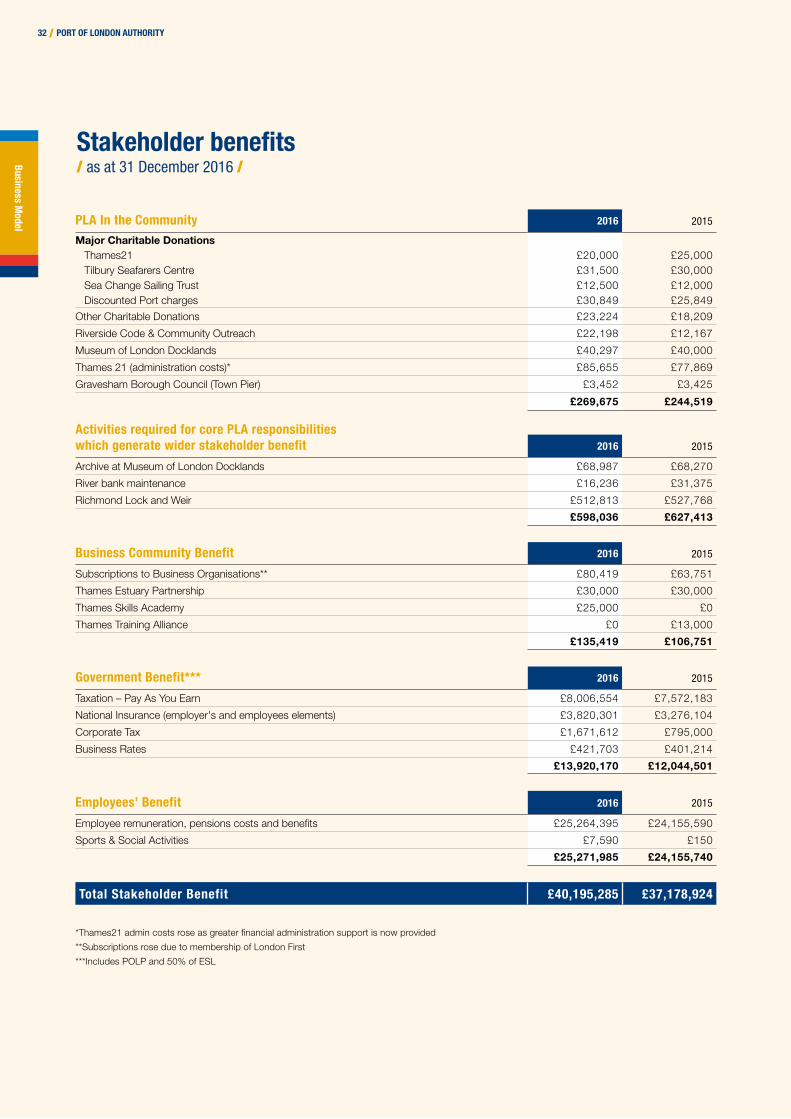
PLA In the Community 2016 2015
Major Charitable Donations Thames21 £20,000 £25,000 Tilbury Seafarers Centre £31,500 £30,000 Sea Change Sailing Trust £12,500 £12,000 Discounted Port charges £30,849 £25,849
Other Charitable Donations £23,224 £18,209
Riverside Code & Community Outreach £22,198 £12,167
Museum of London Docklands £40,297 £40,000
Thames 21 (administration costs)* £85,655 £77,869
Gravesham Borough Council (Town Pier) £3,452 £3,425
£269,675 £244,519
Activities required for core PLA responsibilities which generate wider stakeholder benefit 2016 2015
Archive at Museum of London Docklands £68,987 £68,270
River bank maintenance £16,236 £31,375
Richmond Lock and Weir £512,813 £527,768
£598,036 £627,413
Business Community Benefit 2016 2015
Subscriptions to Business Organisations** £80,419 £63,751
Thames Estuary Partnership £30,000 £30,000
Thames Skills Academy £25,000 £0
Thames Training Alliance £0 £13,000
£135,419 £106,751
Government Benefit*** 2016 2015
Taxation – Pay As You Earn £8,006,554 £7,572,183
National Insurance (employer's and employees elements) £3,820,301 £3,276,104
Corporate Tax £1,671,612 £795,000
Business Rates £421,703 £401,214
£13,920,170 £12,044,501
Employees’ Benefit 2016 2015
Employee remuneration, pensions costs and benefits £25,264,395 £24,155,590
Sports & Social Activities £7,590 £150
£25,271,985 £24,155,740
Total Stakeholder Benefit £40,195,285 £37,178,924
*Thames21 admin costs rose as greater financial administration support is now provided
**Subscriptions rose due to membership of London First
***Includes POLP and 50% of ESL
32 / PORT OF LONDON AUTHORITY
Stakeholder benefits / as at 31 December 2016 / Business M
odel

ANNUAL REPORT & ACCOUNTS / 33
Trade (million tonnes) 2016 2015
Imports 43.2 38.3
Exports 7.2 7.1
Total 50.4 45.4
Unitised traffic ‘000 twenty-foot equivalent units – (included in above tonnages) 2016 2015
Imports 1,281 1,120
Exports 1,256 1,097
Total 2,537 2,217
Number of chargeable vessel arrivals to the Port of London 2016 2015
Total 10,869 10,495
United Kingdom Port Traffic 2016* (million tonnes)
Port of London Trade by Type 2016
* Source: Department for Transport
26%
25%
3%1%
9%
OIL
AGGREGATES & CEMENT
OTHER
CONTAINERS/TRAILERS36%
METALSFOREST PRODUCTS
50.38
31.90
34.76
36.05
27.58
27.44
26.87
26.87
17.55
55.55
Port trade statistics
LONDON
LIVERPOOL
MILFORD HAVEN
SOUTHAMPTON
DOVER
FORTH
FELIXSTOWE
TEES AND HARTLEPOOL
BELFAST
GRIMSBY & IMMINGHAM

Port of London Total Traffic
Imports Exports Totalmillion tonnes million tonnes million tonnes
2016 2015 2016 2015 2016 2015
Oil, crude & products 13.3 10.9 0.0 0.0 13.3 10.9
Containers & trailers 13.4 12.2 4.6 4.6 18.0 16.8
Aggregates & cement 12.4 10.7 0.0 0.0 12.4 10.7
Other cargo 3.0 3.0 1.6 1.5 4.6 4.5
Forest products 0.7 1.0 0.0 0.0 0.7 1.0
Metals & ores 0.4 0.5 1.0 1.0 1.4 1.5
Total 43.2 38.3 7.2 7.1 50.4 45.4
The above figures exclude the transport of refuse and other internal port traffic
Unitised Traffic – (included in above tonnages)
Imports Exports Total000 20-foot equivalent units 000 20-foot equivalent units 000 20-foot equivalent units
2016 2015 2016 2015 2016 2015
Ro/Ro terminals (trailers & containers) 522 522 518 521 1,040 1,043
Container terminals 759 598 738 576 1,497 1,174
Unitised Total (TEUs) 1,281 1,120 1,256 1,097 2,537 2,217
34 / PORT OF LONDON AUTHORITY
Port trade statistics/ continued / Business M
odel

ANNUAL REPORT & ACCOUNTS / 35
Port of London Fuel Traffic*Million tonnes
Port of London Unitised TrafficThousand TEUs
Port of London Total TrafficMillion tonnes
Port of London Non-fuel TrafficMillion tonnes
1,699
2,027
2,007
1,672
1,897
20.2
20.5
21.7
19.1
19.9
19.1
15.4
1,899
1,932
31.7
32.2
31.3
26.3
28.2
28.3
29.7
30.2
13.0
1,953
32.6
51.92006
52.72007
53.02008
45.42009
43.72012
43.22013
44.52014
2015
48.12010
48.82011
2006
2007
2008
2009
2012
2013
2014
34.52015
2010
2011
2006
2007
2008
2009
2012
2013
2014
2010
2011
2006
2007
2008
2009
2012
2013
2014
2010
2011
11.9
2015 10.9
2,0972015 2,217
37.12016 2016 2,537
45.4
2016 2016 13.350.4
* Fuel Traffic has traditionally included oil, plus fuel for power generation and manufacturing operations such as cement making. Following the closure in 2013 of Tilbury Power Station, and the closure in previous years of Thamesside cement works, the figure is now solely oil related.
Port trade statistics/ continued /

Risk Management
The PLA oversees safe navigation along the tidal Thames, shares its marine, environmental, planning and other expertise to promote use of the river and safeguard its marine environment, whilst operating within an acceptable risk envelope. The Board recognises that there are inherent risks in running any business but to ensure that the PLA’s risk appetite is not exceeded, a risk management system is required which enables risks to be identified, understood and managed.
Risk management within the PLA is designed to be proportionate, comprehensive, objective and continuous. It is based on constant monitoring of known risks and knowledge of the Authority’s operating environment together with adherence to the Port Marine Safety Code to identify and manage any additional risks which may arise.
Risk analysis identifies the hazards and analyses risks to which the PLA is exposed, the basic causes of each risk, the impact and likelihood of its materialising and assesses how that risk should be managed. Any negative consequences of taking a risk are compared with the potential benefit to be derived from taking the risk and considered decisions made accordingly.
1. Risk Organisational Structure
The Board is responsible for overseeing the system of risk management and internal control. The Board monitors the effectiveness of the risk management process and receives reports from external, formal biennial reviews. Responsibility for implementing the process of risk management has been delegated to the Executive Committee (ExCo).
ExCo has established three risk committees to assist senior managers in the operation and implementation of the risk management process. Chairs of risk committees are the three executive Board members and include all members of ExCo. Other committee members are drawn from all areas of the PLA providing a broad and comprehensive input to each risk committee. All three risk committees work to the same terms of reference which include the following key functions:
IDENTIFY & ASSESS
RECORD & UPDATE
CONTROL & MITIGATE
MONITOR & REVIEW
CONSULT & COMMUNICATE
Risk management process
36 / PORT OF LONDON AUTHORITY
Business Model

ANNUAL REPORT & ACCOUNTS / 37
It is the responsibility of the Audit Committee to review the systems which are in place and to provide assurance to the Board that the process of risk management is operating effectively.
The following diagram illustrates the risk management structure.
OWNERSHIP
BOARD
PROCESS & CONTROL
AUDIT COMMITTEE
CORPORATE RISK REGISTER
EXCO
OPERATIONAL RISK COMMITTEE
INTERNAL RISK COMMITTEE
EXTERNAL RISK COMMITTEE
HAZARD MANAGEMENT TOOLS
INFO
RMAT
ION
FLOW
The risk registers of the three committees form the core of the risk management process. They are reviewed and updated at least four times each year. Each committee presents its register to ExCo and the Board annually, together with an annual review paper submitted by each committee Chair. The Head of Risk, who attends all committee meetings, also reports annually to the Board and Audit Committees outlining system changes, reporting on performance of the risk committees and reviewing policy, risk appetite and terms of reference documents. The distillation of the three separate risk registers into one corporate risk register is undertaken to accompany each risk report to both ExCo and the Board.
Risk training is undertaken annually for all risk committee members, facilitated by an external trainer delivering bespoke courses.
The PLA is confident that its procedures to ensure the necessary monitoring of risks and controls were sufficient throughout 2016.
Two external reviews have now been undertaken since the inception of this risk management structure.
The first was in 2013 with the remit to test the system design, ensure that it is sufficiently robust and make recommendations for improvement. The results of the review constituted a pass and also made a number of enhancement suggestions, all of which were ultimately adopted.
The focus of the second review in 2015 was the successful operation of the risk management system as designed. Once again the results of the review were positive with only minor improvements recommended. All of the enhancements were accepted and implemented during 2016.
The current three risk registers include five risks which are identified as our top ‘strategic risks’. The principal risks and uncertainties faced by the PLA in 2016, together with the potential effects, controls and mitigating factors are contained within the corporate risk register the essence of which is replicated on the following pages.
Risk Management/ continued /
PLA Risk Management Structure

2. Strategic Risks*
Risk, effect and progression Controls and mitigation Potential Net Impact
Action
1. Very serious marine casualties
Very serious marine casualties resulting in loss of life and requiring a multi agency response. Class V or high speed vessel e.g., another Marchioness. PLA has limited control over licensing Class V vessels.
Effective navigational Safety Management System (SMS), Risk assessment / hazard review, Vessel Traffic Services (VTS), Pilotage, Hydrography, Passenger Boat Code of Practice, Automatic Identification System (AIS), RNLI and London Coastguard, Special Signal Lights, New speed control byelaws.
Moderate Engaging with the MCA and DfT about Tunnel Boats, Class V mate competency requirements and vessel/operator SMS standards.
2. PLA Pension Fund (PLAPF) deficit
There is a substantial deficit on an actuarial basis in the PLAPF.
As at the balance sheet date the deficit stands in excess of £70m.
The PLA has negotiated a repair plan with the trustees, however, it is a long-term open-ended commitment over which the PLA has little control or any ability to set boundaries.
For the short and medium term, changes have been implemented to the benefits structure. PLA continues to adhere to the repair plan and supports the trustees in pursuit of appropriate investment strategies.
Moderate Monitor to ensure we have sufficient funds to sustain scheme affordability.
3. Fundamental shift in financial climate
A fundamental shift in the micro or macro financial environment in which the PLA operates. Included are anything from changes in trade including business cessation of a major customer or changes in the consumer market through to national or international economic factors such as Brexit.
Communication channels in place with a view to anticipating change in sufficient time to react accordingly by making a corresponding shift in the cost base.
Debt management protocols in place.
International exposure minimised as far as is possible.
Five-year business plans and an annual forecast and budget exercise are undertaken.
Moderate Continued vigilance with major operators, shipping lines and other stakeholders.
4. Closure of main navigational channel that results in closure or partial closure of the port, significantly disrupting or halting operations and trade.
Closure due to: collision, grounding, foundering, deliberate terrorist action, deliberate action by a pressure group blocks the river.
Effective navigational SMS, Risk assessment / hazard review, VTS, Pilotage, Hydrography.
Effective response to clearing passage if engaged to do so with experience highlighting Marine Services and the vessel Titan as key.
Participation in Thames Security Forum and resilience groups.
Low Establish protocols and procedures. Advance notice to other river users in order to reduce impact.
5. Pilots National Pension Fund (PNPF) deficit
PNPF, which is a multi-employer scheme, has a substantial deficit in which the PLA has a share in the region of 6.8%.
It is a long-term open-ended industry-wide liability over which individual employers have little influence.
An industry-wide repair plan is in place which, in common with many ports, is funded by way of a levy.
In common within the industry we impose a levy on pilotage acts and tripping charges at a level that meets the requirements of the repair plan.
Low Encourage and support the ongoing discussions regarding other viable solutions.
Key: Risk Increased Risk Unchanged Risk Decreased
* Like all businesses, legislative changes can affect PLA operations.
38 / PORT OF LONDON AUTHORITY
Risk Management/ continued / Business M
odel

ANNUAL REPORT & ACCOUNTS / 39
3. Going Concern basis of accounting
The Board has a reasonable expectation that the company has adequate resources for a period of at least 12 months from the date of approval of the financial statements and has therefore assessed that the going concern basis of accounting is appropriate in preparing the financial statements and that there are no material uncertainties to disclose.
This conclusion is based on a review of the resources available to the company, taking account of the company’s financial projections, together with available cash and committed borrowing facilities as well as consideration of the company’s capital adequacy and any material uncertainties. In reaching this conclusion, the Board has considered the magnitude of potential impacts resulting from uncertain future events or changes in conditions, the likelihood of their occurrence and the likely effectiveness of mitigating actions that the Board would consider undertaking.
4. Long term viability statement
The Board has assessed the viability of the company over a three-year period to December 2019, taking account of the company’s current position and potential impact of the principal risks documented in the corporate risk register. The three-year review period was selected for the following reasons:
I. Our normal business cycle is a budget, plus two plan years. To go beyond that in a business environment prone to change has in the past proved unrealistic. The recent rapid growth in vessel size is indicative of this.
II. With a balance sheet dominated by pension liabilities it makes sense for us to use a review window which fits in with the triennial valuation process of the PLA pension fund and PNPF.
Based on the results of this analysis, the Board has a reasonable expectation that the company will be able to continue in operation and meet its liabilities as they fall due over the period to December 2019.
In making this statement the Board has considered the resilience of the company, taking account of its current position, the principal risks facing the business in severe but reasonable scenarios and the effectiveness of any mitigating actions. This assessment has considered the potential impacts of these risks on the business model, future performance, solvency and liquidity over the period.
Risk Management/ continued /

Governance
ANNUAL REPORT & ACCOUNTS / 41
Our year
During 2016, the Board focused the organisation on the following priority areas: the Thames Vision, the direction of the Strategy and Business Plan, the PLA pension fund, green tariff and air quality, fleet review and procurement, Tideway, the Thames Skills Academy and risk management.
The board met seven times, with one of the meetings an ‘Away Day’ which provided opportunity for looking at items in greater depth.
The substantive items we addressed together at the Board included:
• Regular updates on navigational and personal Health & Safety, including the fatal accident to one of our pilots
• The development of the PLA’s Strategy and Business Plan
• Budget and performance review
• Business cases for investment exceeding £250,000
• Pilotage demand and future requirements
Our approach
The PLA Board is the duty holder on Health & Safety and the accountable body for navigational safety under the Port Marine Safety Code (PMSC). Safety is always top of the Board agenda at every meeting.
The Board’s role is to set the strategy of the PLA, ensure its long-term success and that we create stakeholder value. In particular we have a duty to manage the tidal river Thames in trust for future generations and to pass it on to our successors in an improved condition. As a provider of essential navigational safety services, we have to ensure that the organisation is efficient and provides customers with cost-effective services. With no shareholders, we are accountable to stakeholders and value their input in shaping the approach and decisions that we take.
We are committed to maintaining the highest standards of corporate governance and follow the principles of the Combined Code, where appropriate, for a statutory organisation.
Our governance is consistent with best practice and the requirements of the Department for Transport’s guidance, Modernising Trust Ports II. We comply with the requirements of the PMSC and review performance regularly with the guidance of the ‘Designated Person’, as set out in the PMSC.
As the Board, we regularly receive detailed financial and operational information to allow us to monitor the key areas of the business. Senior managers regularly brief us on various aspects of the PLA’s work.
Corporate governance report

42 / PORT OF LONDON AUTHORITY
Our governance structure
Seven scheduled board meetings (including an Away Day) were held during the year. In addition, the five committees of the Board overseeing specific elements of the business met and reported back, as needed. The committees are:
A Audit Committee
L Licensing Committee
N Nominations Committee
R Remuneration Committee
P Pensions Advisory Committee
A series of short reports on each of the committees starts on page 48.
Our people
The board comprises a non-executive chairman and up to three non-executive members appointed by the Secretary of State for Transport; and up to four non-executive members appointed by the Authority. Three executive members also sit on the Board.
During the latter part of 2016 two new non-executive members were appointed to further strengthen the Board’s skill set: Judith Armitt and Darren James. Bob Baker joined the Board as chief harbour master in May, taking over from David Philips who retired.
Our stakeholders
Open communication with our stakeholder community is at the heart of our operations. Consistent with Modernising Trust Ports guidance, we hold an Annual Stakeholders’ Forum, where stakeholders have an opportunity to meet, hear from and challenge the Executive and Board. A number of open Public Meetings and River Users Consultative Forums are held, giving stakeholders further opportunity for dialogue with the PLA.
Our approach to risk
We adopt a prudent approach to the management of risk in the business. This is consistent with our prime role, providing an essential safety service to our customers. We are also a commercial organisation and accept some level of risk as a normal consequence of doing business. More details of our approach to risk identification and management can be found on page 36.
Board effectiveness review
A full external review of our board was undertaken by Independent Audit Limited in 2015. In order to ensure the recommendations are being implemented, members completed an online questionnaire during 2016, using Independent Audit’s self-assessment tool, “Thinking Board”. The outcomes were discussed at the Away Day in October.
The main areas of Board focus were identified as:
• strategic development
• further work to strengthen the Board’s oversight of pension issues
• KPIs
We consider the intermediate review to have been rigorous and transparent. Independent Audit Limited has no other connections with the Authority.
We welcome any feedback you may have on this Annual Report – please email comments to [email protected]
Christopher Rodrigues CBE Chairman
20 March 2017
Corporate governance report / continued /
Governance

ANNUAL REPORT & ACCOUNTS / 43
Secretary to the Authority
Susan Grundy
ChairmanChristopher Rodrigues, CBE
Vice ChairmanTony Quinlan
Executive members
Robin Mortimer (Chief Executive)
Robert Baker (Chief Harbour Master)
Brian Chapman (Chief Financial Officer)
Non-executive members
Helen Deeble, CBE Annette Malm Justad
Ian Moncrieff, CBE
Alun Griffiths
Darren James Judith Armitt
Management Executive Committee
Chief Executive Robin Mortimer
Chief Financial OfficerBrian Chapman
Chief Harbour Master Robert Baker
Director Of Corporate Affairs Alistair Gale
Director Of Marine Operations Peter Steen
Director Of Planning and Environment James Trimmer
Director Of Human Resources Glenn Witham
Director Thames VisionKatherine Riggs
Board Members / as at 20 March 2017 /

44 / PORT OF LONDON AUTHORITY
Board Members’ Biographies / as at 20 March 2017 /
Tony Quinlan (51) / Vice Chairman
Qualifications: BSc (Hons.) Chemistry; Chartered Accountant
Appointment to the board: March 2012
Committee membership: Audit (chairman), Pensions Advisory
Tony joined the PLA Board as a non-executive director in March 2012. He is vice -hairman and Audit Committee chair.
A chartered accountant, Tony qualified with Coopers & Lybrand before joining Marks & Spencer in 1992, where he held a number of senior finance positions. He was the group’s director of investor relations from 2000 before taking up the position of director of finance, the deputy to the group finance director, in 2005. In 2008, Tony joined Drax Group plc, the UK listed electricity business, as group finance director, also responsible for communications. Tony left Drax in 2015 and joined Laird plc, the UK listed technology group, as chief financial officer. Tony was appointed chief executive officer of Laird plc in September 2016, a position he currently holds.
Christopher Rodrigues CBE (67) / Chairman
Qualifications: MA Cambridge; MBA Harvard, D Univ Surrey
Appointment to the board: January 2016
Committee membership: : Nominations, Pensions, Advisory, Remuneration (ex-officio), Audit (ex-officio), Licensing (ex officio), Pensions Advisory
Christopher Rodrigues was appointed chairman of the PLA with effect from 1 January 2016. Christopher has strong Thames links. He was a member of two winning Cambridge Boat Race crews and subsequently chairman of the Leander Club; he is a craft owning freeman of the Waterman’s Company. Following a career in the financial and tourism sectors, Christopher is currently chairman of Visit Britain, Openwork LLP and the British Bobsleigh & Skeleton Association.
Helen Deeble, CBE (55) / Non-executive director
Qualifications: Chartered Accountant (ICAEW)
Appointment to the board: September 2014
Committee membership: Audit, Pensions Advisory (chairman)
Other roles: Chairman/Trustee of three PLA pension schemes (PLAPF, PLAWWOPF, PLARBS)
Helen joined the PLA as a non-executive director in September 2014.
A chartered accountant with a background in retail and logistics, Helen has more than 20 years’ experience in shipping. She is chief executive of the P&O Ferries Division, a pan European ferry and logistics business.
Helen is a board member of the UK Chamber of Shipping, The Standard P&I Club and of Carnival Corporation and plc, the world’s largest cruise line. She was vice-president and president of the UK Chamber of Shipping from 2011 to 2013.
Annette Malm Justad (58) / Non-executive director
Qualifications: Masters degree in Technology Management from Norwegian University of Science and Technology (NTNU)/MIT; MSc in Chemical Engineering from NTNU.
Appointment to the board: June 2014
Committee membership: Remuneration (chairman), Audit, Pensions Advisory
Annette Malm Justad joined the PLA as a non-executive director on 1 June 2014. Annette has over 30 years’ experience in industry and shipping, working for companies including Yara International ASA, Norgas Carriers/IM Skaugen ASA, and Norsk Hydro ASA. From 2006 to 2010, she was CEO of Eitzen Maritime Services ASA,an international ship supply company.
Annette is currently chairman of Norwegian listed American Shipping Company, SeaBird Exploration and Store Norske Kulkompani. She is also a member of the boards of Awilco LNG and Odfjell.
Governance

ANNUAL REPORT & ACCOUNTS / 45
Board Members’ Biographies / as at 20 March 2017 / continued
Ian Moncrieff, CBE DL (62) / Non-executive director
Qualifications: BA (Hons) Geography/Geology, IoD Certificate in Company Direction
Appointment to the board: January 2015
Committee membership: Licensing
Ian joined the PLA board as non-executive director and Marine Member on 1 January 2015. He was formerly chief executive of the UK Hydrographic Office (UKHO) from 2011 - 2015, having been with the UKHO in a variety of roles, including UK National Hydrographer as a Rear Admiral since 2006.
He served with the Royal Navy for 35 years, accumulating over 20 years’ seagoing experience in 11 warships. His senior roles included Commander British Forces South Atlantic and he commanded the ice-breaker HMS Endurance and destroyer HMS Nottingham and was executive officer of the aircraft carrier, HMS Invincible. Ian is a Deputy Lieutenant for the county of Somerset, a trustee of the Falklands Conservation charity and a Governor of Taunton School. He is also Younger Brother of Trinity House and member of the Honourable Company of Master Mariners.
Alun Griffiths (62) / Non-executive director
Qualifications: BSc (Hons) Applied Economics
Appointment to the board: September 2014
Committee membership: Licensing (chairman), Remuneration
Alun Griffiths joined the PLA on 1 September 2014. He was formerly Group HR director and a main board member at WS Atkins plc, Europe’s largest engineering and design consultancy. An economics graduate, Alun is a fellow of the Chartered Institute of Personnel and Development. He has worked in a number of business management and corporate roles, including HR, strategy and marketing.
Alun is a non-executive director of Severfield plc, The Ramboll Group A/S, Anchor Trust and The McLean Group. He is also a member of the Ministry of Defence National Employer Advisory Board.
He has worked extensively across the science and engineering sectors to improve gender diversity at all levels up to and including the boardroom.
Darren James (49) / Non-executive director
Qualifications: B Eng(Hons) Civil Engineering; C Eng Chartered Engineer, Member of the Engineering Council, Fellow of the Institution of Civil Engineers, Fellow of the Chartered Institution of Highways and Transportation, Fellow of the Institute of Directors
Appointment to the board: December 2016
Committee membership: Licensing
Darren was appointed a non-executive member of the Port of London Authority board on 1 December 2016.
A Chartered Civil Engineer, Darren graduated with honours from the University of Surrey in 1990. He has spent his career at Costain coming through the graduate programme as a civil engineer, project management roles on some of the UK’s largest infrastructure programmes to become managing director of their Infrastructure Division. Darren is a member of the executive Board of Costain Group PLC and responsible for their activities across the highways, rail and nuclear sectors. He sits on the Prince’s Trust Leadership Group championing the entry of young people into the industry.
Judith Armitt (63) / Non-executive director
Qualifications: MA Philosophy, Politics and Economics, Chartered Institute of Public Finance and Accountancy (CCAB qualified)
Appointment to the board: December 2016
Committee membership: Pensions Advisory
Judith was appointed a non-executive member of the Port of London Authority board on 1 December 2016.
She retired as chief executive of Local Partnerships LLP in April 2016. Prior to this she worked in the Cabinet Office, was managing director of Ashford’s Future Company, Thames Gateway chief executive and chief executive of Medway Council.
Judith is chair, trustee and director of the Rochester Diocesan Board of Finance; a trustee of the Centre for Engineering and Manufacturing Excellence (CEME), and of Design: South East. She is a non-executive director of the Housing and Finance Institute and a member of the Governing Body of Canterbury Christchurch University.

46 / PORT OF LONDON AUTHORITY
Board Members’ Biographies / as at 20 March 2017 / continued
Brian Chapman (64) / Chief financial officer
Qualifications: Graduate in Economics and Mathematics; Fellow of Chartered Institute of Management Accountants
Appointment to the board: September 2001
Brian Chapman, chief financial officer, was appointed an executive member of the PLA in September 2001 prior to which he spent many years in the food industry. His post prior to joining the PLA was as finance director of United Milk plc, and previously he was regional finance director for the consumer products arm of the New Zealand Dairy Board. As chief financial officer he is responsible for the accounting function, pensions, information services, insurance and property. He is a director of Estuary Services Ltd, Port of London Properties Limited and a trustee of a number of pension funds.
Robin Mortimer (44) / Chief executive
Qualifications: BA(Hons), Modern History, Oxon; MSc, Development Studies, School of Oriental and African Studies
Appointment to the board: March 2014
Committee membership: Licensing, Pensions Advisory
Prior to joining the PLA, Robin had 20 years’ experience in the UK Government civil service working on transport, environment, infrastructure and overseas development. He was Private Secretary to the Deputy Prime Minister from 1997-1998 and later to the Secretary of State for Transport from 2001-2003. In 2007, he became a Director in Defra where he led the Government’s Adapting to Climate Change programme and oversaw the creation of the Canal & River Trust and directed policy on farming and the environment.
Robin is a Member of the CBI’s London Council and, since 2012, a trustee of the United Nations Environment Programme World Conservation Monitoring Centre, a Cambridge-based charity. He is a trustee of Thames21 and a director of Estuary Services Ltd.
Robert Baker (58) / Chief harbour master
Qualifications: MBA and Master Mariner
Appointment to the board: May 2016
Committee membership: Licensing
Bob Baker became PLA chief harbour master in May 2016. He is responsible for all operational and navigational matters including vessel traffic management, pilotage, harbour services and port security. Bob joined the PLA from Forth Ports, where he was chief harbour master and a director of Forth Estuary Towage from 2001. Bob’s seagoing career lasted from 1975 to 1991, before he came ashore to work at the Port of Tilbury, latterly as general manager, conventional operations and harbour master. He holds an MBA from Henley Management College.
Governance
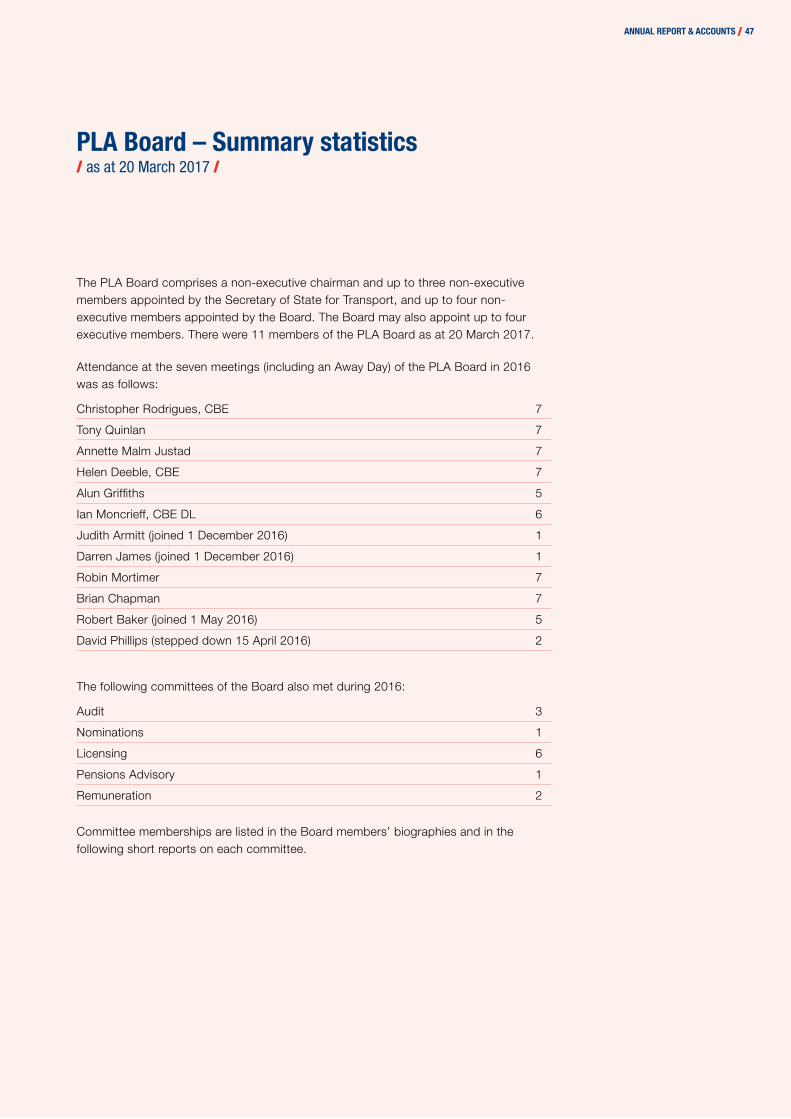
ANNUAL REPORT & ACCOUNTS / 47
PLA Board – Summary statistics / as at 20 March 2017 /
The PLA Board comprises a non-executive chairman and up to three non-executive members appointed by the Secretary of State for Transport, and up to four non-executive members appointed by the Board. The Board may also appoint up to four executive members. There were 11 members of the PLA Board as at 20 March 2017.
Attendance at the seven meetings (including an Away Day) of the PLA Board in 2016 was as follows:
Christopher Rodrigues, CBE 7
Tony Quinlan 7
Annette Malm Justad 7
Helen Deeble, CBE 7
Alun Griffiths 5
Ian Moncrieff, CBE DL 6
Judith Armitt (joined 1 December 2016) 1
Darren James (joined 1 December 2016) 1
Robin Mortimer 7
Brian Chapman 7
Robert Baker (joined 1 May 2016) 5
David Phillips (stepped down 15 April 2016) 2
The following committees of the Board also met during 2016:
Audit 3
Nominations 1
Licensing 6
Pensions Advisory 1
Remuneration 2
Committee memberships are listed in the Board members’ biographies and in the following short reports on each committee.

48 / PORT OF LONDON AUTHORITY
Committees / as at 20 March 2017 /
A Audit Committee Met 3 t imes
Current Membership: Anthony Quinlan (chairman); Annette Malm Justad;
Helen Deeble; Christopher Rodrigues (ex-officio)
Commentary The audit committee’s role is to:
• advise on the appointment/re-appointment/removal of auditors, their terms of engagement and their level of remuneration
• review the scope and the results of the annual audit and report to the Board on the effectiveness of the audit process
• review the annual financial statements, including reporting to the Board on the significant issues considered by the committee in relation to the financial statements and how these were addressed
• review the effectiveness of the risk management system
The principal items discussed during the year were around:
• insurance claims
• the viability statement
• financial reporting
• risk management
• audit results
• audit planning
• effectiveness of the external audit function
• compliance and internal audit
• insurance claims
• whistleblowing
• tax
• human slavery
The PLA’s first Human Slavery statement pursuant to Section 54, Part 6 of the Modern Slavery Act 2015 can be found on the PLA website: www.pla.co.uk
L Licensing Committee Met 6 t imes
Current Membership: Alun Griffiths (chairman); Darren James;
Robin Mortimer; Robert Baker; Ian Moncrieff; Christopher Rodrigues (ex-officio)
Commentary The licensing committee’s role is to:
• approve the processes for administration of the licensing of works
• determine any application considered contentious or significant
• determine any proposal to suspend or revoke a licence, take enforcement action or impose a condition which is not agreed by the licensee
• approve the use of powers under the Town & Country Planning (General Permitted Development) Order
The principal items discussed during the year included:
• Thames Tideway Tunnel
• various licence applications
• alleged breeches of licence conditions and subsequent action
Governance

ANNUAL REPORT & ACCOUNTS / 49
Committees / as at 20 March 2017 / continued
N Nominations Committee Met 1 t ime
Current Membership: Christopher Rodrigues (chairman); Tony Quinlan;
non-executive member/s (as required)
Commentary The nominations committee’s role is to:
• lead the process for Board appointments and make recommendations to the Board
The principal items discussed during the year were around:
• recruitment of two new non-executive board members
A formal, rigorous and transparent process is followed during the selection and appointment of new Board members, all of whom receive a comprehensive induction, tailored to meet their individual needs.
The recent recruitment campaign was managed by executive search firm, Odgers Berndtson with involvement from the Department for Transport.
R Remuneration Committee Met 2 t imes
Current Membership: Annette Malm Justad (chairman); Alun Griffiths,
Christopher Rodrigues (ex-officio)
Commentary The remuneration committee’s role is to:
• consider and recommend to the Board the remuneration terms for the organisation, including executive directors
• succession planning of directors and the senior management team
The principal items discussed during the year were around:
• pay prospects
• gender pay gap
• succession planning
P Pensions Advisory Committee Met 1 t ime
Current Membership: Christopher Rodrigues (chairman); Tony Quinlan,
Annette Malm Justad, Robin Mortimer
Commentary The pensions advisory committee’s role is to:
• to formalise the board response to pension fund decisions
• to monitor pension developments and policy in the wider employment market
• negotiate any payment plans with pension scheme trustees
The principal items discussed during the committee’s first meeting were:
• the scale of pension issues
• actuarial valuations
• a legal overview of pension fund rules

50 / PORT OF LONDON AUTHORITY
Financial statements
50 / PORT OF LONDON AUTHORITY
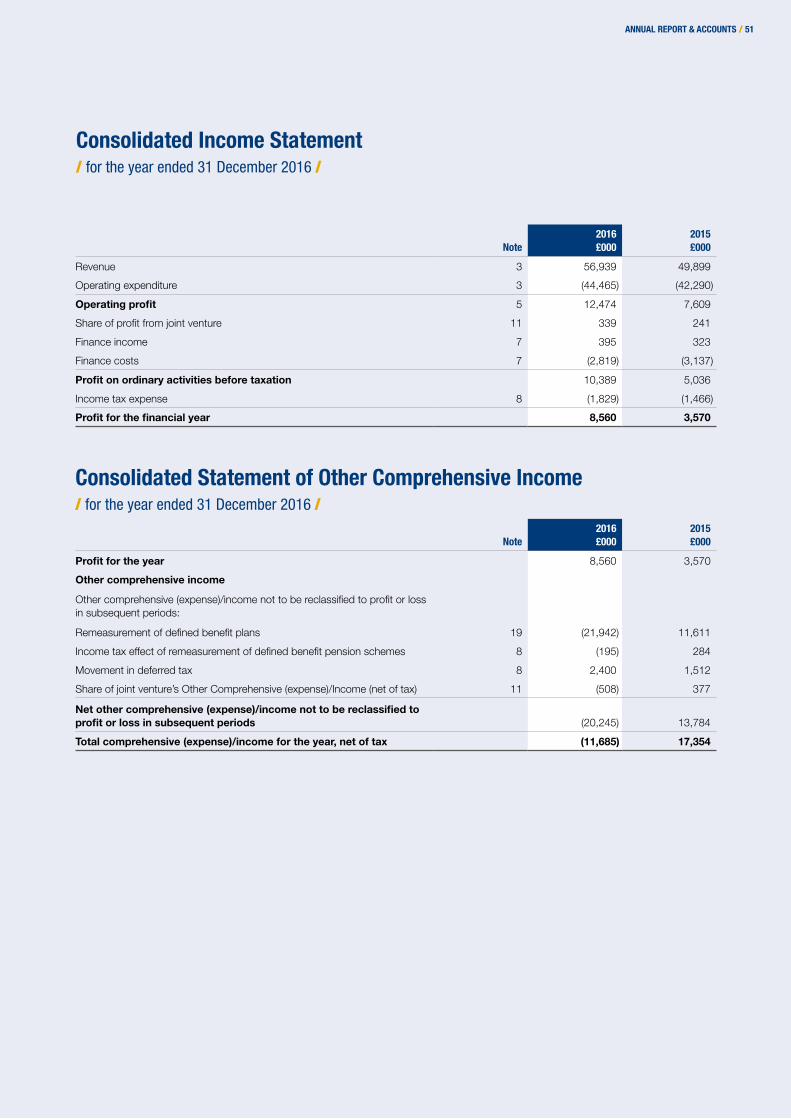
ANNUAL REPORT & ACCOUNTS / 51 ANNUAL REPORT & ACCOUNTS / 51
Consolidated Income Statement / for the year ended 31 December 2016 /
Note2016£000
2015£000
Revenue 3 56,939 49,899
Operating expenditure 3 (44,465) (42,290)
Operating profit 5 12,474 7,609
Share of profit from joint venture 11 339 241
Finance income 7 395 323
Finance costs 7 (2,819) (3,137)
Profit on ordinary activities before taxation 10,389 5,036
Income tax expense 8 (1,829) (1,466)
Profit for the financial year 8,560 3,570
Consolidated Statement of Other Comprehensive Income/ for the year ended 31 December 2016 /
Note2016£000
2015£000
Profit for the year 8,560 3,570
Other comprehensive income
Other comprehensive (expense)/income not to be reclassified to profit or loss in subsequent periods:
Remeasurement of defined benefit plans 19 (21,942) 11,611
Income tax effect of remeasurement of defined benefit pension schemes 8 (195) 284
Movement in deferred tax 8 2,400 1,512
Share of joint venture’s Other Comprehensive (expense)/Income (net of tax) 11 (508) 377
Net other comprehensive (expense)/income not to be reclassified to profit or loss in subsequent periods (20,245) 13,784
Total comprehensive (expense)/income for the year, net of tax (11,685) 17,354
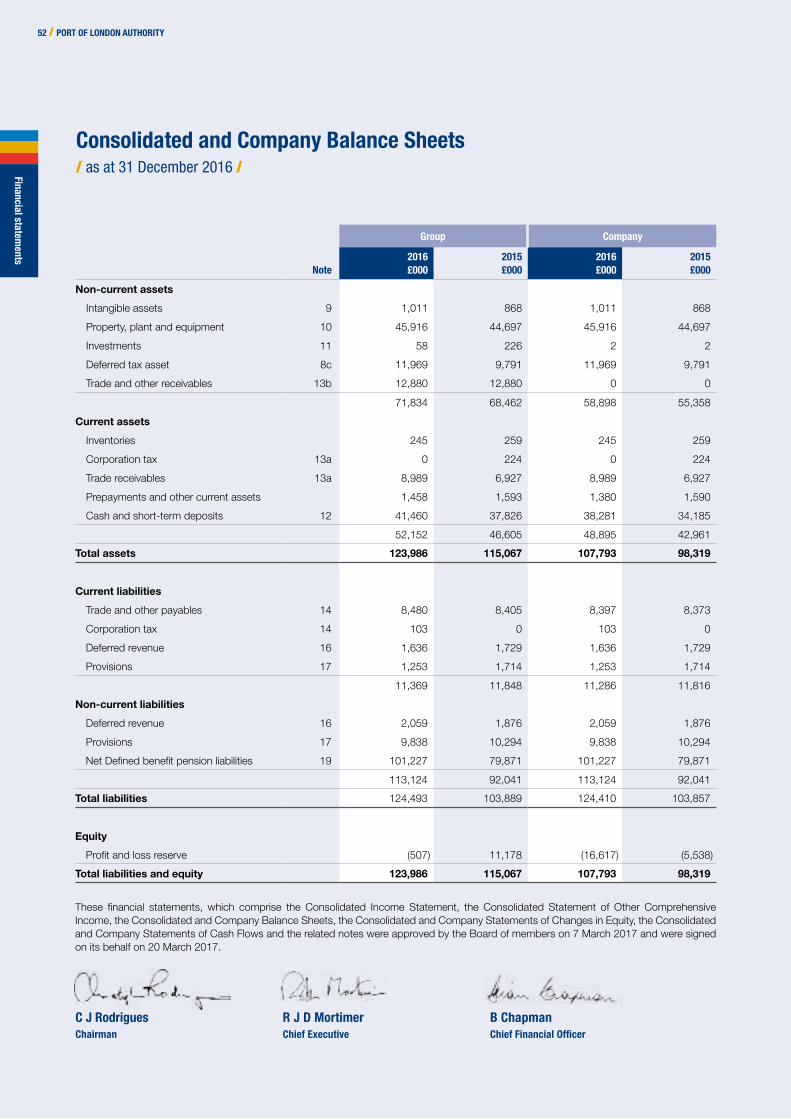
52 / PORT OF LONDON AUTHORITY52 / PORT OF LONDON AUTHORITY
Consolidated and Company Balance Sheets/ as at 31 December 2016 /
Group Company
Note2016£000
2015£000
2016£000
2015£000
Non-current assets
Intangible assets 9 1,011 868 1,011 868
Property, plant and equipment 10 45,916 44,697 45,916 44,697
Investments 11 58 226 2 2
Deferred tax asset 8c 11,969 9,791 11,969 9,791
Trade and other receivables 13b 12,880 12,880 0 0
71,834 68,462 58,898 55,358
Current assets
Inventories 245 259 245 259
Corporation tax 13a 0 224 0 224
Trade receivables 13a 8,989 6,927 8,989 6,927
Prepayments and other current assets 1,458 1,593 1,380 1,590
Cash and short-term deposits 12 41,460 37,826 38,281 34,185
52,152 46,605 48,895 42,961
Total assets 123,986 115,067 107,793 98,319
Current liabilities
Trade and other payables 14 8,480 8,405 8,397 8,373
Corporation tax 14 103 0 103 0
Deferred revenue 16 1,636 1,729 1,636 1,729
Provisions 17 1,253 1,714 1,253 1,714
11,369 11,848 11,286 11,816
Non-current liabilities
Deferred revenue 16 2,059 1,876 2,059 1,876
Provisions 17 9,838 10,294 9,838 10,294
Net Defined benefit pension liabilities 19 101,227 79,871 101,227 79,871
113,124 92,041 113,124 92,041
Total liabilities 124,493 103,889 124,410 103,857
Equity
Profit and loss reserve (507) 11,178 (16,617) (5,538)
Total liabilities and equity 123,986 115,067 107,793 98,319
These financial statements, which comprise the Consolidated Income Statement, the Consolidated Statement of Other Comprehensive Income, the Consolidated and Company Balance Sheets, the Consolidated and Company Statements of Changes in Equity, the Consolidated and Company Statements of Cash Flows and the related notes were approved by the Board of members on 7 March 2017 and were signed on its behalf on 20 March 2017.
C J Rodrigues R J D Mortimer B Chapman Chairman Chief Executive Chief Financial Officer
Financial statements

ANNUAL REPORT & ACCOUNTS / 53 ANNUAL REPORT & ACCOUNTS / 53
Consolidated and Company Statements of Changes in Equity / for the year ended 31 December 2016 /
Group
Profit andloss reserve
£000
At 1 January 2015 (6,176)
Total comprehensive income/(expense) 17,354
At 31 December 2015 11,178
Total comprehensive income/(expense) (11,685)
At 31 December 2016 (507)
Company
Profit andloss reserve
£000
At 1 January 2015 (22,354)
Total comprehensive income/(expense) 16,816
At 31 December 2015 (5,538)
Total comprehensive income/(expense) (11,079)
At 31 December 2016 (16,617)
Profit and loss reserves represent the cumulative total comprehensive income attributable to the Group and Company to the end of the year.
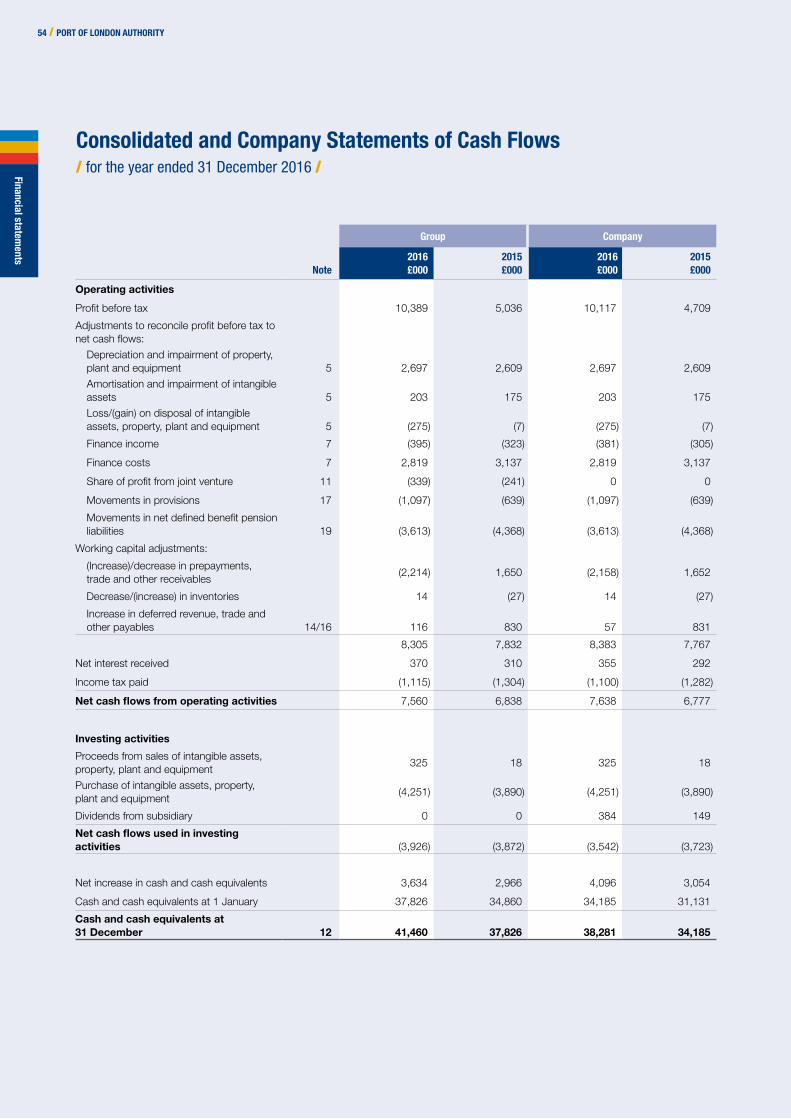
54 / PORT OF LONDON AUTHORITY
54 / PORT OF LONDON AUTHORITY
Consolidated and Company Statements of Cash Flows / for the year ended 31 December 2016 /
Group Company
Note2016£000
2015£000
2016£000
2015£000
Operating activities
Profit before tax 10,389 5,036 10,117 4,709
Adjustments to reconcile profit before tax to net cash flows:
Depreciation and impairment of property, plant and equipment 5 2,697 2,609 2,697 2,609
Amortisation and impairment of intangible assets 5 203 175 203 175
Loss/(gain) on disposal of intangible assets, property, plant and equipment 5 (275) (7) (275) (7)
Finance income 7 (395) (323) (381) (305)
Finance costs 7 2,819 3,137 2,819 3,137
Share of profit from joint venture 11 (339) (241) 0 0
Movements in provisions 17 (1,097) (639) (1,097) (639)
Movements in net defined benefit pension liabilities 19 (3,613) (4,368) (3,613) (4,368)
Working capital adjustments:
(Increase)/decrease in prepayments, trade and other receivables
(2,214) 1,650 (2,158) 1,652
Decrease/(increase) in inventories 14 (27) 14 (27)
Increase in deferred revenue, trade and other payables 14/16 116 830 57 831
8,305 7,832 8,383 7,767
Net interest received 370 310 355 292
Income tax paid (1,115) (1,304) (1,100) (1,282)
Net cash flows from operating activities 7,560 6,838 7,638 6,777
Investing activities
Proceeds from sales of intangible assets, property, plant and equipment
325 18 325 18
Purchase of intangible assets, property, plant and equipment
(4,251) (3,890) (4,251) (3,890)
Dividends from subsidiary 0 0 384 149
Net cash flows used in investing activities (3,926) (3,872) (3,542) (3,723)
Net increase in cash and cash equivalents 3,634 2,966 4,096 3,054
Cash and cash equivalents at 1 January 37,826 34,860 34,185 31,131
Cash and cash equivalents at 31 December 12 41,460 37,826 38,281 34,185
Financial statements

ANNUAL REPORT & ACCOUNTS / 55
ANNUAL REPORT & ACCOUNTS / 55
Notes to the consolidated and company financial statements / for the year ended 31 December 2016 /
1. Accounting policies
Corporate informationThe consolidated financial statements of the Port of London Authority (PLA), its subsidiary and its joint venture (collectively, the Group) for the year ended 31 December 2016 were authorised for issue in accordance with a resolution of the Board of members on 7 March 2017. PLA (the Company and the parent) is constituted under the Port of London Act 1968 as subsequently amended by other Acts and Harbour Revision Orders. It is controlled by a Board of members domiciled in the United Kingdom including a Chairman who is appointed by the Secretary of State for Transport. The main trading address of the PLA is located at London River House, Royal Pier Road, Gravesend in Kent.
The Group was established for the purpose of administering, preserving and improving the Port of London as set forth in the Port of London Act 1968 as amended. Information on the Group’s structure is provided below. Information on other related party relationships of the Group and Company is provided in Note 21.
The consolidated financial statements of the Group include:
% equity interest
Name Principal activitiesCountry of incorporation 2016 2015
Port of London Authority (PLA) – Providing Pilotage services; United Kingdom
– Operating a Vessel Traffic Service;
– River works licenses, Rentals;
– Moorings;
– Hydrographic surveying;
– Dredging; and
– Providing aids to navigation.
Port of London Properties Limited (POLP) – Management of property interests. United Kingdom 100 100
The Group holds a 50% interest in Estuary Services Limited (ESL) (2015 50%) and accounts for this interest in accordance with the equity method as further described below and in Note 11.
Basis of PreparationThe Group financial statements have been prepared in accordance with International Financial Reporting Standards as adopted by the EU (IFRS) as issued by the International Accounting Standards Board (IASB).
The Group and Company financial statements have been prepared on an historical cost basis. The Group and Company financial statements are presented in Pounds Sterling and all values are rounded to the nearest thousand (£000), except where otherwise indicated.
The Group and Company financial statements provide comparative information in respect of the previous period. In addition, the Group and Company present additional consolidated and Company Balance Sheets at the beginning of the earliest period presented when there is a retrospective application of an accounting policy. The company has taken advantage of Section 408 of the Companies Act 2006 exemption from presenting its own Income Statement and Statement of Other Comprehensive Income. The Company profit for the year amounted to £8,658,000 (2015: £3,408,000).
Basis of consolidationThe Group financial statements comprise the financial statements of the Company, its wholly owned subsidiary and its joint venture interest as at 31 December 2016.
Summary of significant accounting policiesThese financial statements have been prepared on the going concern basis. A summary of the more important accounting policies, which have been applied consistently unless indicated to the contrary, is set out below.
(a) Investment in joint venture A joint venture is a type of joint arrangement whereby the parties that have joint control of the arrangement have rights to the net assets
of the joint venture. Joint control is the contractually agreed sharing of control of an arrangement, which exists only when decisions about the relevant activities require unanimous consent of the parties sharing control. The Group’s investment in its joint venture is accounted for using the equity method.
Under the equity method, the investment in a joint venture is initially recognised at cost. The carrying amount of the investment is adjusted to recognise changes in the Group’s share of net assets of the joint venture since the acquisition date.

Notes to the consolidated and company financial statements / for the year ended 31 December 2016 / continued / Financial statem
ents
56 / PORT OF LONDON AUTHORITY
1. Accounting policies continued The Consolidated Income Statement reflects the Group’s share of the results of operations of the joint venture. Any change in Other
Comprehensive Income of those investees is presented as part of the Consolidated Statement of Other Comprehensive Income. In addition, when there has been a change recognised directly in the equity of the joint venture, the Group recognises its share of any changes, when applicable, in the Statement of Changes in Equity. Unrealised gains and losses resulting from transactions between the Group and the joint venture are eliminated to the extent of the interest in the joint venture.
The aggregate of the Group’s share of income or expense of a joint venture is shown on the face of the Consolidated Income Statement below operating profit.
The financial statements of the joint venture are prepared on the same basis and for the same reporting period as the Group.
After application of the equity method, the Group determines whether it is necessary to recognise an impairment loss in the joint venture. At each reporting date, the Group determines whether there is objective evidence that the investment in the joint venture is impaired. If there is such evidence, the Group calculates the amount of impairment as the difference between the recoverable amount of the joint venture and its carrying value, then recognises the loss within ‘share of profit of joint venture’ in the Consolidated Income Statement. In the Company’s stand-alone financial statements the investment in the joint venture is recognised at cost.
(b) Current versus non-current classification The Group presents assets and liabilities in the Balance Sheet based on a current/non-current classification. An asset is current when it is:
• expected to be realised or intended to be sold or consumed in a normal operating cycle;
• held primarily for the purpose of trading;
• expected to be realised within twelve months after the reporting period; or
• a cash or cash equivalent unless said cash or cash equivalent is restricted from being exchanged or used to settle a liability for at least twelve months after the reporting period.
All other assets are classified as non-current.
A liability is current when:
• it is expected to be settled in a normal operating cycle;
• it is held primarily for the purpose of trading;
• it is due to be settled within twelve months after the reporting period; or
• there is no unconditional right to defer the settlement of the liability for at least twelve months after the reporting period.
All other liabilities are classified as non-current.
Deferred tax assets and liabilities are classified as non-current assets and liabilities.
(c) Revenue Recognition Revenue is recognised to the extent that it is probable that the economic benefits will flow to the Group and the revenue can be reliably
measured, regardless of when the payment is being made. Revenue is measured at the fair value of the consideration received or receivable, taking into account contractually defined terms of payment and excluding taxes or duty. The Group has concluded that it is the principal in all of its revenue arrangements since it is the primary obligor in all the revenue arrangements, has pricing latitude and is also exposed to inventory and credit risks.
The specific recognition criteria described below must also be met before revenue is recognised.
Sale of goods Revenue from the sale of goods is recognised when the significant risks and rewards or ownership of the goods have passed to the buyer.
The Group regularly makes sales of parts of the foreshore, river bed and airspace above it. These sales are considered by the Board to be a core part of the Group’s operational activities. The Group recognises these sales within revenue at the point of sale (i.e. upon completion of a contract).
River works licences Leases in which the Group does not transfer substantially all the risks and benefits of ownership of an asset are classified as operating
leases. Initial direct costs incurred in negotiating an operating lease are treated as operating expenditure in the year incurred. Operating lease income is recognised on a straight line basis over the period covered by the licence. Contingent rents are recognised as revenue in the period in which they are earned.

Notes to the consolidated and company financial statements / for the year ended 31 December 2016 / continued /
ANNUAL REPORT & ACCOUNTS / 57
1. Accounting policies continued Rendering of services and recognition of royalities Cargo conservancy charges are recognised as revenue for imported/exported cargo in accordance with the date that the vessel enters
the Port limits or departs from a berth. Vessel conservancy charges are recognised as revenue in accordance with the date that the vessel enters or leaves the Port limits. Pilotage income is recognised as revenue on the commencement of a Pilotage act. Landfill royalties are recognised as revenue in accordance with the date the material is deposited. Other income is recognised as revenue as the service is provided.
(d) Taxes Current income tax Current income tax assets and liabilities for the current period are measured at the amount expected to be recovered from or paid to the
taxation authorities. The tax rates and tax laws used to compute the amount are those that are enacted and applicable, at the reporting date in the countries where the Group operates and generates taxable income.
Deferred tax Deferred tax is provided using the liability method on temporary differences between the tax bases of assets and liabilities and their
carrying amounts for financial reporting purposes at the reporting date.
Deferred tax liabilities are recognised for all taxable temporary differences.
The carrying amount of deferred tax assets is reviewed at each reporting date and reduced to the extent that it is no longer probable that sufficient taxable profit will be available to allow all or part of the deferred tax asset to be utilised. Unrecognised deferred tax assets are re-assessed at each reporting date and are recognised to the extent that it has become probable that future taxable profits will allow the deferred tax asset to be recovered.
Deferred tax assets and liabilities are measured at the tax rates that are expected to apply in the year when the asset is realised or the liability is settled, based on tax rates (and tax laws) that have been enacted or substantively enacted at the reporting date.
Deferred tax relating to items recognised outside of the Income Statement is also considered outside of the Income Statement. Deferred tax items are recognised in correlation to the underlying transaction either in Other Comprehensive Income or directly in Changes in Equity.
Deferred tax assets and deferred tax liabilities are offset if a legally enforceable right exists to set off current tax assets against current tax liabilities and the deferred taxes relate to the same taxable entity and the same taxation authority.
(e) Foreign Currencies The Group’s financial statements are presented in Pounds Sterling, which is also the functional currency of the parent, subsidiary and the
joint venture in which the Group has an investment.
Assets and liabilities denominated in foreign currencies are translated at the exchange rate ruling at the Balance Sheet date and any resulting exchange differences are dealt with in the Income Statement. Exchange differences arising on transactions during the year, which are translated at the exchange rate ruling at the date of transaction, are also dealt with in the Income Statement.
(f) Property, plant and equipment Property, plant and equipment is stated at cost less accumulated depreciation and accumulated impairment losses. Such costs include
costs directly attributable to making the asset capable of operating as intended and borrowing costs for long-term construction projects if the borrowing costs are directly attributable to the acquisition, construction or production of an asset. When significant parts of property, plant and equipment are required to be replaced at intervals, the Group recognises such parts as individual assets with specific useful lives and depreciates them accordingly. Likewise, when a major inspection or overhaul is performed, its cost is recognised in the carrying amount of the plant and equipment as a replacement if the recognition criteria is satisfied. All other repair and maintenance costs are recognised in the Income Statement as incurred. The carrying values of property, plant and equipment are reviewed for impairment when events or changes in circumstances indicate the carrying value may not be recoverable.
Depreciation is provided on assets other than land on a straight line basis over their estimated useful economic lives. These lives range up to a maximum of 50 years for dredging, river structures and buildings and 30 years for floating craft and plant and equipment. Depreciation commences when the assets are completed and available for their intended use.
The estimated useful lives, residual values and depreciation methods of property, plant and equipment are reviewed annually. Changes made are accounted for prospectively as changes in estimates.
(g) Leases The determination of whether an arrangement is (or contains) a lease is based on the substance of the arrangement at the inception
date. The arrangement is assessed for whether fulfilment of the arrangement is dependent on the use of a specific asset or assets or the arrangement conveys a right to use the asset or assets, even if that right is not explicitly specified in an arrangement.
Operating lease – Group and Company as a Lessee Costs in respect of operating leases are charged to the Income Statement on a straight line basis.

Notes to the consolidated and company financial statements / for the year ended 31 December 2016 / continued / Financial statem
ents
58 / PORT OF LONDON AUTHORITY
1. Accounting policies continued(h) Intangible Assets Intangible assets are initially measured at cost. Subsequently, the intangible assets are amortised over their useful economic lives and
assessed for impairment whenever there is an indication that the intangible asset may be impaired. The amortisation period and the amortisation method for the intangible assets are reviewed at least at the end of each reporting period. Changes in the expected useful life or the expected pattern of consumption of future economic benefits embodied in the asset are considered to modify the amortisation period or method, as appropriate, and are treated as changes in accounting estimates. The amortisation expense on intangible assets is recognised in the Income Statement in the expense that is consistent with the function of the intangible asset.
Gains or losses arising from de-recognition of an intangible asset are measured as the difference between the net disposal proceeds and the carrying amount of the asset and are recognised in the Income Statement when the asset is derecognised.
Amortisation is provided on assets on a straight line basis over their estimated useful economic lives. These lives range up to a maximum of 10 years for software and 50 years for a licence to deposit dredging materials. Amortisation commences when the assets are completed and available for their intended use.
The estimated useful lives, residual values and amortisation methods of software and licences are reviewed annually. Changes made are accounted for prospectively as changes in estimates.
(i) Financial Instruments – initial recognition and subsequent measurement A financial instrument is any contract that gives rise to a financial asset of one entity and a financial liability or equity instrument of another
entity.
Financial Assets Initial recognition and measurement Financial assets are classified, at initial recognition, as financial assets at fair value through profit and loss or loans and receivables, as
appropriate. All financial assets are recognised initially at fair value. The Group’s financial assets include cash and short-term deposits and trade and other receivables.
Subsequent measurement For purposes of subsequent measurement financial assets are classified in two categories:
• financial assets at fair value through profit and loss, at the reporting date there are no such assets; and
• loans and receivables.
Loans and receivables Loans and receivables are non-derivative financial assets with fixed or determinable payments that are not quoted in an active market.
After initial measurement, such financial assets are subsequently measured at amortised cost using the effective interest rate (EIR) method, less impairment if such interest is significant. Amortised cost is calculated by taking into account any discount or premium on acquisition and fees or costs that are an integral part of the EIR. The EIR amortisation is included in finance income in the Income Statement. The losses arising from impairment of receivables are recognised in cost of sales or other operating expenses.
Derecognition A financial asset (or, where applicable, a part of a financial asset or part of a group of similar financial assets) is primarily derecognised when:
• the rights to receive cash flows from the asset have expired; or
• the Group has transferred its rights to receive cash flows from the asset or has assumed an obligation to pay the received cash flows in full without material delay to a third party under a ‘pass-through’ arrangement and either a) the Group has transferred substantially all the risks and rewards of the asset; or b) the group has neither transferred nor retained substantially all the risks and rewards of the asset, but has transferred control of the asset.
When the group has transferred its rights to receive cash flows from an asset or has entered into a pass-through arrangement, it evaluates if and to what extent it has retained the risks and rewards of ownership. When it has neither transferred nor retained substantially all of the risks and rewards of the asset, nor transferred control of the asset, the Group continues to recognise the transferred asset to the extent of the Group’s continuing involvement. In that case, the Group also recognises an associated liability. The transferred asset and the associated liability are measured on a basis that reflects the rights and obligations that the Group has retained.
Impairment of financial assets The Group assesses, at each reporting date, whether there is objective evidence that a financial asset or a group of financial assets
is impaired. An impairment exists if one or more events that has occurred since the initial recognition of the asset (an incurred ‘loss event’), has an impact on the estimated future cash flows of the financial asset or the group of financial assets and this impact can be reliably estimated. Evidence of impairment may include indications that a debtor or a group of debtors is experiencing significant financial difficulty, default or delinquency in interest or principal payments, it is probable that they will enter bankruptcy or other financial reorganisation, observable data indicating that there is a measurable decrease in the estimated future cash flows such as changes in arrears or economic conditions that correlate with defaults.
Notes to the consolidated and company financial statements / for the year ended 31 December 2016 / continued /
ANNUAL REPORT & ACCOUNTS / 59
1. Accounting policies continued Financial liabilities Initial recognition and measurement Financial liabilities are classified, at initial recognition, as loans and borrowings or payables, as appropriate. All financial liabilities are
recognised initially at fair value and, in the case of loans and borrowings and payables, net of directly attributable transaction costs. The Group’s financial liabilities include trade and other payables.
Subsequent measurement After initial recognition, interest-bearing loans and borrowings are subsequently measured at amortised cost using the effective interest
rate (EIR) method. Gains and losses are recognised in the Income Statement when the liabilities are derecognised as well as through the EIR amortisation process.
Amortised cost is calculated by taking into account any discount or premium on acquisition and fees or costs that are an integral part of the EIR. The EIR amortisation is included as finance costs in the Income Statement.
Derecognition A financial liability is derecognised when the obligation under the liability is discharged or cancelled, or expires. When an existing financial
liability is replaced by another from the same lender on substantially different terms, or the terms of an existing liability are substantially modified, such an exchange or modification is treated as the derecognition of the original liability and the recognition of a new liability. The difference in the respective carrying amounts is recognised in the Consolidated Income Statement.
Fair Value As stated above, the Group initially measures certain financial instruments at fair value at each Balance Sheet date. Fair value is the
price that would be received to sell an asset or paid to transfer a liability in an orderly transaction between market participants at the measurement date. The fair value measurement is based on the presumption that the transaction to sell the asset or transfer the liability takes place either:
• in the principal market for the asset or liability; or
• in the absence of a principal market, in the most advantageous market for the asset or liability.
The principal or the most advantageous market must be accessible by the Group. The fair value of an asset or a liability is measured using the assumptions that market participants would use when pricing the asset or liability, assuming that market participants act in their economic best interest. A fair value measurement of a non-financial asset takes into account a market participant’s ability to generate economic benefits by using the asset in its highest and best use or by selling it to another market participant that would use the asset in its highest and best use. The Group uses valuation techniques that are appropriate in the circumstances and for which sufficient data are available to measure fair value, maximising the use of relevant observable inputs and minimising the use of unobservable inputs. All assets and liabilities for which fair value is measured or disclosed in the financial statements are categorised within the fair value hierarchy, described as follows, based on the lowest level input that is significant to the fair value measurement as a whole:
• level 1 – quoted (unadjusted) market prices in active markets for identical assets or liabilities;
• level 2 – valuation techniques for which the lowest level input that is significant to the fair value measurement is directly or indirectly observable; and
• level 3 – valuation techniques for which the lowest level input that is significant to the fair value measurement is unobservable.
For assets and liabilities that are recognised in the financial statements on a recurring basis, the Group determines whether transfers have occurred between levels in the hierarchy by re-assessing categorisation (based on the lowest level input that is significant to the fair value measurement as a whole) at the end of each reporting period.
Offsetting of financial instruments Financial assets and financial liabilities are offset and the net amount is reported in the Consolidated Balance Sheet if there is a currently
enforceable legal right to offset the recognised amounts and there is an intention to settle on a net basis, to realise the assets and settle the liabilities simultaneously.
(j) Inventories Inventories are valued at the lower of cost and net realisable value. Inventory consists of spare parts and consumable items. Costs
incurred to bring the product to its present location include transportation costs. Net realisable value is the estimated selling price in the ordinary course of business, less estimated costs necessary to make the sale.

Notes to the consolidated and company financial statements / for the year ended 31 December 2016 / continued / Financial statem
ents
60 / PORT OF LONDON AUTHORITY
1. Accounting policies continued(k) Impairment of non-financial assets The Group assesses, at each reporting date, whether there is an indication that an asset may be impaired. If any indication exists, or
when annual impairment testing for an asset is required, the Group estimates the asset’s recoverable amount. An asset’s recoverable amount is the higher of an asset’s or cash-generating unit’s (CGU) fair value less costs of disposal and its value in use. The recoverable amount is determined for an individual asset, unless the asset does not generate cash inflows that are largely independent of those from other assets or groups of assets. When the carrying amount of an asset or CGU exceeds its recoverable amount, the asset is considered impaired and is written down to its recoverable amount.
In assessing value in use, the estimated future cash flows are discounted to their present value using a pre-tax discount rate that reflects current market assessments of the time value of money and the risks specific to the asset. In determining fair value less costs of disposal, recent market transactions are taken into account. If no such transactions can be identified, an appropriate valuation model is used. These calculations are corroborated by valuation multiples, quoted share prices for publicly traded companies or other available fair value indicators.
Impairment losses of continuing operations, including impairment on inventories, are recognised in the Consolidated Income Statement in expense categories consistent with the function of the impaired asset.
For assets, an assessment is made at each reporting date to determine whether there is an indication that previously recognised impairment losses no longer exist or have decreased. If such indication exists, the Group estimates the asset’s or CGU’s recoverable amount. A previously recognised impairment loss is reversed only if there has been a change in the assumptions used to determine the asset’s recoverable amount since the last impairment loss was recognised. The reversal is limited so that the carrying amount of the asset does not exceed its recoverable amount, nor exceed the carrying amount that would have been determined, net of depreciation, had no impairment loss been recognised for the asset in prior years. Such reversal is recognised in the Consolidated Income Statement.
(l) Cash and short-term deposits Cash and short-term deposits in the Balance Sheet comprise cash at banks and on hand and short-term deposits with a maturity of
twelve months or less and accessible without penalty. For the purpose of the Consolidated Statement of Cash Flows, cash and cash equivalents consist of cash and short-term deposits, as defined above.
(m) Provisions – general Provisions are recognised when the Group has a present obligation (legal or constructive) as a result of a past event, when it is probable
that an outflow of resources embodying economic benefits will be required to settle the obligation and when a reliable estimate can be made of the amount of the obligation. The expense relating to a provision is presented in the Consolidated Income Statement net of any reimbursement. Any increase to a provision as the result of discounting is recognised in the Consolidated Income Statement as an interest expense.
(n) Pensions and other post-employment benefits The Group operates defined benefit plans in the UK, which require contributions to be made to separately administered funds. The costs
of providing benefits under the defined benefit plans are determined separately for each plan using the projected unit credit method and are based on actuarial advice.
Re-measurements, comprising of actuarial gains, the effect of the asset ceiling and losses and the return on plan assets (excluding net interest) are recognised immediately in the Balance Sheet with a corresponding debit or credit to retained earnings through Other Comprehensive Income in the period in which they occur. Re-measurements are not reclassified to the Consolidated Income Statement in subsequent periods. Past service costs are recognised in the Consolidated Income Statement at the date of the plan amendment or curtailment. Net interest is calculated by applying the discount rate to the net defined benefit liability or asset.
The Group recognises the following changes in the net defined obligation under ‘operating expenditure’ in the Consolidated Income Statement:
• service costs comprising current service costs, past service costs, gains and losses on curtailments and non-routine settlements; and
• net interest expense or income.
The defined benefit pension asset or liability in the Balance Sheet comprises the total for each plan of the present value of the defined benefit obligation (using a discount rate based on high quality corporate bonds that have been rated at AA or equivalent status) less the fair value of plan assets out of which the obligations are to be settled directly. Fair value is based on market price information and in the case of quoted securities is the published bid price. Some pension assets do not have quoted values. The PLAPF has an investment in an infrastructure fund with the net asset value being provided by the fund managers. The WWOPF has an annuity policy where the asset value is set equal to the corresponding liability. The value of a net pension benefit asset may be limited to the amount that may be recovered either through reduced contributions or agreed refunds from the scheme.
Contributions to defined contribution schemes are recognised in the Consolidated Income Statement in the period in which they become payable.
(o) Payments to suppliers Suppliers are normally paid within 30 days from date of invoice or in accordance with suppliers’ terms if different.

Notes to the consolidated and company financial statements / for the year ended 31 December 2016 / continued /
ANNUAL REPORT & ACCOUNTS / 61
1. Accounting policies continued
Significant accounting judgements, estimates and assumptionsThe preparation of the Group’s financial statements requires management to make judgements, estimates and assumptions that affect the reported amounts of revenues, expenses, assets and liabilities, and the accompanying disclosures, including the disclosure of contingent liabilities. Uncertainty about these assumptions and estimates could result in outcomes that require a material adjustment to the carrying amount of assets or liabilities affected in future periods.
In the application of the Group’s accounting policies, management are required to make judgements, estimates and assumptions about the carrying amounts of assets and liabilities that are not readily apparent from other sources. The estimates and associated assumptions are based on historical experience and other factors that are considered to be relevant. Actual results may differ from estimates. The following summarises the judgements, estimates and assumptions that may cause amounts recognised or disclosed to change in following reporting periods.
(a) Joint venture classification – Estuary Services Limited – judgement The group holds a 50% voting and equity interest in Estuary Services Limited (ESL). The Group has determined that it holds joint
control over ESL with the Port of Sheerness Limited as neither party can pass a resolution without the consent of the other party. Upon establishing joint control, the Group has further determined that this joint arrangement is a joint venture rather than a joint operation. The Group determined this as it does not have rights to any specific assets or liabilities of ESL, but rather to the net assets of the company nor does it have an implicit obligation to fund the liabilities of ESL through an obligation to purchase all of the output of ESL. As a joint venture, the Group accounts for its interest in ESL under the equity method.
(b) Defined benefit plans (pension benefits) – estimates & judgement The costs of the defined benefit pension plans and the present value of the pension obligations are determined using actuarial valuations.
An actuarial valuation involves making various assumptions that may differ from actual developments in the future. These include the determination of the discount rate, future salary increases, mortality rates and future pension increases. Due to the complexities involved in the valuation and its long-term nature, a defined benefit obligation is highly sensitive to changes in these assumptions. All assumptions are reviewed at each reporting date.
In determining the appropriate discount rate, management considers the interest rates of corporate bonds in currencies consistent with the currencies of the post-employment benefit obligations with at least an ‘AA’ rating or above, as set by an internationally acknowledged rating agency, and extrapolated as needed along the yield curve to correspond with the expected term of the defined benefit obligations. The underlying bonds are further reviewed for quality. Those having excessive credit spreads are excluded from the analysis of bonds on which the discount rate is based, on the basis that they do not represent high quality corporate bonds. See note 19.
(c) Cargo handling provision – estimates and judgement The provision amount for cargo handling claims is determined using actuarial valuations. An actuarial valuation involves making various
assumptions that may differ to actual developments in the future. These include the determination of the discount rate, the number of future claims, the amount of future claims and the timing of future claims. Due to the complexities involved in the valuation and its long-term nature, the provision is highly sensitive to changes in these assumptions. All assumptions are reviewed at each reporting date.
The discount rate used is the weighted average risk free rate based on the Bank of England’s government liability curve spot rate at 31 December 2016 of 1.5% (2015 1.5%). It is expected that the provision will be utilised over a period of around 34 years. See note 17.
(d) Deferred tax assets – estimates and judgement Significant management judgement is required to determine the amount of deferred tax assets that can be recognised, based upon
the likely timing and the level of future taxable profits together with future tax planning strategies. Deferred tax is recognised on pension liabilities capped at management’s best estimate of available future taxable profits.
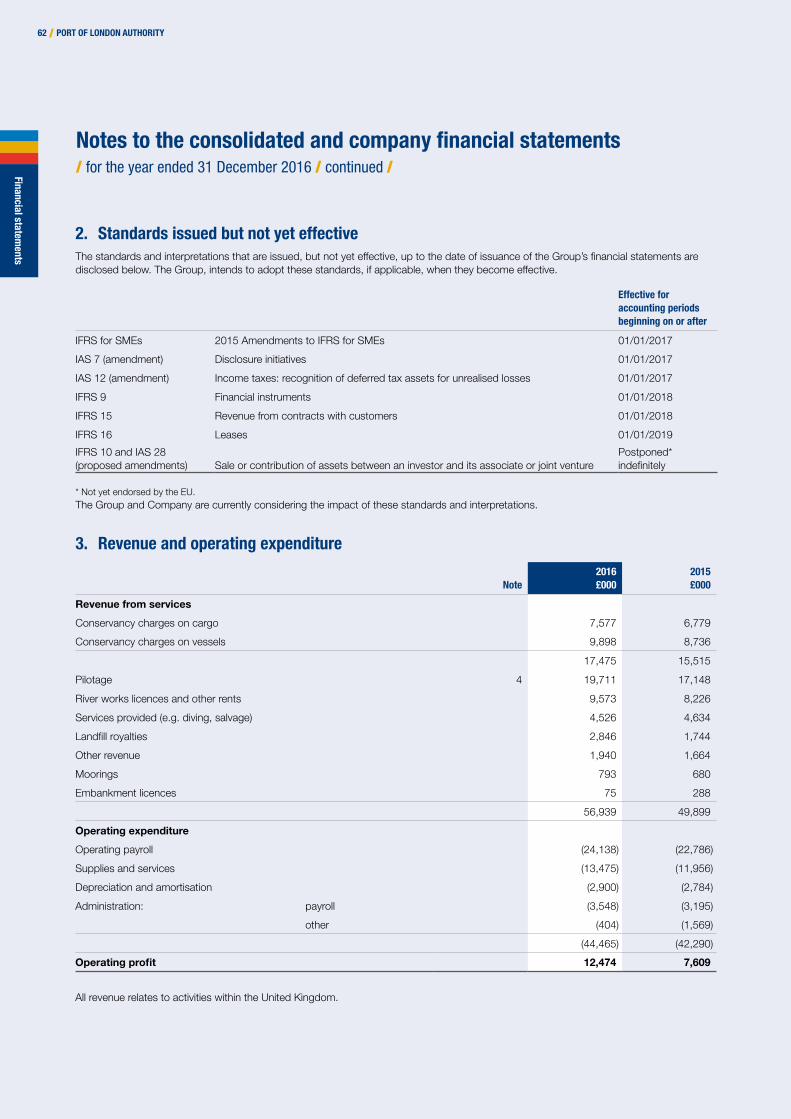
Notes to the consolidated and company financial statements / for the year ended 31 December 2016 / continued / Financial statem
ents
62 / PORT OF LONDON AUTHORITY
2. Standards issued but not yet effectiveThe standards and interpretations that are issued, but not yet effective, up to the date of issuance of the Group’s financial statements are disclosed below. The Group, intends to adopt these standards, if applicable, when they become effective.
Effective foraccounting periodsbeginning on or after
IFRS for SMEs 2015 Amendments to IFRS for SMEs 01/01/2017
IAS 7 (amendment) Disclosure initiatives 01/01/2017
IAS 12 (amendment) Income taxes: recognition of deferred tax assets for unrealised losses 01/01/2017
IFRS 9 Financial instruments 01/01/2018
IFRS 15 Revenue from contracts with customers 01/01/2018
IFRS 16 Leases 01/01/2019
IFRS 10 and IAS 28 (proposed amendments) Sale or contribution of assets between an investor and its associate or joint venture
Postponed* indefinitely
* Not yet endorsed by the EU.The Group and Company are currently considering the impact of these standards and interpretations.
3. Revenue and operating expenditure
Note2016£000
2015£000
Revenue from services
Conservancy charges on cargo 7,577 6,779
Conservancy charges on vessels 9,898 8,736
17,475 15,515
Pilotage 4 19,711 17,148
River works licences and other rents 9,573 8,226
Services provided (e.g. diving, salvage) 4,526 4,634
Landfill royalties 2,846 1,744
Other revenue 1,940 1,664
Moorings 793 680
Embankment licences 75 288
56,939 49,899
Operating expenditure
Operating payroll (24,138) (22,786)
Supplies and services (13,475) (11,956)
Depreciation and amortisation (2,900) (2,784)
Administration: payroll (3,548) (3,195)
other (404) (1,569)
(44,465) (42,290)
Operating profit 12,474 7,609
All revenue relates to activities within the United Kingdom.
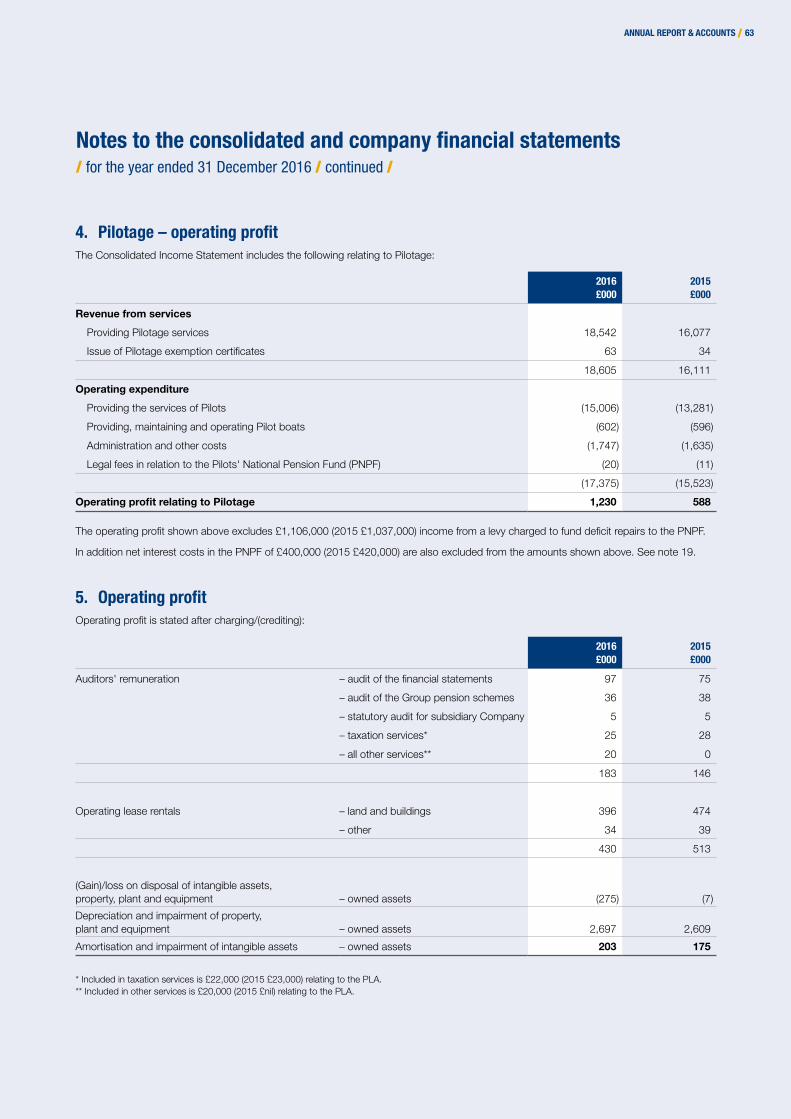
Notes to the consolidated and company financial statements / for the year ended 31 December 2016 / continued /
ANNUAL REPORT & ACCOUNTS / 63
4. Pilotage – operating profitThe Consolidated Income Statement includes the following relating to Pilotage:
2016£000
2015£000
Revenue from services
Providing Pilotage services 18,542 16,077
Issue of Pilotage exemption certificates 63 34
18,605 16,111
Operating expenditure
Providing the services of Pilots (15,006) (13,281)
Providing, maintaining and operating Pilot boats (602) (596)
Administration and other costs (1,747) (1,635)
Legal fees in relation to the Pilots' National Pension Fund (PNPF) (20) (11)
(17,375) (15,523)
Operating profit relating to Pilotage 1,230 588
The operating profit shown above excludes £1,106,000 (2015 £1,037,000) income from a levy charged to fund deficit repairs to the PNPF.
In addition net interest costs in the PNPF of £400,000 (2015 £420,000) are also excluded from the amounts shown above. See note 19.
5. Operating profitOperating profit is stated after charging/(crediting):
2016£000
2015£000
Auditors' remuneration – audit of the financial statements 97 75
– audit of the Group pension schemes 36 38
– statutory audit for subsidiary Company 5 5
– taxation services* 25 28
– all other services** 20 0
183 146
Operating lease rentals – land and buildings 396 474
– other 34 39
430 513
(Gain)/loss on disposal of intangible assets, property, plant and equipment – owned assets (275) (7)
Depreciation and impairment of property, plant and equipment – owned assets 2,697 2,609
Amortisation and impairment of intangible assets – owned assets 203 175
* Included in taxation services is £22,000 (2015 £23,000) relating to the PLA.** Included in other services is £20,000 (2015 £nil) relating to the PLA.
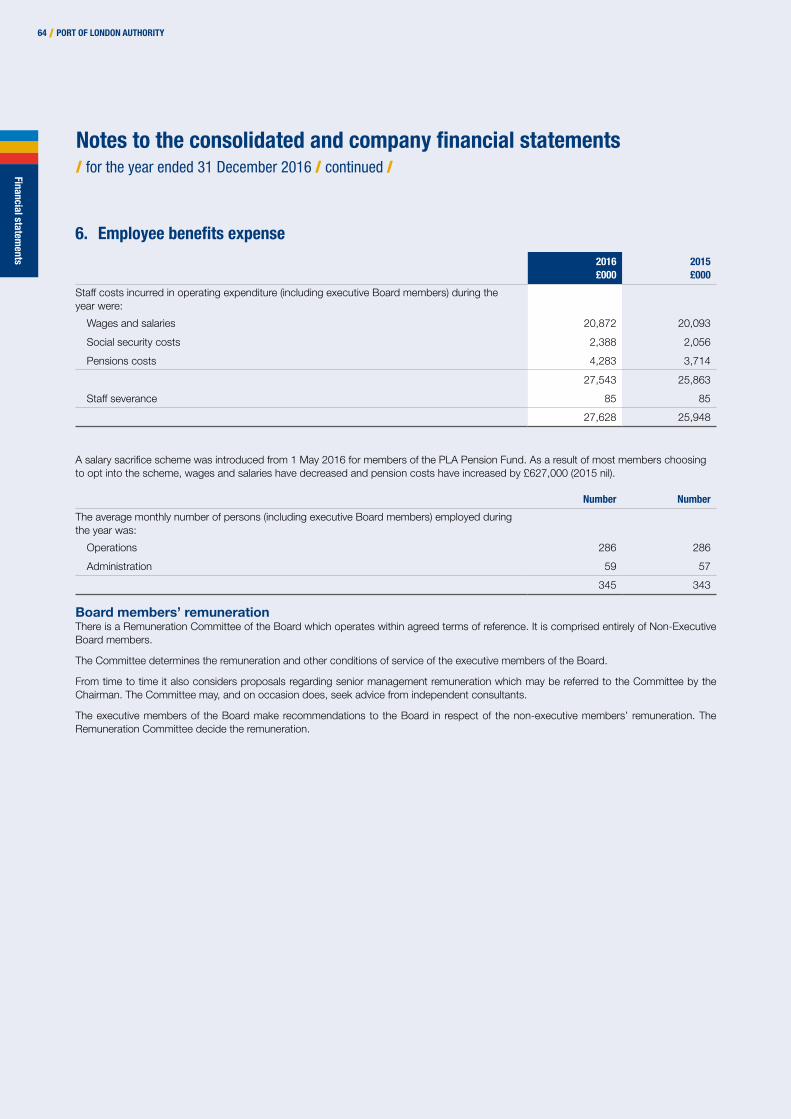
Notes to the consolidated and company financial statements / for the year ended 31 December 2016 / continued / Financial statem
ents
64 / PORT OF LONDON AUTHORITY
6. Employee benefits expense
2016£000
2015£000
Staff costs incurred in operating expenditure (including executive Board members) during the year were:
Wages and salaries 20,872 20,093
Social security costs 2,388 2,056
Pensions costs 4,283 3,714
27,543 25,863
Staff severance 85 85
27,628 25,948
A salary sacrifice scheme was introduced from 1 May 2016 for members of the PLA Pension Fund. As a result of most members choosing to opt into the scheme, wages and salaries have decreased and pension costs have increased by £627,000 (2015 nil).
Number Number
The average monthly number of persons (including executive Board members) employed during the year was:
Operations 286 286
Administration 59 57
345 343
Board members’ remunerationThere is a Remuneration Committee of the Board which operates within agreed terms of reference. It is comprised entirely of Non-Executive Board members.
The Committee determines the remuneration and other conditions of service of the executive members of the Board.
From time to time it also considers proposals regarding senior management remuneration which may be referred to the Committee by the Chairman. The Committee may, and on occasion does, seek advice from independent consultants.
The executive members of the Board make recommendations to the Board in respect of the non-executive members’ remuneration. The Remuneration Committee decide the remuneration.
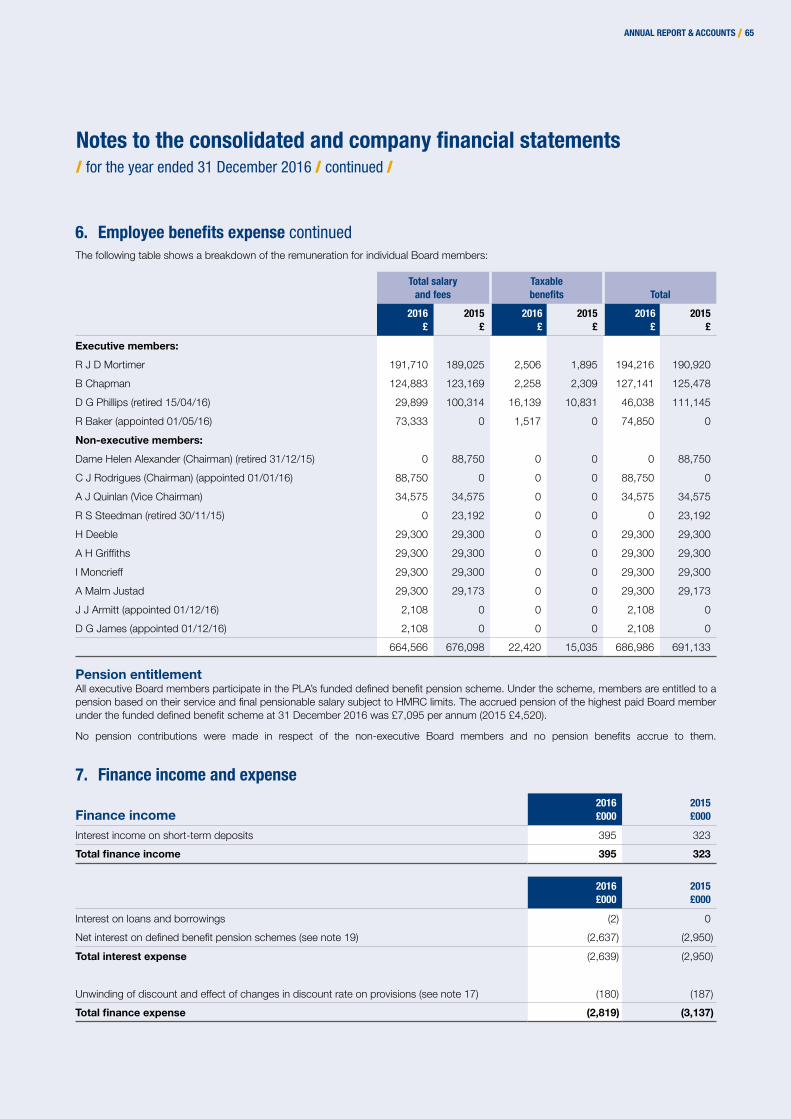
Notes to the consolidated and company financial statements / for the year ended 31 December 2016 / continued /
ANNUAL REPORT & ACCOUNTS / 65
6. Employee benefits expense continuedThe following table shows a breakdown of the remuneration for individual Board members:
Total salary and fees
Taxable benefits Total
2016£
2015£
2016£
2015£
2016£
2015£
Executive members:
R J D Mortimer 191,710 189,025 2,506 1,895 194,216 190,920
B Chapman 124,883 123,169 2,258 2,309 127,141 125,478
D G Phillips (retired 15/04/16) 29,899 100,314 16,139 10,831 46,038 111,145
R Baker (appointed 01/05/16) 73,333 0 1,517 0 74,850 0
Non-executive members:
Dame Helen Alexander (Chairman) (retired 31/12/15) 0 88,750 0 0 0 88,750
C J Rodrigues (Chairman) (appointed 01/01/16) 88,750 0 0 0 88,750 0
A J Quinlan (Vice Chairman) 34,575 34,575 0 0 34,575 34,575
R S Steedman (retired 30/11/15) 0 23,192 0 0 0 23,192
H Deeble 29,300 29,300 0 0 29,300 29,300
A H Griffiths 29,300 29,300 0 0 29,300 29,300
I Moncrieff 29,300 29,300 0 0 29,300 29,300
A Malm Justad 29,300 29,173 0 0 29,300 29,173
J J Armitt (appointed 01/12/16) 2,108 0 0 0 2,108 0
D G James (appointed 01/12/16) 2,108 0 0 0 2,108 0
664,566 676,098 22,420 15,035 686,986 691,133
Pension entitlement All executive Board members participate in the PLA’s funded defined benefit pension scheme. Under the scheme, members are entitled to a pension based on their service and final pensionable salary subject to HMRC limits. The accrued pension of the highest paid Board member under the funded defined benefit scheme at 31 December 2016 was £7,095 per annum (2015 £4,520).
No pension contributions were made in respect of the non-executive Board members and no pension benefits accrue to them.
7. Finance income and expense
Finance income2016£000
2015£000
Interest income on short-term deposits 395 323
Total finance income 395 323
2016£000
2015£000
Interest on loans and borrowings (2) 0
Net interest on defined benefit pension schemes (see note 19) (2,637) (2,950)
Total interest expense (2,639) (2,950)
Unwinding of discount and effect of changes in discount rate on provisions (see note 17) (180) (187)
Total finance expense (2,819) (3,137)
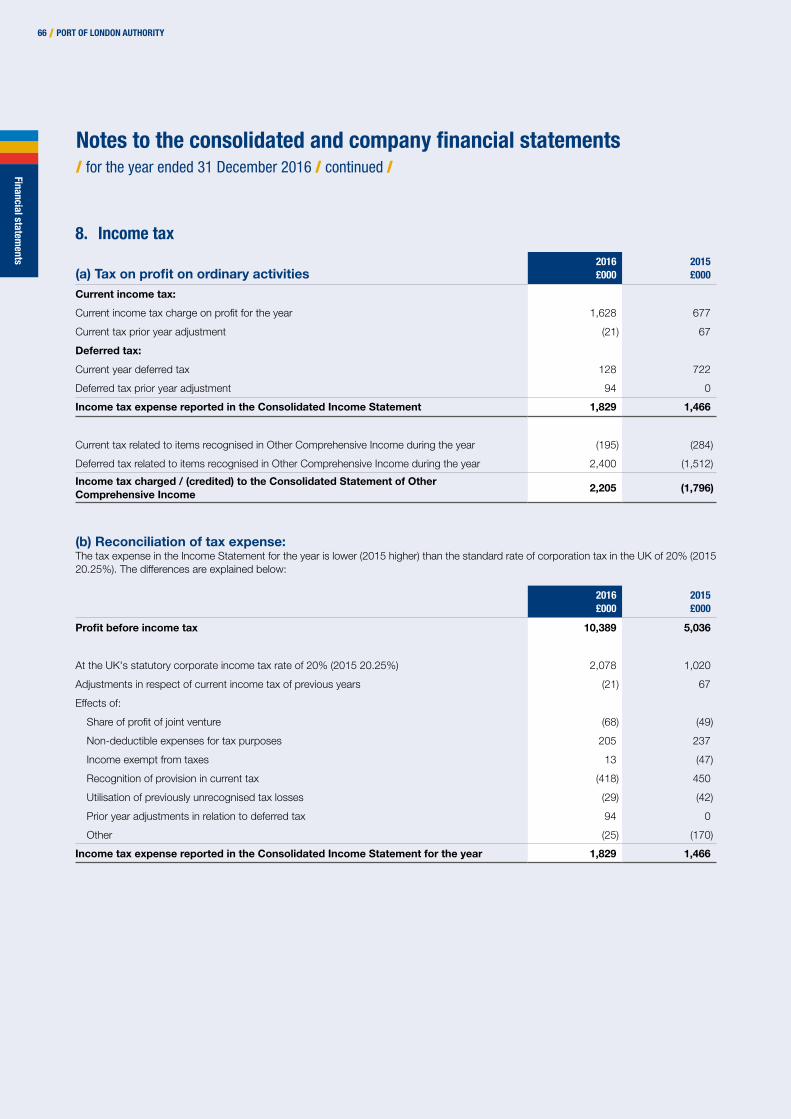
Notes to the consolidated and company financial statements / for the year ended 31 December 2016 / continued / Financial statem
ents
66 / PORT OF LONDON AUTHORITY
8. Income tax
(a) Tax on profit on ordinary activities2016£000
2015£000
Current income tax:
Current income tax charge on profit for the year 1,628 677
Current tax prior year adjustment (21) 67
Deferred tax:
Current year deferred tax 128 722
Deferred tax prior year adjustment 94 0
Income tax expense reported in the Consolidated Income Statement 1,829 1,466
Current tax related to items recognised in Other Comprehensive Income during the year (195) (284)
Deferred tax related to items recognised in Other Comprehensive Income during the year 2,400 (1,512)
Income tax charged / (credited) to the Consolidated Statement of Other Comprehensive Income
2,205 (1,796)
(b) Reconciliation of tax expense: The tax expense in the Income Statement for the year is lower (2015 higher) than the standard rate of corporation tax in the UK of 20% (2015 20.25%). The differences are explained below:
2016£000
2015£000
Profit before income tax 10,389 5,036
At the UK's statutory corporate income tax rate of 20% (2015 20.25%) 2,078 1,020
Adjustments in respect of current income tax of previous years (21) 67
Effects of:
Share of profit of joint venture (68) (49)
Non-deductible expenses for tax purposes 205 237
Income exempt from taxes 13 (47)
Recognition of provision in current tax (418) 450
Utilisation of previously unrecognised tax losses (29) (42)
Prior year adjustments in relation to deferred tax 94 0
Other (25) (170)
Income tax expense reported in the Consolidated Income Statement for the year 1,829 1,466

Notes to the consolidated and company financial statements / for the year ended 31 December 2016 / continued /
ANNUAL REPORT & ACCOUNTS / 67
8. Income tax continued
Balance Sheet Income Statement
(c) Deferred tax2016£000
2015£000
2016£000
2015£000
Deferred tax assets relating to net defined benefit pension liabilities 13,300 10,900 0 0
Accelerated depreciation for tax purposes (1,366) (1,142) (224) (695)
Other temporary differences 35 33 2 (27)
Deferred tax income/(expense) 11,969 9,791 (222) (722)
Net deferred tax assets
Reflected in the Balance Sheet as follows:
Deferred tax assets 13,300 10,900
Deferred tax liabilities (1,331) (1,109)
Net deferred tax assets 11,969 9,791
Reconciliation of net deferred tax assets2016£000
2015£000
At 1 January 9,791 9,001
Tax expense during the year recognised in the Consolidated Income Statement (222) (722)
Tax income during the year recognised in Other Comprehensive Income 2,400 1,512
At 31 December 11,969 9,791
The Group offsets tax assets and liabilities if and only if it has a legally enforceable right to set off current tax assets and current tax liabilities and the deferred tax assets and deferred tax liabilities related to income taxes are levied by the same tax authority.
The Finance Act 2016, enacted on 15 September 2016 replaces the 18% rate with a 17% rate to be applied from 1 April 2020. The Group has calculated the deferred tax assets at appropriate rates between 17% - 20% in accordance with when it anticipates temporary differences will unwind. The increase in the deferred tax asset related to pension fund deficit has been limited to £2,400,000 based on forecasted profits for the next 10 years. The Group has capital losses carried forward of £2,230,000 (2015 £2,284,000) that may be available for offset against future capital gains that arise in the Group. A deferred tax asset has not been recognised in respect of these losses.
The Group’s joint venture will not distribute its profits until it obtains consent from all venture partners.
The PLA’s share of the temporary differences associated with the joint venture, for which a deferred tax asset has not been recognised, aggregate to £34,000 (2015: £9,000).

Notes to the consolidated and company financial statements / for the year ended 31 December 2016 / continued / Financial statem
ents
68 / PORT OF LONDON AUTHORITY
9. Intangible assets
Group and Company
Software£000
Licences£000
Total£000
Cost
At 1 January 2015 2,447 330 2,777
Additions 247 0 247
Disposals (63) (63)
At 31 December 2015 2,631 330 2,961
Additions 307 39 346
Disposals (31) 0 (31)
At 31 December 2016 2,907 369 3,276
Amortisation
At 1 January 2015 1,876 96 1,972
Charge for year 169 6 175
Eliminated on disposals (54) 0 (54)
At 31 December 2015 1,991 102 2,093
Charge for year 196 7 203
Eliminated on disposals (31) 0 (31)
At 31 December 2016 2,156 109 2,265
Net book value at 31 December 2016 751 260 1,011
Net book value at 31 December 2015 640 228 868
The Group has a 50 year licence with effect from 3 July 2000, granted by the Royal Society for the Protection of Birds, to deposit dredging materials on land at Rainham, Essex.
Assets under development not yet being amortised amounted to £252,000 (2015 £12,000).

Notes to the consolidated and company financial statements / for the year ended 31 December 2016 / continued /
ANNUAL REPORT & ACCOUNTS / 69
10. Property, plant and equipment
Group and Company
Landand
buildings£000
Dredging£000
Riverstructures
£000
Floatingcraft£000
Plantand
equipment£000
Total£000
Cost
At 1 January 2015 13,864 20,912 10,854 14,271 17,041 76,942
Additions 640 0 42 1,884 860 3,426
Disposals 0 0 0 0 (253) (253)
At 31 December 2015 14,504 20,912 10,896 16,155 17,648 80,115
Reclassifications (70) 0 0 (545) 615 0
Additions 3,091 0 118 20 737 3,966
Disposals 0 0 0 (558) (372) (930)
At 31 December 2016 17,525 20,912 11,014 15,072 18,628 83,151
Depreciation
At 1 January 2015 5,816 3,413 6,123 5,818 11,890 33,060
Charge for year 385 394 407 452 971 2,609
Eliminated on disposals 0 0 0 0 (251) (251)
At 31 December 2015 6,201 3,807 6,530 6,270 12,610 35,418
Charge for year 421 398 408 495 975 2,697
Eliminated on disposals 0 0 0 (522) (358) (880) At 31 December 2016 6,622 4,205 6,938 6,243 13,227 37,235
Net book value at 31 December 2016 10,903 16,707 4,076 8,829 5,401 45,916
Net book value at 31 December 2015 8,303 17,105 4,366 9,885 5,038 44,697
The net book value of leasehold property held under long leases included in land and buildings above is £56,000 (2015 £56,000).
Assets under construction not yet being depreciated amounted to £1,478,000 (2015 £2,392,000).

Notes to the consolidated and company financial statements / for the year ended 31 December 2016 / continued / Financial statem
ents
70 / PORT OF LONDON AUTHORITY
11. Interest in joint ventureThe Group has a 50% interest in Estuary Services Limited, a jointly controlled entity involved in launch services, together with shore support services, for the boarding and landing of pilots. The Group’s interest in Estuary Services Limited is accounted for using the equity method in the consolidated financial statements. Summarised financial information of the joint venture, based on its IFRS financial statements, with a reconciliation to the carrying amount of the investment in the consolidated financial statements is set out below:
Summarised Balance Sheet of Estuary Services Limited2016£000
2015£000
Non-current assets 2,389 1,675
Current assets:
Cash and cash equivalents 1,293 709
Prepayments 41 37
Trade and other receivables 394 723
1,728 1,469
Current liabilities (543) (453)
Non-current liabilities, including deferred tax liabilities £nil (2015 £nil) and long-term borrowing £nil (2015 £nil). (3,459) (2,239)
Equity 115 452
Proportion of the Group's ownership 50% 50%
Carrying amount of the investment 58 226
Summarised Income Statement of Estuary Services Limited2016£000
2015£000
Revenue 3,654 3,376
Cost of sales (2,821) (2,725)
Finance income 6 3
Finance costs, including interest expense £82,000 (2015 £101,000) (82) (101)
Profit on ordinary activities before taxation 757 553
Income tax expense (79) (72)
Profit for the year 678 481
Group's share of profit for the year 339 241
Summarised Statement of Other Comprehensive (expense)/Income of Estuary Services Limited2016£000
2015£000
Other comprehensive income not to be reclassified to profit or loss in subsequent periods:
Remeasurement of defined benefit scheme (1,252) 548
Income tax effect of remeasurement of defined benefit scheme 40 35
Movement in deferred tax relating to defined benefit pension scheme 197 172
Total other comprehensive income (1,015) 755
Group's share of Other Comprehensive (expense)/Income (508) 377
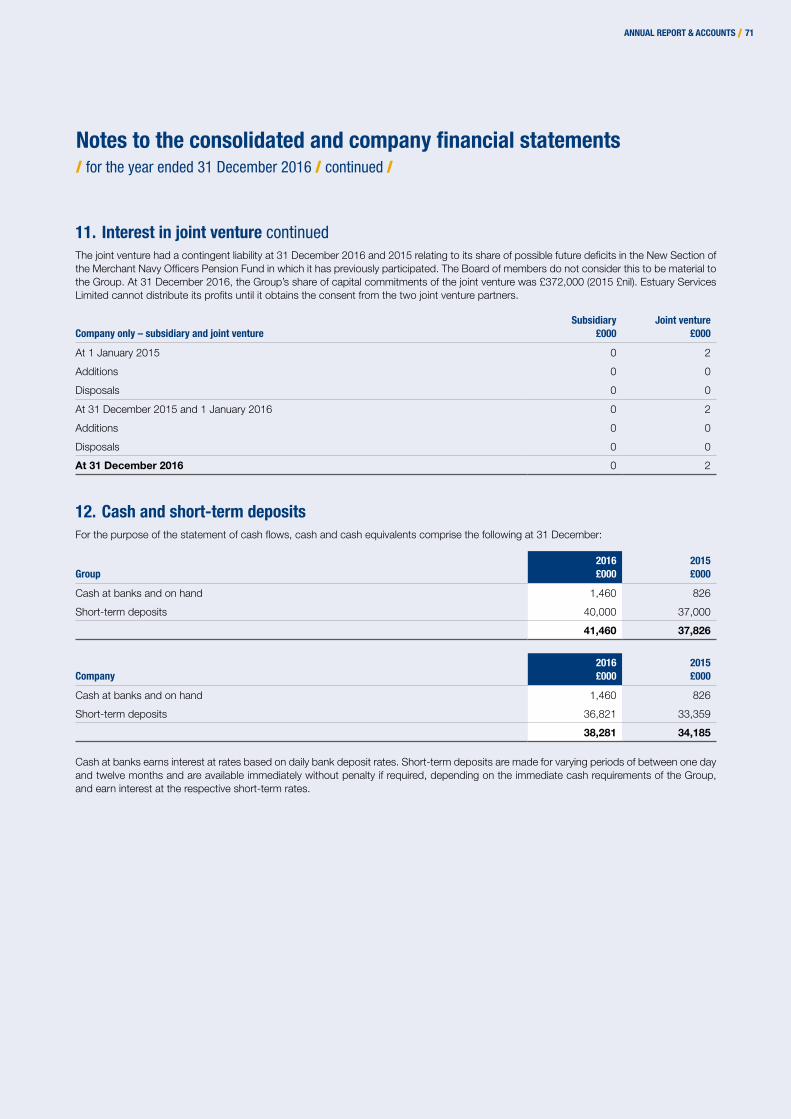
Notes to the consolidated and company financial statements / for the year ended 31 December 2016 / continued /
ANNUAL REPORT & ACCOUNTS / 71
11. Interest in joint venture continuedThe joint venture had a contingent liability at 31 December 2016 and 2015 relating to its share of possible future deficits in the New Section of the Merchant Navy Officers Pension Fund in which it has previously participated. The Board of members do not consider this to be material to the Group. At 31 December 2016, the Group’s share of capital commitments of the joint venture was £372,000 (2015 £nil). Estuary Services Limited cannot distribute its profits until it obtains the consent from the two joint venture partners.
Company only – subsidiary and joint ventureSubsidiary
£000Joint venture
£000
At 1 January 2015 0 2
Additions 0 0
Disposals 0 0
At 31 December 2015 and 1 January 2016 0 2
Additions 0 0
Disposals 0 0
At 31 December 2016 0 2
12. Cash and short-term depositsFor the purpose of the statement of cash flows, cash and cash equivalents comprise the following at 31 December:
Group2016£000
2015£000
Cash at banks and on hand 1,460 826
Short-term deposits 40,000 37,000
41,460 37,826
Company2016£000
2015£000
Cash at banks and on hand 1,460 826
Short-term deposits 36,821 33,359
38,281 34,185
Cash at banks earns interest at rates based on daily bank deposit rates. Short-term deposits are made for varying periods of between one day and twelve months and are available immediately without penalty if required, depending on the immediate cash requirements of the Group, and earn interest at the respective short-term rates.

Notes to the consolidated and company financial statements / for the year ended 31 December 2016 / continued / Financial statem
ents
72 / PORT OF LONDON AUTHORITY
13. Trade receivables
(a) Trade receivables (current)
Group2016£000
2015£000
Corporation tax 0 224
Trade receivables 8,989 6,703
8,989 6,927
Company2016£000
2015£000
Corporation tax 0 224
Trade receivables 8,989 6,703
Receivables from subsidiary 0 0
8,989 6,927
For terms and conditions relating to related party receivables, refer to Note 21.
Trade receivables are non-interest bearing and are generally on terms of 30 days.
As at 31 December 2016, trade receivables of an initial value of £806,000 (2015 £868,000) were impaired and fully provided for. See below for the movements in the provision for impairment of receivables.
Group and company
Individuallyimpaired
£000
Collectively impaired
£000Total£000
At 1 January 2015 798 300 1,098
Utilised (24) 0 (24)
Unused amounts reversed (56) (150) (206)
At 31 December 2015 and 1 January 2016 718 150 868
Utilised (13) 0 (13)
Unused amounts reversed (49) 0 (49)
At 31 December 2016 656 150 806
As at 31 December, the ageing analysis of trade receivables is, as follows:
Neither past due nor
impaired£000
Past due but not impaired
Total£000
<30 days£000
30-60 days£000
61-90 days£000
91-120 days£000
>120 days£000
Group
2016 8,989 2,322 3,413 1,432 642 401 779
2015 6,703 1,763 2,344 1,986 422 86 102
Company
2016 8,989 2,322 3,413 1,432 642 401 779
2015 6,703 1,763 2,344 1,986 422 86 102
See Note 15 on the credit risk of trade receivables, which explains how the Group manages and measures credit quality of trade receivables that are neither part due nor impaired.
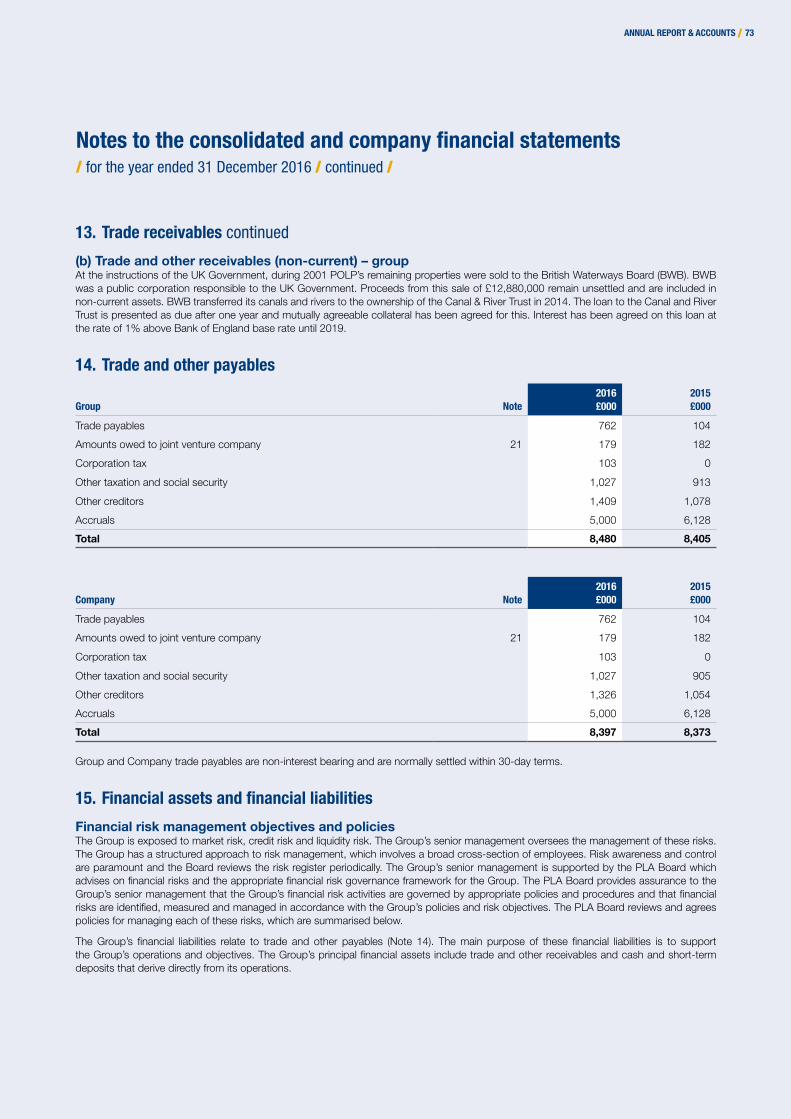
Notes to the consolidated and company financial statements / for the year ended 31 December 2016 / continued /
ANNUAL REPORT & ACCOUNTS / 73
13. Trade receivables continued
(b) Trade and other receivables (non-current) – groupAt the instructions of the UK Government, during 2001 POLP’s remaining properties were sold to the British Waterways Board (BWB). BWB was a public corporation responsible to the UK Government. Proceeds from this sale of £12,880,000 remain unsettled and are included in non-current assets. BWB transferred its canals and rivers to the ownership of the Canal & River Trust in 2014. The loan to the Canal and River Trust is presented as due after one year and mutually agreeable collateral has been agreed for this. Interest has been agreed on this loan at the rate of 1% above Bank of England base rate until 2019.
14. Trade and other payables
Group Note2016£000
2015£000
Trade payables 762 104
Amounts owed to joint venture company 21 179 182
Corporation tax 103 0
Other taxation and social security 1,027 913
Other creditors 1,409 1,078
Accruals 5,000 6,128
Total 8,480 8,405
Company Note2016£000
2015£000
Trade payables 762 104
Amounts owed to joint venture company 21 179 182
Corporation tax 103 0
Other taxation and social security 1,027 905
Other creditors 1,326 1,054
Accruals 5,000 6,128
Total 8,397 8,373
Group and Company trade payables are non-interest bearing and are normally settled within 30-day terms.
15. Financial assets and financial liabilities
Financial risk management objectives and policiesThe Group is exposed to market risk, credit risk and liquidity risk. The Group’s senior management oversees the management of these risks. The Group has a structured approach to risk management, which involves a broad cross-section of employees. Risk awareness and control are paramount and the Board reviews the risk register periodically. The Group’s senior management is supported by the PLA Board which advises on financial risks and the appropriate financial risk governance framework for the Group. The PLA Board provides assurance to the Group’s senior management that the Group’s financial risk activities are governed by appropriate policies and procedures and that financial risks are identified, measured and managed in accordance with the Group’s policies and risk objectives. The PLA Board reviews and agrees policies for managing each of these risks, which are summarised below.
The Group’s financial liabilities relate to trade and other payables (Note 14). The main purpose of these financial liabilities is to support the Group’s operations and objectives. The Group’s principal financial assets include trade and other receivables and cash and short-term deposits that derive directly from its operations.

Notes to the consolidated and company financial statements / for the year ended 31 December 2016 / continued / Financial statem
ents
74 / PORT OF LONDON AUTHORITY
15. Financial assets and financial liabilities continued
Categories of financial instruments:Fair value Book value
Group2016£000
2015£000
2016£000
2015£000
Financial Liabilities
Loans and receivables:
Trade and other receivables 21,869 19,807 21,869 19,807
21,869 19,807 21,869 19,807
At fair value through profit and loss:
Cash and short-term deposits 41,460 37,826 41,460 37,826
41,460 37,826 41,460 37,826
Total 63,329 57,633 63,329 57,633
Financial Liabilities
Financial liabilities at amortised cost:
Trade and other payables (8,732) (7,492) (8,732) (7,492)
Total 54,597 50,141 54,597 50,141
Fair value Book value
Company2016£000
2015£000
2016£000
2015£000
Financial Assets
Loans and receivables:
Trade and other receivables 8,989 6,927 8,989 6,927
8,989 6,927 8,989 6,927
At fair value through profit and loss:
Cash and short-term deposits (38,281) 34,185 (38,281) 34,185
(38,281) 34,185 (38,281) 34,185
Total (29,292) 41,112 (29,292) 41,112
Financial Liabilities
Financial liabilities at amortised cost:
Trade and other payables (7,370) (7,468) (7,370) (7,468)
Total (36,662) 33,644 (36,662) 33,644
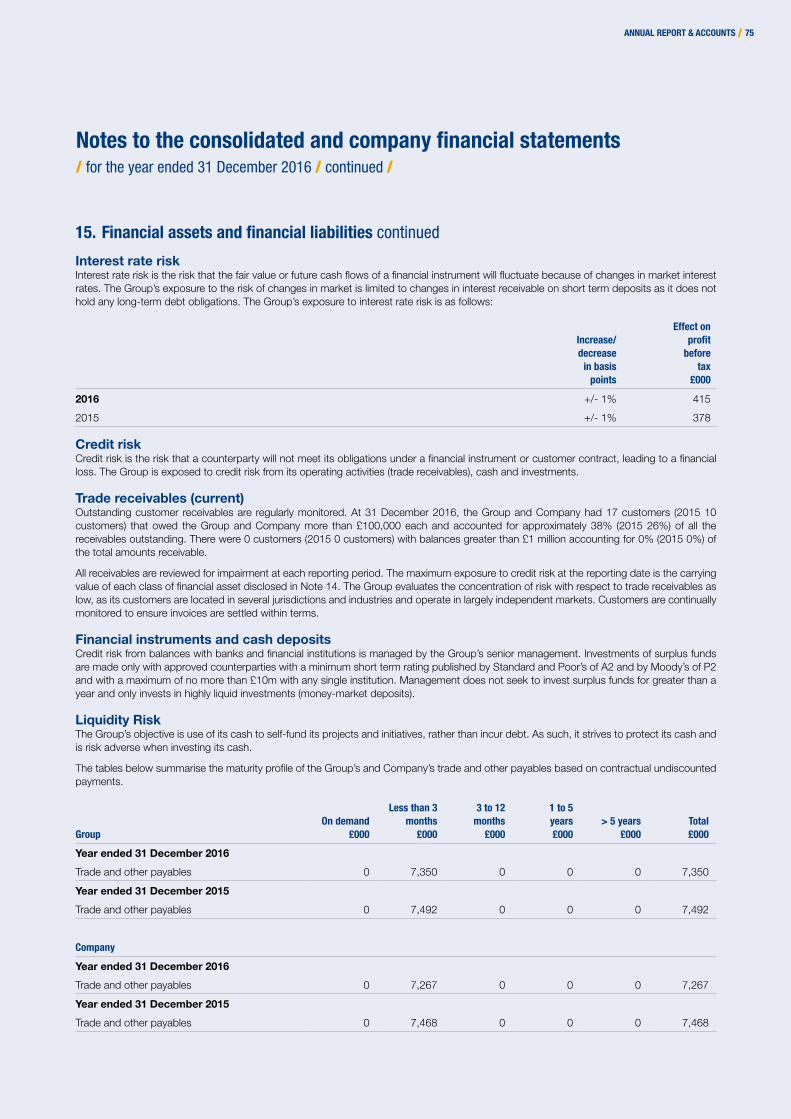
Notes to the consolidated and company financial statements / for the year ended 31 December 2016 / continued /
ANNUAL REPORT & ACCOUNTS / 75
15. Financial assets and financial liabilities continued
Interest rate riskInterest rate risk is the risk that the fair value or future cash flows of a financial instrument will fluctuate because of changes in market interest rates. The Group’s exposure to the risk of changes in market is limited to changes in interest receivable on short term deposits as it does not hold any long-term debt obligations. The Group’s exposure to interest rate risk is as follows:
Increase/decrease
in basispoints
Effect on profit
before tax
£000
2016 +/- 1% 415
2015 +/- 1% 378
Credit riskCredit risk is the risk that a counterparty will not meet its obligations under a financial instrument or customer contract, leading to a financial loss. The Group is exposed to credit risk from its operating activities (trade receivables), cash and investments.
Trade receivables (current)Outstanding customer receivables are regularly monitored. At 31 December 2016, the Group and Company had 17 customers (2015 10 customers) that owed the Group and Company more than £100,000 each and accounted for approximately 38% (2015 26%) of all the receivables outstanding. There were 0 customers (2015 0 customers) with balances greater than £1 million accounting for 0% (2015 0%) of the total amounts receivable.
All receivables are reviewed for impairment at each reporting period. The maximum exposure to credit risk at the reporting date is the carrying value of each class of financial asset disclosed in Note 14. The Group evaluates the concentration of risk with respect to trade receivables as low, as its customers are located in several jurisdictions and industries and operate in largely independent markets. Customers are continually monitored to ensure invoices are settled within terms.
Financial instruments and cash depositsCredit risk from balances with banks and financial institutions is managed by the Group’s senior management. Investments of surplus funds are made only with approved counterparties with a minimum short term rating published by Standard and Poor’s of A2 and by Moody’s of P2 and with a maximum of no more than £10m with any single institution. Management does not seek to invest surplus funds for greater than a year and only invests in highly liquid investments (money-market deposits).
Liquidity RiskThe Group’s objective is use of its cash to self-fund its projects and initiatives, rather than incur debt. As such, it strives to protect its cash and is risk adverse when investing its cash.
The tables below summarise the maturity profile of the Group’s and Company’s trade and other payables based on contractual undiscounted payments.
GroupOn demand
£000
Less than 3months
£000
3 to 12 months
£000
1 to 5 years£000
> 5 years£000
Total£000
Year ended 31 December 2016
Trade and other payables 0 7,350 0 0 0 7,350
Year ended 31 December 2015
Trade and other payables 0 7,492 0 0 0 7,492
Company
Year ended 31 December 2016
Trade and other payables 0 7,267 0 0 0 7,267
Year ended 31 December 2015
Trade and other payables 0 7,468 0 0 0 7,468
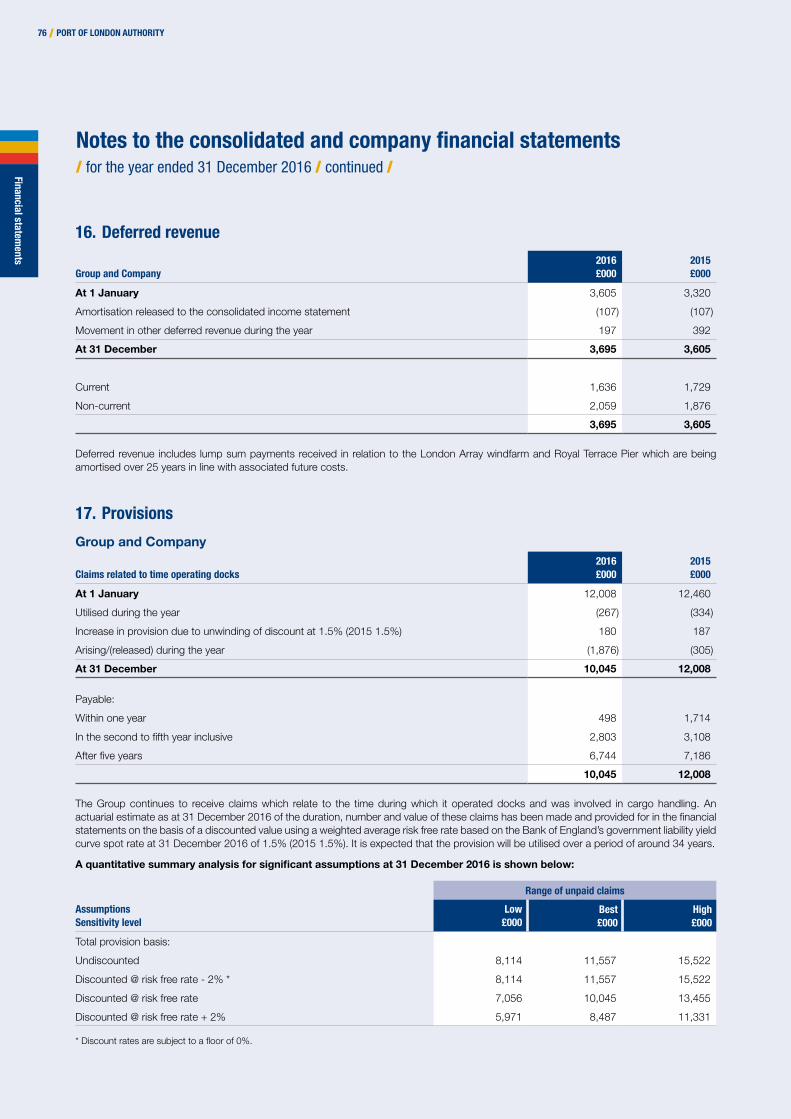
Notes to the consolidated and company financial statements / for the year ended 31 December 2016 / continued / Financial statem
ents
76 / PORT OF LONDON AUTHORITY
16. Deferred revenue
Group and Company2016£000
2015£000
At 1 January 3,605 3,320
Amortisation released to the consolidated income statement (107) (107)
Movement in other deferred revenue during the year 197 392
At 31 December 3,695 3,605
Current 1,636 1,729
Non-current 2,059 1,876
3,695 3,605
Deferred revenue includes lump sum payments received in relation to the London Array windfarm and Royal Terrace Pier which are being amortised over 25 years in line with associated future costs.
17. Provisions
Group and Company
Claims related to time operating docks2016£000
2015£000
At 1 January 12,008 12,460
Utilised during the year (267) (334)
Increase in provision due to unwinding of discount at 1.5% (2015 1.5%) 180 187
Arising/(released) during the year (1,876) (305)
At 31 December 10,045 12,008
Payable:
Within one year 498 1,714
In the second to fifth year inclusive 2,803 3,108
After five years 6,744 7,186
10,045 12,008
The Group continues to receive claims which relate to the time during which it operated docks and was involved in cargo handling. An actuarial estimate as at 31 December 2016 of the duration, number and value of these claims has been made and provided for in the financial statements on the basis of a discounted value using a weighted average risk free rate based on the Bank of England’s government liability yield curve spot rate at 31 December 2016 of 1.5% (2015 1.5%). It is expected that the provision will be utilised over a period of around 34 years.
A quantitative summary analysis for significant assumptions at 31 December 2016 is shown below:
AssumptionsSensitivity level
Range of unpaid claims
Low£000
Best£000
High£000
Total provision basis:
Undiscounted 8,114 11,557 15,522
Discounted @ risk free rate - 2% * 8,114 11,557 15,522
Discounted @ risk free rate 7,056 10,045 13,455
Discounted @ risk free rate + 2% 5,971 8,487 11,331
* Discount rates are subject to a floor of 0%.

Notes to the consolidated and company financial statements / for the year ended 31 December 2016 / continued /
ANNUAL REPORT & ACCOUNTS / 77
17. Provisions continued
Property related provision2016£000
2015£000
At 1 January 0 0
Utilised during the year 0 0
Arising / (released) during the year 1,046 0
At 31 December 1,046 0
Payable:
Within one year 755 0
In the second to fifth year inclusive 291 0
After five years 0 0
1,046 0
A property related liability of £1,046k has been calculated following advice. Given the uncertainty of the liability a provision has been provided, in previous years the liability was included in general accruals.
18. Commitments and contingencies
Operating lease commitments – Group and Company as lesseeThe Group and Company have entered into commercial leases for land & buildings and machinery & equipment. The land & building leases have an average life of 6 years and the machinery & equipment leases have an average life of 2 years. The minimum future lease rentals payable under non-cancellable operating leases as at 31 December 2016 and 2015 are as follows:
2016 2015
Landand
buildings£000
Other£000
Total£000
Land and
buildings£000
Other£000
Total£000
Total commitments under non-cancellable operating leases expiring:-
Within one year 253 29 282 266 26 292
In the second to fifth year inclusive 402 37 439 455 32 487
Over five years 1,192 0 1,192 960 0 960
1,847 66 1,913 1,681 58 1,739
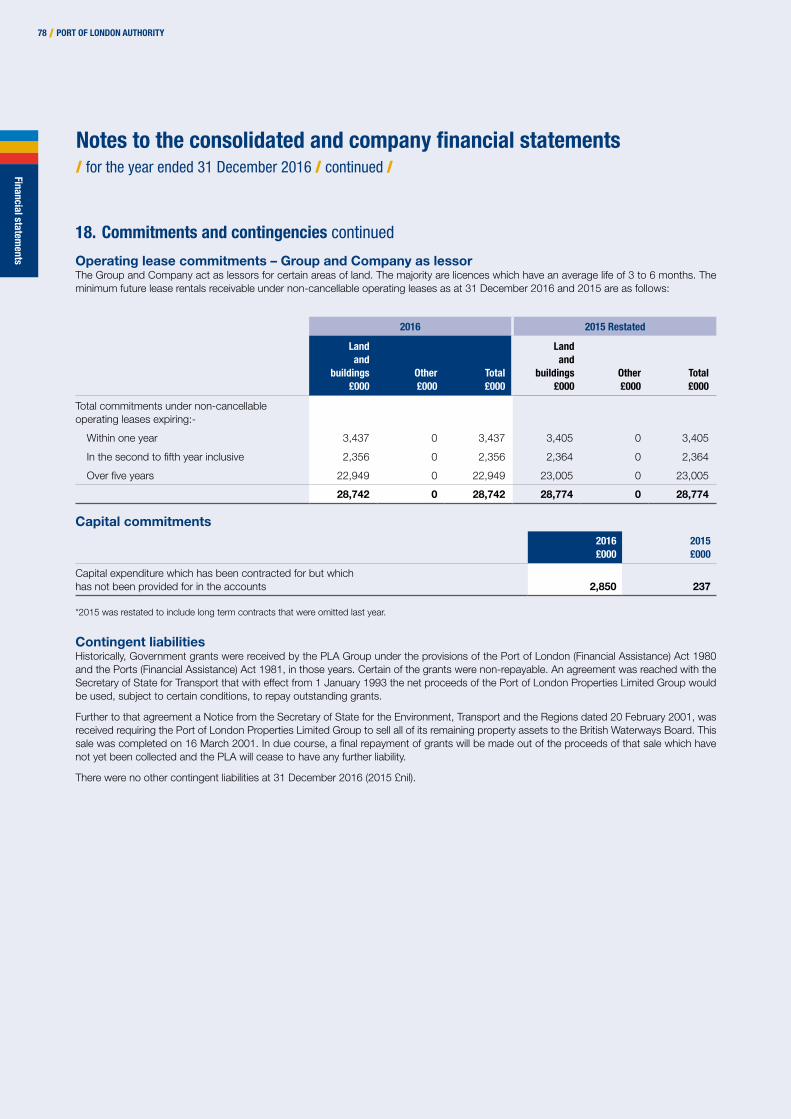
Notes to the consolidated and company financial statements / for the year ended 31 December 2016 / continued / Financial statem
ents
78 / PORT OF LONDON AUTHORITY
18. Commitments and contingencies continued
Operating lease commitments – Group and Company as lessorThe Group and Company act as lessors for certain areas of land. The majority are licences which have an average life of 3 to 6 months. The minimum future lease rentals receivable under non-cancellable operating leases as at 31 December 2016 and 2015 are as follows:
2016 2015 Restated
Landand
buildings£000
Other£000
Total£000
Land and
buildings£000
Other£000
Total£000
Total commitments under non-cancellable operating leases expiring:-
Within one year 3,437 0 3,437 3,405 0 3,405
In the second to fifth year inclusive 2,356 0 2,356 2,364 0 2,364
Over five years 22,949 0 22,949 23,005 0 23,005
28,742 0 28,742 28,774 0 28,774
Capital commitments2016£000
2015£000
Capital expenditure which has been contracted for but which has not been provided for in the accounts 2,850 237
*2015 was restated to include long term contracts that were omitted last year.
Contingent liabilitiesHistorically, Government grants were received by the PLA Group under the provisions of the Port of London (Financial Assistance) Act 1980 and the Ports (Financial Assistance) Act 1981, in those years. Certain of the grants were non-repayable. An agreement was reached with the Secretary of State for Transport that with effect from 1 January 1993 the net proceeds of the Port of London Properties Limited Group would be used, subject to certain conditions, to repay outstanding grants.
Further to that agreement a Notice from the Secretary of State for the Environment, Transport and the Regions dated 20 February 2001, was received requiring the Port of London Properties Limited Group to sell all of its remaining property assets to the British Waterways Board. This sale was completed on 16 March 2001. In due course, a final repayment of grants will be made out of the proceeds of that sale which have not yet been collected and the PLA will cease to have any further liability.
There were no other contingent liabilities at 31 December 2016 (2015 £nil).
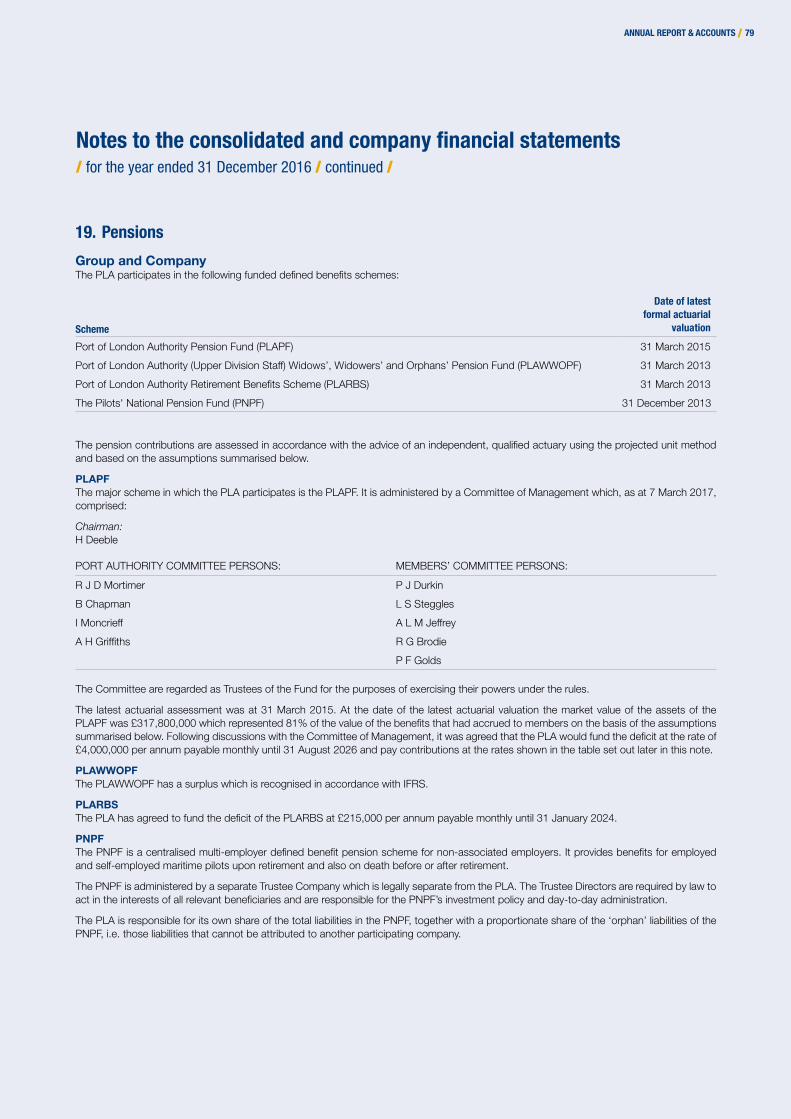
Notes to the consolidated and company financial statements / for the year ended 31 December 2016 / continued /
ANNUAL REPORT & ACCOUNTS / 79
19. Pensions
Group and CompanyThe PLA participates in the following funded defined benefits schemes:
Scheme
Date of latest formal actuarial
valuation
Port of London Authority Pension Fund (PLAPF) 31 March 2015
Port of London Authority (Upper Division Staff) Widows’, Widowers’ and Orphans’ Pension Fund (PLAWWOPF) 31 March 2013
Port of London Authority Retirement Benefits Scheme (PLARBS) 31 March 2013
The Pilots' National Pension Fund (PNPF) 31 December 2013
The pension contributions are assessed in accordance with the advice of an independent, qualified actuary using the projected unit method and based on the assumptions summarised below.
PLAPFThe major scheme in which the PLA participates is the PLAPF. It is administered by a Committee of Management which, as at 7 March 2017, comprised:
Chairman: H Deeble
PORT AUTHORITY COMMITTEE PERSONS: MEMBERS’ COMMITTEE PERSONS:
R J D Mortimer P J Durkin
B Chapman L S Steggles
I Moncrieff A L M Jeffrey
A H Griffiths R G Brodie
P F Golds
The Committee are regarded as Trustees of the Fund for the purposes of exercising their powers under the rules.
The latest actuarial assessment was at 31 March 2015. At the date of the latest actuarial valuation the market value of the assets of the PLAPF was £317,800,000 which represented 81% of the value of the benefits that had accrued to members on the basis of the assumptions summarised below. Following discussions with the Committee of Management, it was agreed that the PLA would fund the deficit at the rate of £4,000,000 per annum payable monthly until 31 August 2026 and pay contributions at the rates shown in the table set out later in this note.
PLAWWOPFThe PLAWWOPF has a surplus which is recognised in accordance with IFRS.
PLARBSThe PLA has agreed to fund the deficit of the PLARBS at £215,000 per annum payable monthly until 31 January 2024.
PNPFThe PNPF is a centralised multi-employer defined benefit pension scheme for non-associated employers. It provides benefits for employed and self-employed maritime pilots upon retirement and also on death before or after retirement.
The PNPF is administered by a separate Trustee Company which is legally separate from the PLA. The Trustee Directors are required by law to act in the interests of all relevant beneficiaries and are responsible for the PNPF’s investment policy and day-to-day administration.
The PLA is responsible for its own share of the total liabilities in the PNPF, together with a proportionate share of the ‘orphan’ liabilities of the PNPF, i.e. those liabilities that cannot be attributed to another participating company.

Notes to the consolidated and company financial statements / for the year ended 31 December 2016 / continued / Financial statem
ents
80 / PORT OF LONDON AUTHORITY
19. Pensions continuedAll SchemesThe results of the latest formal actuarial valuations have been updated to 31 December 2016 by a qualified independent actuary.
The principal assumptions used in determining pension benefit obligations for these plans are shown below:
PLA Schemes – Principal assumptions2016
%2015
%
Discount rate 2.6 3.6
RPI price inflation 3.4 3.1
CPI price inflation 2.4 2.1
Future salary increases 3.9 3.6
Future pension increases (RPI, min 3%, max 5%) 3.7 3.6
Future pension increases (RPI, max 5%) 3.3 3.0
Future pension increases (CPI, max 2.5%) 1.9 1.8
Years Years
Life expectation for pensioners at the age of 65:
Male 87.0 87.0
Female 89.1 89.0
PNPF – Principal assumptions2016
%2015
%
Discount rate 2.5 3.5
RPI price inflation 3.3 3.0
CPI price inflation 2.3 2.0
Future salary increases 3.8 3.5
Future pension increases (RPI, min 3%, max 5%) 3.7 3.5
Future pension increases (RPI, max 5%) 3.2 3.0
Years Years
Life expectation for pensioners at the age of 65:
Male 87.2 87.1
Female 89.2 88.8
PLAPF – Contribution ratesFrom 1 July 2016
%To 30 June 2016
%
For members who have entered into a salary sacrifice agreement with the PLA:
Higher rate members 22.70 20.10
Lower rate members 17.03 15.08
For members who have not entered into a salary sacrifice agreement with the PLA:
Higher rate members 15.13 13.40
Lower rate members 11.35 10.05

Notes to the consolidated and company financial statements / for the year ended 31 December 2016 / continued /
ANNUAL REPORT & ACCOUNTS / 81
2016£m
2015£m
In respect of the shortfall in funding:
Amount payable per annum in level monthly instalments until 31 August 2026 per the agreed recovery plan
4.0 4.0
Additional voluntary amounts paid by the PLA over and above the agreed recovery plan 0.0 1.0
Total deficit repairs during the year 4.0 5.0
All SchemesThe fair value of the major categories of plan assets are as follows:
At 31 December 2016PLAPF
£mPLAWWOPF
£mPLARBS
£mPNPF
£mTotal
£m
Multi assets credit 139.1 0.0 0.0 0.0 139.1
Equities 74.4 0.0 0.0 3.6 78.0
Hedge funds 67.5 0.0 0.0 3.2 70.7
Liability driven investments 39.8 0.0 0.0 0.0 39.8
Corporate bonds 0.0 6.3 0.9 7.0 14.2
Gilts 0.0 7.5 1.6 3.5 12.6
Diversified growth funds 0.0 5.9 0.0 3.4 9.3
Insurance policies 0.0 7.7 0.0 0.0 7.7
Infrastructure 11.9 0.0 0.0 0.0 11.9
Cash 8.6 0.0 0.0 0.5 9.1
Total 341.3 27.4 2.5 21.2 392.4
19. Pensions continued
At 31 December 2015PLAPF
£mPLAWWOPF
£mPLARBS
£mPNPF
£mTotal
£m
Multi assets credit 117.8 0.0 0.0 0.0 117.8
Equities 61.7 0.0 0.0 3.0 64.7
Hedge funds 58.5 0.0 0.0 3.3 61.8
Liability driven investments 34.0 0.0 0.0 0.0 34.0
Corporate bonds 0.0 5.4 0.9 7.6 13.9
Gilts 0.0 6.3 1.6 2.2 10.1
Diversified growth funds 0.0 5.7 0.0 3.1 8.8
Insurance policies 0.0 8.6 0.0 0.0 8.6
Infrastructure 7.8 0.0 0.0 0.0 7.8
Cash 17.9 0.0 0.0 0.3 18.2
Total 297.7 26.0 2.5 19.5 345.7
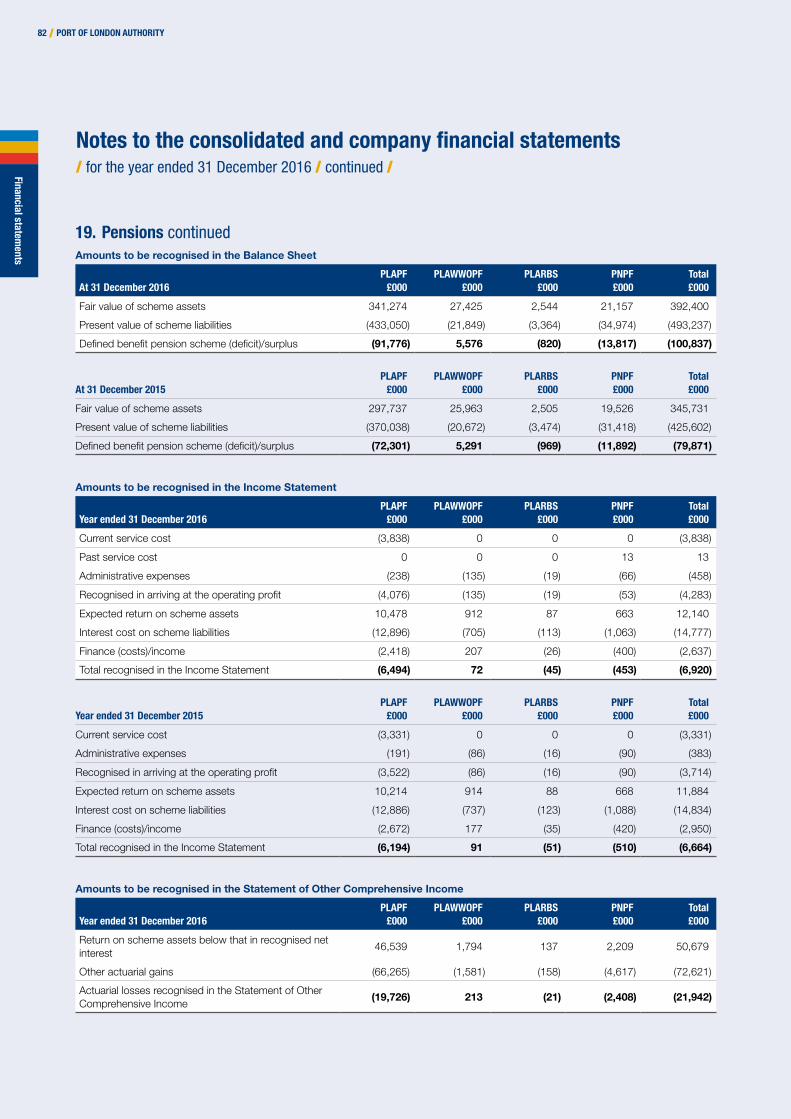
Notes to the consolidated and company financial statements / for the year ended 31 December 2016 / continued / Financial statem
ents
82 / PORT OF LONDON AUTHORITY
19. Pensions continuedAmounts to be recognised in the Balance Sheet
At 31 December 2016PLAPF
£000PLAWWOPF
£000PLARBS
£000PNPF£000
Total£000
Fair value of scheme assets 341,274 27,425 2,544 21,157 392,400
Present value of scheme liabilities (433,050) (21,849) (3,364) (34,974) (493,237)
Defined benefit pension scheme (deficit)/surplus (91,776) 5,576 (820) (13,817) (100,837)
At 31 December 2015PLAPF
£000PLAWWOPF
£000PLARBS
£000PNPF£000
Total£000
Fair value of scheme assets 297,737 25,963 2,505 19,526 345,731
Present value of scheme liabilities (370,038) (20,672) (3,474) (31,418) (425,602)
Defined benefit pension scheme (deficit)/surplus (72,301) 5,291 (969) (11,892) (79,871)
Amounts to be recognised in the Income Statement
Year ended 31 December 2016PLAPF
£000PLAWWOPF
£000PLARBS
£000PNPF£000
Total£000
Current service cost (3,838) 0 0 0 (3,838)
Past service cost 0 0 0 13 13
Administrative expenses (238) (135) (19) (66) (458)
Recognised in arriving at the operating profit (4,076) (135) (19) (53) (4,283)
Expected return on scheme assets 10,478 912 87 663 12,140
Interest cost on scheme liabilities (12,896) (705) (113) (1,063) (14,777)
Finance (costs)/income (2,418) 207 (26) (400) (2,637)
Total recognised in the Income Statement (6,494) 72 (45) (453) (6,920)
Year ended 31 December 2015PLAPF
£000PLAWWOPF
£000PLARBS
£000PNPF£000
Total£000
Current service cost (3,331) 0 0 0 (3,331)
Administrative expenses (191) (86) (16) (90) (383)
Recognised in arriving at the operating profit (3,522) (86) (16) (90) (3,714)
Expected return on scheme assets 10,214 914 88 668 11,884
Interest cost on scheme liabilities (12,886) (737) (123) (1,088) (14,834)
Finance (costs)/income (2,672) 177 (35) (420) (2,950)
Total recognised in the Income Statement (6,194) 91 (51) (510) (6,664)
Amounts to be recognised in the Statement of Other Comprehensive Income
Year ended 31 December 2016PLAPF
£000PLAWWOPF
£000PLARBS
£000PNPF£000
Total£000
Return on scheme assets below that in recognised net interest
46,539 1,794 137 2,209 50,679
Other actuarial gains (66,265) (1,581) (158) (4,617) (72,621)
Actuarial losses recognised in the Statement of Other Comprehensive Income
(19,726) 213 (21) (2,408) (21,942)

Notes to the consolidated and company financial statements / for the year ended 31 December 2016 / continued /
ANNUAL REPORT & ACCOUNTS / 83
19. Pensions continued
Year ended 31 December 2015PLAPF
£000PLAWWOPF
£000PLARBS
£000PNPF£000
Total£000
Return on scheme assets below that in recognised net interest
(6,734) (1,203) (72) (209) (8,218)
Other actuarial gains 17,326 1,638 205 660 19,829
Actuarial gains recognised in the Statement of Other Comprehensive Income
10,592 435 133 451 11,611
Changes in the present value of the defined benefits obligations are as follows:
PLAPF£000
PLAWWOPF£000
PLARBS£000
PNPF£000
Total£000
At 1 January 2015 (390,208) (22,714) (3,978) (32,988) (449,888)
Movement in the administrative reserve balance (191) (54) (16) 0 (261)
Current service cost (3,331) 0 0 0 (3,331)
Interest expense on defined benefits obligations (12,886) (737) (123) (1,088) (14,834)
Member's contributions (978) 0 0 0 (978)
Actuarial gains on scheme liabilities 17,326 1,638 205 660 19,829
Benefits paid 20,230 1,195 438 1,998 23,861
At 31 December 2015 and 1 January 2016 (370,038) (20,672) (3,474) (31,418) (425,602)
Movement in the administrative reserve balance (238) (68) (19) 0 (325)
Current service cost (3,838) 0 0 0 (3,838)
Past service cost 0 0 0 13 13
Interest expense on defined benefits obligations (12,896) (705) (113) (1,063) (14,777)
Members’ contributions (433) 0 0 0 (433)
Actuarial losses on scheme liabilities (66,265) (1,581) (158) (4,617) (72,621)
Benefits paid 20,658 1,177 400 2,111 24,346
At 31 December 2016 (433,050) (21,849) (3,364) (34,974) (493,237)
Changes in the fair value of plan assets are as follows:
PLAPF£000
PLAWWOPF£000
PLARBS£000
PNPF£000
Total£000
At 1 January 2015 306,547 27,479 2,712 20,250 356,988
Administration expenses 0 (32) 0 (90) (122)
Interest income on scheme assets 10,214 914 88 668 11,884
Actuarial losses on scheme assets (6,734) (1,203) (72) (209) (8,218)
Company contributions 6,962 0 215 905 8,082
Member's contributions 978 0 0 0 978
Benefits paid (20,230) (1,195) (438) (1,998) (23,861)
At 31 December 2015 and 1 January 2016 297,737 25,963 2,505 19,526 345,731
Administration expenses 0 (67) 0 (66) (133)
Interest income on scheme assets 10,478 912 87 663 12,140
Actuarial gains on scheme assets 46,539 1,794 137 2,209 50,679
Company contributions 6,745 0 215 936 7,896
Members’ contributions 433 0 0 0 433
Benefits paid (20,658) (1,177) (400) (2,111) (24,346)
At 31 December 2016 341,274 27,425 2,544 21,157 392,400
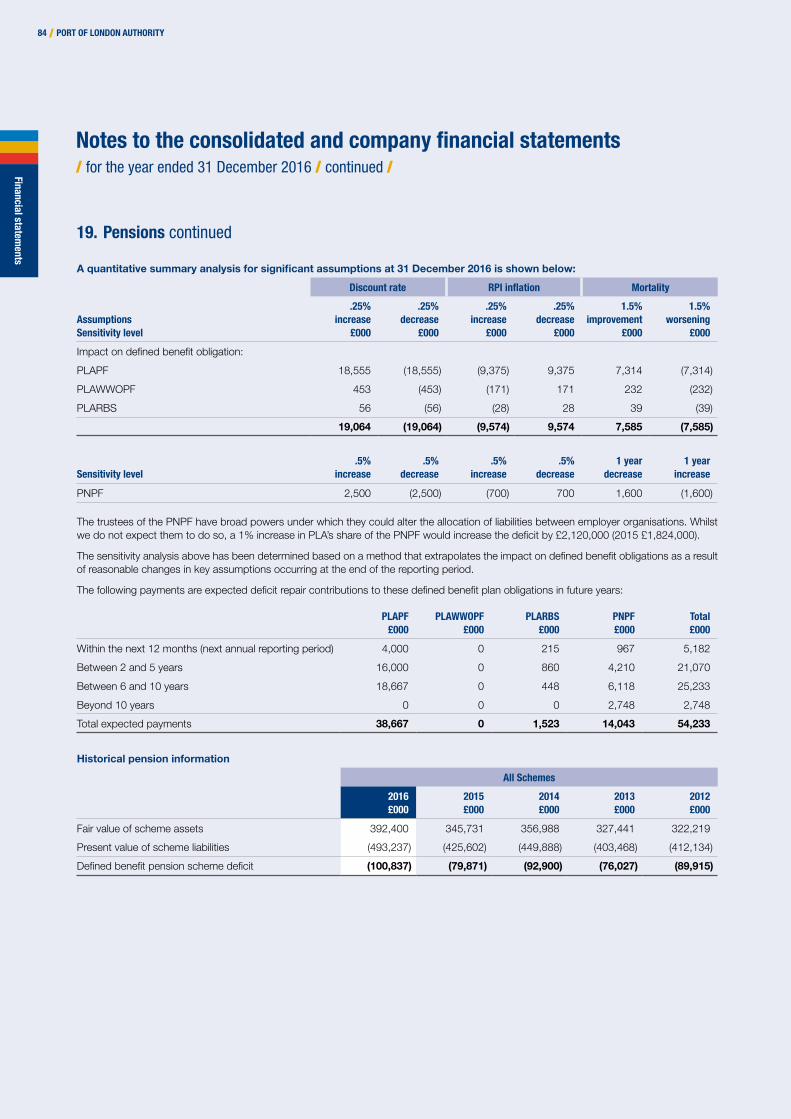
Financial statements
84 / PORT OF LONDON AUTHORITY
Notes to the consolidated and company financial statements / for the year ended 31 December 2016 / continued /
19. Pensions continued
A quantitative summary analysis for significant assumptions at 31 December 2016 is shown below:
Discount rate RPI inflation Mortality
AssumptionsSensitivity level
.25% increase
£000
.25% decrease
£000
.25% increase
£000
.25% decrease
£000
1.5% improvement
£000
1.5% worsening
£000
Impact on defined benefit obligation:
PLAPF 18,555 (18,555) (9,375) 9,375 7,314 (7,314)
PLAWWOPF 453 (453) (171) 171 232 (232)
PLARBS 56 (56) (28) 28 39 (39)
19,064 (19,064) (9,574) 9,574 7,585 (7,585)
Sensitivity level.5%
increase.5%
decrease.5%
increase.5%
decrease1 year
decrease1 year
increase
PNPF 2,500 (2,500) (700) 700 1,600 (1,600)
The trustees of the PNPF have broad powers under which they could alter the allocation of liabilities between employer organisations. Whilst we do not expect them to do so, a 1% increase in PLA’s share of the PNPF would increase the deficit by £2,120,000 (2015 £1,824,000).
The sensitivity analysis above has been determined based on a method that extrapolates the impact on defined benefit obligations as a result of reasonable changes in key assumptions occurring at the end of the reporting period.
The following payments are expected deficit repair contributions to these defined benefit plan obligations in future years:
PLAPF£000
PLAWWOPF£000
PLARBS£000
PNPF£000
Total£000
Within the next 12 months (next annual reporting period) 4,000 0 215 967 5,182
Between 2 and 5 years 16,000 0 860 4,210 21,070
Between 6 and 10 years 18,667 0 448 6,118 25,233
Beyond 10 years 0 0 0 2,748 2,748
Total expected payments 38,667 0 1,523 14,043 54,233
Historical pension information
All Schemes
2016£000
2015£000
2014£000
2013£000
2012£000
Fair value of scheme assets 392,400 345,731 356,988 327,441 322,219
Present value of scheme liabilities (493,237) (425,602) (449,888) (403,468) (412,134)
Defined benefit pension scheme deficit (100,837) (79,871) (92,900) (76,027) (89,915)

Notes to the consolidated and company financial statements / for the year ended 31 December 2016 / continued /
ANNUAL REPORT & ACCOUNTS / 85
20. Capital managementFor the purpose of the Group and Company’s capital management, capital includes the net assets of the Group and Company. The primary objective of the Group and Company’s capital management is to effectively use its capital to fulfil its charter in ensuring 1) safe navigation on the river, 2) conserving the environment of the river, 3) supporting the development of the use of the river and 4) forming a partnership with river users and accountability to stakeholders. The Company has had a significant increase in net liabilities relating to the PLA pension fund. The Company has an agreed long-term programme to reduce the pension deficit, this agreed by pension trustees and the pension regulator. Cashflow forecasts show we can accommodate the capital commitments to maintain the business, maintain adequate working capital and make the deficit repayments.
In order to meet its overall objectives the Group and Company’s capital management is risk adverse and aims to protect its cash as much as possible. This means that PLA keeps its cash to self fund its projects, initiatives and long term liabilities. In doing so the Group and Company aim to have as little debt as possible. The Group currently has net liabilities of £322,000 (2015 net assets £11,178,000). The Group and Company do not have any financial covenants that they are required to comply with.
21. Related party transactionsNote 1 above provides the information about the Group’s structure including the details of the subsidiary and joint venture. The following table provides the total amount of transactions that have been entered into with related parties for the relevant financial year.
Group
Sales to related parties
£000
Purchases from related
parties£000
Board members
remuneration£000
Amounts owed by related
parties£000
Amounts owed to
related parties£000
Subsidiary
2016 0 0 0 0 0
2015 101 0 0 0 0
Joint venture
2016 158 2,523 0 0 179
2015 157 2,160 0 0 182
Key management personnel of the Group
2016 0 0 687 0 0
2015 0 0 691 0 0
Company
Sales to related parties
£000
Purchases from related
parties£000
Board members
remuneration£000
Amounts owed by related
parties£000
Amounts owed to
related parties£000
Subsidiary
2016 0 0 0 0 0
2015 101 0 0 0 0
Joint venture
2016 158 2,523 0 0 179
2015 157 2,160 0 0 182
Key management personnel of the Group
2016 0 0 687 0 0
2015 0 0 691 0 0

86 / PORT OF LONDON AUTHORITY86 / PORT OF LONDON AUTHORITY
Notes to the consolidated and company financial statements / for the year ended 31 December 2016 / continued / Financial statem
ents
21. Related party transactions continuedTerms and conditions of transactions with related partiesOutstanding balances at the year end are unsecured and interest free and settlement occurs in cash. There have been no guarantees provided or received for any related party receivables or payables. For the year ended 31 December 2016, the Group has not recorded any impairment of receivables relating to amounts owed by related parties (2015 £Nil). This assessment is undertaken each financial year through examining the financial position of the related party and the market in which the related party operates.
During the year the PLA provided administration and management services to Port of London Properties Limited for which it charged £102,000 (2015 £101,000).
During the year the PLA provided administration and management services to Estuary Services Limited for which it charged £158,000 (2015 £157,000) and was charged £2,523,000 (2015 £2,160,000) for boarding and landing services. At 31 December 2016 the PLA owed £179,000 (2015 £182,000) to Estuary Services Limited for unpaid boarding and landing services received.
Members of the PLA Board are the key management personnel of the Group. See page 43.

ANNUAL REPORT & ACCOUNTS / 87 ANNUAL REPORT & ACCOUNTS / 87
Statement of Members’ responsibilities / in respect of the annual report and the financial statements /
The members are responsible for preparing the Annual Report and Accounts in accordance with applicable law and regulations.
The members of the PLA are required to prepare financial statements for each financial year which give a true and fair view of the state of affairs of the PLA and of the profit or loss of the PLA for that period. In preparing those financial statements, the members are required to:
• present fairly the financial position, financial performance and cash flows of the group and company;
• select suitable accounting policies in accordance with IAS8: Accounting policies, changes in accounting estimates and errors, and then apply them consistently;
• make judgements that are reasonable;
• present information, including accounting policies, in a manner that provides relevant, reliable, comparable and understandable information;
• provide additional disclosures when compliance with the specific requirements in IFRSs as adopted by the European Union is insufficient to enable users to understand the impact of particular transactions, other events and conditions on the group and company’s financial position and financial performance;
• prepare the financial statements on the going concern basis unless it is inappropriate to presume that the PLA will continue in business, in which case there should be supporting assumptions or qualifications as necessary; and
• state that the group and company has complied with IFRSs as adopted by the European Union, subject to any material departures disclosed and explained in the financial statements.
The members confirm that they have complied with the above requirements in preparing the financial statements.
The members are responsible for keeping proper accounting records that disclose with reasonable accuracy at any time the financial position of the PLA and enable them to ensure that the financial statements comply with Section 42 of the Harbours Act 1964, as amended by the Transport Act 1981. They are also responsible for safeguarding the assets of the PLA and hence for taking reasonable steps for the prevention and detection of fraud and other irregularities.
The members are responsible for the maintenance and integrity of the corporate and financial information included on the PLA’s website. Legislation in the United Kingdom governing the preparation and dissemination of financial statements may differ from legislation in other jurisdictions.

88 / PORT OF LONDON AUTHORITY88 / PORT OF LONDON AUTHORITY
Independent Auditor’s Report to the Members of Port of London Authority / for the year ended 31 December 2016 /Financial statem
ents
We have audited the financial statements of Port of London Authority for the year ended 31 December 2016 which comprise the consolidated income statement, consolidated statement of other comprehensive income, consolidated and company balance sheets, consolidated and company statements of changes in equity, consolidated and company statements of cash flows and the related notes 1 to 21. The financial reporting framework that has been applied in their preparation is applicable law and International Financial Reporting Standards (IFRSs) as adopted by the European Union.
This report is made solely to the Port of London Authority’s members, as a body, in accordance with the Harbours Act 1964, as amended by the Transport Act 1981. Our audit work has been undertaken so that we might state to the Port of London Authority’s members those matters we are required to state to them in an auditor’s report and for no other purpose. To the fullest extent permitted by law, we do not accept or assume responsibility to anyone other than the company and the company’s members as a body, for our audit work, for this report, or for the opinions we have formed.
Respective responsibilities of the members of the Port of London Authority and auditorAs explained more fully in the Statement of members’ responsibilities on page 87, the directors are responsible for the preparation of the financial statements and for being satisfied that they give a true and fair view. Our responsibility is to audit and express an opinion on the financial statements in accordance with applicable law and International Standards on Auditing (UK and Ireland). Those standards require us to comply with the Auditing Practices Board’s Ethical Standards for Auditors.
Scope of the audit of the financial statementsAn audit involves obtaining evidence about the amounts and disclosures in the financial statements sufficient to give reasonable assurance that the financial statements are free from material misstatement, whether caused by fraud or error. This includes an assessment of: whether the accounting policies are appropriate to the group’s and the parent company’s circumstances and have been consistently applied and adequately disclosed; the reasonableness of significant accounting estimates made by the directors; and the overall presentation of the financial statements. In addition, we read all the financial and non-financial information in the Annual report and accounts to identify material inconsistencies with the audited financial statements and to identify any information that is apparently materially incorrect based on, or materially inconsistent with, the knowledge acquired by us in the course of performing the audit. If we become aware of any apparent material misstatements or inconsistencies we consider the implications for our report.
Opinion on financial statementsIn our opinion the financial statements:
• give a true and fair view of the state of the group’s and of the company’s affairs as at 31 December 2016 and of the group’s profit for the year then ended;
• have been properly prepared in accordance with IFRSs as adopted by the European Union;
• have been prepared in accordance with the requirements of the Harbours Act 1964, as amended by the Transport Act 1981.
Ernst & Young LLP, Statutory AuditorLondon20 March 2017
Photos by:Samuel Ashfield
Paul ErlamBen Fitzpatrick
Alistair GaleJason Hawkes
TidewayAndy Wallace
Mike RobinsonViking Cruises
Paul HymanWayne McCabe
Carmen CompanyMetal
Adam Cowell

PINNACLE HOUSE23-26 St Dunstan’s HillLondon, EC3R 8HN
LONDON RIVER HOUSERoyal Pier RoadGravesend, Kent, DA12 2BG
T / +44 (01474) 562200
F / +44 (01474) 562281
W / WWW.PLA.CO.UK @LondonPortAuth