2016-2017 Ice Boom Report-Final - IJC
28
2016-2017 Operation of the Lake Erie – Niagara River Ice Boom A report to the International Niagara Board of Control by the International Niagara Working Committee October 2017
Transcript of 2016-2017 Ice Boom Report-Final - IJC

2016-2017 Operation of the Lake Erie – Niagara River Ice Boom A report to the International Niagara Board of Control by the International Niagara Working Committee
October 2017

i
Report to
The International Niagara Board of Control On The 2016–17 Operation of
The Lake Erie–Niagara River Ice Boom By the International Niagara Working Committee
October 2017

ii
TABLE OF CONTENTS
1. PURPOSE .................................................................................................................................................................. 1
2. HIGHLIGHTS ............................................................................................................................................................. 1
3. HYDROMETEOROLOGICAL AND ICE CONDITIONS ............................................................................................ 2
4. OPERATION OF THE ICE BOOM DURING THE 2016–17 ICE SEASON .............................................................. 34.1 Installation of the Boom ................................................................................................................................ 3 4.2 Ice Boom Operation ...................................................................................................................................... 4 4.3 Ice Boom Opening ........................................................................................................................................ 4 4.4 Ice Boom Maintenance ................................................................................................................................. 5
5. POWER LOSSES, FLOODING, AND NAVIGATION DURINGTHE 2016–17 ICE SEASON .................................. 55.1 Estimated Power Losses .............................................................................................................................. 5 5.2 Niagara River Shore Flooding and Property Damages ................................................................................ 5 5.3 Navigation at the Welland Canal .................................................................................................................. 5
6. FINDINGS, CONCLUSIONS AND RECOMMENDATIONS ...................................................................................... 56.1 Findings and Conclusions ............................................................................................................................ 5 6.2 Recommendations for the 2017–18 Operation ............................................................................................ 6
Appendix A – Description of the Lake Erie-Niagara River Area .............................................................................. 14 A.1 Hydraulics and Hydrology .......................................................................................................................... 14
(a) Upper Niagara River ............................................................................................................................ 14 (b) Niagara Cascades and Falls ............................................................................................................... 14 (c) Lower Niagara River ............................................................................................................................ 14
A.2 Hydro-Electric Installations and Remedial Works ...................................................................................... 14 A.3 Other Shore Installations ............................................................................................................................ 15 A.4 Ice Problems .............................................................................................................................................. 15
Appendix B – Background Information on the Ice Boom ......................................................................................... 16 B.1 Authorization for Placement of the Ice Boom ............................................................................................. 16 B.2 Purpose of the Ice Boom ............................................................................................................................ 16 B.3 Description of the Ice Boom ....................................................................................................................... 16
iii
LIST OF FIGURES
Figure 1: MODIS Satellite Imagery from NOAA, 1 February 2017 ............................................................................. 1
Figure 2: Single Season: Weekly Ice Coverage for 2016/17 ..................................................................................... 3
Figure 3: Multiple Season: Weekly Ice Coverage for 2013/14 to 2016/17 ................................................................ 3
Figure 4: Ice Thickness Measurements Flight Locations.......................................................................................... 3
Figure 5: Span E shown open and trailing from Ice Boom Camera ......................................................................... 5
LIST OF TABLES
Table 1: Air Temperature at Buffalo Niagara International Airport ........................................................................... 7
Table 2: Lake Erie Water Temperatures as Recorded at the Buffalo Intake (Dec 2016 - May 2017)* ..................... 8
Table 3: Observed Dates of Last Ice 1905 to Present ................................................................................................. 9
Table 4: Dates Water Temperature Reached 4°C (39°F) and Dates of Ice Boom Installation ............................... 10
Table 5: Comparison of Ice Areas Near Time of Ice Boom Opening ....................................................................... 11
Table 6: Estimated Power Losses In MW-hours Due to Ice for Period of Record 1975 to Present ..................... 12
Table 7: Ice Boom and Welland Canal Opening Dates ............................................................................................... 13
LIST OF ENCLOSURES
Enclosure 1: Great Lakes – St. Lawrence Drainage Basin ...................................................................................... 17
Enclosure 2: Niagara River Water Level Gauge Locations ..................................................................................... 18
Enclosure 3: NYPA and OPG Power Projects .......................................................................................................... 19
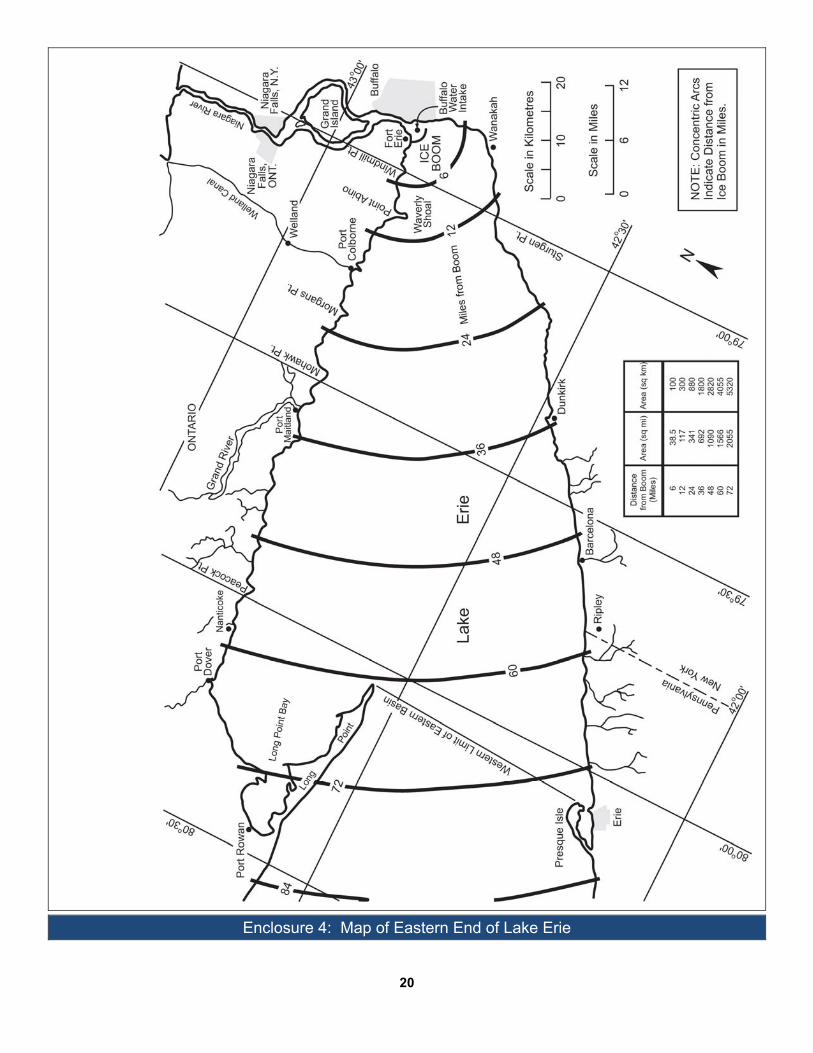
Enclosure 4: Map of Eastern End of Lake Erie ......................................................................................................... 20
Enclosure 5: Ice Boom Detail ..................................................................................................................................... 21
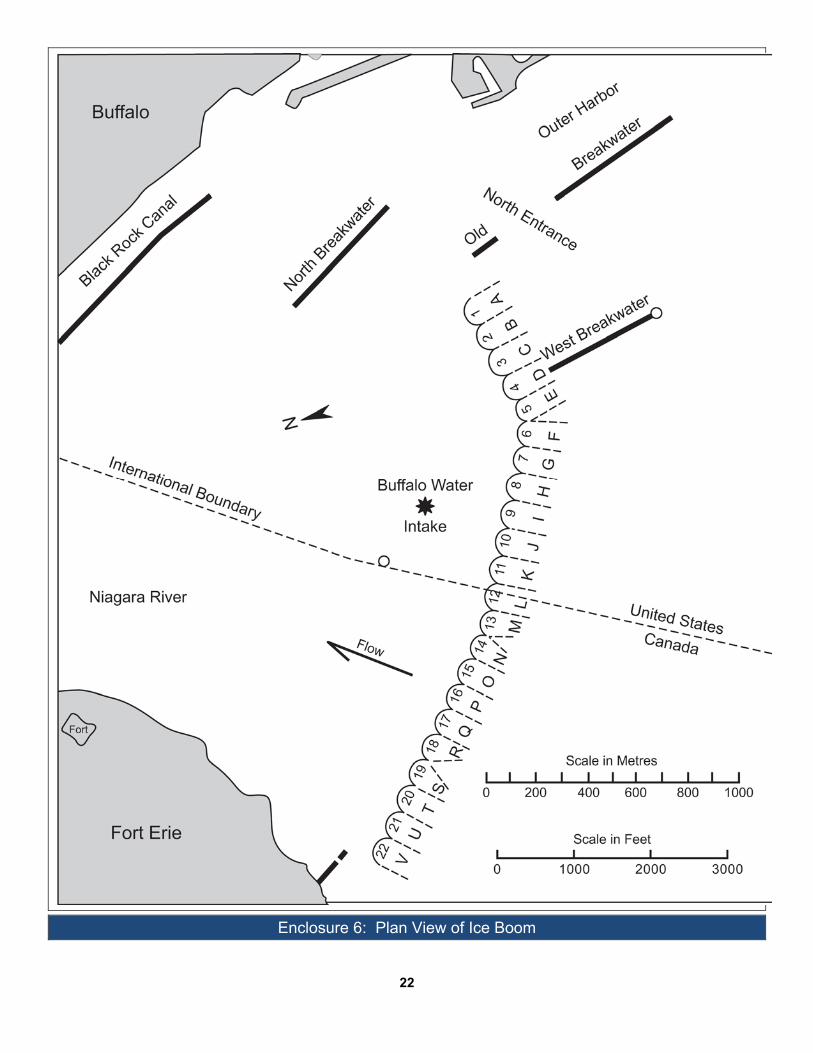
Enclosure 6: Plan View of Ice Boom .......................................................................................................................... 22
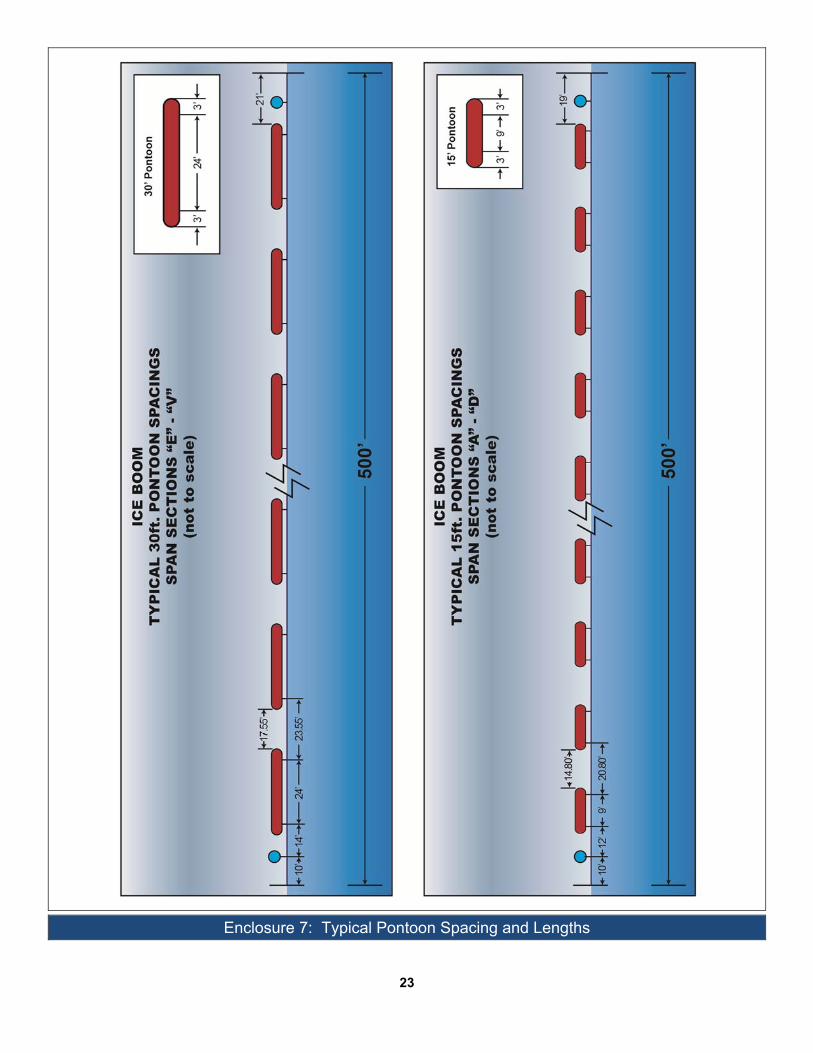
Enclosure 7: Typical Pontoon Spacing and Lengths .............................................................................................. 23 This report is available in electronic format at the International Niagara Board of Control web site: http://www.ijc.org/en_/inbc/reports
1
1. PURPOSEThe Lake Erie–Niagara River Ice Boom (ice boom) reduces the amount of ice passing from Lake Erie to the Niagara River. This prevents ice blockages from reducing hydropower production and reduces ice damage to shoreline property. The Power Entities, New York Power Authority (NYPA) and Ontario Power Generation (OPG) are authorized by the International Joint Commission (IJC) to use the ice boom. The International Niagara Board of Control (the Board) oversees the installation, operation and removal of the ice boom. This report is prepared by the Board’s International Niagara Working Committee (INWC) based on information provided by the Power Entities. Information collected by the INWC is used to inform the Board of ice boom operation for the 2016-2017 ice season. Further description of the Lake Erie–Niagara River system can be found in Appendix A.
2. HIGHLIGHTSThe winter of 2016–2017 was one of the warmest winters recorded for the Buffalo/Niagara area. Temperatures were above average for all months with the exception of March 2017.
In accordance with condition (d) of the International Joint Commission Order of Approval, installation of the Lake Erie-Niagara River ice boom may begin when the Lake Erie water temperature reaches 4°C (39°F) or on 16 December, whichever occurs first. The water temperature, as measured at the Buffalo Water Intake, did not reach 4°C (39°F) until 15 December 2016. However, installation of the Lake Erie-Niagara River Ice Boom did not commence until 17 December 2016 due to high wave activity on Lake Erie.
On 17 December 2016 ice boom crews began installation of the ice boom’s 22 spans and completed installation on 22 December 2016.
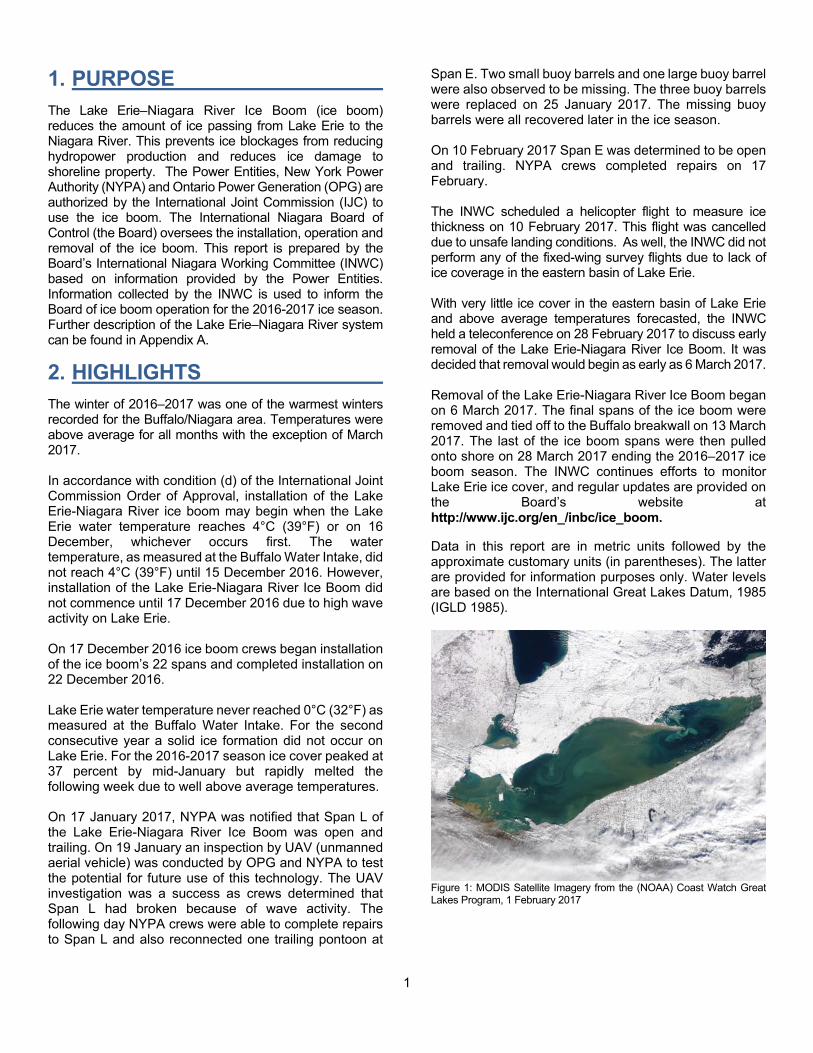
Lake Erie water temperature never reached 0°C (32°F) as measured at the Buffalo Water Intake. For the second consecutive year a solid ice formation did not occur on Lake Erie. For the 2016-2017 season ice cover peaked at 37 percent by mid-January but rapidly melted the following week due to well above average temperatures.
On 17 January 2017, NYPA was notified that Span L of the Lake Erie-Niagara River Ice Boom was open and trailing. On 19 January an inspection by UAV (unmanned aerial vehicle) was conducted by OPG and NYPA to test the potential for future use of this technology. The UAV investigation was a success as crews determined that Span L had broken because of wave activity. The following day NYPA crews were able to complete repairs to Span L and also reconnected one trailing pontoon at
Span E. Two small buoy barrels and one large buoy barrel were also observed to be missing. The three buoy barrels were replaced on 25 January 2017. The missing buoy barrels were all recovered later in the ice season.
On 10 February 2017 Span E was determined to be open and trailing. NYPA crews completed repairs on 17 February.
The INWC scheduled a helicopter flight to measure ice thickness on 10 February 2017. This flight was cancelled due to unsafe landing conditions. As well, the INWC did not perform any of the fixed-wing survey flights due to lack of ice coverage in the eastern basin of Lake Erie.
With very little ice cover in the eastern basin of Lake Erie and above average temperatures forecasted, the INWC held a teleconference on 28 February 2017 to discuss early removal of the Lake Erie-Niagara River Ice Boom. It was decided that removal would begin as early as 6 March 2017.
Removal of the Lake Erie-Niagara River Ice Boom began on 6 March 2017. The final spans of the ice boom were removed and tied off to the Buffalo breakwall on 13 March 2017. The last of the ice boom spans were then pulled onto shore on 28 March 2017 ending the 2016–2017 ice boom season. The INWC continues efforts to monitor Lake Erie ice cover, and regular updates are provided on the Board’s website at http://www.ijc.org/en_/inbc/ice_boom.
Data in this report are in metric units followed by the approximate customary units (in parentheses). The latter are provided for information purposes only. Water levels are based on the International Great Lakes Datum, 1985 (IGLD 1985).
Figure 1: MODIS Satellite Imagery from the (NOAA) Coast Watch Great Lakes Program, 1 February 2017

2
3. HYDROMETEOROLOGICALAND ICE CONDITIONS
During the winter of 2016-2017, the INWC continued its program of collecting data and information related to ice boom operations. These data were used to monitor conditions of the ice boom and Lake Erie, as well as determining the installation and removal dates of the ice boom. As part of the program, satellite imagery and mapping were analyzed, and meteorological data from the U.S. National Weather Service Station at Buffalo were collected.
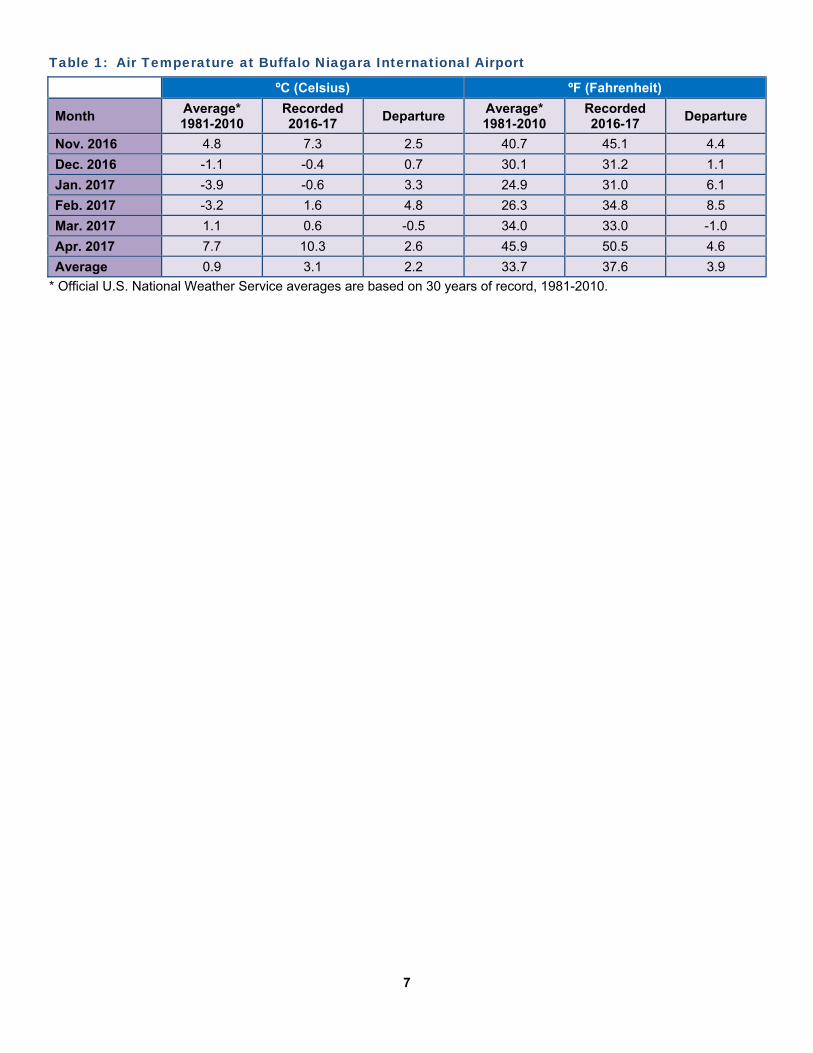
The average monthly air temperature data for November 2016 through April 2017, as measured by the National Weather Service at the Buffalo Niagara International Airport, are displayed in Table 1.
November 2016 was a mild month with an average temperature of 7.3°C (45.1°F), making it the 8th warmest November on record. Buffalo temperature records date back to 1871. The month began with an extended rain event on 2 and 3 November 2016 as a slow moving cold front passed across the region. The first sub-freezing temperatures were experienced on 20 November 2016 as 2.3 cm (0.9 in) of snow fell, marking the first measurable snowfall of the winter of 2016-2017. The month of November ended with thunderstorms, bringing the total precipitation for the month to 8.6 cm (3.4 in), below the average of 10.2 cm (4.0 in). With above average temperatures for September, October and November, the autumn season of 2016 was the third warmest on record.
The mild temperatures persisted into the beginning of December before a strong cold front moved into the Buffalo/Niagara Region on 8 December 2016. From 11 to 19 December 2016, 64.5 cm (25.4 in) of lake effect snow fell in Buffalo before temperatures began to rise. By Christmas, temperatures were well above normal with a daily record of 14.4°C (58.0°F) being set on 26 December breaking the old record of 12.8°C (55.0°F) set back in 1982. Temperatures returned to normal by the end of the year with another lake effect snow event dropping several inches at the end of 2016. The average temperature for December 2016 was -0.4°C (31.2°F) which is 0.7°C (1.1°F) above normal.
The New Year began with temperatures slowly rising above freezing before a cold front moved into the Buffalo/Niagara Region on 4 January 2017. This would be the only prolonged cold spell for the month as temperatures rose to above freezing again on 10 January 2017 and continued until the end of the month. Precipitation for the month of January was below normal with 7.4 cm (2.9 in) total for the month compared to the average of 8.1 cm (3.2 in). The average temperature for January 2017 was -0.6°C (31.0°F), placing it 3.3°C (6.1°F) above normal.
February 2017 will go down as the warmest February on record for the Buffalo/Niagara Region. Just two years after the coldest recorded February in 2015. The average temperature for February 2017 was 1.6°C (34.8°F), which is 4.8°C (8.5°F) above average for the month and 8.3°C (15.0°F) warmer than two years prior. On 24 February 2017 the record for warmest February day was tied as the mercury climbed to 21.7°C (71.0°F), tying the previous record set back in 2000. Total precipitation for the month was below normal with only 12.7 cm (5.0 in) of snow falling. This makes February 2017 the fifth least snowiest on record.
As March 2017 began a windy cold front moved into the area. The average temperature for March was recorded at 0.6°C (33.0°F) which was colder than February for just the 11th time on record. On 5 March the temperature dropped to -13.9°C (7.0°F) before milder temperatures returned by the end of the week. Precipitation for March totaled 11.2 cm (4.4 in), with 68.1 cm (26.8 in) of total snowfall making March 2017 the 7th snowiest on record.
Above average temperatures returned for April 2017. The average temperature for the month was 10.3°C (50.5°F), which is the 6th warmest April on record. Close to the record set back in 1921 of 10.7°C (51.3°F). Total precipitation was measured at 16.3 cm (6.4 in) for the month. The total precipitation for March-April 2017 was 27.2 cm (10.7 in). This is the second wettest March-April since 1991 which saw 30.0 cm (11.8 in).
Total snowfall from November 2016 to April 2017 was 193.3 cm (76.1 in) as recorded at the Buffalo Niagara International Airport, which is 46.0 cm (18.1 in) below normal. The average temperature for the six-month period was 2.2°C (3.9°F) above the long term average.
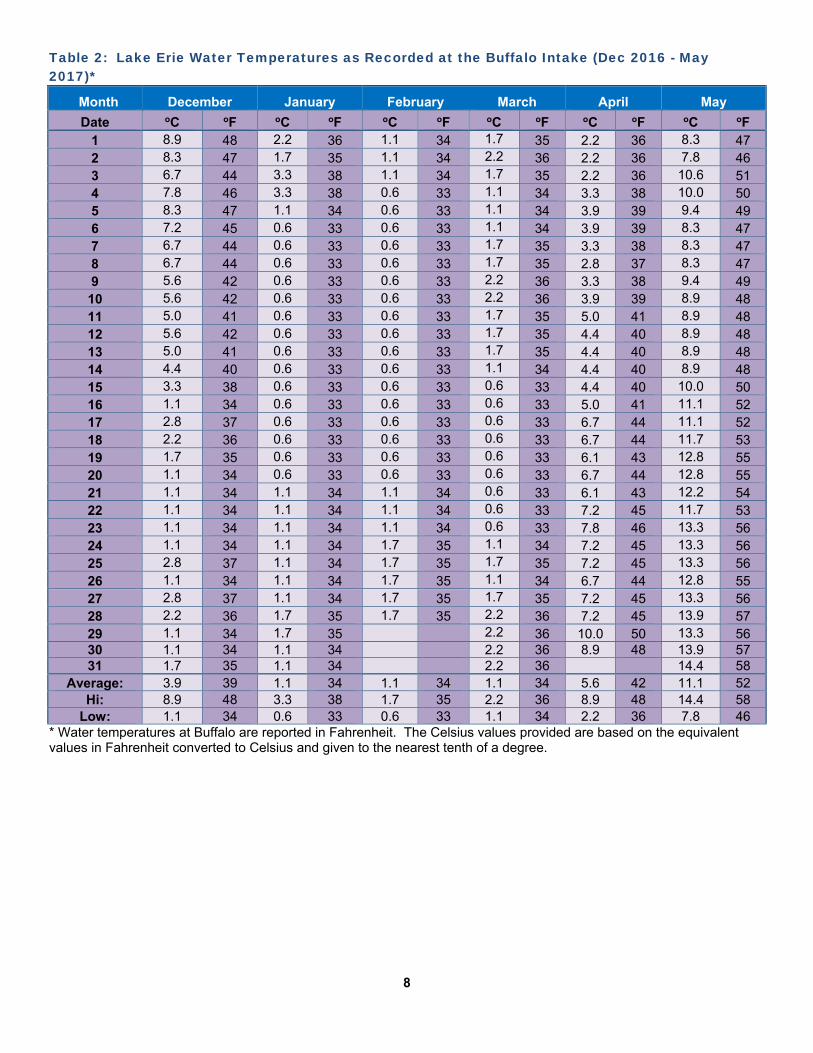
The daily Lake Erie water temperature, as measured at the Buffalo Water Intake, for the period December 2016 through May 2017, are provided in Table 2. Lake Erie water temperature dropped to 4.0°C (39.0°F) on 15 December 2016.
The first ice of the season was observed in the Chippewa Grass Island Pool on 8 January 2017. As shown in Figure 2, ice coverage on Lake Erie peaked at 37 percent mid-January as reported by the Canadian Ice Service. Figure 3 displays the extreme difference in ice coverage for Lake Erie over the last four years beginning with the 2013/14 ice season thru the 2016/17 ice season.
Based on available satellite imagery and information provided by the Canadian Ice Service, the date of last ice was determined as 17 March 2017. Historical dates of last ice can be seen in Table 3.

3
Figure 2: Single Season: Weekly Ice Coverage for 2016/17 provided by the Canadian Ice Service
Figure 3: Multiple Season Ice Coverage from 2013/14 to 2016/17 provided by the Canadian Ice Service
The INWC typically carries out two helicopter flights for ice thickness measurements, and various fixed wing flights for lake ice area assessment in the eastern basin of Lake Erie. These flights, supplemented by ice information available from satellite imagery, are used to make decisions on the operation and removal of the Lake Erie-Niagara River Ice Boom. The helicopter flight scheduled for 10 February 2017 was cancelled due to a lack of ice and unsafe landing conditions. With above average temperatures and a lack of ice build-up, no other helicopter or fixed wing flights were deemed necessary by the Board’s Working Committee for the remainder of the 2016/17 season. Figure 4 shows the six ice thickness measurement locations.
Figure 4: Typical Locations of Ice Thickness Measurement Points.
4. OPERATION OF THE ICEBOOM DURING THE 2016–17ICE SEASON
The following sections provide a description of key operations of the ice boom in the 2016-17 ice season as they relate to the Order of Approval. Further background information on the ice boom can be found in Appendix B.
4.1 Installation of the Boom
A video surveillance system is used to monitor the ice boom. The web cam and information on the ice boom is available at: www.iceboom.nypa.gov and the Board’s web site at http://www.ijc.org/en_/inbc/ice_boom.
Phase 1 of the ice boom installation (raising of the junction plates and attaching of the floatation buoy barrels) began on 28 November 2016. Beginning near the breakwall on the American side, crews were able to install 13 of 23 buoy barrels. The following day work was suspended due to inclement weather. Work resumed on 30 November 2016 as crews were able to install two more buoy barrels bringing the total to 15 before wave action from high winds halted work. Over the next few days wave action from inclement weather brought all work to a halt. On 6 December ice boom crews were able to get back on the water and install the eight remaining buoy barrels completing Phase 1 of the Lake Erie-Niagara River Ice Boom.
With Phase 1 of the ice boom installation complete, crews began Phase 2 on 7 December 2016, towing two boom spans from their storage area at 100 Katherine Street, Buffalo, NY, (along the shore of the Buffalo River about 3 km [2 mi] upstream from Lake Erie) and securing them to the Buffalo Harbor breakwall. Work was halted for the day as weather conditions worsened. Crews worked diligently the following two days, towing out four spans on 8 December and five on 9 December 2016, and securing them to the breakwall. This brought the total to 11 of 22 spans secured to the breakwall before work was halted for the weekend. On the following Monday and Tuesday five spans were towed out on each day and secured to the breakwall bringing the total to 21 of 22 spans. On 14 December 2016 the last of 22 spans was secured to the breakwall with one additional span placed at the Coast Guard Station. Phase 2 was completed on 15 December 2016 as the second spare span was placed at the Buffalo Coast Guard Station.
The Lake Erie water temperature is taken at the Buffalo Water Treatment Plant located at the head of the Niagara River. The reading is taken at a depth of 9.1 m (30 ft). In accordance with Condition (d) of the International Joint Commission’s 5 October 1999 supplementary Order of Approval: Installation of the Lake Erie-Niagara River Ice Boom (i.e. Phase 3 which is the placement of ice boom

4
spans on Lake Erie as shown in Enclosure 6) will not begin before the Lake Erie water temperature reaches 4°C (39°F) or before 16 December, whichever occurs first.
Lake Erie water temperature dropped to 4°C (39°F) on 15 December 2016. The following day, 16 December 2016, the Board issued a media advisory that installation of the Lake Erie-Niagara River Ice boom would begin that day. Due to inclement weather conditions, installation began the following day. On 17 December 2016 crews installed 7 spans (Spans V to P) on the Canadian Side of the Niagara River (refer to Enclosure 6 for span layout).
On 19 December 2016 another 9 spans were installed (Spans O to G) bringing the total to 16 spans installed. Unfavorable weather delayed further installation until 22 December 2016 when NYPA crews were able to complete Phase 3 by installing the remaining six spans (Spans F to A) completing installation of the ice boom.
Table 4 provides the dates from 1964 to the present year, when the Lake Erie water temperature, as measured at the Buffalo Water Intake, reached 4°C (39°F) and the dates of ice boom installation. As indicated in both Tables 2 and 4, the Lake Erie water temperature reached 4°C (39°F) on 15 December 2016.
4.2 Ice Boom Operation
Typically, an ice sheet will form behind the ice boom, stabilizing the structure for a significant portion of the ice season. During the 2016-2017 ice season, the ice sheet formed for only brief periods behind the ice boom. Due to above average temperatures, there were extended lengths of time that the ice boom was exposed to the stress of wave action during high wind events.
On 17 January 2017, NYPA was notified that Span L of the ice boom was open and trailing. On 19 January, Span L was observed to be broken by unmanned aerial vehicle (UAV) inspection. On 20 January 2017, NYPA crews completed a thorough inspection of the ice boom from an icebreaker vessel confirming Span L had broken. They also noticed that three buoy barrels, two small and one large, had broken free and drifted down river and that Span E had a trailing pontoon. Crews were able to complete all repairs and replace the missing buoy barrels that same day. Later in the ice season all three buoy barrels that had broken free were recovered.
On 10 February 2017 Span E was observed to be open and trailing as shown in Figure 5 (circled in yellow). NYPA crews completed repairs to Span E on 17 February 2017. A thorough inspection was completed following the repairs and all sections of the Lake Erie-Niagara River Ice Boom were shown to be in good working order.
Figure 5: Span E is circled in yellow, shown open and trailing. Image courtesy of NYPA from the Lake Erie-Niagara River Ice Boom webcam.
4.3 Ice Boom Opening
MODIS imagery showed only trace amounts of ice throughout the month of February. A fixed-wing ice survey flight is typically carried out to determine the extent and condition of ice coverage on the eastern basin of Lake Erie and in the Maid-of-the-Mist-Pool (MOMP). With almost no ice coverage, the flight was deemed unnecessary prior to the decision to begin removal of the ice boom.
Considering the amount of ice remaining in the eastern basin and in the MOMP, members of the INWC held a teleconference on 28 February 2017 to discuss the early removal of the ice boom. On 6 March the Board issued a media advisory stating that ice boom removal preparations were underway as ice boom crews began Phase 1 of the Lake Erie-Niagara River Ice Boom opening.
On 6 March 2017, ice boom crews removed 12 spans (K to V) and secured them to the Buffalo Harbor breakwall. The following day Phase 1 of the ice boom removal was completed as crews removed the remaining 10 spans (A to J) and secured them to the breakwall. With all 22 spans secured to the breakwall NYPA crews were ready to begin Phase 2, but poor marine conditions on Lake Erie halted work over the next few days. On 10 March 2017 ice boom crews began Phase 2 of the Lake Erie-Niagara River Ice Boom opening by removing 11 buoy barrels from the Canadian side. On 13 March 2017, NYPA crews completed Phase 2 by removing the remaining 12 buoy barrels and installing tag lines on the anchor cables. With Phases 1 & 2 complete, NYPA informed the INWC and both the Canadian and U.S. Coast Guards that the ice boom was now open.
Phase 3 of the Lake Erie-Niagara River Ice boom removal began on 21 March 2017 as ice boom crews towed five of the 152-metre (500-foot) long spans to the Katherine Street storage facility. The following day four more spans were towed up the Buffalo River and pulled onto shore.
Phase 3 continued on 23 March 2017 as five more spans were retrieved bringing the total to 14 of 24 spans towed in.

5
On 24 March another four spans were towed to the storage facility. With six spans left at the Buffalo Harbor breakwall work was halted over the weekend.
Work began again on 27 March 2017 as crews towed in two more spans before heavy fog set in, creating a zero-visibility situation and stopping work for the day. Phase 3 of the Lake Erie-Niagara River Ice Boom opening was completed on 28 March 2017 as crews towed the remaining four spans to the Katherine Street storage facility marking the end of the 2016-2017 ice boom season.
The IJC was informed that the 2017 ice boom removal operations were complete. Historical data, from 1970 to present, on the ice area remaining in eastern Lake Erie and the boom opening dates, are shown in Table 5.
4.4 Ice Boom Maintenance
As part of a routine summer maintenance program, hardware will be replaced where necessary. During the summer of 2017 many cables had splice repairs completed. A total of eight 152-metre (500-foot) cable spans were replaced and 20 pontoon end caps that were damaged were replaced.
5. POWER LOSSES, FLOODING,AND NAVIGATION DURINGTHE 2016-17 ICE SEASON
5.1 Estimated Power Losses
Even with the installation of the ice boom, some reduction in hydropower generation can be expected virtually every year due to ice conditions where ice flows over top the ice boom or when ice is generated in the river itself. The Power Entities estimate that the ice boom provides an average annual savings to the hydropower facilities of approximately 414,000 Megawatt Hours (MWh) of electric energy.
The Power Entities experienced a 1,100 MWh loss of hydroelectric power generation due to ice during the 2016–2017 ice season. A summary of estimated loss of energy due to ice for the period of record, 1975 to present, is shown in Table 6.
5.2 Niagara River Shore Flooding and Property Damages
The NYPA’s Flood Warning Notification Plan (FWNP) in the Event of Ice-Affected Flooding on the Upper Niagara River was tested on 20 December 2016. A drill was conducted that simulated a flood event along the U.S. shoreline downstream of the North Grand Island Bridge. These simulated conditions were caused by a postulated ice stoppage and jam between NYPA’s intakes and the Buckhorn dikes.
Activation of the FWNP was not required in the 2016-2017 ice season.
5.3 Navigation at the Welland Canal
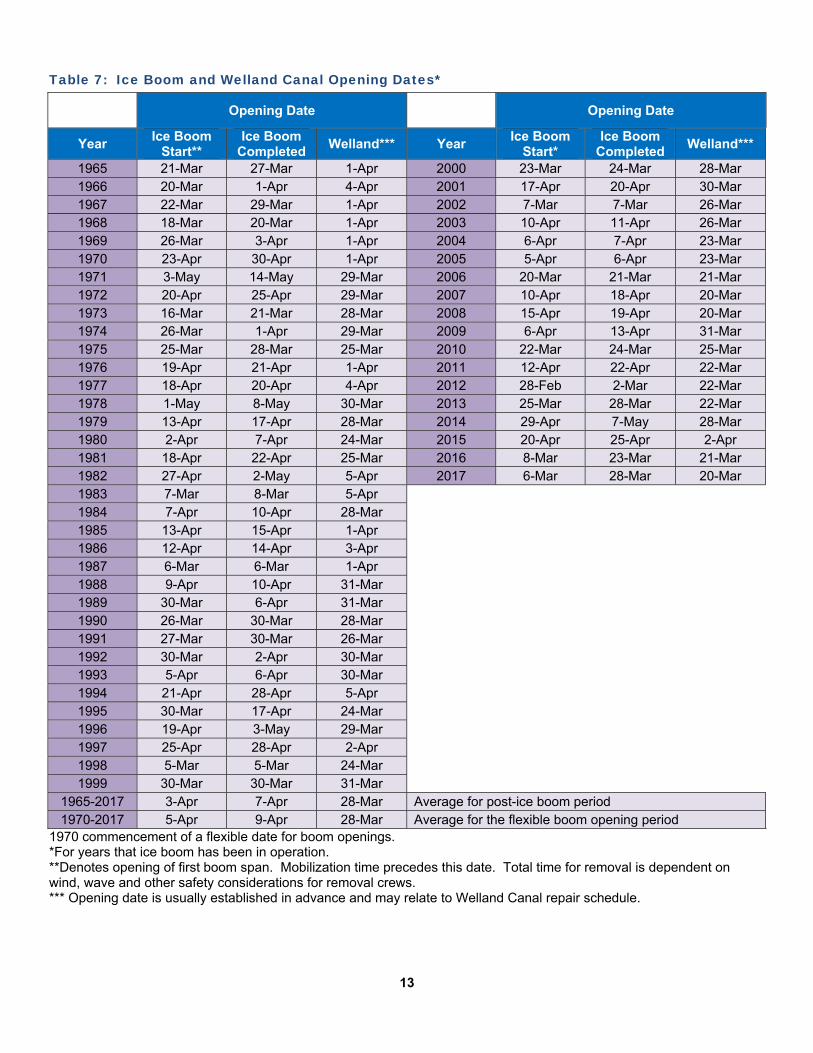
The Welland Canal opened to commercial shipping this season on 20 March 2017 for its 188th consecutive year of service. A comparison of the dates of boom opening and the commencement date of navigation at the Welland Canal for the period 1965 to 2017 is shown in Table 7.
6. FINDINGS, CONCLUSIONSAND RECOMMENDATIONS
6.1 Findings and Conclusions
For the second consecutive year Western New York and Southern Ontario experienced temperatures well above average for the winter of 2016-17. All months covered within this report were warmer than average with the exception of March 2017, which was recorded as colder than February 2017.
On 17 January 2017, NYPA was made aware that span L of the Lake Erie Niagara River Ice Boom was open and trailing. On 19 January an inspection by UAV was conducted by OPG and NYPA to test the potential for future use of this technology. The UAV investigation was a success as crews determined that Span L was open and trailing. The following day NYPA crews were able to complete repairs to Span L and also reconnected one trailing pontoon at Span E. Two small buoy barrels and one large buoy barrel were also observed to be missing. The three buoy barrels were replaced on 25 January 2017. Later in the ice season all three buoy barrels that had broken free of the boom were recovered. Helicopter (for ice thickness measurements) and fixed-wing (for lake ice area assessment) flights were not required to assess ice conditions in the eastern basin of Lake Erie as a result of the ice conditions during the winter of 2016-2017.
6
6.2 Recommendations for the 2017–18 Operation
The Board and the INWC should continue to monitor and assess the performance of the ice boom.
The Power Entities should continue to ensure that they monitor the ice boom and have adequate materials to repair multiple breakages in a timely manner, if they occur.
Utilization of Great Lakes ice information maps prepared by the Canadian Ice Centre and the United States National Ice Center, NOAA satellite imagery, and helicopter and fixed wing aerial ice surveys should continue to be used, as required, to evaluate ice conditions throughout the winter. In addition, the availability and applicability of additional, alternate forms of satellite-based remote sensing information should be investigated.
The INWC should continue to store ice area maps produced from aerial reconnaissance flights or composite ice maps in electronic format for future reference.
The INWC should continue to liaise with both the United States and Canadian Coast Guard regarding ice boom installation and removal operations.
The use of UAVs for rapid inspection of the ice boom should be continued to be investigated as they offer a timely and efficient method of evaluating the state of the ice boom.
7
Table 1: Air Temperature at Buffalo Niagara International Airport
ºC (Celsius) ºF (Fahrenheit)
Month Average* 1981-2010
Recorded 2016-17
Departure Average* 1981-2010
Recorded 2016-17
Departure
Nov. 2016 4.8 7.3 2.5 40.7 45.1 4.4
Dec. 2016 -1.1 -0.4 0.7 30.1 31.2 1.1
Jan. 2017 -3.9 -0.6 3.3 24.9 31.0 6.1
Feb. 2017 -3.2 1.6 4.8 26.3 34.8 8.5
Mar. 2017 1.1 0.6 -0.5 34.0 33.0 -1.0
Apr. 2017 7.7 10.3 2.6 45.9 50.5 4.6
Average 0.9 3.1 2.2 33.7 37.6 3.9
* Official U.S. National Weather Service averages are based on 30 years of record, 1981-2010.
8
Table 2: Lake Erie Water Temperatures as Recorded at the Buffalo Intake (Dec 2016 - May 2017)*
Month December January February March April May
Date oC oF oC oF oC oF oC oF oC oF oC oF 1 8.9 48 2.2 36 1.1 34 1.7 35 2.2 36 8.3 47 2 8.3 47 1.7 35 1.1 34 2.2 36 2.2 36 7.8 46 3 6.7 44 3.3 38 1.1 34 1.7 35 2.2 36 10.6 51 4 7.8 46 3.3 38 0.6 33 1.1 34 3.3 38 10.0 50 5 8.3 47 1.1 34 0.6 33 1.1 34 3.9 39 9.4 49 6 7.2 45 0.6 33 0.6 33 1.1 34 3.9 39 8.3 47 7 6.7 44 0.6 33 0.6 33 1.7 35 3.3 38 8.3 47 8 6.7 44 0.6 33 0.6 33 1.7 35 2.8 37 8.3 47 9 5.6 42 0.6 33 0.6 33 2.2 36 3.3 38 9.4 49 10 5.6 42 0.6 33 0.6 33 2.2 36 3.9 39 8.9 48 11 5.0 41 0.6 33 0.6 33 1.7 35 5.0 41 8.9 48 12 5.6 42 0.6 33 0.6 33 1.7 35 4.4 40 8.9 48 13 5.0 41 0.6 33 0.6 33 1.7 35 4.4 40 8.9 48 14 4.4 40 0.6 33 0.6 33 1.1 34 4.4 40 8.9 48 15 3.3 38 0.6 33 0.6 33 0.6 33 4.4 40 10.0 50 16 1.1 34 0.6 33 0.6 33 0.6 33 5.0 41 11.1 52 17 2.8 37 0.6 33 0.6 33 0.6 33 6.7 44 11.1 52 18 2.2 36 0.6 33 0.6 33 0.6 33 6.7 44 11.7 53 19 1.7 35 0.6 33 0.6 33 0.6 33 6.1 43 12.8 55 20 1.1 34 0.6 33 0.6 33 0.6 33 6.7 44 12.8 55 21 1.1 34 1.1 34 1.1 34 0.6 33 6.1 43 12.2 54 22 1.1 34 1.1 34 1.1 34 0.6 33 7.2 45 11.7 53 23 1.1 34 1.1 34 1.1 34 0.6 33 7.8 46 13.3 56 24 1.1 34 1.1 34 1.7 35 1.1 34 7.2 45 13.3 56 25 2.8 37 1.1 34 1.7 35 1.7 35 7.2 45 13.3 56 26 1.1 34 1.1 34 1.7 35 1.1 34 6.7 44 12.8 55 27 2.8 37 1.1 34 1.7 35 1.7 35 7.2 45 13.3 56 28 2.2 36 1.7 35 1.7 35 2.2 36 7.2 45 13.9 57 29 1.1 34 1.7 35 2.2 36 10.0 50 13.3 56 30 1.1 34 1.1 34 2.2 36 8.9 48 13.9 57 31 1.7 35 1.1 34 2.2 36 14.4 58
Average: 3.9 39 1.1 34 1.1 34 1.1 34 5.6 42 11.1 52 Hi: 8.9 48 3.3 38 1.7 35 2.2 36 8.9 48 14.4 58
Low: 1.1 34 0.6 33 0.6 33 1.1 34 2.2 36 7.8 46 * Water temperatures at Buffalo are reported in Fahrenheit. The Celsius values provided are based on the equivalentvalues in Fahrenheit converted to Celsius and given to the nearest tenth of a degree.

9
Table 3: Observed Dates of Last Ice 1905 to Present
Year Observed Date
of Last Ice Year
Observed Date of Last Ice
Year Observed Date of
Last Ice
1905 7-May 1943 20-May 1981 30-Apr 1906 22-Apr 1944 15-Apr 1982 20-May 1907 30-Apr 1945 9-Apr 1983 23-Feb 1908 9-May 1946 No data 1984 25-Apr 1909 26-Apr 1947 No data 1985 1-May 1910 30-Apr 1948 No data 1986 26-Apr 1911 6-May 1949 No data 1987 9-Mar 1912 29-Apr 1950 No data 1988 27-Apr 1913 30-Apr 1951 15-Apr 1989 9-Apr 1914 28-Apr 1952 27-Mar 1990 10-Apr 1915 2-May 1953 Ice-free 1991 28-Mar 1916 11-May 1954 27-Apr 1992 15-Apr 1917 30-Apr 1955 5-Apr 1993 16-Apr 1918 20-Apr 1956 20-Apr 1994 1-May 1919 15-Mar 1957 11-Apr 1995 18-Apr 1920 20-May 1958 10-Apr 1996 6-May 1921 14-Mar 1959 8-May 1997 29-Apr 1922 11-Apr 1960 5-May 1998 Ice-free 1923 16-May 1961 15-Apr 1999 2-Apr 1924 20-Apr 1962 30-Apr 2000 28-Mar 1925 26-Apr 1963 11-May 2001 27-Apr 1926 31-May 1964 27-Apr 2002 Ice-free 1927 9-Apr 1965* 14-May 2003 22-Apr 1928 19-May 1966 27-Apr 2004 30-Apr 1929 2-May 1967 13-Apr 2005 11-Apr 1930 7-May 1968 4-May 2006 5-Apr 1931 7-Apr 1969 26-Apr 2007 29-Apr 1932 21-Apr 1970 30-Apr 2008 23-Apr 1933 23-Apr 1971 31-May 2009 16-Apr 1934 23-Apr 1972 5-May 2010 29-Mar 1935 13-Apr 1973 15-Mar 2011 24-Apr 1936 31-May 1974 6-Apr 2012 Ice-free 1937 14-Apr 1975 8-Apr 2013 9-Apr 1938 14-Apr 1976 19-Apr 2014 8-May 1939 14-May 1977 13-May 2015 20-Apr 1940 19-May 1978 14-May 2016 6-Mar 1941 21-Apr 1979 3-May 2017 17-Mar 1942 30-Apr 1980 23-Apr

10
Table 4: Dates Water Temperature Reached 4˚C (39˚F) and Dates of Ice Boom Installation Date Water
Temperature Reached 4°C
(39°F)
Installation of the Ice Boom
Date Water Temperature Reached 4°C
(39°F)
Installation of the Ice Boom
7-Dec-1964
1960's
9 Nov to 15 Dec 1964 27-Dec-1990
1990's
27 Dec to 30 Dec 1990
15-Dec-1965 19 Nov to 8 Dec 1965 19-Dec-1991 20 Dec to 27 Dec 1991
19-Dec-1966 8 Nov to 6 Dec 1966 6-Dec-1992 13 Dec to 14 Dec 1992
29-Nov-1967 17 Nov to 5 Dec 1967 16-Dec-1993 17 Dec to 28 Dec 1993
10-Dec-1968 25 Nov to 5 Dec 1968 2-Jan-1995 7 Jan to 10 Jan 1995
9-Dec-1969 15 Nov to 10 Dec 1969 7-Dec-1995 13 Dec to 16 Dec 1995
15-Dec-1970
1970's
Completed 15 Dec 1970* 4-Dec-1996 8 Dec to 11 Dec 1996
25-Dec-1971 3 Dec to 10 Dec 1971 13-Dec-1997 17 Dec to 18 Dec 1997
11-Dec-1972 11 Dec to 18 Dec 1972 1-Jan-1999 2 Jan to 9 Jan 1999
7-Jan-1974 19 Dec 1973 to 9 Jan 1974 27-Dec-1999 19 Dec to 29 Dec 1999
10-Dec-1974 11 Dec to 30 Dec 1974 18-Dec-2000
2000's
16 Dec to 28 Dec 2000
20-Dec-1975 24 Dec 1975 to 8 Jan 1976 27-Dec-2001 17 Dec to 22 Dec 2001
24-Dec-1976 30 Nov to 18 Dec 1976 3-Dec-2002 11 Dec to 12 Dec 2002
8-Dec-1977 13 Dec to 31 Dec 1977 15-Dec-2003 16 Dec to 20 Dec 2003
11-Dec-1978 Completed 19 Dec 1978* 20-Dec-2004 17 Dec to 20 Dec 2004
17-Nov-1979 Completed 22 Dec 1979* 9-Dec-2005 14 Dec to 15 Dec 2005
14-Dec-1980
1980's
22 Dec to 30 Dec 1980 19-Jan-2007 18 Dec to 19 Dec 2006
11-Dec-1981 19 Dec to 23 Dec 1981 9-Dec-2007 13 Dec to 17 Dec 2007
4-Jan-1982 6 Jan to 8 Jan 1983 5-Dec-2008 10 Dec to 11 Dec 2008
18-Dec-1983 19 Dec to 21 Dec 1983 12-Dec-2009 17 Dec to 19 Dec 2009
26-Dec-1984 27 Dec to 30 Dec 1984 8-Dec-2010
2010’s
12 Dec to 16 Dec 2010
17-Dec-1985 20 Dec to 21 Dec 1985 28-Dec-2011 17 Dec to 18 Dec 2011
15-Dec-1986 16 Dec to 17 Dec 1986 28-Dec-2012 18 Dec to 20 Dec 2012
19-Dec-1987 19 Dec to 26 Dec 1987 10-Dec-2013 14 Dec to 16 Dec 2013
12-Nov-1988 12 Dec to 17 Dec 1988 5-Dec-2014 15 Dec to 16 Dec 2014
6-Dec-1989 7 Dec to 8 Dec 1989 6-Jan-2016 16 Dec to 28 Dec 2015
15-Dec-2016 17 Dec to 22 Dec 2016
Note: Prior to the 1980-81 Ice Season, the International Joint Commission Orders required that complete closure of the ice boom shall not be accomplished before the first Monday in December. * Starting date unknown.

11
Table 5: Comparison of Ice Areas Near Time of Ice Boom Opening
Areas of Ice in Eastern Lake Erie
Opening of Ice Boom
Areas of Ice in Eastern Lake Erie
Opening of Ice Boom
Year Date of Obser-vation
Square KMs
Square Miles
Start Com-pleted
Year Date of Obser-vation
Square KMs
Square Miles
Start Com-pleted
1965
No Data Collected
21-Mar 27-Mar 2001 14-Apr 390 150 17-Apr 20-Apr
1966 20-Mar 1-Apr 2002 Ice-free 7-Mar 7-Mar
1967 22-Mar 29-Mar 2003 10-Apr 490 190 10-Apr 11-Apr
1968 8-Mar 20-Mar 2004 5-Apr 1110 430 6-Apr 7-Apr
1969 26-Mar 3-Apr 2005 4-Apr 210 80 5-Apr 6-Apr
1970 16-Apr 2590 1000 23-Apr 30-Apr 2006 20-Mar 80 30 20-Mar 21-Mar
1971 27-Apr 2850 1100 3-May 14-May 2007 7-Apr 620 240 10-Apr 18-Apr
1972 18-Apr 1300 500 20-Apr 25-Apr 2008 14-Apr 310 120 15-Apr 19-Apr
1973 14-Mar 260 100 16-Mar 21-Mar 2009 6-Apr 100 40 6-Apr 13-Apr
1974 18-Mar 320 125 26-Mar 1-Apr 2010 18-Mar 570 220 22-Mar 24-Mar
1975 21-Mar 80 30 25-Mar 28-Mar 2011 11-Apr 230 90 12-Apr 22-Apr
1976 15-Apr 130 50 19-Apr 21-Apr 2012 Ice-free 28-Feb 2-Mar
1977 14-Apr 520 200 18-Apr 20-Apr 2013 25-Mar 228 88 25-Mar 28-Mar
1978 27-Apr 710 275 1-May 8-May 2014 28-Apr 622 240 29-Apr 7-May
1979 10-Apr 390 150 13-Apr 17-Apr 2015 19-Apr 218 84 20-Apr 25-Apr
1980 1-Apr 700 270 2-Apr 7-Apr 2016 Ice-free 8-Mar 23-Mar
1981 15-Apr 980 300 18-Apr 22-Apr 2017 Ice-free 6-Mar 13-Mar
1982 26-Apr 1090 420 27-Apr 2-May
1983 2-Mar Trace Trace 7-Mar 8-Mar
1984 5-Apr 780 300 7-Apr 10-Apr
1985 12-Apr 780 300 13-Apr 15-Apr
1986 7-Apr 1010 390 12-Apr 14-Apr
1987 5-Mar 130 50 6-Mar 6-Mar
1988 8-Apr 700 270 9-Apr 10-Apr
1989 27-Mar 340 130 30-Mar 6-Apr
1990 26-Mar 230 90 26-Mar 30-Mar
1991 25-Mar 50 20 27-Mar 30-Mar
1992 31-Mar 160 60 30-Mar 2-Apr
1993 3-Apr 540 210 5-Apr 6-Apr
1994 19-Apr 620 240 21-Apr 28-Apr
1995 28-Mar 410 160 30-Mar 17-Apr
1996 17-Apr 730 280 19-Apr 3-May
1997 24-Apr 60 25 25-Apr 28-Apr
1998 Ice-free 5-Mar 5-Mar
1999 30-Mar Trace Trace 30-Mar 30-Mar
2000 21-Mar 160 60 23-Mar 24-Mar

12
Table 6: Estimated Power Losses In MW-hours Due to Ice for Period of Record 1975 to Present
Winter season of:
December January February March April May Totals
1974-75 * * 150,000 15,100 * * 165,100
1975-76 * 78,700 36,500 45,800 32,000 * 193,000
1976-77 * 54,000 23,500 0 0 0 77,500
1977-78 * 88,000 600 600 0 0 89,200
1978-79 * 30,000 3,700 0 1,600 0 35,300
1979-80 * 6,000 30,000 13,000 10,500 0 59,500
1980-81 14,000 9,000 3,900 1,100 4,100 0 32,100
1981-82 * 58,000 27,000 10,000 13,000 5,000 113,000
1982-83 0 0 0 0 0 0 0
1983-84 53,000 57,000 4,000 25,000 0 0 139,000
1984-85 0 65,000 25,000 11,000 29,000 0 130,000
1985-86 10,000 65,000 8,000 5,000 6,000 0 94,000
1986-87 0 28,000 32,000 4,000 0 0 64,000
1987-88 0 13,000 24,000 0 4,000 0 41,000
1988-89 0 0 30,000 1,000 2,000 0 33,000
1989-90 6,000 7,000 5,000 5,000 0 0 23,000
1990-91 0 14,000 11,000 6,000 0 0 31,000
1991-92 0 21,000 3,000 14,000 0 0 38,000
1992-93 0 0 2,000 2,000 0 0 4,000
1993-94 0 11,000 12,000 0 1,000 0 24,000
1994-95 0 0 11,000 2,000 7,000 0 20,000
1995-96 0 45,000 4,000 13,000 0 0 62,000
1996-97 0 80,000 4,000 3,000 16,000 0 103,000
1997-98 0 0 0 0 0 0 0
1998-99 0 17,000 700 0 0 0 17,700
1999-00 0 0 1,200 0 0 0 1,200
2000-01 700 3,600 500 100 0 0 4,900
2001-02 0 0 0 0 0 0 0
2002-03 0 35,000 11,500 1,500 0 0 48,000
2003-04 0 26,000 5,800 0 0 0 31,800
2004-05 0 7,000 13,100 8,500 0 0 28,600
2005-06 0 0 14,300 18,600 0 0 32,900
2006-07 0 2,500 37,600 3,800 7,800 0 51,700
2007-08 0 15,500 153,900 1,300 500 0 171,200
2008-09 0 4,700 17,600 0 2,400 0 24,700
2009-10 0 36,700 3,000 0 0 0 39,700
2010-11 0 8,400 5,800 0 15,300 0 29,500
2011-12 0 0 0 0 0 0 0
2012-13 0 0 2,900 21,600 9,100 0 33,600
2013-14 0 93,300 0 0 0 0 93,300
2014-15 0 32,800 6,200 0 0 0 39,000
2015-16 0 0 10,500 0 0 0 10,500
2016-17 1,100 0 0 0 0 0 1,100
*No Data PublishedNote: No Data available for period 1964-74.
13
Table 7: Ice Boom and Welland Canal Opening Dates*
Opening Date Opening Date
Year Ice Boom
Start** Ice Boom
Completed Welland*** Year
Ice Boom Start*
Ice BoomCompleted
Welland***
1965 21-Mar 27-Mar 1-Apr 2000 23-Mar 24-Mar 28-Mar 1966 20-Mar 1-Apr 4-Apr 2001 17-Apr 20-Apr 30-Mar 1967 22-Mar 29-Mar 1-Apr 2002 7-Mar 7-Mar 26-Mar 1968 18-Mar 20-Mar 1-Apr 2003 10-Apr 11-Apr 26-Mar 1969 26-Mar 3-Apr 1-Apr 2004 6-Apr 7-Apr 23-Mar 1970 23-Apr 30-Apr 1-Apr 2005 5-Apr 6-Apr 23-Mar 1971 3-May 14-May 29-Mar 2006 20-Mar 21-Mar 21-Mar 1972 20-Apr 25-Apr 29-Mar 2007 10-Apr 18-Apr 20-Mar 1973 16-Mar 21-Mar 28-Mar 2008 15-Apr 19-Apr 20-Mar 1974 26-Mar 1-Apr 29-Mar 2009 6-Apr 13-Apr 31-Mar 1975 25-Mar 28-Mar 25-Mar 2010 22-Mar 24-Mar 25-Mar 1976 19-Apr 21-Apr 1-Apr 2011 12-Apr 22-Apr 22-Mar 1977 18-Apr 20-Apr 4-Apr 2012 28-Feb 2-Mar 22-Mar 1978 1-May 8-May 30-Mar 2013 25-Mar 28-Mar 22-Mar 1979 13-Apr 17-Apr 28-Mar 2014 29-Apr 7-May 28-Mar 1980 2-Apr 7-Apr 24-Mar 2015 20-Apr 25-Apr 2-Apr 1981 18-Apr 22-Apr 25-Mar 2016 8-Mar 23-Mar 21-Mar 1982 27-Apr 2-May 5-Apr 2017 6-Mar 28-Mar 20-Mar 1983 7-Mar 8-Mar 5-Apr 1984 7-Apr 10-Apr 28-Mar 1985 13-Apr 15-Apr 1-Apr 1986 12-Apr 14-Apr 3-Apr 1987 6-Mar 6-Mar 1-Apr 1988 9-Apr 10-Apr 31-Mar 1989 30-Mar 6-Apr 31-Mar 1990 26-Mar 30-Mar 28-Mar 1991 27-Mar 30-Mar 26-Mar 1992 30-Mar 2-Apr 30-Mar 1993 5-Apr 6-Apr 30-Mar 1994 21-Apr 28-Apr 5-Apr 1995 30-Mar 17-Apr 24-Mar 1996 19-Apr 3-May 29-Mar 1997 25-Apr 28-Apr 2-Apr 1998 5-Mar 5-Mar 24-Mar 1999 30-Mar 30-Mar 31-Mar
1965-2017 3-Apr 7-Apr 28-Mar Average for post-ice boom period 1970-2017 5-Apr 9-Apr 28-Mar Average for the flexible boom opening period
1970 commencement of a flexible date for boom openings. *For years that ice boom has been in operation.**Denotes opening of first boom span. Mobilization time precedes this date. Total time for removal is dependent on wind, wave and other safety considerations for removal crews. *** Opening date is usually established in advance and may relate to Welland Canal repair schedule.

14
Appendix A – Description of the Lake Erie-Niagara River Area
A.1 Hydraulics and Hydrology
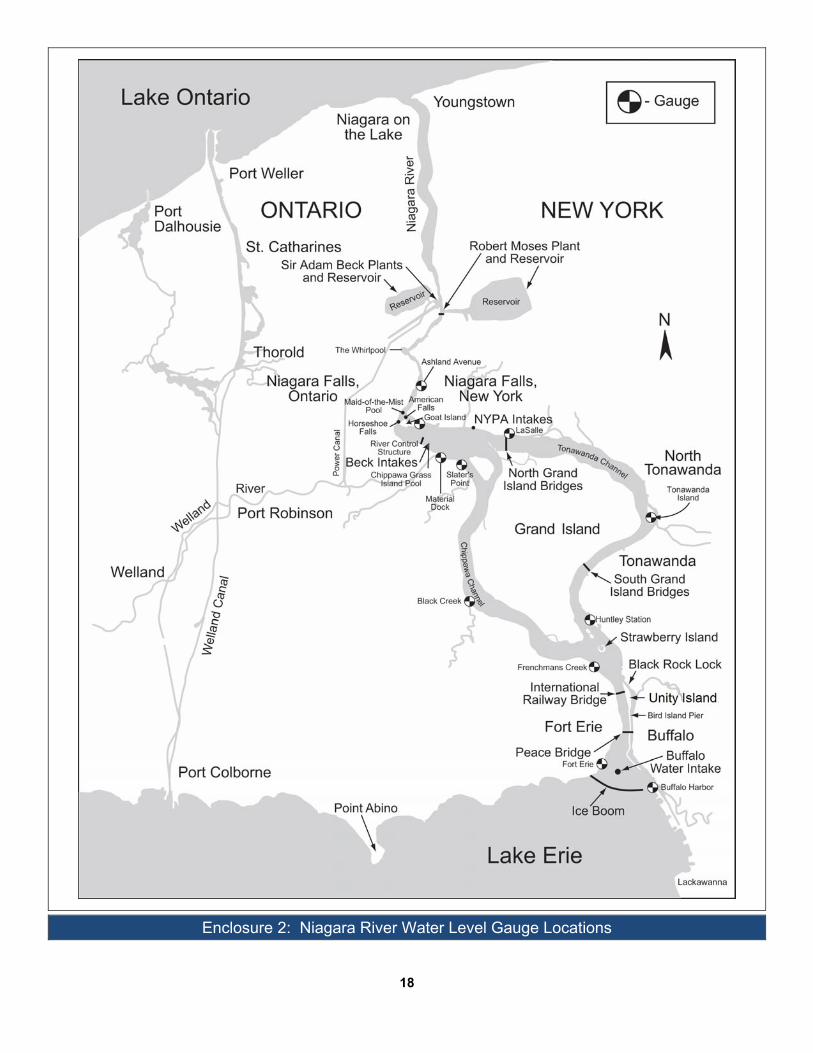
The Niagara River, about 58 km (36 mi) in length, is the natural outlet from Lake Erie to Lake Ontario (Enclosure 3). The elevation difference between the two lakes is about 99 m (326 ft); and about half of this occurs at Niagara Falls. Over the period 1860-2016, the average Niagara River flow at Queenston, Ontario has been 5861 m3/s (206,972 cfs). The Welland Canal carries a small portion of the Lake Erie outflow. The total upper Great Lakes drainage basin upstream of the Niagara River is approximately 684,000 km2 (264,000 mi2). Enclosure 2 shows a detailed map of the Niagara River.
The Niagara River, as described in the following paragraphs, consists of three major reaches: the upper Niagara River, the Niagara Cascades and Falls, and the lower Niagara River.
(a) Upper Niagara River
The upper Niagara River extends about 35 km (22 mi) from Lake Erie to the Cascade Rapids, which begin 1 km (0.6 mi) upstream from the Horseshoe Falls. From Lake Erie to Strawberry Island, a distance of approximately 8 km (5 mi), the channel width varies from 2,740 m (9,000 ft) at its funnel-shaped entrance to 460 m (1,500 ft) at Unity Island below the Peace Bridge. The fall over this reach is around 1.8 m (6 ft). In the upper 3.2 km (2 mi) of the river, the maximum depth is approximately 6 m (20 ft), with velocities as high as 3.7 m/s (12 ft/s) in the vicinity of the Peace Bridge. Below Unity Island, the river widens to approximately 610 m (2,000 ft), with velocities ranging from 1.2 to 1.5 m/s (4 to 5 ft/s).
At Grand Island, the river divides into the west channel known as the Canadian or Chippawa Channel and the east channel known as the American or Tonawanda Channel. The Chippawa Channel is approximately 17.7 km (11 mi) in length and varies from 610 to 1,220 m (2,000 to 4,000 ft) in width. Velocities range from 0.6 to 0.9 m/s (2 to 3 ft/s). The Chippawa Channel carries approximately 60 percent of the total river flow. The Tonawanda Channel is 24 km (15 mi) long and varies from 460 to 610 m (1,500 to 2,000 ft) in width above Tonawanda Island. Downstream thereof, the channel varies from 460 to 1,220 m (1,500 to 4,000 ft) in width. Velocities range from 0.6 to 0.9 m/s (2 to 3 ft/s). North of Grand Island, the channels unite to form the 4.8 km (3 mi) long Chippawa-Grass Island Pool (CGIP). At the downstream end of the CGIP is the International Niagara Control Works (INCW). This gate control structure extends from the Canadian shoreline about halfway across the width of the river. The Niagara Falls are located about 1,370 m (4,500 ft)
downstream of the structure. The average fall from Lake Erie to the CGIP is 2.7 m (9 ft).
(b) Niagara Cascades and Falls
Below the INCW, the river falls 15 m (50 ft) through the Cascade area and is divided into two channels by Goat Island. These channels convey the flow to the brink of the Canadian and American Falls (Enclosure 3). The Canadian or Horseshoe Falls is so named because the crest is horseshoe shaped. During the non-tourist hours, the minimum Falls flow is 1,416 m3/s (50,000 cfs). This produces a fall of about 57 m (188 ft). Minimum Falls flow for tourist hours is 2,832 m3/s (100,000 cfs), which results in a fall of about 54 m (177 ft). These minimum flow values are combined Horseshoe and American Falls flows. There are small accumulations of talus (rock debris) at the flanks. At the American Falls, water plunges vertically, ranging from 21 to 34 m (70 to 100 ft), to a talus slope at its base.
(c) Lower Niagara River
The Niagara Gorge extends from the Falls for 11 km (7 mi) downstream to the foot of the escarpment at Queenston, Ontario. The upper portion of this reach is known as the Maid-of-the-Mist Pool (M-O-M Pool), with an average fall of approximately 1.5 m (5 ft). This reach is navigable for practically its entire length. The M-O-M Pool is bounded downstream by the Whirlpool Rapids, which extends a further 1.6 km (1 mi). The water surface profile drops 15 m (50 ft) in the Whirlpool Rapids, where velocities can reach as high as 9 m/s (30 ft/s). The Whirlpool, a basin 518 m (1,700 ft) long, 365 m (1,200 ft) wide and depths up to 38 m (125 ft), is where the river makes a near right-angled turn. Below the Whirlpool, there is another set of rapids which drop approximately 12 m (40 ft). The river emerges from the gorge at Queenston, Ontario and subsequently drops 1.5 m (5 ft) to Lake Ontario. At Queenston, the river widens to 610 m (2,000 ft) and is navigable to Lake Ontario.
A.2 Hydro-Electric Installations and Remedial Works
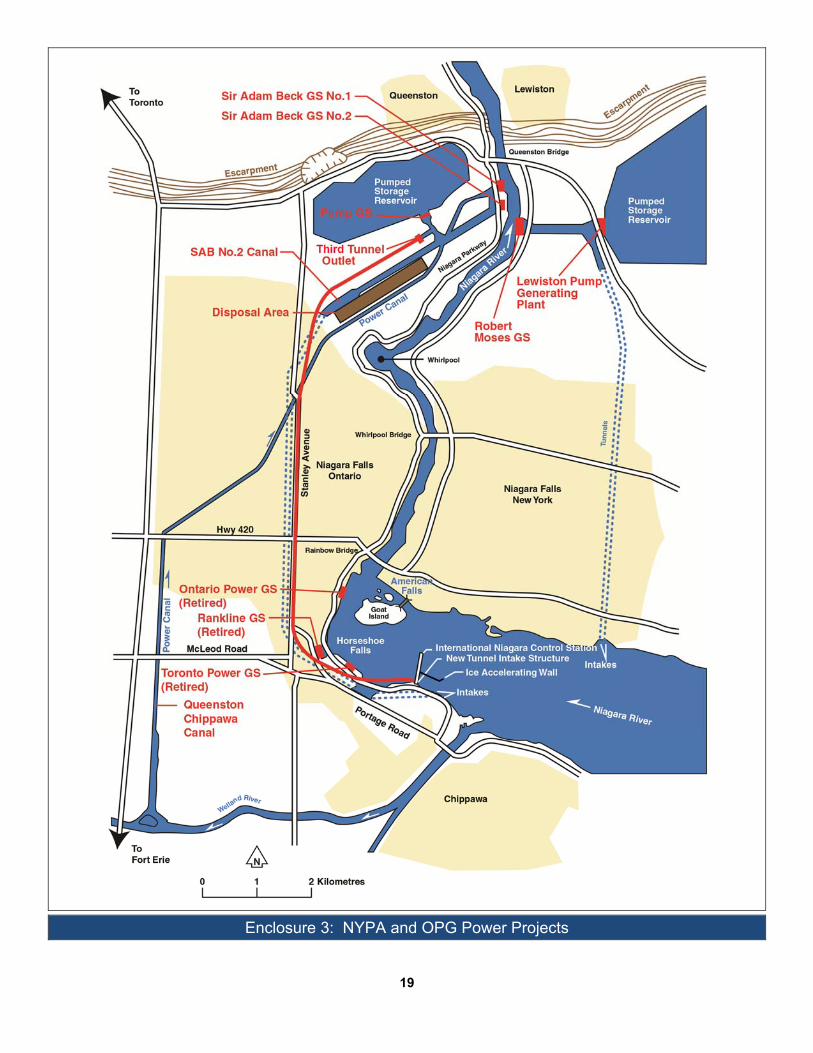
A major portion of Lake Erie outflow is utilized for power production and is diverted to hydroelectric plants by intake structures located above the Falls (Enclosure 3). A lesser portion is diverted for power via the Welland Canal. The high head plants, Sir Adam Beck Nos.1 and 2 in Canada and the Robert Moses Niagara Power Project in the United States, withdraw water from the CGIP and return it to the lower Niagara River at Queenston, Ontario and Lewiston, New York, respectively. Enclosure 3 shows the location of these diversion structures and hydro-electric power plants.
The amount of water that can be diverted for power

15
generation is determined by a 1950 Treaty between the Governments of Canada and the United States concerning “The Diversion of the Niagara River”, generally referred to as the “1950 Niagara Treaty”, The Treaty requires the flow over Niagara Falls to be no less than 2,832 m3/s (100,000 cfs) during the daylight hours of the tourist season. The tourist season is defined as 8:00 a.m. to 10:00 p.m. local time from 1 April to 15 September and 8:00 a.m. to 8:00 p.m. local time from 16 September to 31 October. At all other times, the flow must be not less than 1,416 m3/s (50,000 cfs). The Treaty also specifies that all water in excess of that required for domestic and sanitary purposes, navigation, and the Falls flow requirements may be diverted for power generation. River levels are monitored using water level gauges located along the Niagara River. Gauge locations are referenced on the map in Enclosure 2.
Remedial works were constructed by the Power Entities in the 1950’s, with the approval of the International Joint Commission (IJC), to maintain the Falls flow required by the Treaty and to facilitate power diversions. The remedial works consist of excavation and fill on both flanks of the Horseshoe Falls and the INCW structure extending about 0.8 km (0.5 mi) into the river from the Canadian shore at the downstream end of the CGIP. The INCW has 13 gates that were completed in 1957 and 5 additional gates which were completed in 1963. The INCW is operated jointly by the Power Entities and regulates the water level in the CGIP within limits set by the International Niagara Board of Control. It also functions to adjust Falls flow promptly from 2,832 m3/s (100,000 cfs) to 1,416 m3/s (50,000 cfs) and vice- versa during the tourist season. In 1964, with the IJC’s approval, the Power Entities installed a floating ice boom in Lake Erie, near the head of the Niagara River. The ice boom has been installed early each winter and removed in the spring every year since then. Its main purpose is to reduce the frequency and duration of heavy ice runs into the Niagara River which may lead to ice jams that could seriously hamper power diversions and damage shoreline installations. A more detailed description of the boom is contained in Section B.3.
A.3. Other Shore Installations
The Black Rock Canal parallels the upper reach of the Niagara River from Buffalo Harbor to the downstream end of Unity Island. The canal provides an alternate route around the constricted shallow and high velocity Peace Bridge reach of the upper Niagara River. Extending from Buffalo Harbor to above Strawberry Island, the canal is separated from the river at the upstream end by the Bird Island Pier, a stone and concrete wall, and by Unity Island at the downstream end. The Black Rock Lock, which has a lift of 1.5 m (5 ft), is located near the lower end of the canal. A navigation channel extends from Unity Island via the Tonawanda Channel to Niagara Falls, New York. The channel and canal are maintained to a depth of 6.4 m (21 ft) below low water datum to North Tonawanda and then
to a depth of 3.7 m (12 ft) below low water datum to the city of Niagara Falls, New York.
The U.S. Government rehabilitated a portion of the Bird Island Pier in 1985 and 1986. Prior to rebuilding, most of the pier was overtopped by water passing from the Canal into the Niagara River at times of storm and/or high outflow from Lake Erie. Although the rebuilding raised the level of the pier slightly, culverts were incorporated into the structure to ensure unimpeded pre-project flow conditions that occurred over and through the pier.
Two bridges linking the Province of Ontario and State of New York span the upper Niagara River. The Peace Bridge (highway) crosses the head of the river and the Black Rock Canal close to Lake Erie. The International Railway Bridge crosses the river and the canal 2.4 km (1.5 mi) downstream from the Peace Bridge. The South and North Grand Island highway bridges traverse the Tonawanda Channel at Tonawanda and Niagara Falls, New York, respectively. Docks for recreational craft are located at many points along the Niagara River, with a high concentration along the Tonawanda Channel. There are a few commercial docks for bulk commodities along the United States shoreline between the lower end of the Black Rock Canal and North Tonawanda, New York. Several municipal and industrial water intakes and waste outfalls are located in the upper river. Some of these have structures extending above the water surface.
A.4 Ice Problems
Flow retardation due to ice in the Niagara River is a common winter event. During periods of high southwest winds, ice from Lake Erie sometimes enters the Niagara River and becomes grounded in shallow areas such as the shoals near the head of the river and in the CGIP. During severe winter weather, ice originating in the river often adds to the problems caused by ice runs from the lake. These ice conditions can retard the flow in the Niagara River and occasionally lead to shore property damage and flooding. Accumulations of ice at the hydroelectric power intakes above Niagara Falls or ice jams upstream can reduce the amount of water diverted into these intakes. At times, a combination of reduced diversions, manipulated water elevations in the CGIP and ice breaker activity is necessary to facilitate ice passage. Ice accumulations in the M-O-M Pool may pose potential hazards to the boat tour companies’ facilities located downstream of the Falls. In the past, heavy ice runs in the upper river, combined with a large volume of ice already in the M-O-M Pool, have occasionally damaged these facilities.

16
Appendix B – Background Information on the Ice Boom
B.1 Authorization for Placement of the Ice Boom
The IJC authorized the Power Entities to install the ice boom on a test basis under an Order of Approval dated 9 June 1964. This Order has subsequently been modified by Supplementary Orders. The operation of the ice boom is reviewed by the IJC when circumstances require, but no less than once every five years. The most recent review was completed in 2014. A 1999 review resulted in the Commission issuing a Supplementary Order which modified condition (d). A 1984 Order of Approval established the current conditions for ice boom opening by modifying condition (e). A Supplementary Order was issued in 1997 to remove any reference to the material required for the ice boom’s pontoons.
Condition (d) regarding installation and Condition (e) regarding boom removal state, respectively:
“(d) Installation of the floating sections of the boom shall not commence prior to December 16 or prior to the water temperature at the Buffalo Water intake reaching 4º C (39º F), whichever occurs first, unless otherwise directed by the Commission.”
“(e) All floating sections of the ice boom shall be opened by April 1, unless ice cover surveys on or about that date show there is more than 250 mi2 (650 km2) of ice east of Long Point. The ice boom opening may be delayed until the amount of ice east of Long Point has diminished to 250 mi2 (650 km2). Complete disassembly and removal of all remaining flotation equipment shall be completed within two weeks thereafter. Notwithstanding any other provision of this Order, the Commission retains the right to require retention, opening or removal of all or any part of the boom at any time because of the existence of an emergency situation.”
B.2 Purpose of the Ice Boom
The ice boom accelerates the formation of the natural ice arch that forms most winters near the head of the Niagara River and also stabilizes the arch once it has formed. A map of eastern Lake Erie indicating the location of the ice boom is shown in Enclosure 4. The boom reduces the severity and duration of ice runs from Lake Erie into the Niagara River, thereby lessening the probability of large-scale ice blockage in the river. Such blockages could lead to both hydropower generation reductions and shoreline property flooding. In addition, it reduces the probability of ice damage to docks and other shore structures.
Once the ice arch is formed, the arch bears the pressure of upstream ice. Seasonal storms may overcome the stability of the arch and force large masses of ice against the boom. The boom was designed to then submerge and allow the ice to override it until the pressure is relieved. After storm conditions subside, the boom resurfaces and again restrains the ice. Throughout the winter season, the ice boom facilitates stabilization of the broken ice cover during the refreezing process. In the spring, it minimizes the severity of ice runs by reducing the quantity of loose ice floes which enter the river.
B.3 Description of the Ice Boom
When in position, the 2,700 m (8,800 ft) ice boom spans the outlet of Lake Erie and is located approximately 300 m (1,000 ft) southwest of the water intake crib for the city of Buffalo. The boom is made up of 22 spans. Spans are anchored to the lake bed at 122 m (400 ft) intervals by 6.4 cm (2.5 in) diameter steel cables. Enclosure 5 illustrates structural details and a plan view of the ice boom is shown in Enclosure 6. As a result of studies conducted by the Power Entities, all of the timber pontoons were replaced with 76 cm (30 in) diameter, 9 m (30 ft) long steel pontoons. This replacement was done to improve the ice-overtopping resistance of the ice boom and reduce its maintenance costs. The replacement of timbers with steel pontoons was completed in the fall of 1997 and the first all-steel-pontoon ice boom was used in the 1997-98 ice season.
Based on experience gained during the 1997-98 ice season, it was recommended that to reduce the potential for damage to the ends of the pontoons from collisions due to storm-induced wave action during open water periods, one steel pontoon from each of the spans A through J be removed. Therefore, beginning with the 1998-99 ice season, spans A through J contain 10 instead of 11 steel pontoons. This modification greatly reduced damage to the pontoons in this reach.
To further reduce the pontoon end cap damage and reduce the fatigue of the span cables between the inner and outer break walls (i.e. Spans A through D), the number and length of pontoons were changed to sixteen 4.6 m (15 ft) long mini pontoons per 152 m (500 ft) span, during the 2000-01 ice season. As per maintenance protocol, and to further reduce damage to the ends of the pontoons, sections K-P were reduced from 11 to 10 pontoons per sections at the start of the 2001-02 ice season. Remaining sections Q-V were reconfigured to 10 pontoons per span at the beginning of the 2002-03 ice season.
Enclosure 6 shows the plan view of the ice boom on Lake Erie. Enclosure 7 shows the span configuration using the typical 9 m (30 ft) pontoon and the 4.6 m (15 ft) mini pontoons.

17
Enclosure 1: Great Lakes – St. Lawrence Drainage Basin
18
Enclosure 2: Niagara River Water Level Gauge Locations
19
Enclosure 3: NYPA and OPG Power Projects
20
Enclosure 4: Map of Eastern End of Lake Erie

21
Enclosure 5: Ice Boom Detail
22
Enclosure 6: Plan View of Ice Boom
23
Enclosure 7: Typical Pontoon Spacing and Lengths

24
Notes