OECD生徒の学習到達度調査2018年調査(PISA2018)のポイ …16 スロベニア 495 アイルランド 500 チェコ 497 17 ベルギー 493 チェコ 499 アイルランド

A member of MUFG, a global financial group
中東欧、ロシア、CIS諸国の主要経済指標Main Economic Indicators for CEE, Russia and CIS
The Bank of Tokyo-Mitsubishi UFJ, Ltd.
三菱東京UFJ銀行 経済調査室 (ロンドン駐在)
Economic Research Office (London),The Bank of Tokyo-Mitsubishi UFJ6th October 2016

目次 / Table of contents
1: 主要経済指標
Main economic indicators
ポーランド/ Poland 03
チェコ/ Czech Republic 04
ハンガリー/ Hungary 05
ルーマニア/ Romania 06
スロバキア/ Slovakia 07
クロアチア/ Croatia 08
ブルガリア/ Bulgaria 09
セルビア/ Serbia 10
マケドニア/ Macedonia 11
ロシア/ Russia 12
カザフスタン/ Kazakhstan 13
ウクライナ/ Ukraine 142
2: 実質GDP成長率
Real GDP growth rate 15
3: 為替相場
Exchange rates 17
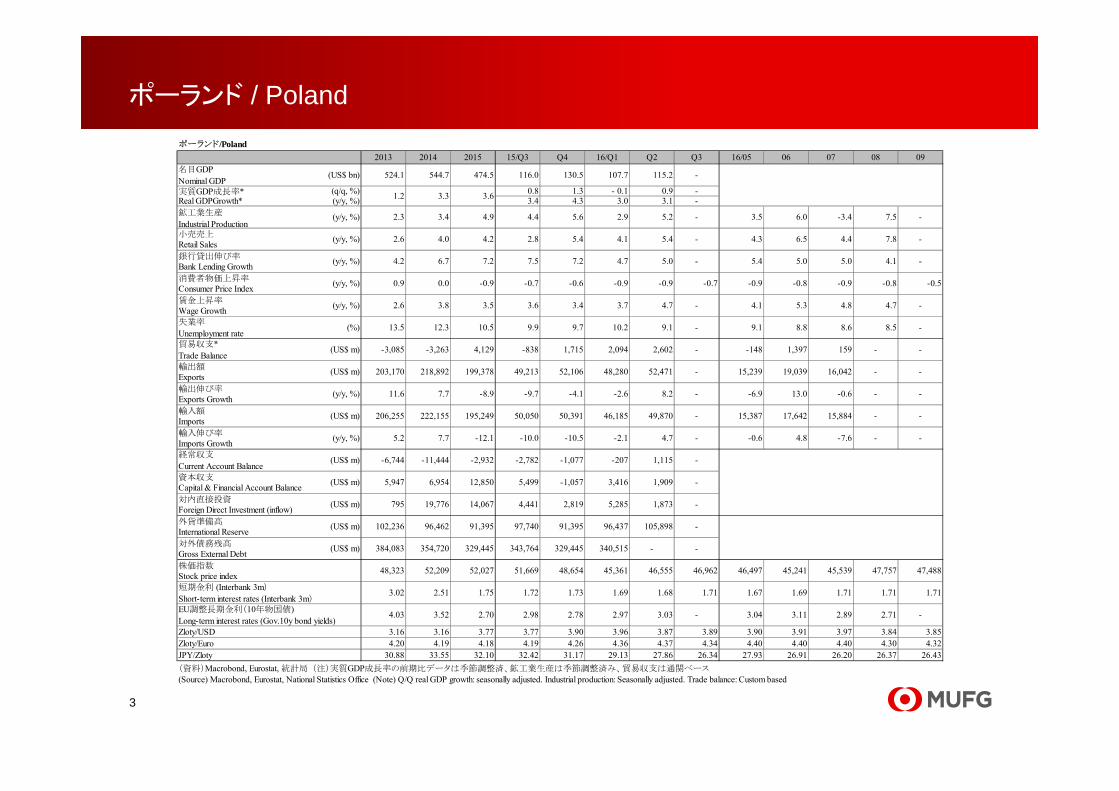
ポーランド/Poland2013 2014 2015 15/Q3 Q4 16/Q1 Q2 Q3 16/05 06 07 08 09
名目GDPNominal GDP
(US$ bn) 524.1 544.7 474.5 116.0 130.5 107.7 115.2 -
実質GDP成長率* (q/q, %) 0.8 1.3 - 0.1 0.9 -Real GDPGrowth* (y/y, %) 3.4 4.3 3.0 3.1 -鉱工業生産
Industrial Production(y/y, %) 2.3 3.4 4.9 4.4 5.6 2.9 5.2 - 3.5 6.0 -3.4 7.5 -
小売売上Retail Sales (y/y, %) 2.6 4.0 4.2 2.8 5.4 4.1 5.4 - 4.3 6.5 4.4 7.8 -
銀行貸出伸び率Bank Lending Growth (y/y, %) 4.2 6.7 7.2 7.5 7.2 4.7 5.0 - 5.4 5.0 5.0 4.1 -
消費者物価上昇率Consumer Price Index (y/y, %) 0.9 0.0 -0.9 -0.7 -0.6 -0.9 -0.9 -0.7 -0.9 -0.8 -0.9 -0.8 -0.5
賃金上昇率Wage Growth (y/y, %) 2.6 3.8 3.5 3.6 3.4 3.7 4.7 - 4.1 5.3 4.8 4.7 -
失業率
Unemployment rate(%) 13.5 12.3 10.5 9.9 9.7 10.2 9.1 - 9.1 8.8 8.6 8.5 -
貿易収支*Trade Balance
(US$ m) -3,085 -3,263 4,129 -838 1,715 2,094 2,602 - -148 1,397 159 - -
輸出額Exports (US$ m) 203,170 218,892 199,378 49,213 52,106 48,280 52,471 - 15,239 19,039 16,042 - -
輸出伸び率Exports Growth (y/y, %) 11.6 7.7 -8.9 -9.7 -4.1 -2.6 8.2 - -6.9 13.0 -0.6 - -
輸入額 Imports (US$ m) 206,255 222,155 195,249 50,050 50,391 46,185 49,870 - 15,387 17,642 15,884 - -
輸入伸び率Imports Growth (y/y, %) 5.2 7.7 -12.1 -10.0 -10.5 -2.1 4.7 - -0.6 4.8 -7.6 - -
経常収支
Current Account Balance(US$ m) -6,744 -11,444 -2,932 -2,782 -1,077 -207 1,115 -
資本収支Capital & Financial Account Balance (US$ m) 5,947 6,954 12,850 5,499 -1,057 3,416 1,909 -
対内直接投資Foreign Direct Investment (inflow) (US$ m) 795 19,776 14,067 4,441 2,819 5,285 1,873 -
外貨準備高International Reserve (US$ m) 102,236 96,462 91,395 97,740 91,395 96,437 105,898 -
対外債務残高Gross External Debt (US$ m) 384,083 354,720 329,445 343,764 329,445 340,515 - -
株価指数Stock price index 48,323 52,209 52,027 51,669 48,654 45,361 46,555 46,962 46,497 45,241 45,539 47,757 47,488
3.02 2.51 1.75 1.72 1.73 1.69 1.68 1.71 1.67 1.69 1.71 1.71 1.71
4.03 3.52 2.70 2.98 2.78 2.97 3.03 - 3.04 3.11 2.89 2.71 -
Zloty/USD 3.16 3.16 3.77 3.77 3.90 3.96 3.87 3.89 3.90 3.91 3.97 3.84 3.85Zloty/Euro 4.20 4.19 4.18 4.19 4.26 4.36 4.37 4.34 4.40 4.40 4.40 4.30 4.32JPY/Zloty 30.88 33.55 32.10 32.42 31.17 29.13 27.86 26.34 27.93 26.91 26.20 26.37 26.43(資料)Macrobond, Eurostat, 統計局(注)実質GDP成長率の前期比データは季節調整済、鉱工業生産は季節調整済み、貿易収支は通関ベース(Source) Macrobond, Eurostat, National Statistics Office (Note) Q/Q real GDP growth: seasonally adjusted. Industrial production: Seasonally adjusted. Trade balance: Custom based
短期金利 (Interbank 3m)
Short-term interest rates (Interbank 3m)EU調整長期金利(10年物国債)Long-term interest rates (Gov.10y bond yields)
3.61.2 3.3
ポーランド / Poland
3

チェコ共和国/Czech Republic2013 2014 2015 15/Q3 Q4 16/Q1 Q2 Q3 16/05 06 07 08 09
名目GDPNominal GDP
(US$ bn) 209.4 207.7 185.3 47.1 46.7 47.6 49.1 -
実質GDP成長率* (q/q, %) 1.0 0.3 0.4 0.9 -Real GDPGrowth* (y/y, %) 4.2 4.3 2.7 3.6 -鉱工業生産*Industrial Production*
(y/y, %) 0.1 5.0 4.8 6.0 2.8 3.3 2.3 - 1.4 4.0 -7.6 - -
小売売上Retail Sales (y/y, %) 1.1 5.6 8.1 6.2 9.0 7.6 8.8 - 11.3 6.5 -0.5 - -
銀行貸出伸び率Bank Lending Growth (y/y, %) 3.7 3.8 6.4 8.6 6.4 7.8 7.3 - 7.8 7.3 7.1 6.3 -
消費者物価上昇率Consumer Price Index (y/y, %) 1.4 0.4 0.3 0.4 0.1 0.5 0.6 - 0.6 0.6 0.5 0.6 -
賃金上昇率Wage Growth (y/y, %) -0.1 2.9 2.7 3.1 3.2 4.5 3.9 -
失業率
Unemployment rate(%) 7.0 6.2 5.1 4.9 4.6 4.3 4.1 - 4.1 4.2 4.2 4.0 -
貿易収支*Trade Balance
(US$ m) 5,444 7,032 5,325 762 959 2,699 2,810 - 784 949 -62 - -
輸出額Exports (US$ m) 142,393 151,668 132,658 32,345 33,645 33,839 36,067 - 11,738 12,369 9,300 - -
輸出伸び率Exports Growth (y/y, %) 2.2 13.0 3.6 1.0 3.7 1.8 4.3 - 8.1 1.7 -16.5 - -
輸入額 Imports (US$ m) 136,949 144,636 127,333 31,584 32,686 31,140 33,257 - 10,954 11,419 9,361 - -
輸入伸び率Imports Growth (y/y, %) 0.7 12.1 4.3 2.7 2.9 0.2 0.5 - 4.0 -1.2 -14.6 - -
経常収支
Current Account Balance(US$ m) -1,113 360 1,682 -1,459 591 4,478 -2 -
資本収支Capital & Financial Account Balance (US$ m) 7,704 4,594 12,194 45 2,308 5,439 517 -
対内直接投資Foreign Direct Investment (inflow) (US$ m) 7,358 8,095 2,468 949 426 652 1,784 -
外貨準備高International Reserve (US$ m) 55,798 54,085 64,148 62,649 64,148 72,880 74,457 -
対外債務残高Gross External Debt (US$ m) 99,652 106,251 115,877 117,524 115,877 119,031 123,596 -
株価指数Stock price index 1,216 1,240 1,258 1,272 1,245 1,160 1,138 1,119 1,145 1,097 1,113 1,115 1,131
0.38 0.34 0.29 0.31 0.29 0.29 0.29 0.29 0.29 0.29 0.29 0.29 0.29
2.13 1.58 0.72 0.95 0.57 0.54 0.49 0.33 0.49 0.49 0.41 0.33 0.27
Koruna/USD 19.57 20.76 24.60 24.36 24.72 24.53 23.95 24.22 23.91 24.09 24.45 24.11 24.10Koruna/Euro 25.99 27.54 27.28 27.08 27.06 27.04 27.04 27.03 27.03 27.06 27.04 27.02 27.02JPY/Koruna 4.99 5.10 4.92 5.01 4.91 4.70 4.51 4.23 4.56 4.37 4.26 4.20 4.23(資料)Macrobond, Eurostat, 統計局(注)実質GDP成長率の前期比データは季季節・稼働日調整済、鉱工業生産は稼働日調整済み、貿易収支は通関ベース(Source) Macrobond, Eurostat, National Statistics Office (Note) Q/Q real GDP growth: seasonally and calender adjusted. Industrial production: calender adjusted. Trade balance: Custom based
短期金利 (Interbank 3m)
Short-term interest rates (Interbank 3m)EU調整長期金利(10年物国債)Long-term interest rates (Gov.10y bond yields)
-0.5 2.7 4.5
チェコ / Czech Republic
4

ハンガリー/Hungary2013 2014 2015 15/Q3 Q4 16/Q1 Q2 Q3 16/05 06 07 08 09
名目GDPNominal GDP
(US$ bn) 134.5 138.2 120.7 31.0 32.4 27.1 31.1 -
実質GDP成長率* (q/q, %) 0.4 0.9 - 0.5 1.0 -Real GDPGrowth* (y/y, %) 2.4 3.2 1.1 2.6 -鉱工業生産*Industrial Production*
(y/y, %) 1.5 7.3 7.2 5.9 8.5 0.4 3.0 - 4.3 ▲ 0.3 - 0.1 - -
小売売上Retail Sales (y/y, %) 1.6 5.2 5.8 5.6 4.5 4.4 6.0 - 5.7 5.7 3.9 4.3 -
銀行貸出伸び率Bank Lending Growth (y/y, %) -4.2 -2.3 -11.1 -9.7 -11.1 -6.5 -6.7 - -7.4 -6.7 -6.3 -5.3 -
消費者物価上昇率Consumer Price Index (y/y, %) 1.7 -0.2 -0.1 0.0 0.5 0.3 -0.1 - -0.2 -0.2 -0.3 -0.1 -
賃金上昇率Wage Growth (y/y, %) 3.4 3.1 4.3 4.6 5.3 6.0 6.0 - 5.9 5.7 5.1 - -
失業率
Unemployment rate(%) 10.3 7.9 6.9 6.6 6.3 6.1 5.5 - 5.5 5.1 5.0 4.9 -
貿易収支*Trade Balance
(US$ m) 8,708 8,349 9,529 2,173 2,330 2,824 3,178 - 843 1,249 743 - -
輸出額Exports (US$ m) 108,015 112,537 100,299 24,892 25,222 24,766 27,058 - 8,588 9,494 8,073 - -
輸出伸び率Exports Growth (y/y, %) 5.0 4.2 -10.9 -11.9 -6.3 -1.2 7.8 - 8.4 5.4 -5.0 - -
輸入額 Imports (US$ m) 99,307 104,188 90,770 22,719 22,892 21,941 23,880 - 7,744 8,245 7,330 - -
輸入伸び率Imports Growth (y/y, %) 5.3 4.9 -12.9 -12.1 -9.8 -0.8 3.7 - 5.4 2.3 -6.0 - -
経常収支
Current Account Balance(US$ m) 5,167 2,893 4,119 1,108 727 1,693 1,995 -
資本収支Capital & Financial Account Balance (US$ m) 13,323 11,507 14,004 2,494.0 5,917.1 687.5 2,374.2 -
対内直接投資Foreign Direct Investment (inflow) (US$ m) 3,358 7,521 -15,288 1,574.8 -16,820.8 -9,193.2 -663.1 -
外貨準備高International Reserve (US$ m) 46,389 41,901 33,020 35,961 33,020 31,169 27,434 -
対外債務残高Gross External Debt (US$ m) 165,329 145,319 127,008 131,226 127,008 129,990 127,119 -
株価指数Stock price index 18,652 17,932 21,036 21,744 22,692 24,092 26,591 27,683 26,537 26,540 27,262 27,638 28,132
4.30 2.41 1.61 1.37 1.35 1.33 1.08 0.91 1.07 1.01 0.97 0.88 0.88
5.92 4.81 3.43 3.61 3.36 3.28 3.23 - 3.35 3.31 2.88 2.83 -
Forint/USD 223.61 232.78 279.39 280.72 285.72 283.06 277.60 278.67 278.49 279.49 284.21 276.72 275.41Forint/Euro 296.93 308.71 309.93 312.10 312.70 312.15 313.37 311.02 314.58 313.98 314.35 310.21 308.68JPY/Forint 0.436 0.455 0.433 0.435 0.425 0.407 0.389 0.367 0.391 0.377 0.366 0.366 0.370(資料)Macrobond, Eurostat, 統計局(注)実質GDP成長率の前期比データは季節調整済、鉱工業生産は稼働日調整済み、失業率は3カ月移動平均、貿易収支は通関ベース。(Source) Macrobond, Eurostat, National Statistics Office (Note) Q/Q real GDP growth: seasonally adjusted. Industrial production: Calender and seasonally adjusted. Unemployment rate: three months moving average. Trade balance: Custom based
短期金利 (Interbank 3m)
Short-term interest rates (Interbank 3m)EU調整長期金利(10年物国債)Long-term interest rates (Gov.10y bond yields)
1.8 3.6 3.0
ハンガリー / Hungary
5

ルーマニア/Romania2013 2014 2015 15/Q3 Q4 16/Q1 Q2 Q3 16/05 06 07 08 09
名目GDPNominal GDP
(US$ bn) 191.6 199.3 177.8 49.5 52.0 36.0 44.3 -
実質GDP成長率* (q/q, %) 1.6 1.2 1.5 1.5 -Real GDPGrowth* (y/y, %) 3.6 3.8 4.3 6.0 -鉱工業生産*Industrial Production*
(y/y, %) 7.3 6.3 3.0 3.3 2.5 - 0.4 0.1 - - 1.8 - 0.4 0.0 - -
小売売上Retail Sales (y/y, %) 1.6 8.3 9.4 12.1 15.6 20.0 18.0 - 18.4 15.5 13.9 - -
銀行貸出伸び率Bank Lending Growth (y/y, %) -3.3 -3.3 3.0 0.6 3.0 2.8 1.2 - 2.4 1.2 1.8 0.7 -
消費者物価上昇率Consumer Price Index (y/y, %) 4.0 1.1 - 0.6 - 1.8 - 1.2 - 2.6 - 2.5 - -3.5 -0.7 -0.8 -0.2 -
賃金上昇率Wage Growth (y/y, %) 4.8 5.2 8.3 7.7 11.1 12.2 13.6 - 14.2 14.3 12.4 - -
失業率
Unemployment rate(%) 7.0 6.6 6.7 6.9 6.7 6.4 6.0 - 6.2 6.0 6.1 6.0 -
貿易収支*Trade Balance
(US$ m) -7,640 -8,041 -9,282 -2,492 -3,102 -2,154 -2,840 - -1,107 -782 -711 - -
輸出額Exports (US$ m) 65,796 69,579 60,553 15,426 14,976 15,281 16,172 - 5,284 5,550 5,320 - -
輸出伸び率Exports Growth (y/y, %) 13.6 5.8 -13.0 -14.0 -10.5 1.5 7.1 - 5.5 3.8 -4.1 - -
輸入額 Imports (US$ m) 73,436 77,620 69,836 17,917 18,078 17,435 19,012 - 6,391 6,332 6,030 - -
輸入伸び率Imports Growth (y/y, %) 4.5 5.7 -10.0 -9.8 -4.5 5.0 10.4 - 13.8 2.9 -3.7 - -
経常収支
Current Account Balance(US$ m) -2,044 -1,342 -2,135 -935 -1,481 -777 -1,501 -
資本収支Capital & Financial Account Balance (US$ m) 6,255 9,314 6,854 1,423 221 2,726 2,388 -
対内直接投資Foreign Direct Investment (inflow) (US$ m) 3,846 3,886 4,308 1,070 714 1,063 1,245 -
外貨準備高International Reserve (US$ m) 44,811 39,165 35,167 32,712 35,167 35,566 35,312 -
対外債務残高Gross External Debt (US$ m) 135,156 114,661 97,789 99,785 97,789 101,250 98,051 -
株価指数Stock price index 5,713 6,745 7,214 7,301 7,087 6,474 6,515 6,816 6,425 6,482 6,587 6,864 6,988
4.22 2.54 1.33 1.37 1.17 0.83 0.76 0.77 0.75 0.77 0.80 0.79 0.72
5.41 4.49 3.47 3.86 3.53 3.42 3.47 - 3.43 3.48 3.14 2.93 -
Leu/USD 3.33 3.35 4.01 3.98 4.07 4.08 3.98 4.00 3.98 4.03 4.06 3.98 3.97Leu/Euro 4.42 4.44 4.45 4.43 4.46 4.49 4.50 4.46 4.50 4.52 4.49 4.46 4.45JPY/Leu 29.33 31.61 30.20 30.67 29.80 28.27 27.08 25.59 27.36 26.16 25.68 25.44 25.67(資料)Macrobond, Eurostat, 統計局(注)実質GDP成長率の前期比データは季節調整済、鉱工業生産は稼働日調整済み、貿易収支は通関ベース(Source) Macrobond, Eurostat, National Statistics Office (Note) Q/Q real GDP growth: seasonally adjusted. Industrial production: Calender adjusted. Trade balance: Custom based
EU調整長期金利(10年物国債)Long-term interest rates (Gov.10y bond yields)
短期金利 (Interbank 3m)
Short-term interest rates (Interbank 3m)
3.3 3.0 3.8
ルーマニア / Romania
6

スロバキア/Slovakia2013 2014 2015 15/Q3 Q4 16/Q1 Q2 Q3 16/05 06 07 08 09
名目GDPNominal GDP
(US$ bn) 98.0 100.2 86.6 22.9 22.1 20.3 22.6 -
実質GDP成長率* (q/q, %) 1.0 1.0 0.8 0.9 -Real GDPGrowth* (y/y, %) 3.7 4.3 3.4 3.7 -鉱工業生産*Industrial Production*
(y/y, %) 3.9 8.7 7.1 6.0 5.2 2.0 7.2 - 11.1 2.3 - 15.2 - -
小売売上Retail Sales (y/y, %) -1.3 3.5 -1.9 -0.2 -1.7 0.5 2.1 - 2.6 -0.4 -2.7 0.3 -
銀行貸出伸び率Bank Lending Growth (y/y, %) 5.4 6.7 9.7 8.1 9.7 8.0 7.4 - 7.9 7.4 9.1 9.1 -
消費者物価上昇率Consumer Price Index (y/y, %) 0.4 -0.1 -0.5 -0.5 -0.5 -0.5 -0.7 - -0.8 -0.7 -0.9 -0.8 -
賃金上昇率Wage Growth (y/y, %) 2.3 4.1 2.9 2.9 4.1 3.3 2.7 -
失業率
Unemployment rate(%) 14.2 13.2 11.5 11.3 11.0 10.4 9.6 - 9.5 9.5 9.4 9.4 -
貿易収支*Trade Balance
(US$ m) 5,619 6,237 3,663 532 706 1,077 1,522 - 493 587 66 - -
輸出額Exports (US$ m) 85,191 85,843 75,268 18,306 19,603 18,336 20,503 - 6,814 6,923 5,346 - -
輸出伸び率Exports Growth (y/y, %) 3.4 1.1 4.8 5.8 7.4 1.0 7.1 - 10.4 3.0 -14.1 - -
輸入額 Imports (US$ m) 79,573 79,607 71,604 17,774 18,898 17,260 18,982 - 6,321 6,336 5,280 - -
輸入伸び率Imports Growth (y/y, %) 2.4 0.4 7.5 11.2 9.1 2.8 4.9 - 7.6 1.4 -11.6 - -
経常収支
Current Account Balance(US$ m) 1,485 50 -1,127 -873 -235 -312 90 -
資本収支Capital & Financial Account Balance (US$ m) -642 -2,103 2,120 1,254 149 307 2,704 -
対内直接投資Foreign Direct Investment (inflow) (US$ m) 1,005 846 2,126 -8 355 1,781 44 -
外貨準備高International Reserve (US$ m) 922 1,392 1,812 2,237 1,812 1,761 1,781 -
対外債務残高Gross External Debt (US$ m) 83,303 82,023 73,015 75,533 73,015 75,113 77,410 -
株価指数Stock price index 190.8 211.1 259.8 258.8 292.3 311.7 321.1 314.8 322.9 314.6 310.2 314.7 319.2
0.22 0.21 - 0.02 - 0.03 - 0.09 - 0.19 - 0.26 - 0.30 -0.26 -0.27 -0.29 -0.30 -0.30
3.19 2.07 0.89 1.04 0.73 0.57 0.52 - 0.41 0.77 0.49 0.30 -
EUR/USD 0.75 0.75 0.90 0.90 0.91 0.91 0.89 0.90 0.88 0.89 0.90 0.89 0.89GBP/EUR 0.85 0.81 0.73 0.72 0.72 0.77 0.79 0.85 0.78 0.79 0.84 0.86 0.85JPY/EUR 129.56 140.45 134.25 135.78 132.89 127.01 121.85 114.24 123.13 118.29 115.15 113.44 114.19(資料)Macrobond, Eurostat , 統計局(注)実質GDP成長率の前期比データは季節/稼働日調整済、鉱工業生産は季節調整済み、貿易収支は通関ベース(Source) Macrobond, Eurostat, National Statistics Office (Note) Q/Q real GDP growth: seasonally adjusted. Industrial production: Seasonally adjusted. Trade balance: Custom based
短期金利 (Interbank 3m)
Short-term interest rates (Interbank 3m)長期金利(10年物国債)Long-term interest rates (Gov.10y bond yields)
1.4 2.6 3.6
スロバキア / Slovakia
7

クロアチア/Croatia2013 2014 2015 15/Q3 Q4 16/Q1 Q2 Q3 16/05 06 07 08 09
名目GDPNominal GDP
(US$ bn) 57.7 57.1 48.7 12.1 13.5 12.0 11.2 12.8
実質GDP成長率* (q/q, %) 0.9 1.4 -0.5 0.5 0.5Real GDPGrowth* (y/y, %) 1.2 2.8 1.9 2.7 2.8鉱工業生産*Industrial Production*
(y/y, %) -1.4 1.3 2.4 2.6 4.1 3.6 6.5 3.7 4.9 1.8 4.4 1.4 -
小売売上Retail Sales (y/y, %) -0.5 0.4 2.4 1.8 2.3 3.3 4.8 3.4 3.2 3.3 3.7 3.6 -
銀行貸出伸び率Bank Lending Growth (y/y, %) 0.9 -2.3 -2.0 -0.7 1.4 -2.0 -5.7 -4.8 -5.3 -4.8 -6.4 -5.8 -
消費者物価上昇率Consumer Price Index (y/y, %) 2.3 0.2 -0.3 0.1 -0.5 -0.3 -0.9 -1.2 -0.9 -1.2 -1.2 -1.1 -1.5
賃金上昇率Wage Growth (y/y, %) 1.0 -0.1 0.6 3.0 0.6 0.6 3.0 3.0
失業率
Unemployment rate(%) 20.3 19.7 17.7 15.5 15.4 16.1 15.4 12.8 15.9 14.4 13.6 13.3 13.1
貿易収支*Trade Balance
(US$ m) -8,745 -8,430 -7,385 -1,917 -1,627 -1,860 -2,165 -1,869 -727 -697 - - -
輸出額Exports (US$ m) 11,847 12,946 11,865 3,076 3,134 2,742 3,182 2,743 1,196 1,169 - - -
輸出伸び率Exports Growth (y/y, %) 6.3 9.3 -8.4 7.4 10.5 6.6 3.1 6.6 15.8 2.2 - - -
輸入額 Imports (US$ m) 20,592 21,376 19,250 4,993 4,760 4,601 5,347 4,611 1,924 1,866 - - -
輸入伸び率Imports Growth (y/y, %) 7.1 3.8 -9.9 6.7 11.7 4.0 5.2 4.3 11.9 4.1 - - -
経常収支
Current Account Balance(US$ m) 566 454 2,540 4,362 -500 -1,741 172 -
資本収支Capital & Financial Account Balance (US$ m) -440 -68 2,436 2,975 159 -1,244 839 -
対内直接投資Foreign Direct Investment (inflow) (US$ m) 937 3,960 157 199 -566 576 94 -
外貨準備高International Reserve (US$ m) 17,789 15,355 14,887 15,000 14,887 15,041 14,372 -
対外債務残高Gross External Debt (US$ m) 63,339 56,473 49,456 52,376 49,456 50,487 - -
株価指数Stock price index 1,856 1,794 1,734 1,757 1,691 1,619 1,687 1,800 1,697 1,686 1,729 1,789 1,881
1.51 0.97 1.23 1.37 1.46 0.92 0.81 0.83 0.80 0.80 0.79 0.82 0.87
Kuna/USD 5.71 5.76 6.87 6.82 6.97 6.91 6.65 6.71 6.63 6.70 6.77 6.68 6.69Kuna/EUR 7.58 7.63 7.62 7.58 7.63 7.62 7.50 7.49 7.50 7.52 7.49 7.49 7.50JPY/Kuna 17.10 18.40 17.63 17.91 17.42 16.68 16.24 15.25 16.42 15.73 15.37 15.16 15.23(資料)Macrobond, Eurostat, 統計局 (注)実質GDP成長率の前期比データは季節調整済、鉱工業生産は季節調整済み、貿易収支は通関ベース(Source) Macrobond, Eurostat, National Statistics Office (Note) Q/Q real GDP growth: seasonally adjusted. Industrial production: Seasonally adjusted. Trade balance: Custom based
短期金利 (Interbank 3m)
Short-term interest rates (Interbank 3m)
1.6-0.4-1.1
クロアチア / Croatia
8

ブルガリア/Bulgaria2013 2014 2015 15/Q3 Q4 16/Q1 Q2 Q3 16/05 06 07 08 09
名目GDPNominal GDP
(US$ bn) 55.5 56.5 48.8 13.3 13.2 10.4 12.6 -
実質GDP成長率* (q/q, %) 0.7 0.7 0.7 0.7 -Real GDPGrowth* (y/y, %) 3.1 3.0 2.9 3.0 -鉱工業生産*Industrial Production*
(y/y, %) -0.5 2.9 3.5 2.8 2.3 2.9 1.1 - -2.1 4.0 -0.5 - -
小売売上Retail Sales (y/y, %) 3.8 10.7 1.0 0.1 0.5 2.5 3.4 - 4.3 3.0 3.1 - -
銀行貸出伸び率 Bank Lending Growth (y/y, %) 0.0 -8.1 -1.5 -9.8 -1.5 -2.2 -1.2 - -1.0 -1.2 -0.5 -0.4 -
消費者物価上昇率Consumer Price Index (y/y, %) -0.9 -2.0 -0.9 -0.9 -1.0 -1.1 -2.3 - -2.6 -1.9 -1.1 -1.1 -
賃金上昇率Wage Growth (y/y, %) 3.7 2.2 7.9 8.0 8.1 7.3 7.7 - 7.9 7.8 - - -
失業率
Unemployment rate(%) 12.9 11.4 9.1 8.8 8.0 8.0 8.0 - 7.9 8.0 7.9 7.7 -
貿易収支*Trade Balance
(US$ m) -4,722 -5,332 -3,742 -666 -1,375 -516 -733 - -317 -194 - - -
輸出額Exports (US$ m) 29,566 29,319 25,489 6,485 6,180 5,969 6,410 - 2,033 2,270 - - -
輸出伸び率Exports Growth (y/y, %) 10.8 -0.8 -13.1 -18.4 -14.4 -4.0 -3.0 - -5.1 -1.6 - - -
輸入額 Imports (US$ m) 34,288 34,652 29,231 7,150 7,555 6,485 7,143 - 2,350 2,464 - - -
輸入伸び率Imports Growth (y/y, %) 4.8 1.1 -15.6 -21.1 -11.9 -8.5 -3.9 - -1.6 -2.9 - - -
経常収支
Current Account Balance(US$ m) 711 47 191 1,161 -856 294 580 -
資本収支Capital & Financial Account Balance (US$ m) 2,506 -1,499 930 547 815 513 40 -
対内直接投資Foreign Direct Investment (inflow) (US$ m) 1,920 1,710 - 442 224 487 701 -
外貨準備高International Reserve (US$ m) 18,335 18,576 20,783 21,109 20,783 22,719 23,214 -
対外債務残高Gross External Debt (US$ m) 51,864 48,666 37,959 39,370 37,959 40,468 - -
株価指数Stock price index 427.1 555.7 474.2 465.1 442.7 447.7 444.1 465.5 440.9 451.7 453.5 463.9 481.4
1.14 0.78 0.54 0.52 0.49 0.22 0.13 0.14 0.14 0.13 0.13 0.15 0.14
3.47 3.35 2.49 2.36 2.59 2.59 2.40 - 2.37 2.40 2.39 2.28 #N/A
Lev/USD 1.48 1.48 1.77 1.76 1.79 1.78 1.73 1.75 1.73 1.74 1.77 1.75 1.75Lev/EUR 1.96 1.96 1.96 1.96 1.96 1.96 1.96 1.96 1.96 1.96 1.96 1.96 1.96JPY/Lev 66.04 71.59 68.46 69.26 67.78 64.90 62.28 58.35 62.92 60.44 58.82 57.91 58.36(資料)Macrobond, Eurostat, 統計局(注)実質GDP成長率データは季節/稼働日調整済、鉱工業生産は季節調整済み、貿易収支は通関ベース(Source) Macrobond, Eurostat, National Statistics Office (Note) Q/Q real GDP growth: seasonally adjusted. Industrial production: Seasonally adjusted. Trade balance: Custom based
短期金利 (Interbank 3m)
Short-term interest rates (Interbank 3m)長期金利(10年物国債)Long-term interest rates (Gov.10y bond yields)
3.01.51.2
ブルガリア / Bulgaria
9

セルビア/Serbia2013 2014 2015 15/Q3 Q4 16/Q1 Q2 Q3 16/05 06 07 08 09
名目GDPNominal GDP
(US$ bn) 45.5 44.2 36.5 9.6 9.7 8.3 9.3 -
実質GDP成長率* (q/q, %) 0.3 -0.1 1.9 0.0 -Real GDPGrowth* (y/y, %) 2.4 1.8 4.0 2.0 -鉱工業生産*Industrial Production*
(y/y, %) 5.6 -6.1 8.4 13.2 10.2 10.4 2.4 - 0.9 -2.2 0.7 5.1 -
小売売上Retail Sales (y/y, %) -4.9 2.4 1.6 1.8 2.4 9.9 7.2 - 3.6 8.1 5.3 6.5 -
消費者物価上昇率Consumer Price Index (y/y, %) 7.9 2.1 1.4 1.5 1.4 1.5 0.5 - 0.7 0.3 1.2 1.2 -
賃金上昇率Wage Growth (y/y, %) 5.7 1.1 -0.4 -0.8 0.4 4.5 4.2 - 0.1 4.4 1.6 1.5 -
貿易収支*Trade Balance
(US$ m) -5,940 -5,764 -4,819 -1,092 -1,415 -998 -1,178 - -402 -465 -300 -400 -
輸出額Exports (US$ m) 14,611 14,845 13,380 3,384 3,331 3,407 3,921 - 1,271 1,333 1,234 1,149 -
輸出伸び率Exports Growth (y/y, %) 30.1 1.6 -9.9 -8.6 -7.0 9.0 10.8 - 5.8 8.3 2.1 13.4 -
輸入額 Imports (US$ m) 20,551 20,609 18,200 4,476 4,746 4,405 5,099 - 1,673 1,798 1,534 1,550 -
輸入伸び率Imports Growth (y/y, %) 8.6 0.3 -11.7 -14.3 -6.4 0.9 10.6 - 11.6 9.8 0.8 11.8 -
経常収支
Current Account Balance(US$ m) -2,786 -2,632 -1,749 -381 -487 -405 -307 -
資本収支Capital & Financial Account Balance (US$ m) -2,144 -2,253 -1,356 -269 -458 -206 -190 -
対内直接投資Foreign Direct Investment (inflow) (US$ m) 2,055 1,990 2,345 660 645 576 488 -
外貨準備高International Reserve (US$ m) 14,803 11,372 10,727 11,178 10,727 10,027 9,531 -
対外債務残高Gross External Debt (US$ m) 35,483 31,214 28,628 29,350 28,628 29,546 28,685 -
株価指数Stock price index 534.6 612.1 657.3 642.9 623.0 598.5 615.5 625.2 617.2 618.1 611.8 627.3 635.8
10.16 8.27 6.14 5.24 3.99 3.39 3.34 3.55 3.29 3.43 3.57 3.56 3.53
85.18 88.48 108.86 108.13 110.49 111.52 108.98 110.50 108.68 109.95 111.57 110.04 109.96113.08 117.35 120.73 120.18 120.93 122.94 123.05 123.31 122.85 123.49 123.36 123.32 123.27
JPY/Dinar 1.15 1.20 1.11 1.13 1.10 1.03 0.99 0.93 1.00 0.96 0.93 0.92 0.93(資料)Macrobond, Eurostat, 統計局(注)実質GDP成長率の前期比データは季節/稼働日調整済、鉱工業生産は季節調整済み、月次の鉱工業生産は製造業のみ、貿易収支は通関ベース
(Source) Macrobond, Eurostat, National Statistics Office (Note) Q/Q real GDP growth: seasonally adjusted. Industrial production: Seasonally adjusted, monthly data for IP covers only manufacturing sector. Trade balance: Custom based
Dinar/USDDinar/EUR
短期金利 (Interbank 3m)
Short-term interest rates (Interbank 3m)
0.8-1.82.6
セルビア / Serbia
10

マケドニア/Macedonia2013 2014 2015 15/Q3 Q4 16/Q1 Q2 Q3 16/05 06 07 08 09
名目GDPNominal GDP
(US$ bn) 10.8 11.3 10.1 2.7 2.6 2.5 2.7 -
実質GDP成長率*Real GDPGrowth*
(y/y, %) 2.9 3.6 3.7 3.6 3.9 2.0 2.2 -
鉱工業生産(製造業)*Industrial Production (Manufacturing)*
(y/y, %) 9.0 19.4 2.9 15.7 2.9 7.8 3.8 - 16.3 3.8 14.8 - -
小売売上Retail Sales (y/y, %) -8.0 -1.2 6.1 -1.1 6.1 15.5 7.6 - 7.2 7.6 7.9 11.2 -
消費者物価上昇率Consumer Price Index (y/y, %) 1.4 -0.6 -0.3 -0.2 -0.4 0.0 -0.6 - -0.6 -0.6 -0.3 - -
賃金上昇率Wage Growth (y/y, %) 1.2 1.2 2.4 3.0 1.8 2.8 1.6 - 1.1 0.7 - - -
失業率
Unemployment rate(%) 29.0 28.0 26.1 25.5 24.6 24.5 24.0 -
貿易収支*Trade Balance
(US$ m) -2,321 -2,337 -1,910 -400 -592 -412 -567 - -200.6 -184.5 -124.4 -176.6 -
輸出額Exports (US$ m) 4,299 4,964 4,490 1,150 1,154 1,086 1,191 - 400.1 372.9 447.4 388.0 -
輸出伸び率Exports Growth (y/y, %) 7.1 15.5 -9.6 -11.8 -7.7 4.3 4.0 - 0.3 -12.6 17.3 8.9 -
輸入額 Imports (US$ m) 6,620 7,301 6,400 1,550 1,746 1,498 1,758 - 600.7 557.4 571.7 564.6 -
輸入伸び率Imports Growth (y/y, %) 1.5 10.3 -12.3 -16.7 -6.3 2.2 7.3 - 14.5 -3.1 2.7 18.3 -
経常収支
Current Account Balance(US$ m) -178 -91 -141 145 -142 -12 - -
資本収支Capital & Financial Account Balance (US$ m) -122 -39 -98 163 -148 -17 - -
対内直接投資Foreign Direct Investment (inflow) (US$ m) 401 49 191 22 43 109 - -
外貨準備高International Reserve (US$ m) 2,485 2,701 2,239 2,205 2,239 2,296 2,106 -
対外債務残高Gross External Debt (US$ m) 7,194 7,287 6,942 6,982 6,942 7,595 - -
株価指数Stock price index 1,725.4 1,735.6 1,730.1 1,665.4 1,744.2 1,805.7 1,740.7 1,889.5 1,740.5 1,722.1 1,806.3 1,901.6 1,956.2
3.69 3.08 1.91 1.72 1.72 1.77 1.95 2.08 1.97 2.09 2.11 2.06 2.06
Denar/USD 46.39 46.44 55.35 55.27 56.09 55.75 54.39 55.04 54.33 54.66 55.47 54.85 54.81Denar/EUR 61.58 61.60 61.38 61.43 61.39 61.46 61.41 61.42 61.41 61.39 61.33 61.47 61.45JPY/Denar 2.10 2.28 2.19 2.21 2.16 2.07 1.98 1.86 2.00 1.93 1.88 1.85 1.86(資料)Macrobond , Eurostat, 統計局(注)実質GDP成長率データは季節/稼働日調整済、鉱工業生産は季節調整済み、貿易収支は通関ベース(Source) Macrobond, Eurostat, National Statistics Office (Note) Q/Q real GDP growth: seasonally adjusted. Industrial production: Seasonally adjusted. Trade balance: Custom based
短期金利 (Interbank 3m)
Short-term interest rates (Interbank 3m)
マケドニア / Macedonia
11
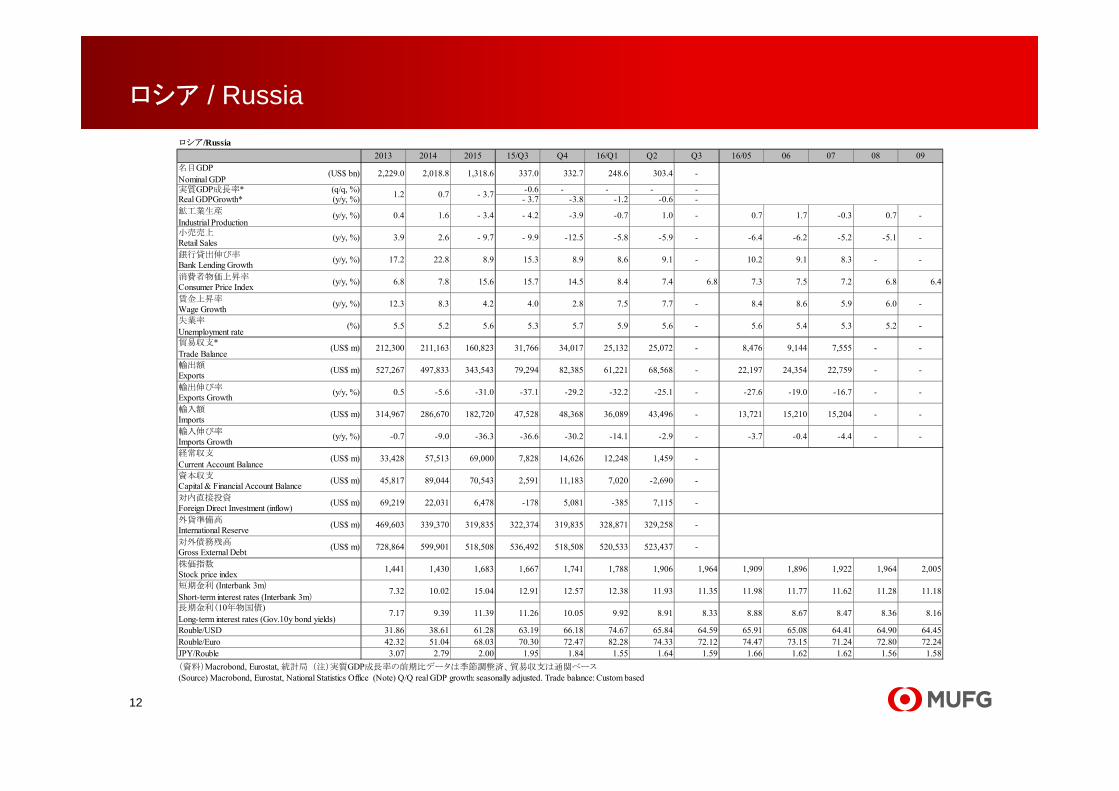
ロシア/Russia2013 2014 2015 15/Q3 Q4 16/Q1 Q2 Q3 16/05 06 07 08 09
名目GDPNominal GDP
(US$ bn) 2,229.0 2,018.8 1,318.6 337.0 332.7 248.6 303.4 -
実質GDP成長率* (q/q, %) -0.6 - - - -Real GDPGrowth* (y/y, %) - 3.7 -3.8 -1.2 -0.6 -鉱工業生産
Industrial Production(y/y, %) 0.4 1.6 - 3.4 - 4.2 -3.9 -0.7 1.0 - 0.7 1.7 -0.3 0.7 -
小売売上Retail Sales (y/y, %) 3.9 2.6 - 9.7 - 9.9 -12.5 -5.8 -5.9 - -6.4 -6.2 -5.2 -5.1 -
銀行貸出伸び率Bank Lending Growth (y/y, %) 17.2 22.8 8.9 15.3 8.9 8.6 9.1 - 10.2 9.1 8.3 - -
消費者物価上昇率Consumer Price Index (y/y, %) 6.8 7.8 15.6 15.7 14.5 8.4 7.4 6.8 7.3 7.5 7.2 6.8 6.4
賃金上昇率Wage Growth (y/y, %) 12.3 8.3 4.2 4.0 2.8 7.5 7.7 - 8.4 8.6 5.9 6.0 -
失業率
Unemployment rate(%) 5.5 5.2 5.6 5.3 5.7 5.9 5.6 - 5.6 5.4 5.3 5.2 -
貿易収支*Trade Balance
(US$ m) 212,300 211,163 160,823 31,766 34,017 25,132 25,072 - 8,476 9,144 7,555 - -
輸出額Exports (US$ m) 527,267 497,833 343,543 79,294 82,385 61,221 68,568 - 22,197 24,354 22,759 - -
輸出伸び率Exports Growth (y/y, %) 0.5 -5.6 -31.0 -37.1 -29.2 -32.2 -25.1 - -27.6 -19.0 -16.7 - -
輸入額 Imports (US$ m) 314,967 286,670 182,720 47,528 48,368 36,089 43,496 - 13,721 15,210 15,204 - -
輸入伸び率Imports Growth (y/y, %) -0.7 -9.0 -36.3 -36.6 -30.2 -14.1 -2.9 - -3.7 -0.4 -4.4 - -
経常収支
Current Account Balance(US$ m) 33,428 57,513 69,000 7,828 14,626 12,248 1,459 -
資本収支Capital & Financial Account Balance (US$ m) 45,817 89,044 70,543 2,591 11,183 7,020 -2,690 -
対内直接投資Foreign Direct Investment (inflow) (US$ m) 69,219 22,031 6,478 -178 5,081 -385 7,115 -
外貨準備高International Reserve (US$ m) 469,603 339,370 319,835 322,374 319,835 328,871 329,258 -
対外債務残高Gross External Debt (US$ m) 728,864 599,901 518,508 536,492 518,508 520,533 523,437 -
株価指数Stock price index 1,441 1,430 1,683 1,667 1,741 1,788 1,906 1,964 1,909 1,896 1,922 1,964 2,005
7.32 10.02 15.04 12.91 12.57 12.38 11.93 11.35 11.98 11.77 11.62 11.28 11.18
7.17 9.39 11.39 11.26 10.05 9.92 8.91 8.33 8.88 8.67 8.47 8.36 8.16
Rouble/USD 31.86 38.61 61.28 63.19 66.18 74.67 65.84 64.59 65.91 65.08 64.41 64.90 64.45Rouble/Euro 42.32 51.04 68.03 70.30 72.47 82.28 74.33 72.12 74.47 73.15 71.24 72.80 72.24JPY/Rouble 3.07 2.79 2.00 1.95 1.84 1.55 1.64 1.59 1.66 1.62 1.62 1.56 1.58(資料)Macrobond, Eurostat, 統計局(注)実質GDP成長率の前期比データは季節調整済、貿易収支は通関ベース(Source) Macrobond, Eurostat, National Statistics Office (Note) Q/Q real GDP growth: seasonally adjusted. Trade balance: Custom based
長期金利(10年物国債)Long-term interest rates (Gov.10y bond yields)
短期金利 (Interbank 3m)
Short-term interest rates (Interbank 3m)
1.2 0.7 - 3.7
ロシア / Russia
12

カザフスタン/Kazakhstan2013 2014 2015 15/Q3 Q4 16/Q1 Q2 Q3 16/05 06 07 08 09
名目GDPNominal GDP
(US$ bn) 224.3 215.8 183.1 49.0 43.3 26.2 30.0 -
実質GDP成長率
Real GDPGrowth(y/y, %) 5.2 3.8 1.6 1.2 1.2 - 0.1 0.1 -
鉱工業生産
Industrial Production(y/y, %) 2.3 0.2 -1.6 -4.2 - 3.2 - 0.8 - 2.8 - -5.3 0.1 0.1 -7.5 -
小売売上Retail Sales (y/y, %) 12.8 12.0 -0.1 1.8 - 8.0 - 3.1 0.8 - 2.2 0.3 0.1 4.1 -
消費者物価上昇率Consumer Price Index (y/y, %) 5.8 6.7 6.6 4.0 11.9 15.1 16.8 17.2 16.7 17.3 17.7 17.6 16.4
賃金上昇率Wage Growth (y/y, %) 6.8 10.9 3.8 2.0 3.8 11.9 15.6 -
失業率
Unemployment rate(%) 5.2 5.0 5.0 4.9 5.0 5.0 5.0 - 5.0 5.1 5.1 5.0 -
貿易収支*Trade Balance
(US$ m) 33,639 37,025 15,540 3,992 2,951 3,146 2,395 - 682 1,034 1,292 - -
輸出額Exports (US$ m) 82,512 78,238 45,726 11,674 9,992 8,311 8,475 - 2,725 3,033 3,164 - -
輸出伸び率Exports Growth (y/y, %) -10.6 -5.2 -41.6 -39.0 -42.1 -30.4 -30.1 - -32.0 -29.0 -15.2 - -
輸入額 Imports (US$ m) 48,873 41,213 30,186 7,682 7,041 5,166 6,080 - 2,042 1,999 1,872 - -
輸入伸び率Imports Growth (y/y, %) 9.7 -15.7 -26.8 -30.8 -35.6 -28.1 -26.6 - -23.6 -24.7 -29.9 - -
経常収支
Current Account Balance(US$ m) 1,187 5,957 -5,464 -1,968 -1,240 -1,068 -2,518 -
資本収支Capital & Financial Account Balance (US$ m) -310 -7,241 -9,841 -3,309 -2,490 -1,430 -3,624 -
対内直接投資Foreign Direct Investment (inflow) (US$ m) 10,011 7,091 6,585 1,717 1,667 2,784 5,072 -
外貨準備高International Reserve (US$ m) 19,127 21,814 20,299 20,637 20,299 19,339 20,291 -
対外債務残高Gross External Debt (US$ m) 150,033 157,428 153,456 155,649 153,456 153,988 - -
株価指数Stock price index 950 1,088 864 853 893 925 988 1,085 980 1,017 1,016 1,089 1,146
4.62 6.78 10.18 9.24 13.42 17.45 16.35 13.95 16.23 15.84 14.32 13.82 13.75
Tenge/USD 152.20 179.35 223.21 218.71 301.70 355.44 335.46 341.56 333.06 336.72 341.79 344.01 338.78Tenge/Euro 209.75 217.05 242.44 244.16 327.68 405.05 372.69 383.99 370.85 374.09 382.14 383.04 380.87JPY/Tenge 0.69 0.67 0.54 0.55 0.40 0.32 0.31 0.30 0.33 0.31 0.30 0.30 0.30(資料)Macrobond, Eurostat, 統計局(注)貿易収支は通関ベース(Source) Macrobond, Eurostat, National Statistics Office (Note) Trade balance: Custom based
短期金利 (Interbank 3m)
Short-term interest rates (Interbank 3m)
カザフスタン / Kazakhstan
13

ウクライナ /Ukraine2013 2014 2015 15/Q3 Q4 16/Q1 Q2 Q3 16/05 06 07 08 09
名目GDPNominal GDP
(US$ bn) 179.7 132.4 90.6 25.8 25.4 17.6 21.0 -
実質GDP成長率
Real GDPGrowth(y/y, %) -0.1 -6.3 -10.1 -7.2 -1.4 0.1 1.4 -
鉱工業生産
Industrial Production(y/y, %) -4.8 -10.3 -14.2 -8.1 -3.5 3.6 0.1 - 0.2 -3.4 -0.2 3.4 -
小売売上Retail Sales (y/y, %) 6.1 -8.3 -22.5 -19.1 -17.4 4.0 7.2 - 4.4 5.0 4.5 5.2 -
銀行貸出伸び率Bank Lending Growth (y/y, %) 11.7 12.1 -3.8 -0.5 -3.8 -13.8 -7.4 - -5.4 -7.4 -8.2 -4.8 -
消費者物価上昇率Consumer Price Index (y/y, %) -0.3 12.1 48.5 53.3 45.4 31.3 8.1 - 7.5 6.9 7.9 8.4 -
賃金上昇率Wage Growth (y/y, %) 8.0 6.1 21.1 24.5 29.0 26.6 23.3 - 23.3 24.1 22.4 23.7 -
失業率
Unemployment rate(%) 7.4 9.0 9.2 9.0 9.1 9.9 9.4 -
貿易収支*Trade Balance
(US$ m) -13,652 -468 633 -510 -104 -961 279 - 187 11 -265 - -
輸出額Exports (US$ m) 63,312 53,914 38,135 9,583 10,021 7,719 8,905 - 2,881 2,930 2,922 - -
輸出伸び率Exports Growth (y/y, %) -8.0 -14.8 -29.3 -28.2 -16.1 -18.1 -2.2 - -2.1 -5.3 -7.2 - -
輸入額 Imports (US$ m) 76,964 54,382 37,502 10,093 10,126 8,680 8,626 - 2,694 2,918 3,187 - -
輸入伸び率Imports Growth (y/y, %) -9.1 -29.3 -31.0 -23.1 -23.3 -4.0 4.6 - 2.4 5.9 6.8 - -
経常収支
Current Account Balance(US$ m) -16,518 -4,596 -189 225 -317 -1,222 615 -
資本収支Capital & Financial Account Balance (US$ m) -18,661 9,511 -126 -965 -1,156 -353 -575 -
対内直接投資Foreign Direct Investment (inflow) (US$ m) 4,509 847 3,050 915 743 1,389 749 -
外貨準備高International Reserve (US$ m) 18,776 6,622 12,368 11,784 12,368 11,631 12,914 -
対外債務残高Gross External Debt (US$ m) 142,079 126,308 118,729 125,107 118,729 117,358 - -
株価指数Stock price index 312.3 401.2 343.1 333.6 260.8 240.7 223.5 226.2 219.3 221.0 224.0 222.1 232.7
15.78 18.76 20.34 20.90 20.32 19.15 18.20 16.72 18.28 17.66 17.11 16.67 16.40
Hryvnia/USD 8.15 11.98 21.86 21.85 22.99 25.77 25.31 25.48 25.29 25.03 24.93 25.25 26.24 Hryvnia/Euro 10.83 15.90 24.24 24.28 25.16 28.41 28.58 28.43 28.59 28.11 27.56 28.30 29.41 JPY/Hryvnia 11.97 8.84 5.54 5.59 5.28 4.47 4.26 4.02 4.31 4.21 4.18 4.01 3.88 (資料)Macrobond, Eurostat, 統計局(注)貿易収支は通関ベース(Source) Macrobond, Eurostat, National Statistics Office (Note) Trade balance: Custom based
短期金利 (Interbank 3m)
Short-term interest rates (Interbank 3m)
ウクライナ / Ukraine
14

-5.0-4.0-3.0-2.0-1.00.01.02.03.04.05.0
-8.0
-6.0
-4.0
-2.0
0.0
2.0
4.0
6.0
8.0
06 08 10 12 14 16
(q/q,%)(y/y,%)チェコ/Czech Repblic
q/q (RHS) y/y
-5.0-4.0-3.0-2.0-1.00.01.02.03.04.05.0
-8.0
-6.0
-4.0
-2.0
0.0
2.0
4.0
6.0
8.0
06 08 10 12 14 16
(q/q,%)(y/y,%) ハンガリー/Hungary
q/q (RHS) y/y
-0.50.00.51.01.52.02.53.03.54.0
-1.00.01.02.03.04.05.06.07.08.0
06 08 10 12 14 16
(q/q,%)(y/y,%) ポーランド/Poland
q/q (RHS) y/y
-8.0-6.0-4.0-2.00.02.04.06.08.0
-12.0-10.0-8.0-6.0-4.0-2.00.02.04.06.08.0
10.012.0
06 08 10 12 14 16
(q/q,%)(y/y, %) ルーマニア/Romania
q/q (RHS) y/y
-10.0-8.0-6.0-4.0-2.00.02.04.06.08.010.0
-15.0
-10.0
-5.0
0.0
5.0
10.0
15.0
06 08 10 12 14 16
(q/q,%)(y/y,%) スロバキア/Slovakia
q/q (RHS) y/y
-10.0
-8.0
-6.0
-4.0
-2.0
0.0
2.0
4.0
6.0
8.0
06 08 10 12 14 16
(y/y,%) クロアチア/Croatia
実質GDP成長率 / Real GDP growth rate
15

-6.0
-4.0
-2.0
0.0
2.0
4.0
6.0
-10.0-8.0-6.0-4.0-2.00.02.04.06.08.0
10.0
06 08 10 12 14 16
(q/q,%)(y/y,%) ブルガリア/Bulgaria
q/q (RHS) y/y
-3.0-2.0-1.00.01.02.03.04.05.06.0
-5.0
-2.5
0.0
2.5
5.0
7.5
10.0
06 08 10 12 14 16
(y/y,%) セルビア/Serbia
q/q (RHS) y/y
-5.0-4.0-3.0-2.0-1.00.01.02.03.04.05.0
-12.0-9.0-6.0-3.00.03.06.09.0
12.0
06 08 10 12 14 16
(q/q,%)(y/y,%) ロシア/Russia
q/q (RHS) y/y
-6.0-4.0-2.00.02.04.06.08.0
10.012.0
06 08 10 12 14 16
(y/y,%) マケドニア/Macedonia
-4.0
-2.0
0.0
2.0
4.0
6.0
8.0
10.0
12.0
07 08 09 10 11 12 13 14 15 16
(y/y,%)カザフスタン/Kazakhstan
-25.0
-20.0
-15.0
-10.0
-5.0
0.0
5.0
10.0
15.0
06 08 10 12 14 16
(y/y,%) ウクライナ/Ukraine
実質GDP成長率 / Real GDP growth rate
16

23.0
24.0
25.0
26.0
27.0
28.0
29.0
16.0
18.0
20.0
22.0
24.0
26.0
28.0
11 12 13 14 15 16
(Koruna/EUR)(Koruna/USD)
チェコ・コルナ/ Czech Koruna
Koruna/USD Koruna/EUR
260.0270.0280.0290.0300.0310.0320.0330.0
166.0186.0206.0226.0246.0266.0286.0306.0
11 12 13 14 15 16
(Forint/EUR)(Forint/USD)
ハンガリー・フォリント/ Hungary Forint
Forint/USD Forint/EUR
3.75
4.00
4.25
4.50
4.75
2.50
2.75
3.00
3.25
3.50
3.75
4.00
4.25
11 12 13 14 15 16
(Zloty/EUR)(Zloty/USD)ポーランド・ズロチ/ Polish Zloty
Zloty/USD Zloty/EUR
4.00
4.25
4.50
4.75
2.50
2.75
3.00
3.25
3.50
3.75
4.00
4.25
11 12 13 14 15 16
(Leu/EUR)(Leu/USD)ルーマニア・レイ/ Romanian Leu
Leu/USD Leu/EUR
1.90
1.92
1.94
1.96
1.98
2.00
1.301.401.501.601.701.801.90
11 12 13 14 15 16
(Lev/EUR)(Lev/USD)ブルガリア・レフ/ Bulgarian Lev
Lev/USD Lev/EUR
Currency pegged against euro at 1.95583
7.20
7.40
7.60
7.80
8.00
4.755.005.255.505.756.006.256.506.757.007.257.50
11 12 13 14 15 16
(Kuna/EUR)(Kuna/USD)クロアチア・クーナ/ Croatian Kuna
Kuna/USD Kuna/EUR
為替相場 / Exchange rates
17

58.059.060.061.062.063.064.065.0
40.0
45.0
50.0
55.0
60.0
11 12 13 14 15 16
(Denar/EUR)(Denar/USD)マケドニア・デナール/ Macedonian
Denar
Denar/USD Denar/EUR
Currency pegged against euro at 61.5053
35.0
45.0
55.0
65.0
75.0
85.0
95.0
25.0
35.0
45.0
55.0
65.0
75.0
85.0
11 12 13 14 15 16
(Rouble/EUR)(Rouble/USD)
ロシア・ルーブル/ Russian Rouble
Rouble/USD Rouble/EUR
160.0200.0240.0280.0320.0360.0400.0440.0
120.0160.0200.0240.0280.0320.0360.0400.0
11 12 13 14 15 16
(Tenge/EUR)(Tenge/USD)
カザフスタン・テンゲ/Kazakh Tenge
Tenge/USD Tenge/EUR
5.0
10.0
15.0
20.0
25.0
30.0
35.0
40.0
5.0
10.0
15.0
20.0
25.0
30.0
35.0
11 12 13 14 15 16
(Hryvnia/EUR)(Hryvnia/USD)
ウクライナ・フリブニャ/Ukrainian Hryvnia
Hryvnia/USD Hryvnia/EUR
90.0
100.0
110.0
120.0
130.0
140.0
150.0
75.0
85.0
95.0
105.0
115.0
125.0
135.0
11 12 13 14 15 16
(JPY/EUR)(JPY/USD)日本・円/Japanese Yen
JPY/USD JPY/EUR
95.0
100.0
105.0
110.0
115.0
120.0
125.0
60.0
70.0
80.0
90.0
100.0
110.0
120.0
11 12 13 14 15 16
(Dinar/EUR)(Dinar/USD)セルビア・ディナール/ Serbian Dinar
Dinar/USD Dinar/EUR
為替相場 / Exchange rates
18

当資料は情報提供のみを目的として作成されたものであり、金融商品の売買や投資など何らか
の行動を勧誘するものではありません。ご利用に関しては、すべてお客様御自身でご判断下さい
ますよう、宜しくお願い申し上げます。当資料は信頼できると思われる情報に基づいて作成されて
いますが、当室はその正確性を保証するものではありません。内容は予告なしに変更することが
ありますので、予めご了承下さい。また、当資料は著作物であり、著作権法により保護されており
ます。全文または一部を転載する場合は出所を明記してください。
The Bank of Tokyo-Mitsubishi UFJ, Ltd. (“BTMU”) is a limited liability stock company incorporated in Japan and registered in the Tokyo Legal Affairs Bureau (company no. 0100-01-008846). BTMU’s head office is at 7-1 Marunouchi 2-Chome, Chiyoda-Ku, Tokyo 100-8388, Japan. BTMU’s London branch is registered as a UK establishment in the UK register of companies (registered no. BR002013). BTMU is authorised and regulated by the Japanese Financial Services Agency. BTMU’s London branch is authorised by the Prudential Regulation Authority (FCA/PRA no. 139189) and subject to regulation by the Financial Conduct Authority and limited regulation by the Prudential Regulation Authority. Details about the extent of BTMU London branch’s regulation by the Prudential Regulation Authority are available from us on request.

This report shall not be construed as solicitation to take any action such as purchasing/selling/investing in financial market products. In taking any action, each reader is requested to act on the basis of his or her own judgment. This report is based on information believed to be reliable, but we do not guarantee, and do not accept any liability whatsoever for, its accuracy and we accept no liability whatsoever for any loss or damage of any kind arising out of the use of all or any part of this report. The contents of the report may be revised without advance notice. Also, this report is a literary work protected by copyright. No part of this report may be reproduced in any form without express statement of its source.
The Bank of Tokyo-Mitsubishi UFJ, Ltd. retains copyright to this report and no part of this report may be reproduced or re-distributed without the written permission of The Bank of Tokyo-Mitsubishi UFJ, Ltd. The Bank of Tokyo-Mitsubishi UFJ, Ltd. expressly prohibits the re-distribution of this report to Retail Customers, via the internet or otherwise and The Bank of Tokyo-Mitsubishi UFJ, Ltd., its subsidiaries or affiliates accept no liability whatsoever to any third parties resulting from such re-distribution.
The Bank of Tokyo-Mitsubishi UFJ, Ltd.25 Ropemaker street, LondonEC2Y 9AN, UK
www.mufg.jp/www.mufg.jp/english
21


![セレブレーション-日本ポーランド現代美術展-0414_press... · 1 広報資料 Ver.03 [29th March. 2019] 日本ポーランド国交樹立100周年記念 ポーランド芸術祭2019](https://static.fdocuments.net/doc/165x107/5e41c87ab944a146126978ac/ffffffioefffffccei-0414press.jpg)