2015Q3 - Lee Associates Manhattan Office Report
12
LEE NYC MANHATTAN TREND TRACKER 3Q2015 THE OFFICE MARKET REPORT
-
Upload
joel-herskowitz -
Category
Documents
-
view
89 -
download
1
Transcript of 2015Q3 - Lee Associates Manhattan Office Report
LEE NYCMANHATTAN TREND TRACKER3Q2015
THE OFFICE MARKET REPORT
HUDSONRIVER
EASTRIVER
PLAZAPLAZADISTRICTDISTRICTPLAZAPLAZAPLAZAPLAZAPLAZAPLAZAPLAZAPLAZAPLAZAPLAZAPLAZAPLAZAPLAZAPLAZA
DISTRICTDISTRICTDISTRICTDISTRICTDISTRICTDISTRICTDISTRICTDISTRICTDISTRICTDISTRICTDISTRICTDISTRICTDISTRICTDISTRICT
MIDTOWN WESTMIDTOWN WESTMIDTOWN WESTMIDTOWN WESTMIDTOWN WESTMIDTOWN WESTMIDTOWN WESTMIDTOWN WESTMIDTOWN WESTMIDTOWN WESTMIDTOWN WESTMIDTOWN WESTMIDTOWN WESTMIDTOWN WESTMIDTOWN WESTMIDTOWN WEST
MIDTOWN EASTMIDTOWN EASTMIDTOWN EASTMIDTOWN EASTMIDTOWN EASTMIDTOWN EASTMIDTOWN EASTMIDTOWN EASTMIDTOWN EASTMIDTOWN EASTMIDTOWN EASTMIDTOWN EASTMIDTOWN EASTMIDTOWN EASTMIDTOWN EASTMIDTOWN EASTMIDTOWN EASTMIDTOWN EASTMIDTOWN EAST
GRAND CENTRALGRAND CENTRALGRAND CENTRALGRAND CENTRALGRAND CENTRALGRAND CENTRALGRAND CENTRALGRAND CENTRALGRAND CENTRALGRAND CENTRALGRAND CENTRALGRAND CENTRALGRAND CENTRALGRAND CENTRALGRAND CENTRALGRAND CENTRALGRAND CENTRALGRAND CENTRALGRAND CENTRALGRAND CENTRALGRAND CENTRALGRAND CENTRALGRAND CENTRALGRAND CENTRALGRAND CENTRALGRAND CENTRALGRAND CENTRALGRAND CENTRALGRAND CENTRALGRAND CENTRALGRAND CENTRALGRAND CENTRALGRAND CENTRALGRAND CENTRAL
TIMES SQUARETIMES SQUARETIMES SQUARETIMES SQUARETIMES SQUARETIMES SQUARETIMES SQUARETIMES SQUARETIMES SQUARETIMES SQUARETIMES SQUARETIMES SQUARETIMES SQUARETIMES SQUARETIMES SQUARETIMES SQUARETIMES SQUARETIMES SQUARETIMES SQUARE
CITY HALLCITY HALLCITY HALL| INSURANCE DISTRICT| INSURANCE DISTRICT| INSURANCE DISTRICT| INSURANCE DISTRICT
CITY HALLCITY HALLCITY HALLCITY HALLCITY HALLCITY HALLCITY HALLCITY HALLCITY HALLCITY HALLCITY HALLCITY HALLCITY HALLCITY HALLCITY HALLCITY HALLCITY HALLCITY HALLCITY HALLCITY HALLCITY HALLCITY HALLCITY HALLCITY HALLCITY HALLCITY HALLCITY HALLCITY HALLCITY HALLCITY HALL| INSURANCE DISTRICT| INSURANCE DISTRICT| INSURANCE DISTRICT| INSURANCE DISTRICT| INSURANCE DISTRICT| INSURANCE DISTRICT| INSURANCE DISTRICT| INSURANCE DISTRICT| INSURANCE DISTRICT| INSURANCE DISTRICT| INSURANCE DISTRICT| INSURANCE DISTRICT| INSURANCE DISTRICT| INSURANCE DISTRICT| INSURANCE DISTRICT| INSURANCE DISTRICT| INSURANCE DISTRICT| INSURANCE DISTRICT| INSURANCE DISTRICT| INSURANCE DISTRICT| INSURANCE DISTRICT| INSURANCE DISTRICT| INSURANCE DISTRICT| INSURANCE DISTRICT| INSURANCE DISTRICT| INSURANCE DISTRICT| INSURANCE DISTRICT| INSURANCE DISTRICT| INSURANCE DISTRICT| INSURANCE DISTRICT| INSURANCE DISTRICT| INSURANCE DISTRICT| INSURANCE DISTRICT| INSURANCE DISTRICT| INSURANCE DISTRICT| INSURANCE DISTRICT| INSURANCE DISTRICT| INSURANCE DISTRICT| INSURANCE DISTRICT| INSURANCE DISTRICT| INSURANCE DISTRICT| INSURANCE DISTRICT| INSURANCE DISTRICT| INSURANCE DISTRICT| INSURANCE DISTRICT| INSURANCE DISTRICT| INSURANCE DISTRICT| INSURANCE DISTRICT| INSURANCE DISTRICT| INSURANCE DISTRICT| INSURANCE DISTRICT
WORLDWORLDWORLDTRADETRADECENTERCENTER
WORLDWORLDWORLDWORLDWORLDWORLDWORLDWORLDWORLDWORLDWORLDWORLDWORLDTRADETRADETRADETRADETRADETRADETRADETRADETRADETRADECENTERCENTERCENTERCENTERCENTERCENTERCENTERCENTERCENTERCENTER
FINANCIALDISTRICTDISTRICTDISTRICT
FINANCIALFINANCIALFINANCIALFINANCIALFINANCIALFINANCIALFINANCIALFINANCIALFINANCIALFINANCIALFINANCIALFINANCIALFINANCIALFINANCIALFINANCIALFINANCIALFINANCIALFINANCIALFINANCIALFINANCIALFINANCIALFINANCIALFINANCIALFINANCIALFINANCIALFINANCIALFINANCIALFINANCIALFINANCIALFINANCIALFINANCIALFINANCIALFINANCIALFINANCIALFINANCIALFINANCIALDISTRICTDISTRICTDISTRICTDISTRICTDISTRICTDISTRICTDISTRICTDISTRICTDISTRICTDISTRICTDISTRICTDISTRICTDISTRICTDISTRICTDISTRICTDISTRICTDISTRICTDISTRICTDISTRICTDISTRICTDISTRICTDISTRICTDISTRICTDISTRICTDISTRICTDISTRICTDISTRICTDISTRICTDISTRICTDISTRICTDISTRICTDISTRICTDISTRICTDISTRICTDISTRICTDISTRICTDISTRICT
ROCKEFELLERROCKEFELLERCENTERCENTER
ROCKEFELLERROCKEFELLERROCKEFELLERROCKEFELLERROCKEFELLERROCKEFELLERROCKEFELLERROCKEFELLERROCKEFELLERROCKEFELLERROCKEFELLERCENTERCENTERCENTERCENTERCENTERCENTERCENTERCENTERCENTERCENTERCENTER
PENN STATION | GARMENT DISTRICTPENN STATION | GARMENT DISTRICTPENN STATION | GARMENT DISTRICTPENN STATION | GARMENT DISTRICTPENN STATION | GARMENT DISTRICTPENN STATION | GARMENT DISTRICTPENN STATION | GARMENT DISTRICTPENN STATION | GARMENT DISTRICTPENN STATION | GARMENT DISTRICTPENN STATION | GARMENT DISTRICTPENN STATION | GARMENT DISTRICTPENN STATION | GARMENT DISTRICTPENN STATION | GARMENT DISTRICTPENN STATION | GARMENT DISTRICTPENN STATION | GARMENT DISTRICTPENN STATION | GARMENT DISTRICTPENN STATION | GARMENT DISTRICTPENN STATION | GARMENT DISTRICTPENN STATION | GARMENT DISTRICTPENN STATION | GARMENT DISTRICTPENN STATION | GARMENT DISTRICTPENN STATION | GARMENT DISTRICTPENN STATION | GARMENT DISTRICTPENN STATION | GARMENT DISTRICTPENN STATION | GARMENT DISTRICTPENN STATION | GARMENT DISTRICTPENN STATION | GARMENT DISTRICTPENN STATION | GARMENT DISTRICTPENN STATION | GARMENT DISTRICTPENN STATION | GARMENT DISTRICTPENN STATION | GARMENT DISTRICTPENN STATION | GARMENT DISTRICTPENN STATION | GARMENT DISTRICTPENN STATION | GARMENT DISTRICTPENN STATION | GARMENT DISTRICTPENN STATION | GARMENT DISTRICT
CHELSEACHELSEACHELSEACHELSEACHELSEACHELSEACHELSEACHELSEACHELSEACHELSEACHELSEACHELSEACHELSEA
MURRAY HILLMURRAY HILLMURRAY HILLMURRAY HILLMURRAY HILLMURRAY HILLMURRAY HILLMURRAY HILLMURRAY HILLMURRAY HILLMURRAY HILLMURRAY HILLMURRAY HILLMURRAY HILLMURRAY HILLMURRAY HILLMURRAY HILLMURRAY HILLMURRAY HILLMURRAY HILLMURRAY HILLMURRAY HILLMURRAY HILLMURRAY HILLMURRAY HILL
GRAMERCY | FLATIRONGRAMERCY | FLATIRONGRAMERCY | FLATIRONGRAMERCY | FLATIRONGRAMERCY | FLATIRONGRAMERCY | FLATIRONGRAMERCY | FLATIRONGRAMERCY | FLATIRONGRAMERCY | FLATIRONGRAMERCY | FLATIRONGRAMERCY | FLATIRONGRAMERCY | FLATIRONGRAMERCY | FLATIRONGRAMERCY | FLATIRONGRAMERCY | FLATIRONGRAMERCY | FLATIRONGRAMERCY | FLATIRONGRAMERCY | FLATIRONGRAMERCY | FLATIRONGRAMERCY | FLATIRONGRAMERCY | FLATIRONGRAMERCY | FLATIRONGRAMERCY | FLATIRONGRAMERCY | FLATIRONGRAMERCY | FLATIRONGRAMERCY | FLATIRONGRAMERCY | FLATIRONGRAMERCY | FLATIRONGRAMERCY | FLATIRON
SOHO | NOHOSOHO | NOHOSOHO | NOHOSOHO | NOHOSOHO | NOHOSOHO | NOHOSOHO | NOHOSOHO | NOHOSOHO | NOHOSOHO | NOHOSOHO | NOHOSOHO | NOHOSOHO | NOHOSOHO | NOHOSOHO | NOHOSOHO | NOHOSOHO | NOHOSOHO | NOHOSOHO | NOHOSOHO | NOHOSOHO | NOHOSOHO | NOHOSOHO | NOHOSOHO | NOHOSOHO | NOHOSOHO | NOHOSOHO | NOHOSOHO | NOHOSOHO | NOHOSOHO | NOHOSOHO | NOHOSOHO | NOHOSOHO | NOHO
HUDSON SQ.HUDSON SQ.| TRIBECA| TRIBECA| TRIBECA
HUDSON SQ.HUDSON SQ.HUDSON SQ.HUDSON SQ.HUDSON SQ.HUDSON SQ.HUDSON SQ.HUDSON SQ.HUDSON SQ.HUDSON SQ.HUDSON SQ.HUDSON SQ.HUDSON SQ.HUDSON SQ.HUDSON SQ.HUDSON SQ.HUDSON SQ.HUDSON SQ.HUDSON SQ.HUDSON SQ.HUDSON SQ.HUDSON SQ.HUDSON SQ.HUDSON SQ.HUDSON SQ.HUDSON SQ.HUDSON SQ.HUDSON SQ.HUDSON SQ.HUDSON SQ.HUDSON SQ.HUDSON SQ.HUDSON SQ.HUDSON SQ.HUDSON SQ.HUDSON SQ.HUDSON SQ.HUDSON SQ.HUDSON SQ.HUDSON SQ.| TRIBECA| TRIBECA| TRIBECA| TRIBECA| TRIBECA| TRIBECA| TRIBECA| TRIBECA| TRIBECA| TRIBECA| TRIBECA| TRIBECA| TRIBECA| TRIBECA| TRIBECA| TRIBECA| TRIBECA| TRIBECA| TRIBECA| TRIBECA| TRIBECA| TRIBECA| TRIBECA| TRIBECA| TRIBECA| TRIBECA| TRIBECA| TRIBECA| TRIBECA| TRIBECA| TRIBECA| TRIBECA| TRIBECA| TRIBECA| TRIBECA| TRIBECA| TRIBECA| TRIBECA| TRIBECA| TRIBECA| TRIBECA
FDR
DRI
VEFD
R D
RIVE
WES
T SI
DE
HIG
HW
AYW
EST
SID
E H
IGH
WAY
12TH
AVE
12TH
AVE
111TH
AVE
1TH
AVE
WES
T ST
WES
T ST
FDR
DRI
VEFD
R D
RIVE
AVEN
UE O
F TH
E A
MER
ICA
S
AVEN
UE O
F TH
E A
MER
ICA
S
AVEN
UE O
F TH
E A
MER
ICA
S
AVEN
UE O
F TH
E A
MER
ICA
S
AVEN
UE O
F TH
E A
MER
ICA
S
AVEN
UE O
F TH
E A
MER
ICA
S
AVEN
UE O
F TH
E A
MER
ICA
S
AVEN
UE O
F TH
E A
MER
ICA
S
AVEN
UE O
F TH
E A
MER
ICA
S
AVEN
UE O
F TH
E A
MER
ICA
S
AVEN
UE O
F TH
E A
MER
ICA
S
AVEN
UE O
F TH
E A
MER
ICA
S
AVEN
UE O
F TH
E A
MER
ICA
S
AVEN
UE O
F TH
E A
MER
ICA
S
AVEN
UE O
F TH
E A
MER
ICA
S
AVEN
UE O
F TH
E A
MER
ICA
S
AVEN
UE O
F TH
E A
MER
ICA
S
AVEN
UE O
F TH
E A
MER
ICA
S
AVEN
UE O
F TH
E A
MER
ICA
S
AVEN
UE O
F TH
E A
MER
ICA
S
AVEN
UE O
F TH
E A
MER
ICA
S
AVEN
UE O
F TH
E A
MER
ICA
S
AVEN
UE O
F TH
E A
MER
ICA
S
AVEN
UE O
F TH
E A
MER
ICA
S
AVEN
UE O
F TH
E A
MER
ICA
S
AVEN
UE O
F TH
E A
MER
ICA
S
AVEN
UE O
F TH
E A
MER
ICA
S
AVEN
UE O
F TH
E A
MER
ICA
S
AVEN
UE O
F TH
E A
MER
ICA
SAV
ENUE
OF
THE
AM
ERIC
AS
AVEN
UE O
F TH
E A
MER
ICA
SAV
ENUE
OF
THE
AM
ERIC
AS
AVEN
UE O
F TH
E A
MER
ICA
SAV
ENUE
OF
THE
AM
ERIC
AS
AVEN
UE O
F TH
E A
MER
ICA
SAV
ENUE
OF
THE
AM
ERIC
AS
AVEN
UE O
F TH
E A
MER
ICA
SAV
ENUE
OF
THE
AM
ERIC
AS
AVEN
UE O
F TH
E A
MER
ICA
SAV
ENUE
OF
THE
AM
ERIC
AS
AVEN
UE O
F TH
E A
MER
ICA
SAV
ENUE
OF
THE
AM
ERIC
AS
AVEN
UE O
F TH
E A
MER
ICA
SAV
ENUE
OF
THE
AM
ERIC
AS
AVEN
UE O
F TH
E A
MER
ICA
SAV
ENUE
OF
THE
AM
ERIC
AS
AVEN
UE O
F TH
E A
MER
ICA
SAV
ENUE
OF
THE
AM
ERIC
AS
AVEN
UE O
F TH
E A
MER
ICA
SAV
ENUE
OF
THE
AM
ERIC
AS
AVEN
UE O
F TH
E A
MER
ICA
S
8TH
AVE
8TH
AVE
8TH
AVE
8TH
AVE
BRO
ADW
AY
BRO
ADW
AY
BRO
ADW
AY
BRO
ADW
AY
BRO
ADW
AY
BRO
ADW
AYBR
OA
DWAY
BRO
ADW
AYBR
OA
DWAY
BRO
ADW
AY
BRO
ADW
AYBR
OAD
WAY
BRO
ADW
AYBR
OAD
WAY
BRO
ADW
AYBR
OAD
WAY
BRO
ADW
AYBR
OA
DWAY
BRO
ADW
AYBR
OA
DWAY
BRO
ADW
AY
BRO
ADW
AYBR
OA
DWAY
BRO
ADW
AYBR
OA
DWAY
BRO
ADW
AY
HUDS
ON
ST
HUDS
ON
ST
HUDS
ON
ST
HUDS
ON
ST
HUDS
ON
ST
HUDS
ON
ST
HUDS
ON
ST
VARI
CK S
TVA
RICK
ST
VARI
CK S
TVA
RICK
ST
VARI
CK S
TVA
RICK
ST
BRO
ADW
AYBR
OA
DWAY
BRO
ADW
AYBR
OA
DWAY
BRO
ADW
AY
W B
ROA
DWAY
W B
ROA
DWAY
W B
ROA
DWAY
W B
ROA
DWAY
W B
ROA
DWAY
BRO
ADW
AYBR
OA
DWAY
BRO
ADW
AYBR
OA
DWAY
BRO
ADW
AYBR
OA
DWAY
BRO
ADW
AYBR
OA
DWAY
BRO
ADW
AYBR
OA
DWAY
BRO
ADW
AYBR
OA
DWAY
BRO
ADW
AYTRIN
ITY P
LTR
INITY
PL
TRIN
ITY P
LTR
INITY
PL
WILL
IAM
ST
WILL
IAM
ST
WILL
IAM
ST
WILL
IAM
ST
WILL
IAM
ST
GO
LD S
TG
OLD
ST
GO
LD S
TG
OLD
ST W
ATER
ST
WAT
ER S
TW
ATER
ST
WAT
ER S
TW
ATER
ST
WAT
ER S
T
8TH
AVE
8TH
AVE
8TH
AVE
8TH
AVE
110TH
AVE
0TH
AVE
0TH
AVE
0TH
AVE
1110TH
AVE
0TH
AVE
0TH
AVE
0TH
AVE
0TH
AVE
CEN
TRA
L PA
RK W
EST
CEN
TRA
L PA
RK W
EST
CEN
TRA
L PA
RK W
EST
CEN
TRA
L PA
RK W
EST
CEN
TRA
L PA
RK W
EST
CEN
TRA
L PA
RK W
EST
CEN
TRA
L PA
RK W
EST
CEN
TRA
L PA
RK W
EST
CEN
TRA
L PA
RK W
EST
CEN
TRA
L PA
RK W
EST
CEN
TRA
L PA
RK W
EST
CEN
TRA
L PA
RK W
EST
CEN
TRA
L PA
RK W
EST
CEN
TRA
L PA
RK W
EST
CEN
TRA
L PA
RK W
EST
CENTRAL PARK SOUTHCENTRAL PARK SOUTHCENTRAL PARK SOUTHCENTRAL PARK SOUTHCENTRAL PARK SOUTHCENTRAL PARK SOUTHCENTRAL PARK SOUTHCENTRAL PARK SOUTHCENTRAL PARK SOUTHCENTRAL PARK SOUTHCENTRAL PARK SOUTHCENTRAL PARK SOUTHCENTRAL PARK SOUTH
AVEN
UE O
F TH
E A
MER
ICA
SAV
ENUE
OF
THE
AM
ERIC
AS
AVEN
UE O
F TH
E A
MER
ICA
SAV
ENUE
OF
THE
AM
ERIC
AS
AVEN
UE O
F TH
E A
MER
ICA
SAV
ENUE
OF
THE
AM
ERIC
AS
AVEN
UE O
F TH
E A
MER
ICA
SAV
ENUE
OF
THE
AM
ERIC
AS
AVEN
UE O
F TH
E A
MER
ICA
SAV
ENUE
OF
THE
AM
ERIC
AS
AVEN
UE O
F TH
E A
MER
ICA
SAV
ENUE
OF
THE
AM
ERIC
AS
AVEN
UE O
F TH
E A
MER
ICA
SAV
ENUE
OF
THE
AM
ERIC
AS
AVEN
UE O
F TH
E A
MER
ICA
SAV
ENUE
OF
THE
AM
ERIC
AS
AVEN
UE O
F TH
E A
MER
ICA
SAV
ENUE
OF
THE
AM
ERIC
AS
AVEN
UE O
F TH
E A
MER
ICA
SAV
ENUE
OF
THE
AM
ERIC
AS
AVEN
UE O
F TH
E A
MER
ICA
SAV
ENUE
OF
THE
AM
ERIC
AS
5TH
AVE
5TH
AVE
5TH
AVE
5TH
AVE
5TH
AVE
1ST
AVE
1ST
AVE
1ST
AVE
1ST
AVE
1ST
AVE
1ST
AVE
1ST
AVE
1ST
AVE
1ST
AVE
1ST
AVE
1ST
AVE
1ST
AVE
1ST
AVE
1ST
AVE
1ST
AVE
1ST
AVE
1ST
AVE
AVE
AAV
E A
AVE
AAV
E A
ALL
EN S
TA
LLEN
ST
ALL
EN S
TA
LLEN
ST
ALL
EN S
T
BOW
ERY
BOW
ERY
BOW
ERY
BOW
ERY
DELANCEY STDELANCEY ST
DELANCEY STDELANCEY STDELANCEY STDELANCEY STDELANCEY STDELANCEY ST
E HOUSTON STE HOUSTON STE HOUSTON STE HOUSTON STE HOUSTON STE HOUSTON ST
W HOUSTON STW HOUSTON STW HOUSTON STW HOUSTON STW HOUSTON STW HOUSTON STW HOUSTON ST
W HOUSTON ST
W HOUSTON ST
W HOUSTON ST
W HOUSTON ST
W HOUSTON ST
W HOUSTON ST
GANESEVOORT ST
GANESEVOORT ST
GANESEVOORT ST
GANESEVOORT ST
GANESEVOORT ST
GANESEVOORT ST
GANESEVOORT ST
W 4TH STW 4TH STW 4TH STW 4TH ST E 4TH STE 4TH STE 4TH ST
CHAMBERS STCHAMBERS STCHAMBERS STCHAMBERS STCHAMBERS STCHAMBERS STCHAMBERS STCHAMBERS STCHAMBERS STCHAMBERS STCHAMBERS STCHAMBERS STCHAMBERS ST
VESEY STVESEY STVESEY STVESEY STVESEY STVESEY STVESEY STVESEY ST
PARK PLPARK PLPARK PL
WORTH STWORTH STWORTH STWORTH STWORTH ST
FRANKLIN ST
FRANKLIN ST
FRANKLIN ST
FRANKLIN ST
FRANKLIN ST
WALL STWALL STWALL STWALL ST
BATTERYBATTERYBATTERYBATTERYBATTERYBATTERY
PLPL
BEAVER ST
BEAVER ST
BEAVER ST
BEAVER ST
BEAVER ST
CANAL STCANAL STCANAL STCANAL STCANAL STCANAL STCANAL ST
CANAL ST
CANAL ST
CANAL ST
CANAL ST
CANAL ST
CANAL ST
CANAL ST
CANAL ST
CANAL ST
CANAL ST
CANAL ST
PARK
ROW
PARK
ROW
PARK
ROW
PARK
ROW
PARK
ROW
PARK
ROW
PARK
ROW
PARK
ROW
CEN
TRE
STCE
NTR
E ST
CEN
TRE
STCE
NTR
E ST
5TH
AVE
5TH
AVE
5TH
AVE
5TH
AVE
5TH
AVE
LEXI
NG
TON
AVE
LEXI
NG
TON
AVE
LEXI
NG
TON
AVE
LEXI
NG
TON
AVE
LEXI
NG
TON
AVE
LEXI
NG
TON
AVE
LEXI
NG
TON
AVE
LEXI
NG
TON
AVE
LEXI
NG
TON
AVE
LEXI
NG
TON
AVE
LEXI
NG
TON
AVE
LEXI
NG
TON
AVE
5TH
AVE
5TH
AVE
5TH
AVE
5TH
AVE
5TH
AVE
W 14TH STW 14TH STW 14TH STW 14TH STW 14TH ST
W 23RD STW 23RD STW 23RD ST E 23RD STE 23RD STE 23RD STE 23RD ST
W 34TH STW 34TH STW 34TH ST E 34TH STE 34TH STE 34TH ST
W 42ND STW 42ND STW 42ND ST E 42ND STE 42ND STE 42ND STE 42ND STE 42ND ST
W 47TH STW 47TH STW 47TH ST E 47TH STE 47TH STE 47TH STE 47TH STE 47TH STE 47TH STE 47TH ST
W 57TH STW 57TH STW 57TH ST E 57TH STE 57TH STE 57TH ST
E 14TH STE 14TH STE 14TH STE 14TH STE 14TH STE 14TH STE 14TH STE 14TH ST
CEN
TRA
L PA
RK W
EST
CEN
TRA
L PA
RK W
EST
CEN
TRA
L PA
RK W
EST
CEN
TRA
L PA
RK W
ESTW 65TH STW 65TH STW 65TH STW 65TH STW 65TH STW 65TH STW 65TH ST E 65TH STE 65TH STE 65TH STE 65TH STE 65TH ST
LEE NYCMANHATTAN TREND TRACKER3Q2015
MANHATTAN TREND TRACKER 3RD QUARTER 20152
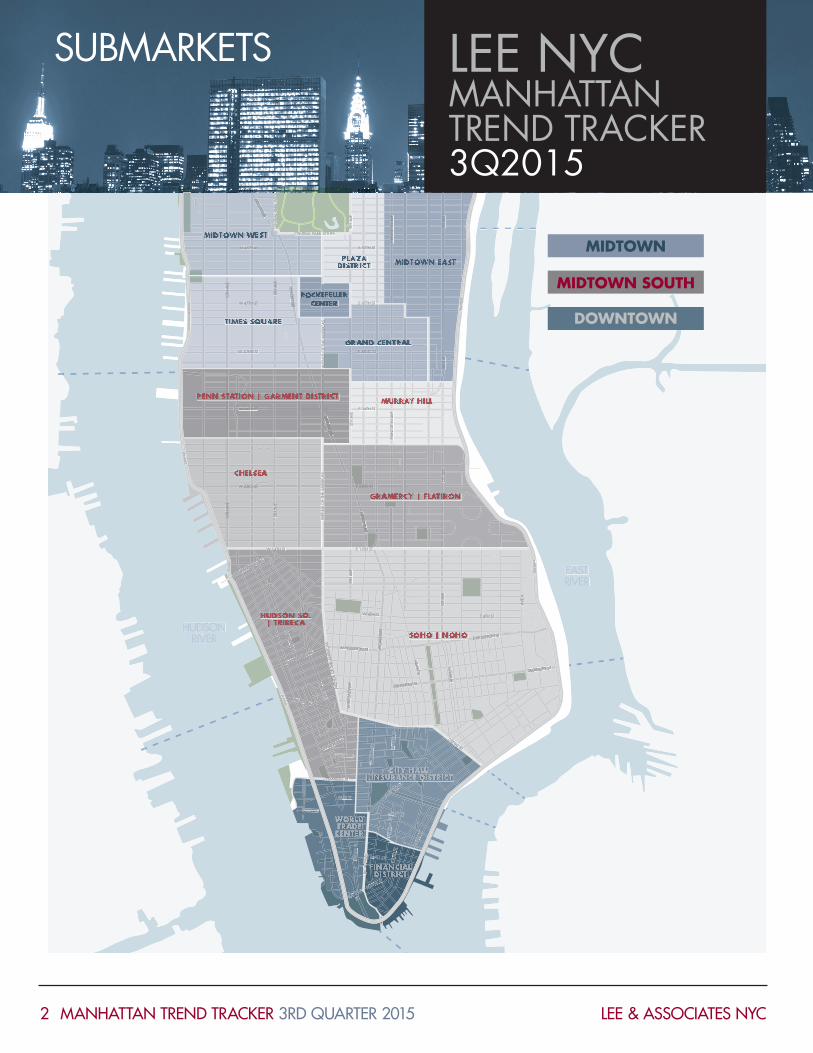
SUBMARKETS
MIDTOWN
MIDTOWN SOUTH
DOWNTOWN
LEE & ASSOCIATES NYC
MARKET SUMMARY
MANHATTAN TREND TRACKER 3RD QUARTER 20153 LEE & ASSOCIATES NYC
LEE NYCMANHATTAN TREND TRACKER3Q2015
Market Inventory(MSF)
AvailableTotal(SF)
TotalVacancy
Rate(%)
TotalAvailability
Rate(%)
TotalNet
Absorption(SF)
UnderConstruction
(SF)
DirectAskingRent
($PSF)
Sublease AskingRent
($PSF)
Overall AskingRent
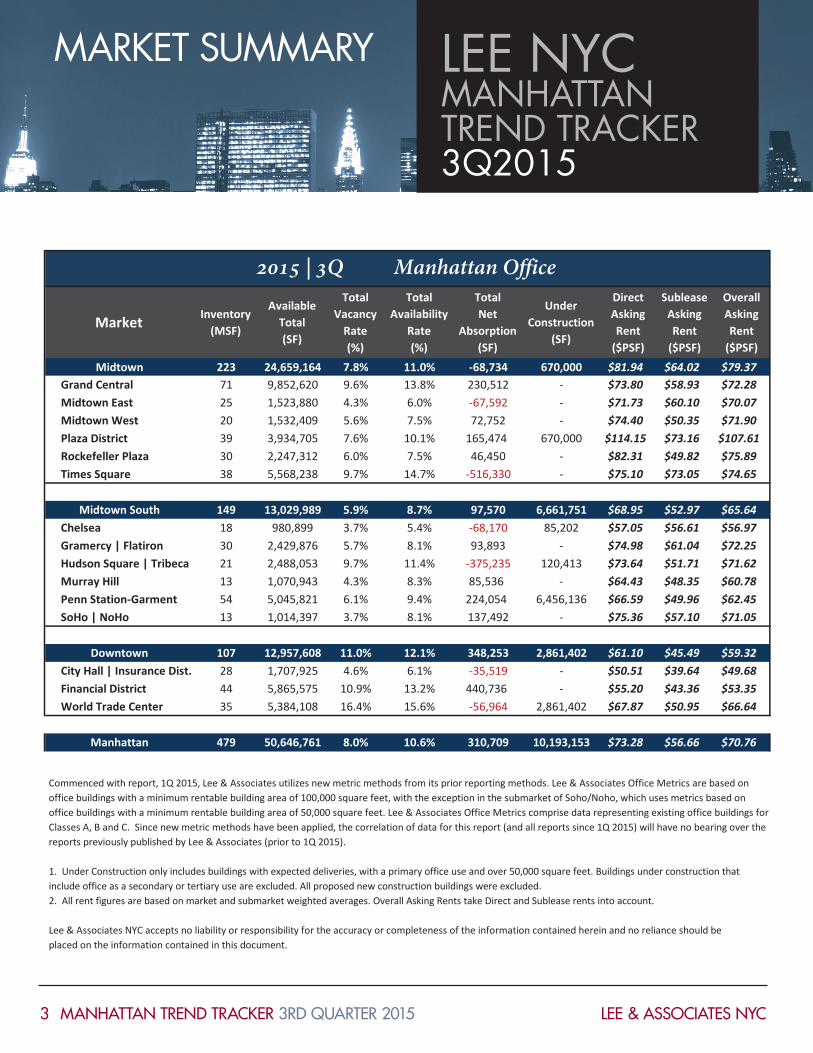
($PSF)Midtown 223 24,659,164 7.8% 11.0% -68,734 670,000 $81.94 $64.02 $79.37
Grand Central 71 9,852,620 9.6% 13.8% 230,512 - $73.80 $58.93 $72.28 Midtown East 25 1,523,880 4.3% 6.0% -67,592 - $71.73 $60.10 $70.07 Midtown West 20 1,532,409 5.6% 7.5% 72,752 - $74.40 $50.35 $71.90 Plaza District 39 3,934,705 7.6% 10.1% 165,474 670,000 $114.15 $73.16 $107.61 Rockefeller Plaza 30 2,247,312 6.0% 7.5% 46,450 - $82.31 $49.82 $75.89 Times Square 38 5,568,238 9.7% 14.7% -516,330 - $75.10 $73.05 $74.65
Midtown South 149 13,029,989 5.9% 8.7% 97,570 6,661,751 $68.95 $52.97 $65.64 Chelsea 18 980,899 3.7% 5.4% -68,170 85,202 $57.05 $56.61 $56.97 Gramercy | Flatiron 30 2,429,876 5.7% 8.1% 93,893 - $74.98 $61.04 $72.25 Hudson Square | Tribeca 21 2,488,053 9.7% 11.4% -375,235 120,413 $73.64 $51.71 $71.62 Murray Hill 13 1,070,943 4.3% 8.3% 85,536 - $64.43 $48.35 $60.78 Penn Station-Garment 54 5,045,821 6.1% 9.4% 224,054 6,456,136 $66.59 $49.96 $62.45 SoHo | NoHo 13 1,014,397 3.7% 8.1% 137,492 - $75.36 $57.10 $71.05
Downtown 107 12,957,608 11.0% 12.1% 348,253 2,861,402 $61.10 $45.49 $59.32 City Hall | Insurance Dist. 28 1,707,925 4.6% 6.1% -35,519 - $50.51 $39.64 $49.68 Financial District 44 5,865,575 10.9% 13.2% 440,736 - $55.20 $43.36 $53.35 World Trade Center 35 5,384,108 16.4% 15.6% -56,964 2,861,402 $67.87 $50.95 $66.64
Manhattan 479 50,646,761 8.0% 10.6% 310,709 10,193,153 $73.28 $56.66 $70.76
2015 | 3Q Manhattan Office
Commenced with report, 1Q 2015, Lee & Associates utilizes new metric methods from its prior reporting methods. Lee & Associates Office Metrics are based on office buildings with a minimum rentable building area of 100,000 square feet, with the exception in the submarket of Soho/Noho, which uses metrics based on office buildings with a minimum rentable building area of 50,000 square feet. Lee & Associates Office Metrics comprise data representing existing office buildings for Classes A, B and C. Since new metric methods have been applied, the correlation of data for this report (and all reports since 1Q 2015) will have no bearing over the reports previously published by Lee & Associates (prior to 1Q 2015).
1. Under Construction only includes buildings with expected deliveries, with a primary office use and over 50,000 square feet. Buildings under construction that include office as a secondary or tertiary use are excluded. All proposed new construction buildings were excluded.2. All rent figures are based on market and submarket weighted averages. Overall Asking Rents take Direct and Sublease rents into account.
Lee & Associates NYC accepts no liability or responsibility for the accuracy or completeness of the information contained herein and no reliance should beplaced on the information contained in this document.
Market Inventory(MSF)
AvailableTotal(SF)
TotalVacancy
Rate(%)
TotalAvailability
Rate(%)
TotalNet
Absorption(SF)
UnderConstruction
(SF)
DirectAskingRent
($PSF)
Sublease AskingRent
($PSF)
Overall AskingRent
($PSF)Midtown 223 24,659,164 7.8% 11.0% -68,734 670,000 $81.94 $64.02 $79.37
Grand Central 71 9,852,620 9.6% 13.8% 230,512 - $73.80 $58.93 $72.28 Midtown East 25 1,523,880 4.3% 6.0% -67,592 - $71.73 $60.10 $70.07 Midtown West 20 1,532,409 5.6% 7.5% 72,752 - $74.40 $50.35 $71.90 Plaza District 39 3,934,705 7.6% 10.1% 165,474 670,000 $114.15 $73.16 $107.61 Rockefeller Plaza 30 2,247,312 6.0% 7.5% 46,450 - $82.31 $49.82 $75.89 Times Square 38 5,568,238 9.7% 14.7% -516,330 - $75.10 $73.05 $74.65
Midtown South 149 13,029,989 5.9% 8.7% 97,570 6,661,751 $68.95 $52.97 $65.64 Chelsea 18 980,899 3.7% 5.4% -68,170 85,202 $57.05 $56.61 $56.97 Gramercy | Flatiron 30 2,429,876 5.7% 8.1% 93,893 - $74.98 $61.04 $72.25 Hudson Square | Tribeca 21 2,488,053 9.7% 11.4% -375,235 120,413 $73.64 $51.71 $71.62 Murray Hill 13 1,070,943 4.3% 8.3% 85,536 - $64.43 $48.35 $60.78 Penn Station-Garment 54 5,045,821 6.1% 9.4% 224,054 6,456,136 $66.59 $49.96 $62.45 SoHo | NoHo 13 1,014,397 3.7% 8.1% 137,492 - $75.36 $57.10 $71.05
Downtown 107 12,957,608 11.0% 12.1% 348,253 2,861,402 $61.10 $45.49 $59.32 City Hall | Insurance Dist. 28 1,707,925 4.6% 6.1% -35,519 - $50.51 $39.64 $49.68 Financial District 44 5,865,575 10.9% 13.2% 440,736 - $55.20 $43.36 $53.35 World Trade Center 35 5,384,108 16.4% 15.6% -56,964 2,861,402 $67.87 $50.95 $66.64
Manhattan 479 50,646,761 8.0% 10.6% 310,709 10,193,153 $73.28 $56.66 $70.76
2015 | 3Q Manhattan Office
Commenced with report, 1Q 2015, Lee & Associates utilizes new metric methods from its prior reporting methods. Lee & Associates Office Metrics are based on office buildings with a minimum rentable building area of 100,000 square feet, with the exception in the submarket of Soho/Noho, which uses metrics based on office buildings with a minimum rentable building area of 50,000 square feet. Lee & Associates Office Metrics comprise data representing existing office buildings for Classes A, B and C. Since new metric methods have been applied, the correlation of data for this report (and all reports since 1Q 2015) will have no bearing over the reports previously published by Lee & Associates (prior to 1Q 2015).
1. Under Construction only includes buildings with expected deliveries, with a primary office use and over 50,000 square feet. Buildings under construction that include office as a secondary or tertiary use are excluded. All proposed new construction buildings were excluded.2. All rent figures are based on market and submarket weighted averages. Overall Asking Rents take Direct and Sublease rents into account.
Lee & Associates NYC accepts no liability or responsibility for the accuracy or completeness of the information contained herein and no reliance should beplaced on the information contained in this document.
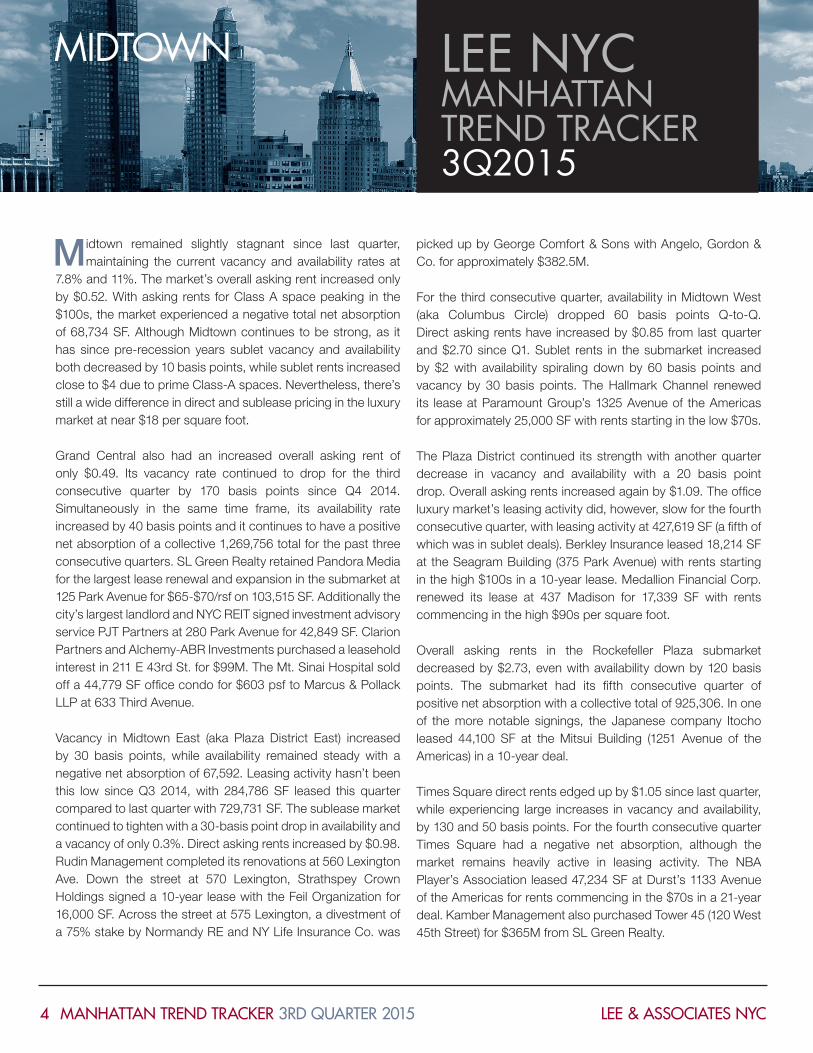
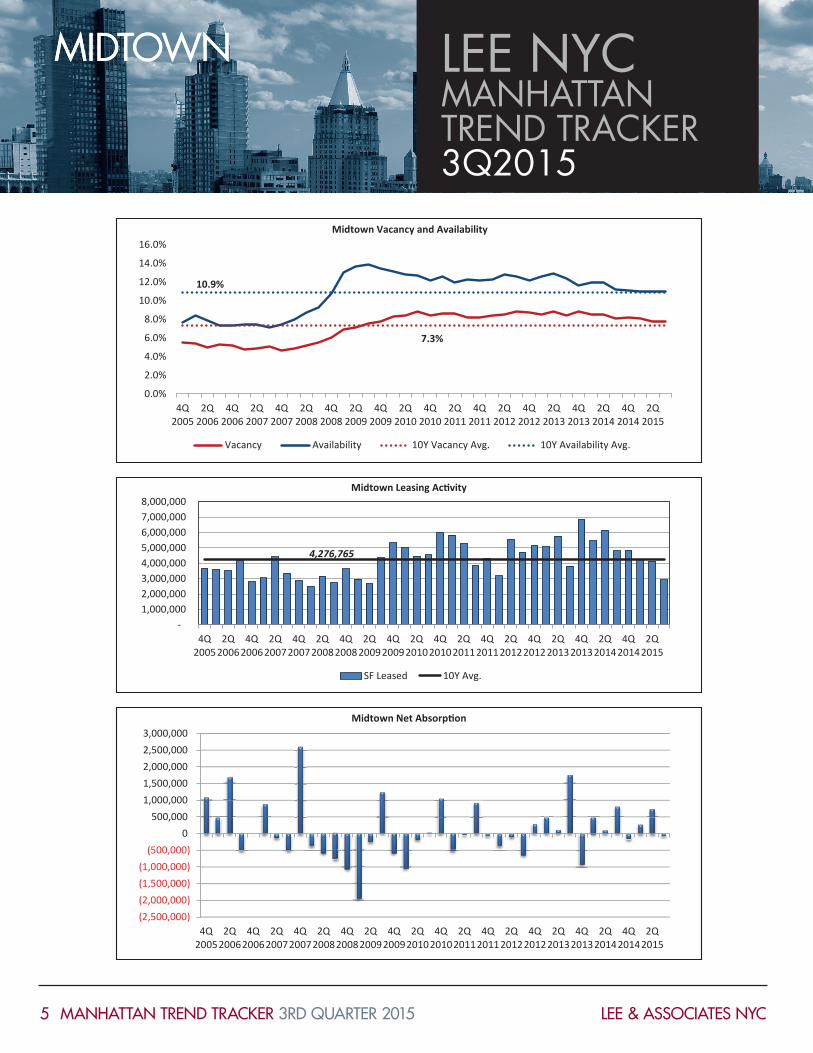
Midtown remained slightly stagnant since last quarter, maintaining the current vacancy and availability rates at
7.8% and 11%. The market’s overall asking rent increased only by $0.52. With asking rents for Class A space peaking in the $100s, the market experienced a negative total net absorption of 68,734 SF. Although Midtown continues to be strong, as it has since pre-recession years sublet vacancy and availability both decreased by 10 basis points, while sublet rents increased close to $4 due to prime Class-A spaces. Nevertheless, there’s still a wide difference in direct and sublease pricing in the luxury market at near $18 per square foot.
Grand Central also had an increased overall asking rent of only $0.49. Its vacancy rate continued to drop for the third consecutive quarter by 170 basis points since Q4 2014. Simultaneously in the same time frame, its availability rate increased by 40 basis points and it continues to have a positive net absorption of a collective 1,269,756 total for the past three consecutive quarters. SL Green Realty retained Pandora Media for the largest lease renewal and expansion in the submarket at 125 Park Avenue for $65-$70/rsf on 103,515 SF. Additionally the city’s largest landlord and NYC REIT signed investment advisory service PJT Partners at 280 Park Avenue for 42,849 SF. Clarion Partners and Alchemy-ABR Investments purchased a leasehold interest in 211 E 43rd St. for $99M. The Mt. Sinai Hospital sold off a 44,779 SF offi ce condo for $603 psf to Marcus & Pollack LLP at 633 Third Avenue.
Vacancy in Midtown East (aka Plaza District East) increased by 30 basis points, while availability remained steady with a negative net absorption of 67,592. Leasing activity hasn’t been this low since Q3 2014, with 284,786 SF leased this quarter compared to last quarter with 729,731 SF. The sublease market continued to tighten with a 30-basis point drop in availability and a vacancy of only 0.3%. Direct asking rents increased by $0.98. Rudin Management completed its renovations at 560 Lexington Ave. Down the street at 570 Lexington, Strathspey Crown Holdings signed a 10-year lease with the Feil Organization for 16,000 SF. Across the street at 575 Lexington, a divestment of a 75% stake by Normandy RE and NY Life Insurance Co. was
picked up by George Comfort & Sons with Angelo, Gordon & Co. for approximately $382.5M.
For the third consecutive quarter, availability in Midtown West (aka Columbus Circle) dropped 60 basis points Q-to-Q. Direct asking rents have increased by $0.85 from last quarter and $2.70 since Q1. Sublet rents in the submarket increased by $2 with availability spiraling down by 60 basis points and vacancy by 30 basis points. The Hallmark Channel renewedits lease at Paramount Group’s 1325 Avenue of the Americas for approximately 25,000 SF with rents starting in the low $70s.
The Plaza District continued its strength with another quarter decrease in vacancy and availability with a 20 basis point drop. Overall asking rents increased again by $1.09. The offi ce luxury market’s leasing activity did, however, slow for the fourth consecutive quarter, with leasing activity at 427,619 SF (a fi fth of which was in sublet deals). Berkley Insurance leased 18,214 SF at the Seagram Building (375 Park Avenue) with rents starting in the high $100s in a 10-year lease. Medallion Financial Corp. renewed its lease at 437 Madison for 17,339 SF with rents commencing in the high $90s per square foot.
Overall asking rents in the Rockefeller Plaza submarket decreased by $2.73, even with availability down by 120 basis points. The submarket had its fi fth consecutive quarter of positive net absorption with a collective total of 925,306. In one of the more notable signings, the Japanese company Itocho leased 44,100 SF at the Mitsui Building (1251 Avenue of the Americas) in a 10-year deal.
Times Square direct rents edged up by $1.05 since last quarter, while experiencing large increases in vacancy and availability, by 130 and 50 basis points. For the fourth consecutive quarter Times Square had a negative net absorption, although the market remains heavily active in leasing activity. The NBA Player’s Association leased 47,234 SF at Durst’s 1133 Avenue of the Americas for rents commencing in the $70s in a 21-year deal. Kamber Management also purchased Tower 45 (120 West 45th Street) for $365M from SL Green Realty.
LEE NYCMANHATTAN TREND TRACKER3Q2015
MIDTOWN
MANHATTAN TREND TRACKER 3RD QUARTER 20154 LEE & ASSOCIATES NYC
MIDTOWN
MANHATTAN TREND TRACKER 3RD QUARTER 20155
MIDTOWN LEE NYCMANHATTAN TREND TRACKER3Q2015
LEE & ASSOCIATES NYC
7.3%
10.9%
0.0%
2.0%
4.0%
6.0%
8.0%
10.0%
12.0%
14.0%
16.0%
4Q2005
2Q2006
4Q2006
2Q2007
4Q2007
2Q2008
4Q2008
2Q2009
4Q2009
2Q2010
4Q2010
2Q2011
4Q2011
2Q2012
4Q2012
2Q2013
4Q2013
2Q2014
4Q2014
2Q2015
Midtown Vacancy and Availability
Vacancy Availability 10Y Vacancy Avg. 10Y Availability Avg.
4,276,765
- 1,000,000 2,000,000 3,000,000 4,000,000 5,000,000 6,000,000 7,000,000 8,000,000
4Q2005
2Q2006
4Q2006
2Q2007
4Q2007
2Q2008
4Q2008
2Q2009
4Q2009
2Q2010
4Q2010
2Q2011
4Q2011
2Q2012
4Q2012
2Q2013
4Q2013
2Q2014
4Q2014
2Q2015
Midtown Leasing Activity
SF Leased 10Y Avg.
(2,500,000)(2,000,000)(1,500,000)(1,000,000)
(500,000)0
500,0001,000,0001,500,0002,000,0002,500,0003,000,000
4Q2005
2Q2006
4Q2006
2Q2007
4Q2007
2Q2008
4Q2008
2Q2009
4Q2009
2Q2010
4Q2010
2Q2011
4Q2011
2Q2012
4Q2012
2Q2013
4Q2013
2Q2014
4Q2014
2Q2015
Midtown Net Absorption
MIDTOWN SOUTH
MANHATTAN TREND TRACKER 3RD QUARTER 20156
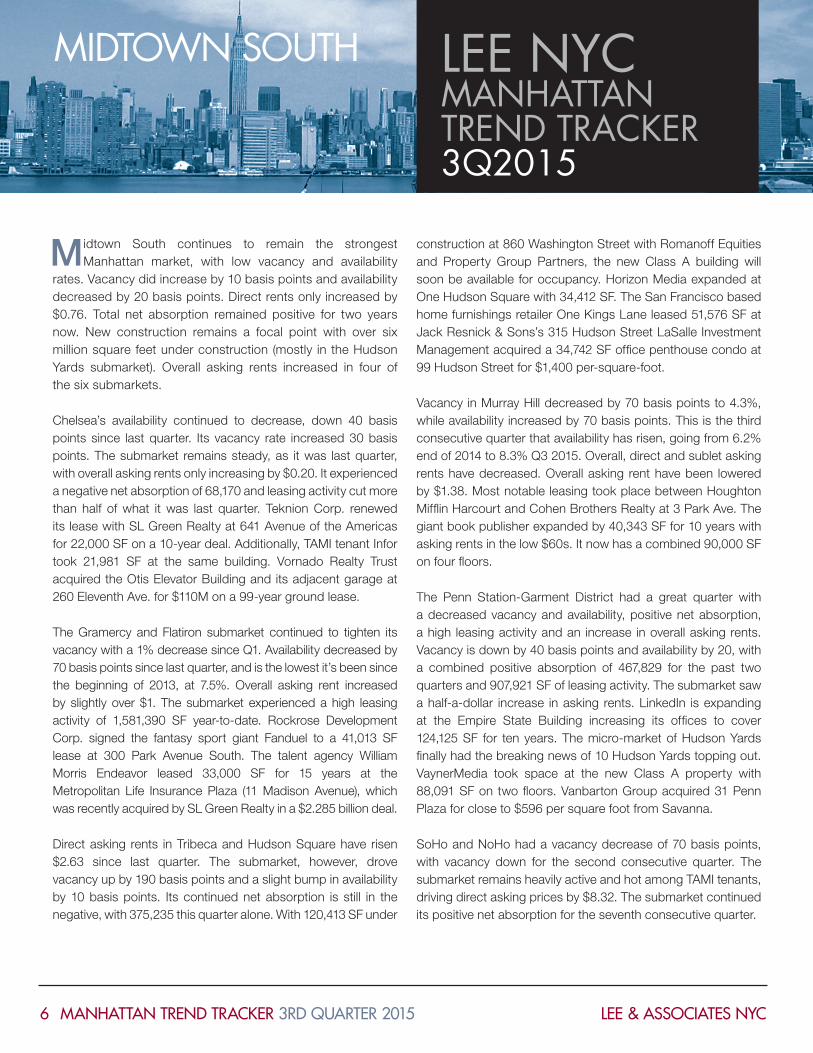
Midtown South continues to remain the strongest Manhattan market, with low vacancy and availability
rates. Vacancy did increase by 10 basis points and availability decreased by 20 basis points. Direct rents only increased by $0.76. Total net absorption remained positive for two years now. New construction remains a focal point with over six million square feet under construction (mostly in the Hudson Yards submarket). Overall asking rents increased in four of the six submarkets.
Chelsea’s availability continued to decrease, down 40 basis points since last quarter. Its vacancy rate increased 30 basis points. The submarket remains steady, as it was last quarter, with overall asking rents only increasing by $0.20. It experienced a negative net absorption of 68,170 and leasing activity cut more than half of what it was last quarter. Teknion Corp. renewed its lease with SL Green Realty at 641 Avenue of the Americas for 22,000 SF on a 10-year deal. Additionally, TAMI tenant Infor took 21,981 SF at the same building. Vornado Realty Trust acquired the Otis Elevator Building and its adjacent garage at 260 Eleventh Ave. for $110M on a 99-year ground lease.
The Gramercy and Flatiron submarket continued to tighten its vacancy with a 1% decrease since Q1. Availability decreased by 70 basis points since last quarter, and is the lowest it’s been since the beginning of 2013, at 7.5%. Overall asking rent increased by slightly over $1. The submarket experienced a high leasing activity of 1,581,390 SF year-to-date. Rockrose Development Corp. signed the fantasy sport giant Fanduel to a 41,013 SF lease at 300 Park Avenue South. The talent agency William Morris Endeavor leased 33,000 SF for 15 years at the Metropolitan Life Insurance Plaza (11 Madison Avenue), which was recently acquired by SL Green Realty in a $2.285 billion deal.
Direct asking rents in Tribeca and Hudson Square have risen $2.63 since last quarter. The submarket, however, drove vacancy up by 190 basis points and a slight bump in availability by 10 basis points. Its continued net absorption is still in the negative, with 375,235 this quarter alone. With 120,413 SF under
construction at 860 Washington Street with Romanoff Equities and Property Group Partners, the new Class A building will soon be available for occupancy. Horizon Media expanded at One Hudson Square with 34,412 SF. The San Francisco based home furnishings retailer One Kings Lane leased 51,576 SF at Jack Resnick & Sons’s 315 Hudson Street LaSalle Investment Management acquired a 34,742 SF offi ce penthouse condo at 99 Hudson Street for $1,400 per-square-foot.
Vacancy in Murray Hill decreased by 70 basis points to 4.3%, while availability increased by 70 basis points. This is the third consecutive quarter that availability has risen, going from 6.2% end of 2014 to 8.3% Q3 2015. Overall, direct and sublet asking rents have decreased. Overall asking rent have been lowered by $1.38. Most notable leasing took place between Houghton Miffl in Harcourt and Cohen Brothers Realty at 3 Park Ave. The giant book publisher expanded by 40,343 SF for 10 years with asking rents in the low $60s. It now has a combined 90,000 SF on four fl oors.
The Penn Station-Garment District had a great quarter with a decreased vacancy and availability, positive net absorption, a high leasing activity and an increase in overall asking rents. Vacancy is down by 40 basis points and availability by 20, with a combined positive absorption of 467,829 for the past two quarters and 907,921 SF of leasing activity. The submarket saw a half-a-dollar increase in asking rents. LinkedIn is expanding at the Empire State Building increasing its offi ces to cover 124,125 SF for ten years. The micro-market of Hudson Yards fi nally had the breaking news of 10 Hudson Yards topping out. VaynerMedia took space at the new Class A property with 88,091 SF on two fl oors. Vanbarton Group acquired 31 Penn Plaza for close to $596 per square foot from Savanna.
SoHo and NoHo had a vacancy decrease of 70 basis points, with vacancy down for the second consecutive quarter. The submarket remains heavily active and hot among TAMI tenants, driving direct asking prices by $8.32. The submarket continued its positive net absorption for the seventh consecutive quarter.
LEE NYCMANHATTAN TREND TRACKER3Q2015
LEE & ASSOCIATES NYC
MIDTOWN SOUTH
MANHATTAN TREND TRACKER 3RD QUARTER 20157
LEE NYCMANHATTAN TREND TRACKER3Q2015
LEE & ASSOCIATES NYC
6.2%
9.7%
0.0%
2.0%
4.0%
6.0%
8.0%
10.0%
12.0%
14.0%
4Q2005
2Q2006
4Q2006
2Q2007
4Q2007
2Q2008
4Q2008
2Q2009
4Q2009
2Q2010
4Q2010
2Q2011
4Q2011
2Q2012
4Q2012
2Q2013
4Q2013
2Q2014
4Q2014
2Q2015
Midtown South Vacancy and Availability
Vacancy Availability 10Y Vacancy Avg. 10Y Availability Avg.
3,039,763
-
1,000,000
2,000,000
3,000,000
4,000,000
5,000,000
6,000,000
7,000,000
8,000,000
4Q2005
2Q2006
4Q2006
2Q2007
4Q2007
2Q2008
4Q2008
2Q2009
4Q2009
2Q2010
4Q2010
2Q2011
4Q2011
2Q2012
4Q2012
2Q2013
4Q2013
2Q2014
4Q2014
2Q2015
Midtown South Leasing Activity
SF Leased 10Y Avg.
(1,200,000)(1,000,000)
(800,000)(600,000)(400,000)(200,000)
0200,000400,000600,000800,000
1,000,000
4Q2005
2Q2006
4Q2006
2Q2007
4Q2007
2Q2008
4Q2008
2Q2009
4Q2009
2Q2010
4Q2010
2Q2011
4Q2011
2Q2012
4Q2012
2Q2013
4Q2013
2Q2014
4Q2014
2Q2015
Midtown South Net Absorption
Net Absorption
DOWNTOWN
MANHATTAN TREND TRACKER 3RD QUARTER 20158
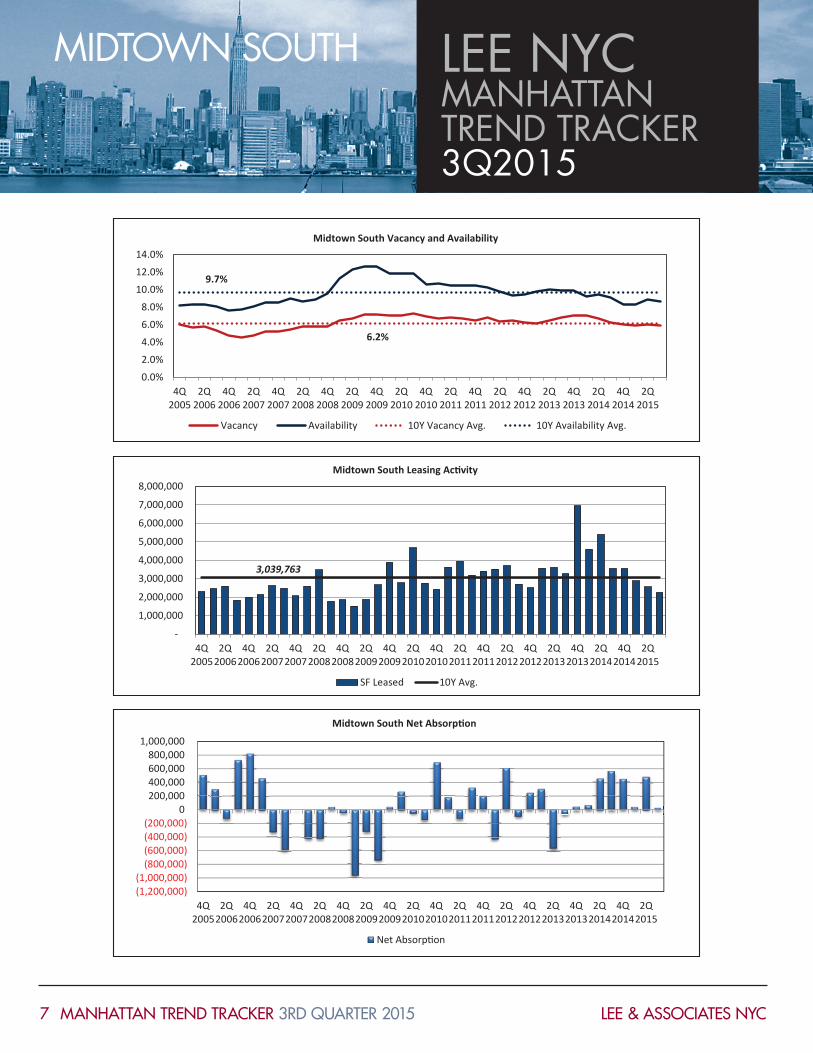
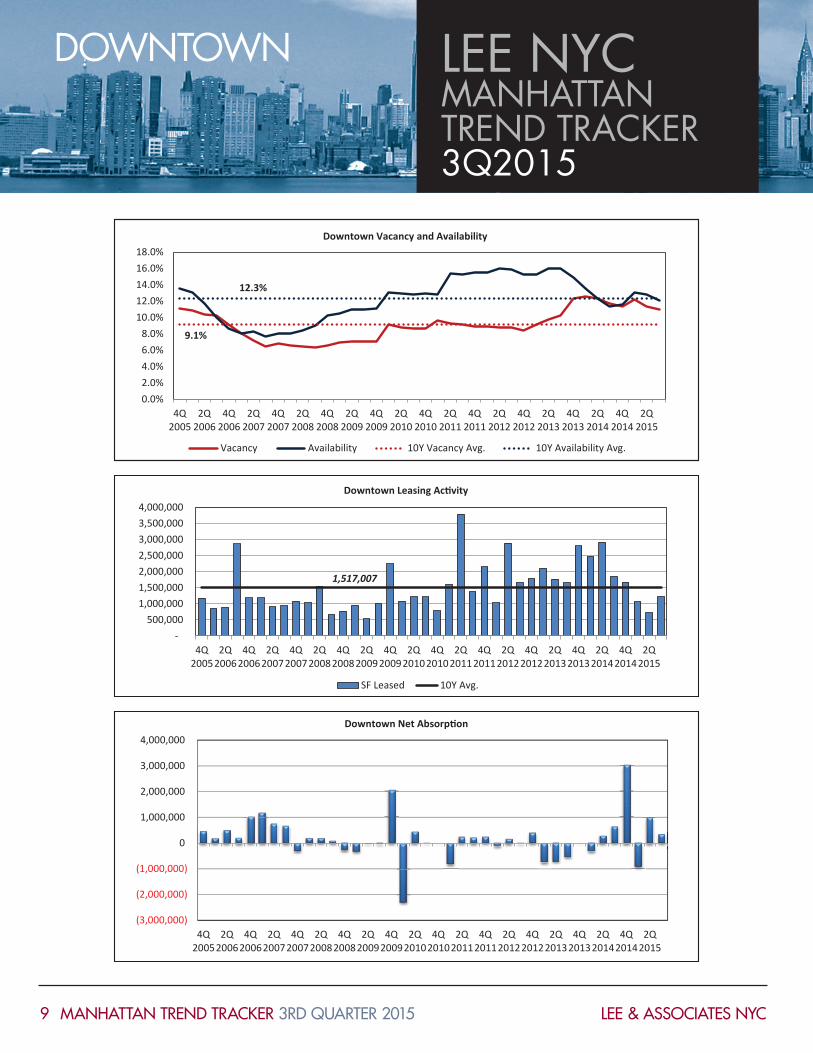
The Downtown market continued to improve this quarter as it did last quarter, with both vacancy and availability
decreasing. Vacancy dropped to 11%, which is still high compared to the Midtown and Midtown South markets. Availability is down by a full 100 basis points since Q1. Overall asking rents remained steady since Q1, hovering between $59-$60 psf. We’ve witnessed another quarter of positive net absorption. Downtown’s sublet vacancy continued to decrease for the third consecutive quarter (0.4%), however subleases accounted for 7% of completed transactions.
Asking rents in the City Hall and Insurance District have increased. Direct asking rents increased by $1.24 and overall asking rents by $0.77. The sublet market is only 0.2% of inventory with average sublet rents down to $39.64. The market experienced its fi rst negative net absorption since Q3 2013, at 35,519; and total leasing activity was almost cut in half to below 100,000 SF. According to private sources, KBS Realty Advisors and Savanna renewed FT Interactive Data for 44,500 SF in 110 William Street. Most of the transactions completed were below 10,000 SF; for example, Ebiquity Inc. took 7,564 SF for 10 years at the same building.
The Financial District saw great improvement, with a 1% decrease in vacancy, and a 90 basis point drop in availability, continuing its positive net absorption from last quarter with a collective absorption of 908,820 SF. This offset the negative net absorption of 1.1M experienced in Q1. Leasing activity increased close to 18% since last quarter. Direct asking rents have increase $0.69 since Q1. The community development
group NFF (Nonprofi t Finance Fund) signed a 15-year lease at 5 Hanover Square for 14,126 SF. Part of the move was strategic in getting a cost-effective space, moving from Midtown. Savanna sold its 480,000 SF offi ce tower at 100 Wall Street to the Cornerstone Group for $275M, or $573 per square foot. The property was 97% leased at the time of the transaction. Alphadyne Asset Management expanded its footprint at RFR Realty’s 17 State Street to 29,386 SF. The most notable deal of the quarter was between Fosun International and Ironshore Holdings at 28 Liberty Street. Ironshore leased over 100,000 SF comprising three fl oors in a 15-year deal.
The popularity of the World Trade Center and World Financial Center remains high among tenants looking for a move from Midtown or Midtown South. With average direct asking rents hovering between $67 to $70 psf since Q1, the submarket fi nally passed the 500,000 SF mark in leasing activity since Q3 2014 (existing buildings only). Experiencing its fi rst negative net absorption since Q2 2014, the market’s vacancy increased by 30 basis points. Its availability decreased to 15.6% from 16.5%, Q-to-Q. Securities brokerage and fi nancial services fi rm KCG Holdings leased 169,000 SF in the World Financial Center (300 Vesey Street). The move highlights a growing fi rm relocating from Jersey City to Downtown Manhattan. Fashion giant Gucci signed a 15-year lease for 83,964 SF at 195 Broadway. The asking rents were in the mid-$50s. The credit rating and research company Moody’s leased 75,312 SF at One World Trade Center. This makes One World Trade Center Moody’s second offi ce footprint in the WTC complex, with the fi rst located at 7 World Trade Center.
LEE NYCMANHATTAN TREND TRACKER3Q2015
LEE & ASSOCIATES NYC
DOWNTOWN
MANHATTAN TREND TRACKER 3RD QUARTER 20159
LEE NYCMANHATTAN TREND TRACKER3Q2015
LEE & ASSOCIATES NYC
9.1%
12.3%
0.0%2.0%4.0%6.0%8.0%
10.0%12.0%14.0%16.0%18.0%
4Q2005
2Q2006
4Q2006
2Q2007
4Q2007
2Q2008
4Q2008
2Q2009
4Q2009
2Q2010
4Q2010
2Q2011
4Q2011
2Q2012
4Q2012
2Q2013
4Q2013
2Q2014
4Q2014
2Q2015
Downtown Vacancy and Availability
Vacancy Availability 10Y Vacancy Avg. 10Y Availability Avg.
1,517,007
- 500,000
1,000,000 1,500,000 2,000,000 2,500,000 3,000,000 3,500,000 4,000,000
4Q2005
2Q2006
4Q2006
2Q2007
4Q2007
2Q2008
4Q2008
2Q2009
4Q2009
2Q2010
4Q2010
2Q2011
4Q2011
2Q2012
4Q2012
2Q2013
4Q2013
2Q2014
4Q2014
2Q2015
Downtown Leasing Activity
SF Leased 10Y Avg.
(3,000,000)
(2,000,000)
(1,000,000)
0
1,000,000
2,000,000
3,000,000
4,000,000
4Q2005
2Q2006
4Q2006
2Q2007
4Q2007
2Q2008
4Q2008
2Q2009
4Q2009
2Q2010
4Q2010
2Q2011
4Q2011
2Q2012
4Q2012
2Q2013
4Q2013
2Q2014
4Q2014
2Q2015
Downtown Net Absorption
CONSTRUCTION ACTIVITY
MANHATTAN TREND TRACKER 3RD QUARTER 201510
LEE NYCMANHATTAN TREND TRACKER3Q2015
LEE & ASSOCIATES NYC
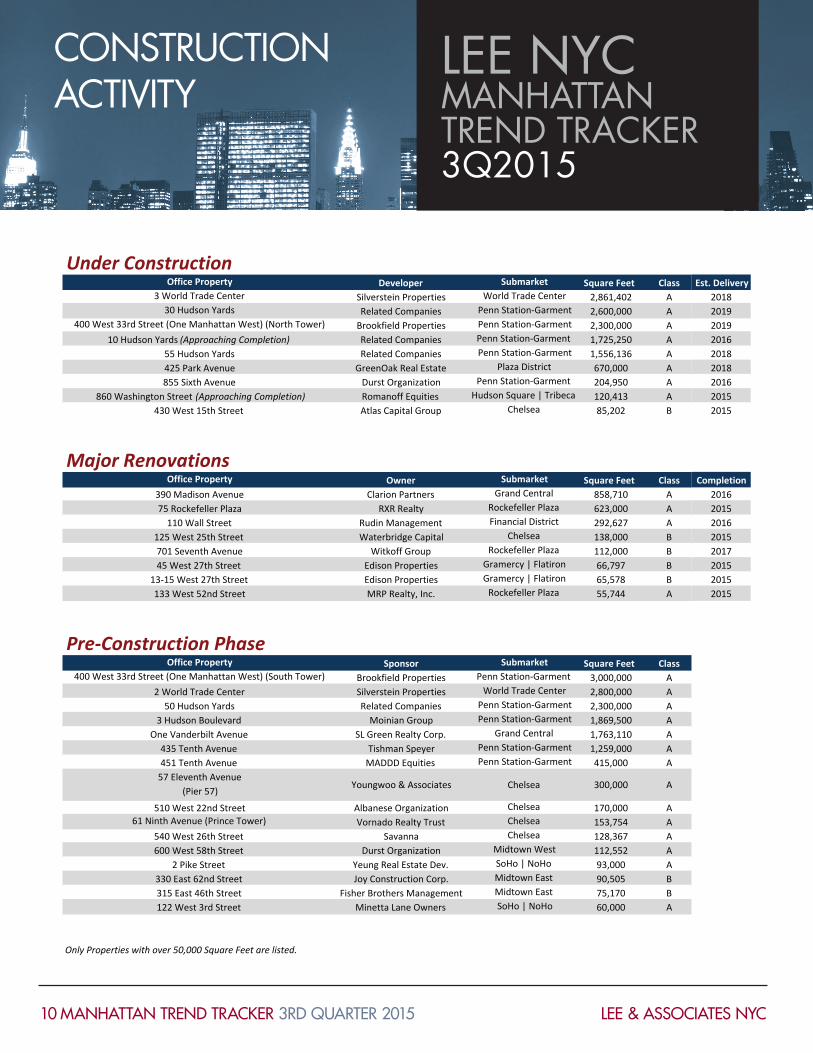
Est. Delivery201820192019201620182018201620152015
Completion20162015201620152017201520152015
Under ConstructionDeveloper Square Feet Class
Silverstein Properties 2,861,402 ARelated Companies 2,600,000 A
Brookfield Properties 2,300,000 ARelated Companies 1,725,250 ARelated Companies 1,556,136 A
GreenOak Real Estate 670,000 ADurst Organization 204,950 ARomanoff Equities 120,413 AAtlas Capital Group 85,202 B
Major RenovationsOwner Square Feet Class
Clarion Partners 858,710 ARXR Realty 623,000 A
Rudin Management 292,627 AWaterbridge Capital 138,000 B
Witkoff Group 112,000 BEdison Properties 66,797 BEdison Properties 65,578 BMRP Realty, Inc. 55,744 A
Pre-‐Construction PhaseSponsor Square Feet Class
Brookfield Properties 3,000,000 ASilverstein Properties 2,800,000 ARelated Companies 2,300,000 A
Moinian Group 1,869,500 ASL Green Realty Corp. 1,763,110 A
Tishman Speyer 1,259,000 AMADDD Equities 415,000 A
Youngwoo & Associates 300,000 A
Albanese Organization 170,000 AVornado Realty Trust 153,754 A
Savanna 128,367 ADurst Organization 112,552 A
Yeung Real Estate Dev. 93,000 AJoy Construction Corp. 90,505 B
Fisher Brothers Management 75,170 BMinetta Lane Owners 60,000 A
Only Properties with over 50,000 Square Feet are listed.
2 Pike Street SoHo | NoHo
122 West 3rd Street SoHo | NoHo
55 Hudson Yards Penn Station-‐Garment
110 Wall Street Financial District
510 West 22nd Street Chelsea61 Ninth Avenue (Prince Tower) Chelsea
330 East 62nd Street Midtown East
600 West 58th Street Midtown West
3 Hudson Boulevard Penn Station-‐GarmentOne Vanderbilt Avenue Grand Central
540 West 26th Street Chelsea
435 Tenth Avenue Penn Station-‐Garment451 Tenth Avenue Penn Station-‐Garment
57 Eleventh Avenue(Pier 57) Chelsea
75 Rockefeller Plaza Rockefeller Plaza
125 West 25th Street Chelsea701 Seventh Avenue Rockefeller Plaza
430 West 15th Street Chelsea
Office Property Submarket390 Madison Avenue Grand Central
855 Sixth Avenue Penn Station-‐Garment860 Washington Street (Approaching Completion) Hudson Square | Tribeca
Office Property Submarket3 World Trade Center World Trade Center
10 Hudson Yards (Approaching Completion) Penn Station-‐Garment
30 Hudson Yards Penn Station-‐Garment400 West 33rd Street (One Manhattan West) (North Tower) Penn Station-‐Garment
425 Park Avenue Plaza District
315 East 46th Street Midtown East
45 West 27th Street Gramercy | Flatiron13-‐15 West 27th Street Gramercy | Flatiron133 West 52nd Street Rockefeller Plaza
2 World Trade Center World Trade Center50 Hudson Yards Penn Station-‐Garment
Office Property Submarket400 West 33rd Street (One Manhattan West) (South Tower) Penn Station-‐Garment
NOTABLE INVESTMENT SALES
MANHATTAN TREND TRACKER 3RD QUARTER 201511
LEE NYCMANHATTAN TREND TRACKER3Q2015
LEE & ASSOCIATES NYC
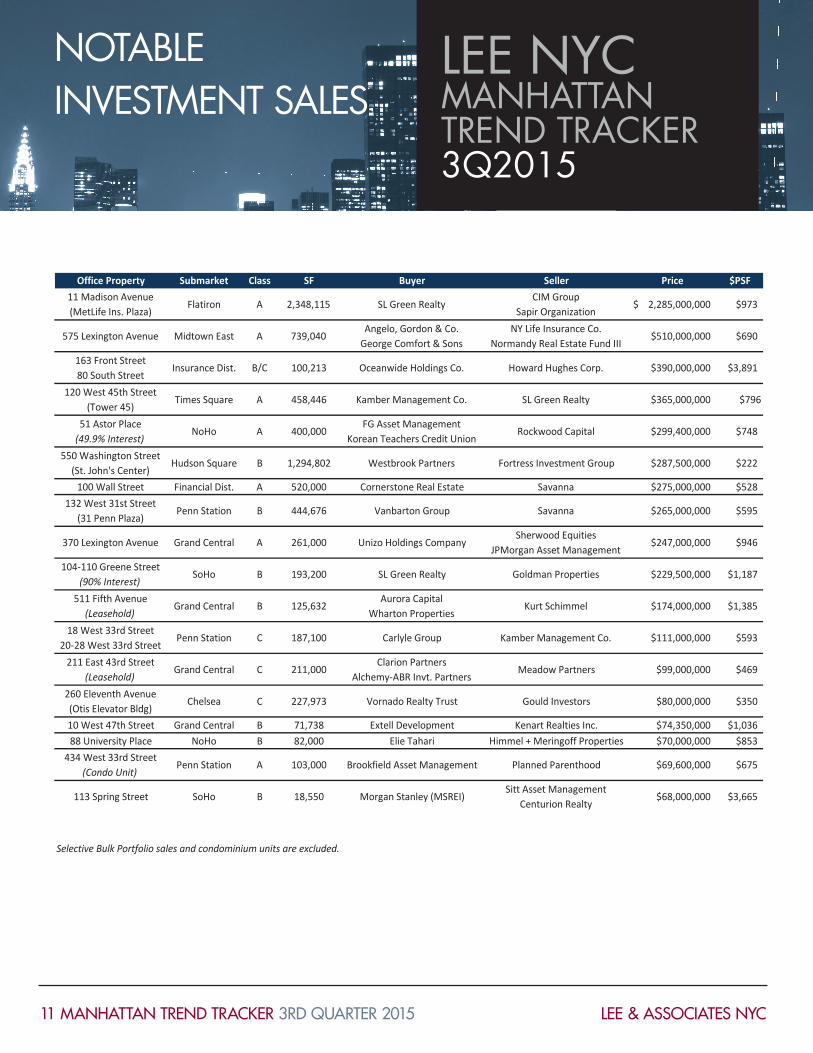
Office Property Submarket Class SF Buyer Seller Price $PSF11 Madison Avenue(MetLife Ins. Plaza)
Flatiron A 2,348,115 SL Green RealtyCIM Group
Sapir Organization2,285,000,000$ $973
575 Lexington Avenue Midtown East A 739,040Angelo, Gordon & Co.
George Comfort & SonsNY Life Insurance Co.
Normandy Real Estate Fund III$510,000,000 $690
163 Front Street80 South Street
Insurance Dist. B/C 100,213 Oceanwide Holdings Co. Howard Hughes Corp. $390,000,000 $3,891
120 West 45th Street(Tower 45)
Times Square A 458,446 Kamber Management Co. SL Green Realty $365,000,000 $796
51 Astor Place(49.9% Interest)
NoHo A 400,000FG Asset Management
Korean Teachers Credit UnionRockwood Capital $299,400,000 $748
550 Washington Street(St. John's Center)
Hudson Square B 1,294,802 Westbrook Partners Fortress Investment Group $287,500,000 $222
100 Wall Street Financial Dist. A 520,000 Cornerstone Real Estate Savanna $275,000,000 $528132 West 31st Street
(31 Penn Plaza)Penn Station B 444,676 Vanbarton Group Savanna $265,000,000 $595
370 Lexington Avenue Grand Central A 261,000 Unizo Holdings CompanySherwood Equities
JPMorgan Asset Management$247,000,000 $946
104-110 Greene Street(90% Interest)
SoHo B 193,200 SL Green Realty Goldman Properties $229,500,000 $1,187
511 Fifth Avenue(Leasehold)
Grand Central B 125,632Aurora Capital
Wharton PropertiesKurt Schimmel $174,000,000 $1,385
18 West 33rd Street20-28 West 33rd Street
Penn Station C 187,100 Carlyle Group Kamber Management Co. $111,000,000 $593
211 East 43rd Street(Leasehold)
Grand Central C 211,000Clarion Partners
Alchemy-ABR Invt. PartnersMeadow Partners $99,000,000 $469
260 Eleventh Avenue(Otis Elevator Bldg)
Chelsea C 227,973 Vornado Realty Trust Gould Investors $80,000,000 $350
10 West 47th Street Grand Central B 71,738 Extell Development Kenart Realties Inc. $74,350,000 $1,03688 University Place NoHo B 82,000 Elie Tahari Himmel + Meringoff Properties $70,000,000 $853
434 West 33rd Street(Condo Unit)
Penn Station A 103,000 Brookfield Asset Management Planned Parenthood $69,600,000 $675
113 Spring Street SoHo B 18,550 Morgan Stanley (MSREI)Sitt Asset Management
Centurion Realty$68,000,000 $3,665
Selective Bulk Portfolio sales and condominium units are excluded.
Lee & Associates NYC600 Madison Avenue, Third Floor
New York, NY 10022 | 212.776.1200www.leeassociatesnyc.com
James WachtPresident
Peter BrausManaging Principal
Henry AbramovResearch Manager
With offi ces
across the nation, the
Lee & Associates ® group
of independently owned
and operated companies
is the largest provider of
regional commercial real estate
services in the United States and
the fourth-largest full-service
commercial real estate
organization overall.