2015/16 Price List - Western Power...2015/16 Price List April 2015 DM#12493477 1 1 Introduction This...
28
DM#12493477 2015/16 Price List ELECTRICITY NETWORKS CORPORATION (“WESTERN POWER”) ABN 18 540 492 861 Date of Issue: 28 April 2015 All prices quoted in this Price List are GST exclusive.
Transcript of 2015/16 Price List - Western Power...2015/16 Price List April 2015 DM#12493477 1 1 Introduction This...

DM#12493477
2015/16 Price List
ELECTRICITY NETWORKS CORPORATION
(“WESTERN POWER”)
ABN 18 540 492 861
Date of Issue: 28 April 2015
All prices quoted in this Price List are GST exclusive.

2015/16 Price List April 2015
DM#12493477
Table of contents
1 Introduction 1
2 Reference Services 1
3 Non-reference services 1
4 Distribution Tariff Application Guide 2
4.1 Reference Tariffs 1 and 2 (RT1 and RT2) 2
4.2 Reference Tariffs 3 and 4 (RT3 and RT4) 2
4.3 Reference Tariff 5 (RT5) 3
4.4 Reference Tariff 6 (RT6) 4
4.5 Reference Tariff 7 (RT7) 4
4.6 Reference Tariff 8 (RT8) 6
4.7 Reference Tariff 9 (RT9) 7
4.8 Reference Tariff 10 (RT10) 7
4.9 Reference Tariff 11 (RT11) 8
4.10 Reference Tariffs 13 and 14 (RT13 and RT14) 9
4.11 Reference Tariffs 15 and 16 (RT15 and RT16) 9
5 Transmission Tariff Application Guide 11
5.1 Transmission Reference Tariff 1 (TRT1) 11
5.2 Transmission Reference Tariff 2 (TRT2) 12
6 Price Tables 13
6.1 Prices for energy-based tariffs on the distribution network 13
6.2 Prices for demand-based tariffs on the distribution network (RT5 to RT8 and RT11) 15
6.3 Transmission prices 20
7 Applications and Queuing Policy fees 26
2015/16 Price List April 2015
DM#12493477 1
1 Introduction This document details Western Power’s Price List. For the purpose of section 5.1(f) of the Electricity Networks Access Code 2004 this document forms part of Western Power’s Access Arrangement.
For the avoidance of doubt, the prices within this Price List will apply to all consumption from 1 July 2015. Where consumption is metered with an accumulation meter and the meter reading interval causes some of the metered consumption to lie within the period covered by this price list and the remainder within a previous or subsequent period not covered by this price list, the consumption covered by this price list will be determined by prorating the metered consumption uniformly on a daily basis.
Section 2 lists the reference tariffs for the reference services provided by Western Power as
stated in the company’s access arrangement.
Sections 4 and 5 detail the reference tariffs, which are based on a number of components. The total charge payable by users under each reference tariff represents the sum of the amounts payable for each component within the relevant reference tariff.
Section 6 details all of the prices that are required to calculate the charges.
Section 7 includes a link to Western Power’s website for fees that are referred to in the Applications and Queuing Policy
2 Reference Services The following table details which reference tariff is applicable to each of the reference services.
Reference Service Reference Tariff
A1 – Anytime Energy (Residential) Exit Service RT1
A2 – Anytime Energy (Business) Exit Service RT2
A3 – Time of Use Energy (Residential) Exit Service RT3
A4 – Time of Use Energy (Business) Exit Service RT4
A5 – High Voltage Metered Demand Exit Service RT5
A6 – Low Voltage Metered Demand Exit Service RT6
A7 – High Voltage Contract Maximum Demand Exit Service RT7
A8 – Low Voltage Contract Maximum Demand Exit Service RT8
A9 – Streetlighting Exit Service RT9
A10 – Un-Metered Supplies Exit Service RT10
A11 – Transmission Exit Service TRT1
B1 – Distribution Entry Service RT11
B2 – Transmission Entry Service TRT2
C1 – Anytime Energy (Residential) Bi-directional Service RT13
C2 – Anytime Energy (Business) Bi-directional Service RT14
C3 – Time of Use (Residential) Bi-directional Service RT15
C4 – Time of Use (Business) Bi-directional Service RT16
3 Non-reference services Where Western Power is providing a User a non-reference service at a connection point,
the tariff applicable to that non-reference service is the tariff agreed between the User and Western Power.

2015/16 Price List April 2015
DM#12493477 2
4 Distribution Tariff Application Guide Within this price list the transmission and distribution components of the bundled charges are published, where applicable. The bundled charge is applicable when calculating the charge for the reference tariff, unless otherwise indicated. For the avoidance of doubt, the bundled charge is the sum of the distribution and transmission components of the charge.
At Western Power's discretion, the charges detailed below may be discounted where there are multiple exit points on the same premises that are configured in a non-standard way. These discounts include, but are not limited to, only charging one administration charge per site.
4.1 Reference Tariffs 1 and 2 (RT1 and RT2)
Reference Tariffs RT1 and RT2 consist of:
(a) a fixed use of system charge (detailed in Table 1) which is payable each day;
(b) a variable use of system charge calculated by multiplying the energy price (detailed in Table 1) by the quantity of electricity consumed at an exit point (expressed in kWh);
(c) a fixed metering charge per revenue meter (detailed in Table 1) which is payable each day; and
(d) a variable metering charge calculated by multiplying the variable price (detailed in Table 1) by the quantity of electricity consumed at an exit point (expressed in kWh).
4.2 Reference Tariffs 3 and 4 (RT3 and RT4)
Reference Tariffs RT3 and RT4 consist of:
(a) a fixed use of system charge (detailed in Table 1) which is payable each day;
(b) an on-peak use of system variable charge calculated by multiplying the on-peak energy price (detailed in Table 1) by the quantity of on-peak electricity consumed at an exit point (expressed in kWh);
(c) an off-peak use of system variable charge calculated by multiplying the off-peak
energy price (detailed in Table 1) by the quantity of off-peak electricity consumed at an exit point (expressed in kWh);
(d) a fixed metering charge per revenue meter (detailed in Table 1) which is payable each day;
(e) an on-peak variable metering charge calculated by multiplying the on-peak variable
price (detailed in Table 1) by the quantity of on-peak electricity consumed at an exit point (expressed in kWh); and
(f) an off-peak variable metering charge calculated by multiplying the off-peak variable
price (detailed in Table 1) by the quantity of off-peak electricity consumed at an exit point (expressed in kWh).
Notes:
1. The on and off peak periods for these tariffs are defined in the following table (all times are Western Standard Time (WST)):
Monday – Friday (includes public holidays) Saturday - Sunday
Off-peak On-Peak Off-Peak Off-Peak
RT3 12:00am – 7:00am 7:00am – 9:00pm 9:00pm – 12:00am All times
RT4 12:00am – 8:00am 8:00am – 10:00pm 10:00pm – 12:00am All times
2015/16 Price List April 2015
DM#12493477 3
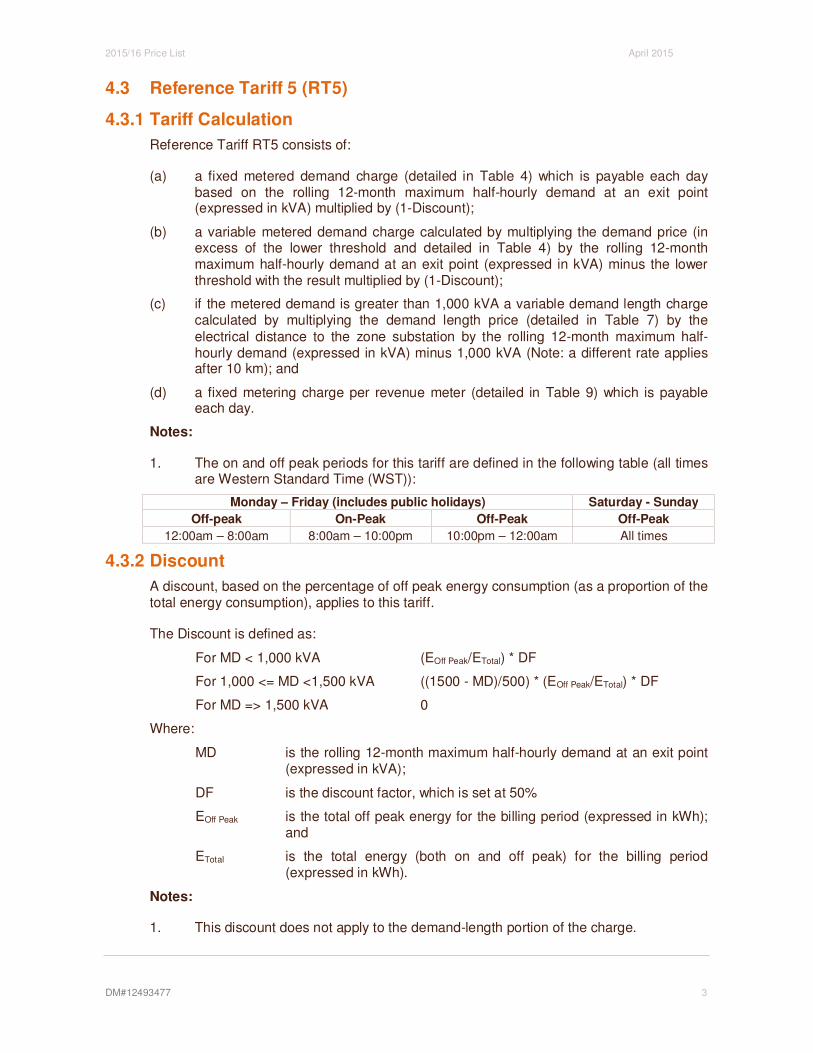
4.3 Reference Tariff 5 (RT5)
4.3.1 Tariff Calculation
Reference Tariff RT5 consists of:
(a) a fixed metered demand charge (detailed in Table 4) which is payable each day based on the rolling 12-month maximum half-hourly demand at an exit point (expressed in kVA) multiplied by (1-Discount);
(b) a variable metered demand charge calculated by multiplying the demand price (in excess of the lower threshold and detailed in Table 4) by the rolling 12-month maximum half-hourly demand at an exit point (expressed in kVA) minus the lower threshold with the result multiplied by (1-Discount);
(c) if the metered demand is greater than 1,000 kVA a variable demand length charge calculated by multiplying the demand length price (detailed in Table 7) by the
electrical distance to the zone substation by the rolling 12-month maximum half-hourly demand (expressed in kVA) minus 1,000 kVA (Note: a different rate applies after 10 km); and
(d) a fixed metering charge per revenue meter (detailed in Table 9) which is payable each day.
Notes:
1. The on and off peak periods for this tariff are defined in the following table (all times are Western Standard Time (WST)):
Monday – Friday (includes public holidays) Saturday - Sunday
Off-peak On-Peak Off-Peak Off-Peak
12:00am – 8:00am 8:00am – 10:00pm 10:00pm – 12:00am All times
4.3.2 Discount
A discount, based on the percentage of off peak energy consumption (as a proportion of the total energy consumption), applies to this tariff.
The Discount is defined as:
For MD < 1,000 kVA (EOff Peak/ETotal) * DF
For 1,000 <= MD <1,500 kVA ((1500 - MD)/500) * (EOff Peak/ETotal) * DF
For MD => 1,500 kVA 0
Where:
MD is the rolling 12-month maximum half-hourly demand at an exit point (expressed in kVA);
DF is the discount factor, which is set at 50%
EOff Peak is the total off peak energy for the billing period (expressed in kWh); and
ETotal is the total energy (both on and off peak) for the billing period (expressed in kWh).
Notes:
1. This discount does not apply to the demand-length portion of the charge.

2015/16 Price List April 2015
DM#12493477 4
4.4 Reference Tariff 6 (RT6)
4.4.1 Tariff Calculation
Reference Tariff RT6 consists of:
(a) a fixed metered demand charge (detailed in Table 5) which is payable each day based on the rolling 12-month maximum half-hourly demand at an exit point (expressed in kVA) multiplied by (1-Discount);
(b) a variable metered demand charge (detailed in Table 5) calculated by multiplying the demand price (in excess of lower threshold) by the rolling 12-month maximum half-hourly demand at an exit point (expressed in kVA) minus the lower threshold with the result multiplied by (1-Discount);
(c) if the metered demand is equal to or greater than 1,000 kVA a variable demand length charge calculated by multiplying the demand length price (detailed in Table 7)
by the electrical distance to the zone substation by the rolling 12-month maximum half-hourly demand (expressed in kVA) minus 1,000 kVA (Note: a different rate applies after 10 km); and
(d) a fixed metering charge per revenue meter (detailed in Table 9) which is payable each day
Notes:
1. This tariff is similar to RT5 in section 4.3 but for customers connected at low voltage. The higher tariff rates reflect the additional cost of using the low voltage network.
2. The on and off peak periods for this tariff are defined in the following table (all times are Western Standard Time (WST)):
Monday – Friday (includes public holidays) Saturday - Sunday
Off-peak On-Peak Off-Peak Off-Peak
12:00am – 8:00am 8:00am – 10:00pm 10:00pm – 12:00am All times
4.4.2 Discount
Identical to RT5 detailed in section 4.3.2.
4.5 Reference Tariff 7 (RT7)
4.5.1 Tariff Calculation
Reference Tariff RT7 consists of:
(a) If the contracted maximum demand (CMD) is less than 7,000 kVA:
i. a fixed demand charge for the first 1,000 kVA (detailed in Table 6) which is payable each day; plus
ii. a variable demand charge calculated by multiplying the applicable demand price (detailed in Table 6) by the CMD at an exit point (expressed in kVA) minus 1,000 kVA; plus
iii. a variable demand length charge calculated by multiplying the demand length price (detailed in Table 7) by the electrical distance to the zone substation by the CMD (expressed in kVA) minus 1,000 kVA (Note: a different rate applies after 10 km);
(b) If the CMD is equal to or greater than 7,000 kVA:

2015/16 Price List April 2015
DM#12493477 5
i. a variable demand charge calculated by multiplying the applicable demand price (detailed in Table 6) by the CMD at an exit point (expressed in kVA); plus
ii. a variable demand length charge calculated by multiplying the demand length price (detailed in Table 8) by the electrical distance to the zone substation by the CMD (expressed in kVA) (Note: a different rate applies after 10 km);
(c) a fixed metering charge per revenue meter (detailed in Table 9) which is payable each day;
(d) a fixed administration charge (detailed in Table 10) which is payable each day; and
(e) excess network usage charges (if applicable).
Notes:
1. For exit points located at the zone substation the fixed and demand charge specified in sections 4.5.1 (a)(i), (a)(ii) & (b)(i) is to be calculated using the transmission component only. In all other instances, the fixed and demand charge specified in sections 4.5.1 (a)(i), (a)(ii) & (b)(i) is to be calculated using the bundled charge.
4.5.2 Excess Network Usage Charges
An additional charge applies to this tariff where the peak half-hourly demand exceeds the nominated CMD during the billing period of the load.
The excess network usage charge (ENUC) is calculated by applying a factor to the excess usage as follows:
ENUC = ENUC Transmission + ENUC Distribution
Where
ENUC Transmission = ENUM * (PD – CMD) * DC Transmission / CMD
ENUC Distribution = ENUM * (PD – CMD) * (DC Distribution + DLC) / CMD
ENUM is the Excess network usage multiplier factor, which is set at 2
PD is the peak half-hourly demand during the billing period of the load
(expressed in kVA)
CMD is the nominated CMD for the billing period of the load (expressed in kVA)
DC Transmission are the applicable transmission components of the fixed and variable demand charges for the billing period for the nominated CMD
DC Distribution are the applicable distribution components of the fixed and variable demand charges for the billing period for the nominated CMD
DLC are the applicable variable demand length charges for the billing period for the nominated CMD
Notes:
1. The ENUC does not include the metering or administration components of the tariff.

2015/16 Price List April 2015
DM#12493477 6
4.6 Reference Tariff 8 (RT8)
4.6.1 Tariff Calculation
Reference Tariff RT8 consists of:
(a) If the contracted maximum demand (CMD) is less than 7,000 kVA:
i. a fixed demand charge for the first 1,000 kVA (detailed in Table 6) which is payable each day; plus
ii. a variable demand charge calculated by multiplying the applicable demand price (detailed in Table 6) by the CMD at an exit point (expressed in kVA) minus 1,000 kVA; plus
iii. a variable demand length charge calculated by multiplying the demand length price (detailed in Table 7) by the electrical distance to the zone substation by the CMD (expressed in kVA) minus 1,000 kVA (Note: a different rate applies after 10 km);
(b) If the CMD is equal to or greater than 7,000 kVA:
i. a variable demand charge calculated by multiplying the applicable demand price (detailed in Table 6) by the CMD at an exit point (expressed in kVA); plus
ii. a variable demand length charge calculated by multiplying the demand length price (detailed in Table 8) by the electrical distance to the zone substation by the CMD (expressed in kVA) (Note: a different rate applies after 10 km);
(c) a fixed low voltage charge (detailed in Table 11) which is payable each day;
(d) a variable low voltage charge calculated by multiplying the low voltage demand price (detailed in Table 11) by the CMD at an exit point (expressed in kVA);
(e) a fixed metering charge per revenue meter (detailed in Table 9) which is payable each day;
(f) a fixed administration charge (detailed in Table 10) which is payable each day; and
(g) excess network usage charges (if applicable).
Notes:
1. This tariff is identical to RT7 in section 4.5, with an additional low voltage charge to cover the use of transformers and LV circuits.
4.6.2 Excess Network Usage Charges
An additional charge applies to this tariff where the peak half-hourly demand exceeds the nominated CMD during the billing period of the load.
The excess network usage charge (ENUC) is calculated by applying a factor to the excess usage as follows:
ENUC = ENUC Transmission + ENUC Distribution
Where
ENUC Transmission = ENUM * (PD – CMD) * DC Transmission / CMD

2015/16 Price List April 2015
DM#12493477 7
ENUC Distribution = ENUM * (PD – CMD) * (DC Distribution + DLC + LVC) / CMD
ENUM is the Excess network usage multiplier factor, which is set at 2
PD is the peak half-hourly demand during the billing period of the load (expressed in kVA)
CMD is the nominated CMD for the billing period of the load (expressed in kVA)
DC Transmission are the applicable transmission components of the fixed and variable demand charges for the billing period for the nominated CMD
DC Distribution are the applicable distribution components of the fixed and variable
demand charges for the billing period for the nominated CMD
DLC are the applicable variable demand length charges for the billing period for the nominated CMD
LVC are the applicable additional fixed and additional demand (low voltage) charges for the billing period for the nominated CMD
Notes:
1. The ENUC does not include the metering or administration components of the tariff.
4.7 Reference Tariff 9 (RT9)
Reference Tariff RT9 consists of:
(a) a fixed use of system charge (detailed in Table 1) which is payable each day;
(b) a variable use of system charge calculated by multiplying the energy price (detailed in Table 1) by the estimated quantity of electricity consumed at an exit point (expressed in kWh and is based on the lamp wattage and illumination period); and
(c) a fixed asset charge based on the type of streetlight asset supplied (detailed in Table 2 and Table 3).
4.8 Reference Tariff 10 (RT10)
Reference Tariff RT10 consists of:
(a) a fixed use of system charge (detailed in Table 1) which is payable each day; and
(b) a variable use of system charge calculated by multiplying the energy price (detailed in Table 1) by the estimated quantity of electricity consumed at an exit point (expressed in kWh and based on the nameplate rating of the connected equipment and the hours of operation).

2015/16 Price List April 2015
DM#12493477 8
4.9 Reference Tariff 11 (RT11)
4.9.1 Tariff Calculation
Reference Tariff RT11 consists of:
(a) a variable connection charge calculated by multiplying the connection price (detailed in Table 12) by the loss-factor adjusted declared sent-out capacity (DSOC) at the entry point (expressed in kW);
(b) a variable control system service charge calculated by multiplying the control system service price (detailed in Table 16) by the nameplate output of the generator at the entry point (expressed in kW);
(c) a variable use of system charge calculated by multiplying the use of system price (based on the location of the electrically closest major generator and detailed in Table 14) by the loss-factor adjusted DSOC at the entry point (expressed in kW);
(d) If the DSOC is less than 7,000 kVA:
i. if the entry point is connected at 415 V or less and the DSOC is equal to or greater than 1,000 kVA a variable demand length charge calculated by multiplying the applicable demand length price (detailed in Table 7) by the electrical distance between the relevant HV network connection point and the electrically closest zone substation by the DSOC (expressed in kVA) minus 1,000 kVA (Note: a different rate applies after 10 km); or
ii. if the entry point is connected at greater than 415 V and the DSOC is equal to or greater than 1,000 kVA a variable demand length charge calculated by multiplying the applicable demand length price (detailed in Table 7) by the
electrical distance between the entry point and the electrically closest zone substation by the DSOC (expressed in kVA) minus 1,000 kVA (Note: a different rate applies after 10 km);
(e) If the DSOC is equal to or greater than 7,000 kVA:
i. if the entry point is connected at 415 V or less a variable demand length charge calculated by multiplying the applicable demand length price
(detailed in Table 8) by the electrical distance between the relevant HV network connection point and the electrically closest zone substation by the DSOC (expressed in kVA) (Note: a different rate applies after 10 km); or
ii. if the entry point is connected at greater than 415 V a variable demand length charge calculated by multiplying the applicable demand length price (detailed in Table 8) by the electrical distance between the entry point and the electrically closest zone substation by the DSOC (expressed in kVA) (Note: a different rate applies after 10 km);
(f) a fixed metering charge per revenue meter (detailed in Table 9) which is payable each day; and
(g) excess network usage charges (if applicable).
Notes:
1. The loss factor used to calculate the loss-factor adjusted DSOC is the relevant
portion from the generator to the zone substation of the loss factor published by the IMO for that generator.
2. For this reference tariff a unity power factor is assumed when converting between kW and kVA.
2015/16 Price List April 2015
DM#12493477 9
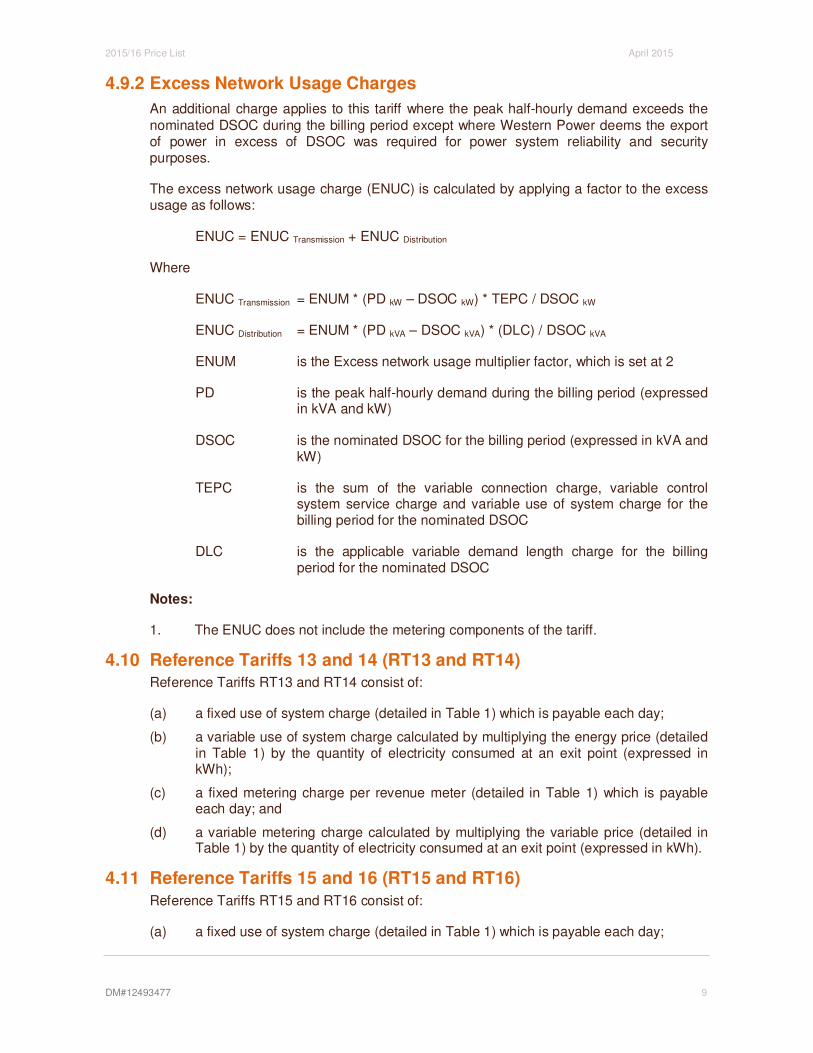
4.9.2 Excess Network Usage Charges
An additional charge applies to this tariff where the peak half-hourly demand exceeds the
nominated DSOC during the billing period except where Western Power deems the export of power in excess of DSOC was required for power system reliability and security purposes.
The excess network usage charge (ENUC) is calculated by applying a factor to the excess usage as follows:
ENUC = ENUC Transmission + ENUC Distribution
Where
ENUC Transmission = ENUM * (PD kW – DSOC kW) * TEPC / DSOC kW
ENUC Distribution = ENUM * (PD kVA – DSOC kVA) * (DLC) / DSOC kVA
ENUM is the Excess network usage multiplier factor, which is set at 2
PD is the peak half-hourly demand during the billing period (expressed in kVA and kW)
DSOC is the nominated DSOC for the billing period (expressed in kVA and kW)
TEPC is the sum of the variable connection charge, variable control system service charge and variable use of system charge for the billing period for the nominated DSOC
DLC is the applicable variable demand length charge for the billing period for the nominated DSOC
Notes:
1. The ENUC does not include the metering components of the tariff.
4.10 Reference Tariffs 13 and 14 (RT13 and RT14)
Reference Tariffs RT13 and RT14 consist of:
(a) a fixed use of system charge (detailed in Table 1) which is payable each day;
(b) a variable use of system charge calculated by multiplying the energy price (detailed in Table 1) by the quantity of electricity consumed at an exit point (expressed in kWh);
(c) a fixed metering charge per revenue meter (detailed in Table 1) which is payable each day; and
(d) a variable metering charge calculated by multiplying the variable price (detailed in Table 1) by the quantity of electricity consumed at an exit point (expressed in kWh).
4.11 Reference Tariffs 15 and 16 (RT15 and RT16)
Reference Tariffs RT15 and RT16 consist of:
(a) a fixed use of system charge (detailed in Table 1) which is payable each day;

2015/16 Price List April 2015
DM#12493477 10
(b) an on-peak use of system variable charge calculated by multiplying the on-peak energy price (detailed in Table 1) by the quantity of on-peak electricity consumed at an exit point (expressed in kWh);
(c) an off-peak use of system variable charge calculated by multiplying the off-peak energy price (detailed in Table 1) by the quantity of off-peak electricity consumed at an exit point (expressed in kWh);
(d) a fixed metering charge per revenue meter (detailed in Table 1) which is payable each day;
(e) an on-peak variable metering charge calculated by multiplying the on-peak variable price (detailed in Table 1) by the quantity of on-peak electricity consumed at an exit point (expressed in kWh); and
(f) an off-peak variable metering charge calculated by multiplying the off-peak variable price (detailed in Table 1) by the quantity of off-peak electricity consumed at an exit point (expressed in kWh).
Notes:
1. The on and off peak periods for these tariffs are defined in the following table (all times are Western Standard Time (WST)):
Monday – Friday (includes public holidays) Saturday - Sunday
Off-peak On-Peak Off-Peak Off-Peak
RT15 12:00am – 7:00am 7:00am – 9:00pm 9:00pm – 12:00am All times
RT16 12:00am – 8:00am 8:00am – 10:00pm 10:00pm – 12:00am All times

2015/16 Price List April 2015
DM#12493477 11
5 Transmission Tariff Application Guide
5.1 Transmission Reference Tariff 1 (TRT1)
5.1.1 Tariff Calculation
Reference Tariff TRT1 consists of:
(a) a user-specific charge that is to be an amount per day which reflects the costs to Western Power of providing the Connection Assets under an Access Contract, which may consist of capital and non-capital costs.
(b) a variable use of system charge calculated by multiplying the applicable use of system price (detailed in Table 13 or where there is no applicable use of system price in Table 13 for the exit point, the price calculated by Western Power in
accordance with Appendix A of the Price List Information) by the contracted maximum demand (CMD) at the exit point (expressed in kW);
(c) a variable common service charge calculated by multiplying the common service price (detailed in Table 15) by the CMD at the exit point (expressed in kW);
(d) a variable control system service charge calculated by multiplying the control system service price (detailed in Table 17) by the CMD at the exit point (expressed in kW);
(e) a fixed metering charge per revenue meter (detailed in Table 18) which is payable each day; and
(f) excess network usage charges (if applicable).
5.1.2 Excess Network Usage Charges
An additional charge applies to this tariff where the peak half-hourly demand exceeds the nominated CMD during the billing period of the load.
The excess network usage charge (ENUC) is calculated by applying a factor to the excess usage as follows:
ENUC = ENUM * (PD – CMD) * (UOS + CON + CS + CSS) / CMD
Where
ENUM is the Excess network usage multiplier factor, which is set at 2
PD is the peak half-hourly demand during the billing period of the load (expressed in kW)
CMD is the nominated CMD for the billing period of the load (expressed in kW)
UOS is the applicable variable use of system charge for the billing period for the nominated CMD
CON is the applicable User-specific charge for the billing period
CS is the applicable variable common service charge for the billing
period for the nominated CMD CSS is the applicable variable control system service charge for the
billing period for the nominated CMD
Note: The ENUC does not include the metering components of the tariff.

2015/16 Price List April 2015
DM#12493477 12
5.2 Transmission Reference Tariff 2 (TRT2)
5.2.1 Tariff Calculation
Reference Tariff TRT2 consists of:
(a) a user-specific charge that is to be an amount per day which reflects the costs to Western Power of providing the Connection Assets under an Access Contract, which may consist of capital and non-capital costs.
(b) a variable use of system charge calculated by multiplying the applicable use of system price (detailed in Table 14 or where there is no applicable use of system price in Table 14 for the entry point, the price calculated by Western Power in
accordance with Appendix A of the Price List Information) by the declared sent-out capacity (DSOC) at the entry point (expressed in kW);
(c) a variable control system service charge calculated by multiplying the control
system service price (detailed in Table 16) by the nameplate output of the generator at the entry point (expressed in kW);
(d) a fixed metering charge per revenue meter (detailed in Table 18) which is payable each day; and
(e) excess network usage charges (if applicable).
5.2.2 Excess Network Usage Charges
An additional charge applies to this tariff where the peak half-hourly demand exceeds the nominated DSOC during the billing period except where Western Power deems the export
of power in excess of DSOC was required for power system reliability and security purposes.
The excess network usage charge (ENUC) is calculated by applying a factor to the excess usage as follows:
ENUC = ENUM * (PD – DSOC) * (UOS + CON + CSS) / DSOC
Where
ENUM is the Excess network usage multiplier factor, which is set at 2
PD is the peak half-hourly demand during the billing period (expressed in kW)
DSOC is the nominated DSOC for the billing period (expressed in kW)
UOS is the applicable variable use of system charge for the billing period for the nominated DSOC
CON is the applicable User-specific charge for the billing period
CSS is the applicable variable control system service charge for the billing period
Note: The ENUC does not include the metering components of the tariff.

2015/16 Price List April 2015
DM#12493477 13
6 Price Tables The tables in the following sections must be used in conjunction with the details in the sections above. Table 6, Table 13 and Table 14 include a Transmission Node Identity (TNI) to uniquely identify zone substations. All prices quoted in this Price List are GST exclusive.
6.1 Prices for energy-based tariffs on the distribution network
6.1.1 Use of system and metering prices
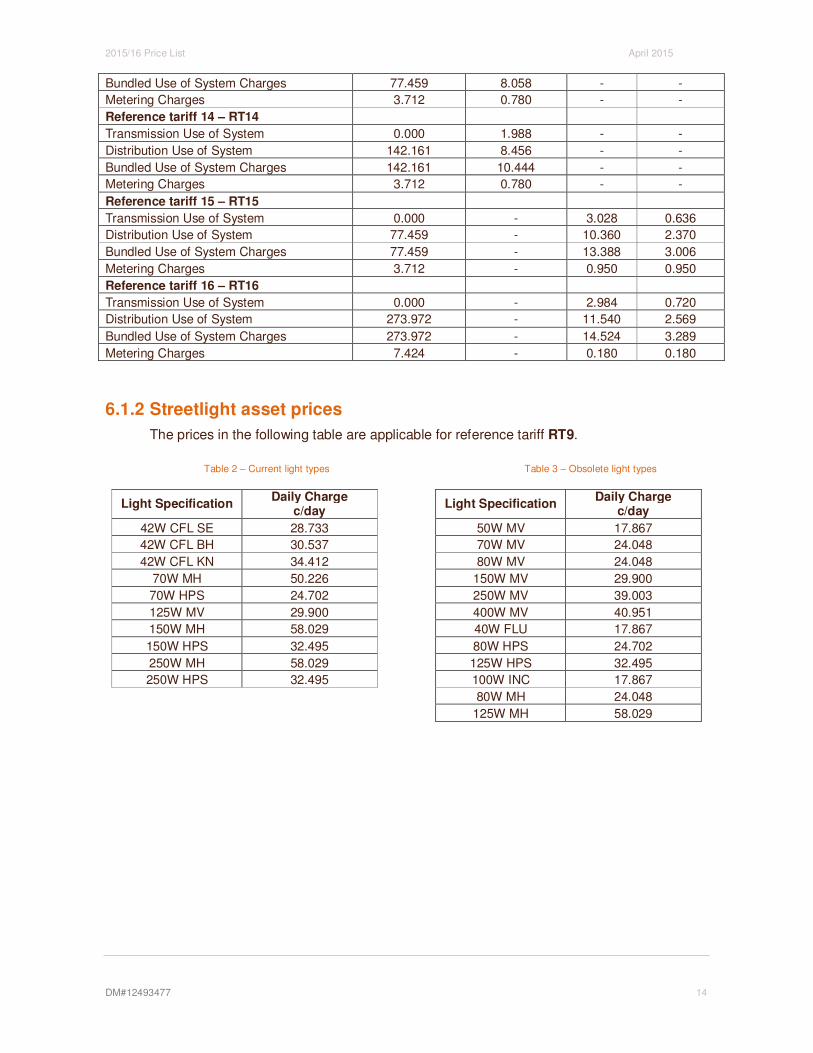
The prices in the following tables are applicable for reference tariffs RT1, RT2, RT3, RT4, RT9, RT10, RT13, RT14, RT15 and RT16.
Table 1
Fixed Price Energy Rates
c/day c/kWh On Peak
c/kWh
Off Peak
c/kWh
Reference tariff 1 - RT1
Transmission Use of System 0.000 1.674 - -
Distribution Use of System 77.459 6.384 - -
Bundled Use of System Charges 77.459 8.058 - -
Metering Charges 3.712 0.780 - -
Reference tariff 2 - RT2
Transmission Use of System 0.000 1.988 - -
Distribution Use of System 142.161 8.456 - -
Bundled Use of System Charges 142.161 10.444 - -
Metering Charges 3.712 0.780 - -
Reference tariff 3 - RT3
Transmission Use of System 0.000 - 3.028 0.636
Distribution Use of System 77.459 - 10.360 2.370
Bundled Use of System Charges 77.459 - 13.388 3.006
Metering Charges 3.712 - 0.950 0.950
Reference tariff 4 - RT4
Transmission Use of System 0.000 - 2.984 0.720
Distribution Use of System 273.972 - 11.540 2.569
Bundled Use of System Charges 273.972 - 14.524 3.289
Metering Charges 7.424 - 0.180 0.180
Reference tariff 9 – RT9
Transmission Use of System 0.000 1.022 - -
Distribution Use of System 6.979 3.228 - -
Bundled Use of System Charges 6.979 4.250 - -
Reference tariff 10 – RT10
Transmission Use of System 0.000 0.664 - -
Distribution Use of System 52.186 3.409 - -
Bundled Use of System Charges 52.186 4.073 - -
Reference tariff 13 – RT13
Transmission Use of System 0.000 1.674 - -
Distribution Use of System 77.459 6.384 - -
2015/16 Price List April 2015
DM#12493477 14
Bundled Use of System Charges 77.459 8.058 - -
Metering Charges 3.712 0.780 - -
Reference tariff 14 – RT14
Transmission Use of System 0.000 1.988 - -
Distribution Use of System 142.161 8.456 - -
Bundled Use of System Charges 142.161 10.444 - -
Metering Charges 3.712 0.780 - -
Reference tariff 15 – RT15
Transmission Use of System 0.000 - 3.028 0.636
Distribution Use of System 77.459 - 10.360 2.370
Bundled Use of System Charges 77.459 - 13.388 3.006
Metering Charges 3.712 - 0.950 0.950
Reference tariff 16 – RT16
Transmission Use of System 0.000 - 2.984 0.720
Distribution Use of System 273.972 - 11.540 2.569
Bundled Use of System Charges 273.972 - 14.524 3.289
Metering Charges 7.424 - 0.180 0.180
6.1.2 Streetlight asset prices
The prices in the following table are applicable for reference tariff RT9.
Table 2 – Current light types
Light Specification Daily Charge
c/day
42W CFL SE 28.733
42W CFL BH 30.537
42W CFL KN 34.412
70W MH 50.226
70W HPS 24.702
125W MV 29.900
150W MH 58.029
150W HPS 32.495
250W MH 58.029
250W HPS 32.495
Table 3 – Obsolete light types
Light Specification Daily Charge
c/day
50W MV 17.867
70W MV 24.048
80W MV 24.048
150W MV 29.900
250W MV 39.003
400W MV 40.951
40W FLU 17.867
80W HPS 24.702
125W HPS 32.495
100W INC 17.867
80W MH 24.048
125W MH 58.029

2015/16 Price List April 2015
DM#12493477 15
6.2 Prices for demand-based tariffs on the distribution network (RT5
to RT8 and RT111)
6.2.1 Demand charges
The prices in the following table are applicable for reference tariff RT5.
Table 4
Transmission Distribution Bundled Tariff
Demand (kVA)
(Lower to upper
threshold)
Fixed c/day
Demand (in excess of
lower threshold) c/kVA/day
Fixed c/day
Demand (in excess of
lower threshold) c/kVA/day
Fixed c/day
Demand (in excess of
lower threshold) c/kVA/day
0 to 300 0.000 19.989 176.199 55.637 176.199 75.626
300 to 1000 5,996.700 14.798 16,867.299 39.724 22,863.999 54.522
1000 to 1500 16,355.300 8.454 44,674.099 17.139 61,029.399 25.593
The prices in the following table are applicable for reference tariff RT6.
Table 5
Transmission Distribution Bundled Tariff
Demand (kVA)
(Lower to upper
threshold)
Fixed c/day
Demand (in excess of
lower threshold) c/kVA/day
Fixed c/day
Demand (in excess of
lower threshold) c/kVA/day
Fixed c/day
Demand (in excess of
lower threshold) c/kVA/day
0 to 300 0.000 19.989 1,005.872 57.495 1,005.872 77.484
300 to 1000 5,996.700 14.798 18,254.372 43.776 24,251.072 58.574
1000 to 1500 16,355.300 8.454 48,897.572 22.260 65,252.872 30.714
1 Note that some components of RT11 are in section 6.3

2015/16 Price List April 2015
DM#12493477 16
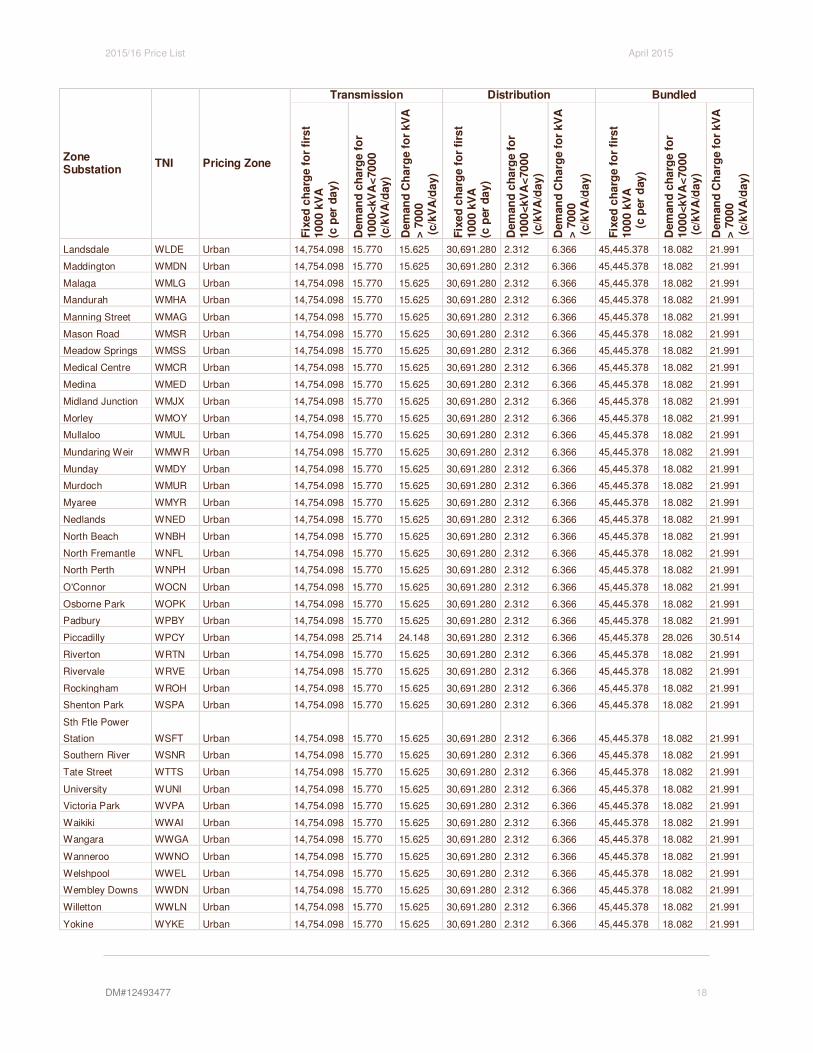
The prices in the following table are applicable for reference tariffs RT7 and RT8.
Table 6
Zone Substation
TNI Pricing Zone
Transmission Distribution Bundled
Fix
ed
ch
arg
e f
or
firs
t 1
000
kV
A
(c p
er
da
y)
Dem
an
d c
ha
rge
fo
r 1
000
<kV
A<
70
00
(c/k
VA
/da
y)
Dem
an
d C
harg
e f
or
kV
A
> 7
000
(c/k
VA
/da
y)
Fix
ed
ch
arg
e f
or
firs
t 1
000
kV
A
(c
per
da
y)
Dem
an
d c
ha
rge
fo
r 1
000
<kV
A<
70
00
(c/k
VA
/da
y)
Dem
an
d C
harg
e f
or
kV
A
> 7
000
(c/k
VA
/da
y)
Fix
ed
ch
arg
e f
or
firs
t 1
000
kV
A
(
c p
er
day
)
Dem
an
d c
ha
rge
fo
r 1
000
<kV
A<
70
00
(c/k
VA
/da
y)
Dem
an
d C
harg
e f
or
kV
A
> 7
000
(c/k
VA
/da
y)
Cook Street WCKT CBD 14,754.098 15.303 15.225 30,691.280 10.568 13.443 45,445.378 25.871 28.668
Forrest Avenue WFRT CBD 14,754.098 15.303 15.225 30,691.280 10.568 13.443 45,445.378 25.871 28.668
Hay Street WHAY CBD 14,754.098 15.303 15.225 30,691.280 10.568 13.443 45,445.378 25.871 28.668
Milligan Street WMIL CBD 14,754.098 15.303 15.225 30,691.280 10.568 13.443 45,445.378 25.871 28.668
Wellington Street WWNT CBD 14,754.098 15.303 15.225 30,691.280 10.568 13.443 45,445.378 25.871 28.668
Black Flag WBKF Goldfields Mining 14,754.098 30.189 27.984 30,691.280 5.595 9.180 45,445.378 35.784 37.164
Boulder WBLD Goldfields Mining 14,754.098 27.468 25.652 30,691.280 5.595 9.180 45,445.378 33.063 34.832
Bounty WBNY Goldfields Mining 14,754.098 52.011 46.689 30,691.280 5.595 9.180 45,445.378 57.606 55.869
West Kalgoorlie WWKT Goldfields Mining 14,754.098 24.563 23.162 30,691.280 5.595 9.180 45,445.378 30.158 32.342
Albany WALB Mixed 14,754.098 28.441 26.486 30,691.280 12.480 15.082 45,445.378 40.921 41.568
Boddington WBOD Mixed 14,754.098 14.294 14.360 30,691.280 12.480 15.082 45,445.378 26.774 29.442
Bunbury Harbour WBUH Mixed 14,754.098 13.956 14.070 30,691.280 12.480 15.082 45,445.378 26.436 29.152
Busselton WBSN Mixed 14,754.098 20.766 19.907 30,691.280 12.480 15.082 45,445.378 33.246 34.989
Byford WBYF Mixed 14,754.098 15.085 15.038 30,691.280 12.480 15.082 45,445.378 27.565 30.120
Capel WCAP Mixed 14,754.098 18.326 17.816 30,691.280 12.480 15.082 45,445.378 30.806 32.898
Chapman WCPN Mixed 14,754.098 24.834 23.394 30,691.280 12.480 15.082 45,445.378 37.314 38.476
Darlington WDTN Mixed 14,754.098 16.337 16.111 30,691.280 12.480 15.082 45,445.378 28.817 31.193
Durlacher Street WDUR Mixed 14,754.098 22.312 21.232 30,691.280 12.480 15.082 45,445.378 34.792 36.314
Eneabba WENB Mixed 14,754.098 20.895 20.018 30,691.280 12.480 15.082 45,445.378 33.375 35.100
Geraldton WGTN Mixed 14,754.098 22.312 21.232 30,691.280 12.480 15.082 45,445.378 34.792 36.314
Marriott Road WMRR Mixed 14,754.098 13.437 13.625 30,691.280 12.480 15.082 45,445.378 25.917 28.707
Muchea WMUC Mixed 14,754.098 16.839 16.541 30,691.280 12.480 15.082 45,445.378 29.319 31.623
Northam WNOR Mixed 14,754.098 21.844 20.831 30,691.280 12.480 15.082 45,445.378 34.324 35.913
Picton WPIC Mixed 14,754.098 15.166 15.107 30,691.280 12.480 15.082 45,445.378 27.646 30.189
Rangeway WRAN Mixed 14,754.098 23.859 22.558 30,691.280 12.480 15.082 45,445.378 36.339 37.640
Sawyers Valley WSVY Mixed 14,754.098 21.090 20.185 30,691.280 12.480 15.082 45,445.378 33.570 35.267
Yanchep WYCP Mixed 14,754.098 16.148 15.949 30,691.280 12.480 15.082 45,445.378 28.628 31.031
Yilgarn WYLN Mixed 14,754.098 26.572 24.884 30,691.280 12.480 15.082 45,445.378 39.052 39.966
Baandee WBDE Rural 14,754.098 29.859 27.701 30,691.280 5.468 9.071 45,445.378 35.327 36.772
Beenup WBNP Rural 14,754.098 34.611 31.774 30,691.280 5.468 9.071 45,445.378 40.079 40.845
Bridgetown WBTN Rural 14,754.098 20.538 19.712 30,691.280 5.468 9.071 45,445.378 26.006 28.783
Carrabin WCAR Rural 14,754.098 32.815 30.235 30,691.280 5.468 9.071 45,445.378 38.283 39.306
Collie WCOE Rural 14,754.098 24.549 23.150 30,691.280 5.468 9.071 45,445.378 30.017 32.221
Coolup WCLP Rural 14,754.098 27.842 25.972 30,691.280 5.468 9.071 45,445.378 33.310 35.043
Cunderdin WCUN Rural 14,754.098 27.476 25.659 30,691.280 5.468 9.071 45,445.378 32.944 34.730
Katanning WKAT Rural 14,754.098 25.058 23.586 30,691.280 5.468 9.071 45,445.378 30.526 32.657
Kellerberrin WKEL Rural 14,754.098 29.072 27.027 30,691.280 5.468 9.071 45,445.378 34.540 36.098
Kojonup WKOJ Rural 14,754.098 17.336 16.967 30,691.280 5.468 9.071 45,445.378 22.804 26.038

2015/16 Price List April 2015
DM#12493477 17
Zone Substation
TNI Pricing Zone
Transmission Distribution Bundled
Fix
ed
ch
arg
e f
or
firs
t 10
00
kV
A
(c p
er
da
y)
Dem
an
d c
ha
rge
fo
r 10
00
<kV
A<
70
00
(c/k
VA
/day)
Dem
an
d C
ha
rge f
or
kV
A
> 7
00
0
(c/k
VA
/da
y)
Fix
ed
ch
arg
e f
or
firs
t 10
00
kV
A
(c p
er
da
y)
Dem
an
d c
ha
rge
fo
r 10
00
<kV
A<
70
00
(c/k
VA
/da
y)
Dem
an
d C
ha
rge f
or
kV
A
> 7
00
0
(c/k
VA
/da
y)
Fix
ed
ch
arg
e f
or
firs
t 10
00
kV
A
(
c p
er
day
)
Dem
an
d c
ha
rge
fo
r 10
00
<kV
A<
70
00
(c/k
VA
/da
y)
Dem
an
d C
ha
rge f
or
kV
A
> 7
00
0
(c/k
VA
/da
y)
Kondinin WKDN Rural 14,754.098 18.683 18.122 30,691.280 5.468 9.071 45,445.378 24.151 27.193
Manjimup WMJP Rural 14,754.098 20.363 19.562 30,691.280 5.468 9.071 45,445.378 25.831 28.633
Margaret River WMRV Rural 14,754.098 26.824 25.100 30,691.280 5.468 9.071 45,445.378 32.292 34.171
Merredin WMER Rural 14,754.098 26.353 24.696 30,691.280 5.468 9.071 45,445.378 31.821 33.767
Moora WMOR Rural 14,754.098 20.593 19.759 30,691.280 5.468 9.071 45,445.378 26.061 28.830
Mount Barker WMBR Rural 14,754.098 26.277 24.631 30,691.280 5.468 9.071 45,445.378 31.745 33.702
Narrogin WNGN Rural 14,754.098 29.664 27.534 30,691.280 5.468 9.071 45,445.378 35.132 36.605
Pinjarra WPNJ Rural 14,754.098 14.238 14.312 30,691.280 5.468 9.071 45,445.378 19.706 23.383
Regans WRGN Rural 14,754.098 21.292 20.358 30,691.280 5.468 9.071 45,445.378 26.760 29.429
Three Springs WTSG Rural 14,754.098 20.527 19.702 30,691.280 5.468 9.071 45,445.378 25.995 28.773
Wagerup WWGP Rural 14,754.098 13.499 13.678 30,691.280 5.468 9.071 45,445.378 18.967 22.749
Wagin WWAG Rural 14,754.098 25.411 23.889 30,691.280 5.468 9.071 45,445.378 30.879 32.960
Wundowie WWUN Rural 14,754.098 22.443 21.345 30,691.280 5.468 9.071 45,445.378 27.911 30.416
Yerbillon WYER Rural 14,754.098 31.968 29.509 30,691.280 5.468 9.071 45,445.378 37.436 38.580
Amherst WAMT Urban 14,754.098 15.770 15.625 30,691.280 2.312 6.366 45,445.378 18.082 21.991
Arkana WARK Urban 14,754.098 15.770 15.625 30,691.280 2.312 6.366 45,445.378 18.082 21.991
Australian Paper
Mills WAPM Urban 14,754.098 15.770 15.625 30,691.280 2.312 6.366 45,445.378 18.082 21.991
Balcatta WBCT Urban 14,754.098 15.770 15.625 30,691.280 2.312 6.366 45,445.378 18.082 21.991
Beechboro WBCH Urban 14,754.098 15.770 15.625 30,691.280 2.312 6.366 45,445.378 18.082 21.991
Belmont WBEL Urban 14,754.098 15.770 15.625 30,691.280 2.312 6.366 45,445.378 18.082 21.991
Bentley WBTY Urban 14,754.098 15.770 15.625 30,691.280 2.312 6.366 45,445.378 18.082 21.991
Bibra Lake WBIB Urban 14,754.098 15.770 15.625 30,691.280 2.312 6.366 45,445.378 18.082 21.991
British Petroleum WBPM Urban 14,754.098 15.770 15.625 30,691.280 2.312 6.366 45,445.378 18.082 21.991
Canning Vale WCVE Urban 14,754.098 15.770 15.625 30,691.280 2.312 6.366 45,445.378 18.082 21.991
Clarence Street WCLN Urban 14,754.098 15.770 15.625 30,691.280 2.312 6.366 45,445.378 18.082 21.991
Clarkson WCKN Urban 14,754.098 15.770 15.625 30,691.280 2.312 6.366 45,445.378 18.082 21.991
Cockburn Cement WCCT Urban 14,754.098 15.770 15.625 30,691.280 2.312 6.366 45,445.378 18.082 21.991
Collier WCOL Urban 14,754.098 15.770 15.625 30,691.280 2.312 6.366 45,445.378 18.082 21.991
Cottesloe WCTE Urban 14,754.098 15.770 15.625 30,691.280 2.312 6.366 45,445.378 18.082 21.991
Edmund Street WEDD Urban 14,754.098 15.770 15.625 30,691.280 2.312 6.366 45,445.378 18.082 21.991
Forrestfield WFFD Urban 14,754.098 15.770 15.625 30,691.280 2.312 6.366 45,445.378 18.082 21.991
Gosnells WGNL Urban 14,754.098 15.770 15.625 30,691.280 2.312 6.366 45,445.378 18.082 21.991
Hadfields WHFS Urban 14,754.098 15.770 15.625 30,691.280 2.312 6.366 45,445.378 18.082 21.991
Hazelmere WHZM Urban 14,754.098 15.770 15.625 30,691.280 2.312 6.366 45,445.378 18.082 21.991
Henley Brook WHBK Urban 14,754.098 15.770 15.625 30,691.280 2.312 6.366 45,445.378 18.082 21.991
Herdsman Parade WHEP Urban 14,754.098 15.770 15.625 30,691.280 2.312 6.366 45,445.378 18.082 21.991
Joel Terrace WJTE Urban 14,754.098 15.770 15.625 30,691.280 2.312 6.366 45,445.378 18.082 21.991
Joondalup WJDP Urban 14,754.098 15.770 15.625 30,691.280 2.312 6.366 45,445.378 18.082 21.991
Kalamunda WKDA Urban 14,754.098 15.770 15.625 30,691.280 2.312 6.366 45,445.378 18.082 21.991
Kambalda WKBA Urban 14,754.098 27.301 25.509 30,691.280 2.312 6.366 45,445.378 29.613 31.875
Kewdale WKDL Urban 14,754.098 15.770 15.625 30,691.280 2.312 6.366 45,445.378 18.082 21.991
2015/16 Price List April 2015
DM#12493477 18
Zone Substation
TNI Pricing Zone
Transmission Distribution Bundled
Fix
ed
ch
arg
e f
or
firs
t 10
00
kV
A
(c p
er
da
y)
Dem
an
d c
ha
rge
fo
r 10
00
<kV
A<
70
00
(c/k
VA
/day)
Dem
an
d C
ha
rge f
or
kV
A
> 7
00
0
(c/k
VA
/da
y)
Fix
ed
ch
arg
e f
or
firs
t 10
00
kV
A
(c p
er
da
y)
Dem
an
d c
ha
rge
fo
r 10
00
<kV
A<
70
00
(c/k
VA
/da
y)
Dem
an
d C
ha
rge f
or
kV
A
> 7
00
0
(c/k
VA
/da
y)
Fix
ed
ch
arg
e f
or
firs
t 10
00
kV
A
(
c p
er
day
)
Dem
an
d c
ha
rge
fo
r 10
00
<kV
A<
70
00
(c/k
VA
/da
y)
Dem
an
d C
ha
rge f
or
kV
A
> 7
00
0
(c/k
VA
/da
y)
Landsdale WLDE Urban 14,754.098 15.770 15.625 30,691.280 2.312 6.366 45,445.378 18.082 21.991
Maddington WMDN Urban 14,754.098 15.770 15.625 30,691.280 2.312 6.366 45,445.378 18.082 21.991
Malaga WMLG Urban 14,754.098 15.770 15.625 30,691.280 2.312 6.366 45,445.378 18.082 21.991
Mandurah WMHA Urban 14,754.098 15.770 15.625 30,691.280 2.312 6.366 45,445.378 18.082 21.991
Manning Street WMAG Urban 14,754.098 15.770 15.625 30,691.280 2.312 6.366 45,445.378 18.082 21.991
Mason Road WMSR Urban 14,754.098 15.770 15.625 30,691.280 2.312 6.366 45,445.378 18.082 21.991
Meadow Springs WMSS Urban 14,754.098 15.770 15.625 30,691.280 2.312 6.366 45,445.378 18.082 21.991
Medical Centre WMCR Urban 14,754.098 15.770 15.625 30,691.280 2.312 6.366 45,445.378 18.082 21.991
Medina WMED Urban 14,754.098 15.770 15.625 30,691.280 2.312 6.366 45,445.378 18.082 21.991
Midland Junction WMJX Urban 14,754.098 15.770 15.625 30,691.280 2.312 6.366 45,445.378 18.082 21.991
Morley WMOY Urban 14,754.098 15.770 15.625 30,691.280 2.312 6.366 45,445.378 18.082 21.991
Mullaloo WMUL Urban 14,754.098 15.770 15.625 30,691.280 2.312 6.366 45,445.378 18.082 21.991
Mundaring Weir WMWR Urban 14,754.098 15.770 15.625 30,691.280 2.312 6.366 45,445.378 18.082 21.991
Munday WMDY Urban 14,754.098 15.770 15.625 30,691.280 2.312 6.366 45,445.378 18.082 21.991
Murdoch WMUR Urban 14,754.098 15.770 15.625 30,691.280 2.312 6.366 45,445.378 18.082 21.991
Myaree WMYR Urban 14,754.098 15.770 15.625 30,691.280 2.312 6.366 45,445.378 18.082 21.991
Nedlands WNED Urban 14,754.098 15.770 15.625 30,691.280 2.312 6.366 45,445.378 18.082 21.991
North Beach WNBH Urban 14,754.098 15.770 15.625 30,691.280 2.312 6.366 45,445.378 18.082 21.991
North Fremantle WNFL Urban 14,754.098 15.770 15.625 30,691.280 2.312 6.366 45,445.378 18.082 21.991
North Perth WNPH Urban 14,754.098 15.770 15.625 30,691.280 2.312 6.366 45,445.378 18.082 21.991
O'Connor WOCN Urban 14,754.098 15.770 15.625 30,691.280 2.312 6.366 45,445.378 18.082 21.991
Osborne Park WOPK Urban 14,754.098 15.770 15.625 30,691.280 2.312 6.366 45,445.378 18.082 21.991
Padbury WPBY Urban 14,754.098 15.770 15.625 30,691.280 2.312 6.366 45,445.378 18.082 21.991
Piccadilly WPCY Urban 14,754.098 25.714 24.148 30,691.280 2.312 6.366 45,445.378 28.026 30.514
Riverton WRTN Urban 14,754.098 15.770 15.625 30,691.280 2.312 6.366 45,445.378 18.082 21.991
Rivervale WRVE Urban 14,754.098 15.770 15.625 30,691.280 2.312 6.366 45,445.378 18.082 21.991
Rockingham WROH Urban 14,754.098 15.770 15.625 30,691.280 2.312 6.366 45,445.378 18.082 21.991
Shenton Park WSPA Urban 14,754.098 15.770 15.625 30,691.280 2.312 6.366 45,445.378 18.082 21.991
Sth Ftle Power
Station WSFT Urban 14,754.098 15.770 15.625 30,691.280 2.312 6.366 45,445.378 18.082 21.991
Southern River WSNR Urban 14,754.098 15.770 15.625 30,691.280 2.312 6.366 45,445.378 18.082 21.991
Tate Street WTTS Urban 14,754.098 15.770 15.625 30,691.280 2.312 6.366 45,445.378 18.082 21.991
University WUNI Urban 14,754.098 15.770 15.625 30,691.280 2.312 6.366 45,445.378 18.082 21.991
Victoria Park WVPA Urban 14,754.098 15.770 15.625 30,691.280 2.312 6.366 45,445.378 18.082 21.991
Waikiki WWAI Urban 14,754.098 15.770 15.625 30,691.280 2.312 6.366 45,445.378 18.082 21.991
Wangara WWGA Urban 14,754.098 15.770 15.625 30,691.280 2.312 6.366 45,445.378 18.082 21.991
Wanneroo WWNO Urban 14,754.098 15.770 15.625 30,691.280 2.312 6.366 45,445.378 18.082 21.991
Welshpool WWEL Urban 14,754.098 15.770 15.625 30,691.280 2.312 6.366 45,445.378 18.082 21.991
Wembley Downs WWDN Urban 14,754.098 15.770 15.625 30,691.280 2.312 6.366 45,445.378 18.082 21.991
Willetton WWLN Urban 14,754.098 15.770 15.625 30,691.280 2.312 6.366 45,445.378 18.082 21.991
Yokine WYKE Urban 14,754.098 15.770 15.625 30,691.280 2.312 6.366 45,445.378 18.082 21.991

2015/16 Price List April 2015
DM#12493477 19
6.2.2 Demand length charges
The prices in the following table are applicable for reference tariffs RT5, RT6, RT7, RT8 and RT11 and the CMD/DSOC is between 1,000 and 7,000 kVA.
Table 7
Demand-Length Charge
Pricing Zone For kVA >1000 and first
10 km length (c/kVA.km/day)
For kVA >1000 and length in excess of 10 km
(c/kVA.km/day)
CBD 0.000 0.000
Urban 1.498 1.049
Mining 0.319 0.223
Mixed 0.701 0.491
Rural 0.446 0.312
The prices in the following table are applicable for reference tariffs RT7, RT8 and RT11 and the CMD/DSOC is at least 7,000 kVA.
Table 8
Demand-Length Charge
Pricing Zone For first 10 km length
(c/kVA.km/day) For length in excess of 10 km
(c/kVA.km/day)
CBD 0.000 0.000
Urban 1.284 0.899
Mining 0.273 0.191
Mixed 0.601 0.421
Rural 0.383 0.268
6.2.3 Metering prices
The prices in the following table are applicable for reference tariffs RT5, RT6, RT7, RT8 and RT11.
Table 9
Metering Equipment Funding Voltage c/revenue meter/day
Western Power funded
High Voltage
(6.6 kV or higher) 1104.027
Low voltage
(415 volts or less) 198.936
Customer funded
High Voltage
(6.6 kV or higher) 527.459
Low Voltage
(415 volts or less) 95.044

2015/16 Price List April 2015
DM#12493477 20
6.2.4 Administration charges
The prices in the following table are applicable for reference tariffs RT7 and RT8.
Table 10
CMD Price
(c/day)
>=7,000 kVA 8,011.000
<7,000 kVA 4,601.000
6.2.5 LV Prices
The prices in the following table are applicable for reference tariff RT8.
Table 11
Category Price
(c/day)
Fixed 969.150
Demand 9.293/kVA
6.2.6 Connection Price
The prices in the following table are applicable for reference tariff RT11.
Table 12
Connection Price (c/kW/day)
Connection Price 1.420
6.3 Transmission prices
6.3.1 Use of system prices
The prices in the following table are applicable for reference tariff TRT1.
Table 13
Substation TNI Use of System Price
(c/kW/day)
Albany WALB 15.802
Alcoa Pinjarra WAPJ 5.005
Amherst WAMT 3.761
Arkana WARK 4.801
Australian Fused Materials WAFM 3.118
Australian Paper Mills WAPM 5.429
Baandee (WC) WBDE 16.938
Balcatta WBCT 4.919
Beckenham WBEC 13.094
Beechboro WBCH 4.369

2015/16 Price List April 2015
DM#12493477 21
Substation TNI Use of System Price
(c/kW/day)
Beenup WBNP 21.165
Belmont WBEL 4.116
Bentley WBTY 5.561
Bibra Lake WBIB 3.865
Binningup Desalination Plant WBDP 2.986
Black Flag WBKF 17.685
Boddington Gold Mine WBGM 3.238
Boddington WBOD 3.157
Boulder WBLD 15.227
Bounty WBNY 37.405
Bridgetown WBTN 8.644
British Petroleum WBPM 6.683
Broken Hill Kwinana WBHK 5.216
Bunbury Harbour WBUH 2.854
Busselton WBSN 8.941
Byford WBYF 3.863
Canning Vale WCVE 3.956
Capel WCAP 6.761
Carrabin WCAR 19.569
Cataby Kerr McGee WKMC 8.062
Chapman WCPN 12.577
Clarence Street WCLN 7.259
Clarkson WCKN 4.901
Cockburn Cement WCCT 2.817
Cockburn Cement Ltd WCCL 3.024
Collie WCOE 12.213
Collier WCOL 7.225
Cook Street WCKT 4.655
Coolup WCLP 15.143
Cottesloe WCTE 5.631
Cunderdin WCUN 14.818
Darlington WDTN 4.983
Edgewater WEDG 4.316
Edmund Street WEDD 4.96
Eneabba WENB 9.057
Forrest Ave WFRT 7.269
Forrestfield WFFD 5.102
Geraldton WGTN 10.323
Glen Iris WGNI 3.368
Golden Grove WGGV 27.056
Gosnells WGNL 4.306
Hadfields WHFS 4.961
Hay Street WHAY 5.331
Hazelmere WHZM 3.826
Henley Brook WHBK 4.451
Herdsman Parade WHEP 8.36
Joel Terrace WJTE 7.587
Joondalup WJDP 4.625

2015/16 Price List April 2015
DM#12493477 22
Substation TNI Use of System Price
(c/kW/day)
Kalamunda WKDA 5.212
Katanning WKAT 12.666
Kellerberrin WKEL 16.239
Kewdale WKDL 3.808
Kojonup WKOJ 5.795
Kondinin WKDN 6.994
Kwinana Alcoa WAKW 1.265
Kwinana Desalination Plant WKDP 3.291
Kwinana PWS WKPS 2.404
Landsdale WLDE 4.449
Maddington WMDN 3.997
Malaga WMLG 3.798
Mandurah WMHA 3.645
Manjimup WMJP 8.489
Manning Street WMAG 5.525
Margaret River WMRV 14.237
Marriott Road Barrack Silicon Smelter WBSI 2.73
Marriott Road WMRR 2.391
Mason Road WMSR 1.908
Mason Road CSBP WCBP 3.224
Mason Road Kerr McGee WKMK 1.953
Meadow Springs WMSS 3.701
Medical Centre WMCR 6.54
Medina WMED 2.881
Merredin 66kV WMER 13.819
Midland Junction WMJX 4.65
Milligan Street WMIL 6.158
Moora WMOR 8.693
Morley WMOY 5.273
Mt Barker WMBR 13.751
Muchea Kerr McGee WKMM 8.203
Muchea WMUC 5.431
Muja PWS WMPS 1.462
Mullaloo WMUL 4.778
Munday WMDY 5.329
Murdoch WMUR 3.081
Mundaring Weir WMWR 7.753
Myaree WMYR 6.574
Narrogin WNGN 16.765
Nedlands WNED 6.156
North Beach WNBH 4.919
North Fremantle WNFL 5.527
North Perth WNPH 4.199
Northam WNOR 9.905
Nowgerup WNOW 5.674
O'Connor WOCN 5.733
Osborne Park WOPK 5.335
Padbury WPBY 4.984

2015/16 Price List April 2015
DM#12493477 23
Substation TNI Use of System Price
(c/kW/day)
Parkeston WPRK 17.333
Parklands WPLD 3.81
Piccadilly WPCY 13.784
Picton 66kv WPIC 3.936
Pinjarra WPNJ 3.039
Rangeway WRAN 11.706
Regans WRGN 9.315
Riverton WRTN 3.406
Rivervale WRVE 5.914
Rockingham WROH 3.067
Sawyers Valley WSVY 9.231
Shenton Park WSPA 6.403
Southern River WSNR 3.922
South Fremantle 22kV WSFT 4.14
Summer St WSUM 7.831
Sutherland WSRD 4.199
Tate Street WTTS 6.613
Three Springs WTSG 8.634
Three Springs Terminal WTST 20.852
Tomlinson Street WTLN 6.329
University WUNI 7.1
Victoria Park WVPA 6.418
Wagerup WWGP 2.381
Wagin WWAG 12.981
Waikiki WWAI 3.19
Wangara WWGA 4.568
Wanneroo WWNO 4.807
Wellington Street WWNT 7.792
Welshpool WWEL 4.072
Wembley Downs WWDN 6.287
West Kalgoorlie WWKT 12.601
Western Collieries WWCL 2.145
Western Mining WWMG 2.521
Westralian Sands WWSD 6.13
Willetton WWLN 3.624
Worsley WWOR 1.988
Wundowie WWUN 10.34
Yanchep WYCP 4.814
Yerbillon WYER 18.815
Yilgarn WYLN 14.131
Yokine WYKE 5.214

2015/16 Price List April 2015
DM#12493477 24
The prices in the following table are applicable for reference tariffs RT11 and TRT2.
Table 14
Substation TNI Use of System
(c/kW/day)
Albany WALB 2.275
Boulder WBLD 1.648
Bluewaters WBWP 2.291
Cockburn PWS WCKB 1.389
Collgar WCGW 2.353
Collie PWS WCPS 2.385
Emu Downs WEMD 2.322
Geraldton WGTN 0.390
Greenough Solar Farm TMGS 0.496
Kemerton PWS WKEM 1.852
Kwinana Alcoa WAKW 1.432
Kwinana Donaldson Road WKND 1.087
Kwinana PWS WKPS 1.389
Landweir (Alinta) WLWT 1.729
Mason Road WMSR 1.087
Merredin Power Station TMDP 1.915
Muja PWS WMPS 2.614
Mumbida Wind Farm TMBW 2.357
Mungarra GTs WMGA 2.314
Newgen Kwinana WNGK 1.617
Newgen Neerabup WGNN 1.274
Oakley (Alinta) WOLY 1.928
Parkeston WPKS 1.988
Pinjar GTs WPJR 1.155
Alcoa Pinjarra WAPJ 2.024
Tiwest GT WKMK 1.123
Wagerup WWGP 1.594
Walkaway Windfarm WWWF 2.557
West Kalgoorlie GTs WWKT 1.616
Worsley WWOR 1.811

2015/16 Price List April 2015
DM#12493477 25
6.3.2 Common Service Prices
The prices in the following table are applicable for reference tariff TRT1.
Table 15
Common Service Price (c/kW/day)
Common Service Price 4.751
6.3.3 Control System Service Prices
The prices in the following table are applicable for reference tariffs RT11 and TRT2.
Table 16
Price (c/kW/day)
Control System Service Price (Generators) 0.177
The prices in the following table are applicable for reference tariff TRT1.
Table 17
Price (c/kW/day)
Control System Service Price (Loads) 1.389
6.3.4 Metering prices
The prices in the following table are applicable for reference tariffs TRT1 and TRT2.
Table 18
c/metering unit/day
Transmission Metering 4,233.137

2015/16 Price List April 2015
DM#12493477 26
7 Applications and Queuing Policy fees The Applications and Queuing Policy makes reference to several fees being published in
the Price List. From 1 July 2013, these prices will no longer be listed in the Price List but will instead be published as a separate document on the Western Power website.
The paper detailing the fees can be found at the link below:
http://www.westernpower.com.au/aboutus/accessArrangement/Networkaccessprices.jsp