
'2015!02!24 CHAPTER 34 Translational Neuroimaging FINAL (1)
30
Chapter 34 Translational Neuroimaging Felipe Picon a , Umberto Volpe b , Philipp Sterzer c,d , Andreas Heinz c,d a Child and Adolescent psychiatrist – ADHD Neuroimaging Researcher at PRODAH - Department of Psychiatry, Federal University of Rio Grande do Sul , Porto Alegre, RS, Brazil Department of Psychiatry, Federal University of Rio Grande do Sul , Porto Alegre, RS, Brazil b Department of Psychiatry, University of Naples SUN, Italy c Department of Psychiatry and Psychotherapy, Campus Charité Mitte, Charité – Universitätsmedizin Berlin, Germany Department of Psychiatry and Psychotherapy, Campus CharitéMitte – UniversitätsmedizinBerlim, Germany d Berlin School of Mind and Brain, Germany Abstract The translation of the neuroimaging discoveries concerning the underpinnings of psychiatric disorders into useful clinical applications for daily psychiatric practice would be of great help to the daily psychiatric practice. Considering that the techniques of neuroimaging map the function and the structure of the living human brain, it is plausible to consider them as the most appropriate techniques to generate biomarkers of psychiatric disorders. Starting from the history of neuroimaging techniques, the aim of this chapter is to review the current knowledge and the future perspectives of neuroimaging for future psychiatrists. The most developed brain imaging techniques are detailed and the most important approaches to analyze neuroimages are re o ver viewed; finally, a special attention is paid to the specificities of task-based and resting-state fMRI protocols are enumerated. In the future, it is highly likely that the brain imaging methods to explore in vivo the brain will pave the way to a number of new applications for the clinical psychiatrist. An academic and clinical background in neuroimaging will probably be highly needed for early career psychiatrists in the near future, both for research and clinical practice. Keywords MRI, fMRI, DTI, MRS, MEG, EEG, SPETC, PET, NIRSI, Neuroimaging, Psychiatry , Magnetic Resonance Imaging, fMRI, Biomarkers “Every now and then a man’s mind is stretched by a new idea or sensation, and never shrinks back to its former dimensions” Oliver Wendell Holmes, Sr. 1
-
Upload
felipe-bau -
Category
Documents
-
view
227 -
download
0
description
dig dig ieeeeeeeee
Transcript of '2015!02!24 CHAPTER 34 Translational Neuroimaging FINAL (1)

Chapter 34
Translational Neuroimaging
Felipe Picona, Umberto Volpeb, Philipp Sterzerc,d, Andreas Heinzc,d
a Child and Adolescent psychiatrist – ADHD Neuroimaging Researcher at PRODAH - Department of Psychiatry, Federal University of Rio Grande do Sul, Porto Alegre, RS, BrazilDepartment of Psychiatry, FederalUniversity of Rio Grande do Sul, Porto Alegre, RS, Brazil
bDepartment of Psychiatry, University of Naples SUN, Italy
c Department of Psychiatry and Psychotherapy, Campus Charité Mitte, Charité – Universitätsmedizin Berlin, GermanyDepartment of Psychiatry and Psychotherapy, Campus CharitéMitte – UniversitätsmedizinBerlim, Germany
d Berlin School of Mind and Brain, Germany
Abstract
The translation of the neuroimaging discoveries concerning the underpinnings of psychiatric disorders into
useful clinical applications for daily psychiatric practice would be of great help to the daily psychiatric
practice. Considering that the techniques of neuroimaging map the function and the structure of the living
human brain, it is plausible to consider them as the most appropriate techniques to generate biomarkers of
psychiatric disorders. Starting from the history of neuroimaging techniques, the aim of this chapter is to
review the current knowledge and the future perspectives of neuroimaging for future psychiatrists. The
most developed brain imaging techniques are detailed and the most important approaches to analyze
neuroimages are reoverviewed; finally, a special attention is paid to the specificities of task-based and
resting-state fMRI protocols are enumerated. In the future, it is highly likely that the brain imaging methods
to explore in vivo the brain will pave the way to a number of new applications for the clinical psychiatrist. An
academic and clinical background in neuroimaging will probably be highly needed for early career
psychiatrists in the near future, both for research and clinical practice.
Keywords
MRI, fMRI, DTI, MRS, MEG, EEG, SPETC, PET, NIRSI, Neuroimaging, Psychiatry, Magnetic Resonance Imaging,
fMRI, Biomarkers
“Every now and then a man’s mindis stretched by a new idea or sensation,
and never shrinks back to its former dimensions”Oliver Wendell Holmes, Sr.1

Case Vignette
Felix has just completed his psychiatric training. He is the best achieving doctor of his 2055graduation class. Worldwide efforts to understand how the brain works have thrived and now many ofthese neuroscientific findings are used daily to help ease and cure the myriad of psychiatric disorders. Felixhas been trained on how to interview, understand their suffering, diagnose, and treat psychiatric patients;however, as core competence of modern psychiatrists he has been also trained on how to applyneuroimaging techniques, as a tool to better differentiate diagnosis, choose between different treatmentsand make predictions on the outcomes of the interventions made. Felix is about to decide if to complete hisPhD in neuroradiology, in order to have better chances to be hired in his hometown psychiatric hospital.
Introduction
The futuristic picture described in the above case vignette is something that many psychiatrists longfor. It would be the ultimate translation of the neuroscientific discoveries into real daily psychiatricapplication2. The availability of objective measures of brain functioning and the deep understanding of theneurobiological underpinnings of mental disorders would be of great help to the daily psychiatric practice.This would be the best outcome scenario of the efforts being made by many neuroscientists around theworld. The various modalities of neuroimaging would, then, be effectively used to help daily psychiatricpractice beyond the neuroradiological use that it has today. Those would be an essential part of thediagnostic and prognostic process either providing actual diagnostic images for clinical classification orproviding different data, depending on the technique used, to help in defining the prognosis or to predictthe response to a certain treatment.
It is with this hopeful state of mind that this chapter has been written and its goal is to foster theinterest in neuroimaging among the future psychiatrists and also to make available toprovide them with thenomenclature and details of the technology already available.
History of neuroimaging
Neuroimaging, a field comprised by methods that image or map the structure and function of thebrain, has its history intertwined with the history of neurosciences and neuroradiology. In the sixteenthcentury, A. Vesalius performed neuroanatomical studies and considered that thoughts and feelings werestored in the cerebral ventricles3.Interestingly, centuries later the first modern psychiatric neuroimagingstudy done in 1976 using computerized tomography (CT) with schizophrenic patients also studied theventricular volumes4. Later on, A. Mosso was responsible for one of the foundation concepts ofneuroimaging, when he described the “human circulation balance” in 1878 and introduced the importantidea of blood flow variations during mental activities, which is, until today, a key-concept for functionalneuroimaging1,5. In the 1910’s, W. Dandy produced the first image of the brain in a painful procedure calledpneumoencephalography in which air injected into the ventricles was the contrast to form the x-ray imageof the brain. Its evolution came in the 1920’s when Dr. A. Egas Moniz introduced the cerebral angiographymaking X-ray images of blood vessels by injecting contrast, as we know it today6.In 1924, H. Berger recordedthe first human electroencephalogram (EEG)7giving way to the first recordings of event-related potentialslater on. In 1968, D. Cohen demonstrated alternating magnetic fields outside the human scalp, thusinitiating the magnetoencephalography (MEG)6,8. The evolution of the usage of x-rays to acquire images ofthe brain came a few decades later when the efforts of many scientists created the first computerizedtomography (CT) in 1971. It was not long until the developments of radioactive compounds were put

together with CT and as a consequence Single Positron Emission Computerized Tomography (SPECT) andPositron Emission Tomography (PET) were added to the neuroimaging techniques. At the same timeMagnetic Resonance Imaging (MRI) was also being developed and the first clinical MRI image was taken in1977. The following years were filled with the improvement of all modalities and the spread of MRI intoclinical settings. In 1990, S. Ogawa, introduced the concept of the Blood-Oxygen-Level dependent (BOLD)contrast and created the functional MRI9. Since then, published papers using fMRI have presented anexponential growth10. Since 2001, a different functional technique, known as “resting state” functionalconnectivity, has received considerable attention enabling measures of functional connectivity amongdifferent brain regions, without the use of any cognitive task in the scanner. It ist therefore stated that theperson was “resting”, although we know that the brain is actually restless11.
Figure 34.1. Timeline of neuroimaging techniques’ evolution
“Neuroimaging Evolution”
Current neuroimaging modalities
Contemporary approach to clinical neuroimaging is mainly handled by neurologists, andneuroradiologists (for diagnostic purposes), as well as by psychiatrists, trying to rule out a neurologicaletiology for psychiatric symptoms; this aspect will not be covered within this chapter. Instead, we willprovide an overview of the specificities of the main structural and functional modalities. Traditionally,neuroimaging modalities are categorized as either structural or functional. Current structural approachesare provided mainly by structural magnetic resonance imaging (sMRI) and diffusion tensor imaging (DTI)which focuses on the structural connectivity. Functional neuroimaging is currently represented by singlepositron emission computerized tomography (SPECT), positron emission tomography (PET),electroencephalography (EEG), magnetoencephalography (MEG), near infrared spectroscopic imaging(NIRSI), functional magnetic resonance imaging (fMRI), and magnetic resonance spectroscopy (MRS). Table34.1 will provide a brief elucidation of the above-mentioned techniques. The most recent technicaldevelopments in this field include the “voxel-wise correction” and the “Biological Parametric Mapping”(which allow to correct for brain volume differences between patients and controls) 12. Table 34.2 willprovide a comparison between the main functional modalities regarding their strengths and limitations.
Table 34.1. Neuroimaging modalities
Neuroimaging Modality Briefdescription
Structural Magnetic Resonance Imaging (sMRI) Evolving from CT, MRI structural studies beganstudying ROI (Regions of Interest);this approachprovides information on one brain structure of

Please see images below in Table 34.3. interest at a time. sMRI is based on the T1 contrastof MR images to elucidate peculiarities anddifferences in volume of brain regions in eachpsychiatric disorder compared to controls subjects.For further details, please also see Table 34.2
Diffusion Tensor Imaging (DTI)
INSERT_ABOUT_HERE_IMAGE_01_DTIFigure 34.2
DTI uses the restriction of movement of watermolecules within the myelin sheath to determinethe morphology of axonal bundles in the whitematter (tractography) and to calculate its anisotropy(as reported in most of the studies, the FractionalAnisotropy of FA). DTI provides information on thestructural connectivity between brain regions13.
Single Positron Emission Computerized Tomography (SPECT)
INSERT_ABOUT_HERE_IMAGE_02_SPECT14 figure 34.314
A single photon emitting radiopharmaceutical(contrast) is injected into the bloodstream of thepatient and then the patient is placed in the SPECTscanner so that the device captures the singlephoton emission, thus generating a brain image withgreater intensity where the radiopharmaceutical hasmore activity. For example, if the contrast is linkedto a dopamine transporter molecule, it is possible tomap where this transporter protein is available inthe brain15.
Positron Emission Tomography (PET)
INSERT_ABOUT_HERE
IMAGE_03_PET16figure 34.416
PET uses the same principle of SPECT, but the PETradiopharmaceutical contrasts emit positrons, havea shorter half-life (the cyclotron has to be placednear the scanner), and a better spatial resolution,hence PET provides images with greater resolutionthan with SPECT.
PET uses radionuclides such as 15O, 13N, 11C, 18F and,with half-lives of 15O=2 min, 13N=10 min, 11C=20 minand 18F=110 min each with an specific decay, thusbeing used in different manners, depending on thefocus of the study17.
Electroencephalography (EEG)
INSERT_ABOUT_HERE
_IMAGE_04_EEG18figure 34.518
The electrodes placed on the scalp of the subjectmeasure the voltage oscillations of the flow of ioniccurrents from brain cortical neurons; the recordedbioelectrical measure provides a topographical andmomentary expression of the brain activity19.
Magnetoencephalography (MEG) MEG captures the electromagnetic fields produced

INSERT_ABOUT_HERE_IMAGE_05_MEG20
(Page 35)figure 34.6 20
by brain electrical currents, by using highly sensitivemagnetometers; it provides electromagneticmeasures of brain functioning8,20.
Near Infrared Spectroscopic Imaging (NIRSI)
INSERT_ABOUT_HERE_IMAGE_06Figure 34.7_NIRSI21
NIRSI is a non-invasive technique, in whichtransmitters and detectors of near-infrared light areplaced on the head of the subject to detectdifferences in transmission and absorption of theinfrared light reflected on the hemoglobin.Therefore NIRSI can measure the cortical changes inblood flow, which indicate neuronal activity22. It hasa relatively low spatial resolution and only coversthe cortex, but has the advantages of being easilymoved to more naturalistic environments (outside aresearch facility or hospital), and it is non-invasive.
Functional Magnetic Resonance Imaging (fMRI)
INSERT_ABOUT_HERE_IMAGE_07_Figure 34.8 FMRI23
FMRI studies brain activity by detecting changes inblood flow related to brain function. It uses acontrast called BOLD (blood oxygenated leveldependent), which uses the distortion of theelectromagnetic field in the MRI scanner to showwhere the oxygenated blood ceased to beoxygenated, thus revealing where substantial brainfunction occurred9.
Magnetic Resonance Spectroscopy (MRS)
INSERT_ABOUT_HERE
_IMAGE_08_MR_Figure 34.9 SPECTROSCOPY24
MRS shows the concentration of e.g. N-acetylaspartate (NAA), choline (Cho), creatine (Cr), lipids,lactate (Lac), myo-inositol (mI), glutamate (Glu) andglutamine (Gln) in a selected brain area. Eachmetabolite has its specific characteristic as a markerof a specific neuronal activity25. MRS gives ametabolic measure of brain function.
Table 34.2.Strengths and limitations of the main functional neuroimaging modalities.
NeuroimagingModalitityModalit
y
TemporalResolution
Spatial Resolution Invasiveness
SPECT > 60 seconds 6-8mmYes (uses
radiotracers)
PET 45 seconds 4mmYes (uses
radiotracers)

MEG 1 milisecond 5mm Noninvasive
fMRI 2-5 seconds 1-1,15mm Noninvasive
Brain images acquired with MRI can be processed with different software, thus providing differentdata outputs. Among the methods used for structural images, there are two main approaches most used inthe literature: voxel-based morphometry (VBM) and surface-based morphometry (SBM), also known formeasuring the cortical thickness. See details of each approach in table 34.3. Other relevant software used inneuroimaging pre-processing and analysis is presented below in table 34.4.
Table34.3. Voxel and surface-based morphometry sMRI techniques.
Technique Description
Voxel-based Morphometry (VBM)
INSERT_ABOUT_HERE_IMAGE_09_Figure 34.10 VBM26
VBM allows the study of regional differences inbrain structure. It compares the brains of groups ofindividuals at the level of each voxel (tridimensionalpixel), usually measuring 1mm327.VBM has been firstdeveloped as an analytical option of the StatisticalParametric Mapping (SPM) software package28.
Surface-based Morphometry (SBM)
INSERT_ABOUT_HERE_IMAGE_10Figure 34.11
_CORTICAL_THICKNESS29
SBM uses surfaces to set limits/boundaries instructural brain images to measure distancesbetween brain regions. One of such boundaries liesbetween gray and white matter, while another oneis set between the outer border of the gray matterto the CSF space. Thus, the technique allows toestimate the thickness of the cerebral cortex. Inaddition, SBM allows the measuring the gyralcurvature, depth, area and volume of various brainregions30. The best known software that uses thismethod is Freesurfer31
Table 34.4. Neuroimaging software
Software Institution of origin Main characteristics
Statistical ParametricMapping (SPM)
University College London,UK
SPM is a free software designed to carry outstatistical parametric mapping of functional andstructural brain images (fMRI and PET)28.
http://fil.ion.ucl.ac.uk/spm
Functional MagneticResonance Imaging ofthe Brain SoftwareLibrary (FSL)
Oxford University, UK FSL is a free software library of image analysis andstatistical tools for functional, structural anddiffusion MRI brain imaging data32
http://www.fmrib.ox.ac.uk/fsl

Analysis of FunctionalNeuroImages (AFNI)
National Institute of MentalHealth (NIMH), Bethesda,MD, USA
AFNI is an open-source agglomeration of programsfor processing and displaying functional MRIdata33.
http://afni.nimh.nih.gov/afni
FreeSurfer MGH/HST Athinoula A.Martinos Center forBiomedical Imaging,Charleston, MA, USA
FreeSurfer is a free software for analyzing MRstructural, functional and diffusion images. Itsmost known feature is the measurement of thecerebral cortical thickness31.
http://www.freesurfer.net
BioImage Suite Yale University, New Haven,CT, USA
BioImage Suite is a free software for the analysis ofneuro, cardiac and abdominal images.
http://www.bioimagesuite.org
MRIcron University of South Carolina,Columbia, SC, USA
MRIcron is a free software used to view andconvert the DICOM image format (original formatof the images acquired by the scanner) into theNIfTI34 format, which is the image format mostlyused in the above mentioned software.
http://www.nitrc.org/projects/mricron
Functional MRI is traditionally known for showing which brain areas are activated during a specifictask, executed by the subjects inside the scanner, as the BOLD signal raises and diminishes according to theneuronal activity. This approach is also known as task-based fMRI. In addition to investigating functionalspecialization in terms of increases and decreases of the BOLD signal in specific brain regions, fMRI can alsobe used to examine functional integration, that is, task-related interactions between brain regions in termsof functional connectivity35.A straightforward way to measure functional connectivity is to assess how theBOLD signal time course in one brain region covaries with the signal in other regions as a function oftask36or in dependence of between-subject factors such as genotype37or psychopathology38. In contrast tosuch correlative approaches, other methods such as Granger causality39or dynamic causal modeling(DCM)40aim at inferring causal interactions between brain regions from fMRI signal time courses. Forexample, DCM for fMRI has been used to show reduced interactions between frontal and parietal regionsduring a working memory task in patients with schizophrenia41.
In addition to task-based fMRI, functional connectivity can also be assessed in resting-state fMRI(RS-fMRI), in which the subject is not required to attend and respond to any task, instead the subject justhas to lie still inside the scanner with the eyes closed or opened and fixed on a specific point. In the RS-fMRI, the BOLD signal oscillations of the whole brain are interpreted as wherever the signal is synchronicallyraising or diminishing, it is said that these areas are “communicating” with each other. This fMRI techniqueis gaining space within the neuroimaging scientific community and is focused on showing the functionalconnectivity between different brain areas independent of specific task-related activations. For furtherdetails on this technique, please see Table34. 5.
Table 34.5. Task-based fMRI and Resting-State fMRI

fMRI approach Description
Task-based fMRI This is the traditional fMRI approach that uses the blood flow fluctuations,through the BOLD signal, to generate images of the brain activity, while thesubject is performing a specific task. Task-based fMRI can be analyzed usingdifferent neuroimaging software, such as SPM42, AFNI33 and FSL32. Severaldifferent neuropsychological tests have been used (flanker test, go-no go test,etc.) and the field is always trying to develop new tasks in order to answerdifferent questions or to reach more accurate responses inside the scanner.
Resting-state fMRI RS-fMRI shows which regions are “communicating” with each other, making itpossible to elucidate functional networks during rest and their potentialalterations in mental disorders. It reveals the functional connectivity withoutthe need to execute any neuropsychological task while inside the scanner,which is why it holds the “resting” in its name43. Resting-State fMRI can beanalyzed using the same neuroimaging software as task-based fMRI, althoughthe way to interpret the findings is different.
Resting state functional MRI aroused much interest in the field of cognitive neuroscience since thefirst studies in the early 2000’s43. The technique explores the intrinsic activity of the brain, not necessarilyrelated to any motor or sensorial event, which became best known by the study of the so-called “defaultmode network” (DMN)44. Resting State fMRI also reveals the functional status of other basic brain networks,such as the auditory system, visual system, sensorimotor system, “salience” network, “executive control”network, and the “dorsal attention” network11.The exploration of the activity of all these networks can beobtained any task performance. Possibly this is one of the most relevant reasons why this techniquerecently blossomed within the psychiatric research community; furthermore, RS-fMRI allows the study ofpatients with various ages, various mental disorders and levels of cognitive functioning, with no need totrain the patient with regards to a specific task. This flexibility of application reveals itself very useful forpsychiatric research and currently this method has been already used to analyze aberrations, disruptions,and modifications of functional connectivity involved in several mental disorders: bipolar disorder45-47, majordepression48-50, schizophrenia51-53, attention-deficit hyperactivity disorder (ADHD)54-56, panic disorder57-59,social anxiety disorder60-64, post traumatic stress disorder (PTSD)65,66,generalized anxiety disorder(GAD)67,68,obsessive compulsive disorder (OCD)69,70, autism71,72, borderline personality disorder73,74,anorexia75-77, bulimia78,79, alcohol dependence80,81, cocaine addiction82-86, cannabis addiction87,88, heroinaddiction89-91, internet gaming addiction92,93, pathological gambling94,95 among others.
The DMN consists of a set of brain regions, including cortical midline structures such as theventromedial prefrontal cortex and the posterior cingulate gyrus and areas of lateral parietal cortex andsuperior temporal gyrus bilaterally, which are more activated when one is thinking about the future,remembering the past or day dreaming96. Historically, the DMN was discovered during the study of themoments of "rest" that occurred during task-based functional studies (moments in which the subject wasnot performing the cognitive task). Ever since Raichle coined the term “Default Mode Network” in 200144
the exploration of this network has been nonstop developing. Many of the psychiatric studies referredabove study the disruptions and alteration of the DMN. Its function has already been described in othermammals as well97-99 and its reliability100 and consistency101-103 strengthens its translational use to psychiatryas a possible future biomarker.

INSERT_ABOUT_HERE_ Figure 34.12IMAGE_11_DEFAULT_MODE_NETWORK104
The quest for neuroimaging biomarkers for psychiatric disorders
A biomarker as defined by the Biomarkers Definitions Working Group is a "characteristic that isobjectively measured and evaluated as an indicator of normal biological processes, pathogenic processes,or pharmacologic responses to a therapeutic intervention"105. Considering that the techniques ofneuroimaging map the function and status of the living human brain, it is plausible to consider that they arethe most appropriate techniques to generate biomarkers of psychiatric disorders. Neuroimaging biomarkersof psychiatric disorders would improve considerably the routine of psychiatrists. They would provideobjective measures of brain function for the propose of differential diagnosis, classification, staging,prediction of course of the disorder, and prediction of response to treatment106. As a prognostic biomarker,a specific set of neuroimaging features could predict future occurrence of a disorder in healthy childhoodsamples, for instance. With this foreseeability, prevention of future negative psychiatric outcomes would behighly and accurately enhanced. Unfortunately, as we know, this goal has not yet been reliably reached yet.Even so, this quest for a useful neuroimaging biomarker in psychiatry already counts with many studies thatapply structural and functional modalities.
Structural MRI scans of individuals with ADHD, schizophrenia, Tourette’s syndrome, bipolar disorder,and at familial risk for major depression were discriminated from the sMRI scans of healthy subjectsthrough the use of a statistical algorithm that analyses the differences in all images and was able todifferentiate one group from the other only with the features of the images107. In another study, grey matterdensity was calculated from sMR images of 36 patients with recent-onset psychosis and 36 matchedcontrols and a pattern classification analysis was applied. The method was able to classify both groups with86.1% of accuracy108. A similar approach using support vector machine classification, a machine learningapproach to BOLD signal patterns of task-based fMRI, was used with the functional brain images ofadolescents with ADHD and controls. The pattern of brain activation correctly classified up to 90% ofpatients (sensibility) and 63% of controls (specificity), achieving an overall classification accuracy of 77%109.Another study, using the same approach, but with a different task, also showed a pattern of brain activationcorrectly classified up to 80% of patients (sensitivity) and 70% of controls (specificity), achieving an overallclassification accuracy of 75%110. Using Resting State-fMRI of 98 ADHD patients and 141 healthy controlsanother group was able to demonstrate 76.15% accuracy and sensitivity of 63.27% and specificity of 85.11%in the discrimination of both groups with the use of a support vector machine classifier 111. The approach canbe used to elucidate gene x gene effects on brain structure112. Besides the use of sMRI and fMRI signals,there is also the use of functional NIRS data to differentiate patients with schizophrenia from healthycontrols. Hahn and colleagues113 enrolled 40 patients with schizophrenia and 40 controls that underwent aworking memory task while wearing the fNIRS helmet. The method was able to classify the different groupswith a 76% accuracy. However, these promising findings need to be replicated in independent samples, inorder to reach external validity and eventually become a useful biomarker.
In the attempt to use neuroimaging as a biomarker of prediction of treatment outcome, Wrase etal.114 observed that amygdala volume reductions predict relapse in alcohol-dependent subjects. McGrathand colleagues115 used glucose PET scans of 38 patients prior to randomization to treatment for depressionwith either escitalopram (10-20mg/d) or 16 sessions of cognitive behavior therapy; they found that insulahypometabolism was associated with remission to cognitive behavior therapy and poor response toescitalopram, while insula hypermetabolism was associated with remission to escitalopram and poorresponse to cognitive therapy. Another study enrolled 24 patients suffering from depression and compared

them with 51 healthy controls, with the use of PET with a serotonin binding radiotracer. They found thatelevated serotonin binding in raphe nuclei was associated with subsequent remission with the use ofescitalopram116. Diffusion Tensor Imaging was also applied to 18 subjects with depression prior to an8weeks treatment with SSRI. Average fractional anisotropy (FA) in the tracts to the right amygdala weresignificantly lower in non-remitters than remitters. These results suggest that the integrity and/or thenumber of white matter fibers terminating in the right amygdala may be compromised in SSRI non-remitters117.
Those above are just some examples of different ways to address the quest for an objectivemeasure of brain function in psychiatric disorders through neuroimaging techniques. Each modality has itsstrengths and weaknesses related to how it acquires the biological signals of the brain. One possibleexplanation for why no reliable biomarker is available yet is the lack of a neurochemical specificity in anyspecific disorder when referring to neurotransmitters and the use of SPECT and PET, for instance106. Theabsence of a gold standard of functional activity in fMRI is also a major challenge to be overcome.Moreover, several clinically diagnosed disorders share common neurobiological dysfunctions, e.g. duringreward anticipation118. Besides that, the wide variety of software used and the lack of a gold standard ofstatistical analysis are also sources of concern. This diversity makes it difficult to compile data; therefore itaffects an overall analysis. Another important aspect that hampers the extrapolation of neuroimagingfindings on psychiatric disorders is sample sizes. As there are many studies with small sample size, somefindings cannot be extrapolated to the general population, making this a future challenge for all youngpsychiatrists who venture in this field of research119.As shown above, the applications of pattern-basedanalysis, e.g., using machine learning techniques, is a promising way to predict the course of psychiatricdiseases. Perhaps the most important translational use for a neuroimaging biomarker would be todifferentiate between psychiatric disorders, not between cases and controls, since that can be easily doneclinically without any scans. As an example, the differentiation of whether a child presenting distractibilityhas ADHD or bipolar disorder is of extreme importance, because the treatment is totally different from onesituation to the other. Even more important would be to predict the onset of psychosis before it happened,hopefully preventing its onset with early treatment.
Conclusions
Despite all the progress neuroimaging techniques had in the last 30 years, there are still severalquestions left unanswered. One of the most fundamental questions of neuroscientists: "how does the brainfunction" is still waiting for a clinically meaningful answer. This exemplifies one caveat of fMRI, that there isno gold standard for brain activation or deactivation. The recent discoveries shown through brain imagesusually amaze the unwarned reader of a neuroimaging headlines in a lay journal or magazine, but for themost part, these results only enlighten the research path of the specific disorder studied. This is the issue ofexternal validity of neuroimaging studies.
Some initiatives are already in place in order to manage some of these limitations described above.Regarding the sample size of neuroimaging studies, some international collaborations are in progresssharing openly online large samples of structural and functional neuroimaging data, in order to promote thegrowth of discovery science120. Initiatives with a specific focus on children at-risk for the development ofpsychopathology121, ADHD122, autism71, addiction123 and large community-base sample to study psychiatricdisorder through the life span124 with multi-modality neuroimaging are already in progress. Many groupsfrom different parts of the world are collaborating also to address through neuroimaging the humanconnectome125 and substantial public funding and support to eliminate brain dysfunctions126,127 are now

officially added in this worldwide effort to understand how the brain functions. Hopefully, in the years tocome the results from these initiatives will help us better understand the brain and lead us to solve some ofthe difficulties in the quest for a neuroimaging biomarker for psychiatric disorders.
The scope of the methods presented here shows the numerous possibilities and increasingopportunities for the early career psychiatrist interested in psychiatric neuroimaging research. For those notinclined to research, it is our hope that this brief review will help to deal with future discoveries ofpsychiatric neuroimaging. Translational neuroimaging is still in its infancy, but with an exponential growth asseen in the last decade increases the possibilities that the futuristic picture described in the beginning ofthe chapter will eventually become reality.

References
1. Holmes OW. The autocrat of the breakfast-table (by O.W. Holmes). 1858.
2. Machado-Vieira R. Tracking the impact of translational research in psychiatry: state of the art and perspectives. J Transl Med. 2012;10:175.
3. Vesalius A. De humani corporis fabrica libri septem. 1543.
4. Johnstone EC, Crow TJ, Frith CD, Husband J, Kreel L. Cerebral ventricular size and cognitive impairment in chronic schizophrenia. The Lancet. 1976 Oct 30;2(7992):924–6.
5. Sandrone S, Bacigaluppi M, Galloni MR, Martino G. Angelo mosso (1846-1910). J Neurol. 2012 Nov 1;259(11):2513–4.
6. Alper MGM. Three pioneers in the early history of neuroradiology: the Snyder lecture. Doc Ophthalmol. 1999 Jan 1;98(1):29–49.
7. Haas LF. Hans Berger (1873–1941), Richard Caton (1842–1926), and electroencephalography. J Neurol Neurosurg Psychiatr. BMJ Publishing Group Ltd; 2003;74(1):9–9.
8. Cohen D. Magnetoencephalography: evidence of magnetic fields produced by alpha-rhythm currents. Science. 1968 Aug 23;161(3843):784–6.
9. Ogawa S, Lee TM, Kay AR, Tank DW. Brain magnetic resonance imaging with contrast dependent onblood oxygenation. Proc Natl Acad Sci USA. 1990 Dec;87(24):9868–72.
10. Bandettini P. Functional MRI today. International Journal of Psychophysiology. 2007 Feb;63(2):138–45.
11. Raichle ME. The Restless Brain. Brain Connectivity. 2011 Jan;1(1):3–12.
12. Beck A, Wustenberg T, Genauck A, Wrase J, Schlagenhauf F, Smolka MN, et al. Effect of brain structure, brain function, and brain connectivity on relapse in alcohol-dependent patients. Arch Gen Psychiatry. 2012 Aug 1;69(8):842–52.
13. Tournier J-D, Mori S, Leemans A. Diffusion tensor imaging and beyond. Magn Reson Med. 2011 Jun;65(6):1532–56.
14. Weng Y-H, Yen T-C, Chen M-C, Kao P-F, Tzen K-Y, Chen R-S, et al. Sensitivity and specificity of 99mTc-TRODAT-1 SPECT imaging in differentiating patients with idiopathic Parkinson's disease from healthy subjects. J Nucl Med. 2004 Mar;45(3):393–401.
15. Holman BL, Devous MD. Functional brain SPECT: the emergence of a powerful clinical method. J Nucl Med. 1992 Oct;33(10):1888–904.
16. Portnow LH, Vaillancourt DE, Okun MS. The history of cerebral PET scanning: from physiology to cutting-edge technology. Neurology. 2013 Mar 5;80(10):952–6.
17. Raichle ME. A brief history of human brain mapping. Trends Neurosci. 2009 Jan 1;32(2):118–26.
18. McLoughlin G, Makeig S, Tsuang MT. In search of biomarkers in psychiatry: EEG-based measures of brain function. Am J Med Genet. 2013 Nov 25;165(2):111–21.
19. da Silva FL. EEG and MEG: Relevance to Neuroscience. Neuron. Elsevier Inc; 2013 Dec 4;80(5):1112–28.

20. Hansen P, Kringelbach M, Salmelin R, editors. MEG: An Introduction to Methods. 1st ed. Oxford University Press, USA; 2010. 1 p. 35.
21. Koike S. Near-infrared spectroscopy in schizophrenia: a possible biomarker for predicting clinical outcome and treatment response. 2013 Nov 12;:1–12.
22. Owen-Reece H, Smith M, Elwell CE, Goldstone JC. Near infrared spectroscopy. Br J Anaesth. 1999 Mar;82(3):418–26.
23. Wessa M, Houenou J, Paillère-Martinot M-L, Berthoz S, Artiges E, Leboyer M, et al. Fronto-striatal overactivation in euthymic bipolar patients during an emotional go/nogo task. Am J Psychiatry. 2007 Apr 1;164(4):638–46.
24. Ben Amor L. 1H-Magnetic resonance spectroscopy study of stimulant medication effect on brain metabolites in French Canadian children with attention deficit hyperactivity disorder. NDT. 2014 Jan;:47.
25. Gujar SK, Maheshwari S, Björkman-Burtscher I, Sundgren PC. Magnetic resonance spectroscopy. J Neuroophthalmol. 2005 Sep;25(3):217–26.
26. Maguire EA, Gadian DG, Johnsrude IS, Good CD, Ashburner J, Frackowiak RS, et al. Navigation-related structural change in the hippocampi of taxi drivers. Proc Natl Acad Sci USA. 2000 Apr 11;97(8):4398–403.
27. Ashburner J, Friston KJ. Voxel-Based Morphometry—The Methods. NeuroImage. 2000 Jun;11(6):805–21.
28. Ashburner J. SPM: A history. NeuroImage. 2012 Aug 15;62(2):791–800.
29. Shaw P, Eckstrand K, Lerch JP, Greenstein D, Clasen L. Attention-deficit/hyperactivity disorder is characterized by a dealy in cortical maturation. PNAS. 2007 Nov 27;:1–6.
30. Fischl B, van der Kouwe A, Destrieux C, Halgren E, Ségonne F, Salat DH, et al. Automatically parcellating the human cerebral cortex. Cereb Cortex. 2004 Jan;14(1):11–22.
31. Fischl B. FreeSurfer. NeuroImage. Elsevier B.V; 2012 Jan 9;:1–15.
32. Jenkinson M, Beckmann CF, Behrens TEJ, Woolrich MW, Smith SM. FSL. NeuroImage. 2012 Aug 15;62(2):782–90.
33. Cox RW. AFNI: software for analysis and visualization of functional magnetic resonance neuroimages. Comput Biomed Res. 1996 Jun;29(3):162–73.
34. Larobina M, Murino L. Medical image file formats. J Digit Imaging. 2014 Apr;27(2):200–6.
35. Stephan KE. On the role of general system theory for functional neuroimaging. Journal of Anatomy.2004 Dec;205(6):443–70.
36. Friston KJ, Buechel C, Fink GR, Morris J, Rolls E, Dolan RJ. Psychophysiological and modulatory interactions in neuroimaging. NeuroImage. 1997 Oct;6(3):218–29.
37. Heinz A, Braus DF, Smolka MN, Wrase J, Puls I, Hermann D, et al. Amygdala-prefrontal coupling depends on a genetic variation of the serotonin transporter. Nat Neurosci. 2005 Jan;8(1):20–1.
38. Schmack K, Gòmez-Carrillo de Castro A, Rothkirch M, Sekutowicz M, Rössler H, Haynes J-D, et al. Delusions and the role of beliefs in perceptual inference. J Neurosci. 2013 Aug 21;33(34):13701–

12.
39. Roebroeck A, Formisano E, Goebel R. Mapping directed influence over the brain using Granger causality and fMRI. NeuroImage. 2005 Mar;25(1):230–42.
40. Friston KJ, Harrison L, Penny W. Dynamic causal modelling. NeuroImage. 2003 Aug;19(4):1273–302.
41. Deserno L, Sterzer P, Wustenberg T, Heinz A, Schlagenhauf F. Reduced prefrontal-parietal effective connectivity and working memory deficits in schizophrenia. J Neurosci. 2012 Jan 4;32(1):12–20.
42. Ashburner J. SPM: A history. NeuroImage. Elsevier Inc; 2011 Nov 3;:1–10.
43. Raichle ME, Snyder AZ. A default mode of brain function: a brief history of an evolving idea. NeuroImage. 2007 Oct 1;37(4):1083–90; discussion1097–9.
44. Raichle ME, MacLeod AM, Snyder AZ, Powers WJ, Gusnard DA, Shulman GL. A default mode of brain function. Proc Natl Acad Sci USA. 2001 Jan 16;98(2):676–82.
45. Favre P, Baciu M, Pichat C, Bougerol T, Polosan M. fMRI evidence for abnormal resting-state functional connectivity in euthymic bipolar patients. J Affect Disord. 2014 Aug;165:182–9.
46. Teng S, Lu C-F, Wang P-S, Li C-T, Tu P-C, Hung C-I, et al. Altered resting-state functional connectivity of striatal-thalamic circuit in bipolar disorder. PLoS ONE. 2014;9(5):e96422.
47. Vargas C, Lopez-Jaramillo C, Vieta E. A systematic literature review of resting state network--functional MRI in bipolar disorder. J Affect Disord. 2013 Sep 25;150(3):727–35.
48. Kerestes R, Davey CG, Stephanou K, Whittle S, Harrison BJ. Functional brain imaging studies of youth depression: A systematic review. Elsevier. 2013 Dec 11;4:209–31.
49. Schilbach L, Müller VI, Hoffstaedter F, Clos M, Goya-Maldonado R, Gruber O, et al. Meta-analytically informed network analysis of resting state FMRI reveals hyperconnectivity in an introspective socio-affective network in depression. PLoS ONE. 2014;9(4):e94973.
50. Ramasubbu R, Konduru N, Cortese F, Bray S, Gaxiola-Valdez I, Goodyear B. Reduced intrinsic connectivity of amygdala in adults with major depressive disorder. Front Psychiatry. 2014;5:17.
51. Cocchi L, Harding IH, Lord A, Pantelis C, Yücel M, Zalesky A. Disruption of structure-function coupling in the schizophrenia connectome. Elsevier. 2014;4:779–87.
52. Tomasi D, Volkow ND. Mapping Small-World Properties through Development in the Human Brain: Disruption in Schizophrenia. PLoS ONE. 2014;9(4):e96176.
53. Yang GJ, Murray JD, Repovs G, Cole MW, Savić A, Glasser MF, et al. Altered global brain signal in schizophrenia. Proc Natl Acad Sci USA. 2014 May 20;111(20):7438–43.
54. Castellanos FX, Margulies DS, Kelly C, Uddin LQ, Ghaffari M, Kirsch A, et al. Cingulate-precuneus interactions: a new locus of dysfunction in adult attention-deficit/hyperactivity disorder. Biol Psychiatry. 2008 Feb 1;63(3):332–7.
55. Posner J, Park C, Wang Z. Connecting the Dots: A Review of Resting Connectivity MRI Studies in Attention-Deficit/Hyperactivity Disorder. Neuropsychol Rev. 2014 Feb 5.
56. Cortese S, Kelly C, Chabernaud C, Proal E, Di Martino A, Milham MP, et al. Toward Systems Neuroscience of ADHD: A Meta-Analysis of 55 fMRI Studies. Am J Psychiatry. 2012 Oct

1;169(10):1038–55.
57. Pannekoek JN, Veer IM, van Tol M-J, van der Werff SJA, Demenescu LR, Aleman A, et al. Aberrant limbic and salience network resting-state functional connectivity in panic disorder without comorbidity. J Affect Disord. 2013 Feb 15;145(1):29–35.
58. Lai C-H, Wu Y-T. Decreased regional homogeneity in lingual gyrus, increased regional homogeneity in cuneus and correlations with panic symptom severity of first-episode, medication-naïve and late-onset panic disorder patients. Psychiatry Res. 2013 Feb 28;211(2):127–31.
59. Shin Y-W, Dzemidzic M, Jo HJ, Long Z, Medlock C, Dydak U, et al. Increased resting-state functional connectivity between the anterior cingulate cortex and the precuneus in panic disorder: resting-state connectivity in panic disorder. J Affect Disord. 2013 Sep 25;150(3):1091–5.
60. Arnold Anteraper S, Triantafyllou C, Sawyer AT, Hofmann SG, Gabrieli JD, Whitfield-Gabrieli S. Hyper-connectivity of subcortical resting-state networks in social anxiety disorder. Brain Connectivity. 2014 Mar;4(2):81–90.
61. Dodhia S, Hosanagar A, Fitzgerald DA, Labuschagne I, Wood AG, Nathan PJ, et al. Modulation of Resting-State Amygdala-Frontal Functional Connectivity by Oxytocin in Generalized Social Anxiety Disorder. Neuropsychopharmacology. 2014 Mar 5.
62. Liu F, Guo W, Fouche J-P, Wang Y, Wang W, Ding J, et al. Multivariate classification of social anxiety disorder using whole brain functional connectivity. Brain structure & function. 2013 Sep 27.
63. Pannekoek JN, Veer IM, van Tol M-J, van der Werff SJA, Demenescu LR, Aleman A, et al. Resting-state functional connectivity abnormalities in limbic and salience networks in social anxiety disorder without comorbidity. EurNeuropsychopharmacol. 2013 Mar;23(3):186–95.
64. Hahn A, Stein P, Windischberger C, Weissenbacher A, Spindelegger C, Moser E, et al. Reduced resting-state functional connectivity between amygdala and orbitofrontal cortex in social anxiety disorder. NeuroImage. Elsevier Inc. Elsevier Inc; 2011 Jun 1;56(3):881–9.
65. Chen AC, Etkin A. Hippocampal network connectivity and activation differentiates post-traumatic stress disorder from generalized anxiety disorder. Neuropsychopharmacology. 2013 Sep;38(10):1889–98.
66. Brown VM, LaBar KS, Haswell CC, Gold AL, Mid-Atlantic MIRECC Workgroup, McCarthy G, et al. Altered resting-state functional connectivity of basolateral and centromedial amygdala complexes in posttraumatic stress disorder. Neuropsychopharmacology. 2014 Jan;39(2):351–9.
67. Roy AK, Fudge JL, Kelly C, Perry JSA, Daniele T, Carlisi C, et al. Intrinsic functional connectivity of amygdala-based networks in adolescent generalized anxiety disorder. J Am Acad Child Adolesc Psychiatry. 2013 Mar;52(3):290–2.
68. Andreescu C, Sheu LK, Tudorascu D, Walker S, Aizenstein H. The ages of anxiety-differences across the lifespan in the default mode network functional connectivity in generalized anxiety disorder. Int J Geriatr Psychiatry. 2014 Jul;29(7):704–12.
69. Stern ER, Fitzgerald KD, Welsh RC, Abelson JL, Taylor SF. Resting-State Functional Connectivity between Fronto-Parietal and Default Mode Networks in Obsessive-Compulsive Disorder. Soriano-Mas C, editor. PLoS ONE. 2012 May 3;7(5):e36356.
70. Posner J, Marsh R, Maia TV, Peterson BS, Gruber A, Simpson HB. Reduced functional connectivity within the limbic cortico-striato-thalamo-cortical loop in unmedicated adults with obsessive-

compulsive disorder. Hum Brain Mapp. 2013 Sep 30;35(6):2852–60.
71. Di Martino A, Yan C-G, Li Q, Denio E, Castellanos FX, Alaerts K, et al. The autism brain imaging data exchange: towards a large-scale evaluation of the intrinsic brain architecture in autism. Molecular Psychiatry. 2014 Jun;19(6):659–67.
72. Washington SD, Gordon EM, Brar J, Warburton S, Sawyer AT, Wolfe A, et al. Dysmaturation of the default mode network in autism. Hum Brain Mapp. 2014 Apr;35(4):1284–96.
73. Wolf RC, Sambataro F, Vasic N, Schmid M, Thomann PA, Bienentreu SD, et al. Aberrant connectivity of resting-state networks in borderline personality disorder. J Psychiatry Neurosci. 2011 Nov;36(6):402–11.
74. Doll A, Sorg C, Manoliu A, Wöller A, Meng C, Förstl H, et al. Shifted intrinsic connectivity of central executive and salience network in borderline personality disorder. Front Hum Neurosci. 2013;7:727.
75. Cowdrey FA, Filippini N, Park RJ, Smith SM, McCabe C. Increased resting state functional connectivity in the default mode network in recovered anorexia nervosa. Hum Brain Mapp. 2014 Feb;35(2):483–91.
76. Favaro A, Clementi M, Manara R, Bosello R, Forzan M, Bruson A, et al. Catechol-O-methyltransferase genotype modifies executive functioning and prefrontal functional connectivity in women with anorexia nervosa. J Psychiatry Neurosci. 2013 Jul;38(4):241–8.
77. Favaro A, Santonastaso P, Manara R, Bosello R, Bommarito G, Tenconi E, et al. Disruption of visuospatial and somatosensory functional connectivity in anorexia nervosa. Biol Psychiatry. 2012 Nov 15;72(10):864–70.
78. Amianto F, D'Agata F, Lavagnino L, Caroppo P, Abbate-Daga G, Righi D, et al. Intrinsic connectivity networks within cerebellum and beyond in eating disorders. Cerebellum. 2013 Oct;12(5):623–31.
79. Lee S, Ran Kim K, Ku J, Lee J-H, Namkoong K, Jung Y-C. Resting-state synchrony between anterior cingulate cortex and precuneus relates to body shape concern in anorexia nervosa and bulimia nervosa. Psychiatry Res. 2014 Jan 30;221(1):43–8.
80. Müller-Oehring EM, Jung Y-C, Pfefferbaum A, Sullivan EV, Schulte T. The Resting Brain of Alcoholics.Cereb Cortex. 2014 Jun 16.
81. Spagnolli F, Cerini R, Cardobi N, Barillari M, Manganotti P, Storti S, et al. Brain modifications after acute alcohol consumption analyzed by resting state fMRI. Magn Reson Imaging. 2013 Oct;31(8):1325–30.
82. Ding X, Lee S-W. Cocaine addiction related reproducible brain regions of abnormal default-mode network functional connectivity: a group ICA study with different model orders. NeurosciLett. 2013Aug 26;548:110–4.
83. Konova AB, Moeller SJ, Tomasi D, Volkow ND, Goldstein RZ. Effects of methylphenidate on resting-state functional connectivity of the mesocorticolimbic dopamine pathways in cocaine addiction. JAMA Psychiatry. 2013 Aug;70(8):857–68.
84. Wisner KM, Patzelt EH, Lim KO, MacDonald AW. An intrinsic connectivity network approach to insula-derived dysfunctions among cocaine users. Am J Drug Alcohol Abuse. 2013 Nov;39(6):403–13.

85. Cisler JM, Elton A, Kennedy AP, Young J, Smitherman S, James GA, et al. Psychiatry Research: Neuroimaging. Psychiatry Research: Neuroimaging. Elsevier; 2013 Jul 30;213(1):39–46.
86. Kelly C, Zuo X-N, Gotimer K, Cox CL, Lynch L, Brock D, et al. Reduced interhemispheric resting state functional connectivity in cocaine addiction. Biol Psychiatry. 2011 Apr 1;69(7):684–92.
87. Pujol J, Blanco-Hinojo L, Batalla A, López-Solà M, Harrison BJ, Soriano-Mas C, et al. Functional connectivity alterations in brain networks relevant to self-awareness in chronic cannabis users. J Psychiatr Res. 2014 Apr;51:68–78.
88. Orr C, Morioka R, Behan B, Datwani S, Doucet M, Ivanovic J, et al. Altered resting-state connectivityin adolescent cannabis users. Am J Drug Alcohol Abuse. 2013 Nov;39(6):372–81.
89. Qiu Y-W, Han L-J, Lv X-F, Jiang G-H, Tian J-Z, Zhuo F-Z, et al. Regional homogeneity changes in heroin-dependent individuals: resting-state functional MR imaging study. Radiology. 2011 Nov;261(2):551–9.
90. Wang Y, Zhu J, Li Q, Li W, Wu N, Zheng Y, et al. Altered fronto-striatal and fronto-cerebellar circuits in heroin-dependent individuals: a resting-state FMRI study. PLoS ONE. 2013;8(3):e58098.
91. Jiang G, Wen X, Qiu Y, Zhang R, Wang J, Li M, et al. Disrupted topological organization in whole-brain functional networks of heroin-dependent individuals: a resting-state FMRI study. PLoS ONE. 2013;8(12):e82715.
92. Ding W-N, Sun J-H, Sun Y-W, Zhou Y, Li L, Xu J-R, et al. Altered Default Network Resting-State Functional Connectivity in Adolescents with Internet Gaming Addiction. Hampson M, editor. PLoS ONE. 2013 Mar 26;8(3):e59902.
93. Dong G, Huang J, Du X. Alterations in regional homogeneity of resting-state brain activity in internet gaming addicts. Behavioral and Brain Functions. 2012;8(1):41.
94. Koehler S, Ovadia-Caro S, van der Meer E, Villringer A, Heinz A, Romanczuk-Seiferth N, et al. Increased functional connectivity between prefrontal cortex and reward system in pathological gambling. PLoS ONE. 2013;8(12):e84565.
95. Tschernegg M, Crone JS, Eigenberger T, Schwartenbeck P, Fauth-Bühler M, Lemènager T, et al. Abnormalities of functional brain networks in pathological gambling: a graph-theoretical approach.Front Hum Neurosci. 2013;7:625.
96. Buckner RL, Andrews-Hanna JR, Schacter DL. The brain's default network: anatomy, function, and relevance to disease. 2008 Mar 1;1124:1–38.
97. Mantini D, Gerits A, Nelissen K, Durand JB, Joly O, Simone L, et al. Default Mode of Brain Function in Monkeys. J Neurosci. 2011 Sep 7;31(36):12954–62.
98. Upadhyay J, Baker SJ, Chandran P, Miller L, Lee Y, Marek GJ, et al. Default-mode-like network activation in awake rodents. PLoS ONE. 2011;6(11):e27839.
99. Lu H, Zou Q, Gu H, Raichle ME, Stein EA, Yang Y. Rat brains also have a default mode network. Proc Natl Acad Sci USA. 2012 Mar 6;109(10):3979–84.
100. Zuo X-N, Di Martino A, Kelly C, Shehzad ZE, Gee DG, Klein DF, et al. The oscillating brain: complex and reliable. NeuroImage. 2010 Jan 15;49(2):1432–45.
101. Harrison BJ, Pujol J, López-Solà M, Hernández-Ribas R, Deus J, Ortiz H, et al. Consistency and

functional specialization in the default mode brain network. Proc Natl Acad Sci USA. 2008 Jul 15;105(28):9781–6.
102. Long X-Y, Zuo X-N, Kiviniemi V, Yang Y, Zou Q-H, Zhu C-Z, et al. Default mode network as revealed with multiple methods for resting-state functional MRI analysis. J Neurosci Methods. 2008 Jun 30;171(2):349–55.
103. Damoiseaux JS, Rombouts SARB, Barkhof F, Scheltens P, Stam CJ, Smith SM, et al. Consistent resting-state networks across healthy subjects. Proc Natl Acad Sci USA. 2006 Sep 12;103(37):13848–53.
104. Fox MD, Snyder AZ, Vincent JL, Corbetta M, van Essen DC, Raichle ME. The human brain is intrinsically organized into dynamic, anticorrelated functional networks. Proc Natl Acad Sci USA. 2005 Jul 5;102(27):9673–8.
105. Biomarkers Definitions Working Group. Biomarkers and surrogate endpoints: preferred definitions and conceptual framework. Clin Pharmacol Ther. 2001 Mar;69(3):89–95.
106. Linden DEJ. The challenges and promise of neuroimaging in psychiatry. Neuron. 2012 Jan 12;73(1):8–22.
107. Bansal R, Staib LH, Laine AF, Hao X, Xu D, Liu J, et al. Anatomical Brain Images Alone Can Accurately Diagnose Chronic Neuropsychiatric Illnesses. Zhan W, editor. PLoS ONE. 2012 Dec 7;7(12):e50698.
108. Sun D, van Erp TGM, Thompson PM, Bearden CE, Daley M, Kushan L, et al. Elucidating a Magnetic Resonance Imaging-Based Neuroanatomic Biomarker for Psychosis: Classification Analysis Using Probabilistic Brain Atlas and Machine Learning Algorithms. Biol Psychiatry. 2009 Dec;66(11):1055–60.
109. Hart H, Chantiluke K, Cubillo AI, Smith AB, Simmons A, Brammer MJ, et al. Pattern classification of response inhibition in ADHD: Toward the development of neurobiological markers for ADHD. Hum Brain Mapp. 2014 Jul;35(7):3083–94.
110. Hart H, Marquand AF, Smith A, Cubillo A, Simmons A, Brammer M, et al. Predictive neurofunctionalmarkers of attention-deficit/hyperactivity disorder based on pattern classification of temporal processing. J Am Acad Child Adolesc Psychiatry. 2014 May;53(5):569–578.e1.
111. Cheng W, Ji X, Zhang J, Feng J. Individual classification of ADHD patients by integrating multiscale neuroimaging markers and advanced pattern recognition techniques. Front Syst Neurosci. 2012;6:58.
112. Puls I, Mohr J, Wrase J, Priller J, Behr J, Kitzrow W, et al. Synergistic effects of the dopaminergic andglutamatergic system on hippocampal volume in alcohol-dependent patients. Biological Psychology. 2008 Sep;79(1):126–36.
113. Hahn T, Marquand AF, Plichta MM, Ehlis A-C, Schecklmann MW, Dresler T, et al. A novel approach to probabilistic biomarker-based classification using functional near-infrared spectroscopy. Hum Brain Mapp. 2013 May;34(5):1102–14.
114. Wrase J, Makris N, Braus DF, Mann K, Smolka MN, Kennedy DN, et al. Amygdala volume associated with alcohol abuse relapse and craving. Am J Psychiatry. 2008 Sep;165(9):1179–84.
115. McGrath CL, Kelley ME, Holtzheimer PE, Dunlop BW, Craighead WE, Franco AR, et al. Toward a neuroimaging treatment selection biomarker for major depressive disorder. JAMA Psychiatry. 2013 Aug;70(8):821–9.

116. Miller JM, Hesselgrave N, Ogden RT, Zanderigo F, Oquendo MA, Mann JJ, et al. Brain serotonin 1A receptor binding as a predictor of treatment outcome in major depressive disorder. Biol Psychiatry. 2013 Nov 15;74(10):760–7.
117. Delorenzo C, Delaparte L, Thapa-Chhetry B, Miller JM, Mann JJ, Parsey RV. Prediction of selective serotonin reuptake inhibitor response using diffusion-weighted MRI. Front Psychiatry. 2013;4:5.
118. Hägele C, Schlagenhauf F, Rapp M, Sterzer P, Beck A, Bermpohl F, et al. Dimensional psychiatry: reward dysfunction and depressive mood across psychiatric disorders. Psychopharmacology (Berl). 2014 Jun 29.
119. Button KS, Ioannidis JPA, Mokrysz C, Nosek BA, Flint J, Robinson ESJ, et al. Power failure: why small sample size undermines the reliability of neuroscience. Nat Rev Neurosci. 2013 Apr 10;14(5):365–76.
120. Biswal BB, Mennes M, Zuo X-N, Gohel S, Kelly C, Smith SM, et al. Toward discovery science of human brain function. Proc Natl Acad Sci USA. 2010 Mar 9;107(10):4734–9.
121. Salum GA, Sergeant J, Sonuga-Barke E, Vandekerckhove J, Gadelha A, Pan PM, et al. Specificity of basic information processing and inhibitory control in attention deficit hyperactivity disorder. Psychol Med. 2013 Apr 8;:1–15.
122. HD-200 Consortium. The ADHD-200 Consortium: A Model to Advance the Translational Potential ofNeuroimaging in Clinical Neuroscience. Front SystNeurosci. 2012;6:62.
123. Schumann G, Loth E, Banaschewski T, Barbot A, Barker G, Büchel C, et al. The IMAGEN study: reinforcement-related behaviour in normal brain function and psychopathology. Molecular Psychiatry. 2010 Dec;15(12):1128–39.
124. Nooner KB, Colcombe SJ, Tobe RH, Mennes M, Benedict MM, Moreno AL, et al. The NKI-Rockland Sample: A Model for Accelerating the Pace of Discovery Science in Psychiatry. Front Neurosci. 2012;6:152.
125. Craddock RC, Jbabdi S, Yan C-G, Vogelstein JT, Castellanos FX, Di Martino A, et al. Imaging human connectomes at the macroscale. Nat Meth. 2013 May 30;10(6):524–39.
126. Hampton T. European-led project strives to simulate the human brain. JAMA : the journal of the American Medical Association. 2014 Apr;:1598–600.
127. Underwood E. Neuroscience. BRAIN project meets physics. Science (New York, NY). 2014 May 30;:954–5.

Image 01Figure 34.2 – Diffusion Tensor Imaging (DTI)
Image 01Figure 34.2. Tractography image showing the morphology of axonal bundles in the white matter. Blue represent s tracts going in the rostral-caudal direction, Red latero-lateral direction and Green antero-posterior direction. Other colors are a mixture of those directions.

Image 34.302 - Single Positron Emission Computerized Tomography (SPECT)
Image 34.32. SPECT images of 4 subjects showing the decreasing binding of 99mTc-TRODAT-1 in bilateral putamen comparing a healthy subject (A) with 3 others with different stages of Parkinson's Disease.

Image Figure 34.403 - Positron Emission Tomography (PET)
Image 3Figure 34.4. Comparison of (A) 18F-spiperone (a D2-like antagonist) PET image from 1987 and a 18F-FPCIT PET image from 2012, showing the increased resolution and definition between the caudate nuclei and putamen in B compared to A.
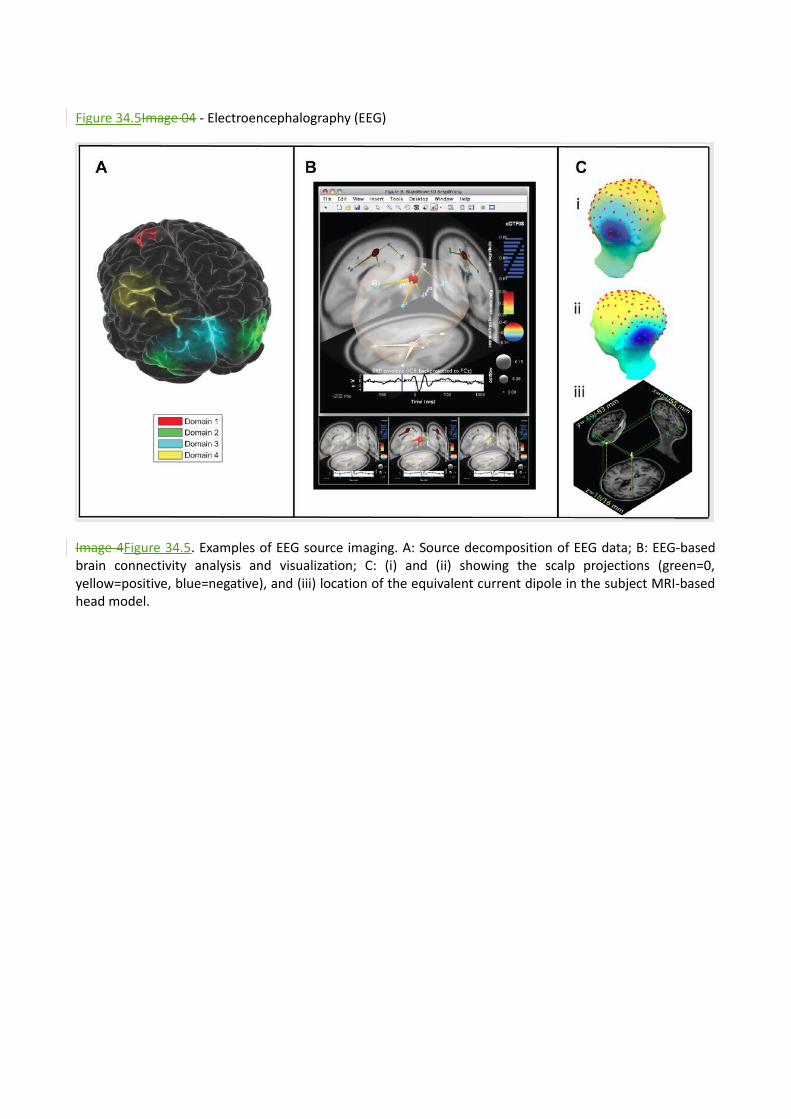
Figure 34.5Image 04 - Electroencephalography (EEG)
Image 4Figure 34.5. Examples of EEG source imaging. A: Source decomposition of EEG data; B: EEG-basedbrain connectivity analysis and visualization; C: (i) and (ii) showing the scalp projections (green=0,yellow=positive, blue=negative), and (iii) location of the equivalent current dipole in the subject MRI-basedhead model.

Image 05Figure 34.6 - Magnetoencephalography (MEG)
Figure 34.6Image 5. Image 5. Commercial MEG systems in (a), (c), and (d). (b) shows the placement of each magnetometer over the scalp.

Image 06Figure 34.7 - Near Infrared Spectroscopic Imaging (NIRSI)
Image 6.Figure 34.7 (A) Illustration showing the near-infrared light being emitted from a source probe ontothe human scalp, passing and being scattered through the brain tissue, which will be detected by adetector probe; (B) shows a commercial NIRS equipment; (C) shows the disposition of the sourceprobes, detector probes and measurement points (channels); and (D) shows the NIRS helmet inplace over the scalp of the subject.

Image 07Figure 34.8 - Functional Magnetic Resonance Imaging (fMRI)
Image 7. Image 7.Figure 34.8 Example of a fMRI study results display showing the areas of increased activation for 17 Euthymic bipolar patients relative to healthy comparison subjects submitted to emotional and nonemotional tasks.

Image 08Figure 34.9 - Magnetic Resonance Spectroscopy (MRS)
Figure 34.9 Image 8. Example of a MRS study results display showing the peaks of Glx, Cho, Cr, Glu and NAA from a previously selected area of the brain.

Image 09Figure 34.10 - Voxel-based Morphometry (VBM)
Image 9.Figure 34.10 Example of VBM results display. (a) shows a sagittal section of an MRI scan with the hippocampus indicates by the red box. (b) shows the group results superimposed to a MRI image.

Image 10Figure 34.11 - Surface-based Morphometry (SBM)
Image 10Figure 34.11. Example of SBM study display of results. This image shows the regions where the ADHD group had delayed cortical maturation.

Image 11Figure 34.12 - Default Mode Network (DMN)
Image 11.Figure 34.12 Default Mode Network regions (in green-blue) shown anticorrelated with regions involved in attention and working memory (in yellow-red).