2015 SMF Crop Team Final Presentation
128
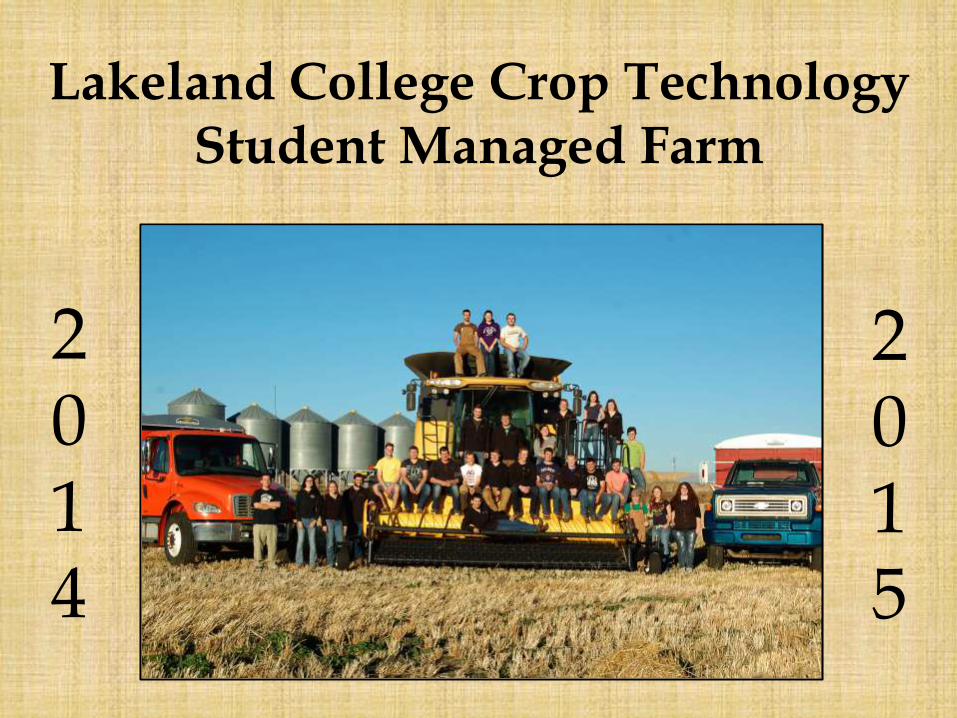
2 0 1 5 2 0 1 4 Lakeland College Crop Technology Student Managed Farm
-
Upload
lakeland-college -
Category
Education
-
view
213 -
download
0
Transcript of 2015 SMF Crop Team Final Presentation
2015
2014
Lakeland College Crop TechnologyStudent Managed Farm

General Manager & Assistant Manager

General Manager
Responsibilities:
Represent the Student Managed Farm
Chair meetings
Overseeing, managing and participating in day to day tasks
Help each team achieve specific goals
Assistant General Manager
Responsibilities:
Take minutes from meetings
Organize and record timesheets
Total harvest hours – 742 hours
Total SMF Hours as of today –1570
Fill in for General Manager when absent
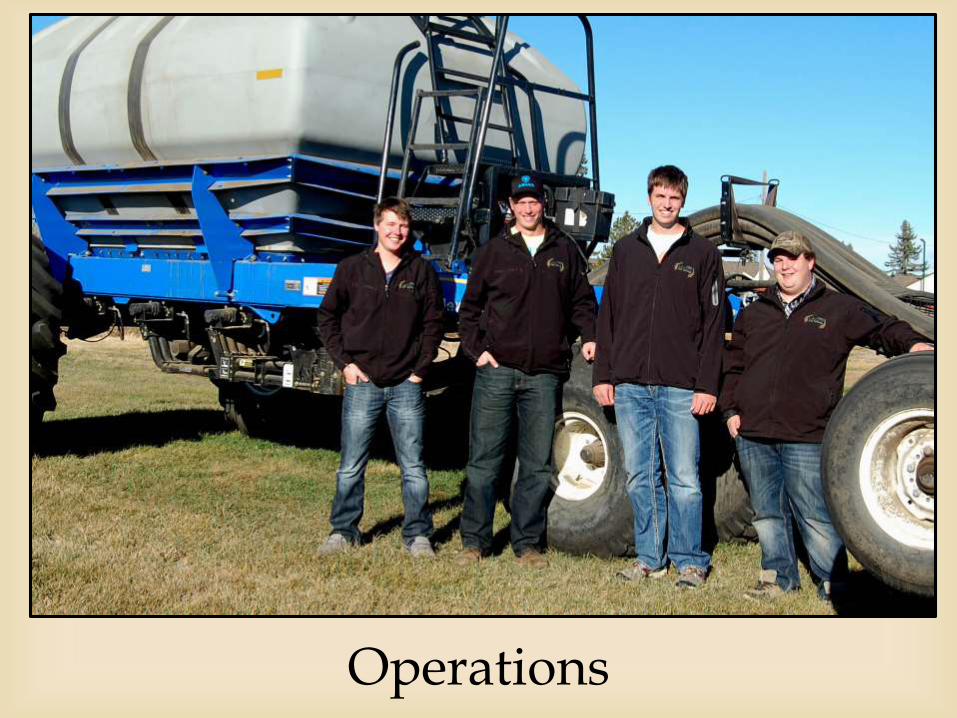
Operations

Bin plan
Manage class groups
Make harvest decisions
Organize post-harvest activities
Organize grain movement
Roles and Responsibilities
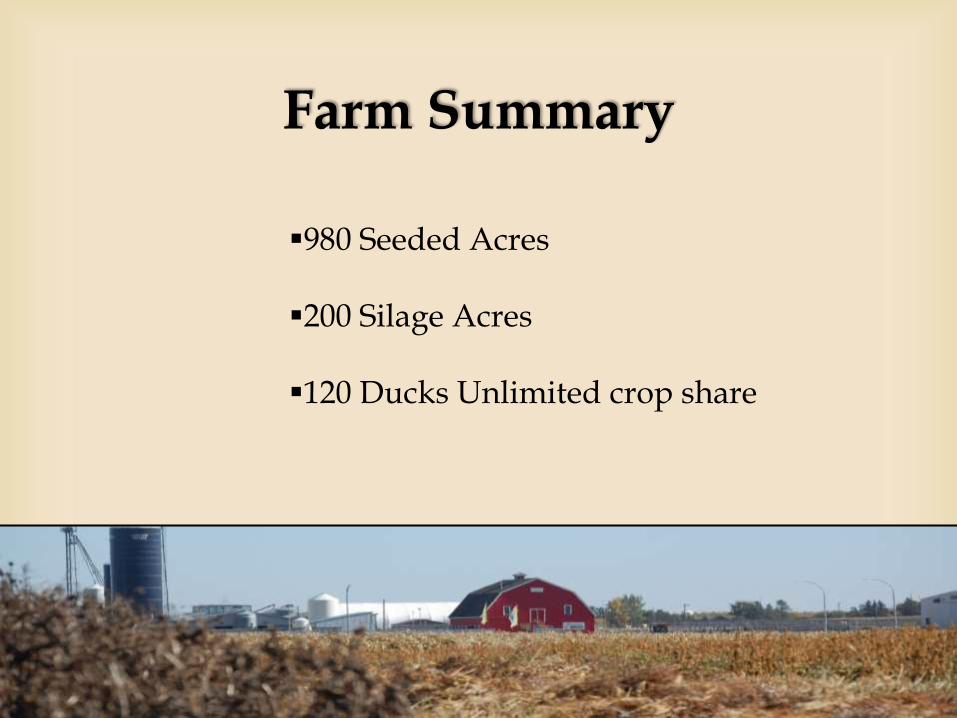
Farm Summary
980 Seeded Acres
200 Silage Acres
120 Ducks Unlimited crop share
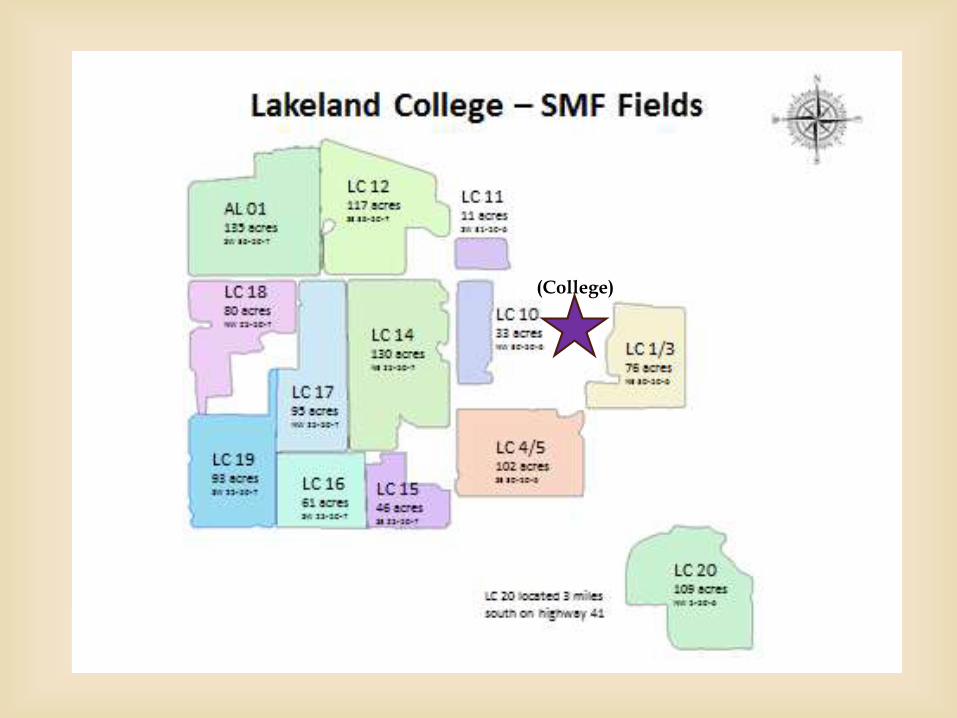
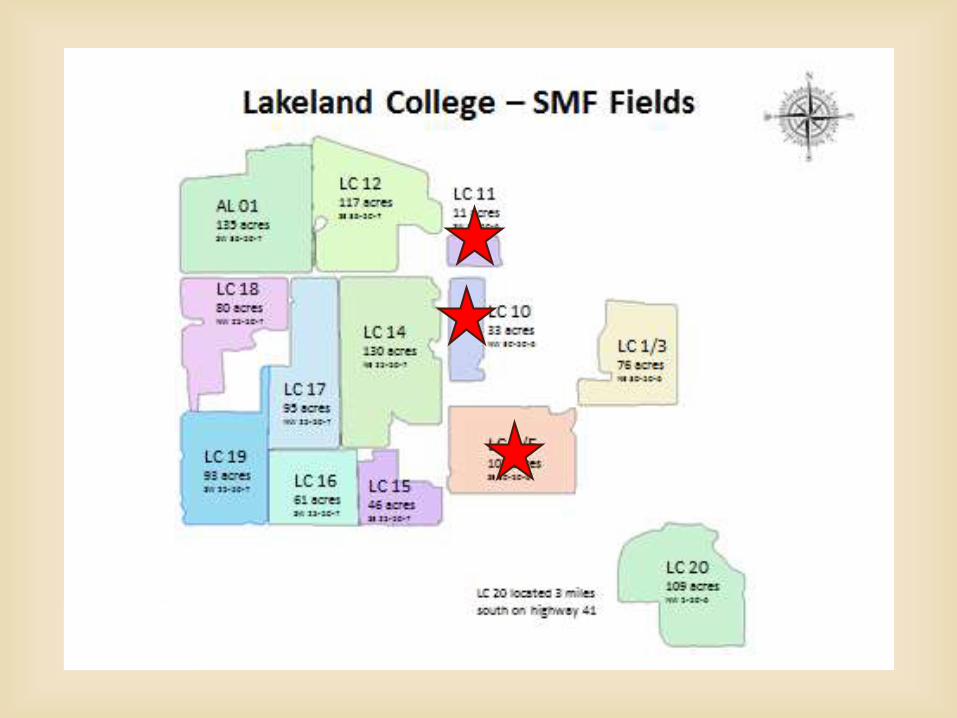
(College)
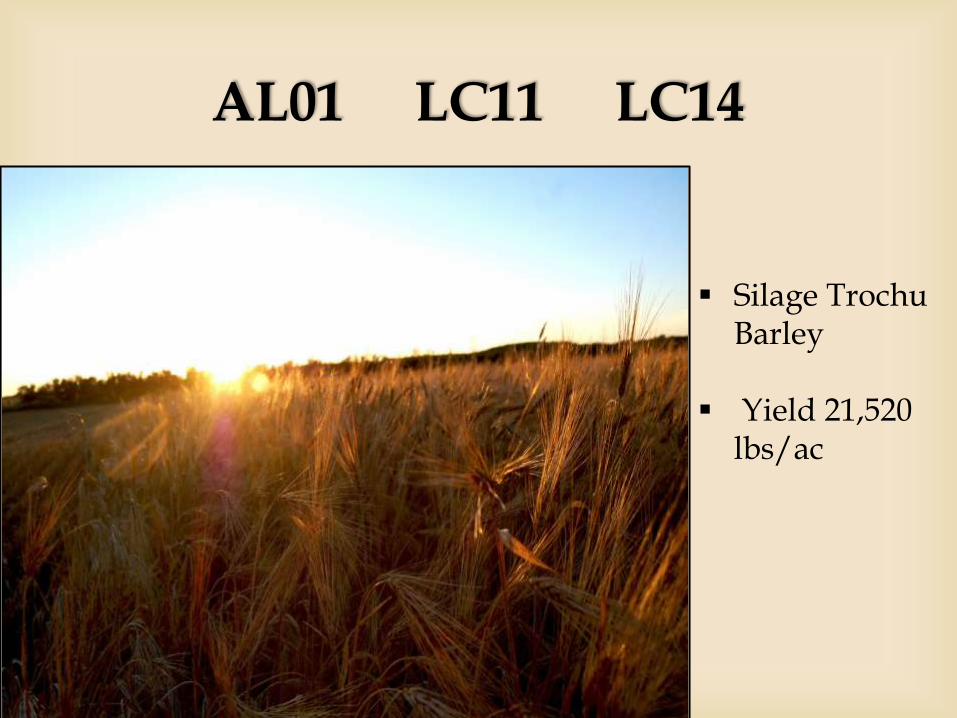
AL01 LC11 LC14
Silage TrochuBarley
Yield 21,520 lbs/ac
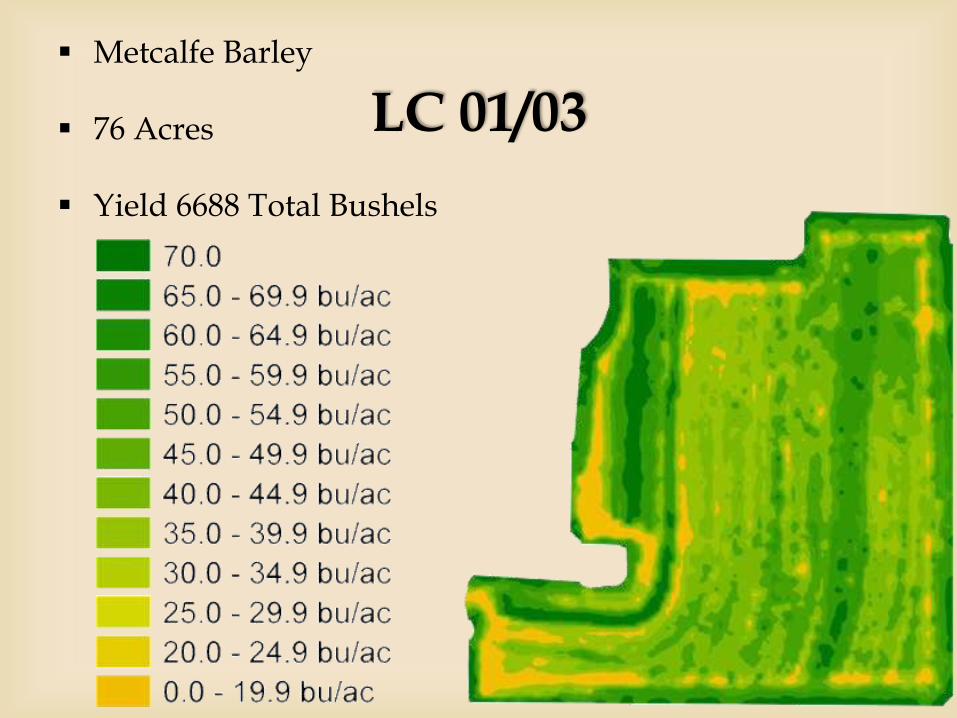
LC 01/03 Metcalfe Barley
76 Acres
Yield 6688 Total Bushels
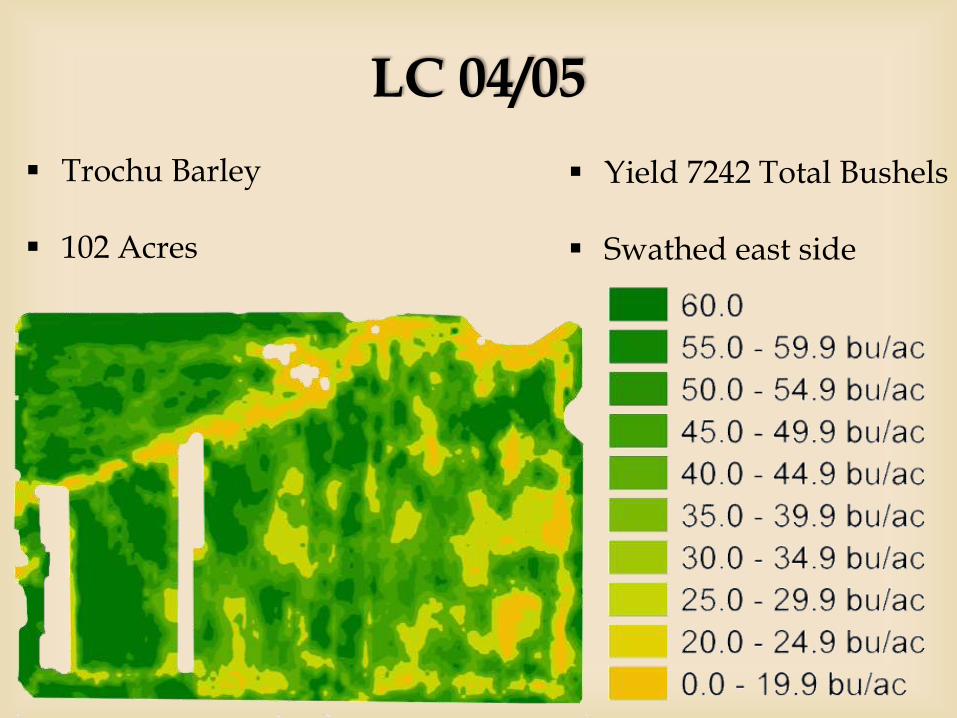
LC 04/05
Trochu Barley
102 Acres
Yield 7242 Total Bushels
Swathed east side
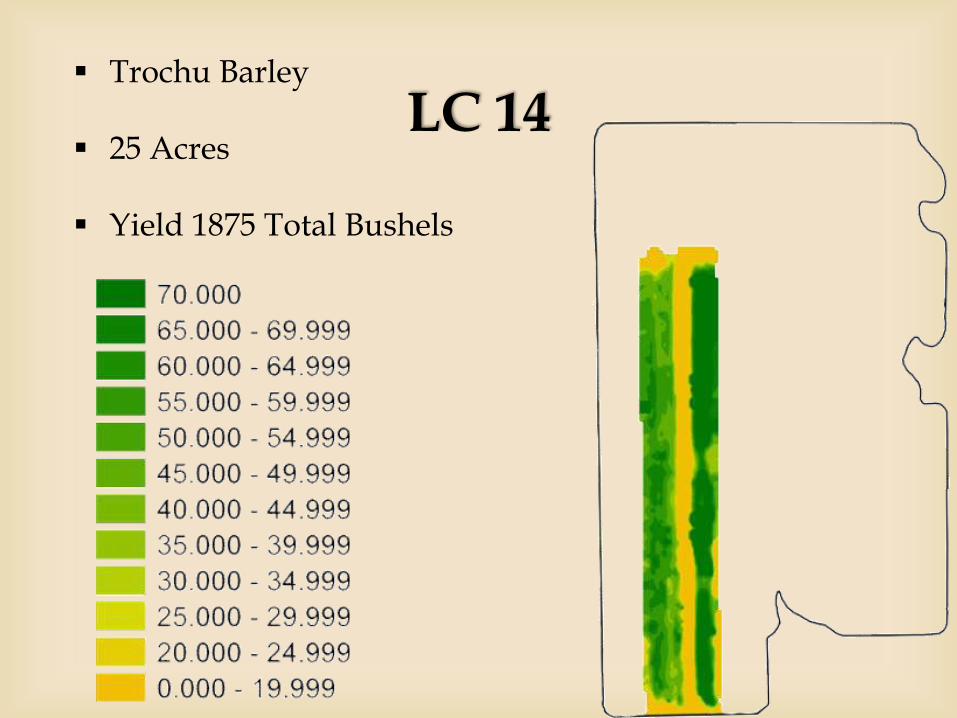
LC 14 Trochu Barley
25 Acres
Yield 1875 Total Bushels
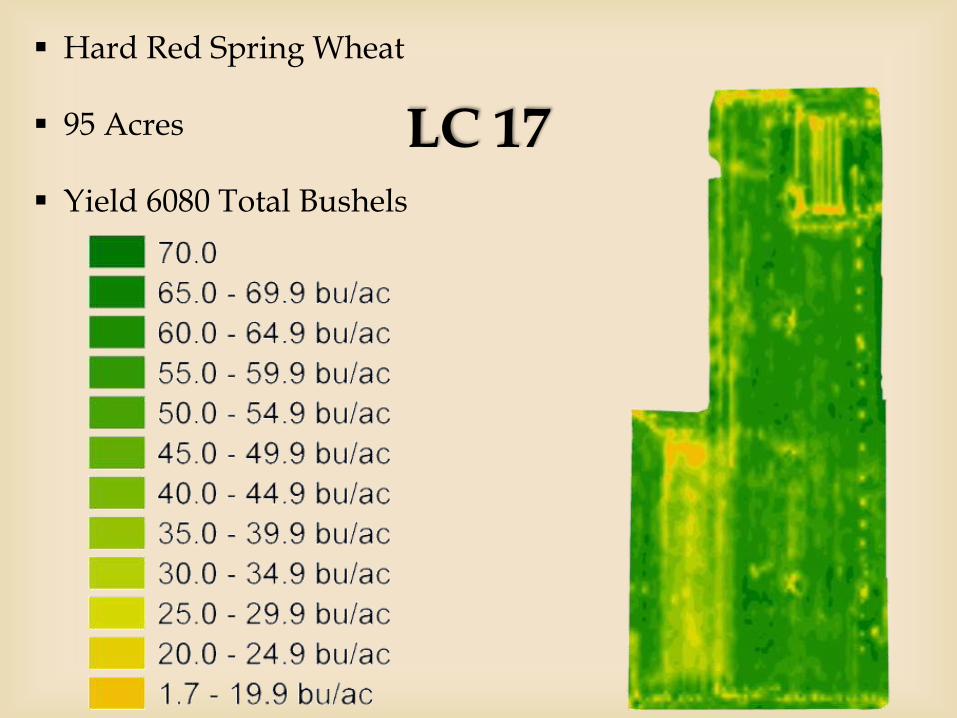
LC 17
Hard Red Spring Wheat
95 Acres
Yield 6080 Total Bushels
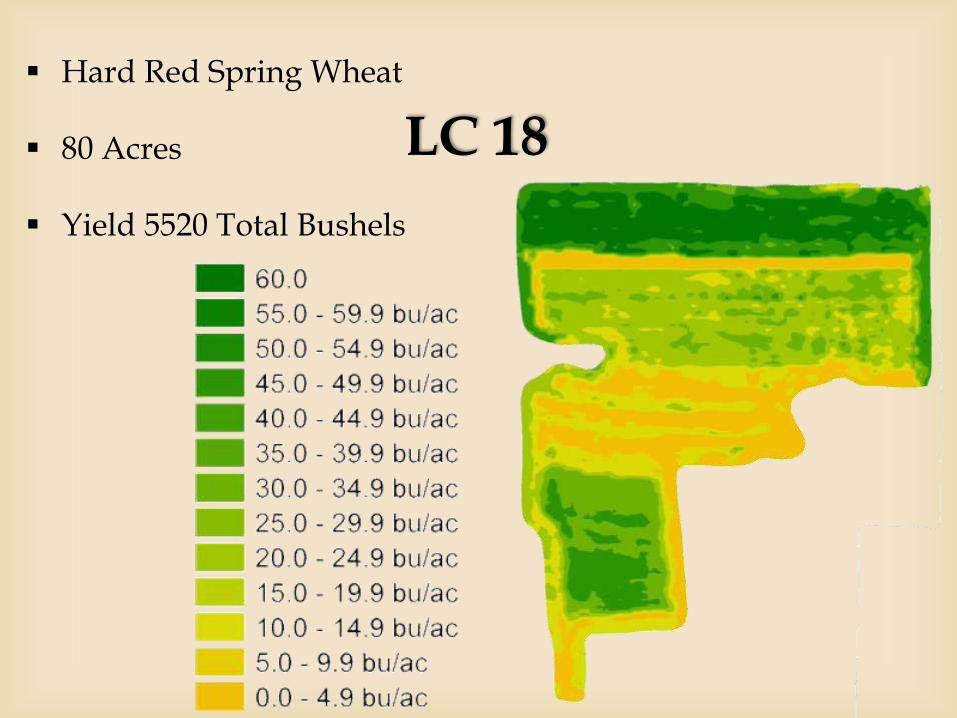
LC 18
Hard Red Spring Wheat
80 Acres
Yield 5520 Total Bushels

LC 20 Hard Red Spring Wheat
109 Acres
Yield 6104 Total Bushels

LC 19 Canola L130
93 Acres
Yield 4371 Total Bushels
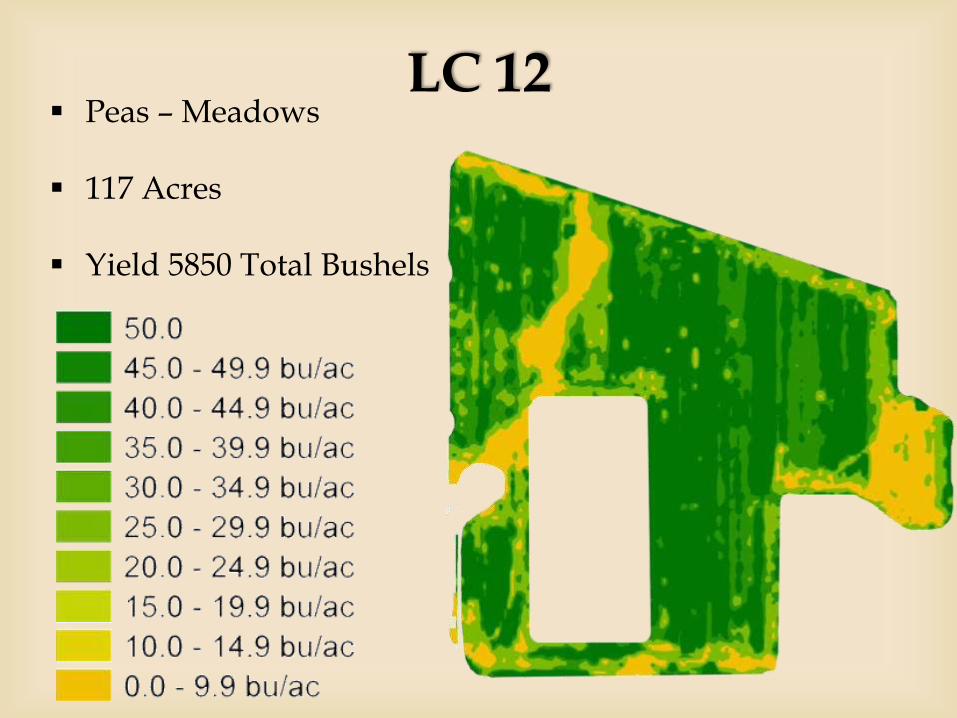
LC 12 Peas – Meadows
117 Acres
Yield 5850 Total Bushels
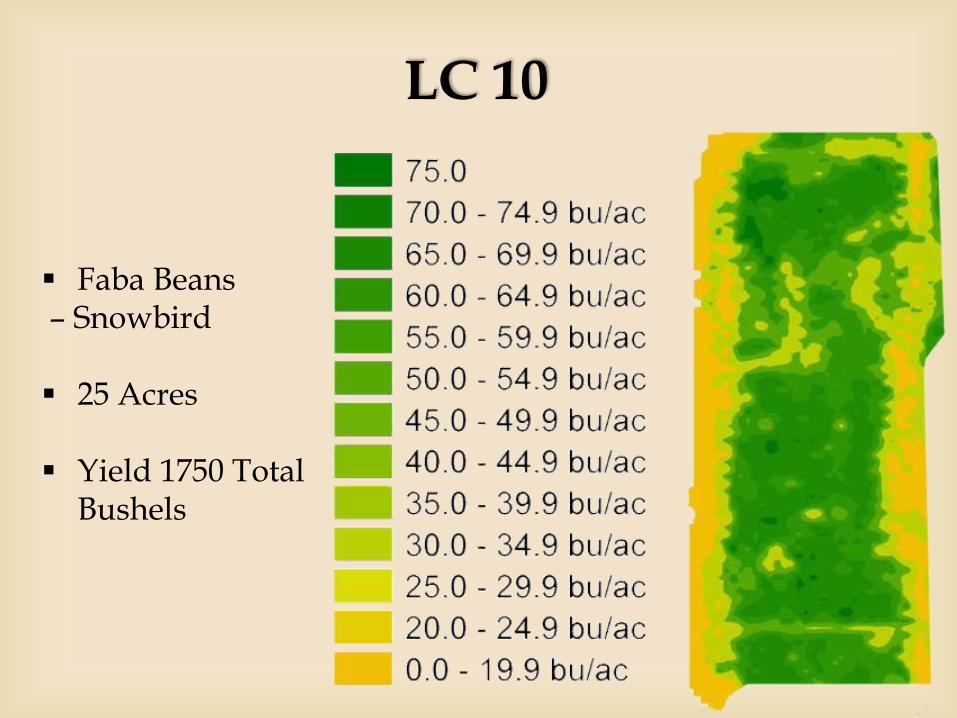
LC 10
Faba Beans– Snowbird
25 Acres
Yield 1750 Total Bushels
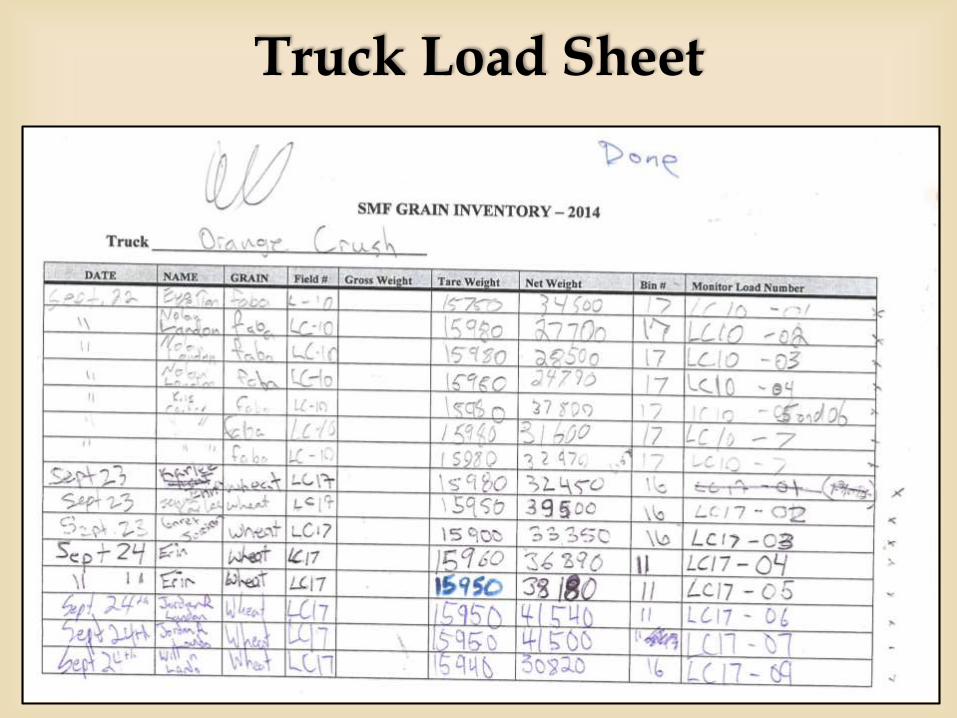
Truck Load Sheet
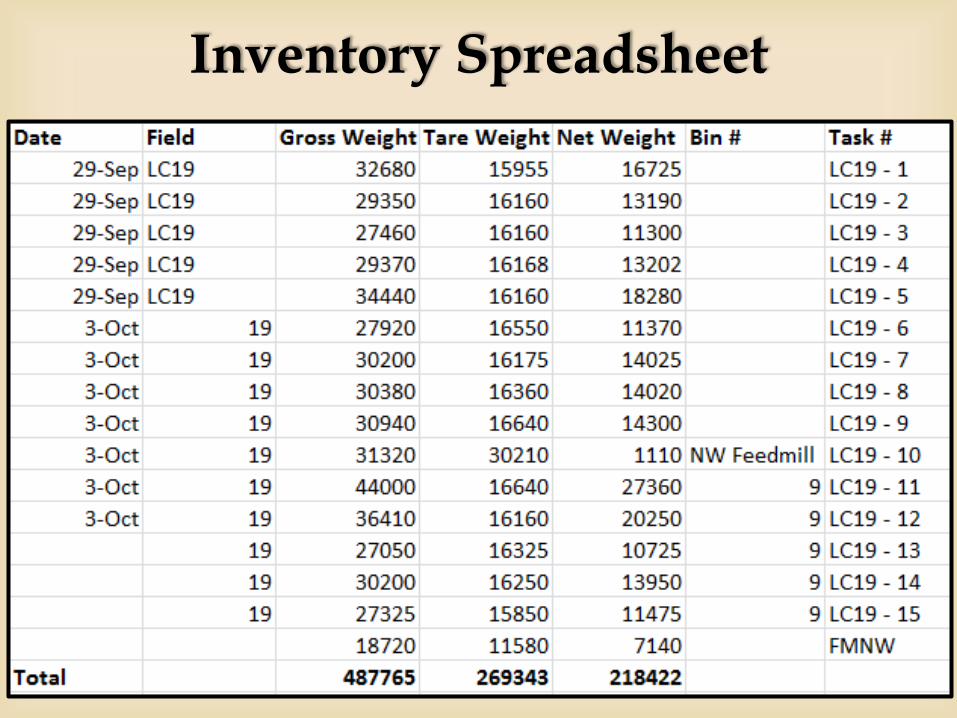
Inventory Spreadsheet
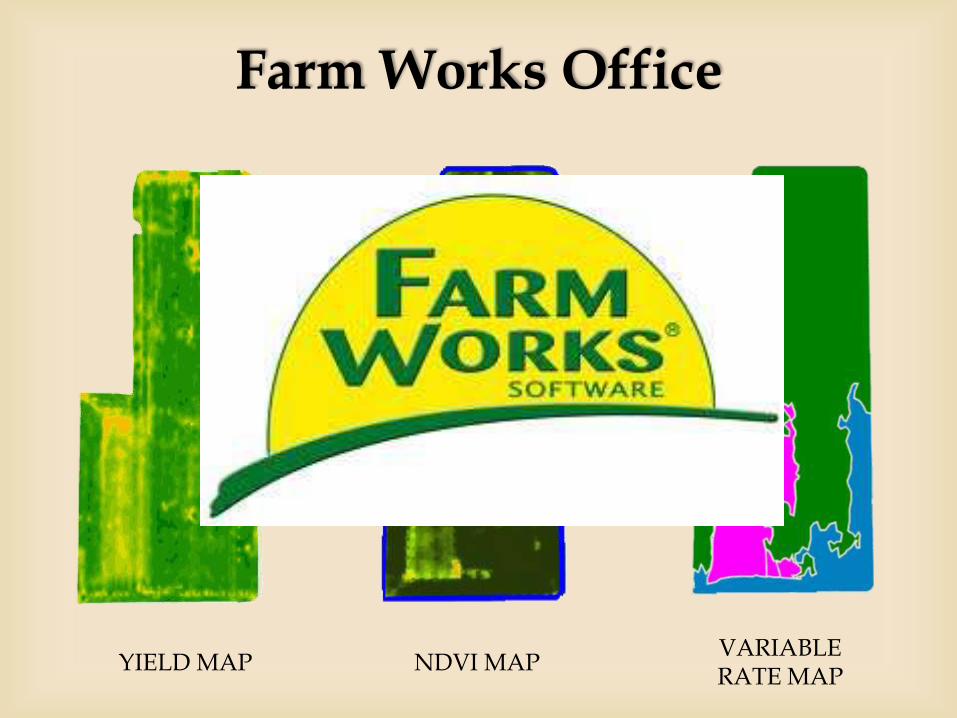
Farm Works Office
NDVI MAPYIELD MAPVARIABLE RATE MAP
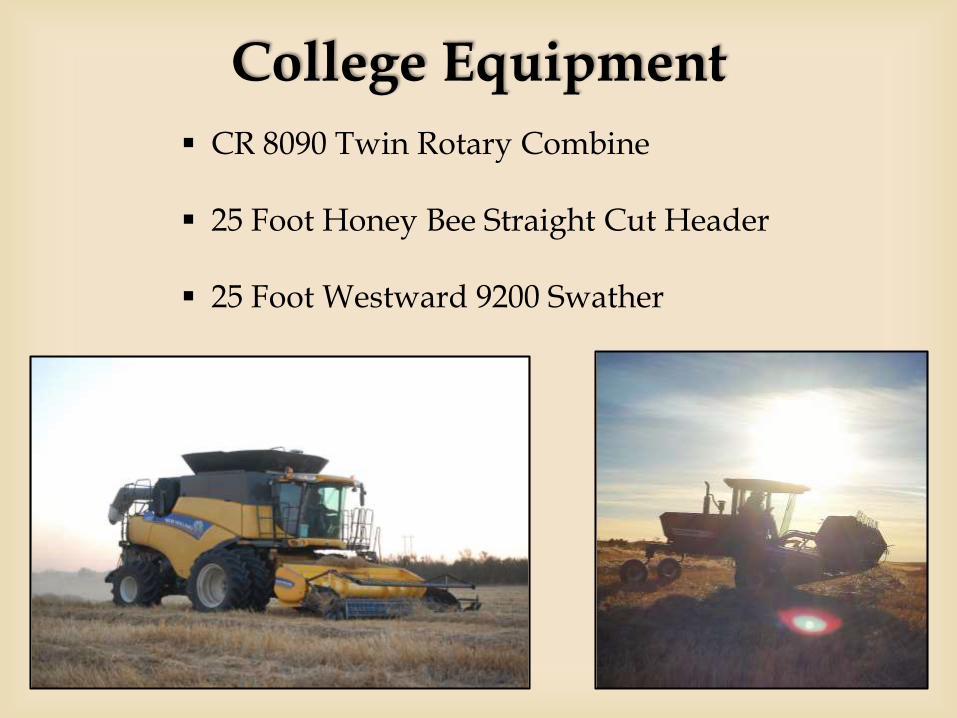
College Equipment
CR 8090 Twin Rotary Combine
25 Foot Honey Bee Straight Cut Header
25 Foot Westward 9200 Swather
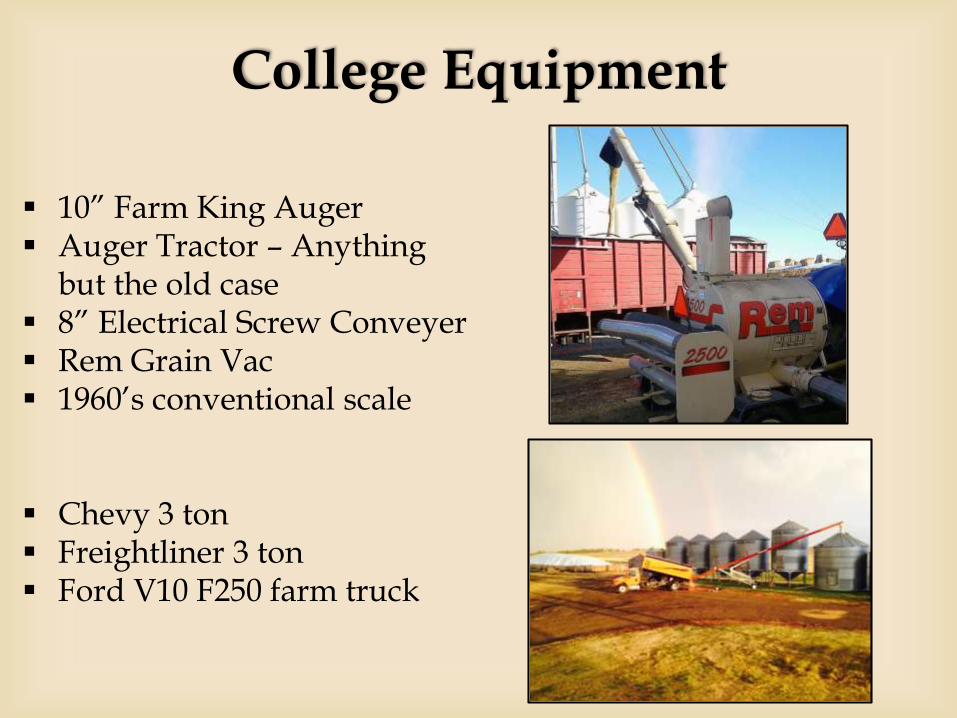
College Equipment
10” Farm King Auger Auger Tractor – Anything
but the old case 8” Electrical Screw Conveyer Rem Grain Vac 1960’s conventional scale
Chevy 3 ton Freightliner 3 ton Ford V10 F250 farm truck
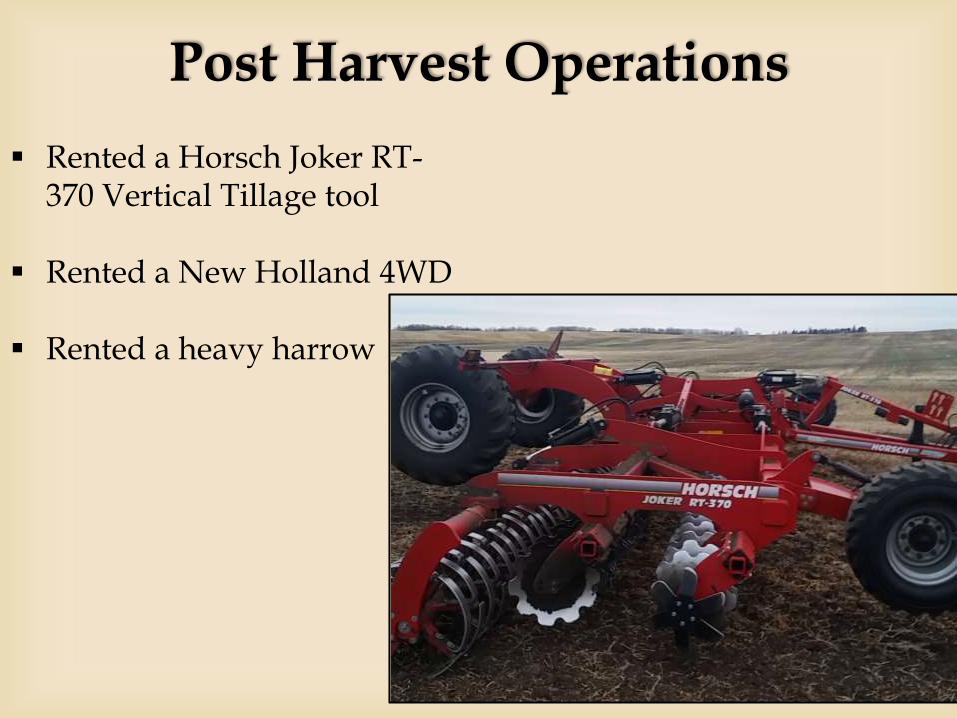
Post Harvest Operations
Rented a Horsch Joker RT-370 Vertical Tillage tool
Rented a New Holland 4WD
Rented a heavy harrow
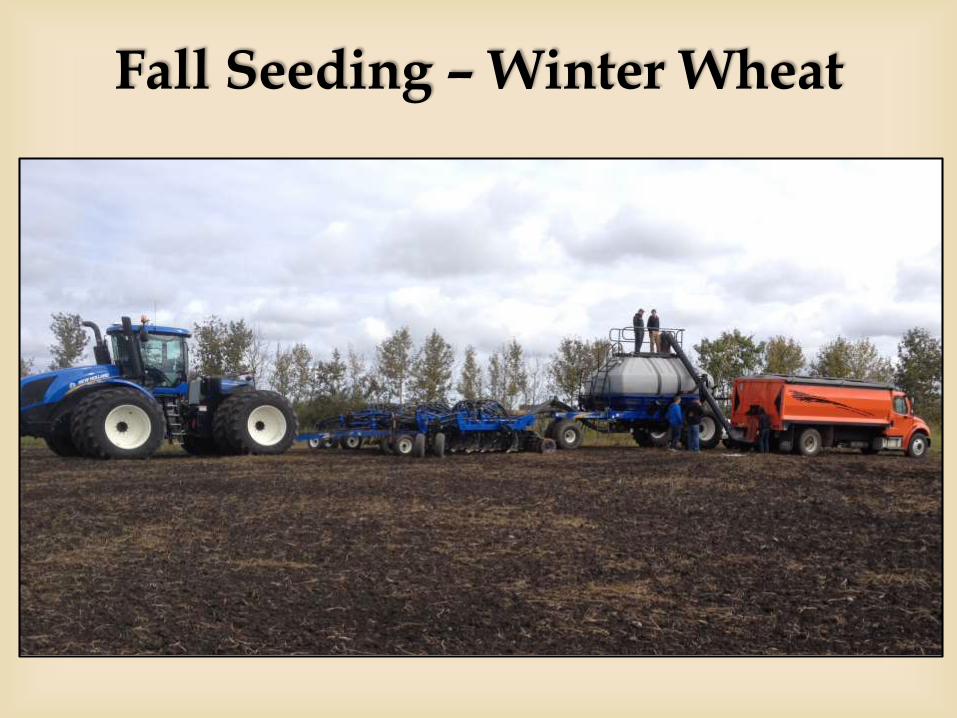
Fall Seeding – Winter Wheat
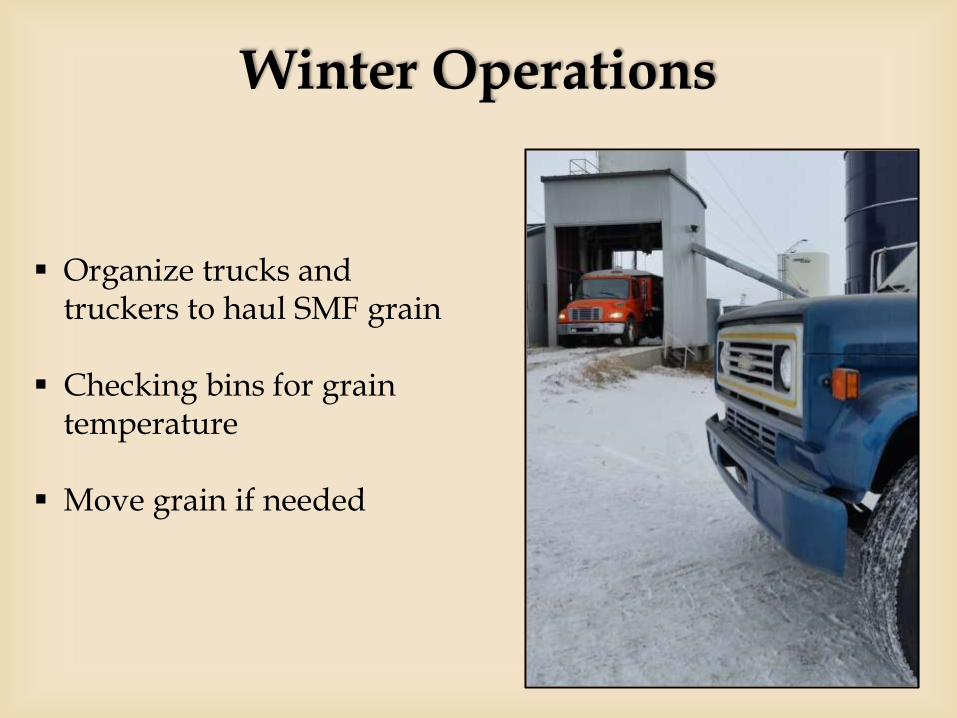
Winter Operations
Organize trucks and truckers to haul SMF grain
Checking bins for grain temperature
Move grain if needed
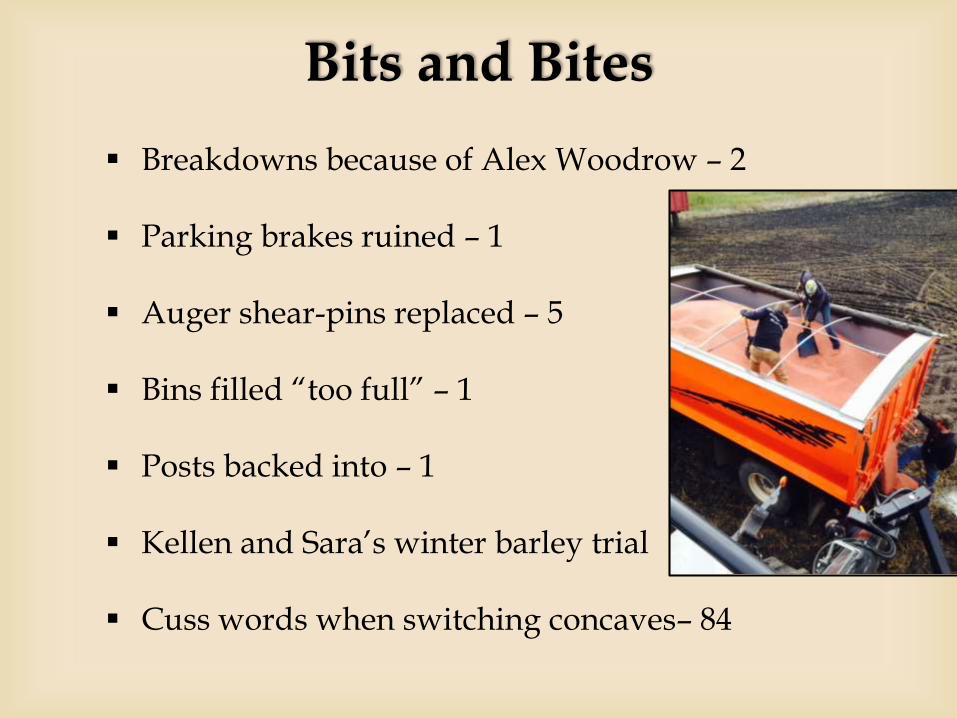
Bits and Bites
Breakdowns because of Alex Woodrow – 2
Parking brakes ruined – 1
Auger shear-pins replaced – 5
Bins filled “too full” – 1
Posts backed into – 1
Kellen and Sara’s winter barley trial
Cuss words when switching concaves– 84
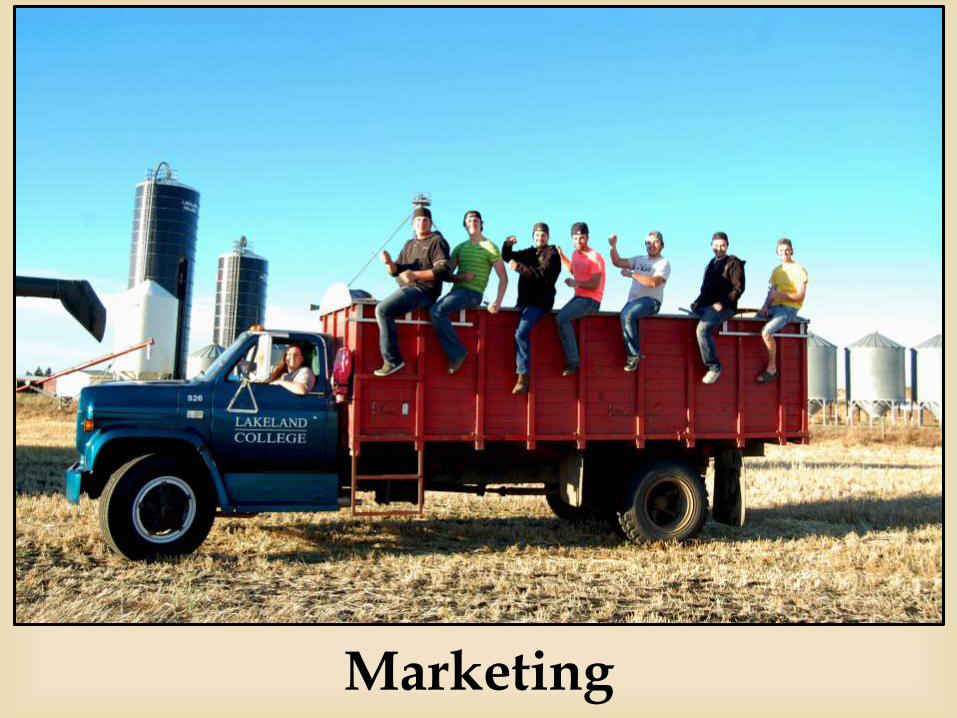
Marketing

Manager
Record weekly prices (Futures, Basis, Cash Prices)
Help team members when making grain sales
Chair weekly meetings & prepare presentations
Roles and Responsibilities
Team
Sell the SMF Crops commodities
Contact grain buyers
Record weekly prices (Futures ,Basis, Cash Prices )
Deliver samples to potential grain buyers
Watch daily market trends
Read market commentary
Give Productions team a market outlook when deciding on next years crop plan
Roles and Responsibilities
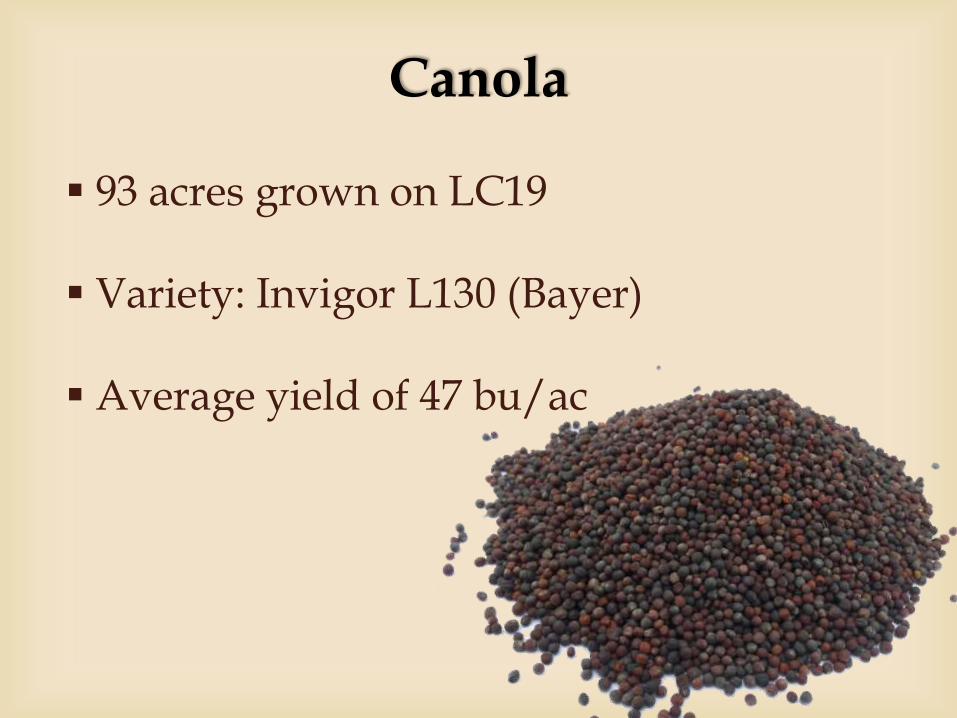
93 acres grown on LC19
Variety: Invigor L130 (Bayer)
Average yield of 47 bu/ac
Canola
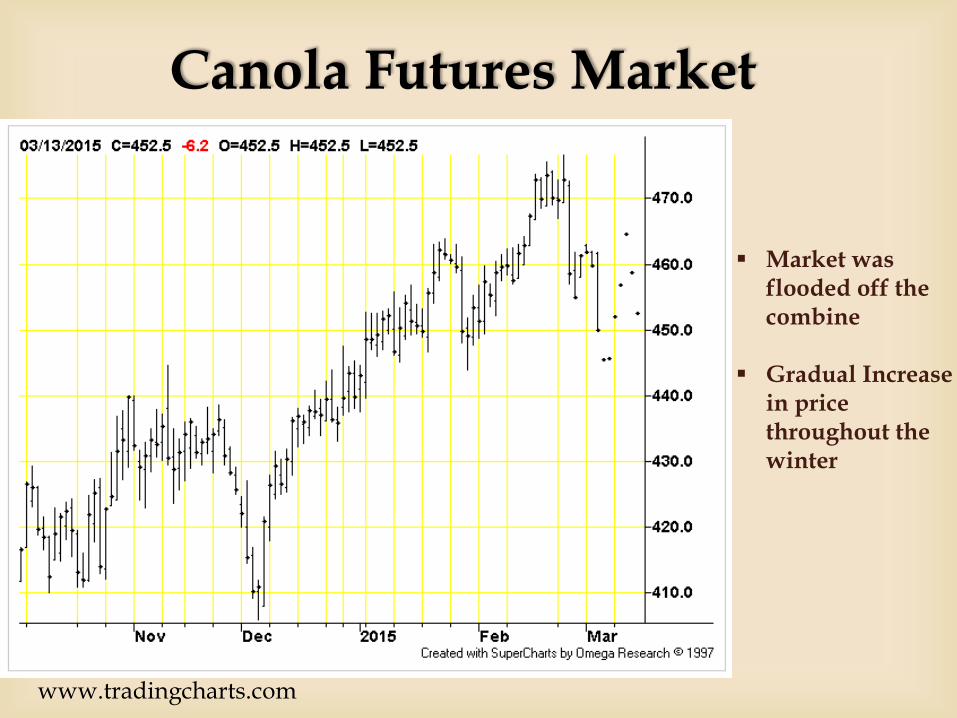
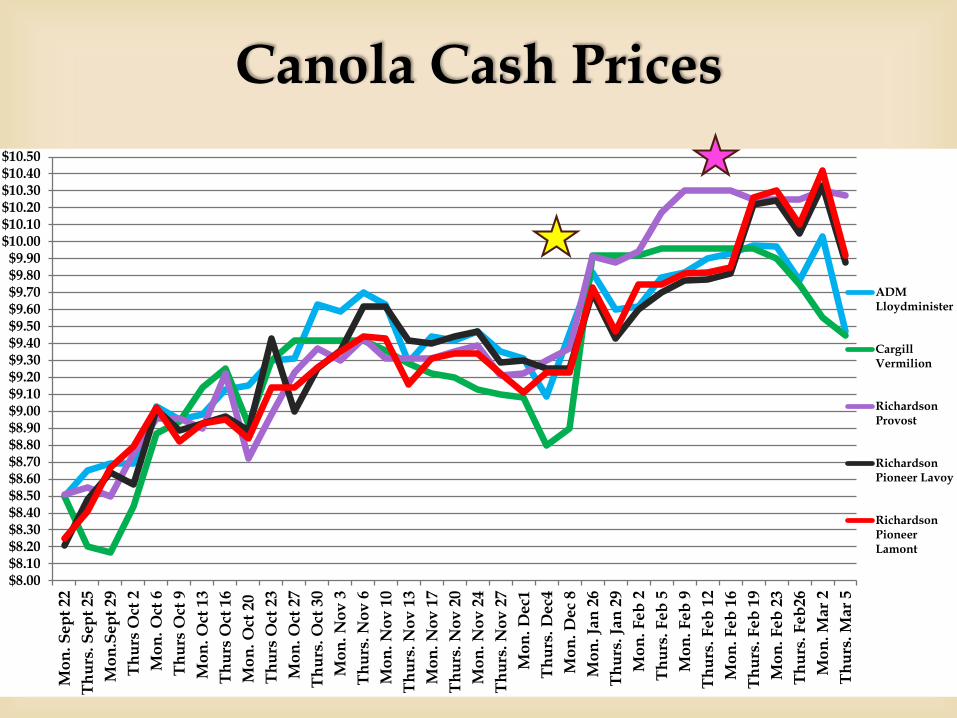
Canola Futures Market
Market was flooded off the combine
Gradual Increase in price throughout the winter
www.tradingcharts.com

Canola Cash Prices
$8.00$8.10$8.20$8.30$8.40$8.50$8.60$8.70$8.80$8.90$9.00$9.10$9.20$9.30$9.40$9.50$9.60$9.70$9.80$9.90
$10.00$10.10$10.20$10.30$10.40$10.50
Mo
n. S
ep
t 22
Th
urs
. S
ep
t 25
Mo
n.S
ep
t 29
Th
urs
Oct
2
Mo
n. O
ct 6
Th
urs
Oct
9
Mo
n. O
ct 1
3
Th
urs
Oct
16
Mo
n. O
ct 2
0
Th
urs
Oct
23
Mo
n. O
ct 2
7
Th
urs
. O
ct 3
0
Mo
n.
No
v 3
Th
urs
. N
ov
6
Mo
n. N
ov
10
Th
urs
. N
ov
13
Mo
n.
No
v 1
7
Th
urs
. N
ov
20
Mo
n. N
ov
24
Th
urs
. N
ov
27
Mo
n. D
ec1
Th
urs
. D
ec4
Mo
n.
Dec
8
Mo
n. Ja
n 2
6
Th
urs
. Ja
n 2
9
Mo
n. F
eb
2
Th
urs
. F
eb
5
Mo
n. F
eb
9
Th
urs
. F
eb
12
Mo
n. F
eb
16
Th
urs
. F
eb
19
Mo
n. F
eb
23
Th
urs
. F
eb
26
Mo
n. M
ar
2
Th
urs
. M
ar
5
ADMLloydminister
CargillVermilion
RichardsonProvost
RichardsonPioneer Lavoy
RichardsonPioneerLamont

Canola Basis Tracking
-$0.40
-$0.20
$0.00
$0.20
$0.40
$0.60
$0.80
$1.00
CargillVermilion
ADMLloydminister
RichardsonProvost
RichardsonPioneer Lavoy
RichardsonPioneerLamont
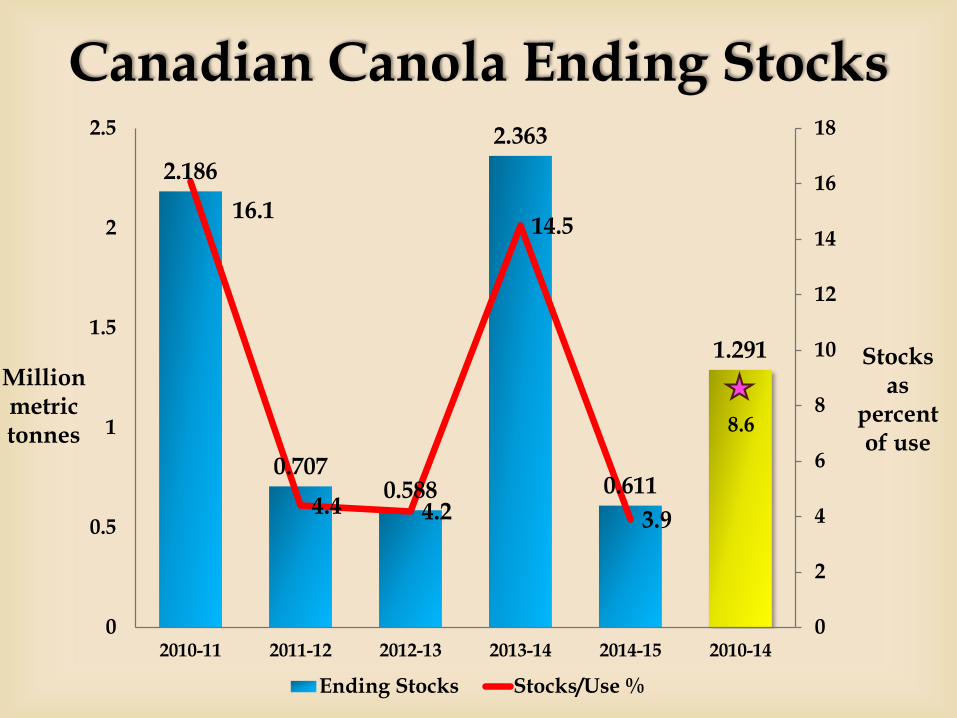
Canadian Canola Ending Stocks
2.186
0.7070.588
2.363
0.611
1.291
16.1
4.4 4.2
14.5
3.9
0
2
4
6
8
10
12
14
16
18
0
0.5
1
1.5
2
2.5
2010-11 2011-12 2012-13 2013-14 2014-15 2010-14
Ending Stocks Stocks/Use %
8.6
Million metric tonnes
Stocks as
percent of use
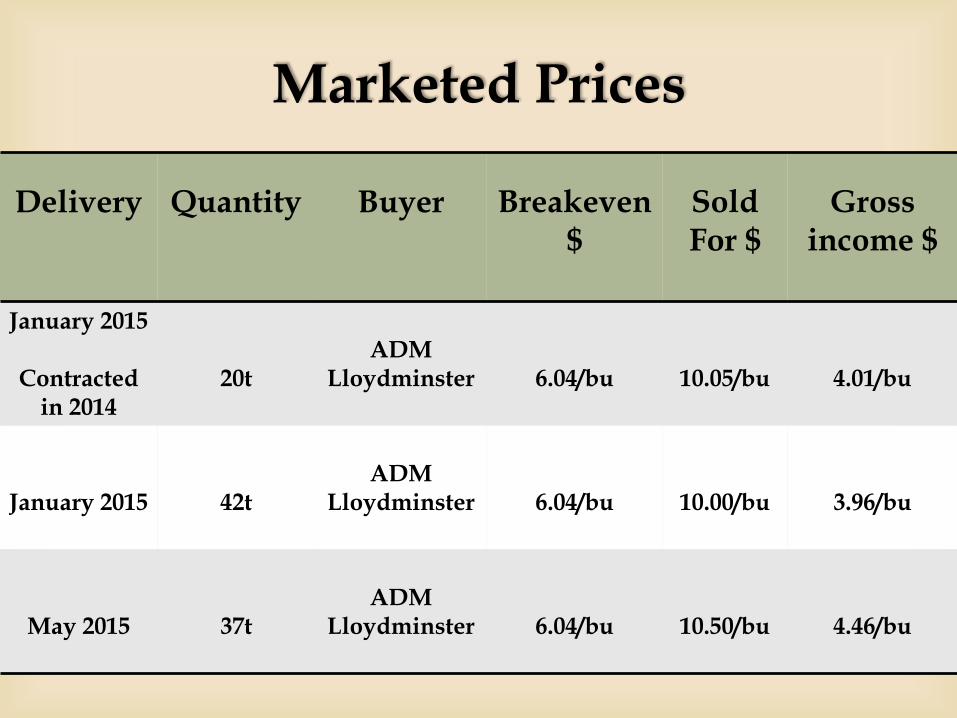
Marketed Prices
Delivery Quantity Buyer Breakeven $
SoldFor $
Gross income $
January 2015
Contracted in 2014
20t ADM
Lloydminster 6.04/bu 10.05/bu 4.01/bu
January 2015 42tADM
Lloydminster 6.04/bu 10.00/bu 3.96/bu
May 2015 37tADM
Lloydminster 6.04/bu 10.50/bu 4.46/bu
Canola Cash Prices
$8.00$8.10$8.20$8.30$8.40$8.50$8.60$8.70$8.80$8.90$9.00$9.10$9.20$9.30$9.40$9.50$9.60$9.70$9.80$9.90
$10.00$10.10$10.20$10.30$10.40$10.50
Mo
n. S
ep
t 22
Th
urs
. S
ep
t 25
Mo
n.S
ep
t 29
Th
urs
Oct
2
Mo
n. O
ct 6
Th
urs
Oct
9
Mo
n. O
ct 1
3
Th
urs
Oct
16
Mo
n. O
ct 2
0
Th
urs
Oct
23
Mo
n. O
ct 2
7
Th
urs
. O
ct 3
0
Mo
n.
No
v 3
Th
urs
. N
ov
6
Mo
n. N
ov
10
Th
urs
. N
ov
13
Mo
n.
No
v 1
7
Th
urs
. N
ov
20
Mo
n. N
ov
24
Th
urs
. N
ov
27
Mo
n. D
ec1
Th
urs
. D
ec4
Mo
n.
Dec
8
Mo
n. Ja
n 2
6
Th
urs
. Ja
n 2
9
Mo
n. F
eb
2
Th
urs
. F
eb
5
Mo
n. F
eb
9
Th
urs
. F
eb
12
Mo
n. F
eb
16
Th
urs
. F
eb
19
Mo
n. F
eb
23
Th
urs
. F
eb
26
Mo
n. M
ar
2
Th
urs
. M
ar
5
ADMLloydminister
CargillVermilion
RichardsonProvost
RichardsonPioneer Lavoy
RichardsonPioneerLamont

Marketed Prices
Delivery Quantity Buyer Breakeven $
SoldFor $
Gross income $
January 2015
Contracted in 2014
20t ADM
Lloydminster 6.04/bu 10.05/bu 4.01/bu
January 2015 42tADM
Lloydminster 6.04/bu 10.00/bu 3.96/bu
May 2015 37tADM
Lloydminster 6.04/bu 10.50/bu 4.46/bu
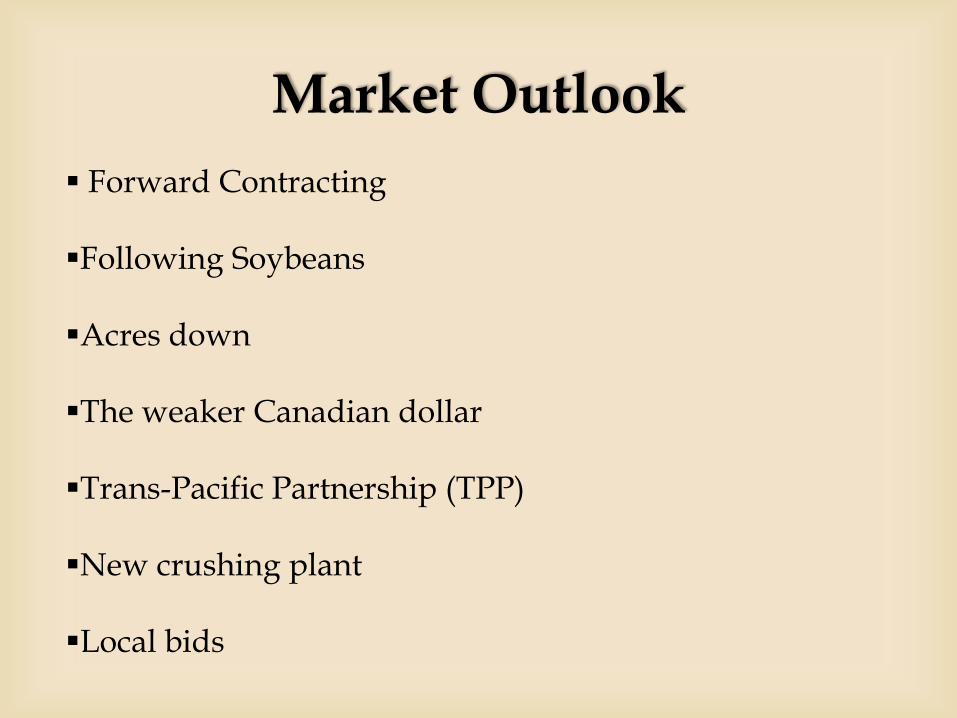
Market Outlook
Forward Contracting
Following Soybeans
Acres down
The weaker Canadian dollar
Trans-Pacific Partnership (TPP)
New crushing plant
Local bids
Hard Red Spring Wheat
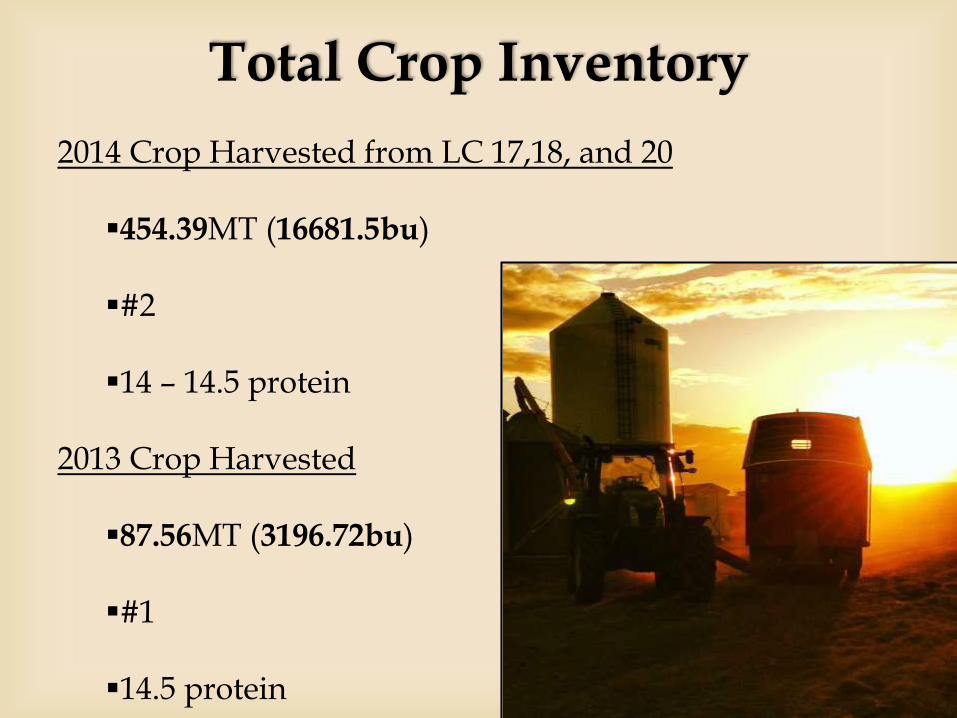
Total Crop Inventory
2014 Crop Harvested from LC 17,18, and 20
454.39MT (16681.5bu)
#2
14 – 14.5 protein
2013 Crop Harvested
87.56MT (3196.72bu)
#1
14.5 protein
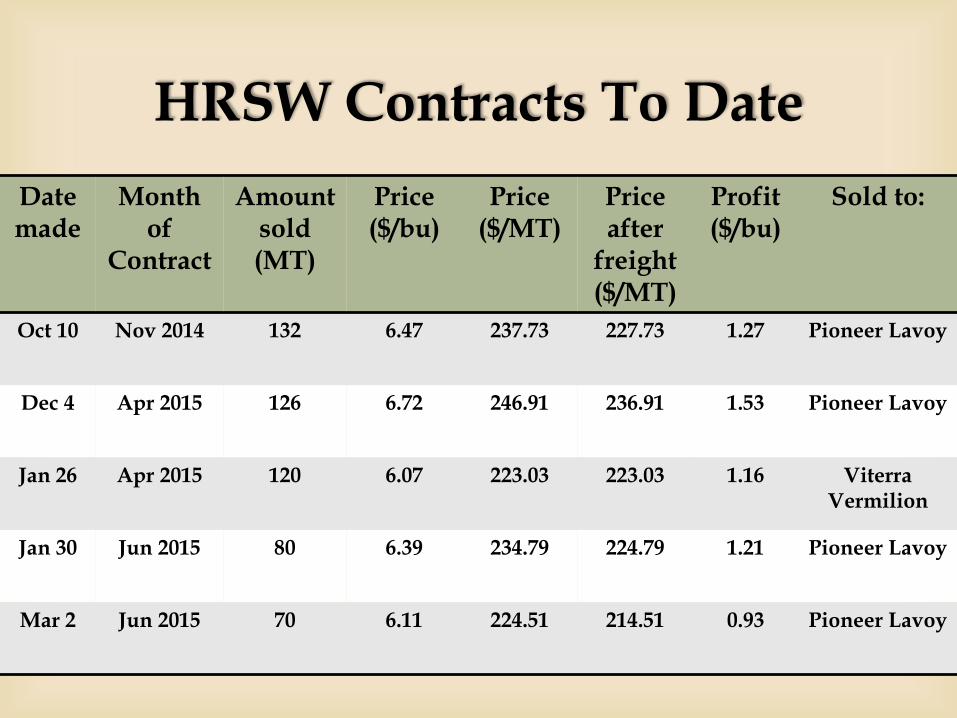
HRSW Contracts To Date
Date made
Month of
Contract
Amount sold(MT)
Price ($/bu)
Price ($/MT)
Price after
freight($/MT)
Profit($/bu)
Sold to:
Oct 10 Nov 2014 132 6.47 237.73 227.73 1.27 Pioneer Lavoy
Dec 4 Apr 2015 126 6.72 246.91 236.91 1.53 Pioneer Lavoy
Jan 26 Apr 2015 120 6.07 223.03 223.03 1.16 ViterraVermilion
Jan 30 Jun 2015 80 6.39 234.79 224.79 1.21 Pioneer Lavoy
Mar 2 Jun 2015 70 6.11 224.51 214.51 0.93 Pioneer Lavoy
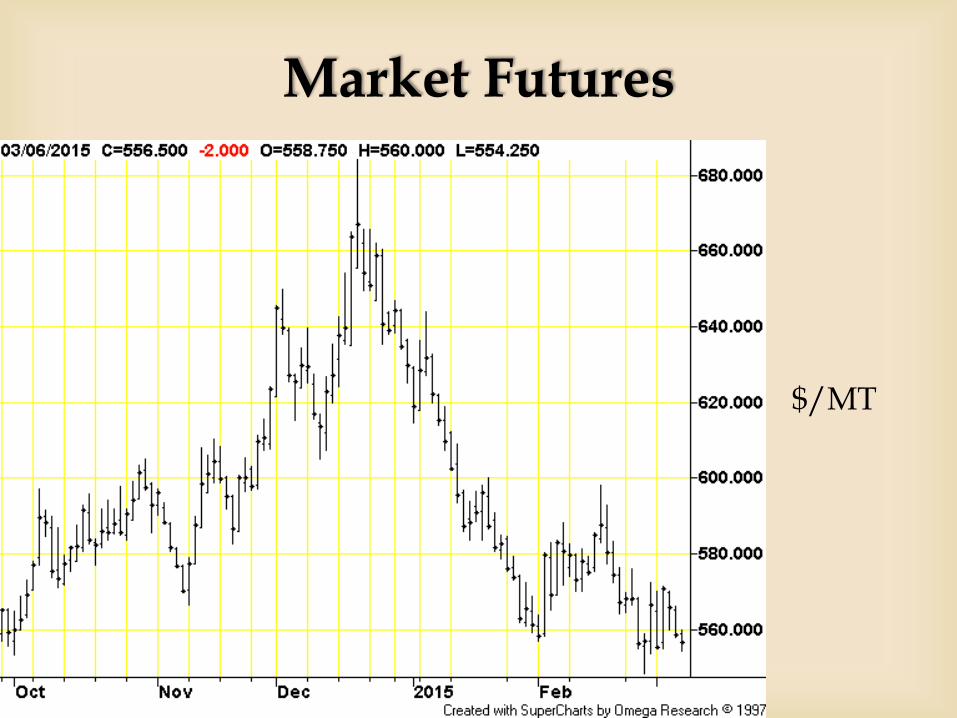
Market Futures
$/MT
$4.50
$5.00
$5.50
$6.00
$6.50
$7.00
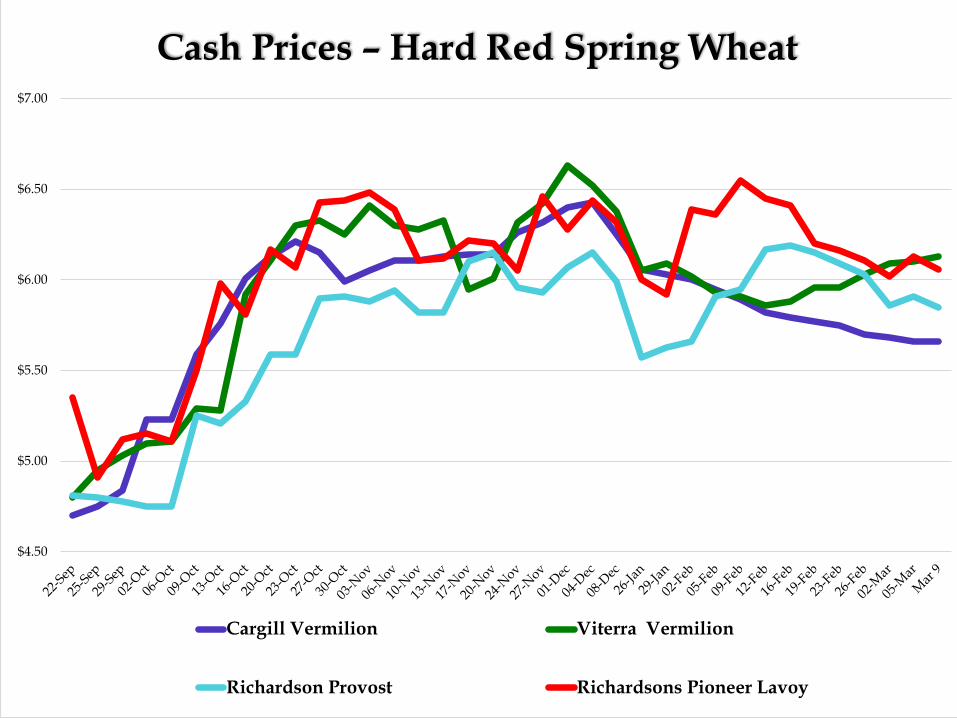
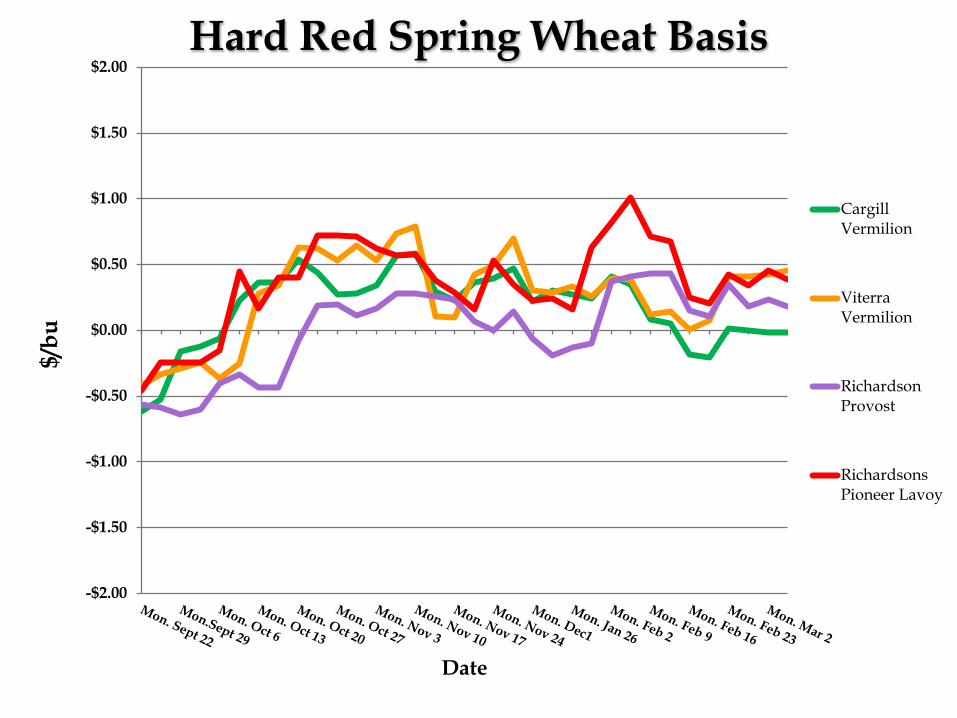
Cash Prices – Hard Red Spring Wheat
Cargill Vermilion Viterra Vermilion
Richardson Provost Richardsons Pioneer Lavoy
-$2.00
-$1.50
-$1.00
-$0.50
$0.00
$0.50
$1.00
$1.50
$2.00$/b
u
Date
Hard Red Spring Wheat Basis
CargillVermilion
ViterraVermilion
RichardsonProvost
RichardsonsPioneer Lavoy
Targets set in December
Both targets were measured at 80MT at Richardson Pioneer in Lavoy, they were not picked up.
December 3rd 2014
Target set at 7.05
Second target set at 7.20
Note:
Current price was just shy of 7
Market Challenges
Wheat prices have been influenced by the previous crop year where 30% carryover has flooded the market
World wheat production was raised 1.7mmt from an already record of 725.03mmt. Increased production came from Argentina and Kazakhstan
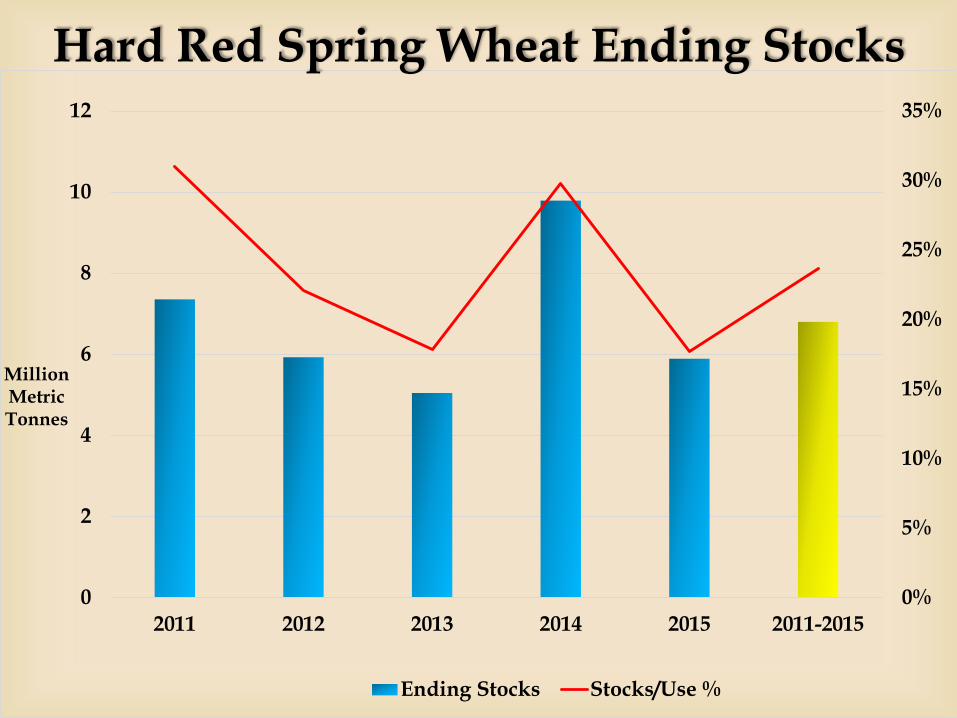
0%
5%
10%
15%
20%
25%
30%
35%
0
2
4
6
8
10
12
2011 2012 2013 2014 2015 2011-2015
Million Metric Tonnes
Ending Stocks Stocks/Use %
Hard Red Spring Wheat Ending Stocks
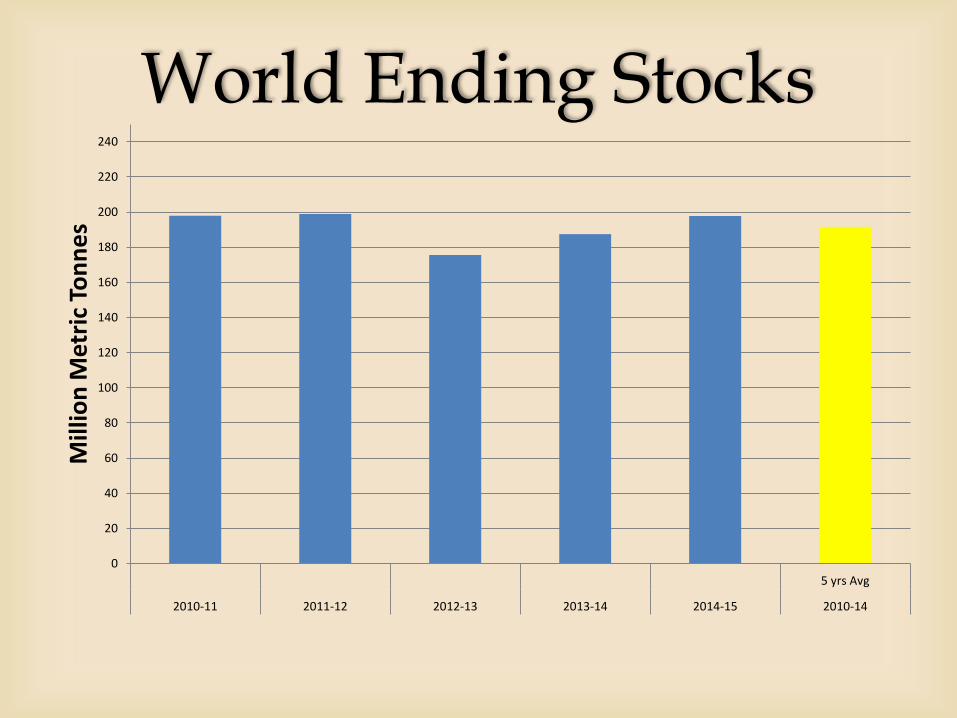
World Ending Stocks
0
20
40
60
80
100
120
140
160
180
200
220
240
5 yrs Avg
2010-11 2011-12 2012-13 2013-14 2014-15 2010-14
Mill
ion
Met
ric
Ton
ne
s
The Canadian Wheat Market will continue to struggle considering surplus has been an issue.
Quality issues overshadow total supplies.
There will be more Spring Wheat acres this year, as last year many acres were flooded.
3-5% more acres are projected for 2015 in Western Canada
Market Outlook

Barley
Light Barley from Flax Field
Good barley that didn’t make malt
Why the Barley Didn’t Make Malt
Protein 16.6%
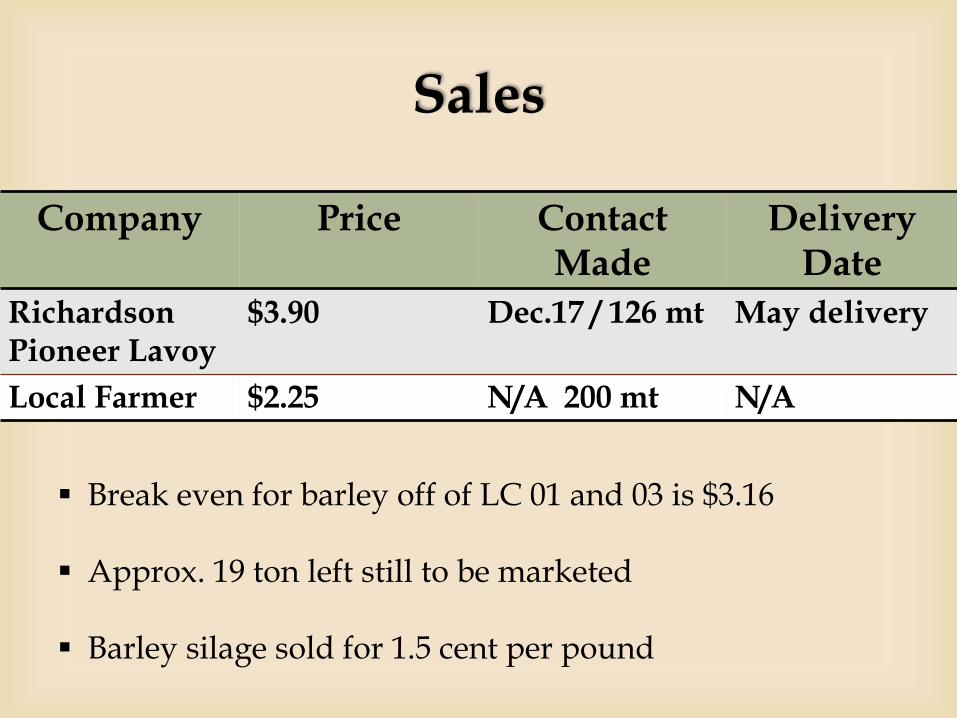
Sales
Company Price ContactMade
DeliveryDate
Richardson Pioneer Lavoy
$3.90 Dec.17 / 126 mt May delivery
Local Farmer $2.25 N/A 200 mt N/A
Break even for barley off of LC 01 and 03 is $3.16
Approx. 19 ton left still to be marketed
Barley silage sold for 1.5 cent per pound
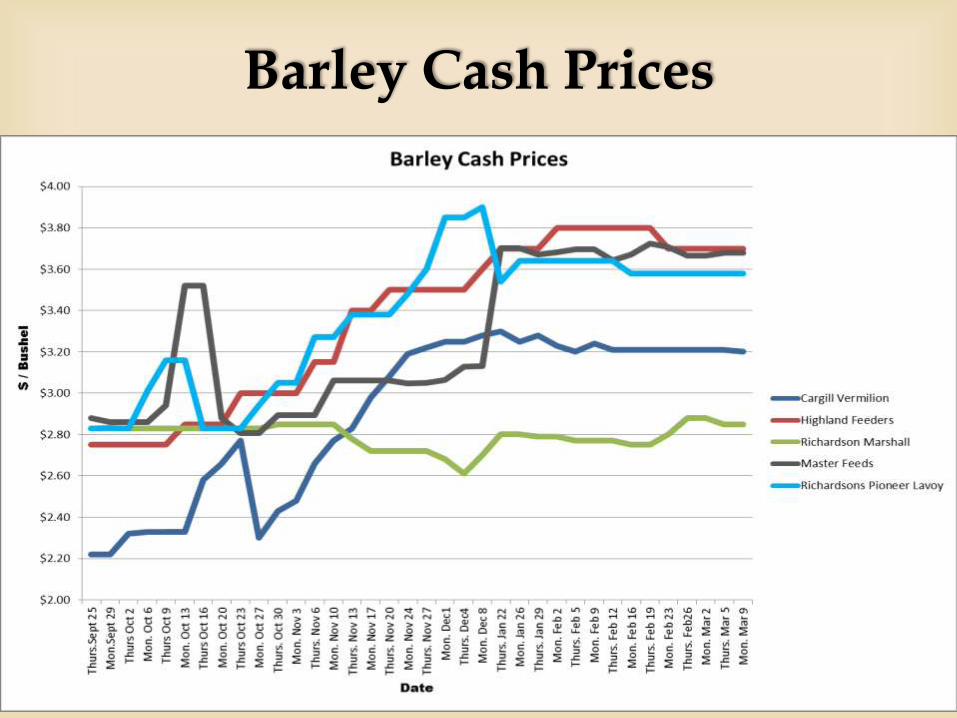
Barley Cash Prices
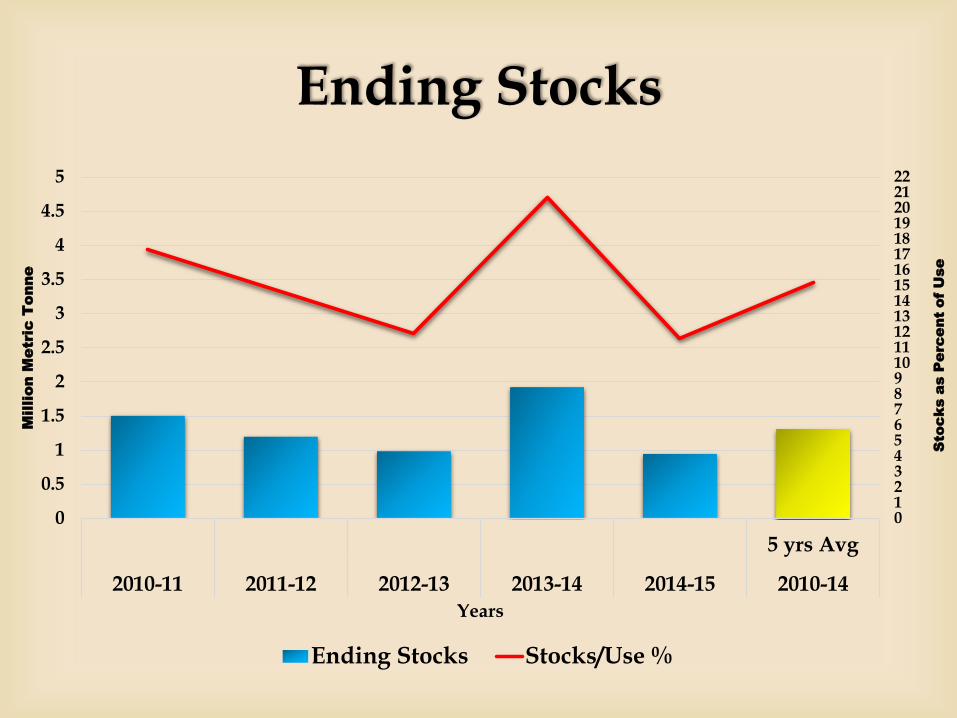
Ending Stocks
012345678910111213141516171819202122
0
0.5
1
1.5
2
2.5
3
3.5
4
4.5
5
5 yrs Avg
2010-11 2011-12 2012-13 2013-14 2014-15 2010-14
Sto
ck
s a
s P
erc
ent o
f U
se
Million M
etric T
onne
Years
Ending Stocks Stocks/Use %
Barley Outlook
Seeded acres to be up 9%
Record low carry over and total supply
Domestic use down 6%
Export decrease to 5%
Faba Beans
Poor Germination in some areas from frost
Great crop for rotation purposes
Seeded acres on a steady incline
Faba Bean Seed Outlook

Seeded Acres in Alberta
Year Seeded Acres
2012 6,000
2013 25,000
2014 80,000
Projected 2015 160,000
Five local producers currently interested
Un-cleaned common seed in SK for $11/bu
Certified from Stamp Seeds for $15/bu
Currently selling SMF un-cleaned Faba beans for $9.50/bu
Sales
Edible
Must have 10% or less damage
Marketed through a pulse buyer
Price of $8 - $9
Feed
Great protein and energy
Feed price of $6.50 - $7.00
Markets for Faba Beans
The current market outlook is fragile
A relatively new crop to the area, with seeded acres sky rocketing
Markets slowly developing leaving risk of flooding the market
Market Outlook
High Pulse prices have pushed Faba bean prices up
By May/June pulse stocks in Canada very low
Ending Stocks
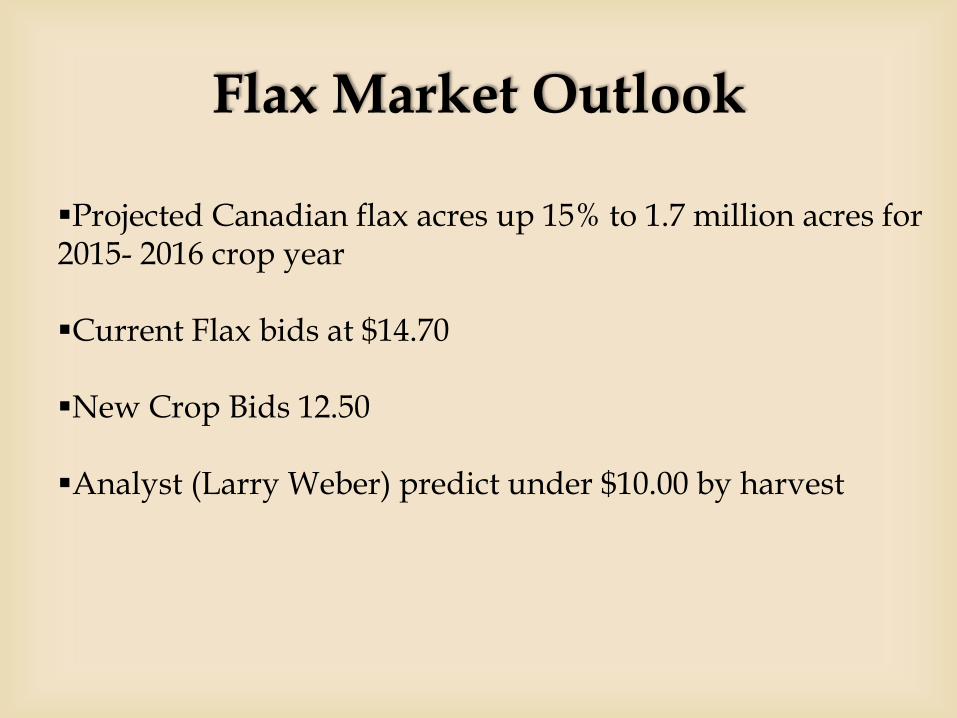
Projected Canadian flax acres up 15% to 1.7 million acres for 2015- 2016 crop year
Current Flax bids at $14.70
New Crop Bids 12.50
Analyst (Larry Weber) predict under $10.00 by harvest
Flax Market Outlook
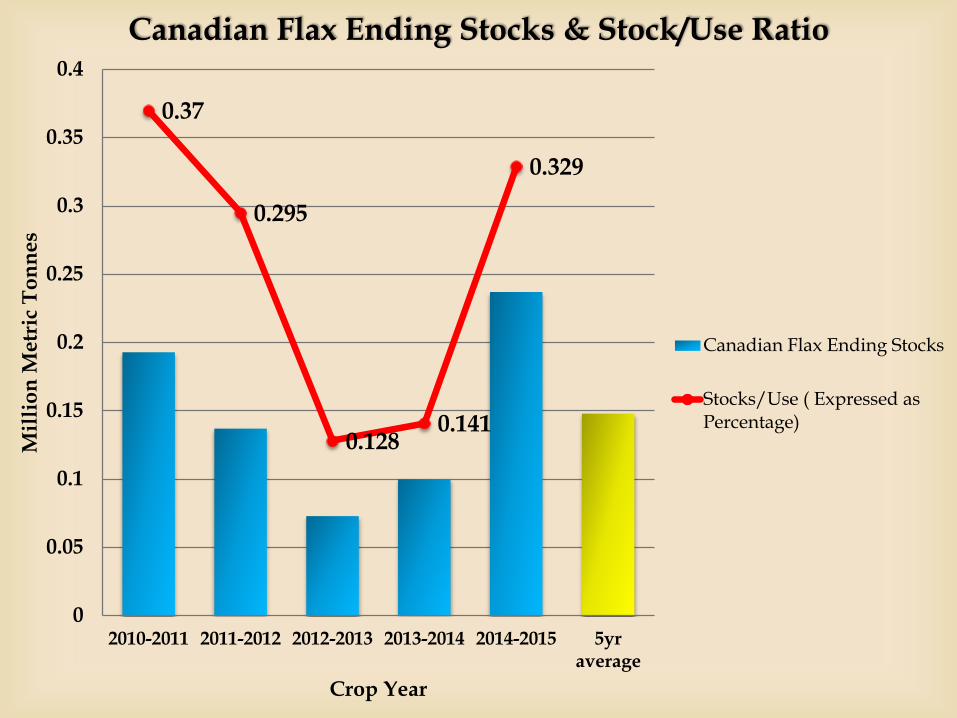
0.37
0.295
0.1280.141
0.329
0
0.05
0.1
0.15
0.2
0.25
0.3
0.35
0.4
2010-2011 2011-2012 2012-2013 2013-2014 2014-2015 5yraverage
Mil
lio
n M
etr
ic T
on
ne
s
Crop Year
Canadian Flax Ending Stocks & Stock/Use Ratio
Canadian Flax Ending Stocks
Stocks/Use ( Expressed asPercentage)
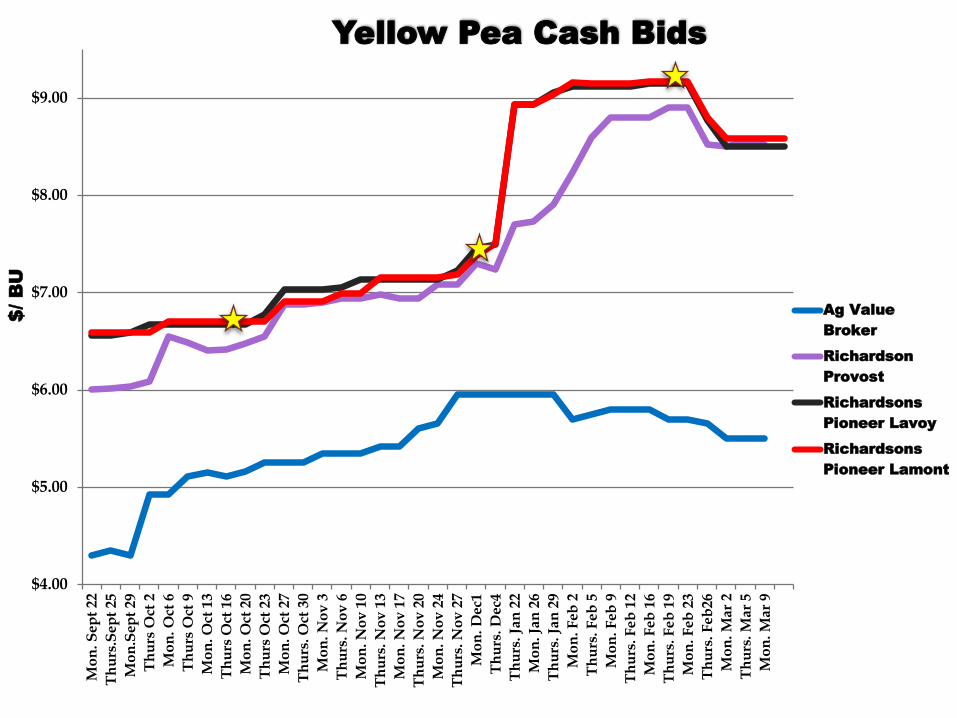
Yellow Peas
$4.00
$5.00
$6.00
$7.00
$8.00
$9.00M
on
. S
ept
22
Th
urs
.Sep
t 25
Mo
n.S
ept
29
Th
urs
Oct
2
Mo
n.
Oct
6
Th
urs
Oct
9
Mo
n. O
ct 1
3
Th
urs
Oct
16
Mo
n. O
ct 2
0
Th
urs
Oct
23
Mo
n. O
ct 2
7
Th
urs
. O
ct 3
0
Mo
n. N
ov
3
Th
urs
. N
ov
6
Mo
n. N
ov
10
Th
urs
. N
ov
13
Mo
n. N
ov
17
Th
urs
. N
ov
20
Mo
n. N
ov
24
Th
urs
. N
ov
27
Mo
n.
Dec1
Th
urs
. D
ec4
Th
urs
. Ja
n 2
2
Mo
n. Ja
n 2
6
Th
urs
. Ja
n 2
9
Mo
n.
Feb
2
Th
urs
. F
eb
5
Mo
n.
Feb
9
Th
urs
. F
eb
12
Mo
n. F
eb 1
6
Th
urs
. F
eb
19
Mo
n. F
eb 2
3
Th
urs
. F
eb
26
Mo
n. M
ar
2
Th
urs
. M
ar
5
Mo
n. M
ar
9
$/ B
U
Yellow Pea Cash Bids
Ag Value
Broker
Richardson
Provost
Richardsons
Pioneer Lavoy
Richardsons
Pioneer Lamont

Contracts
Elevator Name
Delivery Period
Amount Sold (MT)
Price Break EvenPrices
PriceAfter Break Evens
Date of Contract
Pioneer Lavoy
January 84MT $7.05/bu $259.05/MT $5.36/bu $1.69/bu October 10th, 2014
Pioneer Lavoy
January 44MT $7.35/bu $270.07/MT $5.36/bu $1.99/bu December 2nd, 2014
Pioneer Lavoy
April 20MT $9.01/bu $331.06/MT $5.36/bu $3.65/bu February 22nd, 2015
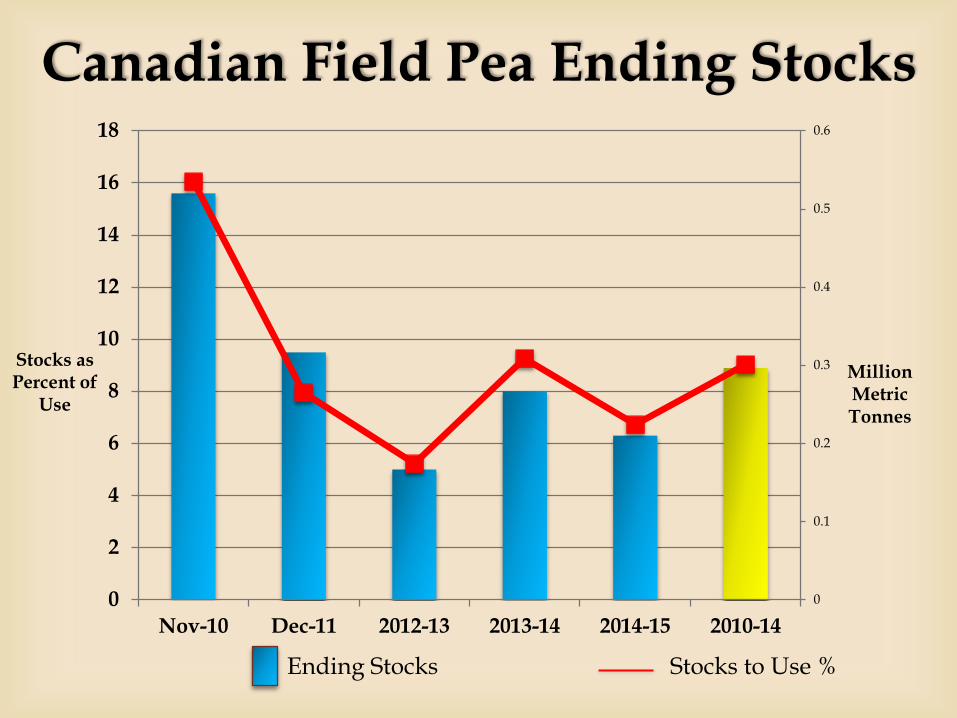
Canadian Field Pea Ending Stocks
0
0.1
0.2
0.3
0.4
0.5
0.6
0
2
4
6
8
10
12
14
16
18
Nov-10 Dec-11 2012-13 2013-14 2014-15 2010-14
Stocks asPercent of
Use
Million Metric Tonnes
Ending Stocks Stocks to Use %
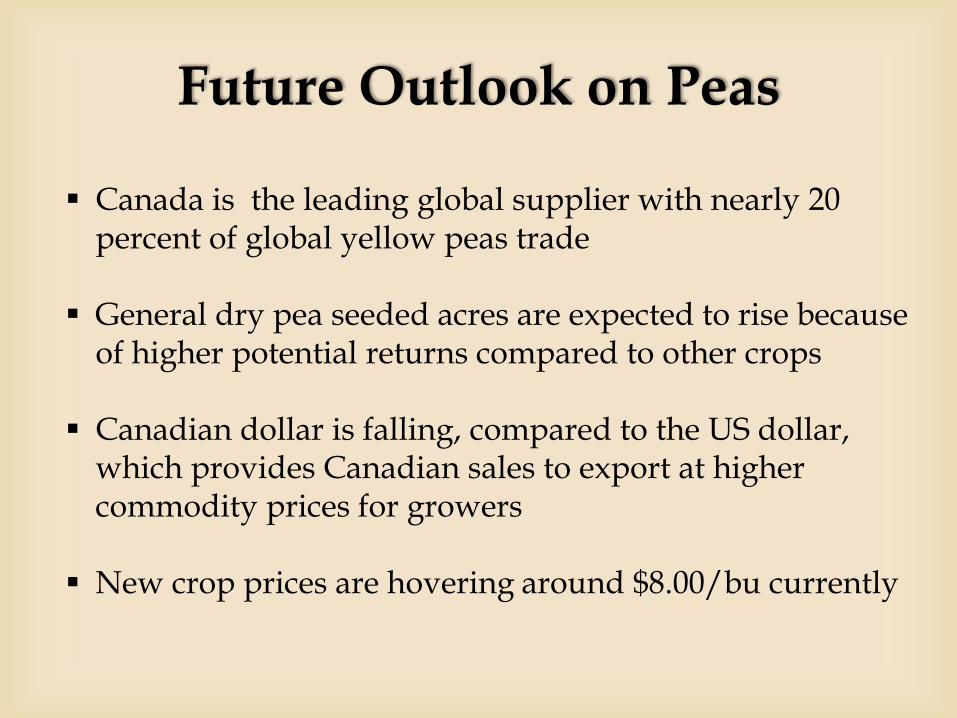
Canada is the leading global supplier with nearly 20 percent of global yellow peas trade
General dry pea seeded acres are expected to rise because of higher potential returns compared to other crops
Canadian dollar is falling, compared to the US dollar, which provides Canadian sales to export at higher commodity prices for growers
New crop prices are hovering around $8.00/bu currently
Future Outlook on Peas
Finance
Manager:
Weekly meetingsTeam meetingsGeneral meetings
Team:
QuickBooks Cost and Returns Excel SheetFiling all SMF filesCreate a projected budget
Roles and Responsibilities
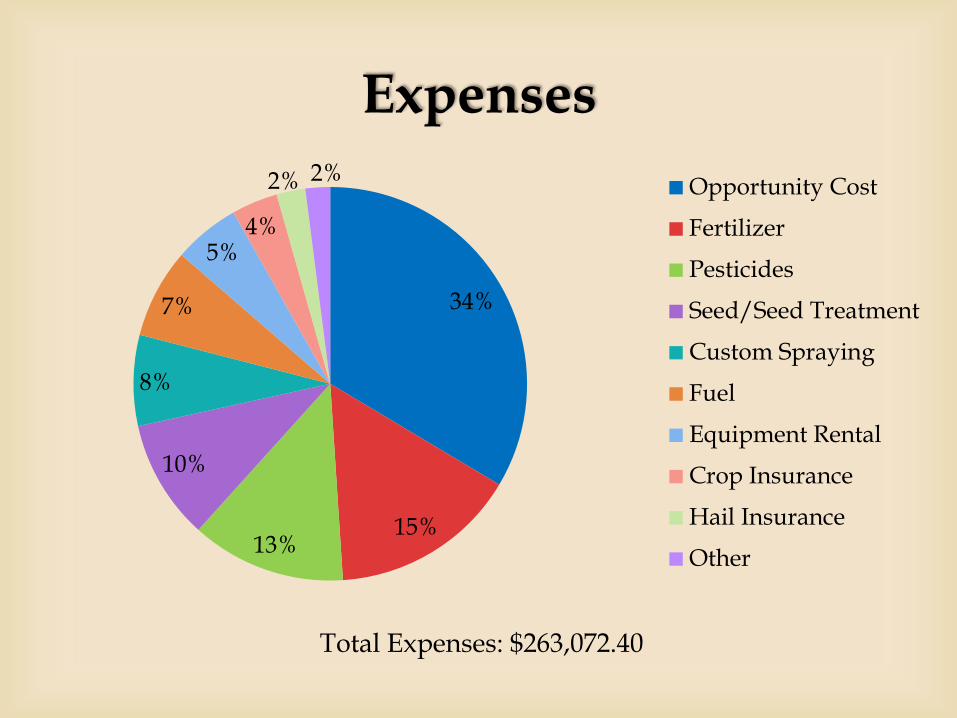
Expenses
34%
15%13%
10%
8%
7%
5%4%
2% 2%Opportunity Cost
Fertilizer
Pesticides
Seed/Seed Treatment
Custom Spraying
Fuel
Equipment Rental
Crop Insurance
Hail Insurance
Other
Total Expenses: $263,072.40
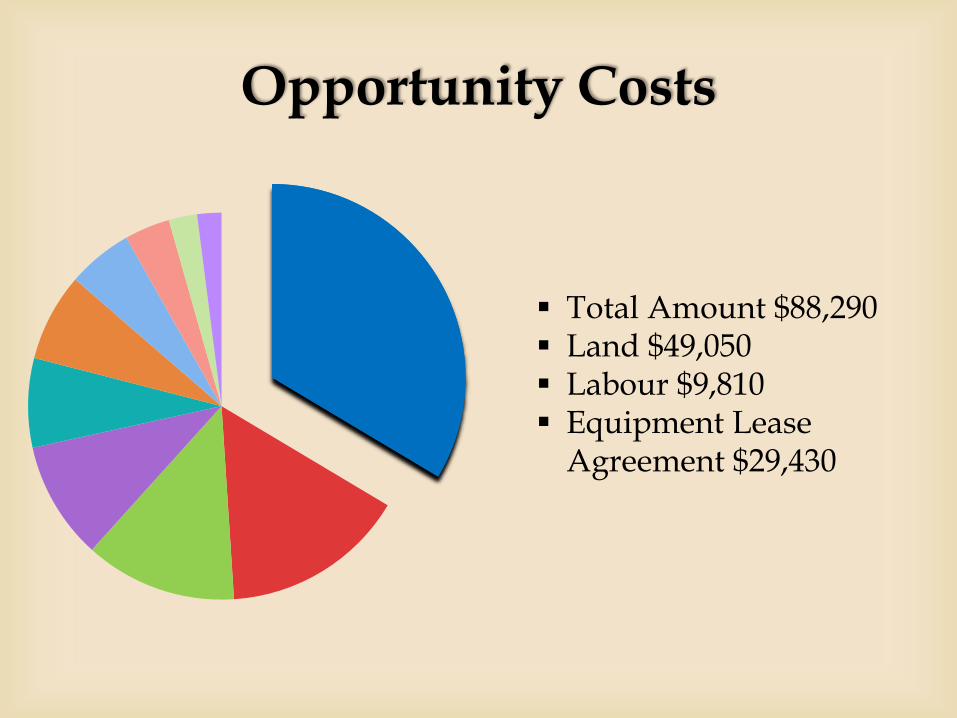
Opportunity Costs
Total Amount $88,290 Land $49,050 Labour $9,810 Equipment Lease
Agreement $29,430

Fertilizer
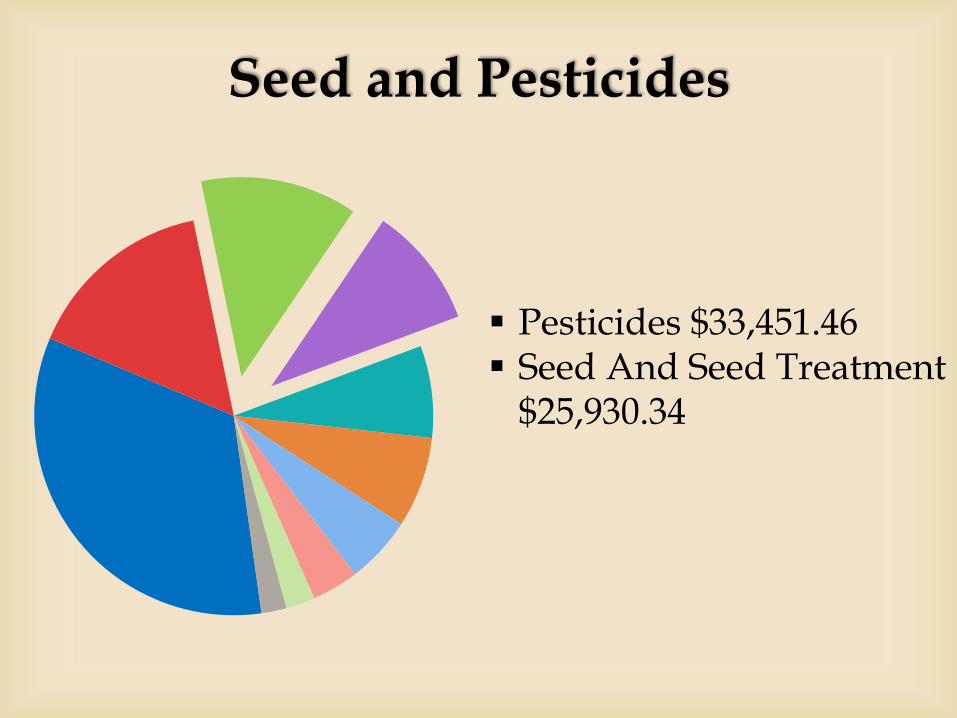
Seed and Pesticides
Pesticides $33,451.46 Seed And Seed Treatment
$25,930.34
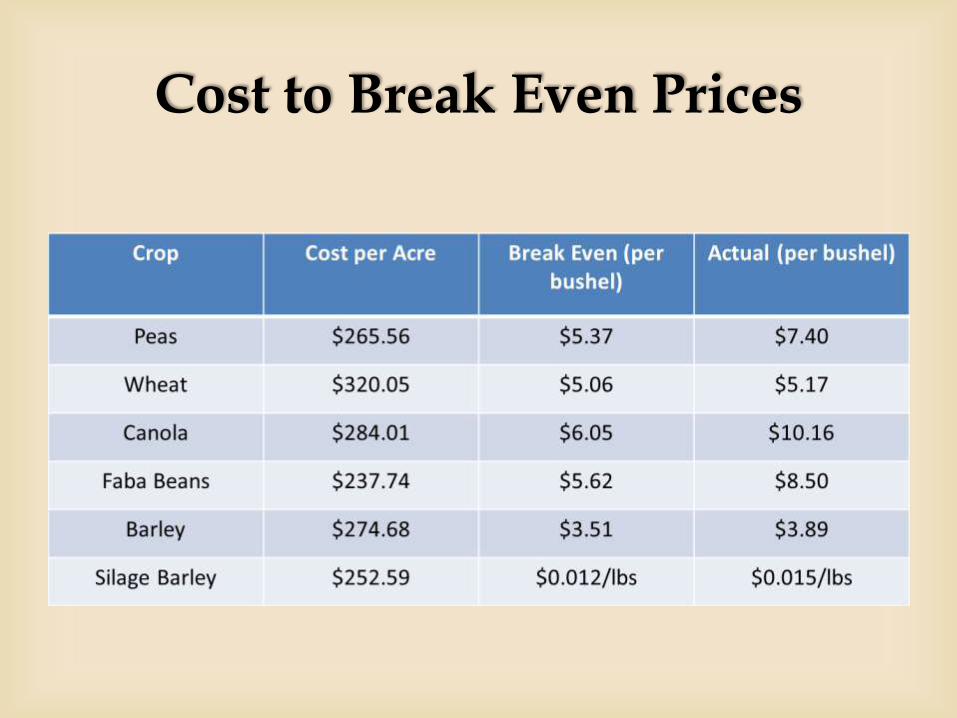
Cost to Break Even Prices
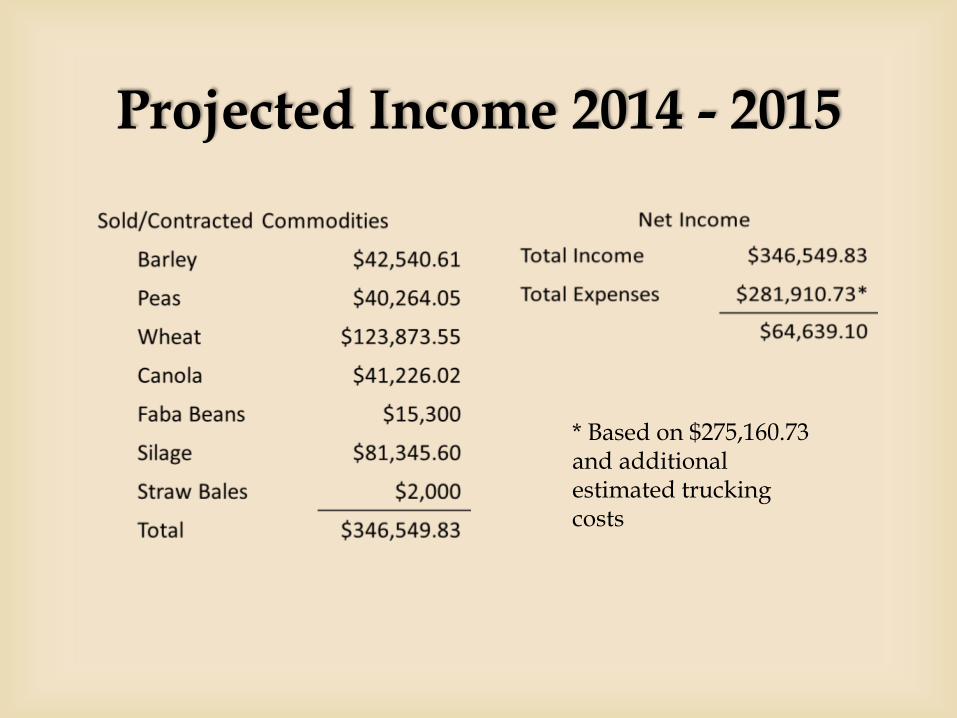
Projected Income 2014 - 2015
* Based on $275,160.73 and additional estimated trucking costs
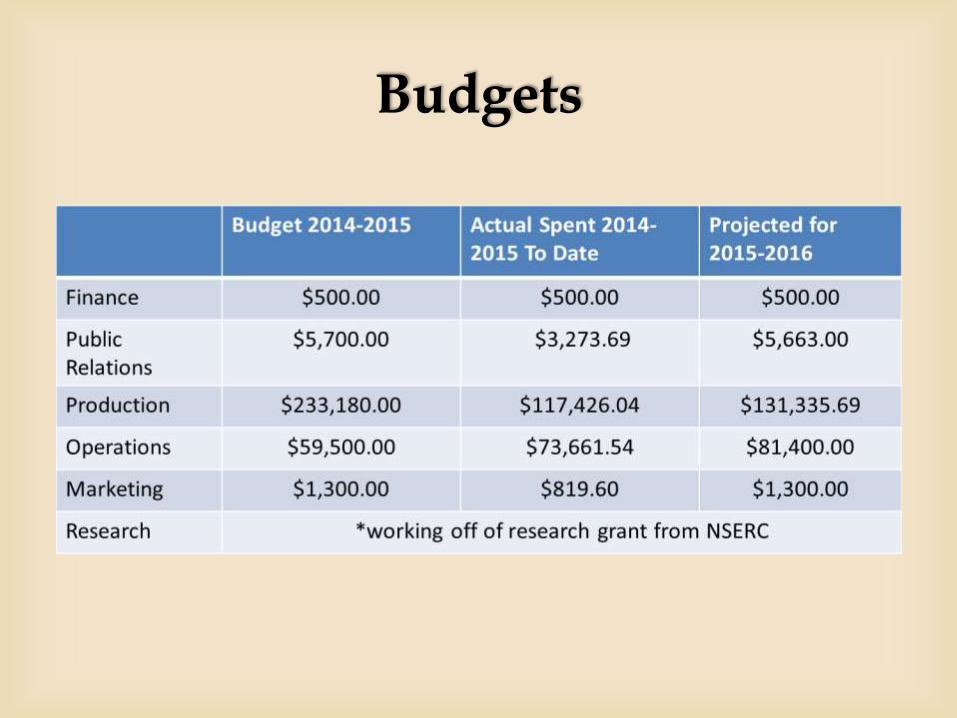
Budgets

2015 – 2016 Projection
Crop Acres ProjectedYield
(Bushels per acre)
ProjectedExpenses(per acre)
Projected Market Price
Projected Income
(per acre)
Projected Profit
(per acre)
Peas 93 45 $194.17 $7.63 $343.35 $149.18
HRS Wheat
117 50 $177.94 $5.90 $295.00 $117.06
Winter Wheat
135 45 $145.98 $3.00 $135.00 -$10.98
ClearfieldCanola
97 50 $242.09 $9.65 $482.50 $240.41
RR Canola 76 50 $232.83 $9.65 $482.50 $249.67
Barley 102 60 $148.46 $5.27 $316.20 $167.74
Silage 146 21600 (pounds)
$106.91 $0.015(per lb.)
$324.00 $217.09
Flax 210 30 $169.27 $12.18 $365.40 $196.13

Productions
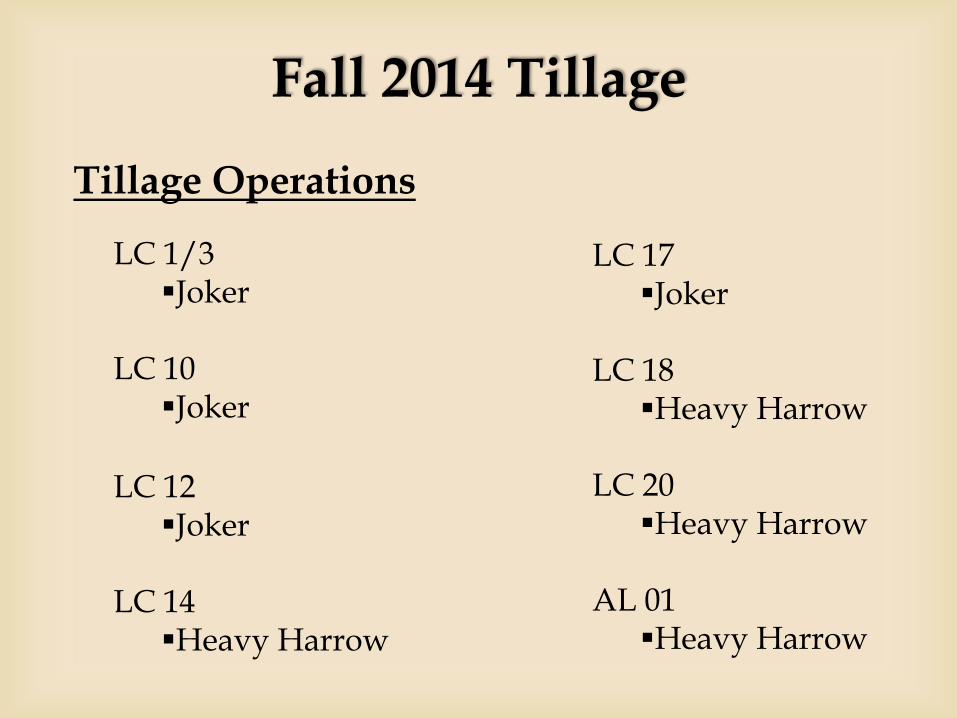
LC 12Joker
LC 14Heavy Harrow
Tillage Operations
Fall 2014 Tillage
LC 17Joker
LC 18Heavy Harrow
LC 20Heavy Harrow
AL 01Heavy Harrow
LC 1/3Joker
LC 10Joker
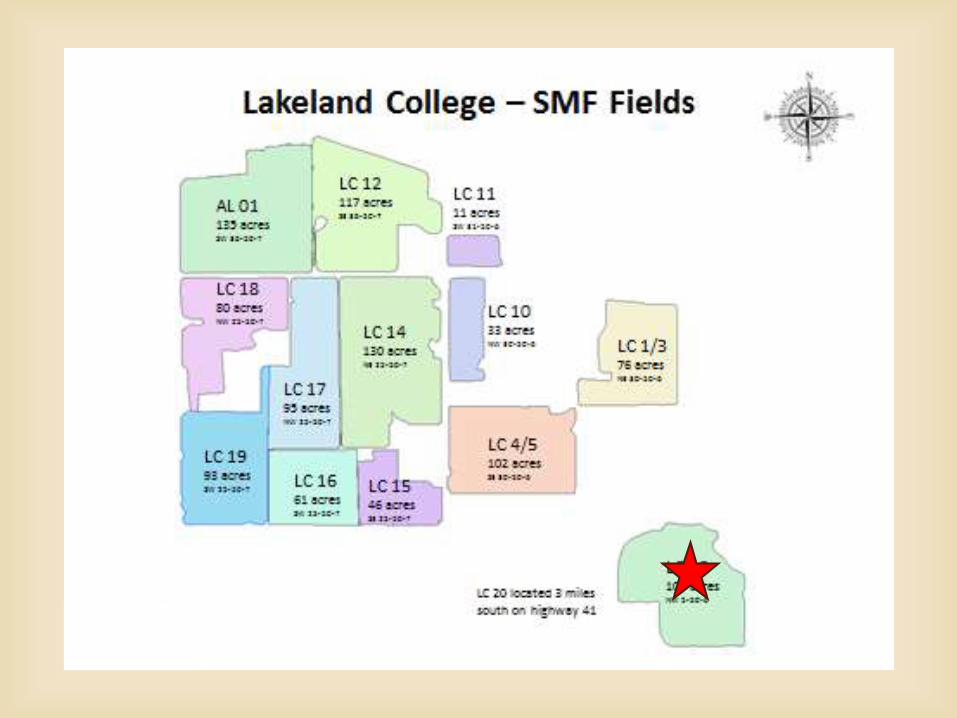
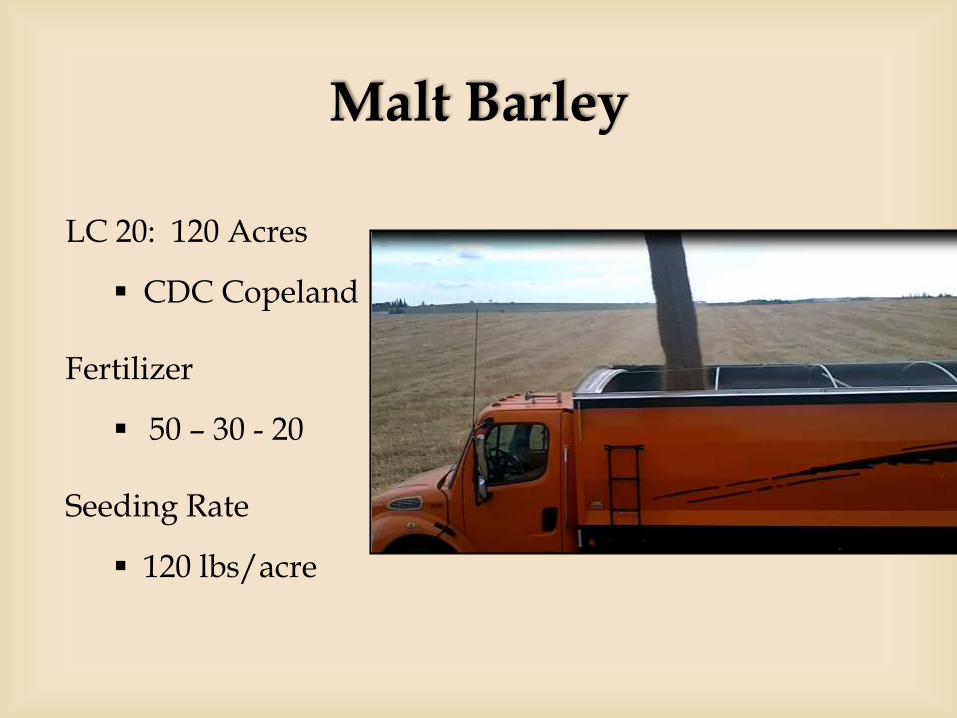
LC 20: 120 Acres
CDC Copeland
Fertilizer
50 – 30 - 20
Seeding Rate
120 lbs/acre
Malt Barley
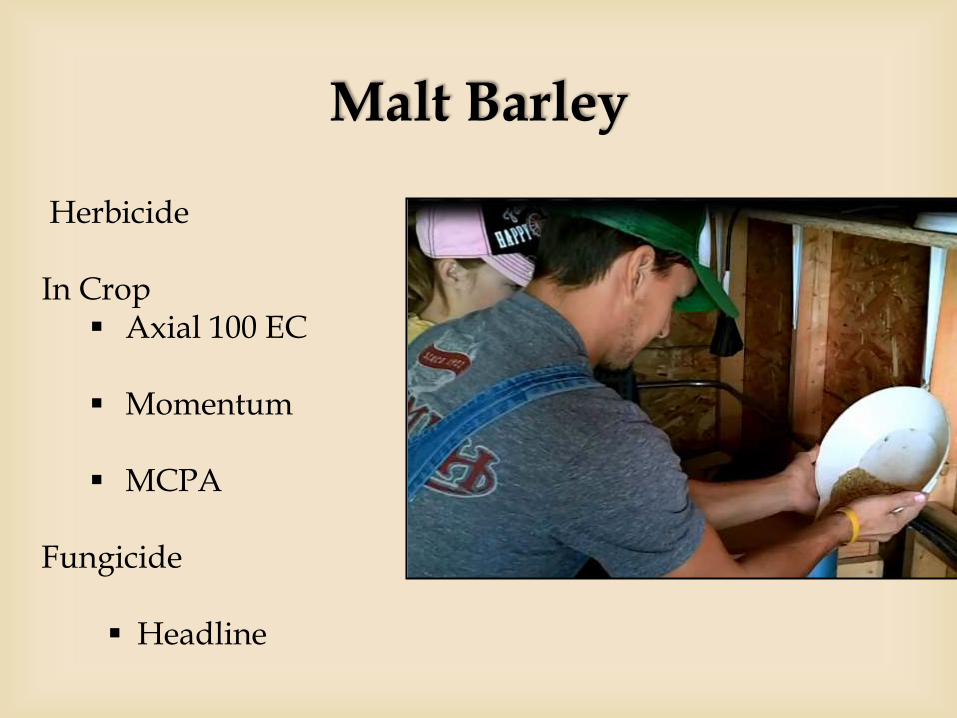
Herbicide
In Crop Axial 100 EC
Momentum
MCPA
Fungicide
Headline
Malt Barley
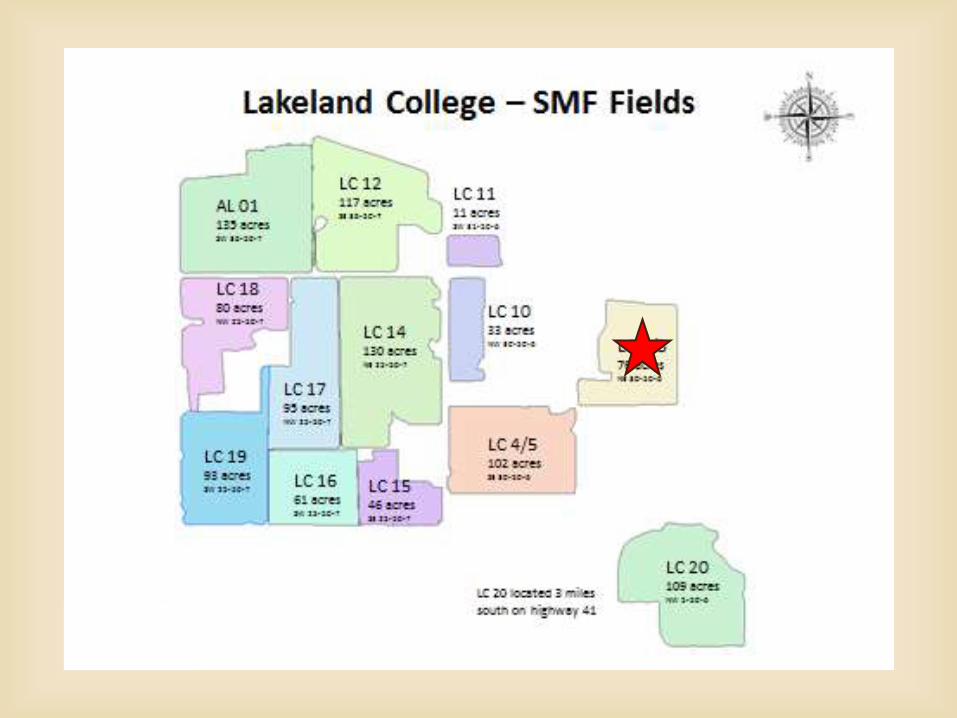
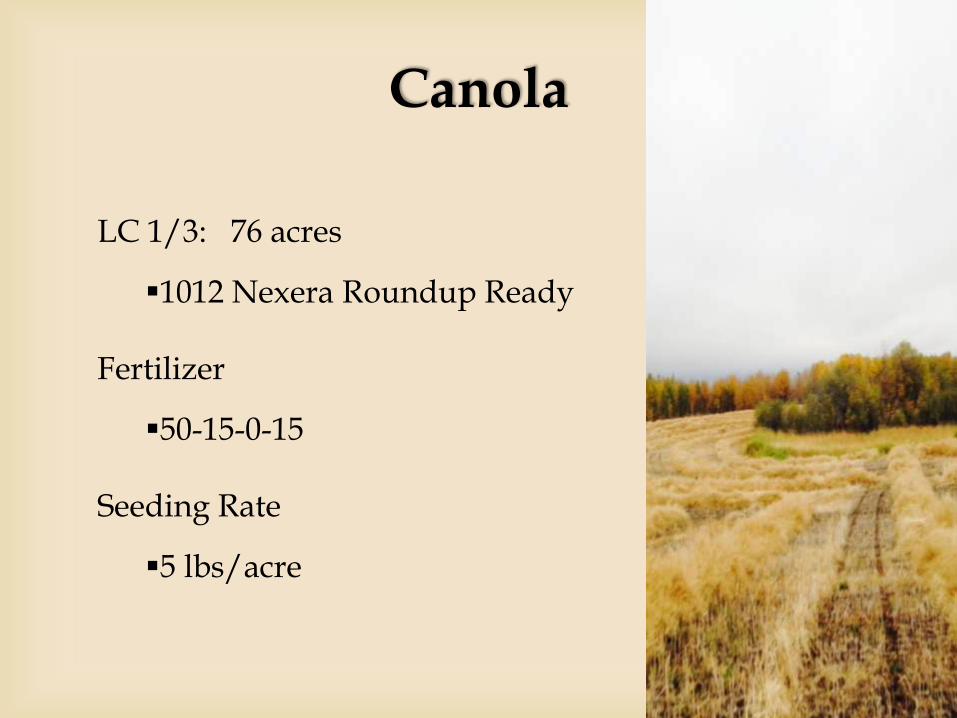
LC 1/3: 76 acres
1012 Nexera Roundup Ready
Fertilizer
50-15-0-15
Seeding Rate
5 lbs/acre
Canola
Herbicide
Pre Seed – Cleanstart
In Crop - Roundup
Fungicide
Vertisan
Insecticide
Decis
Canola
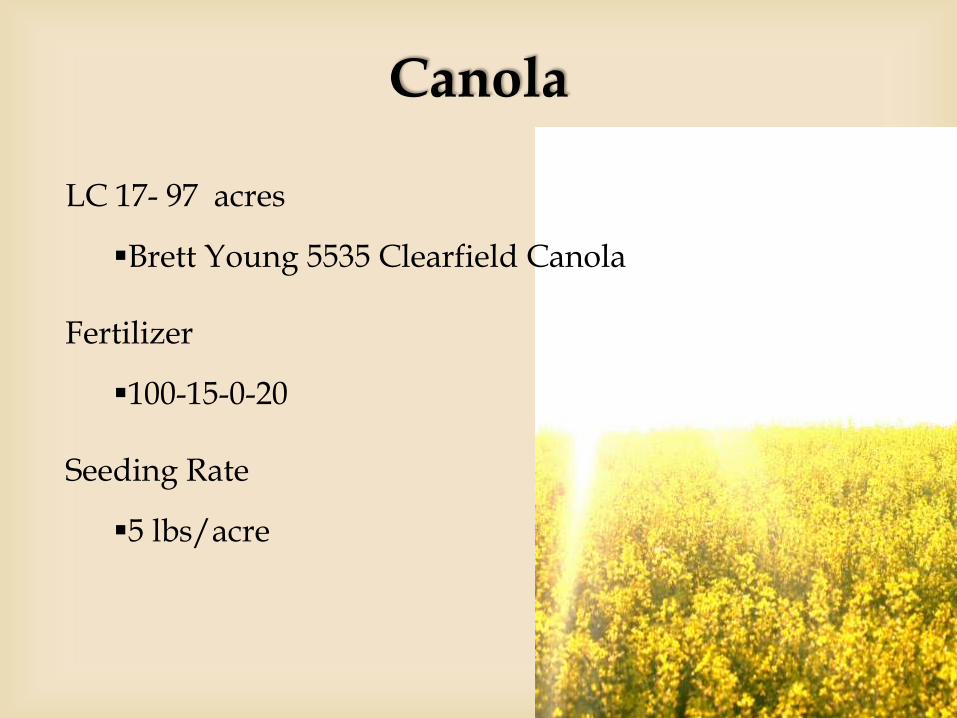
LC 17- 97 acres
Brett Young 5535 Clearfield Canola
Fertilizer
100-15-0-20
Seeding Rate
5 lbs/acre
Canola
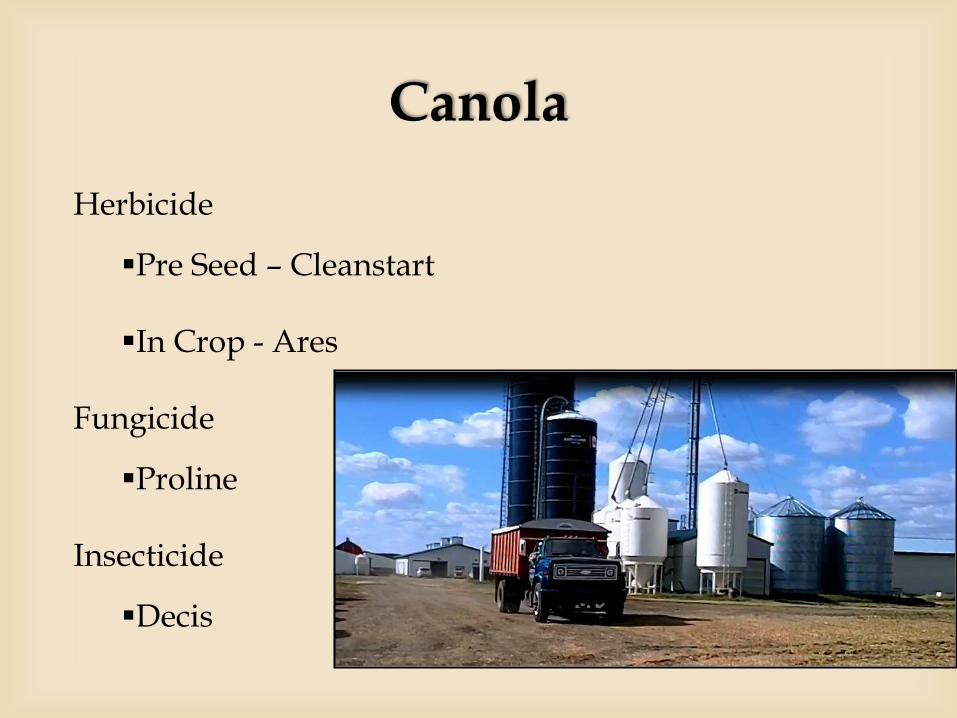
Herbicide
Pre Seed – Cleanstart
In Crop - Ares
Fungicide
Proline
Insecticide
Decis
Canola
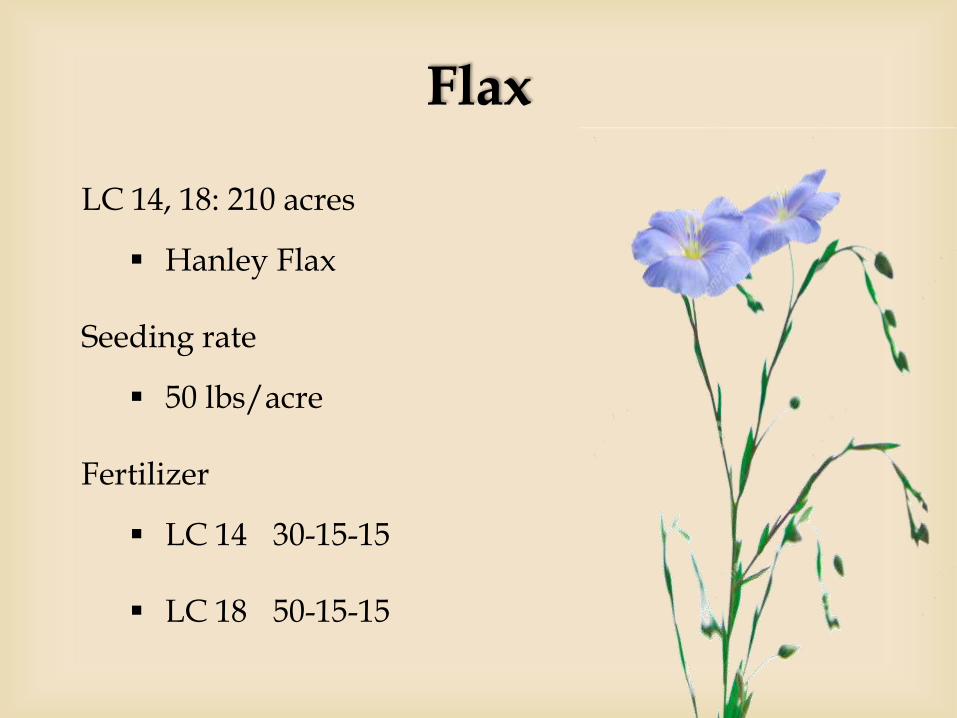
LC 14, 18: 210 acres
Hanley Flax
Seeding rate
50 lbs/acre
Fertilizer
LC 14 30-15-15
LC 18 50-15-15
Flax

Herbicide
Pre Seed – Cleanstart
In Crop - Curtail M, Assure
Desiccant
Reglone
Flax

LC12: 117acres
Harvest Wheat from our Bins
Fertilizer
30-15-15
Seeding Rate
105 lbs/acre
Wheat
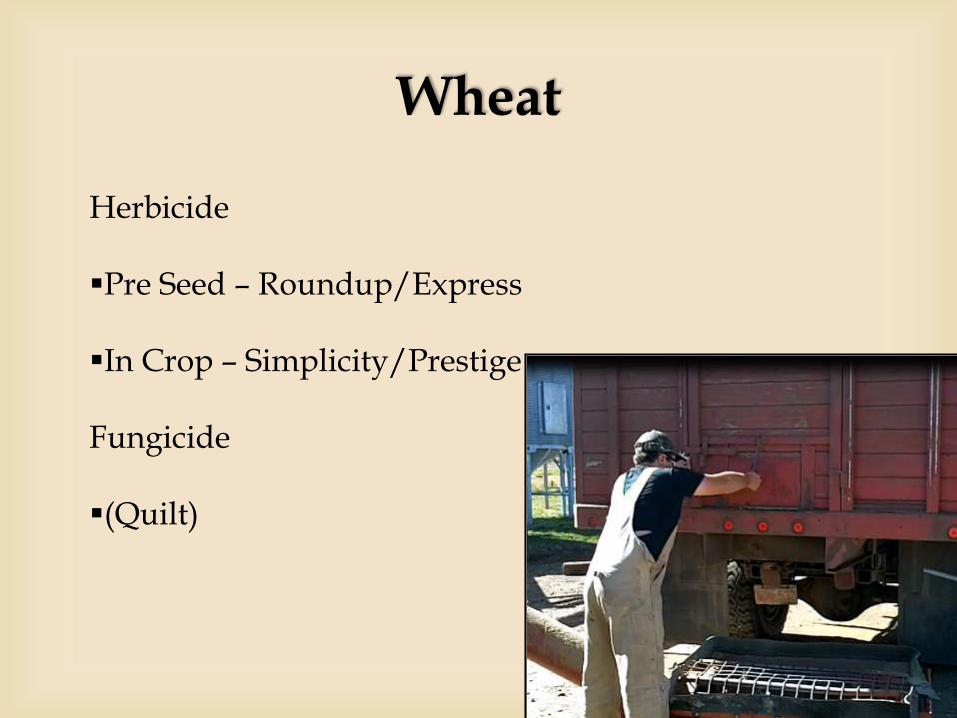
Herbicide
Pre Seed – Roundup/Express
In Crop – Simplicity/Prestige
Fungicide
(Quilt)
Wheat

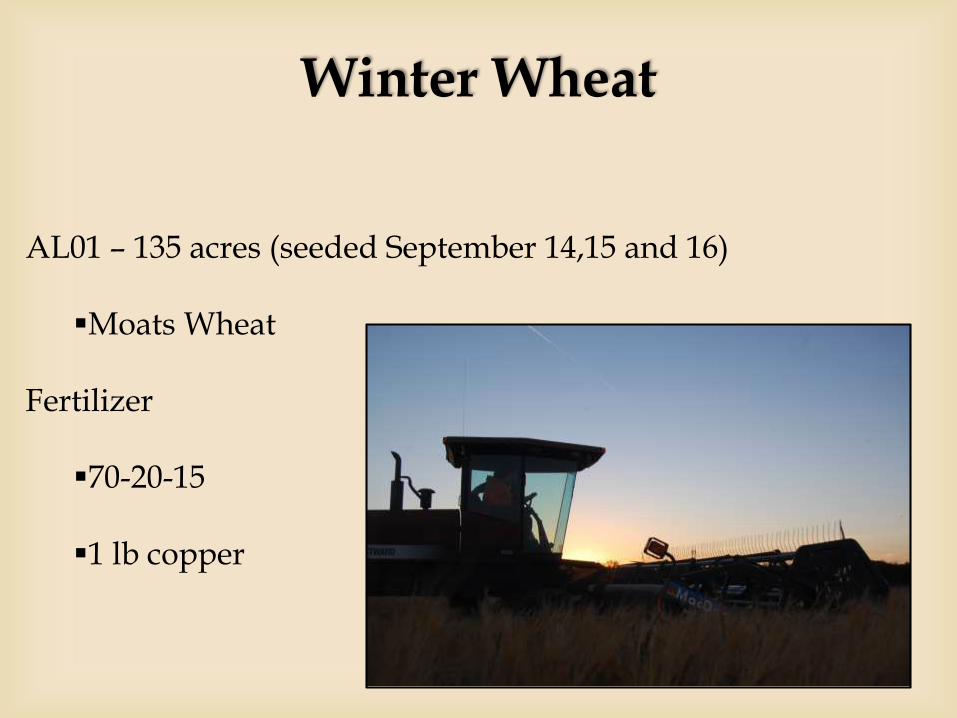
AL01 – 135 acres (seeded September 14,15 and 16)
Moats Wheat
Fertilizer
70-20-15
1 lb copper
Winter Wheat
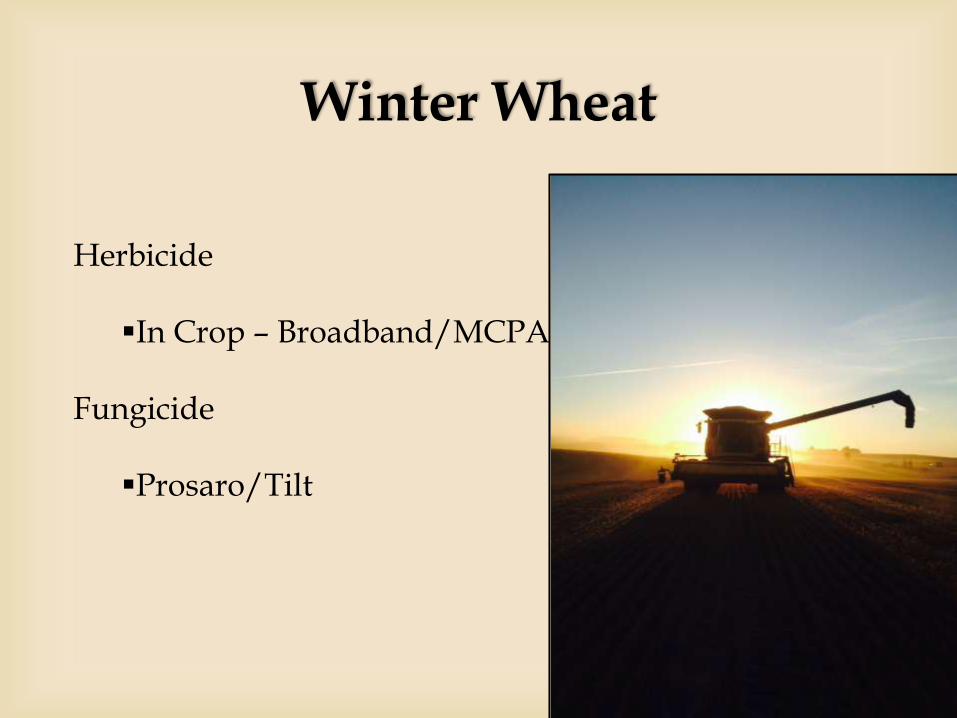
Winter Wheat
Herbicide
In Crop – Broadband/MCPA
Fungicide
Prosaro/Tilt
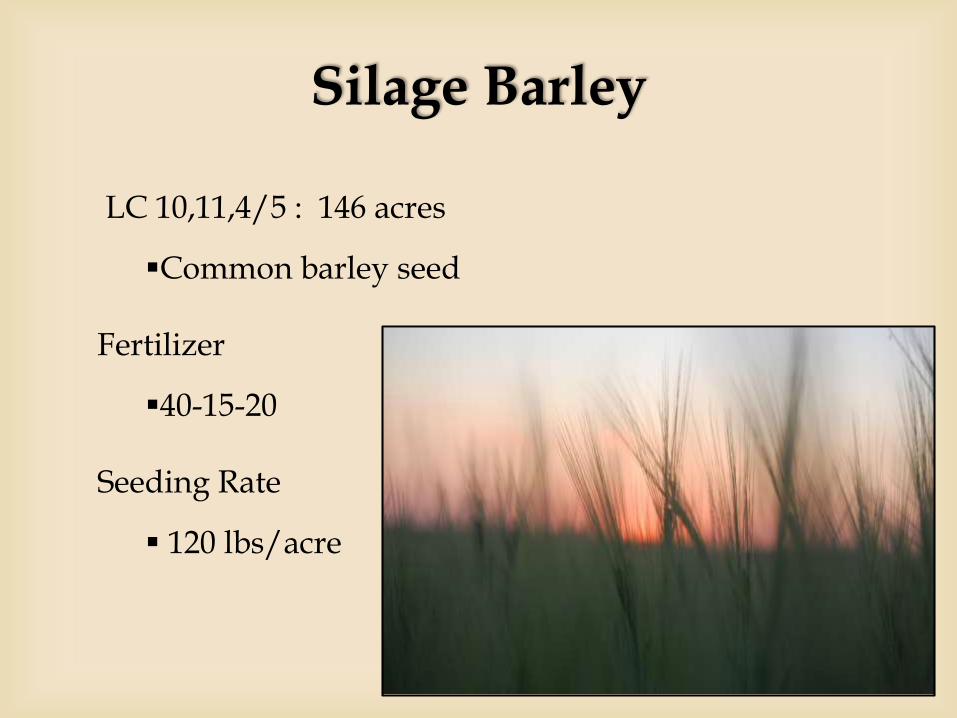
Silage Barley
LC 10,11,4/5 : 146 acres
Common barley seed
Fertilizer
40-15-20
Seeding Rate
120 lbs/acre
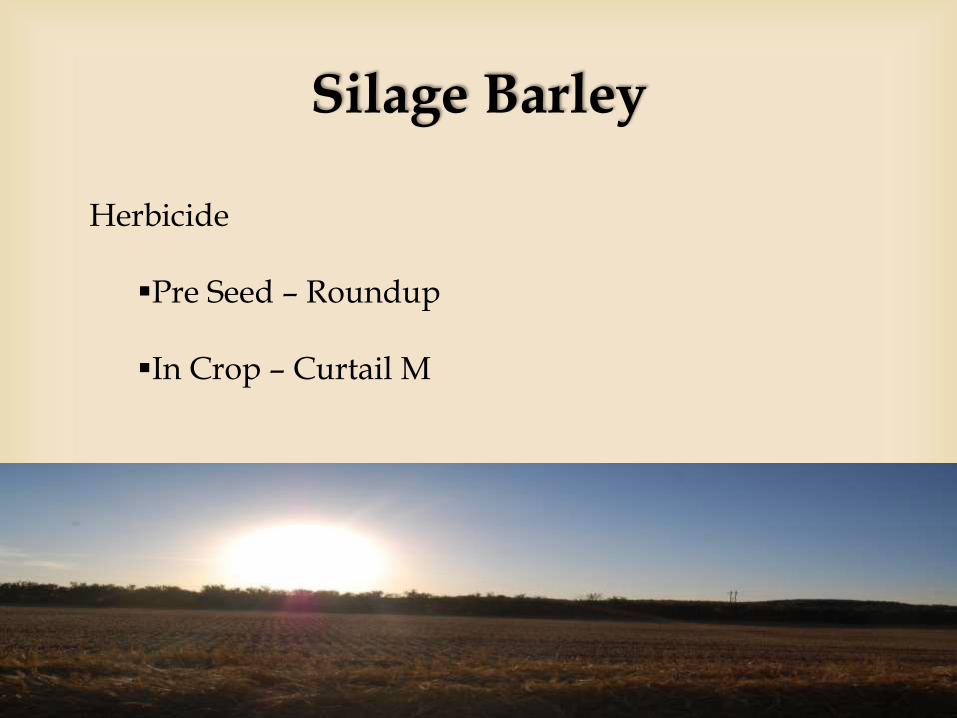
Herbicide
Pre Seed – Roundup
In Crop – Curtail M
Silage Barley
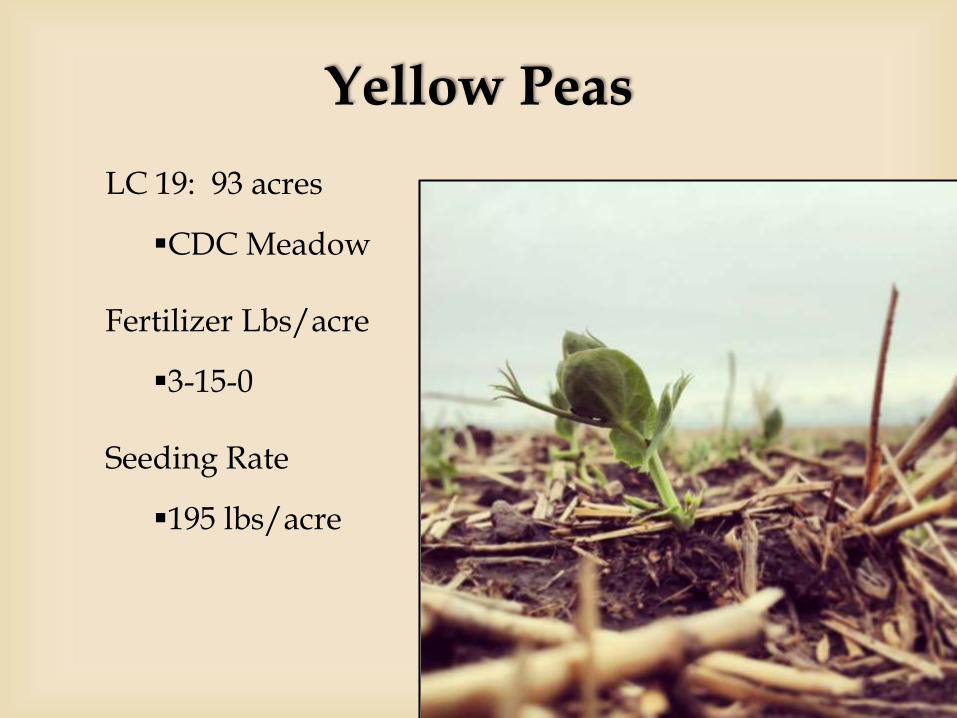
LC 19: 93 acres
CDC Meadow
Fertilizer Lbs/acre
3-15-0
Seeding Rate
195 lbs/acre
Yellow Peas
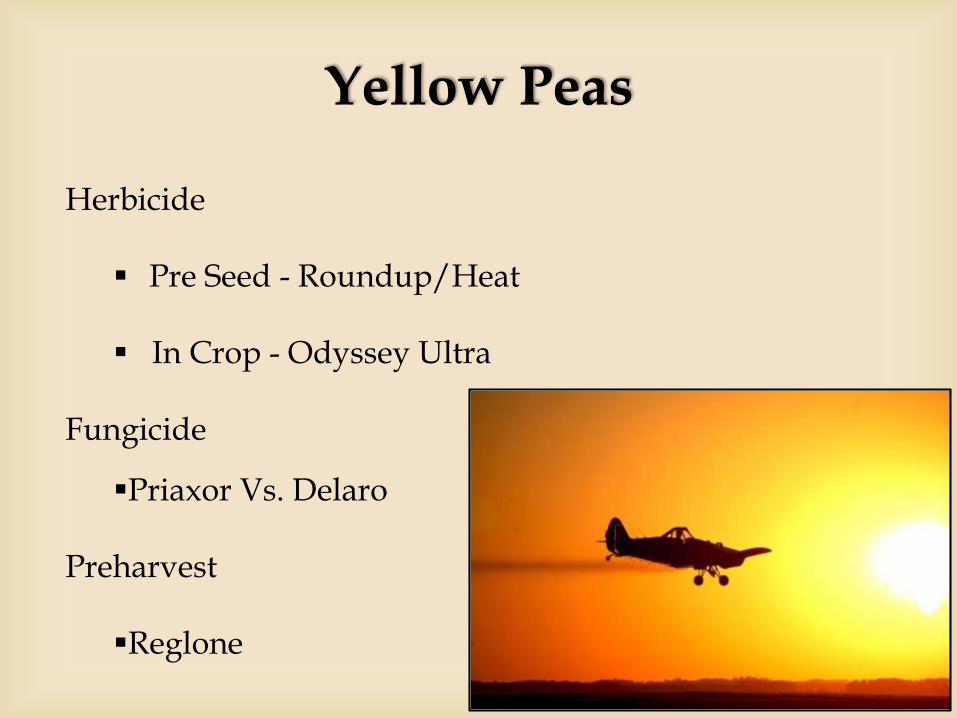
Herbicide
Pre Seed - Roundup/Heat
In Crop - Odyssey Ultra
Fungicide
Priaxor Vs. Delaro
Preharvest
Reglone
Yellow Peas
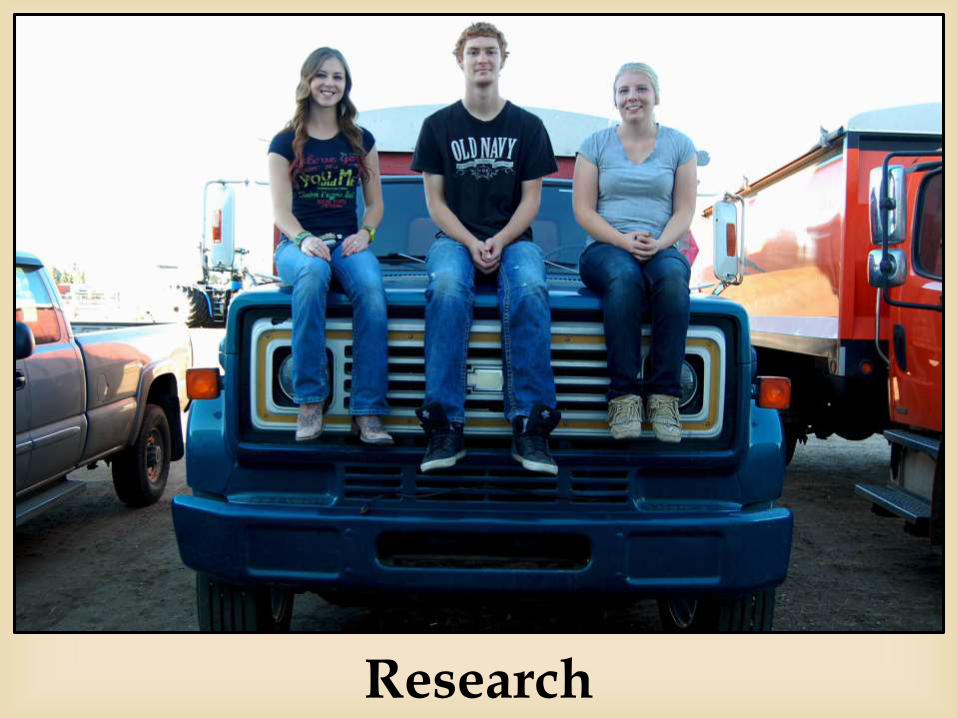
Research

Manager Role
Coordinate the use of college land for research
Create agenda for research meetings
Represent the research team at general meetings
Work with team players to accomplish goals
Team Player Roles
Attend general & research group meetings
In fall semester harvest industry trial plots
Moisture test and grade samples from combine
Attend steering committee meetings with local producers and industry representatives
Plan intensity trials for upcoming season

Richardson Wheat Trials
Harvested September 23, 2014
7 Varieties: 4 CWRS, 3 CPSR
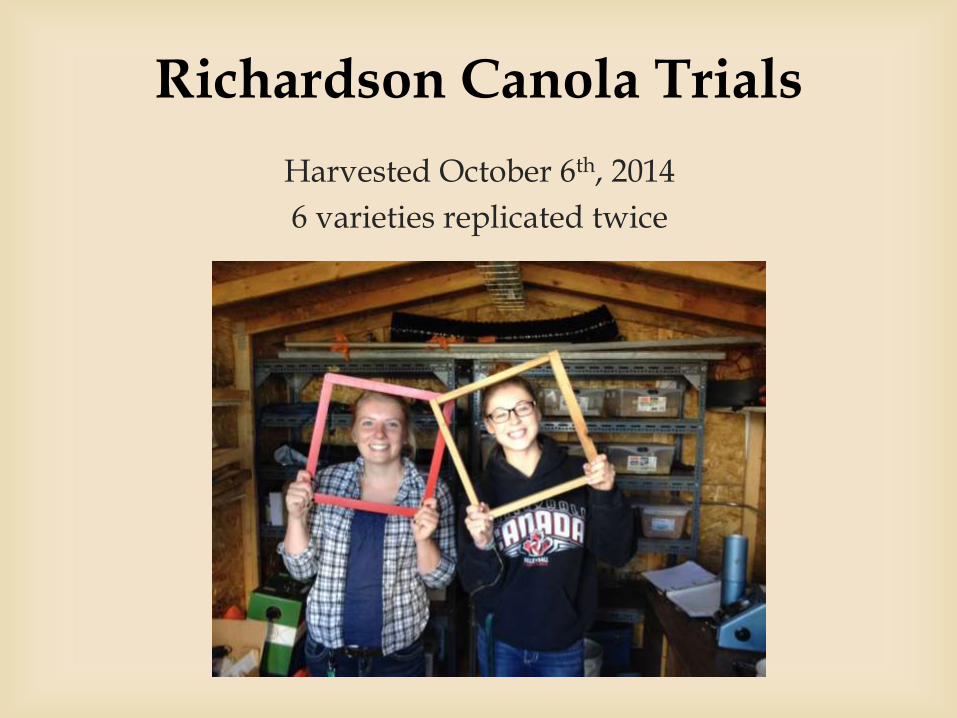
Richardson Canola Trials
Harvested October 6th, 2014
6 varieties replicated twice
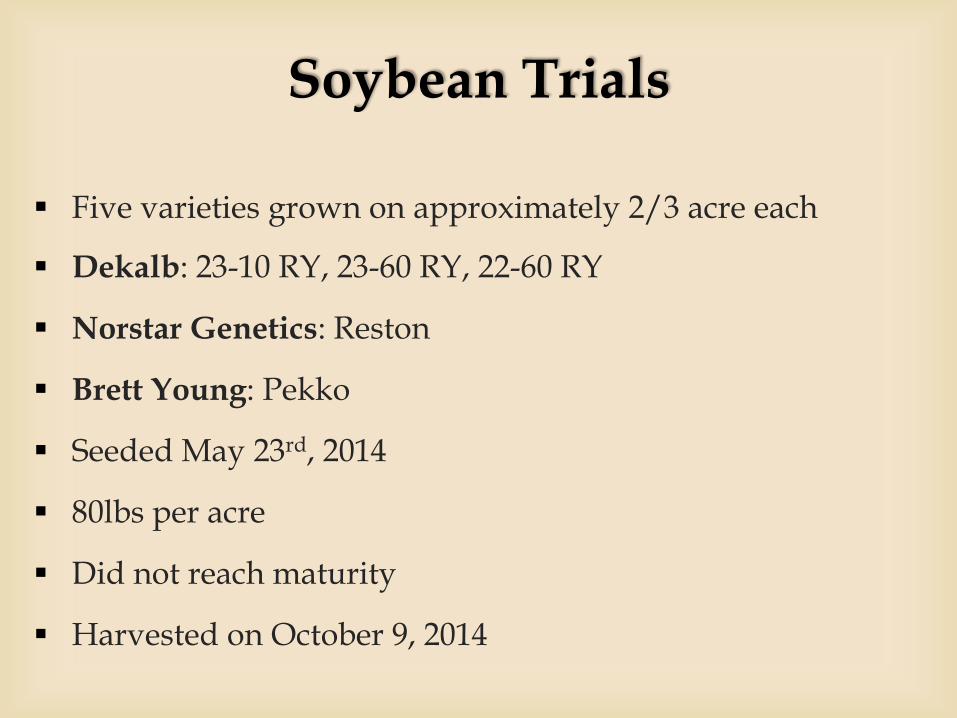
Soybean Trials
Five varieties grown on approximately 2/3 acre each
Dekalb: 23-10 RY, 23-60 RY, 22-60 RY
Norstar Genetics: Reston
Brett Young: Pekko
Seeded May 23rd, 2014
80lbs per acre
Did not reach maturity
Harvested on October 9, 2014
Dow AgroSciences
Crop Production Services
Brett Young
2015 Research Trials

Enhancing Crop Management Intensity Trials
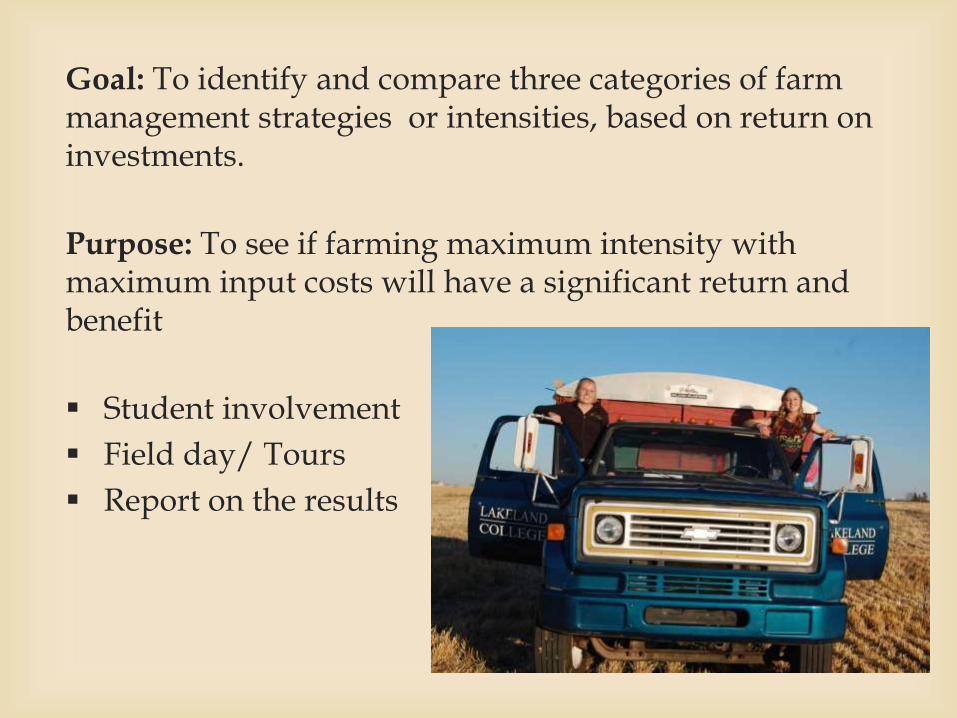
Goal: To identify and compare three categories of farm management strategies or intensities, based on return on investments.
Purpose: To see if farming maximum intensity with maximum input costs will have a significant return and benefit
Student involvement
Field day/ Tours
Report on the results

Experimental Treatments 2014
(R. Baron, 2014)

Results
Yields 2014(R. Baron, 2014)
Producer Field: College SMFTreatment A Yield Bu/Acre: 60.5Treatment B Yield Bu/Acre: 60.7Treatment C Yield Bu/Acre: 59.9Significant Difference: No
Producer Field: Sherwood FarmsTreatment A Yield Bu/Acre: 67.4Treatment B Yield Bu/Acre: 65.9Treatment C Yield Bu/Acre: 69.0Significant Difference: No
Producer Field: Gundiwindi FarmsTreatment A Yield Bu/Acre: 67.1Treatment B Yield Bu/Acre: 67.8Treatment C Yield Bu/Acre: 62.6Significant Difference: Yes
Producer Field: McLaughlin Agri-VenturesTreatment A Yield Bu/Acre: 66.4Treatment B Yield Bu/Acre: 65.4Treatment C Yield Bu/Acre: 67.9Significant Difference: No
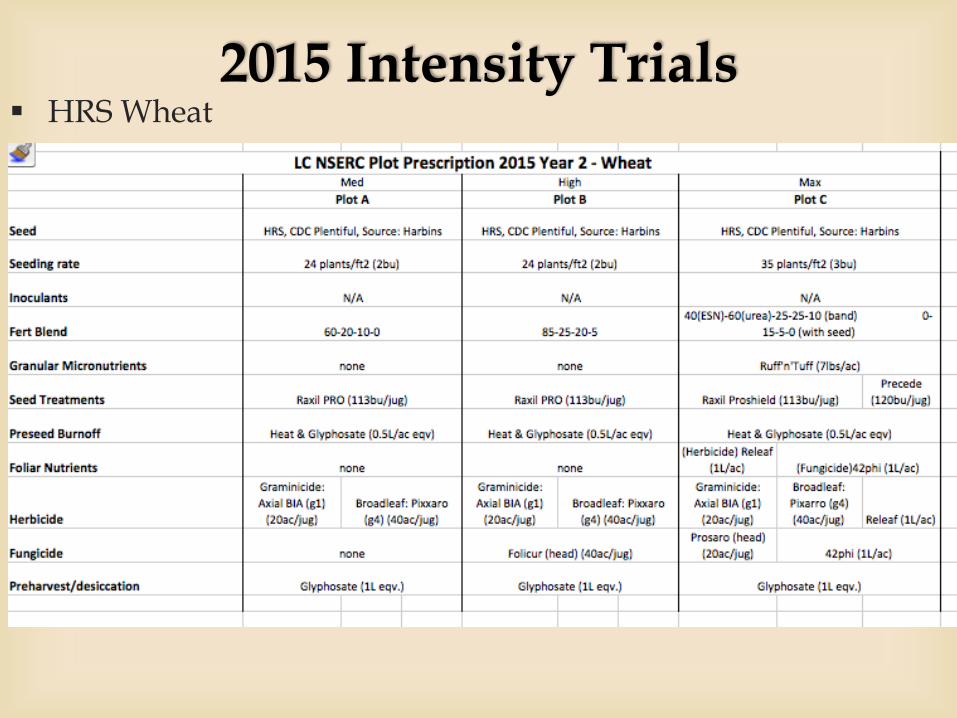
2015 Intensity Trials HRS Wheat

Public Relations
Roles And Responsibilities
Student Managed Farm representative to the public
Manage meetings each week with the Public Relation team
Delegate roles to each team member
Attend manager meetings

Event Management
Supper in the Field, Harvest Supper and Final Presentation
Organize contact information and send it out to the public
Informing first year students of planned events
Create PowerPoint presentations and videos to be displayed during events
Book venues and food for each event
Decorate

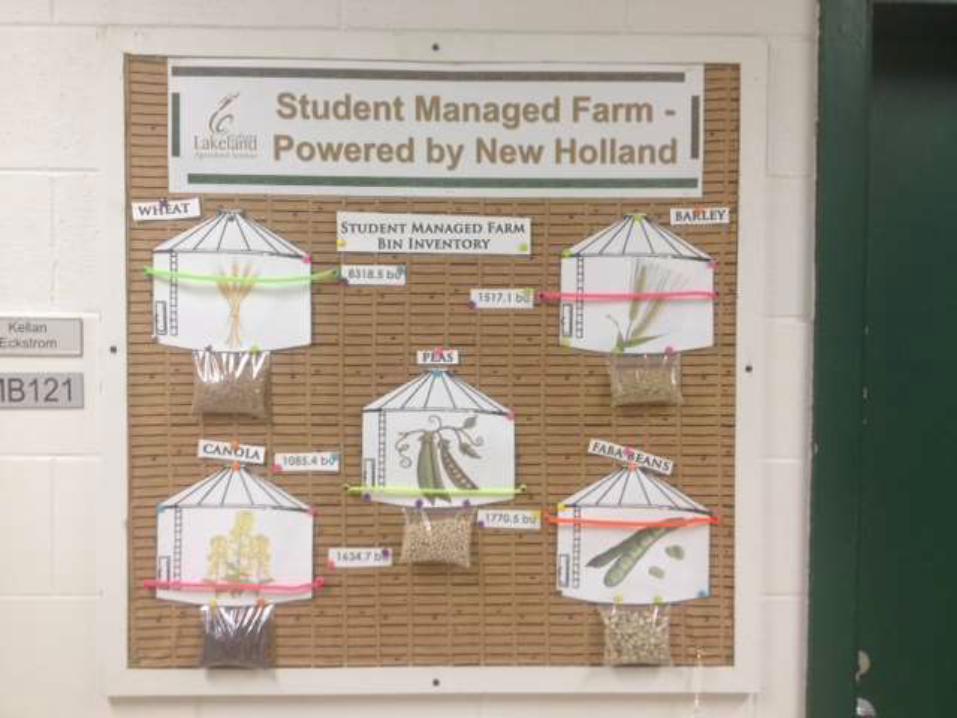
Display Bulletin Boards
Monthly update Design, pictures and information
Inventory management
Update weekly weather
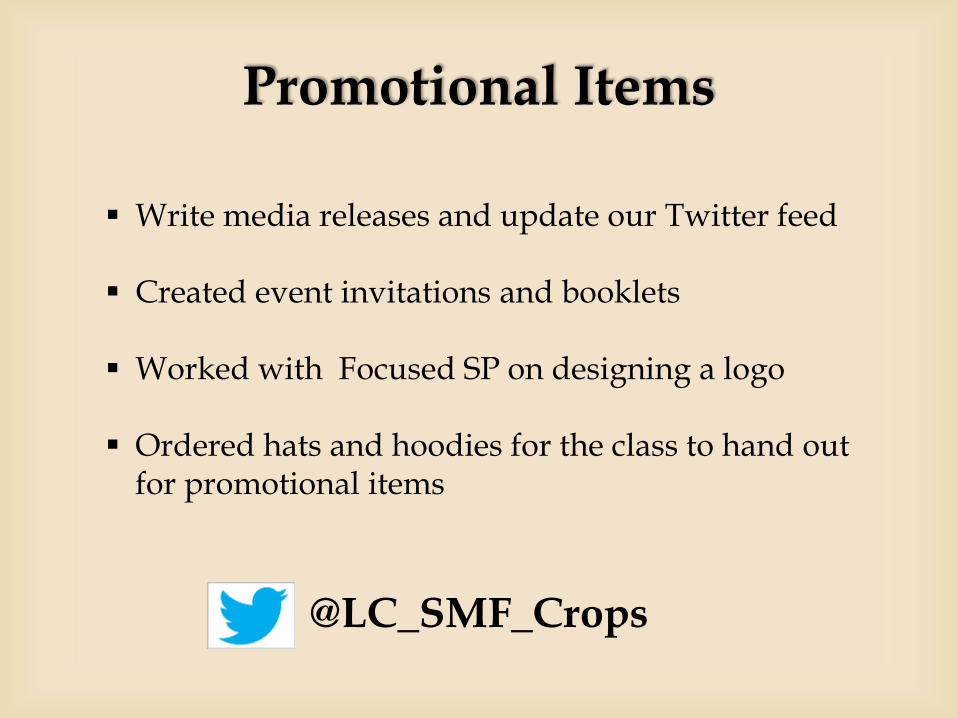
Promotional Items
Write media releases and update our Twitter feed
Created event invitations and booklets
Worked with Focused SP on designing a logo
Ordered hats and hoodies for the class to hand out for promotional items
@LC_SMF_Crops

AB Pulse Growers
Bayer CropScience
Cargill
Crop Production Services
Ducks Unlimited
DuPont
Erickson Farms
Durlowe Farm
Gundiwindi Farms
Lindholm Seed Farms
McLaughlin Agri-Ventures
Richardson Pioneer
Sherwood Farms
Webb’s Crop Service
Webb’s Machinery
Western Ag Services
Thank You