2015 Results Presentation · o Lower gold price and volumes o Lower realised moly price (> 50%...
31
Diego Hernández – CEO Iván Arriagada – Mining CEO Alfredo Atucha - CFO 2015 Results Presentation
Transcript of 2015 Results Presentation · o Lower gold price and volumes o Lower realised moly price (> 50%...

Diego Hernández –CEOIvánArriagada–Mining CEOAlfredo Atucha -CFO
2015 Results Presentation

Cautionary statement
This presentation has been prepared by Antofagasta plc. By reviewing and/orattendingthis presentation you agree to the following conditions.
This presentation contains forward-looking statements. All statements other than historical facts are forward-looking statements. Examples of forward-looking statements include those regarding the Group's strategy, plans, objectives or future operating or financial performance; reserve and resourceestimates; commodity demand and trends in commodity prices; growth opportunities; and any assumptions underlying or relating to any of theforegoing. Words such as “intend”, “aim”, “project”, “anticipate”, “estimate”, “plan”, “believe”, “expect”, “may”, “should”, “will”, “continue” and similarexpressions identify forward-looking statements. Forward-looking statements involve known and unknown risks, uncertainties, assumptions and otherfactors that are beyond the Group’s control. Given these risks, uncertainties and assumptions, actual results could differ materially from any future resultsexpressed or implied by these forward-looking statements, which speak only as of the date of this presentation. Important factors that could causeactual results to differ from those in the forward-looking statements include: global economic conditions; demand, supply and prices for copper; long-term commodity price assumptions, as they materially affect the timing and feasibility of future projects and developments; trends in the copper miningindustry and conditions of the international copper markets; the effect of currency exchange rates on commodity prices and operating costs; theavailability and costs associated with mining inputs and labour; operating or technical difficulties in connection with mining or development activities;employee relations; litigation; and actions and activities of governmental authorities, including changes in laws, regulations or taxation. Except asrequired by applicable law, rule or regulation, the Group does not undertake any obligation to publicly update or revise any forward-looking statements,whether as a result of new information, futureevents or otherwise.
Certain statistical and other information about Antofagasta plc included in this presentation is sourced from publicly available third party sources. Suchinformation presents the views of those thirdparties and may not necessarily correspond to the views held by Antofagasta plc.
This presentation is for information purposes only and does not constitute an offer to sell or the solicitation of an offer to buy shares in Antofagasta plc orany other securities in any jurisdiction. Further it does not constitute a recommendation by Antofagasta plc or any other person to buy or sell shares inAntofagastaplc or any other securities.
Past performance cannot be relied on as a guide to future performance.
2

Agenda
2015 Overview Operations review and
growth opportunities
Financial review Investment case
3

2015 Overview
4

Safety Performance
Safety First Culture
5
• Unacceptably, a fatality occurred at Michilla during the year
• Committed to zero fatalities
• 38% improvement in injury rate
• New safety and occupational health model being extended to contractors
Focus on:
o Early identification of key fatality and serious injury risks
o Reporting and investigating high-potential near misses
o On-the-ground senior safety leadership
0
1 2
5
1
3.2
2.6
2.11.9 2.0
0
1
2
3
4
5
6
2011 2012 2013 2014 2015
Fatalities LTIFR
Achieved 38% reduction in LTIFR

Position
Optimise
Discipline
The Group’s position in a challenging environment• Strong balance sheet• Competitive operating cost position• Re-setting community engagement• Preserving growth projects
Optimise our portfolio• Sale of water division• Bring Antucoya to full production• Purchase of TMM and stake in Zaldívar• Closure of Michilla
Maintain our discipline and flexibility• Cost control without increasing risk• Reduce development capital expenditure
without compromising future growth
2015 Year’s Highlights
6

vs. 2014 2015(1)
Revenue (34.0)% $3,394.6m• Lower realised copper prices (24% decline),
disruptions to production in Q1 and heavy rains in the Atacama Desert in Q2
EBITDA (58.4)% $890.7m• Revenues declined and lower production lead to
higher unit costs
Net earnings per share (98.6)% 0.6c• Lower realised copper price and sales, partly offset by
lower tax payable
Operating cash flow (65.8)% $858.3m• Operations continue to generate significant cash
despite the fall in revenue
Copper production (10.6)% 630.3kt• Lower production at Los Pelambres due to disruptions
in Q1 as well as lower grades. Lower production at Centinela and delayed ramp-up at Antucoya
Net cash costs 4.9% $1.50/lb• Lower gold production and lower realised
molybdenum prices
1. FY 2015 financials and comparatives for continuing operations
2015 overview Reducing costs and building a platform for long-term growth
7

Investment CaseResponding to uncertain times
8
• Strong and growing production
• Large resource base
• Low costs and long-life assets
• Four mines in two ‘world-class’ mining districts in Chile
Robust platform
Capital discipline
Cost control
High quality assets
• Focus on operating efficiencies through innovation and exploiting synergies
• Cost and Competitiveness Programme
• Strong and flexible balance sheet
• Manageable debt levels
• Consistence pay-out ratio dividend policy
• Continuing to optimise mines
• Lowering cost base for future upturn
• Disciplined approach to capital allocation
Creating value for shareholders
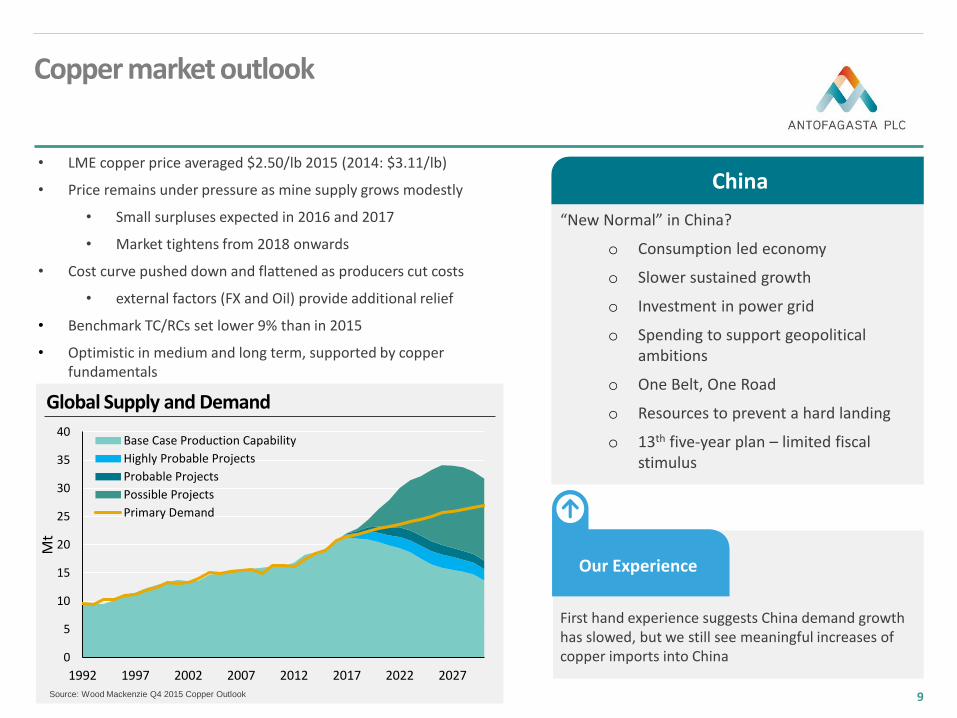
“New Normal” in China?
o Consumption led economy
o Slower sustained growth
o Investment in power grid
o Spending to support geopolitical ambitions
o One Belt, One Road
o Resources to prevent a hard landing
o 13th five-year plan – limited fiscal stimulus
Global Supply and Demand
0
5
10
15
20
25
30
35
40
1992 1997 2002 2007 2012 2017 2022 2027
Mt
Base Case Production Capability
Highly Probable Projects
Probable Projects
Possible Projects
Primary Demand
Source: Wood Mackenzie Q4 2015 Copper Outlook
• LME copper price averaged $2.50/lb 2015 (2014: $3.11/lb)
• Price remains under pressure as mine supply grows modestly
• Small surpluses expected in 2016 and 2017
• Market tightens from 2018 onwards
• Cost curve pushed down and flattened as producers cut costs
• external factors (FX and Oil) provide additional relief
• Benchmark TC/RCs set lower 9% than in 2015
• Optimistic in medium and long term, supported by copper fundamentals
Copper market outlook
9
China
Our Experience
First hand experience suggests China demand growth has slowed, but we still see meaningful increases of copper imports into China

Operations review and growth opportunities
10

Existing core business• Constant focus on cost management and compliance
• Delivery of production and cash cost guidance
• Continue to get the best possible performance from existing assets
• Proactive new approach with community and other stakeholders
Organic & sustainable growth of the core business• Complete Antucoya on budget
• Complete Centinela 105 ktpd expansion
• Progress Encuentro Oxides
• Complete Centinela Second Concentrator and Los Pelambres Incremental Expansion feasibility studies and advance permitting
Growth beyond the core business• Progress international exploration activities
• Continue optimisation of Twin Metals Minnesota pre-feasibility study
• Monitor potential acquisition opportunities
Strategy
11

Operations overview
12
Los Pelambres
Michilla Group
Lower throughput due to harder ore zone of the mine
Highest molybdenum production since 2012
Protests in Q1 2015
Lower grade
Throughput expansions progressing
Placed on care and maintenance at the end of 2015
Lower production at Los Pelambres and Centinela
Completed construction of Antucoya, with commissioning in Q2 2016
2014 2015
704,800t Cu 630,300t Cu(1)
C1 $1.43/lb C1 $1.50/lb
2014 2015
391,300t Cu 363,200t Cu
C1 $1.18/lb C1 $1.23/lb
2014 2015
266,600t Cu 221,100t Cu
C1 $1.63/lb C1 $1.85/lb
2014 2015
47,000t Cu 29,400t Cu
C1 $2.38/lb C1 $2.14/lb
1. Includes 4.4kt from Zaldívar and 12.2kt from Antucoya
Centinela
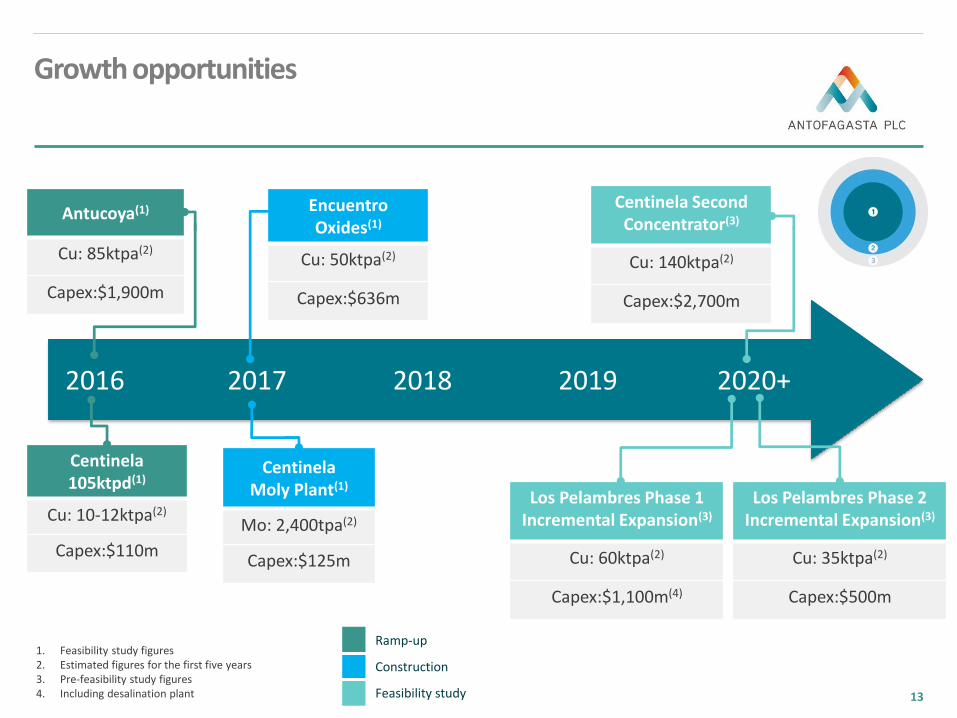
2016 2017 2018 2019 2020+
Centinela 105ktpd(1)
Cu: 10-12ktpa(2)
Capex:$110m
Antucoya(1)
Cu: 85ktpa(2)
Capex:$1,900m
Encuentro Oxides(1)
Cu: 50ktpa(2)
Capex:$636m
Los Pelambres Phase 1 Incremental Expansion(3)
Cu: 60ktpa(2)
Capex:$1,100m(4)
Centinela Second Concentrator(3)
Cu: 140ktpa(2)
Capex:$2,700m
Centinela Moly Plant(1)
Mo: 2,400tpa(2)
Capex:$125m
1. Feasibility study figures2. Estimated figures for the first five years3. Pre-feasibility study figures4. Including desalination plant
Ramp-up
Construction
Feasibility study
Growth opportunities
13
Los Pelambres Phase 2 Incremental Expansion(3)
Cu: 35ktpa(2)
Capex:$500m

Zaldívar
Zaldívar acquisition
14
• 50% from Barrick for $1.0 billion closed in Q4 2015,
• Antofagasta operator of the mine
• Rare opportunity to acquire good-quality copper asset in familiar jurisdiction
• Production growth as grade increases
• $15-20 million of synergies and cost savings targeted
• Upside potential through exploration of mine’s resources
• Capital intensity of $17,000/t annual production
2015(2) First 5 years(2)
Copper production (t) 103,300 100-150,000
Cash costs ($/lb) 1.74 1.30-1.70
Start of operation: 1998
Remaining mine life: 14 years
Reserves (P+P) (1): 455mt @ 0.55% Cu
Note: Attributable production for 2015 was 4,400 tonnes1. As of 31 December 20152. Full year figures. 100% of production.
Antucoya
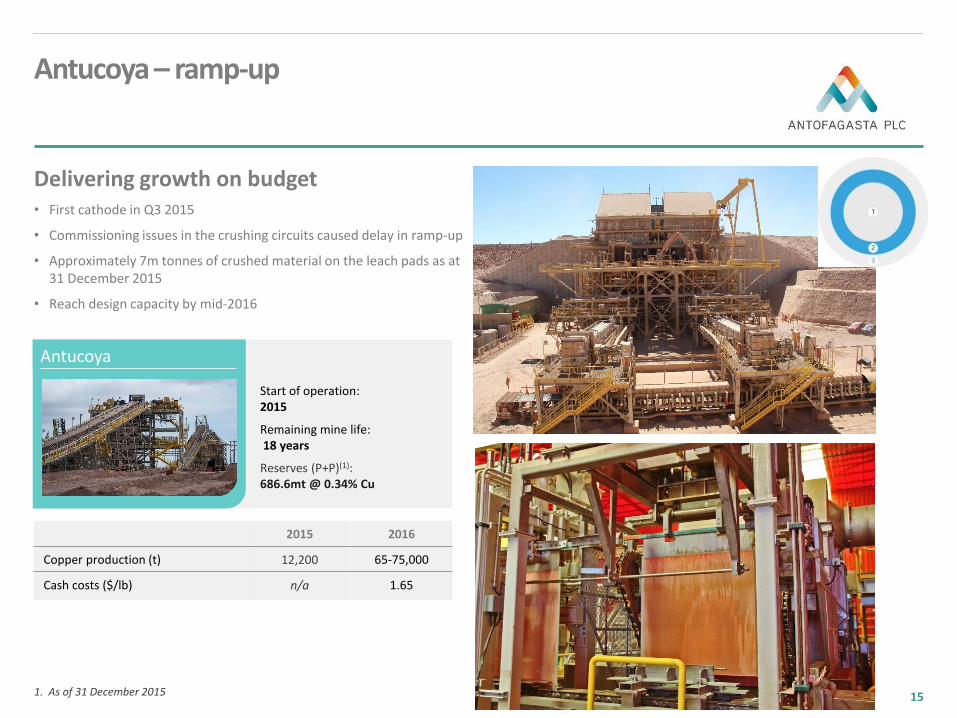
Antucoya – ramp-up
15
Delivering growth on budget• First cathode in Q3 2015
• Commissioning issues in the crushing circuits caused delay in ramp-up
• Approximately 7m tonnes of crushed material on the leach pads as at 31 December 2015
• Reach design capacity by mid-2016
Start of operation: 2015
Remaining mine life: 18 years
Reserves (P+P)(1):686.6mt @ 0.34% Cu
2015 2016
Copper production (t) 12,200 65-75,000
Cash costs ($/lb) n/a 1.65
1. As of 31 December 2015
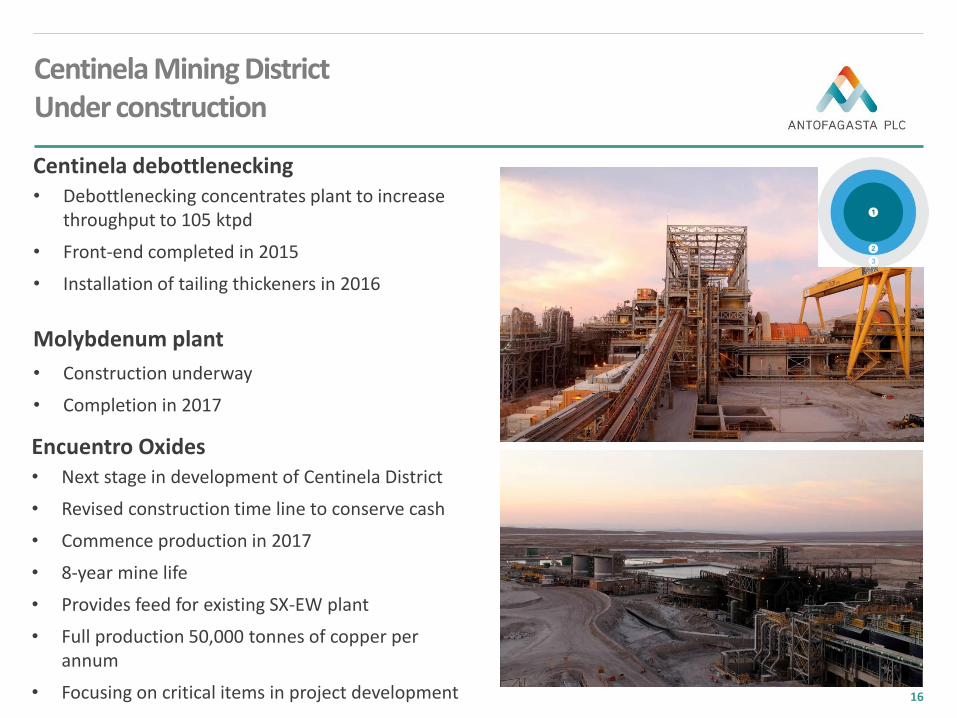
Encuentro Oxides • Next stage in development of Centinela District
• Revised construction time line to conserve cash
• Commence production in 2017
• 8-year mine life
• Provides feed for existing SX-EW plant
• Full production 50,000 tonnes of copper per annum
• Focusing on critical items in project development
Centinela debottlenecking • Debottlenecking concentrates plant to increase
throughput to 105 ktpd
• Front-end completed in 2015
• Installation of tailing thickeners in 2016
Molybdenum plant
• Construction underway
• Completion in 2017
Centinela Mining District Under construction
16

Centinela Second Concentrator
• Planned 2nd concentrator 7 km from current facilities
o Throughput: 90 ktpd
o Annual production:
• 140 kt copper
• 150 koz gold
• 3.0 kt molybdenum
• Two-phase growth:
o Phase 1 - 90 ktpd
o Phase 2 - +50 ktpd
• EIA submitted to authorities in Q2 2015
• Slowed feasibility study, focusing on critical path items
• Earliest investment decision 2017
10km
Centinela Mining District Future development
17

Phase 1
• Maximising throughput under existing permits
• Throughput capacity to 190 ktpd + desalination plant
• New grinding and flotation circuit to counter the increasing hardness of the ore
• Estimated capex of $1.1 billion including desalination plant and water pipeline
• Desalination and water pipeline EIA submission in 2016
• Earliest investment decision in late 2017
Phase 2
• Throughput expansion to 205 ktpd
• Mine life extension beyond 2037 with increases in capacity of tailings facility and waste rock dumps
• Repower conveyors from primary crusher to concentrator
• Estimated capex of $500 million
• EIA submission in 2018
Los Pelambres Incremental ExpansionPhased development
18

Twin Metals Minnesota Project
• 2.4 billion tonne resource containing copper, nickel and PGMs
• Optimising pre-feasibility study
• Consolidated ownership of project
• Advancing permitting process
Exploration and evaluation
• Chile and internationally
• Reduced exploration and evaluation as part of cost savings programme
Further growth opportunities Beyond 2020
19

2015 Performance and Guidance
20
2015 Net Cash Cost
1.50/lb
2016 Guidance
1.35/lb
2015 Production
213,900 oz
2016 Guidance
245,000- 275,000 oz
2015 Production
10,100 t
2016 Guidance
8,000 – 9,000t
2015 Production
630,300 t
2016 Guidance
710,000 - 740,000 t
MoAu $/lbCu
Production and cost improvements to offset another challenging year
Financial review
21

Turnover 2015 vs 2014 ($m)
3
5
7
9
11
13
15
31
De
c 1
3
30
Jun
14
31
De
c 1
4
30
Jun
15
31
De
c 1
5
180
220
260
300
340
31
De
c 1
3
30
Ju
n 1
4
31
De
c 1
4
30
Ju
n 1
5
31
De
c 1
5
Revenue declined by 34.0%o Mainly as a result of lower copper prices and sales volumeso Lower gold price and volumeso Lower realised moly price (> 50% lower), partly offset by
higher volumes
$(1,752)m
1. Restated to include results of continuing operations only
Weaker commodity price environment
22
Copper price
Gold price
Molybdenum price
1,000
1,100
1,200
1,300
1,400
31-
Dec
-13
30-
Jun
-14
31-
Dec
-14
30-
Jun
-15
31-
Dec
-15
5,146
(1,556) (187) (9)3,394
2014 Copper By-products Transport 2015

Cash costs before by-product credits ($/lb) - by cost type
Cash costs before by-product credits ($/lb) - by operation
$1.83/lb $1.81/lb
(0.02) (0.02)
0.03
(0.01)
2014FY Los Pelambres Centinela Michilla Zaldívar 2015FY
($0.02/lb)
2015 Unit cash costs
23
($0.02/lb)
$1.83/lb $1.81/lb(0.07) 0.24 (0.11)(0.10)
0.02
2014FY Fx & Inflation Strategic… Lower Production TC/RCs Savings 2015FYInput prices (1)
1. Energy, diesel and acid

EBITDA FY 2015 vs FY 2014 ($m)
2,141
(1,556)(187)
433 66
(1) (5)
891
EBITDA FY2015 vs FY2014 - Variance Analysis ($m)
$(1,250)m
31.4% EBITDA Margin
26.2% EBITDA Margin
1. Results of continuing operations only
(1)
EBITDA
24

Net earnings FY 2015 vs FY 2014 ($m)
422
542
297 (1,250)
(28) 25 (3) 50
200
400
600
800
1,000
1,200
1,400
FY 2014 Tax Non-controllinginterests
EBITDA Depreciation andamortisation
Finance costs Others FY 2015
Net earnings
25
($417)m
(1)
1. Results of continuing operations only
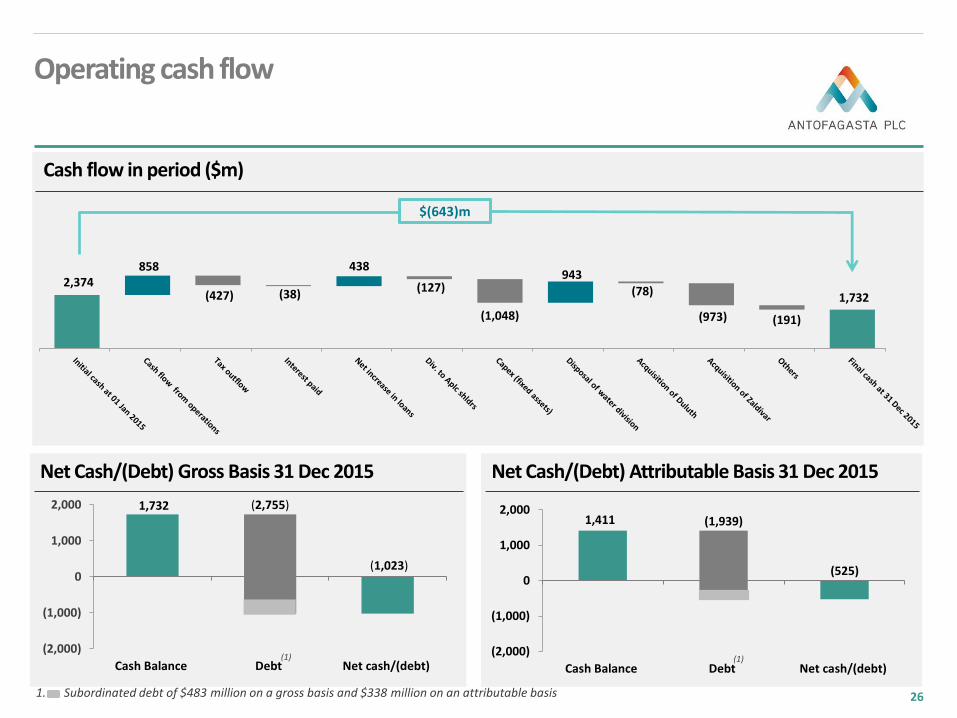
Net Cash/(Debt) Gross Basis 31 Dec 2015
1,732 (2,755)
(1,023)
(2,000)
(1,000)
0
1,000
2,000
Cash Balance Debt Net cash/(debt)
Net Cash/(Debt) Attributable Basis 31 Dec 2015
1,411 (1,939)
(525)
(2,000)
(1,000)
0
1,000
2,000
Cash Balance Debt Net cash/(debt)
Cash flow in period ($m)
Operating cash flow
26
$(643)m
1. Subordinated debt of $483 million on a gross basis and $338 million on an attributable basis
2,374 858
(427) (38)
438
(127)
(1,048)
943 (78)
(973) (191)
1,732
(1) (1)

E&E and Corp Costs ($m)
Mine Site Costs
Gross Cash Costs (c/lb)
Operating cost savings
2015$246m of savings achieved
183 181
(5) (10)
24
168
102
90
62
2014 2015Exploration Corporate
(36%)
Corporate Costs• $152m ($0.11/lb) of
savings • Cumulative savings of
$190m since start of CCP(1)
• $94m of Exploration & Evaluation, and Corporate costs savings
• Cost control without increasing risk
Exploration & Evaluation
1. Cost and Competitiveness Programme2. Energy, diesel and acid
(11)
2016$160m of savings targeted
Services Productivity:
Improving productivity and quality of contracts while reducing costs
Operational & Maintenance Management
Improving performance of critical processes and standardising maintenance management
Corporate & Organisational Effectiveness
Reducing corporate costs and restructuring corporate functions
Energy Efficiency
Improving energy pricing and consumption efficiency
27
Target Areas
• Additional $160 million from mine site costs , +6% of 2015 costs, already included in 2016 guidance
• Target wider group of contractors for cost reduction• Evaluating organisational structures and effectiveness
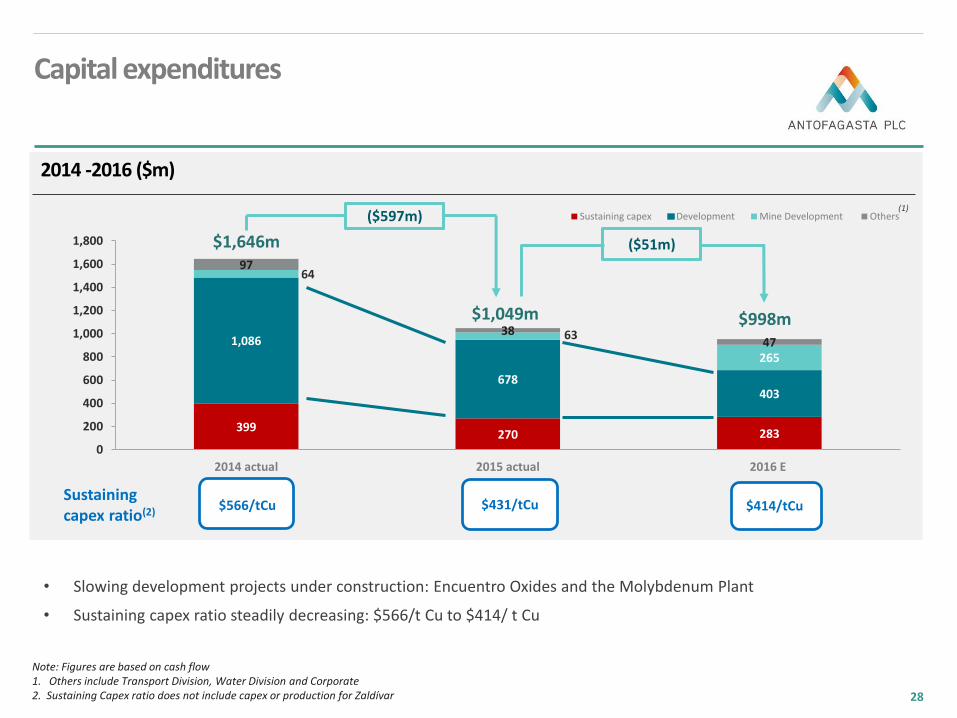
2014 -2016 ($m)
$1,049m $998m
($597m)
($51m)$1,646m
Note: Figures are based on cash flow 1. Others include Transport Division, Water Division and Corporate 2. Sustaining Capex ratio does not include capex or production for Zaldívar
• Slowing development projects under construction: Encuentro Oxides and the Molybdenum Plant
• Sustaining capex ratio steadily decreasing: $566/t Cu to $414/ t Cu
Sustaining capex ratio(2) $566/tCu $431/tCu $414/tCu
Capital expenditures
28
(1)
399270 283
1,086
678403
64
63
265
97
3847
0
200
400
600
800
1,000
1,200
1,400
1,600
1,800
2014 actual 2015 actual 2016 E
Sustaining capex Development Mine Development Others

Investment case
29

Investment CaseResponding to uncertain times
30
• Strong and growing production
• Large resource base
• Low costs and long-life assets
• Four mines in two ‘world-class’ mining districts in Chile
Robust platform
Capital discipline
Cost control
High quality assets
• Focus on operating efficiencies through innovation and exploiting synergies
• Cost and Competitiveness Programme
• Strong and flexible balance sheet
• Manageable debt levels
• Consistence pay-out ratio dividend policy
• Continuing to optimise mines
• Lowering cost base for future upturn
• Disciplined approach to capital allocation
Creating value for shareholders

www.antofagasta.co.uk