
2015 Report on Tuberculosis Research Funding Trends, 2005–2014
60
2015 Report on Tuberculosis Research Funding Trends, 2005–2014: A Decade of Data November 2015 Treatment Action Group By Mike Frick
Transcript of 2015 Report on Tuberculosis Research Funding Trends, 2005–2014

1
2015 Report on Tuberculosis
Research Funding Trends, 2005–2014:
A Decade of Data
November 2015
Treatment Action Group
By Mike Frick

ACKNOWLEDGMENTS
Treatment Action Group is grateful to all of the participating TB R&D funders that make this report possible and to the Stop TB Partnership and the TB Alliance for supporting the writing of this report. Mike Frick would like to thank Tomás Rodríguez Peña for his help collecting data from TB R&D funders in Latin America and Audrey Kaem for providing the quiet space in Boerum Hill, Brooklyn, New York, where this report was written.
ABOUT TAG
Treatment Action Group is an independent AIDS research and policy think tank fighting for better treatment, a vaccine, and a cure for AIDS.
TAG works to ensure that all people with HIV receive lifesaving treatment, care, and information. We are science-based treatment activists working to expand and accelerate vital research and effective community engagement with research and policy institutions. TAG catalyzes open collective action by all affected communities, scientists, and policy makers to end AIDS.
TB/HIV PROJECT
Treatment Action Group’s TB/HIV Project works to strengthen global and U.S.-focused advocacy to increase funding and ensure ambitious research, programs, and policies for people with TB and HIV.
Mike Frick is a TB/HIV project officer at TAG. He holds a bachelor’s degree in international studies and Chinese from Kenyon College and a master of science degree in global health and population from the Harvard School of Public Health.
CONTACT TAG
Treatment Action Group 261 Fifth Avenue, Suite 2110
New York, NY 10016 USA Tel 1.212.253.7922 Fax 1.212.253.7923
www.treatmentactiongroup.org
ISBN 978-0-9905242-4-3
© 2015 by Treatment Action Group
May be copied with attribution for noncommercial use.
Layout by Hollander Snow Studio, Inc.

2015 Report on Tuberculosis Research Funding Trends, 2005–2014: A Decade of Data
NOVEMBER 2015
TREATMENT ACTION GROUP
BY MIKE FRICK
EDITED BY ANDREA BENZACAR, MARK HARRINGTON, AND ERICA LESSEM


DEDICATION
This report is dedicated to all people around the world who participate in TB clinical trials.
Transformative progress in TB research requires adequate funding, as the analysis in this report shows. But even more than money, advances in TB research depend on the informed and voluntary participation of peo-ple with or at risk of contracting TB. The people around the world who agree to participate in TB clinical trials do so knowing that others, rather than themselves, will likely experience the primary rewards of research. Even the best-designed clinical trials carry risk, and some research participants may give their lives to im-prove TB treatment and prevention. The individuals who participate in research face not only opportunity but also uncertainty and, in doing so, embody hope for personal and collective futures free of TB. Yet their contributions are often unappreciated. To recognize their acts of generosity and selflessness, TAG dedicates this report to them.


TABLE OF CONTENTS
EXECUTIVE SUMMARY 1
INTRODUCTION 3
TABLE 1. CHANGES IN TB R&D FUNDING, 2005–2014 3
FIGURE 1. ANNUAL GLOBAL PLAN RESEARCH FUNDING TARGETS VERSUS 2014 FUNDING 4
FIGURE 2. TOTAL TB R&D FUNDING, 2005–2014 5
TABLE 2. TB R&D FUNDERS BY RANK, 2014 6
METHODOLOGY 9
LIMITATIONS 10
RESULTS 11
TRENDS IN TB R&D FUNDING BY FUNDER CATEGORY 11
FIGURE 3. TOTAL TB R&D FUNDING BY FUNDER CATEGORY, 2014 11
FIGURE 4. TOTAL TB R&D FUNDING BY FUNDER CATEGORY, 2005–2014 12
TRENDS IN TB R&D FUNDING BY RESEARCH CATEGORY 13
FIGURE 5. TOTAL TB R&D FUNDING BY RESEARCH CATEGORY, 2005–2014 13
FIGURE 6. TOTAL TB R&D FUNDING BY RESEARCH CATEGORY, 2014 14
FIGURE 7. BASIC SCIENCE 15
FIGURE 8. DIAGNOSTICS 17
FIGURE 9. DRUGS 19
FIGURE 10. VACCINES 22
FIGURE 11. OPERATIONAL RESEARCH 24
FIGURE 12. PEDIATRIC TB R&D FUNDING BY RESEARCH CATEGORY, 2014 26
TABLE 3. PEDIATRIC TB R&D FUNDERS BY RANK, 2014 27
TRENDS IN TB R&D FUNDING AMONG PRODUCT DEVELOPMENT PARTNERSHIPS 29
FIGURE 13. TOTAL TB R&D SPENDING BY PDPS, 2005–2014 29
THE WAY FORWARD: HOW TO END THE LONG WAIT FOR FUNDING 31
FIGURE 14. COUNTRY FUNDING FOR TB R&D, 2014 32
TABLE 4. COUNTRY FUNDING FOR R&D AND TB R&D AS A PERCENTAGE OF GDP 34
CONCLUSION 38
ENDNOTES 39
APPENDIX 1. TOP REPORTING TB R&D FUNDERS, 2014 42
APPENDIX 2. TB EXPERTS INTERVIEWED BY TAG 50


1
Executive SummaryWorking in tuberculosis (TB) research has long meant laboring with too little and waiting for what comes too late. In recent years, an emergent optimism has crept into TB research, but too often the individuals and institutions that comprise the TB research field find their good ideas and energy put on hold by insufficient funding. Ten years of data collected by Treatment Action Group (TAG) show that funding shortfalls for TB research and development (R&D) are serious and chronic. The modest gains in TB research funding from 2005 to 2009 have stagnated in the five years since, and total funding for TB R&D has never exceeded $700 million per year. Throughout the 2005–2014 period, over half of TB research funding has come from public institutions, with a significant decline in industry investment and little growth or increased diversity in philanthropic support. This trend continued in 2014, when funding for TB R&D totaled $674.0 million, 62 percent of it from public agencies. This lack of funding has left TB researchers waiting for the resources required to put new ideas to the test and now threatens to forestall the TB community’s ambitious vision for the future: a world free of TB.
TAG has tracked global spending on TB R&D each year since 2005, measuring actual funding levels against the targets set forth in the Stop TB Partnership’s Global Plan to Stop TB. The situation in 2014, our 10th year of data collection, looks much as it did in 2009. In that year, funding for TB R&D crossed the $500 million mark for the first time, reaching $636.9 million, a jump of 29 percent from the $494.6 million spent in 2008. This sizeable increase came from a single source (the United States government) responding to an emergency (the global financial crisis) with exceptional measures (stimulus money). By lifting the budget of the U.S. National Institutes of Health (NIH), U.S. stimulus spending under the American Recovery and Reinvestment Act set a benchmark that TB research has maintained in the years since 2009. But the field has not pushed past this mark to reach the higher levels of funding required to achieve transformational science. Instead, in 2014, total TB R&D spending of $674.0 million left a funding gap of $1.3 billion mea-sured against the $2 billion annual investment experts called for in the Global Plan to Stop TB 2011–2015. Funding shortfalls persist in every category of research tracked by TAG—from basic science, to the develop-ment of new diagnostics, drugs, and vaccines, to operational research on their delivery and implementation.
As this decade of missed targets closes, researchers are still waiting for the funding that never arrived. During this wait, people with TB—and their families, caregivers, and communities—are left to face the epi-demic without the new drugs, drug regimens, diagnostic tests, and vaccines necessary to end it. The present moment is one that invites reflection, not just backward in time, where missed opportunities and lost lives cast long shadows, but also forward into the next decade, where new aspirations light the horizon.
And the horizon is close. Within the TB field, the World Health Organization’s (WHO’s) End TB Strategy has set an ambitious goal of eliminating TB by 2035 by reducing TB deaths by 95 percent and new cases of TB by 90 percent compared with 2015 levels. The Stop TB Partnership’s revised Global Plan to Stop TB, 2016–2020 maps out what the global community must do within the next five years to eliminate TB. Within the larger global health arena, the Millennium Development Goals (MDGs) are giving way to the Sus-tainable Development Goals (SDGs), with their dense forest of 17 goals and 169 targets.1 In the MDGs, TB was relegated to the catchall category of “other diseases” and not named alongside HIV and malaria in the title of MDG 6.2 The specific mention of TB with HIV and malaria in SDG 3 offers hope that the most lethal pathogenic killer in human history will finally garner the political attention that it deserves. Despite TB’s re-surgence alongside the HIV epidemic in the 1990s, and its stubborn persistence in the first 15 years of the twenty-first century, TB has never summoned the political will, financial investment, and scientific energy equal to its outsized toll on human health and well-being. This must change for the next decade to avoid a dismal resemblance to the last.
It is imperative to break out of this stagnation in funding, political commitment, and popular attention to go somewhere new in our response to TB. Repetition of past failures holds a firm and frustrating grip on the fight against TB. The pathogenesis of TB itself is often repetitious in the way it can relapse into active

2
disease in people with TB infection and reinfect people who have completed TB treatment and been declared cured. Similar phenomena characterize the human response to TB, not just inside the body at the level where human host and TB pathogen interact but also at the collective level of the body politic. A recent history of the response to TB in the twentieth century by Christian McMillan titled Discovering Tuberculosis details the ways in which each generation of scientists and policy makers has rediscovered TB as if for the first time.3 This cycle includes relearning qualities of TB biology and epidemiology discovered in earlier times but now forgotten. Given this history, the question hanging over the next decade of TB research is: will we repeat the missteps of the last 10 years and excuse ourselves by claiming that we are learning something new?
Even with the inadequate funding of the past five years—only $2.7 billion of the $9.8 billion called for—TB researchers managed to (re)learn many things about TB biology, develop two new drugs against drug-resis-tant TB, approve a shorter regimen to treat TB infection, introduce a more rapid diagnostic test, and reinvigo-rate the once-dormant field of TB vaccine research. As we imagine the next 10 years, there is an urgent need to remember what we learned from the last decade and to let this memory spur us to secure the funding, political will, and public pressure that can prevent us from repeating past mistakes.

3
Introduction
YEARTOTAL TB R&D INVESTMENT
CHANGE OVER PREVIOUS YEAR
CHANGE OVER PREVIOUS YEAR (%)
CHANGE OVER 2005
CHANGE OVER 2005 (%)
2005 $358,476,537 N/A N/A N/A N/A
2006 $418,928,300 $60,451,763 16.86 $60,451,763 16.86
2007 $478,343,421 $59,415,121 14.18 $119,866,884 33.44
2008 $494,576,235 $16,232,815 3.39 $136,099,698 37.97
2009 $636,979,349 $142,403,113 28.79 $278,502,812 77.69
2010 $643,360,390 $6,381,042 1.00 $284,883,853 79.47
2011 $675,328,887 $31,968,497 4.97 $316,852,350 88.39
2012 $638,783,272 -$36,545,615 -5.41 $280,306,735 78.19
2013 $686,303,295 $47,520,023 7.44 $327,826,758 91.45
2014 $674,036,492 -$12,266,804 -1.79 $315,559,955 88.03
Changes in TB R&D Funding, 2005–2014
TABLE 1
The 2015 Report on Tuberculosis Research Funding Trends marks the 10th consecutive year that TAG has collected data on global funding for TB R&D. This anniversary issue presents a decade of data and offers a detailed look at TB research funding in 2014, the most recent year under study. The report measures annual spending on TB R&D over this period against the funding targets established by the Stop TB Partnership’s Global Plan to Stop TB, a series first published in 2001 and updated every five years since. The third and current Global Plan calls for annual TB R&D spending of almost $2 billion, or $9.8 billion from 2011 through 2015.4 This amount represents the minimum investment required to advance scientific knowledge of TB and develop the new diagnostics, drugs, and vaccines needed to eliminate TB as a public health threat. Now, one year shy of the end of the 2011–2015 Global Plan period, TAG’s resource tracking shows that the world has spent $2.7 billion on TB R&D since 2011, just over one-fourth of the $9.8 billion target.
To end one period so far behind is to begin the next period in a deep deficit. The fourth Global Plan, slated for publication concurrently with this report, will update TB R&D funding needs, taking into account a fund-ing pattern over the last 10 years that at least two intimate observers of the field have described to TAG as “pathetic.” To help close the books on the past decade and anticipate the next, TAG shared a preliminary look at this year’s data with leading TB researchers and advocates and asked these individuals to reflect on the current state of TB R&D in the context of its present and past funding levels. Many interviewees ex-pressed alarm that early, modest increases in TB R&D funding have now stagnated at an inadequate level. As Lucica Ditiu, executive director of the Stop TB Partnership, commented: “Overall, the funding [for TB R&D] is showing a very ugly situation. Unless we are able to make the case now for the coming years in a much stronger way, we will go nowhere with this amount of money. I have big doubts that investments in the $600 millions will lead us anywhere where we can make a difference in terms of new tools and ending TB.”
Reflecting on the last 10 years of TB R&D funding, Peter Small, founding director of the Stony Brook University Global Health Institute, described the increase in funding from 2005 to 2009 as “a promising time” that “showed how vigorously the research enterprise can respond to resources with a dramatic in-crease in good scientists and science. But the run ended far too soon given the decades of neglect we had to overcome.” In Small’s view, the five years of flat funding that have followed threaten to roll back this earlier progress: “While scientists can absorb a couple of underfunded years, this protracted period of stagna-tion will decrease research efforts and scare away the bright young minds the field so desperately needs. Like water, good science finds its own level, and this level is insufficient given the needs and opportunities.”

4
The human consequences of this insufficient level are apparent. For Manica Balasegaram, executive director of the Médecins Sans Frontières Access Cam-paign, “it is hard to feel anything but disappointment about the persistent unmet medical needs of TB patients” given the obvious mismatch between the reality of TB R&D funding “and the ambitious goals set by the TB community at the start of the 2011–2015 planning period.”
Resolving this unmet medical need through improvements to TB diagnosis, treatment, and prevention is critical. The WHO estimates that 9.6 million peo-ple newly developed TB in 2014; of these, 3.6 million went “missing,” either because they never received a diagnosis or did not have their diagnosis re-ported to national heath systems.5 The limitations of current TB diagnostics contribute to this enormous cohort of people who either receive no treatment or are treated outside the view of public health systems. Sputum smear microsco-py, a nineteenth-century technology, remains the most common TB diagnostic test despite its poor sensitivity, lack of specificity to TB, and limited utility for detecting TB in children or people with HIV.6 The advent of GeneXpert and its accompanying Xpert MTB/RIF assay, which can diagnose TB and resistance to the drug rifampin in under two hours, has shortened the time to treatment initiation in many settings but has yet to demonstrate a significant effect on decreasing TB mortality.7,8
After diagnosis, many people with TB must wait even longer to initiate treat-ment. In 2013, the WHO reported that 39,000 people were on treatment wait-ing lists around the world.9 Once connected to care, people with drug-sensitive TB (DS-TB) face six months of therapy, while those with drug-resistant TB (DR-TB) must take drugs for up to two years. Many of the drugs used to treat
While scientists can absorb a couple of underfunded years, this protracted period of stagnation will decrease research efforts and scare away the bright young minds the field so desperately needs. Like water, good science finds its own level, and this level is insufficient given the needs and opportunities.
— Peter Small, founding director,
Stony Brook University Global Health Institute
Annual Global Plan Research Funding Targets versus 2014 Funding
Basic Science New Diagnostics New Drugs New Vaccines Operational Research
$800,000,000
$600,000,000
$400,000,000
$200,000,000
$0
$420,000,000
$150,091,818
$340,000,000
$65,371,547
$740,000,000
$243,326,678
$380,000,000
$111,340,797$80,000,000
$52,828,217
FIGURE 1
Global Plan Annual Targets 2014 Funding

5
DR-TB impart serious toxicities as well as side effects that include hearing loss, psychosis, and peripheral neuropathy. As a consequence, cure rates for DR-TB remain abysmal. Globally, successful treatment of multidrug-resistant TB (MDR-TB) hovers around 48 percent;10 for people with extensively drug-re-sistant tuberculosis (XDR-TB), the percentage with favorable outcomes (i.e., cure or treatment completion) five years after treatment initiation can be as low as 11 percent.11 Bedaquiline and delamanid—the first new drugs from new classes approved to treat TB in over 40 years—were studied as add-ons to failing regimens.12 What is most needed is the development of wholly new regimens of novel drugs that can reduce treatment duration, side effects, tox-icities, and pill burdens.13
Prevention of TB also remains hamstrung by the limitations of existing technol-ogies. The bacillus Calmette-Guérin vaccine, introduced in 1921, protects in-fants and very young children against TB meningitis but offers little protection against pulmonary TB to adolescents or adults, who account for the majority of TB transmission and mortality.14 Over the last decade, TB incidence has declined at an annual rate of just two percent. If this pace holds, TB incidence in 2050 will be 1,000 times higher than the elimination threshold established by the WHO’s End TB Strategy.15 Accelerating this decline will require new tools, a fact recognized by the third pillar of the End TB Strategy—“intensified research and innovation”—which warns that new technologies must be intro-duced no later than 2025 to meet its TB elimination targets.16 Gavin Church-yard, director of the Aurum Institute, summarized the challenge this way: “In the context of the new WHO End TB Strategy and the ultimate goal of TB elimination, the gaps in research remain huge.”
The current resources available for TB R&D still fall far short of what would be required to sustain or catapult momentum. While there is good quality research going on the world over, the resource and funding limita-tions may be hampering and diluting the impact. If more resources were made avail-able, we would see a lot more TB research being conducted worldwide. We need more resources to enable different researchers to tackle the TB problem from different angles.
—Rebecca Tadokera, senior researcher,
Treatment Action Campaign
Total TB R&D Funding, 2005–2014
2005 2006 2007 2008 2010
$525,000,000
$350,000,000
$418,928,300
$478,343,421
$494,576,235
$636,979,349$643,360,390
2009
FIGURE 2
2011
$675,328,887$700,000,000
$175,000,000
$0
$638,783,272
$686,303,295
2012 2013
$358,476,537
2014
$674,036,492
6
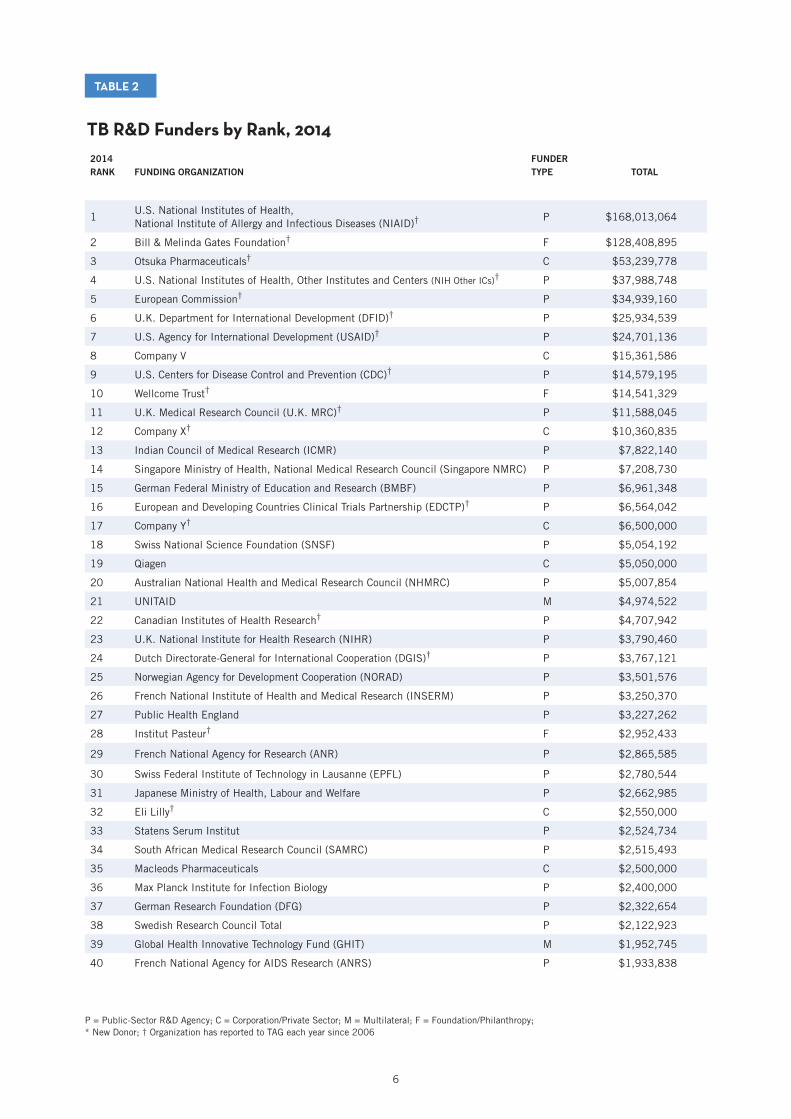
TB R&D Funders by Rank, 2014
TABLE 2
P = Public-Sector R&D Agency; C = Corporation/Private Sector; M = Multilateral; F = Foundation/Philanthropy; * New Donor; † Organization has reported to TAG each year since 2006
2014 RANK FUNDING ORGANIZATION
FUNDER TYPE TOTAL
1U.S. National Institutes of Health, National Institute of Allergy and Infectious Diseases (NIAID)†
P $168,013,064
2 Bill & Melinda Gates Foundation† F $128,408,895
3 Otsuka Pharmaceuticals† C $53,239,778
4 U.S. National Institutes of Health, Other Institutes and Centers (NIH Other ICs)† P $37,988,748
5 European Commission† P $34,939,160
6 U.K. Department for International Development (DFID)† P $25,934,539
7 U.S. Agency for International Development (USAID)† P $24,701,136
8 Company V C $15,361,586
9 U.S. Centers for Disease Control and Prevention (CDC)† P $14,579,195
10 Wellcome Trust† F $14,541,329
11 U.K. Medical Research Council (U.K. MRC)† P $11,588,045
12 Company X† C $10,360,835
13 Indian Council of Medical Research (ICMR) P $7,822,140
14 Singapore Ministry of Health, National Medical Research Council (Singapore NMRC) P $7,208,730
15 German Federal Ministry of Education and Research (BMBF) P $6,961,348
16 European and Developing Countries Clinical Trials Partnership (EDCTP)† P $6,564,042
17 Company Y† C $6,500,000
18 Swiss National Science Foundation (SNSF) P $5,054,192
19 Qiagen C $5,050,000
20 Australian National Health and Medical Research Council (NHMRC) P $5,007,854
21 UNITAID M $4,974,522
22 Canadian Institutes of Health Research† P $4,707,942
23 U.K. National Institute for Health Research (NIHR) P $3,790,460
24 Dutch Directorate-General for International Cooperation (DGIS)† P $3,767,121
25 Norwegian Agency for Development Cooperation (NORAD) P $3,501,576
26 French National Institute of Health and Medical Research (INSERM) P $3,250,370
27 Public Health England P $3,227,262
28 Institut Pasteur† F $2,952,433
29 French National Agency for Research (ANR) P $2,865,585
30 Swiss Federal Institute of Technology in Lausanne (EPFL) P $2,780,544
31 Japanese Ministry of Health, Labour and Welfare P $2,662,985
32 Eli Lilly† C $2,550,000
33 Statens Serum Institut P $2,524,734
34 South African Medical Research Council (SAMRC) P $2,515,493
35 Macleods Pharmaceuticals C $2,500,000
36 Max Planck Institute for Infection Biology P $2,400,000
37 German Research Foundation (DFG) P $2,322,654
38 Swedish Research Council Total P $2,122,923
39 Global Health Innovative Technology Fund (GHIT) M $1,952,745
40 French National Agency for AIDS Research (ANRS) P $1,933,838

7
TB R&D Funders by Rank, 2014 (continued)
TABLE 2
2014 RANK FUNDING ORGANIZATION
FUNDER TYPE TOTAL
41 Qurient* C $1,683,000
42 Health Research Council of New Zealand P $1,551,021
43 South African Department of Science and Technology (DST) P $1,474,767
44 U.S. Department of Defense Medical Research and Development Program (DMRDP) P $1,134,865
45 Australian Research Council P $1,019,066
46 Taiwan Centers for Disease Control P $987,002
47 Médecins Sans Frontières F $936,253
48 National University Health System, Singapore* P $921,116
49 Brazilian National TB Program P $873,244
50 Danish Council for Independent Research P $831,938
51 National Research Foundation, South Africa P $705,924
52 Indian Council of Scientific and Industrial Research* P $700,068
53 World Health Organization (WHO) M $649,888
54 Gabonese Republic P $509,773
55 Brazilian Development Bank* P $500,000
56 Department of Foreign Affairs, Trade and Development Canada (DFTAD) P $496,508
57World Health Organization TDR (Special Programme for Research and Training in Tropical Diseases)
M $490,925
58 Korean Ministry of Health and Welfare P $489,407
59 Indian Ministry of Science and Technology, Department of Biotechnology P $487,439
60 Innovative Medicines Initiative P $473,192
61 Grand Challenges Canada P $472,152
62 Korea Centers for Disease Control and Prevention P $455,400
63 U.S. Food and Drug Administration (FDA)† P $428,674
64 Korea Drug Development Fund* P $396,000
65 Fondation Recherche Médicale F $376,109
66 Japan BCG Laboratory C $373,086
67 Colombian Ministry of Health and Social Protection* P $350,519
68 National Institutes of Health, Peru* P $348,417
69 BioDuro C $337,500
70 Australian Department of Foreign Affairs and Trade P $334,054
71 Spanish Ministry of Science and Innovation P $327,830
72 Hong Kong Health and Medical Research Fund* P $293,302
73 Chilean National Commission for Scientific and Technological Research* P $263,896
74 Damien Foundation Belgium F $244,093
75 Howard Hughes Medical Institute F $200,000
76 U.S. National Science Foundation P $199,956
77 QuantaMatrix C $198,000
78 Bloomberg Foundation F $197,452
P = Public-Sector R&D Agency; C = Corporation/Private Sector; M = Multilateral; F = Foundation/Philanthropy; * New Donor; † Organization has reported to TAG each year since 2006

8
TB R&D Funders by Rank, 2014 (continued)
TABLE 2
2014RANK FUNDING ORGANIZATION
FUNDER TYPE TOTAL
79 Carlos III Health Institute P $155,527
80 Public Health Agency of Canada P $149,890
81 Firland Foundation F $133,827
82 Argentine Ministry of Science, Technology and Productive Innovation* P $132,406
83 LG Life Sciences* C $128,700
84 Danish International Development Agency (DANIDA)† P $120,972
85 Fondation Jacqueline Beytout* F $114,639
86 Company S C $113,762
87 Thrasher Research Fund F $110,000
88 OPEC Fund for International Development M $100,993
89 UBS Optimus Foundation F $96,934
90 Danish National Advanced Technology Foundation P $72,897
91 Biofabri C $68,298
92 Global BioDiagnostics* C $63,548
93 International Union of Immunological Societies* F $59,763
94 Indian Ministry of Health and Family Welfare P $51,708
95 Individual donors to TB Alliance F $48,465
96 National Health Laboratory Service, South Africa (NHLS)* P $47,120
97 Oppenheimer Memorial Trust F $45,235
98 Pfizer Laboratories C $43,767
99 Claude Leon Foundation F $40,052
100 Norwegian Knowledge Centre for the Health Services P $37,495
101 Japan International Cooperation Agency P $35,532
102 Fondation Mérieux F $35,000
103 Stop TB Partnership M $34,500
104 Japan Science and Technology Agency P $31,584
105 Taiwan Ministry of Science and Technology P $30,000
106 Korean Institute of Tuberculosis P $29,700
107 Bioneer* C $14,850
108 Green Cross Medical Science* C $14,850
109 bioMérieux Korea* C $11,880
110 Faber Daeufer C $10,000
111 Indian National Science Academy* P $8,320
112 KNCV Tuberculosis Foundation F $2,599
113 Harry Crossley Foundation* F $1,885
114 Korean Ministry of Science, ICT and Future Planning P $156
P = Public-Sector R&D Agency; C = Corporation/Private Sector; M = Multilateral; F = Foundation/Philanthropy; * New Donor; † Organization has reported to TAG each year since 2006

9
Methodology TAG collected information on TB research funding through an electronic survey sent to public funding agencies, philanthropic organizations, industry groups, multilateral institutions, and select academic and not-for-profit research institutions. The survey asked recipients to report disbursements supporting TB R&D made in 2014 and to categorize spending into one of six research areas: basic science, diagnostics, drugs, vaccines, operational research, and infrastructure/unspecified projects (see box below for a description of each category). Within and across these categories, we also asked organizations to report any spending related to pediatric TB research.
TAG sent surveys to 174 organizations, including known and potential funders of TB R&D. We received 107 surveys in return—the highest yield in our 10-year series—and from these uncovered 116 distinct TB R&D funders. Ten of these organizations, which we refer to as new funders, are reporting to TAG for the first time. Many of these new funders come from underrepresented geographic areas such as South America, where government ministries of health and science in Argentina, Chile, and Peru submitted data this year. We also obtained information from new funders representing public- and private-sector organizations in Singapore, Hong Kong, South Korea, and India.
In addition, TAG worked with the U.S. National Institute of Allergy and Infectious Diseases (NIAID) to collect information on TB research spending by the AIDS Clinical Trials Group (ACTG) and the International Mater-nal Pediatric Adolescent AIDS Clinical Trials Network (IMPAACT). The ACTG and IMPAACT conduct trans-lational research and therapeutic clinical trials for HIV and opportunistic diseases in adults and children. Starting in 2010, each network began increasing the volume of TB research it conducts.17 In previous years, the funding TAG reported for NIAID did not include ACTG and IMPAACT spending on TB research and, as a result, underestimated the NIH’s support for TB R&D. We are pleased to account for the important TB R&D activities of ACTG and IMPAACT for the first time this year in NIAID’s funding total.
After receiving the surveys, TAG converted any data reported in non-U.S. currencies into U.S. dollars using the July 1, 2014, interbank exchange rates provided by the OANDA Corporation.18 All dollar figures in this report are published as U.S. dollars unless otherwise noted and rounded to the nearest dollar (however, all calculations were performed using the unrounded data). To avoid double counting, we cross-checked surveys for project disbursements listed twice. Double counting can arise because many institutions that receive outside funding for some projects serve as a source of funding for others. In addition, we removed spending by product development partnerships (PDPs) such as Aeras or the TB Alliance from total figures, since PDPs are funding recipients and not original-source donors. All figures represent disbursements, or the actual transfer of funds made in 2014, rather than awards, commitments, or budgetary allocations for future years.
In addition, for the first time this year, TAG supplemented the quantitative survey data with qualitative interviews conducted with leading TB researchers. We interviewed 11 individuals—at least one person rep-resenting each area of TB research plus members of major advocacy organizations, activist networks, and philanthropic bodies (see appendix 2 for a full list of people interviewed by TAG). Each interviewee received an advance copy of preliminary findings in early September 2015 alongside a set of open-ended questions. We conducted four interviews over the phone; conversations lasted an average of 30 minutes and were tran-scribed. The remaining seven interviews were submitted to TAG in writing. We quote from these interviews throughout the report, taking care to match quotations to the contexts that their speakers were describing.
RESEARCH AREAS TRACKED BY TAG:
1. Basic science: undirected, investigator-initiated research to discover fundamental knowledge about Mycobacterium tuberculosis (MTB) and closely related mycobacterial organisms.
2. Diagnostics: preclinical and clinical trials of diagnostic technologies and algorithms.
3. Drugs: preclinical and clinical research on treatments and treatment strategies for TB disease and infection.
4. Vaccines: preclinical and clinical research on TB vaccines, including both preventive and immunotherapeutic vaccines.
5. Operational research: evaluations of new or existing TB control tools and strategies to guide their effective implementation in program settings. Operational research may include randomized trials, surveillance, and epidemiological and observational studies.
6. Infrastructure/unspecified projects: TB research that the donor is unable to further specify.

10
Limitations The accuracy of the data in this report depends in large measure on the proportion of eligible institutions that complete the survey. While the true total number of TB R&D funders worldwide remains unknown, TAG expends considerable energy surveying both confirmed and potential TB research funders from across the world—this year, on every inhabited continent and in over four dozen countries. Both the reach and the yield of TAG’s survey have increased each year since 2005, and data for 2014 represent results from our most extensive survey yet.
In addition, TAG makes a particular effort to ensure the recurring participation of the 30 largest funders of TB research from the previous year. This year, all of the top 30 funders from 2013—collectively accounting for 94 percent of total TB R&D funding that year—reported data to TAG. The composition of the top 30 funders has remained remarkably stable over time; few organizations have ever dropped out of the top 30 ranks, and 16 of these funders have participated in all 10 years of TAG’s report.
Astute readers may notice the absence of one highly visible organization in the fight against TB—the Glob-al Fund to Fight AIDS, Tuberculosis and Malaria (Global Fund)—from the list of TB R&D funders in table 2. The Global Fund’s TB team notified TAG that the design of the “enhanced financial reporting” (EFR) system used by the Global Fund until recently precludes the possibility of obtaining an accurate picture of annual TB research spending between 2002 and 2014.19 For this period, the Global Fund is able to report only total spending on TB operational research. From 2002 to 2014, cumulative expenditures on TB oper-ational research by Global Fund programs totaled $95 million.20 Newly introduced changes to Global Fund programmatic budgeting and reporting systems will enable TAG to include annualized totals for Global Fund spending on TB operational research in future years. In addition, despite repeated requests from TAG and its partners, institutions in Russia and China declined to report data. The amount invested in TB research in these two nations remains unknown.
TAG makes every effort to capture comprehensive data on TB R&D funding and encourages donors not includ-ed here to participate in future report rounds. Please contact TAG at [email protected] if you have information or corrections to share. Any corrections will enter print in next year’s report, although TAG may issue more substantial corrections in advance if warranted.
Resource tracking is a collaborative endeavor, and TAG could not do it without the consistent support of funding institutions from across the world. The program officers who complete our survey each year make this report possible and deserve special thanks. Table 2 acknowledges those organizations that have reported to TAG every year since 2006 with a dagger (†) appearing next to their names.

11
Globally, funders spent $674,036,492 on TB R&D in 2014, a decrease of $12.3 million (1.8%) from the $686,303,295 spent in 2013. At $674.0 mil-lion, TB R&D funding in 2014 is on par with the $675.3 million spent in 2011 and above the $638.8 million spent in 2012. However, this level of funding constitutes just 33 percent of the $2 billion Global Plan annual target, leaving a funding gap of $1.3 billion.
TAG observed this small drop in funding, yet its cause initially seemed unclear. More organizations than ever before reported data this year, so the decline was not attributable to diminished survey response or to nonparticipation of one or two major funders. However, at least two international development agencies—Irish Aid and the Australian Department of Foreign Affairs and Trade—noti-fied TAG that fiscal year 2014 fell between disbursements in large multiyear awards, resulting in temporarily lower spending. The particularities of grant payment schedules could, therefore, account for some of the observed decline. Moreover, while overall TB R&D funding appears relatively flat since 2009, the $12.3 million drop between 2013 and 2014 does not reflect the erosive forces of inflation. All figures reported by TAG are nominal (i.e., not adjusted for inflation). Since inflation decreases the purchasing power of flat budgets, flat funding masks falling funding.21 Exacerbating this decline, in the United States, where public agencies account for 37 percent of all funding for TB R&D worldwide, the costs of biomedical research have risen faster than the rates of general inflation.22,23 Accounting for inflation and the increasing costs of medi-cal research, the flat funding seen since 2009 likely hides a downward trend.
While I would like to be optimistic that TB R&D funding is increasing, I am concerned that it is really a flat line, which translates into less money . . . being spent per year over the past several years.
—Sharon Nachman, principal investigator and
chair of the IMPAACT network; professor of pediatrics, Stony Brook University
Results Trends in TB R&D Funding by Funder Category
Total TB R&D Funding by Funder Category, 2014 Total: $674,036,492
Public $418,664,514
(62%)
Private $98,623,440
(15%)
Multilateral $8,203,573
(1%)
Philanthropic $148,544,964
(22%)
FIGURE 3

12
The combination of flat funding and inflation is particularly worrisome given that public institutions continued to account for the majority of TB research funding in 2014. Sixty-two percent, or $418.7 million, of total funding for TB R&D came from the public sector. Philanthropic organizations contributed the next-largest share with $148.5 million (22%), followed by private industry with $98.6 million (15%) and multilateral organizations with $8.2 million (1%). These numbers reveal lower investments from the philanthropic and private sectors compared with in 2013. Private industry spent $12.9 million less on TB R&D in 2014 than it did in 2013, while philanthropic spending dropped by $20.9 million. Declines in these sectors only further intensified the reliance on public institutions, where funding increased by almost $20 million over the previous year.
Most public support for TB research came from a single country—the United States, which accounted for 59% of all public funding for TB research in 2014. This amounted to $247.0 million, over five times more than the $44.5 million given by the United Kingdom, the country with the second-largest share (10.7%) of public funding. Just behind the United Kingdom, member states of the European Union gave a combined $41.9 million (10%). In addition to their contributions to E.U. funding, governments in Germany and France gave $11.7 million and $8.0 million, a respective 3% and 2% of total public spend-ing. Outside of the E.U. but within Europe, Switzerland and Norway gave $7.8 million and $3.5 million, each accounting for less than 2% of the public-sector total.
This year’s report suggests that non-traditional donor countries are assuming a greater role in financing TB R&D. Singapore, appearing in this report for the first time, gave $8.1 million in government funding to TB research in 2014, ranking higher than the much larger countries (and economies) of France, Swit-zerland, Australia, and Canada. Public research agencies in India collectively spent over $9 million on TB R&D, enough to rank India fifth among countries
Total TB R&D Funding by Funder Category, 2005–2014 (in Millions)
FIGURE 4
$250
$375
$125
$0
$500Public Philanthropic Private Multilateral
2013
170
112
6.04
2011
1.65
124
43.1
399390
2012
113
8.16
405389
2010
6.02
124
2009
413
99.9
0.53
2008
155
72.0
268277
2007
132
69.4
248
2006
116
53.1
1.53
236
2005
1.65
78
145128124
123
149
98.6
8.20
419
2014
The private sector is investing much too little. Private sector [funding] is nothing even close to what it should be.
—Lucica Ditiu, executive director,
Stop TB Partnership
The pharmaceutical industry has the capacity to do more than they are currently doing as far as TB R&D is con-cerned. If we look at similar R&D funding data for other diseases, [for which] the mar-ket is . . . so more rewarding financially, we would see that the pharmaceutical industry is availing a lot more resources than they are for TB, which arguably affects mainly developing countries and so is financially less rewarding. Nevertheless, I think that more can be done.
—Rebecca Tadokera, senior researcher,
Treatment Action Campaign

13
with documented investments in TB research. In 2014, the BRICS countries—Brazil, Russia, India, China, and South Africa—accounted for 46% of the world’s incident TB cases and 40% of TB-related deaths, but only 3.6% of public funding for TB R&D.24 Among these countries, India’s combined $9.1 million to TB R&D in 2014 was followed by South Africa with $4.7 million and Brazil with $1.4 million.
Like public funding, spending from the philanthropic sector is heavily reliant on one organization: the Bill & Melinda Gates Foundation (Gates Foundation). In 2014, the Gates Foundation disbursed awards totaling $128.4 million, or 86 percent of all charitable support for TB R&D. As in previous years, the Wellcome Trust emerged as the second-largest philanthropic supporter of TB research, with $14.5 million in spending. The only other foundation giving more than $1 million to TB research in 2014 was the Institut Pasteur, with $2.9 million. Médecins Sans Frontières ranked fourth in this category, spending $936,253, mostly on operational research.
Overall spending by the pharmaceutical industry dipped below $100 million to total $98.6 million—equal to what industry spent in 2009 when mired in the worst of the global financial crisis. Within the private sector, most spending on TB research comes from a single source: Otsuka, a pharmaceutical company based in Tokyo, Japan. Otsuka invested $53.2 million on TB drug development in 2014, accounting for 54 percent of all industry spending across all categories of TB research. Company V and Company X, two pharmaceu-
Total TB R&D Funding by Research Category, 2005–2014 (in Millions)
FIGURE 5
20132011 2012201020092008200720062005
Basic Science Diagnostics Drugs Vaccines Operational Research
Infrastructure/ Unspecified
268
92
263
115
138130
46
240
92
122
129
232
54
172
200
39
176
99
113
173
145
7768
20
74
116
3230 35
52
63
88
77
4141
57
45
54
49
82
32
43
92
43
25
35
50
109
68
72
99
58
81
83
$150
$75
$225
$300
$0
243
111
150
51
6553
2014
Trends in TB R&D Funding by Research Category, 2005–2014

14
tical companies that report to TAG anonymously, trail behind Otsuka with spending of $15.4 million and $10.4 million. Qiagen spent just over $5 million on TB diagnostics R&D, and Macleods Pharmaceuticals—a generic drug company based in India—spent $2.5 million on the development of pediatric formulations of second-line TB drugs.
TB drug R&D received 36 percent of total 2014 funding, followed by basic-science research (22.3%), vaccines (16.5%), diagnostics (9.7%), operational research (7.8%), and infrastructure/unspecified proj-ects (7.6%). Alarmingly, funding for TB drug R&D dropped by almost $24.5 million (9.2%) from 2013 to 2014. Funding levels for operational research and diagnostics development also declined by $18.9 million (26.4%) and $2.4 million (3.5%).
Moving in the other direction, funding for TB vaccine research increased by $18.9 million (20.5%) between 2013 and 2014, a change attributable largely to the first disbursements of a major TB vaccine award through Horizon 2020, the European Commission’s funding program of $100 billion, intended to spur research and innovation in Europe between 2014 and 2020. Funding for basic science increased by nine percent, from $137.6 million in 2013 to $150 million in 2014. Most of this increase reflects a modest uptick in spending by the NIH; combined, NIH institutes and centers spent $8.7 million more on TB basic science in 2014 than they did in 2013. Whether examining increases in some categories of research or decreases in others, the data illustrate how contractions or expansions on the part of one or two major funders can have a sizeable effect on the overall level of funding.
In each category of TB R&D, funding fell short of the Global Plan funding targets. The gap remained largest in TB drugs, where spending of $243.3 million left a shortfall of $496.7 million measured against the $740 million target. The gap was narrowest in operational research, where $52.8 million in spending was $27.2 million short of the $80 million target. Even in basic-science and vaccine research, the observed increases in funding were far below the high jumps needed to approach the targets in these areas. In 2014, the fields of TB basic-science and vaccine research each faced a funding gap of $270 million.
Total TB R&D Funding by Research Category, 2014 Total: $674,036,492
Basic Science $150,091,818
(22%)
Vaccines $111,340,797
(16%)
Infrastructure/ Unspecified
$51,077,435 (8%)Operational
Research $52,828,217
(8%)
FIGURE 6
Drugs $243,326,678
(36%)
Diagnostics $65,371,547
(10%)

15
Basic Science: $150,091,818
European Commission $11,788,434
(8%)
INSERM $3,250,370
(2%)
FIGURE 7
NIAID $65,382,402
(44%)
SNSF $3,784,652
(2%)
Wellcome Trust $5,283,892
(3%)
U.K. MRC $6,404,004
(4%)
Gates Foundation $11,359,362
(8%)
NIH Other ICs $17,662,701
(12%)
Funders under 2% $22,040,807
(15%)
German Research Foundation (DFG) $2,322,654
South African Medical Research Council (SAMRC) $2,024,267
Institut Pasteur $1,803,590
French National Agency for Research (ANR) $1,655,670
Swedish Research Council $1,594,648
Health Research Council of New Zealand $1,551,021
South African Department of Science $1,474,767 and Technology
Canadian Institutes of Health Research $1,284,084
Max Planck Institute for Infection Biology $1,200,000
Swiss Federal Institute of Technology $1,123,910 in Lausanne (EPFL)
Australian Research Council $1,019,066
German Federal Ministry of Education $912,136 and Research (BMBF)
Norwegian Agency for Development Cooperation (NORAD) $660,002
Korean Ministry of Health and Welfare $356,400
National Research Foundation, South Africa $310,446
Japanese Ministry of Health, Labour and Welfare $309,000
Fondation Recherche Médicale $303,044
National Institutes of Health, Peru $259,593
Indian Ministry of Science and Technology, $258,347 Department of Biotechnology
Hong Kong Health and Medical $255,965 Research Fund
Chilean National Commission for Scientific $209,596 and Technological Research
Howard Hughes Medical Institute $200,000
QuantaMatrix $198,000
Public Health England $119,357
U.S. National Science Foundation $112,652
Argentine Ministry of Science, $88,924 Technology and Productive Innovation
U.K. National Institute for Health Research (NIHR) $85,256
International Union of Immunological Societies $59,763
National Health Laboratory Service, South Africa (NHLS) $47,120
Oppenheimer Memorial Trust $45,235
Claude Leon Foundation $40,052
Indian Council of Scientific and $38,026 Industrial Research
Damien Foundation Belgium $36,251
French National Agency for AIDS Research (ANRS) $29,488
Thrasher Research Fund $24,000
Firland Foundation $20,000
Indian National Science Academy $8,320
Korean Ministry of Science, ICT and Future Planning $156
FUNDERS WITH INVESTMENTS UNDER 2%
NHMRC $3,135,193
(2%)
Basic Science

16
The Global Plan calls for annual investments of $420 million in TB basic sci-ence. In 2014, funders gave $150.1 million to basic-science research, leaving a gap of $270 million.
As in previous years, the NIH provided the lion’s share of funding for basic science: $83.0 million, or 55 percent of the total. Within the NIH, NIAID alone contributed $65.4 million; combined, the other NIH institutes and cen-ters gave $17.7 million. Other top-five funders of TB basic-science research include the European Commission with $11.8 million (7.9%), the Gates Foun-dation with $11.4 million (7.6%), and the U.K. Medical Research Council with $6.4 million (4.3%).
The shortage in available funding stands at odds with the surplus of ques-tions about TB pathogenesis in need of answers. The list of unknowns has only multiplied over time as laboratory experiments and clinical trials—and the discordance between the two—have raised new questions, overturned old assumptions, and made clear the incompleteness of prior understanding. Ask what is missing from our knowledge, and most scientists across TB diagnos-tic, drug, and vaccine development reply with a similar answer: biomarkers. Biomarkers are genes, biological processes, or clinical phenotypes that can be objectively measured and interpreted to indicate aspects of how the body re-sponds to disease pathogenesis, immunization, or treatment. The identification of biomarkers that correlate with protective immunity against TB or successful therapeutic intervention would provide helpful guidance to TB vaccine and drug researchers. For diagnostic developers, biomarkers that could pinpoint recent TB infection or reliably predict progression from infection to active dis-ease would revolutionize diagnostic R&D.
The strength of the pipeline for new medical technologies depends on the quality of the basic science and preclinical studies from which testable ideas emerge. As a result, the pace of basic-science research sets the rate of progress in other research areas. Gavin Churchyard offered the following illustration: “If we had a biomarker that could identify recent transmission in TB, we could eliminate these large cluster-randomized trials for interventions to interrupt transmission and have much, much smaller sample sizes and ... shorter time-frames. But because we have to wait for transmission to occur, infection to be established, and progression to TB disease, we require large, long study designs to get the answer.”
According to Gilla Kaplan, director of the Gates Foundation tuberculosis pro-gram, the gap in basic-science funding “isn’t merely a hypothetical gap. The gap essentially means that even if we’re super ambitious at the translational level, we’re going to go back and continue doing things that we know have not succeeded in the past. If there aren’t new tools and new ideas and new con-cepts and new technologies coming through the pipeline from basic research, we’re not going to be testing the right things.” Underfunding basic science, in other words, sets up the TB R&D field to repeat past mistakes, perpetuating the cycle of learning, forgetting, and learning again that hobbled the twenti-eth-century response to TB.25
This limited funding for TB basic science has hit academia particularly hard. University-based research labs function as the generators of testable concepts and hypotheses for all three areas of TB product development—diagnostics, drugs, and vaccines. “Funding is the most important factor guiding research in academia,” said Ruth McNerney, senior research associate at the University of Cape Town Lung Institute and head of operations at Antrum Biotech. Willem Hanekom, deputy director of tuberculosis at the Gates Foundation, echoed this warning: “Limited funding means less research, and people will move to work in areas where the funding is available.”
Limited funding means less research, and people will move to work in areas where the funding is available
— Willem Hanekom, deputy director,
tuberculosis program, Bill & Melinda Gates Foundation
If we had a biomarker that could identify recent transmission in TB, we could eliminate these large cluster-randomized trials for interventions to interrupt transmission and have much, much smaller sample sizes and ... shorter timeframes. But because we have to wait for transmission to occur, infection to be established, and progression to TB disease, we require large, long study designs to get the answer.
— Gavin Churchyard, director, Aurum Institute

17
Diagnostics
Diagnostics: $65,371,547
Gates Foundation $15,857,230
(24%)
Funders under 2% $7,469,313
(12%)
FIGURE 8
NIAID $13,235,870
(20%)
European Commission $1,484,427
(2%)
Wellcome Trust $2,103,413
(3%)
NIHR $2,608,818
(4%)
Qiagen $5,050,000
(8%)
Company Y $6,500,000
(10%)
CDC $9,109,678
(14%)
Australian National Health and Medical $1,254,820 Research Council
European and Developing Countries Clinical $1,025,860 Trials Partnership (EDCTP)
U.S. Agency for International Development (USAID) $915,000
U.S. Department of Defense Medical $749,998 Research and Development Program (DMRDP)
Japanese Ministry of Health, Labour and Welfare $558,464
U.K. Medical Research Council (U.K. MRC) $347,280
Canadian Institutes of Health Research $318,671
Institut Pasteur $276,795
German Federal Ministry of Education $240,324 and Research (BMBF)
French National Agency for AIDS Research (ANRS) $175,745
Public Health Agency of Canada $149,890
Taiwan Centers for Disease Control $139,354
Korean Ministry of Health and Welfare $133,007
LG Life Science $128,700
Grand Challenges Canada $104,923
Norwegian Agency for Development Cooperation (NORAD) $104,237
OPEC Fund for International Development $100,993
Korea Centers for Disease Control and Prevention $99,000
U.S. National Science Foundation $87,304
National Institutes of Health, Peru $85,870
Damien Foundation Belgium $85,195
Indian Ministry of Science and Technology, $75,953 Department of Biotechnology
Global BioDiagnostics $63,548
Thrasher Research Fund $62,000
Hong Kong Health and Medical $37,337 Research Fund
Japan International Cooperation Agency $35,532
Korean Institute of Tuberculosis $29,700
Argentine Ministry of Science, $27,013 Technology and Productive Innovation
Bioneer $14,850
Green Cross Medical Science $14,850
National Research Foundation, South Africa $13,334
bioMérieux Korea $11,880
Harry Crossley Foundation $1,885
FUNDERS WITH INVESTMENTS UNDER 2%
NIH Other ICs $1,952,797
(3%)

18
The Global Plan calls for annual investments of $340 million in research to develop new TB diagnostics. In 2014, funders gave $65.4 million to diagnostics research, leaving a gap of $274.6 million.
As in 2013, the Gates Foundation and NIAID are the first- and second-largest funders of TB diagnostics research, with 2014 funding levels of $15.9 million and $13.2 million. The U.S. Centers for Disease Control and Prevention (CDC), which spent $9.1 million, and two private sector companies—Company Y with $6.5 million in spending and Qiagen with $5.1 million—round out the top five.
After the endorsement of GeneXpert by the WHO in 2010 and its approval by the U.S. Food and Drug Ad-ministration (FDA) in 2013, many heralded the coming of fast-follower diagnostic technologies that would improve on GeneXpert’s performance and circumvent its shortcomings. Five years later, there are no followers within sight of stringent regulatory approval or normative guidance. At this point, deeming any diagnostic technology in the pipeline a “fast follower” would require an especially elastic use of the English language. Many of the technologies in the pipeline lack published data, and the most talked-about candidates have each had their performance assessed in fewer than three field evaluations.26,27
The most striking aspect of TB diagnostics R&D is the paucity of organizations with substantial investments in this area. In 2014, fewer than 15 organizations gave more than $500,000 to TB diagnostics research. One consequence of the limited number of players is that available funders are asked to support all stages of the research process—from discovery to rollout. According to Ruth McNerney, “there has been a blurring of roles between funders, test developers, test evaluators, and policy makers on the rollout of new tests.” McNerney attributes this to the small number of players, but also points to the lack of regulatory capacity to evaluate new diagnostics in many high-TB-burden countries as well as the intimate involvement of funders in procurement-related decisions.
The most striking example of this dynamic took place with GeneXpert—developed by Cepheid with heavy financing from the U.S. Department of Defense, NIAID, and the Gates Foundation. The Foundation for Innovative New Diagnostics (FIND), a product development partnership, with support from the Gates Foun-dation, assumed most of the costs for the evaluation studies required for GeneXpert’s endorsement by the WHO in 2010. The ACTG supported the studies that led to the FDA’s approval of GeneXpert in 2013.28 Many of these same players, including other public agencies such as the United States Agency for International Development (USAID) and the President’s Emergency Plan for AIDS Relief (PEPFAR), then committed addi-tional public and philanthropic money to reduce the price of GeneXpert cartridges from $16.86 to $9.98 in 2012.29 More competition between developers, and an increase in the number of funders, would encourage involved organizations to focus resources in areas where they hold a comparative advantage or are best posi-tioned to make a meaningful difference.

19
Drugs
Drugs: $243,326,678
FIGURE 9
Gates Foundation $41,711,708
(17%)
Company X $9,951,047
(4%)
Funders under 2% $38,963,278
(16%)
NIAID $42,738,275
(18%)
NIH Other ICs $5,209,176
(2%)
Singapore NMRC $7,208,730
(3%)
USAID $11,892,000
(5%)
Company V $15,361,586
(6%)
DFID $17,051,100
(7%)
Otsuka Pharmaceuticals $53,239,778
(22%)
U.S. Centers for Disease Control and Prevention (CDC) $4,469,517
UNITAID $3,444,522
Wellcome Trust $3,372,482
European Commission $3,212,248
U.K. Medical Research Council (U.K. MRC) $3,122,620
Eli Lilly $2,550,000
Macleods Pharmaceuticals $2,500,000
European and Developing Countries Clinical Trials $2,305,721 Partnership (EDCTP)
Qurient $1,683,000
Swiss Federal Institute of Technology in Lausanne (EPFL) $1,656,634
Global Health Innovative Technology Fund (GHIT) $1,394,818
Canadian Institutes of Health Research $1,146,518
Public Health England $1,050,518
French National Agency for Research (ANR) $1,030,294
Indian Council of Scientific and Industrial Research $595,898
Gabonese Republic $509,773
Innovative Medicines Initiative $473,192
Institut Pasteur $410,449
U.S. Food and Drug Administration (FDA) $400,000
Korea Drug Development Fund $396,000
Swedish Research Council $394,347
U.S. Department of Defense Medical $384,867 Research and Development Program (DMRDP)
BioDuro $337,500
Japanese Ministry of Health, Labour and Welfare $309,592
Australian National Health and $299,509 Medical Research Council (NHMRC)
French National Agency for AIDS Research (ANRS) $267,237
Swiss National Science Foundation (SNSF) $264,171
Indian Ministry of Science and Technology, $153,138 Department of Biotechnology
South African Medical Research Council (SAMRC) $123,714
Danish International Development Agency (DANIDA) $120,972
Fondation Jacqueline Beytout $114,639
Damien Foundation Belgium $93,900
German Federal Ministry of Education and Research (BMBF) $86,514
Grand Challenges Canada $52,461
Taiwan Centers for Disease Control $50,205
Individual donors to TB Alliance $48,465
Company S $45,464
Stop TB Partnership $34,500
Thrasher Research Fund $24,000
World Health Organization TDR (Special Programme $20,925 for Research and Training in Tropical Diseases)
Faber Daeufer $10,000
National Institutes of Health, Peru $2,954
FUNDERS WITH INVESTMENTS UNDER 2%

20
The Global Plan calls for annual investments of $740 million in research to develop new drugs or optimize the use of existing ones. In 2014, funders gave $243.3 million to TB drug research, leaving a gap of $496.7 million.
Otsuka, the developer of delamanid, remains the largest funder of TB drug de-velopment, spending $53.3 million in 2014. The phase III trial of delamanid is nearing its end, with results expected in 2017. Otsuka is also completing a study of delamanid’s safety and efficacy in children—a requirement of its receiving accelerated approval based on phase II trial data from the European Medicines Agency in 2014.30
Other top funders of TB drug development are less focused on individual compounds. NIAID and the Gates Foundation spent nearly equal amounts on TB drug R&D in 2014—$42.7 million and $41.7 million. With support from NIAID—and, in the case of IMPAACT, the Eunice Kennedy Shriver National Institute of Child Health and Human Development (NICHD)—the ACTG and IMPAACT spent a respective $5.3 million and $1.1 million on clinical trials of TB drugs and drug regimens addressing TB infection, DS-TB, and DR-TB. The increasing prominence of TB within the scientific agendas of NIAID’s Division of AIDS clinical trials networks represents a major boon to the TB research field. The greater involvement of the ACTG and IMPAACT has brought many experienced clinical trials sites into the TB research fold and has increased opportunities for partnership and collaboration with the world’s largest TB re-search funder.
Both public and private research groups are taking advantage of these oppor-tunities. The CDC’s Tuberculosis Trials Consortium (TBTC)—itself the 10th largest funder of TB drug research with 2014 spending of $4.5 million—is partnering with the ACTG on a phase III study that seeks to shorten DS-TB treatment from six months to four months.31 Otsuka is participating with the ACTG and IMPAACT in the PHOENIx study, which will compare delamanid with isoniazid as preventive therapy when given to household contacts of individuals with diagnosed MDR-TB.32
In addition to these external collaborations, the size and reach of the ACTG and IMPAACT have allowed the two networks to develop ambitious TB research portfolios that together address nearly all forms of TB—from latent TB infec-tion to MDR-TB. According to Dick Chaisson, founding director of the Center for TB Research at the Johns Hopkins University and chair of the ACTG TB transformative science group, this multipronged approach responds to the crit-ical drug discovery needs facing each type of TB: “The need for new TB drugs has never been as urgent as it is now. MDR-TB is now being diagnosed in tens of thousands of people who have no access to effective and safe treatment, and drugs to shorten the treatment of all forms of TB—susceptible, MDR, active, and latent—are desperately needed to reduce the burden this disease imposes on health systems and society.”
Aside from Otsuka, two other private-sector companies rank among the 10 largest funders of TB drug development: Company V and Company X. However, 65 percent of funding for TB drug R&D comes from outside the pharmaceutical industry, an imbalance that has grown in recent years. Three pharmaceuti-cal companies have left TB research since 2012, when Pfizer closed its anti- infectives program; AstraZeneca followed in 2013 and Novartis in 2014.33,34,35 In each of these cases, TB drug research fell victim to a larger structural shift in the pharmaceutical industry. Companies are moving away from anti-infec-tives research, where returns on investment are expected to be low compared with potential earnings from drugs to treat chronic illnesses or even vaccines, which in some companies now rank among the most profitable products.36,37
Despite the pharmaceutical industry’s crumbling commitment to TB research, there are some reasons for measured optimism. Novartis recently restarted research on clofazimine, a drug originally developed and approved to treat leprosy, and told TAG that spending on this program will pick up in 2015.38
The need for new TB drugs has never been as urgent as it is now. MDR-TB is now being diagnosed in tens of thousands of people who have no access to effective and safe treatment, and drugs to shorten the treatment of all forms of TB—susceptible, MDR, active, and latent— are desperately needed to reduce the burden this disease imposes on health systems and society.
—Dick Chaisson, founding director,
Center for TB Research, the Johns Hopkins University;
chair of the ACTG TB transformative
science group

21
Although this renewed work is encouraging, Novartis is not investing in new TB drug candidates. Qurient, a biotech company based in South Korea, spent $1.7 million in 2014 on the preclinical development of TB drug compound Q203, an imidazopyridine-amide-class drug. Merck recently acquired tedizol-id, an already-approved drug in the same class as linezolid, and has indicated interest in developing it for TB. These tentative moves deserve encouragement; other companies with the potential to get involved remain reticent about com-mitting real resources and time. For example, Vertex owns a compound in the aminobenzimidazole class named VXc-486 with demonstrated activity against TB but has not expressed the intent to take it forward into the clinic.39
Despite this nascent reawakening among a handful of biotech and major phar-maceutical companies, the most exciting news in early-stage TB drug devel-opment last year came from the not-for-profit sector. In 2014, for the first time in six years, a new compound—TBA-354, a drug in the nitroimidazole class owned by the TB Alliance—entered phase I of the clinical pipeline.40 The TB Alliance is principally supported by the Gates Foundation, which has leveraged its sizeable investments in TB drug development to support several joint drug-discovery initiatives, including the Critical Path to New TB Drug Reg-imens. The Gates Foundation is also a founding member of the Global Health Innovative Technology Fund (GHIT), a public-private partnership established in Japan in 2013 which, in addition to money from the Gates Foundation, combines the resources of five Japanese pharmaceutical companies (Astel-las, Daiichi Sankyo, Eisai, Shionogi, and Takeda), two Japanese government agencies (the Japanese Ministry of Foreign Affairs and the Ministry of Health, Labour and Welfare), and the United Nations Development Programme. The participating Japanese pharmaceutical companies do not have their own TB drug development programs but have agreed to open their compound libraries and offer technical support to GHIT grantees. Since its inception, GHIT has issued several grants for TB drug development—all to the TB Alliance.
Companies outside of Japan are also offering in-kind support without main-taining their own dedicated TB drug development programs. In 2014, Eli Lilly gave in-kind support worth $2.6 million to TB R&D, primarily through the TB Drug Accelerator project. AbbVie also contributed in kind to TB drug R&D but declined to estimate total costs.41 Nearly $8 million of the $15.4 million Company V spent on TB research came in the form of in-kind contributions to external R&D activities.
In the last four years, the private sector’s exodus from anti-infectives and TB has been staggering.
—Manica Balasegaram, executive director,
Médecins Sans Frontières Access Campaign

22
Vaccines: $111,340,797
FIGURE 10
Gates Foundation $46,649,769
(42%)
DFID $3,239,709
(3%)
Funders under 2% $14,219,026
(13%)
NIAID $20,125,920
(18%)
Statens Serum Institut $2,524,734
(2%)EDCTP $3,049,131
(3%)
Wellcome Trust $3,263,118
(3%)
DGIS $3,767,121
(3%)
European Commission $14,502,269
(13%)
Public Health England $2,057,386
Norwegian Agency for Development Cooperation (NORAD) $1,737,823
U.S. National Institutes of Health, $1,513,855 Other Institutes and Centers (NIH Other ICs)
Japanese Ministry of Health, Labour and Welfare $1,232,270
Max Planck Institute for Infection Biology $1,200,000
U.K. Medical Research Council (U.K. MRC) $1,134,248
Danish Council for Independent Research $831,938
Canadian Institutes of Health Research $616,938
Global Health Innovative Technology Fund (GHIT) $557,927
Brazilian Development Bank $500,000
Institut Pasteur $461,600
Company X $409,788
Japan BCG Laboratory $373,086
Spanish Ministry of Science and Innovation $327,830
Swiss National Science Foundation (SNSF) $303,830
French National Agency for Research (ANR) $179,621
Carlos III Health Institute $155,527
Swedish Research Council $133,929
Danish National Advanced Technology Foundation $72,897
Biofabri $68,298
Company S $68,298
World Health Organization (WHO) $65,968
Pfizer Laboratories $43,767
Norwegian Knowledge Centre for the Health Services $37,495
Japan Science and Technology Agency $31,584
Taiwan Ministry of Science and Technology $30,000
U.S. Food and Drug Administration (FDA) $28,674
Firland Foundation $20,000
Argentine Ministry of Science, Technology $16,469 and Productive Innovation
Indian Council of Medical Research (ICMR) $7,983
FUNDERS WITH INVESTMENTS UNDER 2%
Vaccines

23
The Global Plan calls for annual investments of $380 million in TB vaccine research. In 2014, funders spent $111.3 million, leaving a gap of $268.7 million.
In 2014, the Gates Foundation spent twice as much as the next-largest funder on TB vaccine R&D—$46.6 million from Gates compared with $20.1 million from NIAID. Developing a new TB vaccine is central to the Gates Foundation’s revised TB strategy, which is focused on interrupting TB transmission.42 The Gates Foundation intends to pursue a new strategy for the next 10 years of TB vaccine R&D, and Willem Hanekom commented that “TB vaccine research is definitely going in a new direction. We’re entering a new era where we are doing things differently.”
Part of this welcome new direction entails what the Gates Foundation has deemed a “shift to the left,” in which basic science will assume a more central place in the TB vaccine research agenda.43,44 In this promising approach, resources will transfer from a limited number of expensive, late-stage phase IIb/III trials (events located on the “right” side of the pipeline) to discovery, preclinical development, and phase I studies, enabling exploration of a wider array of vaccine concepts.45 This “left” side of the pipeline is where funders like NIAID have always concentrated their money. But the pivot in this direction by the Gates Foun-dation indicates something important: it reveals the huge unmet need for TB basic-science research created by chronic underfunding and the consequences this has had for product development.
Aside from the Gates Foundation and NIAID, all the other top funders of TB vaccine R&D are European governments and foundations. In 2014, the European Commission gave $14.5 million to TB vaccine R&D, a sizeable increase from the $1.5 million it gave in 2013. Most of this is attributable to the opening of Horizon 2020. The first Horizon 2020 funding call resulted in a $26.2 million award for TB vaccine research, the first installment of which was paid in 2014 and reflected here in higher European Commission spending.46 Other large European supporters of TB vaccine R&D include the U.K. Department for International Devel-opment (DFID) and the Dutch Directorate-General for International Cooperation (DGIS); these organizations each gave over $3 million to Aeras. To the north, the Norwegian Agency for Development Cooperation (NORAD) gave $1.7 million to the TuBerculosis Vaccine Initiative (TBVI), a PDP based in the Netherlands.
Reflecting on available support for TB vaccine R&D, Willem Hanekom pointed out that “in the roughly 15 years of modern TB vaccine research, there have been exciting advances, but we were initially relatively non-selective in choosing which candidates should proceed with development.” Hanekom is referring to how the 16 TB vaccine candidates developed since the field’s revitalization in 2000 employ similar constructs and target a single arm of the human immune system.47 The turn to basic science in TB vaccine R&D is meant to cultivate a more diverse stable of vaccine candidates that can be tested and compared against one another using consensus-based scientific criteria—an approach called portfolio management.48
Increasing the amount of immunology work done alongside clinical trials will be essential to unlocking the full potential of this approach. To this end, Hanekom pointed to HIV vaccine research, which received near-ly eight times as much money as TB vaccine R&D in 2014,49 to illustrate what more funding could bring: “The HIV vaccine efforts have really driven our new knowledge of human immunology. Given the amount of resources dedicated to this research, we’ve learned an incredible amount about the human immune system’s response to HIV. We don’t quite see that kind of research in the TB space. Again, I think it’s a resource is-sue.” Of course, the history of HIV vaccine research shows that great immunology is no guarantee of finding a straightforward path to a safe and efficacious vaccine. But a more explicit focus on immunology and basic science would help the TB vaccine field generate the more diverse and testable new hypotheses it needs to build on the lessons learned from the first 10 years of TB vaccinology.

24
Operational Research
Operational Research: $52,828,217
FIGURE 11
UNITAID $1,530,000
(3%)
Funders under 2% $11,789,418
(22%)
NIH Other ICs $9,130,719
(17%)
ANRS $1,447,693
(3%)
USAID $3,142,102
(6%)
Gates Foundation $4,712,959
(9%)DFID
$5,643,730 (11%)
NIAID $14,335,210
(27%)
NIHR $1,096,386
(2%)
Canadian Institutes of Health Research $1,026,442
U.S. Centers for Disease Control $1,000,000 and Prevention (CDC)
Norwegian Agency for Development $966,940 Cooperation (NORAD)
Médecins Sans Frontières $936,253
Brazilian National TB Program $873,244
National University Health System, Singapore $800,970
Swiss National Science Foundation (SNSF) $701,539
Taiwan Centers for Disease Control $636,787
World Health Organization (WHO) $583,920
U.K. Medical Research Council (U.K. MRC) $579,895
Department of Foreign Affairs, $496,508 Trade and Development Canada
Wolrd Health Organization TDR (Special Programme $470,000 for Research and Training in Tropical Diseases)
South African Medical Research Council (SAMRC) $367,512
Colombian Ministry of Health and Social Protection $350,519
Australian Department of Foreign Affairs and Trade $334,054
Korea Centers for Disease Control and Prevention $326,700
National Research Foundation, South Africa $325,599
Grand Challenges Canada $209,845
Bloomberg Foundation $197,452
European and Developing Countries $183,330 Clinical Trials Partnership (EDCTP)
UBS Optimus Foundation $96,935
Firland Foundation $93,827
Wellcome Trust $76,692
Chilean National Commission for Scientific $54,300 and Technological Research
Fondation Mérieux $35,000
Indian Council of Medical Research (ICMR) $29,044
Damien Foundation Belgium $28,747
Indian Ministry of Health and Family Welfare $4,766
KNCV Tuberculosis Foundation $2,599
FUNDERS WITH INVESTMENTS UNDER 2%

25
The Global Plan calls for annual investments of $80 million in operational re-search on the implementation of new tools and strategies in program settings. In 2014, funders gave $52.8 million to operational research, leaving a gap of $27.2 million.
The composition of the five largest funders of TB operational research remains unchanged from last year. NIAID contributed the most to operational research in 2014 with $14.3 million, followed by other NIH institutes and centers with a combined $9.1 million. Other leading funders of operational research in-clude international development agencies: DFID gave $5.6 million and USAID gave $3.1 million.
The $18.9 million drop in operational-research spending between 2013 and 2014 stands at odds with the growing need for creative solutions to clear the thicket of obstacles that have slowed the integration of new TB drugs and di-agnostics into national health systems. After decades of little or no research output, TB programs were unprepared to incorporate new tools into routine use following the approvals of GeneXpert, bedaquiline, and delamanid. The bulk of GeneXpert scale-up has occurred in a single country—South Africa—with procurement inexplicably delayed by bureaucratic intransigence in other high-TB-burden countries, such as India.50,51 Calculations based on WHO guidance suggest that one-quarter to one-half of people who develop MDR-TB worldwide each year—i.e., 120,000–240,000 people—would be eligible to receive either bedaquiline or delamanid.52 Yet, as of September 2015, just over 1,400 and 100 patients have received bedaquiline and delamanid, respectively, outside of clinical trials.53
TB operational research must address the challenge of how to take a good result generated in one place and reproduce it in many others. There has been no shortage of pilot projects in TB, only shortfalls in funding—facts that may be connected. Much of the operational research spending reported to TAG rep-resents a constellation of small projects conducted locally. These are valuable efforts—especially from the perspective of people with TB who find themselves fortunate enough to receive treatment through an innovative, successful proj-ect. But these smaller endeavors will need to be expanded to have any discern-able impact on the course of the larger TB epidemic, and this will require more funding.
Increased funding would allow the TB operational research agenda to become more ambitious in its design and scope. Gavin Churchyard commented that adaptive trial designs, now becoming more common in clinical trials of TB drugs, should be carried over to the operational research setting. The use of these flexible study designs would enable operational research to respond to preliminary findings, or even to external changes in epidemiology and medical technology, allowing for promising approaches to be evaluated and integrated into health systems more quickly than the existing operational research para-digm allows.
You take a new technology and put it into health systems, and guess what? Your impact is limited. We can’t just devel-op the new tools; we have to figure how to integrate them to maximize their impact.
—Gavin Churchyard, director, Aurum Institute
The lack of proper funding for rolling out new tools at the right scale also becomes a disincentive for development. Why should I develop a new thing when it looks like the TB community is so slow in taking them up? This goes in both directions. Because fund-ing for preparing the ground . . . for new tools was never available or considered, you have countries and programs which are unprepared to embrace new tools.
—Lucica Ditiu, executive director,
Stop TB Partnership

26
Pediatric TB Research
Pediatric TB R&D Funding by Research Category, 2014 Total: $25,749,039
Infrastructure/Unspecified $480,500
(2%)
Vaccines $6,106,340
(24%)
Basic Science $2,768,273
(11%)
Operational Research $2,483,335
(9%)Drugs
$11,613,612 (45%)
Diagnostics $2,296,979
(9%)
FIGURE 12
Pediatric TB researchers are making up for lost time. The first battle to be won required convincing funders and the WHO that pediatric TB is a significant problem deserving of attention and resources. TB in children remains difficult to diagnose with available sputum-based diagnostic technologies. Consequently, many countries did not start tracking cases of TB in children until recently, and the WHO did not publish estimates of pediatric TB incidence or mortality until 2012.
One consequence of this is that pediatric TB research trails far behind research in adults—even accounting for the usual, frequently absurd, delays between adult and pediatric studies seen in medical research at large. “I think there are more people interested in pediatric TB than in the past,” said Sharon Nachman, principal investigator and chair of the IMPAACT network and professor of pediatrics at Stony Brook Univer-sity. “But critical studies investigating novel therapeutics (single or in combination) in children are still far behind adult studies.” Moving forward, there will be no excuse for developers to delay pediatric trials. A recently published consensus statement from an expert group convened by the NIH recommends beginning pediatric studies of new TB drugs and drug regimens as soon as efficacy and safety have been established in adults.54
As a result of this longstanding lag, most pediatric research to date has focused on playing catch-up. These efforts have begun to produce discernable momentum in the last year.55 The TB Alliance, with funding from UNITAID, expects to introduce appropriately dosed pediatric formulations of first-line TB drugs by the end of 2015.56 There are also studies under way or planned to evaluate preventive therapy for children exposed to MDR-TB; treatment shortening for less severe forms of TB in children; and treatment for TB meningitis.57
Funding for pediatric TB R&D demonstrates less progress. In 2014, funders gave $25.7 million to research related to pediatric TB, equal to the $25.3 million spent in 2013. This figure includes any drug, vaccine, diagnostic, basic-science, or operational research with an explicit focus on infants, children, adolescents,

27
Pediatric TB R&D Funders by Rank, 2014
2014 RANK
FUNDING ORGANIZATION
FUNDER TYPE
2014 PEDIATRIC TB R&D FUNDING
PERCENTAGE OF TOTAL 2014 PEDIATRIC TB R&D FUNDING
TOTAL 2014 TB R&D FUNDING
1U.S. National Institutes of Health, Other Institutes and Centers (NIH Other ICs)
P $6,077,122 23.60 $37,988,748
2U.S. National Institutes of Health, National Institute of Allergy and Infectious Diseases (NIAID)
P $4,170,434 16.20 $168,013,064
3 UNITAID M $3,444,522 13.38 $4,974,522
4European and Developing Countries Clinical Trials Partnership (EDCTP)
P $2,840,939 11.03 $6,564,042
5 Macleods Pharmaceuticals C $2,500,000 9.71 $2,500,000
6 Wellcome Trust F $1,692,707 6.57 $14,541,329
7U.K. Medical Research Council (U.K. MRC)
P $1,526,916 5.93 $11,588,045
8 Company V C $1,103,696 4.29 $15,361,586
9 Bill & Melinda Gates Foundation F $500,000 1.94 $128,408,895
10 Médecins Sans Frontières F $317,758 1.23 $936,253
11U.K. National Institute for Health Research
P $289,869 1.13 $3,705,204
12 Canadian Institutes of Health Research P $280,090 1.09 $4,707,942
13French National Agency for AIDS Research (ANRS)
P $197,018 0.77 $1,933,838
14French National Agency for Research (ANR)
P $153,671 0.60 $2,865,585
15Colombia Ministry of Health and Social Protection
P $132,500 0.51 $350,519
16 Thrasher Research Fund F $110,000 0.43 $110,000
17 UBS Optimus Foundation F $96,934 0.38 $96,934
18 Australian Research Council P $84,726 0.33 $1,019,066
19 World Health Organization (WHO) M $65,968 0.26 $649,888
20South African Medical Research Council (SAMRC)
P $51,808 0.20 $2,515,493
21 Firland Foundation F $40,000 0.16 $133,827
22Norwegian Knowledge Centre for the Health Services
P $37,495 0.15 $37,495
23 Taiwan Centers for Disease Control P $19,647 0.08 $987,002
24National Research Foundation South Africa
P $13,334 0.05 $705,924
25 Harry Crossley Foundation F $1,885 0.01 $1,885
TOTAL $25,749,039
TABLE 3

28
or pregnant women. While this is a large increase from the $6.9 million spent in 2010, the first year TAG estimated pediatric TB R&D spending, it keeps the field far off track from spending $200 million on pediatric TB research be-tween 2011 and 2015, a goal called for in the Roadmap for Childhood Tuber-culosis.58 Between 2011 and 2015, the world spent $80 million on pediatric TB research, just 40 percent of the $200 million target.
In Sharon Nachman’s view, “the amount of resources spent on pediatric TB is poor. It suggests that funders either believe that it’s not an issue, it can’t be ‘studied,’ or that there is some amount of naïveté that children don’t get TB or that they are not dying from it.” The IMPAACT network, which Nachman leads, spent $1.1 million on pediatric TB drug research in 2014, and NIAID, where IMPAACT is housed, spent a total of $4.2 million. Outside of NIAID, other NIH institutes and centers spent a combined $6.1 million on pediatric TB R&D, with $4.9 million of this coming from the NICHD. Other leading funders of pediatric TB research include multilateral and public agencies based in Eu-rope. UNITAID gave $3.4 million to support the TB Alliance; the European and Developing Countries Clinical Trials Partnership (EDCTP) spent $2.8 million on clinical trials of TB diagnostics, drugs, and vaccines; and the Wellcome Trust gave $1.7 million.
The oft-repeated adage that the pediatric TB drug market is too small to at-tract pharmaceutical investment is true—but to a lesser extent than is usually acknowledged. Seventy-five percent of funding for pediatric TB R&D in 2014 came from public agencies. Yet Macleods Pharmaceuticals has responded to urgent calls long disregarded by others and invested up to $2.5 million in developing formulations for second-line TB drugs in children for which formal WHO consensus on appropriate dosing is forthcoming. In this case, industry investment has actually led public involvement. Aside from Macleods, Compa-ny V spent $1.1 million on pediatric TB drug research in 2014, and Otsuka, although it did not report its pediatric-specific investments to TAG, continued to support a delamanid safety study in children.
A NOTE ON PEDIATRIC TB R&D RESOURCE TRACKING METHODOLOGY
TAG asked all funders to delineate support for pediatric TB research in their survey submissions. We further identified pediatric TB research by conducting a keyword search of titles and abstracts contained in returned surveys. Search terms included “pediatric,” “paediatric,” “infant,” “child,” “kid,” “adolescent,” and “preg-nant.” While this methodology provides a reasonable estimate, it overlooks research that informs the development of pediatric prod-ucts without enrolling children or studying TB in them directly. Some funders have notified TAG that they lack the means to disaggregate pediatric research from their overall TB R&D spending. Otsuka, for example, did not report the fraction of the $53.2 million it invested in TB drug R&D in 2014 that went to studies of delamanid in younger age cohorts. TAG encourages all funders to develop ways of identifying and disaggregating pediatric TB research spending from within larger totals.
The amount of resources spent on pediatric TB is poor. It suggests that funders either believe that it’s not an issue, it can’t be ‘studied,’ or that there is some amount of naïveté that children don’t get TB or that they are not dying from it.
—Sharon Nachman, principal investigator and
chair of the IMPAACT network; professor of pediatrics, Stony Brook University

29
Trends in TB R&D Funding among Product Development Partnerships
Total TB R&D Spending by PDPs, 2005–2014
Aeras FIND
$15,000,000
$30,000,000
$0
$60,000,000
TB Alliance TBVI
$45,000,000
2005 $18,580,139 $7,874,983 $6,778,239 N/A
2006 $25,923,809 $14,808,362 $5,492,942 N/A
2007 $37,704,051 $22,624,182 $1,145,409 N/A
2008 $48,679,266 $26,885,734 $14,177,202 $339,741
2009 $50,792,515 $35,643,490 $9,975,320 $841,333
2010 $41,572,980 $37,538,794 $8,212,896 $3,700,914
2011 $38,166,117 $27,824,033 $13,938,587 $4,731,422
2012 $38,904,315 $34,388,929 $5,726,157 $3,434,338
2013 $38,515,120 $33,104,121 $4,267,945 $2,169,584
2014 $45,620,984 $35,330,086 $3,788,686 $1,140,577
FIGURE 13
Four PDPs are active in TB research: the TB Alliance pursues research to develop new drugs and drug regi-mens to treat DS-TB and DR-TB; Aeras and TBVI conduct preclinical and clinical trials of TB vaccines; and FIND supports a range of diagnostic developers. The not-for-profit business model on which these groups op-erate is designed to bring together public, private, philanthropic, and academic resources to tackle diseases that attract little commercial attention. The Gates Foundation remained the principal supporter of PDPs in 2014, giving $44.6 million to Aeras, $35.9 million to the TB Alliance, $7.7 million to FIND, and $562,563 to TBVI. Other major sources of PDP funding in 2014 came from international development agencies, most notably DFID, USAID, DGIS, and NORAD.
The numbers in figure 13 represent the annual costs (external and internal) of research activities reported by each PDP. TAG tracks PDP spending separately from other institutions in this report since PDPs rely on out-side funding and do not serve as original-source donors. In 2014, Aeras and TBVI reported respective costs of $45.6 million and $1.1 million. While Aeras and TBVI work together on a number of projects, TBVI tends to focus on discovery, preclinical, and early-stage studies. In addition to these activities, Aeras also conducts larger clinical trials. Currently, there is only one active phase IIb TB vaccine trial—a safety and efficacy study

30
of GlaxoSmithKline’s M72/AS01 vaccine candidate for which Aeras is providing support.59 The TB vaccine field is entering a period of intensified basic science, and most of the studies supported by Aeras and TBVI in 2014 were either preclinical activities or smaller phase I and IIa investigations.60
The TB Alliance reported R&D expenses of $35.3 million in 2014—a $2.2 million increase over the amount it spent in 2013. This increase reflects a flurry of activity in the TB Alliance’s clinical development program over the past year. In 2014, the TB Alliance initiated a number of clinical trials, including the STAND study, a phase III trial of a three-drug regimen (pretomanid, pyrazinamide, and moxifloxacin) that, if shown to be safe and efficacious, could shorten the duration of DS-TB treatment from six months to four months and shorten treatment for some forms of DR-TB to six months. The TB Alliance also began testing the novel combination of bedaquiline, linezolid, and pretomanid in people with XDR-TB,61 advanced new TB drug compound TBA-354 into phase I,62 and initiated work to define a dose of linezolid that preserves the drug’s powerful efficacy while minimizing its substantial toxicities.63 In recent years, the TB Alliance has also become a clearinghouse for drug compounds jettisoned by pharmaceutical companies abandoning TB research. In 2014, the TB Alliance took over the rights to develop a stable of compounds formerly owned by Novartis; it also holds the rights to develop Janssen’s bedaquiline for DS-TB.64,65 Without its own sources of income, the TB Alliance will require substantially increased support from external funders in order to quickly explore the full potential of these compounds to improve TB treatment.

31
The Way Forward: How to End the Long Wait for Funding There is a sense among the researchers and activists interviewed by TAG that TB R&D has arrived at an inflection point—a place where the slope of our progress is about to change. TB research needs and priorities have never been clearer, and the WHO’s End TB Strategy has provided a framework for placing future research alongside policy making and public-health practice as a critical field of action for the TB endgame.66 At this inflection point, will TB research keep pace with the new ambition or fall back into the cycle of repeating past mistakes? To a large extent, the answer will depend on whether the global community can break the past five years of funding stagnation with a massive increase in money for TB R&D.
“There is renewed momentum and vigor to tackle the TB problem from all an-gles—be it basic scientific research, clinical research, or operational research, all of which need to be sustained,” said Rebecca Tadokera, senior researcher at the Treatment Action Campaign, expressing the pragmatic optimism voiced by many of the scientists and activists with whom TAG spoke. This optimism rests on the feeling that good, testable ideas—informed by the scientific successes and disappointments of the last ten years—are in hand; all that’s missing is the money to take them forward. Hovering around this optimism, however, is a kind of nervous energy, drawn from knowing that the TB field has reached this point several times before and failed to raise the science to the level needed to end the TB epidemic.
The impatience to go forward this time acknowledges that we are not just racing against ourselves. Even as we count down to the goals of the five-year Global Plan, the 15-year SDG framework, and the 20-year End TB Strategy, we are also trying to outrun the development and spread of DR-TB. As Dick Chais-son commented, “the pace of discovery and development of new TB drugs is too slow for the millions who continue to suffer and die from our current inadequate regimens.” Securing the increased funding TB R&D needs to meet the expectations of these global frameworks and overcome the accelerating dynamics of DR-TB will be difficult. It will require, at a minimum, tripling the resources available today and maintaining this higher level over time by protecting it from the erosions of inflation and the corrosive effects of political amnesia. In all likelihood, it will require much more than this.
So where is $1.3 billion per annum or more going to come from? Many indi-viduals interviewed by TAG offered their ideas for how the TB research field can mobilize additional funding. Several common themes emerged, which TAG compiled into the recommendations below, told primarily through the words of interviewees themselves. These recommendations look inward—speaking to the demands around which members of the TB research community should organize—but, ultimately, they look outward and articulate a set of actions that funders in a variety of sectors and countries must take to unlock much-needed resources and channel them in the most promising directions.
There is renewed momentum and vigor to tackle the TB problem from all angles—be it basic scientific research, clinical research, or opera-tional research, all of which need to be sustained.
—Rebecca Tadokera, senior researcher,
Treatment Action Campaign

32
Country Contributions to TB R&D, 2014
FIGURE 14
Eur
ope
by C
ount
ry
Uni
ted
Kin
gdom
$
44
,54
0,3
05
Ger
man
y $
11
,68
4,0
01
Fran
ce
$8
,04
9,7
93
Sw
itze
rlan
d $
7,8
34
,73
7
The
Net
herl
ands
$
3,7
67
,12
1
Den
mar
k $
3,5
50
,54
1
Nor
way
$
3,5
39
,07
1
Sw
eden
$
2,1
22
,92
3
Spa
in
$4
83
,35
7
Aus
tral
ia
$6
,36
0,9
73
Bra
zil
$1
,37
3,2
44
Can
ada
$5
,82
6,4
92
Uni
ted
Sta
tes
$2
47
,04
5,6
38
Taiw
an
$1
,01
7,0
02
Sou
th K
orea
$
1,3
70
,66
3 New
Zea
land
$
1,5
51
,02
1
Gab
on
$5
09
,77
3
Indi
a $
9,0
69
,67
4
Japa
n $
2,7
30
,10
1
Sou
th A
fric
a $
4,7
43
,30
4
Eur
opea
n U
nion
Tot
al
$4
1,9
76
,39
4
Sin
gapo
re
$8
,12
9,8
46
Arg
enti
na
$1
32
,40
6
Chi
le
$2
63
,89
6
Col
ombi
a $
35
0,5
19
Per
u $
34
8,4
17
Hon
g K
ong
$2
93
,30
2

33
1. Diversify the funding baseOver 75 percent of all money spent on TB R&D in 2014 came from just 10 organizations, and 44 percent came from the two largest. The NIH and the Gates Foundation gave twice as much to TB R&D as the next-largest funder, Otsuka, which itself gave more to TB research than all other pharmaceuti-cal companies combined. Manica Balasegaram summarized the situation this way: “Today we see an even greater dependence on a single philanthropic organization, while only one public funder is doing its fair share of the heavy lifting. . . . The contributions of Gates and the NIH dwarf all others, and there is a clear need to diversify further; European countries, especially France and Germany, as well as the BRICS countries, can and should contribute much more to TB R&D efforts.”
Several individuals echoed this call for greater diversity of funders. “It’s not a case of, ‘what can we do with money from existing donors?’; it’s ‘how can we find new money?’ We need to find new funders and innovative ways of funding,” said Gavin Churchyard. “We should not keep [asking] just the usual suspects,” agreed Lucica Ditiu. “Besides looking to donor organizations, it’s high time that the countries worst affected by TB—particularly the BRICS countries—put resources on the table for TB R&D. The BRICS countries have huge untapped potential.”
Relative to the sizes of their economies, many smaller nations are outspending European countries on TB research (see table 4). While the European Union spent the third-largest amount of money on TB R&D in 2014—$41.9 mil-lion—as a percentage of its gross domestic product (GDP), this ranks only 16th among all countries. (GDP measures the total dollar value of all goods and services produced in a country over a specific period of time and offers a proxy for the size of a country’s economy.) Singapore spends more on TB R&D as a percentage of its GDP than any other nation, followed by the United Kingdom, the United States, South Africa, and Switzerland. Some European nations, such as Sweden and Germany, rank high in terms of the percentage of their GDP that goes to all forms of R&D (biomedical and otherwise) but rank much lower when it comes to TB R&D. Given their serious commitments to research and innovation, these countries could make a measurable difference if they directed more money to TB research.
Among the world’s largest economies, some countries already fund TB R&D at a level commensurate with their GDP and overall spending on R&D. This cate-gory includes the United States and the United Kingdom, which gave a respec-tive $247 million and $44.5 million to TB R&D in 2014, ranking first and sec-ond in absolute terms. Both nations also rank high in terms of TB R&D funding as a percentage of GDP, indicating that they are supporting TB research at the level that would be expected given their considerable wealth. Other large econ-omies, however, give far less than they could. Japan ranks third in terms of the percentage of its GDP spent on R&D, yet it is 22nd in terms of the percentage that goes to TB research. Sweden and South Korea also perform poorly under this comparison. Sweden and South Korea spend a greater percentage of GDP on research than other countries, yet rank only 12th and 20th when judged by TB R&D funding as a share of GDP.
Many interviewees highlighted the BRICS countries as places where one would expect to find more money for TB research given their large burden of TB and the size of their economies (representing 30% of global GDP in 2015). With the exception of the Indian Council of Medical Research, BRICS country public agencies remain conspicuously absent from the top 30 TB R&D funders. Gar-nering more support from BRICS nations will require stronger accountability mechanisms. Promises made should be kept, and pledges committed should be called in for account. In the 2012 Delhi Communiqué, ministers of health from the BRICS countries resolved to jointly tackle MDR-TB through collabo-ration on TB research. Three years later, this communiqué is remembered only for its rhetoric. India and Brazil rank ninth and 23rd in terms of the money
Today we see an even greater dependence on a single phil-anthropic organization, while only one public funder is do-ing its fair share of the heavy lifting. . . . The contributions of Gates and the NIH dwarf all others, and there is a clear need to diversify further; European countries, especially France and Germany, as well as the BRICS countries, can and should contribute much more to TB R&D efforts.
—Manica Balasegaram, executive director,
Médecins Sans Frontières Access Campaign

34
Country Funding for R&D and TB R&D as a Percentage of GDP
COUNTRYTB R&D FUNDING 2014
GDP 2014 (IN BILLIONS)
EXPENDITURE ON R&D AS PERCENTAGE OF GDP 2005–2014
R&D EXPENDITURE AS PERCENTAGE OF GDP RANK ORDER
TB R&D EXPENDITURE AS PERCENTAGE OF GDP RANK ORDER
Singapore $8,129,846 $308 2.10 13 1
United Kingdom $44,540,305 $2,942 1.72 15 2
United States $247,045,638 $17,419 2.79 7 3
South Africa $4,743,304 $350 0.76 20 4
Switzerland $7,834,737 $685 2.87 6 5
Denmark $3,550,541 $342 2.98 4 6
New Zealand $1,551,021 $188 1.27 17 7
Norway $3,539,071 $500 1.65 16 8
India $9,069,674 $2,067 0.81 19 9
Australia $6,360,973 $1,454 2.39 9 10
The Netherlands $3,767,121 $870 2.16 11 11
Sweden $2,122,923 $571 3.41 2 12
Canada $5,826,492 $1,787 1.73 14 13
European Union $41,976,394 $13,403 2.14 12 14
Germany $11,684,001 $3,853 2.92 5 15
France $8,049,793 $2,829 2.26 10 16
Taiwan* $1,017,002 $530 2.70 8 17
Chile $263,896 $258 0.42 23 18
Hong Kong $293,302 $291 0.75 21 19
South Korea $1,370,663 $1,410 4.04 1 20
Colombia $350,519 $378 0.17 24 21
Japan $2,730,101 $4,602 3.39 3 22
Brazil $1,373,244 $2,346 1.21 18 23
Argentina $132,406 $540 0.65 22 24
* Data on GDP taken from the National Statistics Bureau of the Republic of China (Taiwan); all other data on GDP and R&D expenditure come from the World Bank.
TABLE 4

35
each spends on TB R&D as a percentage of GDP, behind countries such as New Zealand, Denmark, Switzerland, and Norway—places with much lower burdens of disease and smaller economies. Among the BRICS countries, South Africa is leading the way and ranks fourth judged by TB R&D funding as a percentage of GDP. However, the absolute amount of money spent by South Africa—$4.7 million in 2014—is modest. If South Africa tripled its annual funding for TB R&D to $15 million, it would rank first among all nations in terms of TB R&D measured against GDP and would spend more in absolute terms than Canada, France, and Australia. Tripling funding for TB research is a realistic and worthy goal for South Africa’s government to pursue over the next three years.
Although much attention focuses on the BRICS countries, smaller nations at varying income levels can make a meaningful difference in TB R&D funding. Given the small base of available funding, a country would not need to spend close to its full treasury to lift the field. In 2014, to rank among the top 10 funders of TB R&D, an organization only needed to spend more than $12 million. In Asia, Singapore, South Korea, Taiwan, and Hong Kong already sup-port TB R&D, despite having relatively low disease burdens. If each of these nations just doubled its 2014 spending, it would yield an extra $11 million in funding per year. Gavin Churchyard also pointed out that African ministers of health pledged to spend at least two percent of their annual health budgets on research at the 2007 African Union Conference of Ministers of Health: “That has not materialized. If every African nation honored that commitment and contributed two percent of their annual budget for research in TB and HIV, it could be a substantial contribution.”
Encouraging countries to invest more in TB research will require demonstrating the connection between TB R&D and TB programs. As Manica Balasegaram observed, a decade of funding shortfalls in TB R&D “reflects a lack of under-standing that research is a key element in disease control. Greater investments in the past may have led to far better tools to help better control TB today.”
Bridging these two worlds will require two sets of actions. The first will show that TB research and TB programs are two sides of the same coin—especially when the overall supply of coins is limited. One organization that could lead the way here is the CDC, where the Division of TB Elimination has for decades maintained branches dedicated to TB programs and TB clinical research, a symbiosis that has required illustrating the relevance each has for the oth-er. The second involves working with countries to identify locally relevant TB research priorities and turn these into coherent TB research roadmaps. The WHO’s intention to work with “pathfinder countries” to develop national stra-tegic plans for TB research has kicked off these important conversations in India, Brazil, South Africa, Peru, Vietnam, and Indonesia.67 This effort should be expanded to a wider array of nations. The WHO should also ensure that national strategic plans include mechanisms for holding countries accountable for honoring new commitments to TB research. One option would be to reserve dedicated funding for civil-society groups to monitor the implementation of national strategic plans.
2. Invest in the next generation of scientistsNational strategic plans for TB research will be useful only insofar as scientists in these countries receive adequate financial support. Many of the experts TAG interviewed described limited funding as a major impediment to attracting, training, and retaining scientific talent. As Gilla Kaplan explained: “If you train scientists and they can’t get jobs in TB, they’re going to go elsewhere. A young scientist today looking at the funding landscape is very unlikely to go into a topic of research that’s so difficult and competitive. So the amount of resources for TB R&D has a major impact on the pool of TB researchers.”
In David Lewinsohn’s estimation, “talent will follow the resources,” and this relationship holds everywhere, whether in the United States and Europe or in
We need to expect more from the BRICS countries, but we also need to ensure that these monies are spent to achieve and sustain high-quality research.
I feel it should be our prior-ity to develop and promote top-quality researchers from those countries affected by the epidemic who will have the ability to maintain a high-quality research program.
—David Lewinsohn, professor of pulmonary
and critical care medicine, Oregon Health & Science University

36
developing countries. The next cohort of TB scientists should draw more of its membership from BRICS country scientists, which will require these govern-ments to invest in young researchers. “We need to expect more from the BRICS countries, but we also need to ensure that these monies are spent to achieve and sustain high-quality research,” said Lewinsohn, a professor of pulmonary and critical care medicine at Oregon Health & Science University. “I feel it should be our priority to develop and promote top-quality researchers from those countries affected by the epidemic who will have the ability to main-tain a high-quality research program.” Funding institutions in North America, Europe, and Japan have an important role to play in providing capacity build-ing, mentorship, and avenues for collaborative scholarship. The EDCTP, with its emphasis on building research capacity while conducting clinical trials in Africa, offers one model that could be replicated in other settings.
Nearly all funders of basic-science research are public agencies, with the no-table exceptions of the Gates Foundation and the Wellcome Trust. Increased support for basic-science research is most likely to come from governments. However, the angle for securing more government funding for TB basic science is oblique rather than direct. Most public agencies that fund scientific research do not issue calls for TB-specific proposals and instead pursue undirected grant making. For example, in 2014 the U.S. National Science Foundation (NSF) had an annual budget of $7.2 billion and funded 21 percent of all basic research at U.S. universities (excluding basic science supported by the NIH increases the NSF’s share to 58%).68 Yet NSF funding for TB research in 2014 totaled just $200,000 for four active awards. The same characterization de-scribes the U.S. Army’s Congressionally Directed Medical Research Programs (CDMRP), where TB has not counted among the priority disease areas in re-cent calls for investigator-initiated proposals. In 2014, the CDMRP disbursed $1.1 million to TB research, an amount that pales in comparison to the tens of millions the U.S Army and other branches of the U.S. armed forces spend on research related to HIV, malaria, hemorrhagic fever, and other illnesses.69
Established TB researchers may be able to take advantage of undirected fund-ing to maintain their research programs, but more purposeful funding streams will be required to encourage young scientists to dedicate their careers to TB research. Creating TB-specific funding channels within agencies like the NSF may sound enticing, but this strategy would radically invert the missions of national science foundations and institutes of health in ways that may have unintended consequences. One can imagine how competition among disease areas to establish earmarked funding programs would create acrimony, fracture solidarity, and result in a system that poorly reflects the way disparate ailments can affect the same person at the same point in time. A more attractive middle way would have professional societies help TB researchers identify relevant opportunities and apply for funding through undirected programs. Creating and maintaining a compendium of funding calls amenable to TB-related basic- science research would be a good place to start. This idea, first proposed at a global consultation on research for TB elimination convened by the WHO in Stockholm in December 2014, should be taken forward quickly.70
3. Finance and govern research differently“Within the TB research community, the most important lesson that we should have learned if we haven’t learned it, is that if we don’t pool our resources and our skills and our new ideas and work together, we’re not going to utilize the resources optimally.” With these remarks, Gilla Kaplan identified the urgent need for stakeholders involved in TB R&D to find better ways of working togeth-er. The particulars for how this cooperation should proceed are up for debate, and some in the TB research world have proposed specific initiatives to this end.71,72,73 These proposals draw from a stable of concepts that includes patent pools, prize funds, portfolio management, technology transfer initiatives, and knowledge banks, each of which could be implemented singly but would be
Within the TB research com-munity, the most important lesson that we should have learned if we haven’t learned it, is that if we don’t pool our resources and our skills and our new ideas and work together, we’re not going to utilize the resources optimally.
—Gilla Kaplan, director, tuberculosis program, Bill & Melinda Gates Foundation

37
more powerful in combination. Each refers to a specific way of structuring financial incentives, managing risk, and governing ownership of research. All carry ramifications for who owns the products of research and whether people with TB will be able to access them equitably and without undue delay.
In TB drug R&D, one proposal that includes many of these ideas is Médecins Sans Frontières’s 3P Project. The goal is to facilitate the development of new TB drug regimens and move away from the current approach of developing new drugs singly as additions to existing regimens.74 The three Ps stand for “push, pull, pool,” described by Manica Balasegaram as follows: “These mechanisms include ‘push’ funding through grants, ‘pull’ funding through milestone prizes, and ‘pooling’ of data and intellectual property to ensure open, collaborative research and fair licensing for competitive production of the final products.” Participating developers would receive grants to finance R&D upfront (push funding) and monetary prizes for products that reach predetermined milestones (pull funding). But to receive these, they would need to agree to pool intellectual property (IP) and data so that their compounds could be studied together with others.
TB vaccine developers are also making plans for scientific collaboration and joint financing. Major players in the TB vaccine world have taken steps to form a Global TB Vaccine Partnership. As envisioned, this body would bring together scientists, funders, vaccine developers, and other stakeholders to channel funding to-ward the most promising TB vaccine candidates using consensus scientific criteria for deciding which ones to move forward into different stages of clinical testing (i.e., portfolio management).75 Some members of civil society have suggested that the Global TB Vaccine Partnership, in addition to advising on the direction of funding, could play a similar role to the 3P Project by serving as a platform for pooling IP, transferring technology, and sharing knowledge among TB vaccine developers and manufacturers in high- and low- income countries.76 Enabling developing-country vaccine manufacturers to produce and distribute new TB vaccines through the transfer of technology, industrial expertise, and nonrestrictive IP would help reduce the usual delay between the introduction of a new vaccine in high-income countries and its rollout in low- and middle-income countries where need for most new vaccines is greatest.77
Regardless of the specific strategies selected, the TB R&D field needs financing structures that are as inno-vative as the research scientists aspire to conduct. Creating open and collaborative financing mechanisms would spur involvement in TB product development by signaling the availability of resources and partner-ships throughout the pipeline—an essential encouragement to research groups with promising diagnostic platforms, drug compounds, or vaccine constructs but without reliable sources of capital or in-house techni-cal skills. “It’s very difficult to start developing a product without knowing what to rely on for funding as you go along the pipeline,” reflected Lucica Ditiu. “You can have a great molecule in the first phases of trials, but you need more solid ground . . . in order to take your product through to the end.” Given that 62 percent of TB R&D funding comes from the public sector, financing strategies that combine resources under open, transparent frameworks would also make efficient use of limited public resources and offer assurances to country governments that investing in TB research would represent sound stewardship of public tax dollars.
4. Capture and keep political attentionMobilizing the resources required to make these and other proposals a reality will require new ways of harnessing and sustaining political will. Past efforts to capture political support for TB research have been mostly reactive in nature. Often, this has involved seizing the media spotlight in the wake of lamentable news—usually outbreaks of extensively drug-resistant TB (XDR-TB) or sensational stories of individuals with MDR-TB traveling from one country to another. It is not clear that these fleeting moments of alarm have produced any stable increase in TB R&D funding. Ruth McNerney pointed out that “the emergence of XDR-TB has been a wake-up call for policy makers but, as yet, hasn’t triggered a big increase in funding.”
The TB community has slept through many wake-up calls. The resurgence of TB in the wake of HIV was one. The DR-TB alarm was ringing for decades before an outbreak of XDR-TB in Tugela Ferry, South Africa, captured headlines in 2006.78 In the late 1980s, an outbreak of MDR-TB struck New York City, the heart of the global financial system, and cost the city $1 billion to contain.79 As part of its response, the U.S. government committed more money to TB research, but even MDR-TB in close proximity to Wall Street did not summon the level of R&D funding needed to eliminate TB in the United States, much less globally.
In the past 25 years, funding for TB research has grown most in the wake of calamity. The largest increase in TB R&D funding came in 2009 when the U.S. government released emergency stimulus money to respond to the global financial crisis. The TB research community cannot afford to jump from one disaster to another in search of its next windfall. The field should break its dependency on the politics of fear—typified by the irrational response to Ebola by some U.S. politicians80—and move toward more positive, farsighted politics.

38
TB does not need to be made glamorous, as is often suggested. Nor does TB R&D need the star power of celebrity to buoy its fortunes. It needs the strenuous, easy-to-overlook work of movement building and legislative organizing. Thankfully, this work has already begun. The Global TB Caucus, formed through the Barcelona Declaration in 2014, now includes 611 parliamentarians from 97 countries dedicated to fighting TB.81 To date, the caucus has focused primarily on supporting replenishment of the Global Fund and prepar-ing for the rollout of the next Global Plan.82 In the future, its members should adopt TB R&D financing as a core component of its agenda and work to secure financial commitments for TB research in their countries. Activists, for their part, should monitor budgets and audit public pledges to ensure that these commitments turn into real disbursements matching the promised amounts.
Ultimately, bringing more policy makers into the fight against TB will require forging stronger ties between TB R&D and larger social movements advocating for health, sustainable development, and an end to pover-ty. Speaking at the Fourth Global Forum on TB Vaccines in Shanghai, China, Michel Kazatchkine, the UN Secretary-General’s Special Envoy on HIV/AIDS in Eastern Europe and Central Asia, urged those working in TB R&D to frame this work as a global public good and, in doing so, to illustrate the case for investing in TB research as an essential part of achieving larger global goals.83 This advice will only become more important in the coming decade as TB takes its place alongside the crowded chorus of issues in the SDGs. For activists, taking up Kazatchkine’s call will require looking outside the small band of professional TB activists to form ties with those working on HIV, human rights, access to medicines, gender equality, child survival, maternal health, and poverty reduction. Without looking outside the fences of our own field to forge new forms of solidarity, the wait for funding will continue, making it more likely that the next 10 years will look much like the last.
ConclusionSince 2005, the world has spent $5.7 billion on TB research, but the pace of growth in funding has slowed since 2009 and, in some years, decreased compared with the previous year. During this period, annual funding for TB R&D never satisfied the Global Plan targets, turning the last decade into one of missed op-portunities. Although it left us far off track from satisfying global goals, this $5.7 billion taught us many things—including some forgotten from previous eras—that have made it clear where future research must go. Getting there will require a massive increase in funding over the next decade. The new TB elimination agenda has created higher ambitions that research over the coming years must match. Elevating funding to necessary levels will require expanding the donor base beyond 10 core organizations. New money will need to come from new players and will need to be spent collaboratively, including through innovative platforms that enable TB R&D to be financed and owned jointly. Breaking out of the reactionary politics that have de-fined earlier attempts at engaging policy makers would help to ensure that TB research remains a priority in lean times and benefits in times of plenty. We cannot spend any more time waiting. Without fully funding TB R&D, there is a real danger of repeating the past instead of achieving a future free of TB.

39
Endnotes1. United Nations. Transforming our world: the 2030 agenda for sustainable development (A/70/L.1) [Internet].
New York: United Nations; 2015 September 18 (cited 2015 October 6). Available from: https://sustainabledevelopment.un.org/post2015/transformingourworld.
2. United Nations. MDG goal 6: combat HIV/AIDS, malaria and other diseases [Internet]. (date unknown) (cited 2015 October 6). Available from: http://www.un.org/millenniumgoals/aids.shtml.
3. McMillan C. Discovering tuberculosis: a global history, 1900 to present. New Haven: Yale University Press; 2015. p. 5–8.
4. Stop TB Partnership. The global plan to stop TB, 2011–2015. Geneva: World Health Organization; 2011. Available from: http://www.stoptb.org/global/plan/. (Accessed 2015 September 12)
5. World Health Organization. Global tuberculosis report 2015. Geneva: World Health Organization; 2015. Available from: http://www.who.int/tb/publications/global_report/en. (Accessed 2015 November 4)
6. Harrington M. The TB diagnostics pipeline. In: Clayden P, Collins S, Frick M, et al.; i-base/Treatment Action Group. 2015 pipeline report. Edited by Andrea Benzacar. New York: Treatment Action Group; 2015. Available from: http://www.pipelinereport.org/2015/tb-diagnostics. (Accessed 2015 September 17)
7. Churchyard G, McCarthy K, Fielding KL, et al. Effect of Xpert MTB/RIF on early mortality in adults with suspected TB: a pragmatic randomized trial (Abstract 95). Paper presented at: 22nd Conference on Retroviruses and Opportunistic Infections; 2015 February 23–26; Seattle, WA.
8. Theron G, Zijenah L, Chanda D, et al. Feasibility, accuracy, and clinical effect of point-of-care Xpert MTB/RIF testing for tuberculosis in primary-care settings in Africa: a multicentre, randomised, controlled trial. Lancet. 2014 Feb;383(9915):424–35. doi: 10.1016/S0140-6736(13)62073-5.
9. World Health Organization. Global tuberculosis report 2014, Geneva: World Health Organization; 2014. Available from: http://www.who.int/tb/publications/global_report/en. (Accessed 2015 September 12)
10. Ibid.
11. Pietersen E, Ignatius E, Streicher E, et al. Long-term outcomes of patients with extensively drug-resistant tuberculosis in South Africa: a cohort study. Lancet. 2014 Apr;383(9924):1230–9. doi: 10.1016/S0140-6736(13)62675-6.
12. Cox H, Furin J, Mitnick D, Daniels C, Cox V, Goemaere E. The need to accelerate access to new drugs for multidrug-resistant tuberculosis. Bull World Health Organ. 2015 Jul;93(7):491–7. doi: 10.2471/BLT.14.138925.
13. Brigden G, Nyang’wa B, du Cros P, et al. Principles for designing future regimens for multidrug-resistant tuberculosis. Bull World Health Organ. 2014;92(1):68–74. doi: 10.2471/BLT.13.122028.
14. McShane H. Tuberculosis vaccines: beyond bacilli Calmette-Guérin. Philos Trans R Soc Lon B Biol Sci. 2011 Oct 12; 366(1579):2782–9. doi: 10.1098/rstb.2011.0097.
15. Dye C, Glaziou P, Floyd K, Raviglione M. Prospects for tuberculosis elimination. Annu Rev Public Health. 2013;34:271–86. doi: 10.1146/annurev-publhealth-031912-114431.
16. Uplekar M, Weil D, Lonnroth K, et al. WHO’s new End TB Strategy. Lancet. 2015 May;2385(9979):1799–1801. doi: 10.1016/S0140-6736(15)60570-0.
17. Fauci A. Fighting TB should be a priority. MSNBC [Internet]. 2009 November 11 (cited 2015 September 18). Available from: http://www.nbcnews.com/id/33890464/ns/health-infectious_diseases/t/opinion-fighting-tb-should-be-priority/.
18. OANDA. Using OANDA rates for currency conversion [Internet]. (date unknown) (cited 2015 September 18). Available from: http://www.oanda.com/help/how-to-read-currency-conversion-results#HowDoIChoose.
19. Mohammed Yassin (Global Fund to Fights AIDS, TB and Malaria, Geneva, Switzerland). E-mail with: Mike Frick (Treatment Action Group, New York, NY). 2015 September 1.
20. Ibid.
21. Don’t hide the decline. Nature. 2014 Mar 13;507(7491):139. doi: 10.1038/507139a.
22. amfAR and Treatment Action Group. The costs flat funding for biomedical research. Washington, D.C.: amfAR, the Foundation for AIDS Research; 2013. Available from: http://www.amfar.org/articles/on-the-hill/2013/issue-brief--the-costs-of-flat-funding-for-biomedical-research/. (Accessed 2015 September 18)
23. Department of Health and Human Services (U.S.). Biomedical research and development price index (BRDPI): fiscal year 2013 update and projects for FY 2014–FY 2019 [Internet]. 2014 January 15 (cited 2015 September 18). Available from: http://officeofbudget.od.nih.gov/pdfs/FY15/BRDPI_Proj_Jan_2014_508.pdf.
24. Creswell J, Sahu S, Sachdeva K, et al. Tuberculosis in BRICS: challenges and opportunities for leadership within the post-2015 agenda. Bull World Health Organ. 2014 Jun;92(6):459–60. doi: 10.2471/BLT.13.133116.
25. McMillan C. Discovering tuberculosis.
26. Harrington M. The TB diagnostics pipeline.
27. UNITAID. 2014 tuberculosis diagnostics technology and market landscape, 3rd edition. Geneva: World Health Organization; 2014. Available from: http://www.unitaid.eu/images/marketdynamics/publications/UNITAID_TB_Diagnostics_Landscape_3rd- edition.pdf. (Accessed 2015 September 19)
28. McKenna L. Punk’d by pharma: public funds for private products. TAGline. 2014;21(1):14–5. Available from: http://www.treatmentactiongroup.org/tagline/2014/spring/punked-pharma-public-funds-private-products. (Accessed 2015 September 12)

40
29. Stop TB Partnership. Buy-down agreement to reduce cost of Xpert MTB/RIF by 40% for high-burden countries [Internet]. 2012 August 21 (cited 2015 October 7). Available from: http://www.stoptb.org/wg/new_diagnostics/assets/documents/News_XpertPrice_21Aug12.pdf.
30. Lessem E. The tuberculosis treatment pipeline: moving beyond “making the most of what we’ve got. In: Clayden P, Collins S, Frick M, et al.; i-base/Treatment Action Group. 2015 pipeline report. Edited by Andrea Benzacar. New York: Treatment Action Group; 2015. Available from: http://www.pipelinereport.org/2015/tb-treatment. (Accessed 2015 September 17)
31. Ibid.
32. Mark Harrington (Treatment Action Group, New York, NY). E-mail with: Mike Frick (Treatment Action Group, New York, NY). 2015 October 5.
33. Dandekar V. Pfizer draws curtain on anti-infective research; refocuses on next-generation vaccines. PharmAsia News [Internet]. 2013 May 13 (cited 2015 September 19). Available from: https://www.pharmamedtechbi.com/publications/pharmasia-news/2013/5/13/pfizer-draws-curtain-on-antiinfective-research-refocuses-on-nextgen-vaccines.
34. Mullin E. Global tuberculosis R&D takes hit with AstraZeneca site closure. FierceBiotech [Internet]. 2014 February 24 (cited 2015 September 19). Available from: http://www.fiercebiotechresearch.com/story/global-tuberculosis-rd-takes-hit- astrazeneca-site-closure/2014-02-24.
35. Copley C. Novartis hands over experimental TB drugs in antibiotic pullback. Reuters [Internet]. 2014 August 20. Available from: http://www.reuters.com/article/2014/08/20/us-novartis-tuberculosis-idUSKBN0GK19J20140820. (Accessed 2015 September 13)
36. Nordrum A. Antibiotic resistance: why aren’t drug companies developing new medicines to stop superbugs? International Business Times [Internet]. 2015 March 3 (cited 2015 September 19). Available from: http://www.ibtimes.com/antibiotic- resistance-why-arent-drug-companies-developing-new-medicines-stop-1833248.
37. Koons C. Pfizer profit tops estimates as prevnar vaccine sales rise. Bloomberg News [Internet]. 2015 April 28 (cited 2015 Sep-tember 19). Available from: http://www.bloomberg.com/news/articles/2015-04-28/pfizer-cuts-2015-forecast-as-dollar-s-strength-cuts-into-sales.
38. McNeeley D (Novartis AG, Basel, Switzerland). E-mail with: Mike Frick (Treatment Action Group, New York, NY). 2015 June 25.
39. Locher C, Jones S, Hanzelka B, et al. VXc-486, a novel dual targeting GyrB/ParE inhibitor for the treatment of bacterial infec-tions: VXc-486 prodrug sterilizes Mycobacterium tuberculosis infection in combination with anti-mycobacterial drugs in vivo (Abstract F-270). Poster presented at: 54th Annual Interscience Conference on Antimicrobial Agents and Chemotherapy; 2014 September 9; Washington, D.C.
40. TB Alliance. TB Alliance advances next-generation TB drug candidate into clinical testing [Internet]. 2015 February 18 (cited 2015 September 18). Available from: http://www.tballiance.org/newscenter/view-brief.php?id=1118f.php?id=1118.
41. Katharine Jensen (AbbVie, Chicago, IL). E-mail with: Mike Frick (Treatment Action Group, New York, NY). 2015 August 6.
42. Bill & Melinda Gates Foundation. Tuberculosis strategy overview [Internet]. (date unknown) (cited 2015 September 18). Available from: http://www.gatesfoundation.org/What-We-Do/Global-Health/Tuberculosis.
43. Hanekom W. Vaccines against TB: where are we going? Paper presented at: Host Response in Tuberculosis Keystone Symposia; 2015 January 22–27; Santa Fe, NM.
44. Frick M. TB R&D’s shift to the left. TAGline;22(1):14–5. 2015 April 9. Available from: http://www.treatmentactiongroup.org/tagline/2015/spring/tb-rd%E2%80%99s-shift-left. (Accessed 2015 September 17)
45. Ibid.
46. Hannu Lang (European Commission, Brussels, Belgium). E-mail with: Mike Frick (Treatment Action Group, New York, NY). 2015 September 3.
47. Frick M. The TB vaccines pipeline: a new path to the same destination? In: Clayden P, Collins S, Frick M, et al.; i-base/Treatment Action Group. 2015 pipeline report. Edited by Andrea Benzacar. New York: Treatment Action Group; 2015. Available from: http://www.pipelinereport.org/2015/tb-vaccines. (Accessed 2015 September 17)
48. Kaufmann S, Evans T, Hanekom W. Tuberculosis vaccines: time for a global strategy. Sci Transl Med. 2015 Feb 25; 7(276):276fs8. doi: 10.1126/scitranslmed.aaa4730.
49. HIV Vaccines & Microbicides Resource Tracking Working Group. HIV Prevention Research & Development Funding Trends, 2000– 2014. New York: AVAC; 2015. Available from: http://www.avac.org/sites/default/files/resource-files/ResourceTrackingJuly2015.pdf. (Accessed 2015 September 18)
50. Pai M, Schito M. Tuberculosis diagnostics in 2015: landscape, priorities, needs, and prospects. J Infect Dis. 2015 Apr 1; 211 Suppl 2:S21–8. doi: 10.1093/infdis/jiu803.
51. Delhi Network of Positive People, Asia-Pacific Network of Positive People, Coalition of People Living with HIV in India, et al. Urgent need to scale up rapid TB test machines and cartridges. 2015 September 15. Available from: http://www.tbonline.info/media/uploads/documents/genexpert15thsep2015.pdf. (Accessed 2015 September 18).
52. Jennifer Furin (Case Western Reserve University, Cleveland, OH). E-mail with: Erica Lessem (Treatment Action Group, New York, NY). 2015 June 9.
53. Erica Lessem (Treatment Action Group, New York, NY). Personal communication with: Mike Frick (Treatment Action Group, New York, NY). 2015 September 30.
54. Nachman S, Ahmed A, Amanullah F, et al. Towards earlier inclusion of children in tuberculosis drug trials: a consensus state-ment. Lancet Infect Dis. 2015 Jun;15(6):711–20. doi: 10.1016/S1473-3099(15)00007-9.

41
55. McKenna L. Momentum in the pediatric tuberculosis treatment pipeline. In: Clayden P, Collins S, Frick M, et al.; i-base/Treat-ment Action Group. 2015 pipeline report. Edited by Andrea Benzacar. New York: Treatment Action Group; 2015. Available from: http://www.pipelinereport.org/2015/tb-pediatrics. (Accessed 2015 September 17)
56. Ibid.
57. Ibid.
58. World Health Organization, Stop TB Partnership, Treatment Action Group, International Union Against Tuberculosis and Lung Disease, U.S. Agency for International Development, U.S. Centers for Disease Control and Prevention, and UNICEF. Roadmap for childhood tuberculosis. Geneva: World Health Organization; 2013. Available from: http://www.who.int/tb/challenges/children/en/. (Accessed 2015 September 17)
59. ClinicalTrials.gov [Internet]. Bethesda (MD): National Library of Medicine (U.S.) 2000. Identifier NCT01755598, Study to eval-uate the efficacy of GlaxoSmithKline Biologicals’ candidate tuberculosis vaccine in adults; 2015 March 19 (cited 2015 April 1). Available from: https://clinicaltrials.gov/ct2/show/record/NCT01755598.
60. Frick M. The tuberculosis vaccines pipeline.
61. TB Alliance. TB Alliance launches phase 2B clinical trial of a novel TB drug regimen that could cut treatment time by half or more for a majority of TB patients [Internet]. 2014 October 22 (cited 2015 September 18). Available from: http://www.tballiance.org/newscenter/view-brief.php?id=1110.
62. TB Alliance. TB Alliance advances next-generation TB drug candidates [Internet]. 2015 February 18 (cited 2015 September 18). Available from: http://www.tballiance.org/newscenter/view-brief.php?id=1118.
63. ClinicalTrials.gov [Internet]. Bethesda (MD): National Library of Medicine (U.S.). 2000. Identifier NCT02279875, A phase 2 trial to evaluate the efficacy and safety of linezolid in tuberculosis patients; 2014 October 28 (cited 2015 October 6). Available from: https://clinicaltrials.gov/ct2/show/NCT02279875.
64. Copley C. Novartis hands over experimental TB drugs.
65. TB Alliance. [Internet]. Unique collaboration between TB Alliance and Tibotec to accelerate tuberculosis drug development. 2009 June 17 (cited 2015 September 18). Available from: http://www.tballiance.org/newscenter/view-brief.php?id=854.
66. Uplekar M. WHO’s new End TB Strategy.
67. World Health Organization. Global consultation on research for TB elimination. Stockholm: World Health Organization; 2014. Available from: http://www.who.int/tb/features_archive/researchforTBelimination_meeting/en/. (Accessed 2015 October 6)
68. National Science Foundation. FY2014 budget request. Washington, D.C.: National Science Foundation; 2013. Available from: https://www.nsf.gov/about/budget/fy2014/. (Accessed 2015 October 6)
69. Michaud J, Moss K, Kates J. The U.S. Department of Defense and Global Health. Washington, D.C.: Henry J. Kaiser Family Foundation; 2012. Available from: http://kff.org/global-health-policy/report/the-u-s-department-of-defense-global/. (Accessed 2015 October 6)
70. World Health Organization. Global consultation on research for TB elimination.
71. Trinity Partners. TB strategic expansion assessment: final report [Internet]. 2015 April (cited 2015 October 6). Available from: http://www.medicinespatentpool.org/wp-content/uploads/MPP-Intervention-in-TB-Trinity-Partners-.pdf.
72. Médecins Sans Frontières. Push, pull, pool: accelerating innovation and access to medicines for tuberculosis [Internet]. 2015 March (cited 2015 October 7). Available from: http://www.msfaccess.org/3Ps-project.
73. Kaufmann S, Evans T, Hanekom W. Tuberculosis vaccines.
74. Médecins Sans Frontières. Push, pull, pool.
75. Kaufmann S, Evans T, Hanekom W. Tuberculosis vaccines.
76. Frick M. TB R&D’s shift to the left.
77. Crager S. Improving global access to new vaccines: intellectual property, technology transfer, and regulatory pathways. Am J Public Health. 2014 Nov;104(11):e85–91. doi: 10.2105/AJPH.2014.302236.
78. McMillan C. Discovering tuberculosis.
79. Frieden T, Fujiwara P, Washko R, Hamburg M. Tuberculosis in New York City—turning the tide. N Engl J Med. 1995 July; 333(4):229–33.
80. Gonsalves G, Staley P. Panic, paranoia, and public health—the AIDS epidemic’s lessons for Ebola. N Engl J Med. 2014 Dec 18; 371(25):2348–9. doi: 10.1056/NEJMp1413425.
81. Global TB Caucus. The Barcelona declaration. Global TB Caucus; 2015. Available from: http://www.globaltbcaucus.org/#!declaration/c1n8o. (Accessed 2015 September 18)
82. Matt Oliver (RESULTS UK, London, United Kingdom). E-mail with: Mike Frick and Erica Lessem (Treatment Action Group, New York, NY). 2015 August 29.
83. Michel Kazatchkine. Advancing the pipeline: a vision for the next decade. Paper presented at: 4th Global Forum on TB Vaccines; 2015 April 23; Shanghai, China.
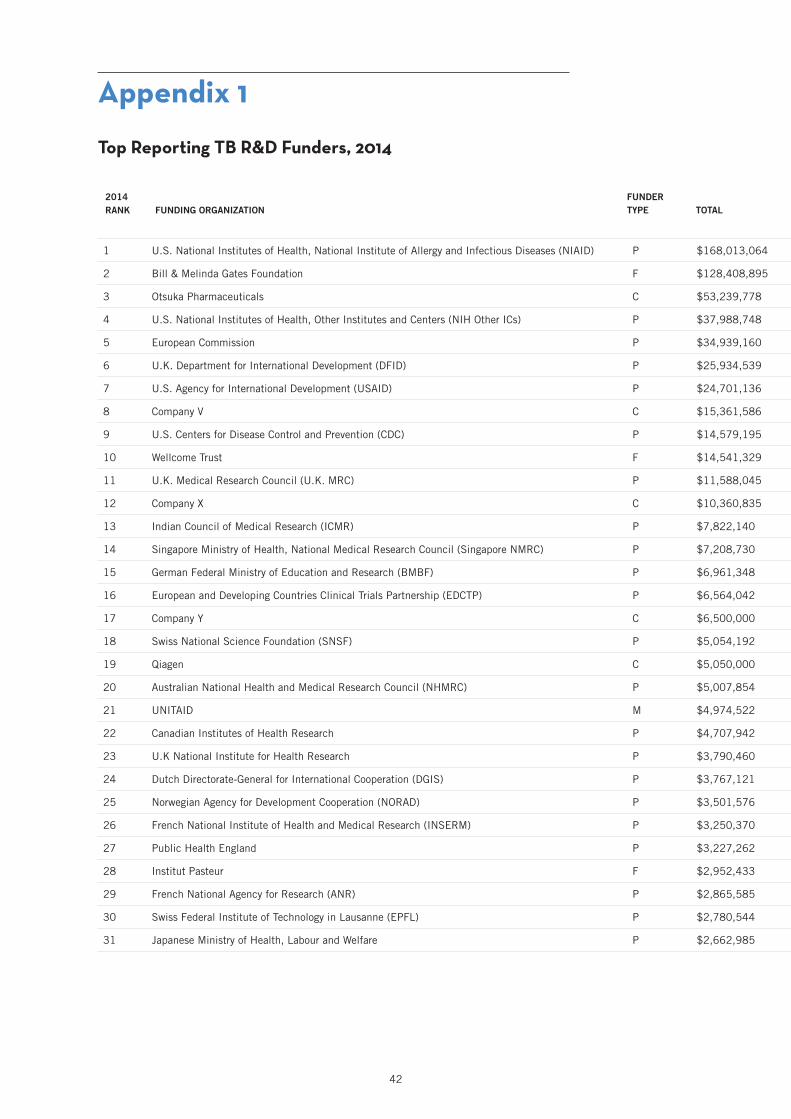
42
2014 RANK FUNDING ORGANIZATION
FUNDER TYPE TOTAL BASIC SCIENCE DIAGNOSTICS DRUGS VACCINES
OPERATIONAL RESEARCH
INFRASTRUCTURE/ UNSPECIFIED
Top Reporting TB R&D Funders, 2014
1 U.S. National Institutes of Health, National Institute of Allergy and Infectious Diseases (NIAID) P $168,013,064 $65,382,402 $13,235,870 $42,738,275 $20,125,920 $14,335,210 $12,195,386
2 Bill & Melinda Gates Foundation F $128,408,895 $11,359,362 $15,857,230 $41,711,708 $46,649,769 $4,712,959 $8,117,867
3 Otsuka Pharmaceuticals C $53,239,778 $0 $0 $53,239,778 $0 $0 $0
4 U.S. National Institutes of Health, Other Institutes and Centers (NIH Other ICs) P $37,988,748 $17,662,701 $1,952,797 $5,209,176 $1,513,855 $9,130,719 $2,519,500
5 European Commission P $34,939,160 $11,788,434 $1,484,427 $3,212,248 $14,502,269 $0 $3,951,782
6 U.K. Department for International Development (DFID) P $25,934,539 $0 $0 $17,051,100 $3,239,709 $5,643,730 $0
7 U.S. Agency for International Development (USAID) P $24,701,136 $0 $915,000 $11,892,000 $0 $3,142,102 $8,752,034
8 Company V C $15,361,586 $0 $0 $15,361,586 $0 $0 $0
9 U.S. Centers for Disease Control and Prevention (CDC) P $14,579,195 $0 $9,109,678 $4,469,517 $0 $1,000,000 $0
10 Wellcome Trust F $14,541,329 $5,283,892 $2,103,413 $3,372,482 $3,263,118 $76,692 $441,732
11 U.K. Medical Research Council (U.K. MRC) P $11,588,045 $6,404,004 $347,280 $3,122,620 $1,134,248 $579,895 $0
12 Company X C $10,360,835 $0 $0 $9,951,047 $409,788 $0 $0
13 Indian Council of Medical Research (ICMR) P $7,822,140 $0 $0 $0 $7,983 $29,044 $7,785,113
14 Singapore Ministry of Health, National Medical Research Council (Singapore NMRC) P $7,208,730 $0 $0 $7,208,730 $0 $0 $0
15 German Federal Ministry of Education and Research (BMBF) P $6,961,348 $912,136 $240,324 $86,514 $0 $0 $5,722,373
16 European and Developing Countries Clinical Trials Partnership (EDCTP) P $6,564,042 $0 $1,025,860 $2,305,721 $3,049,131 $183,330 $0
17 Company Y C $6,500,000 $0 $6,500,000 $0 $0 $0 $0
18 Swiss National Science Foundation (SNSF) P $5,054,192 $3,784,652 $0 $264,171 $303,830 $701,539 $0
19 Qiagen C $5,050,000 $0 $5,050,000 $0 $0 $0 $0
20 Australian National Health and Medical Research Council (NHMRC) P $5,007,854 $3,135,193 $1,254,820 $299,509 $0 $0 $318,331
21 UNITAID M $4,974,522 $0 $0 $3,444,522 $0 $1,530,000 $0
22 Canadian Institutes of Health Research P $4,707,942 $1,284,084 $318,671 $1,146,518 $616,938 $1,026,442 $315,290
23 U.K National Institute for Health Research P $3,790,460 $85,256 $2,608,818 $0 $0 $1,096,386 $0
24 Dutch Directorate-General for International Cooperation (DGIS) P $3,767,121 $0 $0 $0 $3,767,121 $0 $0
25 Norwegian Agency for Development Cooperation (NORAD) P $3,501,576 $660,002 $104,237 $0 $1,737,823 $966,940 $32,574
26 French National Institute of Health and Medical Research (INSERM) P $3,250,370 $3,250,370 $0 $0 $0 $0 $0
27 Public Health England P $3,227,262 $119,358 $0 $1,050,518 $2,057,386 $0 $0
28 Institut Pasteur F $2,952,433 $1,803,590 $276,795 $410,449 $461,600 $0 $0
29 French National Agency for Research (ANR) P $2,865,585 $1,655,670 $0 $1,030,294 $179,621 $0 $0
30 Swiss Federal Institute of Technology in Lausanne (EPFL) P $2,780,544 $1,123,910 $0 $1,656,634 $0 $0 $0
31 Japanese Ministry of Health, Labour and Welfare P $2,662,985 $309,000 $558,464 $309,592 $1,232,270 $0 $253,659
Appendix 1

43
2014 RANK FUNDING ORGANIZATION
FUNDER TYPE TOTAL BASIC SCIENCE DIAGNOSTICS DRUGS VACCINES
OPERATIONAL RESEARCH
INFRASTRUCTURE/ UNSPECIFIED
1 U.S. National Institutes of Health, National Institute of Allergy and Infectious Diseases (NIAID) P $168,013,064 $65,382,402 $13,235,870 $42,738,275 $20,125,920 $14,335,210 $12,195,386
2 Bill & Melinda Gates Foundation F $128,408,895 $11,359,362 $15,857,230 $41,711,708 $46,649,769 $4,712,959 $8,117,867
3 Otsuka Pharmaceuticals C $53,239,778 $0 $0 $53,239,778 $0 $0 $0
4 U.S. National Institutes of Health, Other Institutes and Centers (NIH Other ICs) P $37,988,748 $17,662,701 $1,952,797 $5,209,176 $1,513,855 $9,130,719 $2,519,500
5 European Commission P $34,939,160 $11,788,434 $1,484,427 $3,212,248 $14,502,269 $0 $3,951,782
6 U.K. Department for International Development (DFID) P $25,934,539 $0 $0 $17,051,100 $3,239,709 $5,643,730 $0
7 U.S. Agency for International Development (USAID) P $24,701,136 $0 $915,000 $11,892,000 $0 $3,142,102 $8,752,034
8 Company V C $15,361,586 $0 $0 $15,361,586 $0 $0 $0
9 U.S. Centers for Disease Control and Prevention (CDC) P $14,579,195 $0 $9,109,678 $4,469,517 $0 $1,000,000 $0
10 Wellcome Trust F $14,541,329 $5,283,892 $2,103,413 $3,372,482 $3,263,118 $76,692 $441,732
11 U.K. Medical Research Council (U.K. MRC) P $11,588,045 $6,404,004 $347,280 $3,122,620 $1,134,248 $579,895 $0
12 Company X C $10,360,835 $0 $0 $9,951,047 $409,788 $0 $0
13 Indian Council of Medical Research (ICMR) P $7,822,140 $0 $0 $0 $7,983 $29,044 $7,785,113
14 Singapore Ministry of Health, National Medical Research Council (Singapore NMRC) P $7,208,730 $0 $0 $7,208,730 $0 $0 $0
15 German Federal Ministry of Education and Research (BMBF) P $6,961,348 $912,136 $240,324 $86,514 $0 $0 $5,722,373
16 European and Developing Countries Clinical Trials Partnership (EDCTP) P $6,564,042 $0 $1,025,860 $2,305,721 $3,049,131 $183,330 $0
17 Company Y C $6,500,000 $0 $6,500,000 $0 $0 $0 $0
18 Swiss National Science Foundation (SNSF) P $5,054,192 $3,784,652 $0 $264,171 $303,830 $701,539 $0
19 Qiagen C $5,050,000 $0 $5,050,000 $0 $0 $0 $0
20 Australian National Health and Medical Research Council (NHMRC) P $5,007,854 $3,135,193 $1,254,820 $299,509 $0 $0 $318,331
21 UNITAID M $4,974,522 $0 $0 $3,444,522 $0 $1,530,000 $0
22 Canadian Institutes of Health Research P $4,707,942 $1,284,084 $318,671 $1,146,518 $616,938 $1,026,442 $315,290
23 U.K National Institute for Health Research P $3,790,460 $85,256 $2,608,818 $0 $0 $1,096,386 $0
24 Dutch Directorate-General for International Cooperation (DGIS) P $3,767,121 $0 $0 $0 $3,767,121 $0 $0
25 Norwegian Agency for Development Cooperation (NORAD) P $3,501,576 $660,002 $104,237 $0 $1,737,823 $966,940 $32,574
26 French National Institute of Health and Medical Research (INSERM) P $3,250,370 $3,250,370 $0 $0 $0 $0 $0
27 Public Health England P $3,227,262 $119,358 $0 $1,050,518 $2,057,386 $0 $0
28 Institut Pasteur F $2,952,433 $1,803,590 $276,795 $410,449 $461,600 $0 $0
29 French National Agency for Research (ANR) P $2,865,585 $1,655,670 $0 $1,030,294 $179,621 $0 $0
30 Swiss Federal Institute of Technology in Lausanne (EPFL) P $2,780,544 $1,123,910 $0 $1,656,634 $0 $0 $0
31 Japanese Ministry of Health, Labour and Welfare P $2,662,985 $309,000 $558,464 $309,592 $1,232,270 $0 $253,659
P = Public-Sector R&D Agency F = Foundation/Philanthropy C = Corporation/Private Sector M = Multilateral

44
2014 RANK FUNDING ORGANIZATION
FUNDER TYPE TOTAL BASIC SCIENCE DIAGNOSTICS DRUGS VACCINES
OPERATIONAL RESEARCH
INFRASTRUCTURE/ UNSPECIFIED
32 Eli Lilly C $2,550,000 $0 $0 $2,550,000 $0 $0 $0
33 Statens Serum Institut P $2,524,734 $0 $0 $0 $2,524,734 $0 $0
34 South African Medical Research Council (SAMRC) P $2,515,493 $2,024,267 $0 $123,714 $0 $367,512 $0
35 Macleods Pharmaceuticals C $2,500,000 $0 $0 $2,500,000 $0 $0 $0
36 Max Planck Institute for Infection Biology P $2,400,000 $1,200,000 $0 $0 $1,200,000 $0 $0
37 German Research Foundation (DFG) P $2,322,654 $2,322,654 $0 $0 $0 $0 $0
38 Swedish Research Council P $2,122,923 $1,594,648 $0 $394,347 $133,929 $0 $0
39 Global Health Innovative Technology Fund (GHIT) M $1,952,745 $0 $0 $1,394,818 $557,927 $0 $0
40 French National Agency for AIDS Research (ANRS) P $1,933,838 $29,488 $175,745 $267,237 $0 $1,447,693 $13,675
41 Qurient C $1,683,000 $0 $0 $1,683,000 $0 $0 $0
42 Health Research Council of New Zealand P $1,551,021 $1,551,021 $0 $0 $0 $0 $0
43 South African Department of Science and Technology (DST) P $1,474,767 $1,474,767 $0 $0 $0 $0 $0
44 U.S. Department of Defense Medical Research and Development Program (DMRDP) P $1,134,865 $0 $749,998 $384,867 $0 $0 $0
45 Australian Research Council P $1,019,066 $1,019,066 $0 $0 $0 $0 $0
46 Taiwan Centers for Disease Control P $987,002 $0 $139,354 $50,205 $0 $636,787 $160,656
47 Médecins Sans Frontières F $936,253 $0 $0 $0 $0 $936,253 $0
48 National University Health System, Singapore P $921,116 $0 $0 $0 $0 $800,970 $120,146
49 Brazilian National TB Program P $873,244 $0 $0 $0 $0 $873,244 $0
50 Danish Council for Independent Research P $831,938 $0 $0 $0 $831,938 $0 $0
51 National Research Foundation, South Africa P $705,924 $310,446 $13,334 $0 $0 $325,599 $56,544
52 Indian Council of Scientific and Industrial Research P $700,068 $38,026 $0 $595,898 $0 $0 $66,144
53 World Health Organization (WHO) M $649,888 $0 $0 $0 $65,968 $583,920 $0
54 Gabonese Republic P $509,773 $0 $0 $509,773 $0 $0 $0
55 Brazilian Development Bank P $500,000 $0 $0 $0 $500,000 $0 $0
56 Department of Foreign Affairs, Trade and Development Canada P $496,508 $0 $0 $0 $0 $496,508 $0
57 World Health Organization TDR (Special Programme for Research and Training in Tropical Diseases) M $490,925 $0 $0 $20,925 $0 $470,000 $0
58 Korean Ministry of Health & Welfare P $489,407 $356,400 $133,007 $0 $0 $0 $0
59 Indian Ministry of Science and Technology, Department of Biotechnology P $487,439 $258,347 $75,953 $153,138 $0 $0 $0
60 Innovative Medicines Initiative P $473,192 $0 $0 $473,192 $0 $0 $0
61 Grand Challenges Canada P $472,152 $0 $104,923 $52,461 $0 $209,845 $104,923
62 Korea Centers for Disease Control and Prevention P $455,400 $0 $99,000 $0 $0 $326,700 $29,700
Top Reporting TB R&D Funders, 2014 (continued)
Appendix 1

45
2014 RANK FUNDING ORGANIZATION
FUNDER TYPE TOTAL BASIC SCIENCE DIAGNOSTICS DRUGS VACCINES
OPERATIONAL RESEARCH
INFRASTRUCTURE/ UNSPECIFIED
32 Eli Lilly C $2,550,000 $0 $0 $2,550,000 $0 $0 $0
33 Statens Serum Institut P $2,524,734 $0 $0 $0 $2,524,734 $0 $0
34 South African Medical Research Council (SAMRC) P $2,515,493 $2,024,267 $0 $123,714 $0 $367,512 $0
35 Macleods Pharmaceuticals C $2,500,000 $0 $0 $2,500,000 $0 $0 $0
36 Max Planck Institute for Infection Biology P $2,400,000 $1,200,000 $0 $0 $1,200,000 $0 $0
37 German Research Foundation (DFG) P $2,322,654 $2,322,654 $0 $0 $0 $0 $0
38 Swedish Research Council P $2,122,923 $1,594,648 $0 $394,347 $133,929 $0 $0
39 Global Health Innovative Technology Fund (GHIT) M $1,952,745 $0 $0 $1,394,818 $557,927 $0 $0
40 French National Agency for AIDS Research (ANRS) P $1,933,838 $29,488 $175,745 $267,237 $0 $1,447,693 $13,675
41 Qurient C $1,683,000 $0 $0 $1,683,000 $0 $0 $0
42 Health Research Council of New Zealand P $1,551,021 $1,551,021 $0 $0 $0 $0 $0
43 South African Department of Science and Technology (DST) P $1,474,767 $1,474,767 $0 $0 $0 $0 $0
44 U.S. Department of Defense Medical Research and Development Program (DMRDP) P $1,134,865 $0 $749,998 $384,867 $0 $0 $0
45 Australian Research Council P $1,019,066 $1,019,066 $0 $0 $0 $0 $0
46 Taiwan Centers for Disease Control P $987,002 $0 $139,354 $50,205 $0 $636,787 $160,656
47 Médecins Sans Frontières F $936,253 $0 $0 $0 $0 $936,253 $0
48 National University Health System, Singapore P $921,116 $0 $0 $0 $0 $800,970 $120,146
49 Brazilian National TB Program P $873,244 $0 $0 $0 $0 $873,244 $0
50 Danish Council for Independent Research P $831,938 $0 $0 $0 $831,938 $0 $0
51 National Research Foundation, South Africa P $705,924 $310,446 $13,334 $0 $0 $325,599 $56,544
52 Indian Council of Scientific and Industrial Research P $700,068 $38,026 $0 $595,898 $0 $0 $66,144
53 World Health Organization (WHO) M $649,888 $0 $0 $0 $65,968 $583,920 $0
54 Gabonese Republic P $509,773 $0 $0 $509,773 $0 $0 $0
55 Brazilian Development Bank P $500,000 $0 $0 $0 $500,000 $0 $0
56 Department of Foreign Affairs, Trade and Development Canada P $496,508 $0 $0 $0 $0 $496,508 $0
57 World Health Organization TDR (Special Programme for Research and Training in Tropical Diseases) M $490,925 $0 $0 $20,925 $0 $470,000 $0
58 Korean Ministry of Health & Welfare P $489,407 $356,400 $133,007 $0 $0 $0 $0
59 Indian Ministry of Science and Technology, Department of Biotechnology P $487,439 $258,347 $75,953 $153,138 $0 $0 $0
60 Innovative Medicines Initiative P $473,192 $0 $0 $473,192 $0 $0 $0
61 Grand Challenges Canada P $472,152 $0 $104,923 $52,461 $0 $209,845 $104,923
62 Korea Centers for Disease Control and Prevention P $455,400 $0 $99,000 $0 $0 $326,700 $29,700
P = Public-Sector R&D Agency F = Foundation/Philanthropy C = Corporation/Private Sector M = Multilateral

46
2014 RANK FUNDING ORGANIZATION
FUNDER TYPE TOTAL BASIC SCIENCE DIAGNOSTICS DRUGS VACCINES
OPERATIONAL RESEARCH
INFRASTRUCTURE/ UNSPECIFIED
63 U.S. Food and Drug Administration (FDA) P $428,674 $0 $0 $400,000 $28,674 $0 $0
64 Korea Drug Development Fund P $396,000 $0 $0 $396,000 $0 $0 $0
65 Fondation Recherche Médicale F $376,109 $303,044 $0 $0 $0 $0 $73,066
66 Japan BCG Laboratory C $373,086 $0 $0 $0 $373,086 $0 $0
67 Colombian Ministry of Health and Social Protection P $350,519 $0 $0 $0 $0 $350,519 $0
68 National Institutes of Health, Peru P $348,417 $259,593 $85,870 $2,954 $0 $0 $0
69 BioDuro C $337,500 $0 $0 $337,500 $0 $0 $0
70 Australian Department of Foreign Affairs and Trade P $334,054 $0 $0 $0 $0 $334,054 $0
71 Spanish Ministry of Science and Innovation P $327,830 $0 $0 $0 $327,830 $0 $0
72 Hong Kong Health and Medical Research Fund P $293,302 $255,965 $37,337 $0 $0 $0 $0
73 Chilean National Commission for Scientific and Technological Research P $263,896 $209,596 $0 $0 $0 $54,300 $0
74 Damien Foundation Belgium F $244,093 $36,251 $85,195 $93,900 $0 $28,747 $0
75 Howard Hughes Medical Institute F $200,000 $200,000 $0 $0 $0 $0 $0
76 U.S. National Science Foundation P $199,956 $112,652 $87,304 $0 $0 $0 $0
77 QuantaMatrix C $198,000 $198,000 $0 $0 $0 $0 $0
78 Bloomberg Foundation F $197,452 $0 $0 $0 $0 $197,452 $0
79 Carlos III Health Institute P $155,527 $0 $0 $0 $155,527 $0 $0
80 Public Health Agency of Canada P $149,890 $0 $149,890 $0 $0 $0 $0
81 Firland Foundation F $133,827 $20,000 $0 $0 $20,000 $93,827 $0
82 Argentine Ministry of Science, Technology and Productive Innovation P $132,406 $88,924 $27,013 $0 $16,469 $0 $0
83 LG Life Sciences C $128,700 $0 $128,700 $0 $0 $0 $0
84 Danish International Development Agency (DANIDA) P $120,972 $0 $0 $120,972 $0 $0 $0
85 Fondation Jacqueline Beytout F $114,639 $0 $0 $114,639 $0 $0 $0
86 Company S C $113,762 $0 $0 $45,464 $68,298 $0 $0
87 Thrasher Research Fund F $110,000 $24,000 $62,000 $24,000 $0 $0 $0
Top Reporting TB R&D Funders, 2014 (continued)
Appendix 1

47
2014 RANK FUNDING ORGANIZATION
FUNDER TYPE TOTAL BASIC SCIENCE DIAGNOSTICS DRUGS VACCINES
OPERATIONAL RESEARCH
INFRASTRUCTURE/ UNSPECIFIED
63 U.S. Food and Drug Administration (FDA) P $428,674 $0 $0 $400,000 $28,674 $0 $0
64 Korea Drug Development Fund P $396,000 $0 $0 $396,000 $0 $0 $0
65 Fondation Recherche Médicale F $376,109 $303,044 $0 $0 $0 $0 $73,066
66 Japan BCG Laboratory C $373,086 $0 $0 $0 $373,086 $0 $0
67 Colombian Ministry of Health and Social Protection P $350,519 $0 $0 $0 $0 $350,519 $0
68 National Institutes of Health, Peru P $348,417 $259,593 $85,870 $2,954 $0 $0 $0
69 BioDuro C $337,500 $0 $0 $337,500 $0 $0 $0
70 Australian Department of Foreign Affairs and Trade P $334,054 $0 $0 $0 $0 $334,054 $0
71 Spanish Ministry of Science and Innovation P $327,830 $0 $0 $0 $327,830 $0 $0
72 Hong Kong Health and Medical Research Fund P $293,302 $255,965 $37,337 $0 $0 $0 $0
73 Chilean National Commission for Scientific and Technological Research P $263,896 $209,596 $0 $0 $0 $54,300 $0
74 Damien Foundation Belgium F $244,093 $36,251 $85,195 $93,900 $0 $28,747 $0
75 Howard Hughes Medical Institute F $200,000 $200,000 $0 $0 $0 $0 $0
76 U.S. National Science Foundation P $199,956 $112,652 $87,304 $0 $0 $0 $0
77 QuantaMatrix C $198,000 $198,000 $0 $0 $0 $0 $0
78 Bloomberg Foundation F $197,452 $0 $0 $0 $0 $197,452 $0
79 Carlos III Health Institute P $155,527 $0 $0 $0 $155,527 $0 $0
80 Public Health Agency of Canada P $149,890 $0 $149,890 $0 $0 $0 $0
81 Firland Foundation F $133,827 $20,000 $0 $0 $20,000 $93,827 $0
82 Argentine Ministry of Science, Technology and Productive Innovation P $132,406 $88,924 $27,013 $0 $16,469 $0 $0
83 LG Life Sciences C $128,700 $0 $128,700 $0 $0 $0 $0
84 Danish International Development Agency (DANIDA) P $120,972 $0 $0 $120,972 $0 $0 $0
85 Fondation Jacqueline Beytout F $114,639 $0 $0 $114,639 $0 $0 $0
86 Company S C $113,762 $0 $0 $45,464 $68,298 $0 $0
87 Thrasher Research Fund F $110,000 $24,000 $62,000 $24,000 $0 $0 $0
P = Public-Sector R&D Agency F = Foundation/Philanthropy C = Corporation/Private Sector M = Multilateral

48
2014 RANK FUNDING ORGANIZATION
FUNDER TYPE TOTAL BASIC SCIENCE DIAGNOSTICS DRUGS VACCINES
OPERATIONAL RESEARCH
INFRASTRUCTURE/ UNSPECIFIED
88 OPEC Fund for International Development M $100,993 $0 $100,993 $0 $0 $0 $0
89 UBS Optimus Foundation F $96,934 $0 $0 $0 $0 $96,934 $0
90 Danish National Advanced Technology Foundation Total P $72,897 $0 $0 $0 $72,897 $0 $0
91 Biofabri C $68,298 $0 $0 $0 $68,298 $0 $0
92 Global BioDiagnostics C $63,548 $0 $63,548 $0 $0 $0 $0
93 International Union of Immunological Societies F $59,763 $59,763 $0 $0 $0 $0 $0
94 Indian Ministry of Health and Family Welfare P $51,708 $0 $0 $0 $0 $4,766 $46,941
95 Individual donors to TB Alliance F $48,465 $0 $0 $48,465 $0 $0 $0
96 National Health Laboratory Service, South Africa (NHLS) P $47,120 $47,120 $0 $0 $0 $0 $0
97 Oppenheimer Memorial Trust F $45,235 $45,235 $0 $0 $0 $0 $0
98 Pfizer Laboratories C $43,767 $0 $0 $0 $43,767 $0 $0
99 Claude Leon Foundation F $40,052 $40,052 $0 $0 $0 $0 $0
100 Norwegian Knowledge Centre for the Health Services P $37,495 $0 $0 $0 $37,495 $0 $0
101 Japan International Cooperation Agency P $35,532 $0 $35,532 $0 $0 $0 $0
102 Fondation Mérieux F $35,000 $0 $0 $0 $0 $35,000 $0
103 Stop TB Partnership M $34,500 $0 $0 $34,500 $0 $0 $0
104 Japan Science and Technology Agency P $31,584 $0 $0 $0 $31,584 $0 $0
105 Taiwan Ministry of Science and Technology P $30,000 $0 $0 $0 $30,000 $0 $0
106 Korean Institute of Tuberculosis P $29,700 $0 $29,700 $0 $0 $0 $0
107 Bioneer C $14,850 $0 $14,850 $0 $0 $0 $0
108 Green Cross Medical Science C $14,850 $0 $14,850 $0 $0 $0 $0
109 bioMérieux Korea C $11,880 $0 $11,880 $0 $0 $0 $0
110 Faber Daeufer C $10,000 $0 $0 $10,000 $0 $0 $0
111 Indian National Science Academy P $8,320 $8,320 $0 $0 $0 $0 $0
112 KNCV Tuberculosis Foundation F $2,599 $0 $0 $0 $0 $2,599 $0
113 Harry Crossley Foundation F $1,885 $0 $1,885 $0 $0 $0 $0
114 Korean Ministry of Science, ICT and Future Planning P $156 $156 $0 $0 $0 $0 $0
GRAND TOTAL $674,036,492 $150,091,818 $65,371,547 $243,326,678 $111,340,797 $52,828,217 $51,077,435
Top Reporting TB R&D Funders, 2014 (continued)
Appendix 1
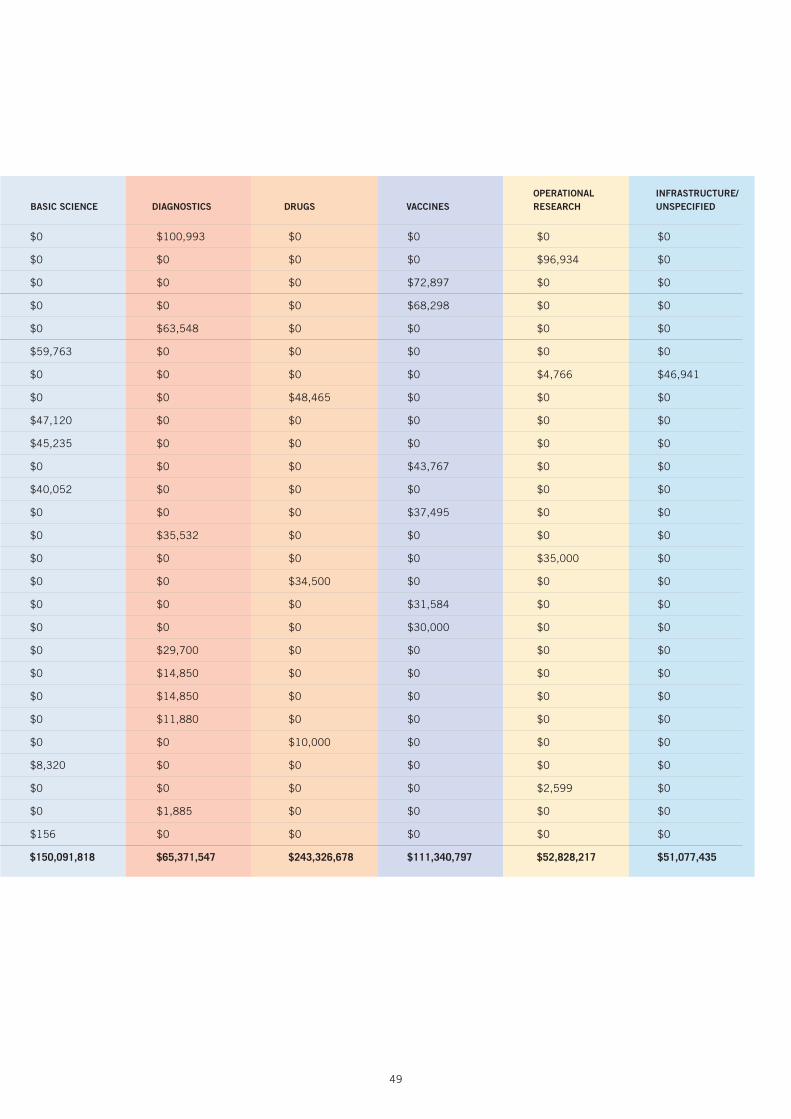
49
2014 RANK FUNDING ORGANIZATION
FUNDER TYPE TOTAL BASIC SCIENCE DIAGNOSTICS DRUGS VACCINES
OPERATIONAL RESEARCH
INFRASTRUCTURE/ UNSPECIFIED
88 OPEC Fund for International Development M $100,993 $0 $100,993 $0 $0 $0 $0
89 UBS Optimus Foundation F $96,934 $0 $0 $0 $0 $96,934 $0
90 Danish National Advanced Technology Foundation Total P $72,897 $0 $0 $0 $72,897 $0 $0
91 Biofabri C $68,298 $0 $0 $0 $68,298 $0 $0
92 Global BioDiagnostics C $63,548 $0 $63,548 $0 $0 $0 $0
93 International Union of Immunological Societies F $59,763 $59,763 $0 $0 $0 $0 $0
94 Indian Ministry of Health and Family Welfare P $51,708 $0 $0 $0 $0 $4,766 $46,941
95 Individual donors to TB Alliance F $48,465 $0 $0 $48,465 $0 $0 $0
96 National Health Laboratory Service, South Africa (NHLS) P $47,120 $47,120 $0 $0 $0 $0 $0
97 Oppenheimer Memorial Trust F $45,235 $45,235 $0 $0 $0 $0 $0
98 Pfizer Laboratories C $43,767 $0 $0 $0 $43,767 $0 $0
99 Claude Leon Foundation F $40,052 $40,052 $0 $0 $0 $0 $0
100 Norwegian Knowledge Centre for the Health Services P $37,495 $0 $0 $0 $37,495 $0 $0
101 Japan International Cooperation Agency P $35,532 $0 $35,532 $0 $0 $0 $0
102 Fondation Mérieux F $35,000 $0 $0 $0 $0 $35,000 $0
103 Stop TB Partnership M $34,500 $0 $0 $34,500 $0 $0 $0
104 Japan Science and Technology Agency P $31,584 $0 $0 $0 $31,584 $0 $0
105 Taiwan Ministry of Science and Technology P $30,000 $0 $0 $0 $30,000 $0 $0
106 Korean Institute of Tuberculosis P $29,700 $0 $29,700 $0 $0 $0 $0
107 Bioneer C $14,850 $0 $14,850 $0 $0 $0 $0
108 Green Cross Medical Science C $14,850 $0 $14,850 $0 $0 $0 $0
109 bioMérieux Korea C $11,880 $0 $11,880 $0 $0 $0 $0
110 Faber Daeufer C $10,000 $0 $0 $10,000 $0 $0 $0
111 Indian National Science Academy P $8,320 $8,320 $0 $0 $0 $0 $0
112 KNCV Tuberculosis Foundation F $2,599 $0 $0 $0 $0 $2,599 $0
113 Harry Crossley Foundation F $1,885 $0 $1,885 $0 $0 $0 $0
114 Korean Ministry of Science, ICT and Future Planning P $156 $156 $0 $0 $0 $0 $0
GRAND TOTAL $674,036,492 $150,091,818 $65,371,547 $243,326,678 $111,340,797 $52,828,217 $51,077,435

50
Appendix 2TB Experts Interviewed by TAG
1. Manica Balasegaram Executive director, Médecins Sans Frontières Access Campaign
2. Dick ChaissonFounding director, Center for TB Research, the Johns Hopkins University; chair of the
ACTG TB transformative science group
3. Gavin Churchyard Director, Aurum Institute
4. Lucica Ditiu Executive director, Stop TB Partnership
5. Willem Hanekom Deputy director, tuberculosis progam, Bill & Melinda Gates Foundation
6. Gilla Kaplan Director, tuberculosis program, Bill & Melinda Gates Foundation
7. David Lewinsohn Professor, pulmonary and critical care medicine, Oregon Health & Science University
8. Ruth McNerney Senior research associate, University of Cape Town Lung Institute; head of operations, Antrum Biotech
9. Sharon Nachman Principal investigator and chair of the IMPAACT network; professor of pediatrics, Stony Brook University
10. Peter Small Founding director, Stony Brook University Global Health Institute
11. Rebecca Tadokera Senior researcher, Treatment Action Campaign


Treatment Action Group 261 Fifth Avenue, Suite 2110 New York, NY 10016 USA Tel 1.212.253.7922 Fax 1.212.253.7923
www.treatmentactiongroup.org
ISBN 978-0-9905242-4-3


![2009 Report on Tuberculosis Research Funding Trends, 2005-2008 2nd Edition [Slide Reports]](https://static.fdocuments.net/doc/165x107/568c4a021a28ab4916966c22/2009-report-on-tuberculosis-research-funding-trends-2005-2008-2nd-edition-56f53dd6c8799.jpg)


