
2015 Q2 Europe & Israel VC Trends Review
47
Venture Capital in Europe & Israel Venture Investment Data: Second Quarter, 2015 Prepared by Gil Dibner @ gdibner blog: yankeesabralimey The Dead Sea, Israel Lowest point on earth, 427M below sea level
-
Upload
gil-dibner -
Category
Technology
-
view
3.632 -
download
0
Transcript of 2015 Q2 Europe & Israel VC Trends Review
Venture Capital in Europe & IsraelVenture Investment Data: Second Quarter, 2015
Prepared by Gil Dibner @gdibnerblog: yankeesabralimey
The Dead Sea, IsraelLowest point on earth, 427M below sea level

The data• Around the middle of last year, I decided I wasn’t happy with available data sources on VC
rounds in Europe & Israel, and that I’d need to build my own• The data in this report consists entirely of data I’ve gathered manually based on publically
available, free sources• No paid data sources or API calls were harmed in the making of this dataset, every
investment was manually classified• This allows analysis of some aspects of the data I consider important – aspects that don’t
appear in other data sources• Seed investment is still under-reported, but I got a bit better at capturing it in the fourth
quarter. Rounds smaller than $500K are generally excluded from this analysis• The analysis is limited to ICT categories and excludes life sciences• The analysis excludes Turkey and FSU countries• I’m converting EUR and GBP into USD using monthly average exchange rates
2@gdibnerblog: yankeesabralimey Syndicate for European & Israeli Enterprise Companies

Monthly pace of venture investment• During the 12 months ended
June, 2015, there were 866 reported venture investments across Europe & Israel
• A total of $9.581B was invested in Europe & Israel during this period, an average of $798M per month
• June 2015 was a record-breaking month for total investments, with over $1.5B raised across 98 rounds
• Spotify, which raised $526M in June, significantly skews the June figure (see slide 5)
@gdibnerblog: yankeesabralimey 3Syndicate for European & Israeli Enterprise Companies
493565
644 625562
725
905971 997
751 787
1,555
42 30 50 79 73 52 92 75 103 77 95 98
0
200
400
600
800
1,000
1,200
1,400
1,600
1,800
Jul Aug Sep Oct Nov Dec Jan Feb Mar Apr May Jun
Qtr3 Qtr4 Qtr1 Qtr2
2014 2015
Num
ber o
f inv
estm
ents
VC Investments in Europe & Israel, July 2014 - June 2015
Invested amount (US $M) Number of investments
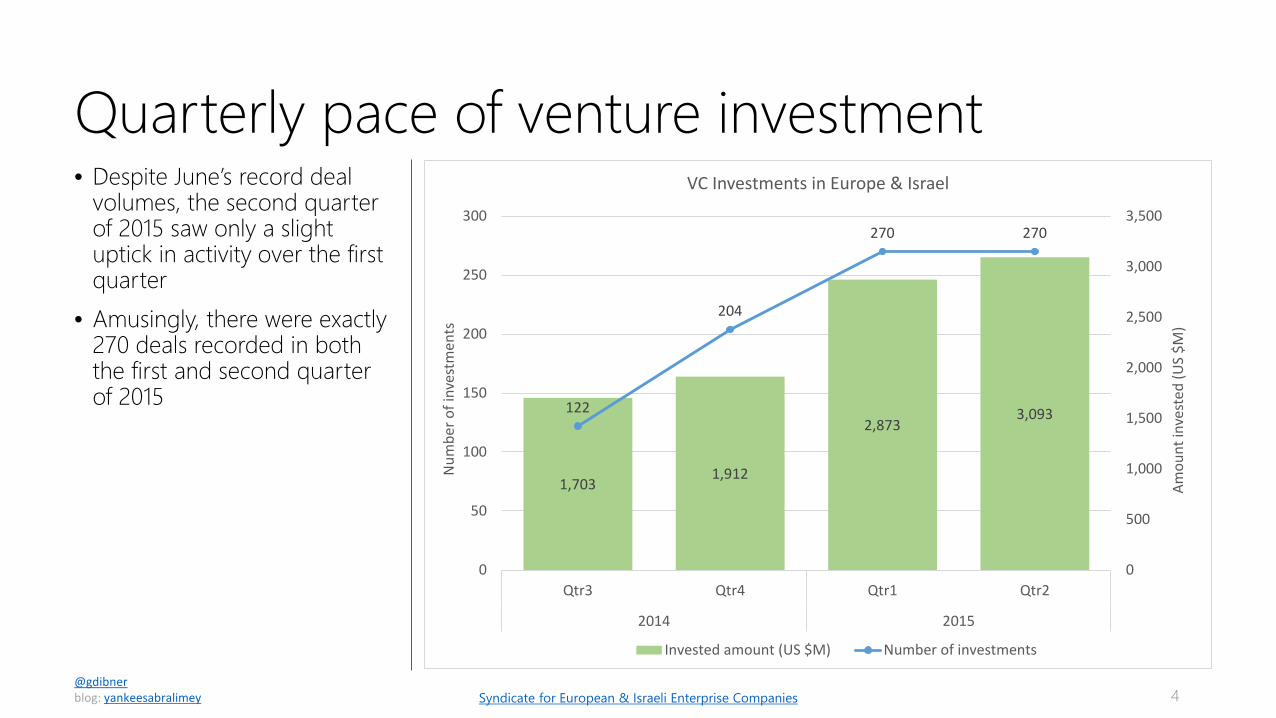
Quarterly pace of venture investment• Despite June’s record deal
volumes, the second quarter of 2015 saw only a slight uptick in activity over the first quarter
• Amusingly, there were exactly 270 deals recorded in both the first and second quarter of 2015
4@gdibnerblog: yankeesabralimey Syndicate for European & Israeli Enterprise Companies
1,7031,912
2,8733,093122
204
270 270
0
500
1,000
1,500
2,000
2,500
3,000
3,500
0
50
100
150
200
250
300
Qtr3 Qtr4 Qtr1 Qtr2
2014 2015
Amou
nt in
vest
ed (U
S $M
)
Num
ber o
f inv
estm
ents
VC Investments in Europe & Israel
Invested amount (US $M) Number of investments

Mega-rounds skew the investment totals• This analysis breaks down VC
investments into brackets by size:• Seed (less than $2M)• Early venture ($2-8M)• Venture ($8-20M)• Growth ($20-100M)• Mega ($100M+)
• Six mega-rounds took place in Europe in the first quarter:
• Funding Circle, a British financial services company, raised $150M in April
• Food Panda, a German food delivery company, raised $100M in April
• Infinidat, and Israeli enterprise storage systems company, raised $150M in May
• Home24, a German commerce company, raised $134M in June
• Delivery Hero, a German food delivery company, raised $110M in June
• Spotify, a Swedish music streaming service, raised $526M in June
• Adjusting for mega-rounds, 2Q was slightly below 1Q in terms of total volume, but still above Q3 & Q4
5@gdibnerblog: yankeesabralimey Syndicate for European & Israeli Enterprise Companies
248 343 285 354345
312 556731539
935
1,154 752
0
500
1,000
1,500
2,000
2,500
3,000
3,500
Qtr3 Qtr4 Qtr1 Qtr2
2014 2015
Amou
nt In
vest
ed (U
S $M
)
Pace of VC Investment in Europe and Israel
Mega (>100) Growth (20-100) Venture (8-20) Early Venture (2-8) Seed (.5-2)

Number of investments, by bracket• Deal volume across the geo
seems to have stabilized in terms of the number of investments
• Early venture and seed volumes seem to be down slightly
• Ventures ($8-20M) rounds seem to have increased somewhat
• Throughout 2015, Europe & Israel seem to have stabilized at around 80-100 deals per month
6@gdibnerblog: yankeesabralimey Syndicate for European & Israeli Enterprise Companies
6 3 7
28 2615
37 3045
30 34 282114
25
31 29
22
2420
33
2333
29
9
5
16
106
10
1316
13
16
2126
5
7
1
1012
4
18
5
10
6
6 12
0
20
40
60
80
100
120
Jul Aug Sep Oct Nov Dec Jan Feb Mar Apr May Jun
Qtr3 Qtr4 Qtr1 Qtr2
2014 2015
Num
ber o
f VC
inve
stm
ents
Number of investments in Europe and Israel by bracketJuly 2014 to June 2015
Mega (>100) Growth (20-100) Venture (8-20) Early Venture (2-8) Seed (<2)
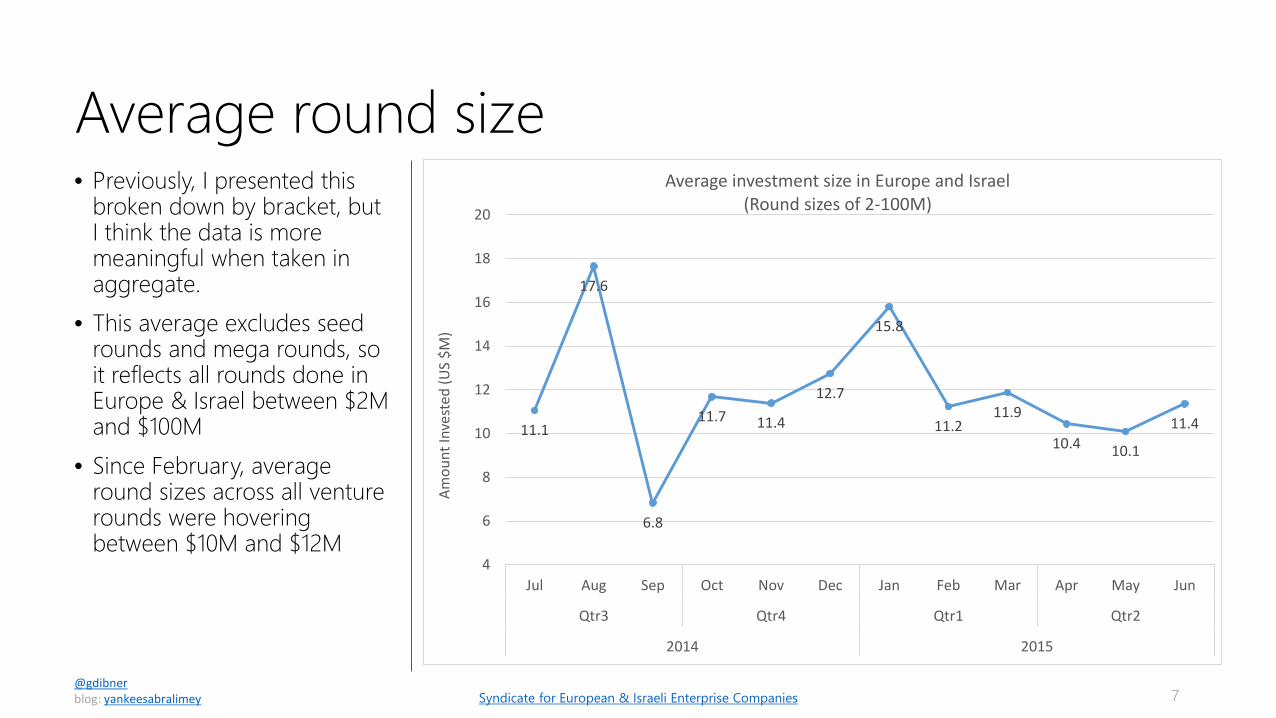
Average round size• Previously, I presented this
broken down by bracket, but I think the data is more meaningful when taken in aggregate.
• This average excludes seed rounds and mega rounds, so it reflects all rounds done in Europe & Israel between $2M and $100M
• Since February, average round sizes across all venture rounds were hovering between $10M and $12M
7@gdibnerblog: yankeesabralimey Syndicate for European & Israeli Enterprise Companies
11.1
17.6
6.8
11.7 11.4
12.7
15.8
11.211.9
10.4 10.1
11.4
4
6
8
10
12
14
16
18
20
Jul Aug Sep Oct Nov Dec Jan Feb Mar Apr May Jun
Qtr3 Qtr4 Qtr1 Qtr2
2014 2015
Amou
nt In
vest
ed (U
S $M
)
Average investment size in Europe and Israel(Round sizes of 2-100M)

Total venture investment by country, 2H 2015• Powered by Spotify’s massive
round, Sweden took the top spot in funds raised in 2Q
• Israel, UK, Germany, and France rounded out the rest of the top five
8@gdibnerblog: yankeesabralimey Syndicate for European & Israeli Enterprise Companies
638.5625.2
587.4553.6
231.6103.1
93.371.1
64.432.8
27.221.5
12.210.09.5
5.41.81.61.10.80.60.5
SwedenIsrael
UKGermany
FranceDenmark
IrelandNetherlands
SpainPortugalBelgiumEstonia
SwitzerlandPolandFinland
ItalyGreece
NorwayLatvia
HungarySlovenia
Iceland
0 100 200 300 400 500 600 700
Total VC investment volume by country, 2Q15 (US $M)

Total venture investment by country, 2H 2015• When mega-rounds
($100M+) are excluded, Israel takes the top slot, with the UK coming in just behind it
• With Spotify excluded, Sweden’s total drops to $112.5M, putting in the fifth slot
• Germany and France round out the top five in the third and fourth place
9@gdibnerblog: yankeesabralimey Syndicate for European & Israeli Enterprise Companies
475.2437.4
231.6208.9
112.5103.1
93.371.1
64.432.8
27.221.5
12.210.09.5
5.41.81.61.10.80.60.5
IsraelUK
FranceGermany
SwedenDenmark
IrelandNetherlands
SpainPortugalBelgiumEstonia
SwitzerlandPolandFinland
ItalyGreece
NorwayLatvia
HungarySlovenia
Iceland
0 50 100 150 200 250 300 350 400 450 500
Total VC investment volume by country, 2Q15 (Excludes mega-rounds, US $M)

Total venture investment by country, 3Q14 to 2Q15• To get a better sense of VC
volumes in various countries, this analysis excludes mega-rounds
• UK venture activity trended down in 2Q15 after skyrocketing in 1Q15
• Investment volume in Israel regained its first place slot
• France has showed continued strength, overtaking both Sweden and Germany in terms of investment volume
10@gdibnerblog: yankeesabralimey Syndicate for European & Israeli Enterprise Companies
Israel, 315
Israel, 567
Israel, 543
Israel, 475
UK, 369
UK, 263
UK, 719
UK, 437
Germany, 180
Germany, 284
Germany, 389
Germany, 209
France, 29
France, 163France, 118
France, 232
Sweden, 74 Sweden, 123Sweden, 89
Sweden, 112
Qtr3 Qtr4 Qtr1 Qtr20
100
200
300
400
500
600
700
800
Tota
l VC
inve
stm
ent (
US
$M)
Total VC investment, 3Q14 - 2Q15 (top 5 countries, excluding mega-rounds)

Average venture round sizes, by country• This analysis excludes mega-
rounds and rounds less than $2M
• UK & Ireland companies raised the largest round sizes on average in 2Q, but much less on average than in 1Q
• DACH startups fell from first place in terms of average size to seventh place
• Generally, average round sizes seem to be converging across the broader geography into very tight band between $8M and $12M
11@gdibnerblog: yankeesabralimey Syndicate for European & Israeli Enterprise Companies
Benelux, 10.6Benelux, 9.9
DACH, 18.0
DACH, 8.9
France, 3.7
France, 10.8
Iberia, 10.4
Iberia, 12.3
Israel, 11.6
Israel, 9.9Nordic, 7.7
Nordic, 11.1
UK & Ireland, 11.9
UK & Ireland, 18.9
UK & Ireland, 12.4
0.0
2.0
4.0
6.0
8.0
10.0
12.0
14.0
16.0
18.0
20.0
Qtr3 Qtr4 Qtr1 Qtr2
2014 2015
Aver
age
roun
d siz
e (U
S $M
)
Average investment size in Europe and Israel (rounds of $2-20M)

Total venture investment by region, 3Q14 to 1Q15• When VC investments across
Europe are aggregated into regions, Israel, DACH, UK & Ireland, the Nordics, and France are the clear and consistent leaders
• Benelux, Iberia, Southern Europe, and Eastern Europe do produce meaningful VC investments (Adyen, Prezi, and many others), but the volumes are still low
12@gdibnerblog: yankeesabralimey Syndicate for European & Israeli Enterprise Companies
Nordic, 124.0 Nordic, 219.3 Nordic, 190.1
Nordic, 775.7UK & Ireland, 399.0 UK & Ireland, 262.9
UK & Ireland, 932.2
UK & Ireland, 680.7
Israel, 315.2 Israel, 567.5
Israel, 834.6
Israel, 625.2
DACH, 532.2DACH, 290.2
DACH, 573.3DACH, 565.8
France, 129.3 France, 163.3
France, 233.0France, 231.6
Benelux, 31.9Benelux, 284.9
Benelux, 46.7Benelux, 98.3
Iberia, 168.1Iberia, 56.5
Iberia, 53.7Iberia, 97.2
0
500
1,000
1,500
2,000
2,500
3,000
3,500
Qtr3 Qtr4 Qtr1 Qtr2
2014 2015
Tota
l VC
inve
stm
ent (
US
$M)
Total VC investment by region
Nordic UK & IrelandIsrael DACHFrance BeneluxIberia East. Eur.South. Eur.

Rounds by bracket & country• To get a better sense of deal
volume, this analysis excludes seed deals which are often poorly reported
• Excluding seed deals, Israel again led the region in the number of VC deals reported
• The UK and DACH followed• Despite an impressive three
mega-rounds into German companies, DACH was a distant third in terms of deal volumes
13@gdibnerblog: yankeesabralimey Syndicate for European & Israeli Enterprise Companies
2218
14 11 125
18
15
88 6
34
7
8
22 3
1
1
31
0
10
20
30
40
50
60
Israel UK &Ireland
DACH Nordic France Benelux Iberia East. Eur. South. Eur.
Num
ber o
f inv
estm
ents
Number of investments in Europe and Israel by bracket, 2Q 2015
Mega (>100) Growth (20-100) Venture (8-20) Early Venture (2-8)

Investment by region, by bracket• In 2Q, UK & Ireland led in
terms of total VC dollars invested
• Israel was in second place• Excluding Spotify’s $526M
round, the Nordics are in third place, still ahead of France and DACH
14@gdibnerblog: yankeesabralimey Syndicate for European & Israeli Enterprise Companies
70 98 48 50 55
176 197
85 72 99
261 172
99 105 61
150150
526
345
0
100
200
300
400
500
600
700
800
900
UK &Ireland
Israel Nordic France DACH Benelux Iberia East. Eur. South. Eur.
Tota
l am
ount
inve
sted
(US
$M)
Investment in Europe and Israel by bracket by region, 2Q 2015(ranked excluding mega-rounds)
Mega (>100) Growth (20-100) Venture (8-20) Early Venture (2-8) Seed (<2)

Participation rate of US VC firms, by bracket• US VC firms are increasingly
active in the European and Israeli VC markets
• Over the past twelve months, US VC firms participated in 16% of the venture rounds in Europe
• US VCs participated in only 5% of seed rounds, 11% of early venture rounds, and 25% of venture rounds
• As a company moves from bracket to bracket, the chance of US VC participation doubles with each bracket change
15@gdibnerblog: yankeesabralimey Syndicate for European & Israeli Enterprise Companies
5% 11%
25%
42%
81%
95% 89%
75%
58%
19%
0%
10%
20%
30%
40%
50%
60%
70%
80%
90%
100%
Seed (.5-2) Early Venture (2-8) Venture (8-20) Growth (20-100) Mega (>100)
Perc
enta
ge o
f rou
nds
Did US VC firms participate in European VC rounds? (3Q14-2Q15)
No Yes

Rate of participation by US firms has recovered• Reversing the negative trend
in the first quarter, US VC firm participation in European & Israeli venture rounds increased in the second quarter
• Within rounds of between $2M and $20M, US VC participation rose from 8% of rounds in February to 20% of rounds in June
16@gdibnerblog: yankeesabralimey Syndicate for European & Israeli Enterprise Companies
10% 5%17%
24%17% 16% 19%
8% 11% 15% 17% 20%
90% 95%83%
76%83% 84% 81%
92% 89% 85% 83% 80%
0%
10%
20%
30%
40%
50%
60%
70%
80%
90%
100%
Jul Aug Sep Oct Nov Dec Jan Feb Mar Apr May Jun
Qtr3 Qtr4 Qtr1 Qtr2
2014 2015
Perc
enta
ge o
f Rou
nds
Did US VC firms participate in European VC rounds? (3Q14-2Q15)
No Yes

Participation of US VC firms by country• In 2Q, US VCs firms were
active in 10 different European countries, flat from 1Q and down from 12 countries in 4Q
• US VC firms were most active in Israel, where they participated in 14 investment rounds
• The UK saw 11 investments with US VC participation
• Germany saw 5 investments with US VC participation
17@gdibnerblog: yankeesabralimey Syndicate for European & Israeli Enterprise Companies
14 115
43 48
25
18 159 11
0
10
20
30
40
50
60
70
Isra
el UK
Germ
any
Swed
en
Spai
n
Irela
nd
Switz
erla
nd
Net
herla
nds
Hung
ary
Denm
ark
Num
ber o
f VC
inve
stm
ents
In which countries are US VCs most active?2Q, 2015
No US VC involved US VC involved

Dimension Categories Explanation/Example
1. Target market Consumer, SMB, Enterprise, Government, Telecom, OEM
What sort of customer does the company target?
2. Vertical market
Adtech, Communications, Data, Development, Durables, Education, Electronics, Employment, Energy, Fashion, Financial, Food, Gaming, Health, HMI, Industrial, Infrastructure, Lifestyle, Logistics, Marketing, Media, Productivity, Real Estate, Security, Sports, Storage, Transportation, Travel, Water
What type of problem does the company solve?
3. Business modelCommerce, Components, Content, Marketplace, SaaS, Semiconductors, Services, Software, Systems,
How does the company makemoney? What are customers paying for?
Combined segment descriptor Consumer + Travel + Marketplace AirBnB has built a travel-related marketplace for consumers 18
Three-dimensional approach to sector mapping

• Excluding mega-rounds, investment activity decreased in both consumer and enterprise
• SMB-oriented and OEM-oriented investment volume both increased
19@gdibnerblog: yankeesabralimey
What target markets are attracting the most VC investment in Europe & Israel?
Syndicate for European & Israeli Enterprise Companies
475 595980 811
494
794
953808
78
133
121
153
78
114
47
106
0
500
1,000
1,500
2,000
2,500
Qtr3 Qtr4 Qtr1 Qtr2
2014 2015
Tota
l VC
inve
stm
ents
(US
$M)
European & Israeli venture financing by target market3Q14 to 2Q15 (excluding mega-rounds, US $M)
Government
Telecom
OEM
SMB
Enterprise
Consumer

• Last quarter ’s trend reversed itself, with consumer-oriented companies accounting for 54% of all VC investment in Europe & Israel, up from 43% in 1Q
• Enterprise dropped from 55% in 4Q14 to 31% in 2Q15
• SMB-oriented companies accounted for 10% of investment dollars, a new high – driven mostly by funding circle
20@gdibnerblog: yankeesabralimey
The return of consumer investment
Syndicate for European & Israeli Enterprise Companies
54%
31%43%
54%
29%55%
47% 31%
5% 7% 4% 10%5%6% 3%7%
0%10%20%30%40%50%60%70%80%90%
100%
Qtr3 Qtr4 Qtr1 Qtr2
2014 2015
European & Israeli venture financing by target market3Q14 to 2Q15 (percent of US $M)
Government Telecom OEM SMB Enterprise Consumer

Breakdown by region & target market• The Israeli VC landscape
continued to be dominated by non-consumer companies
• The DACH region saw a continuation of the dominance of consumer-oriented companies in VC financing (all three of Germany’s mega-rounds in 2Q were consumer companies)
• FundingCircle’s massive round helped explain why more money went into SMB in the UK & Ireland than into enterprise
• If Spotify’s $526M round is removed, the Nordics seemed to continue their shift towards the enterprise
21@gdibnerblog: yankeesabralimey Syndicate for European & Israeli Enterprise Companies
599
288146
466
64 50
160
169 404
55
99
182
70
0
100
200
300
400
500
600
700
800
900
Nordic UK & Ireland Israel DACH France Benelux Iberia
Tota
l am
ount
inve
sted
(US
$M)
Investment in Europe and Israel by target market by country2Q, 2015 (US $M)
Government Telecom OEM SMB Enterprise Consumer

Distribution of investment rounds by country• Across Europe & Israel, 46%
of VC investment rounds were in consumer companies in 2Q, down slightly from 47% in 1Q
• Benelux, France, and the Nordics saw a majority of investments happening into non-consumer companies
22@gdibnerblog: yankeesabralimey Syndicate for European & Israeli Enterprise Companies
65%
56%
50%
50%
45%
44%
39%
30%
20%
31%
36%
25%
41%
44%
39%
56%
10%
8%
11%
5%
12%
11%
4%
5%
25%
9%
7%
6% 6%
0% 10% 20% 30% 40% 50% 60% 70% 80% 90% 100%
Iberia
DACH
UK & Ireland
South. Eur.
Nordic
France
Benelux
Israel
Investment in Europe and Israel by target market by country2Q 2015 (Number of investments)
Consumer Enterprise SMB OEM Telecom Government

Trending away from consumer?• Over the past few months,
the trend seems to be away from consumer investing
23@gdibnerblog: yankeesabralimey Syndicate for European & Israeli Enterprise Companies
38% 40% 44% 44% 37% 42% 50%35%
54% 56%42% 40%
50% 40%44% 42%
48%48% 38%
57%36% 29% 48%
42%
5% 9% 14% 7%6%
6%10%
7%
10%6% 6% 8% 6%7%
0%10%20%30%40%50%60%70%80%90%
100%
Jul Aug Sep Oct Nov Dec Jan Feb Mar Apr May Jun
Qtr3 Qtr4 Qtr1 Qtr2
2014 2015
Investment in Europe and Israel by target market by country,3Q14 to 2Q15 (Number of investments)
Government Telecom OEM SMB Enterprise Consumer

Seed and growth swing back to consumer• As in last quarter, a clear
majority of both growth deals and seed deals were in consumer-oriented companies
• Early venture deals also reflected this trend
• Venture deals, however, showed continued interest in non-consumer categories –mostly enterprise
24@gdibnerblog: yankeesabralimey Syndicate for European & Israeli Enterprise Companies
52%
54%
33%
54%
31%
37%
55%
24%
7%
8%
6%
15%
8%
7%
0% 10% 20% 30% 40% 50% 60% 70% 80% 90% 100%
Seed (<2)
Early Venture (2-8)
Venture (8-20)
Growth (20-100)
Investment in Europe (excluding Israel) by target market by stage bracket 2Q 2015 (Number of investments)
Consumer Enterprise SMB OEM Telecom Government

DACH investors shift back to consumer• DACH is clearly a region with
a record of strong consumer-oriented investment
• In 4Q14 this began to change, but it wasn’t clear if the trend would be long-lived. Indeed, 1Q15 saw a majority of investments in DACH go into consumer companies
• 2Q15, however, saw the pendulum in DACH start to shift back towards non-consumer categories
25@gdibnerblog: yankeesabralimey Syndicate for European & Israeli Enterprise Companies
100%
67% 60%
40%
13%
57% 60%
33%
73% 69% 63%
43%
17%20%
40%88%
43% 40%
67%
20% 23% 38%
36%
20%10%
7%21%17% 10% 8%
0%
10%
20%
30%
40%
50%
60%
70%
80%
90%
100%
Jul Aug Sep Oct Nov Dec Jan Feb Mar Apr May Jun
Qtr3 Qtr4 Qtr1 Qtr2
2014 2015
Investment in DACH by target market by stage bracketJuly 2014 to June 2015 (Number of investments)
OEM SMB Enterprise Consumer

The Nordics shift towards the enterprise…• The Nordic region saw pretty
diverse investment patterns in 3Q14 and 4Q14, but in 1Q15 there was a clear shift towards the enterprise which seemed to continue into 2Q
• OEM-oriented investments which almost vanished in 1Q, returned in 2Q
26@gdibnerblog: yankeesabralimey Syndicate for European & Israeli Enterprise Companies
40%25%
67%83%
50%64%
20%
50%38% 33%
50% 47%
60%
50%
17%42%
27%
60%
50%
38% 44%
44%35%
8%
10% 14%
6%
6%25%17% 17%
9% 10% 10%22%
12%
0%
10%
20%
30%
40%
50%
60%
70%
80%
90%
100%
Jul Aug Sep Oct Nov Dec Jan Feb Mar Apr May Jun
Qtr3 Qtr4 Qtr1 Qtr2
2014 2015
Investment in the Nordics by target marketJuly 2014 to June 2015 (Number of investments)
OEM SMB Enterprise Consumer

…especially in terms of dollars invested• When we look at dollars
investment as opposed to the number of investments, the trend in the Nordics is even clearer
• Spotify’s massive round has been removed from this graph
• June seemed to buck the trend, with an increase in consumer and OEM-oriented investments
27@gdibnerblog: yankeesabralimey Syndicate for European & Israeli Enterprise Companies
32%
11%
72% 75%
44%52%
43%
20%12% 5%
27%45%
68%
49%
6% 0% 55%24%
55%
80%
72% 87%
72% 36%
12%
40%
21% 25% 24%
4% 8%18%
0%
10%
20%
30%
40%
50%
60%
70%
80%
90%
100%
Jul Aug Sep Oct Nov Dec Jan Feb Mar Apr May Jun
Qtr3 Qtr4 Qtr1 Qtr2
2014 2015
Investment in the Nordics by target marketJuly 2014 to July 2015
(Percentage of total US $M invested, excluding mega-rounds)
OEM SMB Enterprise Consumer

Over 50% of French VC deals were SMB or enterprise…• In France, the ratio of
enterprise deals to consumer deals seems roughly constant from September 2014 to June 2015
28@gdibnerblog: yankeesabralimey Syndicate for European & Israeli Enterprise Companies
100% 100%
50% 46%58%
50%62% 60%
46% 50%
29%
50%
38% 38%
33% 50% 31% 40%
46% 33% 71% 33%
15% 8%17% 17%13% 8% 8%
0%
10%
20%
30%
40%
50%
60%
70%
80%
90%
100%
Jul Aug Sep Oct Nov Dec Jan Feb Mar Apr May Jun
Qtr3 Qtr4 Qtr1 Qtr2
2014 2015
VC Investment in France by target marketJuly 2014 to June 2015 (Number of investments)
OEM SMB Enterprise Consumer

…but money increasingly flows to enterprise• When the data is presented
by the amount of dollars, it becomes clear that more and more of French VC dollars are flowing towards enterprise-oriented companies
29@gdibnerblog: yankeesabralimey Syndicate for European & Israeli Enterprise Companies
100% 100%
59%44%
65%77%
33% 31%19%
50%
14%28%
23%46% 10%
23%
64% 69%
74%25%
86%
30%
10%25% 25%
41%
18%3% 7%
0%
10%
20%
30%
40%
50%
60%
70%
80%
90%
100%
Jul Aug Sep Oct Nov Dec Jan Feb Mar Apr May Jun
Qtr3 Qtr4 Qtr1 Qtr2
2014 2015
VC Investment in France by target marketJuly 2014 to June 2015 (Number of investments)
OEM SMB Enterprise Consumer

• Finance recovered its top slot• Marketing-related companies
took the second slot• Digital health opportunities
were in third place• Perhaps somewhat
surprisingly, Adtech took fourth place
30@gdibnerblog: yankeesabralimey
Finance returned to being the top vertical
Syndicate for European & Israeli Enterprise Companies
Financial, 23
Marketing, 22Health, 16
Adtech, 12 Lifestyle, 12Travel, 11
Gaming, 11
Social, 11
Logistics, 11
Security, 10Development, 9
CRM, 9Electronics, 8
Entertainment, 8Food, 8
Industrial, 8Productivity, 8
Payments, 7Fashion, 7Education, 6Infrastructure, 6Employment, 6
Data, 5Durables, 5
ERP, 3
Energy, 3
Legal, 3
European & Israeli venture financing by target market2Q 2015 (number of investments)

• Financial startups were the most commonly funded category in 2Q, including consumer, enterprise, and SMB-oriented companies
• The single most common category was enterprise marketing
• Consumer lifestyle, social, and gaming startups were particularly active as well
31@gdibnerblog: yankeesabralimey
Which verticals for which segments?
Syndicate for European & Israeli Enterprise Companies
Security
Logistics
Gaming
Social
Travel
Lifestyle
Adtech
Health
Marketing
Financial
0 5 10 15 20 25
European & Israeli venture financing by target market2Q, 2015 (number of investments, top 10 verticals)
Consumer
Enterprise
SMB
OEM

• This chart shows the ten most commonly funded verticals across Europe & Israel throughout 2015, by quarter
• Financial, marketing, and health show increasing strength over time
• Infrastructure shows a decline
32@gdibnerblog: yankeesabralimey
The most popular verticals in the past 12 months
Syndicate for European & Israeli Enterprise Companies
Qtr3 Qtr4 Qtr1 Qtr20
20
40
60
80
100
120
140
160
European & Israeli venture financing by vertical market3Q14-2Q15, 2015 (number of investments, top 10 verticals)
Financial
Marketing
Infrastructure
Adtech
Lifestyle
Electronics
Health
Logistics
Travel
Employment

• Lifestyle, which is admittedly a bit of a catch-all consumer category, has shown tremendous strength in terms of VC volume
• Electronics (which typically means consumer electronics systems companies) has shown increasing strength through 1Q, but little investment in 2Q
• Gaming, health, and food-related investments seem to be increasing in 2Q
33@gdibnerblog: yankeesabralimey
Consumer VC investment trends
Syndicate for European & Israeli Enterprise Companies
Qtr3 Qtr4 Qtr1 Qtr2
2014 2015
0
10
20
30
40
50
60
70
80
90
European & Israeli venture financing by consumer verticals3Q14-2Q15, 2015 (number of investments, top 10 verticals)
Lifestyle
Financial
Travel
Gaming
Fashion
Health
Electronics
Logistics
Education
Food

• The most popular enterprise verticals are marketing, adtech, and infrastructure
• Infrastructure and data-related investment declined over the past few quarters
• CRM seems to have picked up steam over the past few quarters
• Other verticals largely holding steady
34@gdibnerblog: yankeesabralimey
Enterprise VC investment trends
Syndicate for European & Israeli Enterprise Companies
Qtr3 Qtr4 Qtr1 Qtr2
2014 2015
0
20
40
60
80
100
120
European & Israeli venture financing by enterprise verticals3Q14-2Q15, 2015 (number of investments, top 10 verticals)
Marketing
Adtech
Infrastructure
Data
Security
Development
Financial
Employment
Health
Logistics
CRM

• VC activity in Israel was very diverse in 2Q15, with health-related and consumer social investments rising the 3rd and 4th slots
• Interestingly, infrastructure investments weren’t in the top ten
• Not surprisingly, security was solidly in the second slot
35@gdibnerblog: yankeesabralimey
A closer look at Israeli venture in 1Q15
Syndicate for European & Israeli Enterprise Companies
Electronics
Productivity
CRM
Development
Financial
Energy
Logistics
Data
Adtech
Social
Health
Security
Marketing
0 1 2 3 4 5 6 7 8 9
Israeli venture financing by target market2Q, 2015 (number of investments, top 10 verticals)
Consumer
Enterprise
SMB
OEM
Telecom
Government

• Last quarter, Fintech was the most popular vertical in the UK – this quarter fintech was far and away the dominant category in the UK
• Consumer-oriented companies dominated most categories of VC funding across the UK, with enterprise marketing and enterprise CRM as the two notable exceptions
36@gdibnerblog: yankeesabralimey
Consumer fintech dominated the UK
Syndicate for European & Israeli Enterprise Companies
Industrial
Development
Infrastructure
ERP
Food
Health
Entertainment
Logistics
Lifestyle
Fashion
CRM
Travel
Gaming
Education
Marketing
Payments
Financial
0 2 4 6 8 10 12 14
UK venture financing by target market2Q, 2015 (number of investments, top verticals)
Consumer
Enterprise
SMB
OEM

• The top three categories in German VC investment in 2Q15 were consumer durables, consumer fashion, and enterprise employment
• In total, the top 10 categories in Germany generated 23 investments, 14 of which were in consumer companies
37@gdibnerblog: yankeesabralimey
German VC was mostly about consumer
Syndicate for European & Israeli Enterprise Companies
Financial
Food
Education
Logistics
Marketing
Payments
Travel
Fashion
Durables
Employment
0 1 2 3 4
German venture financing by target market2Q, 2015 (number of investments, top 10 verticals)
Consumer
Enterprise
SMB

• Nordic VC interest in entertainment startups wasn’t confined to Spotify – and this category was the most popular category in 2Q, including one enterprise offering (Soundtrack Your Brand)
• Perhaps surprisingly, social media was the second most popular category in the Nordics
• Note the strength of enterprise and SMB-related companies
38@gdibnerblog: yankeesabralimey
Nordic VC was very diverse
Syndicate for European & Israeli Enterprise Companies
Electronics
Security
Adtech
Development
Health
Gaming
Financial
Marketing
Social
Entertainment
0 1 2 3 4 5 6
Nordic venture financing by target market2Q, 2015 (number of investments, top 10 verticals)
Consumer
Enterprise
OEM

• In terms of dollars invested during 2Q15, SaaS (28%) and services (22%) were the leaders
• Commerce models were third, at 17% of dollars invested
• The bottom of the distribution was a bit more diverse, including relatively strong showings for media and systems companies
39@gdibnerblog: yankeesabralimey
SaaS jumped ahead of services in 2Q
Syndicate for European & Israeli Enterprise Companies
SaaS, 536, 28%
Services, 432, 22%
Commerce, 319, 17%
Software, 194, 10%Marketplace, 139, 7%
Systems, 130, 7%
Media, 108, 6%
Semiconductors, 40, 2%
Components, 24, 1%
European & Israeli venture financing by target market2Q, 2015 (in US $M) (excluding mega-rounds)

• SaaS returned to its growth trend, both in absolute and relative terms.
• Perhaps driven by the increase in SaaS funding, note the precipitous decline in software funding (non SaaS)
• E-commerce and marketplace models trended down
• Service models declined, but took the number two slot and were up dramatically compared to 3Q and 4Q
40@gdibnerblog: yankeesabralimey
In 2Q, SaaS was king & software collapsed
Syndicate for European & Israeli Enterprise Companies
0
100
200
300
400
500
600
700
800
Qtr3 Qtr4 Qtr1 Qtr2
2014 2015
European & Israeli venture financing by business model3Q14 to 2Q15 (in US $M, excluding mega-rounds)
Software
SaaS
Services
Marketplace
Commerce

US VCs focused on SaaS & services• US VC interest was skewed
heavily towards SaaS & Services models
• Commerce and marketplace models also attracted some US VC attention
41@gdibnerblog: yankeesabralimey Syndicate for European & Israeli Enterprise Companies
1711
4 4
55
48
3222
18 1831
0
10
20
30
40
50
60
70
80
SaaS Services Commerce Marketplace Media Systems Software Components Semiconductors
VC Investments in Europe & Israel2Q, 2015 (number of investments)
No US VC involved US VC involved

• Enterprise marketing SaaS was again the most popular segment for VC investment in 2Q15 with 15 investments across the region
• Surprisingly, consumer social media took the second slot, with 11 investments
• Enterprise CRM SaaS took third place, with investments across the UK, Israel, the Nordics, Benelux, and Iberia
• Consumer financial services took the fourth slot, dominated by UK-based startups
42@gdibnerblog: yankeesabralimey
Enterprise marketing & consumer social media
Syndicate for European & Israeli Enterprise Companies
0 2 4 6 8 10 12 14 16
Enterprise Health SaaS
Consumer Travel Commerce
Consumer Lifestyle Commerce
Enterprise Adtech Services
Consumer Fashion Commerce
Consumer Food Commerce
Enterprise Security Software
Consumer Gaming Software
Consumer Financial Services
Enterprise CRM SaaS
Consumer Social Media
Enterprise Marketing SaaS
Number of VC investments
Investment in Europe & Israel by segment by country2Q15 (segments with 5 or more investments)
UK & Ireland IsraelNordic DACHBenelux IberiaFrance South. Eur.East. Eur.

• Across Europe & Israel, US VC firms invested in 16 enterprise companies, 14 consumer companies, 2 SMB companies, and 2 OEM-oriented companies
• Enterprise SaaS attracted by far more US VC interest than any other space
• The only Nordic companies that attracted US VC interest were in the enterprise SaaS space
• The only Germany companies that attracted US VC interest were in the consumer and SMB spaces
43@gdibnerblog: yankeesabralimey
What business models attract US VC investments?
Syndicate for European & Israeli Enterprise Companies
0 2 4 6 8 10 12
Components
Semiconductors
SaaS
SaaS
Systems
Commerce
Media
Marketplace
Services
Software
Services
SaaS
OEM
SMB
Cons
umer
Ente
rpris
e
US VC Investments in Europe and Israel by end market, business model, & country, 2Q 2015 (excludes seed & mega-rounds)
Israel UK & IrelandFrance DACHIberia NordicBenelux

Focus on dev tools: everywhere you look• Over the past 12 months, 31
dev tooling companies raised VC money across Europe & Israel
• These companies were distributed across eleven countries
• Israel led the pack with 8; the UK saw 5, Sweden 4, and both France and the Netherlands saw 3 each
• This strength continued unabated into 2Q
44@gdibnerblog: yankeesabralimey Syndicate for European & Israeli Enterprise Companies
0
1
2
3
4
5
6
7
Jul Sep Oct Nov Dec Jan Feb Mar Apr May Jun
2014 2015
Num
nber
of i
nves
tmen
ts
Development tools VC investment in Europe and Israel3Q14 to 2Q15, Number of investments
Ireland Belgium Norway LatviaEstonia Germany Netherlands FranceSweden UK Israel

Focus on SaaS: what’s powering the growth• 64 SaaS companies raised VC
financing across Europe & Israel in 2Q15
• Marketing and CRM led the category
• Significantly, health SaaS came in third
• Driven by health-related enterprise SaaS, we are seeing the proliferation of SaaS models into new verticals such as logistics, legal, and education
45@gdibnerblog: yankeesabralimey Syndicate for European & Israeli Enterprise Companies
0 2 4 6 8 10 12 14 16 18 20
Education
Travel
Agtech
Legal
SCM
Logistics
Adtech
ERP
Development
Infrastructure
Productivity
Health
CRM
Marketing
SaaS VC investment in Europe and Israelby vertical and target market, 2Q 2015 (top 10 verticals)
Consumer Enterprise Government SMB

Focus on health• In 2Q15, 16 health-related
startups raised VC money across Europe & Israel
• Israel and Spain saw 5 health-related investments each, the UK saw 2, and Sweden, Finland, the Netherlands, and Poland each saw 1
• 8 of these investments were consumer-oriented, mostly marketplaces and services
• 7 were enterprise oriented (5 of which were SaaS models)
46@gdibnerblog: yankeesabralimey Syndicate for European & Israeli Enterprise Companies
0 1 2 3 4 5 6
SaaS
SaaS
Commerce
Software
Commerce
Services
Marketplace
Software
SMB
Ente
rpris
eCo
nsum
er
Health-related VC investment in Europe and Israelby vertical by country, 2Q 2015 (number of investments)
Israel
Spain
UK
Sweden
Finland
Netherlands
Poland

Based in , I was previously a partner at . Before that, I helped run the
European seed program for . I moved to London after seven years in
during which I worked as a VC with and . I’m originally from .
My VC investments include and . Angel investments include and many more.
If you found this useful, I hope you’ll subscribe to my blog.47
Gil DibnerTo invest in the best European & Israeli enterprise startups,
consider backing me on here. Lots of exciting stuff in thepipeline – and you’ll be in pretty good company.


![[vc 1037 - listing.archiviolocation.com · [vc 1037] ARCHIVIOLOCATION.COM [vc 1037] ARCHIVIOLOCATION.COM [vc 1037] ARCHIVIOLOCATION.COM [vc 1037] ARCHIVIOLOCATION.COM. archivio location](https://static.fdocuments.net/doc/165x107/5fcd99d1df347e1ae154645c/vc-1037-vc-1037-archiviolocationcom-vc-1037-archiviolocationcom-vc-1037.jpg)