2015 Price Monitoring Investigation 2015 Price... · 2015 Price Monitoring Investigation Submission...
154
September 2014 2015 Price Monitoring Investigation Submission to the Queensland Competition Authority APPENDICES Volume One
Transcript of 2015 Price Monitoring Investigation 2015 Price... · 2015 Price Monitoring Investigation Submission...

September 2014
2015 Price Monitoring InvestigationSubmission to the Queensland Competition Authority
APPENDICES Volume One

Gladstone Area Water Board ABN 88 409 667 181Ground Floor 147 Goondoon Street Gladstone Queensland

2015 Price Monitoring Investigation Submission by Gladstone Area Water Board – Appendices
Table of Contents – Volume One Appendix A – Referral Notice
Appendix B – Pricing Principles
Appendix C – Modelled Value of CSS
Appendix D – Australian Water Prices ............................................................................. Synergies Economic Consulting
Appendix E – Operational Benchmarking ................................................................................. Marchment Hill Consulting
Appendix F – Efficiency .................................................................................................................................................... GHD

Submission by Gladstone Area Water Board – Appendices
This page intentionally blank

2015 Price Monitoring Investigation
A–1
Appendix A – Referral Notice This Appendix sets out the Minister’s referral of GAWB to the Authority and indicates where matters raised in the Referral Notice are dealt with in GAWB’s submission.
Referral Notice GAWB Submission
REFERRAL
SECTIONS 23A QUEENSLAND COMPETITION AUTHORITY ACT 1997
1) Referral
As the responsible Minister, pursuant to section 23A of the Queensland Competition Authority Act 1997 (the QCA Act), I refer the Gladstone Area Water Board (GAWB) to the Queensland Competition Authority (the Authority) for a price monitoring investigation for the period from 1 July 2015 to 30 June 2020.
2) Conduct of the QCA pursuant to this referral
In referring this investigation, the Authority is to consider:
a) the planned change in prices of water having regard to, amongst other things:
i. GAWB’s pricing model; and GAWB’s pricing model is provided to the Authority as a separate confidential submission.
ii. demand forecasts; Section 6 Demand forecasting
b) the forecast revenue based on the total prudent and efficient costs of carrying on the activity;
Sections 3 Operating expenditure and 5 Capital expenditure
c) in respect of the return on capital consider the WACC applied by GAWB against the benchmark WACC;
Section 7 Weighted Average Cost of Capital
d) the regulated asset base (RAB) roll-forward calculation (in accordance with the Authority’s previously recommended methodology);
Section 4 Regulated Asset Base roll-forward
e) the revenue carryover calculation (in accordance with the Authority’s previously recommended methodology);
Section 11.1 Revenue carryover from 2011–2015 regulatory period

Submission by Gladstone Area Water Board – Appendices
A–2
Referral Notice GAWB Submission
f) for capital expenditure to be included in the forecast RAB, the Authority is to form a view on prudency and efficiency, with the focus on cost areas which are material to price changes rather than matters which are likely to have a minor and inconsequential impact; and
Section 5 Capital expenditure sets out GAWB’s capital expenditure forecasts, including specific discussion of all projects that would give rise to a material increase in price.
In particular, the Offline Storage project would significantly improve supply reliability but would increase prices to delivery customers by 1% to 3%. See section 5 Capital expenditure – Offline storage and repump station
g) for operating expenditure to be included in the forecast revenue, the Authority may investigate the expenditure in any function where GAWB’s forecast expenditure in that function exceeds the level allowed in the Authority’s 2010 pricing practices investigation by an amount that would give rise to a material increase in price.
Section 3 Operating expenditure sets out GAWB’s operating expenditure forecasts. Section 3.7.1 Material increase in operating expenditure sets out GAWB’s analysis of those functions where GAWB’s forecasts exceed the Authority’s 2010 allowance by an amount that would give rise to a material increase in price.
For the avoidance of doubt, the Authority may consider a matter not indicated in (a) to (g) if it is likely to have a material impact on the price to a customer.
GAWB intends to change the form of regulation from pure price control to a hybrid price and revenue cap. This is discussed in section 9.1.4 Hybrid approach.
GAWB intends to introduce MDQ-based delivery charges. This is discussed at section 8.2 Flow-based delivery network pricing.
3) Consultation
The Authority must undertake an open consultation process with all relevant parties and consider submissions within the timetable for the review and reports. Consistent with section 34 of the QCA Act, all reports and submissions must be published on the Authority’s website.
4) Timing
GAWB is to provide a submission to the Authority in respect of its pricing practices by 30 September 2014.
The Authority must provide a Draft Report by 28 February 2015 and a Final Report by 31 May 2015.

2015 Price Monitoring Investigation
B–1
Appendix B – Pricing Principles Schedule 4 Pricing Principles of GAWB’s water supply agreements will be taken to be amended as follows with effect from 1 July 2014:
Purpose
The contents of this Schedule are intended to accord with the outcomes of the QCA’s 2015 price monitoring investigation. The price monitoring investigation builds upon previous recommendations that were made by the QCA following its investigations (completed in 2002, 2005 and 2010) into the pricing practices of GAWB to the extent that these recommendations have been accepted by the QCA Act Ministers.
The contents of this Schedule are intended to describe GAWB's general pricing principles and not to distinguish between the application of these principles to different services (for example those detailed in a Water Supply Contract (no delivery) and those detailed in a Water Supply Contract (with delivery)).
Key Principles
As detailed in GAWB's Commercial Water Supply Policy (dated 23 August 2004) the price paid for the supply of water should: be cost reflective, forward looking, ensure revenue adequacy, promote sustainable investment, ensure regulatory efficiency and take into account matters relevant to the public interest;
provide an appropriate signal for consumption and investment by reflecting the impact of current consumption on future augmentation; and
thus should not exceed a level necessary to achieve economic efficiency and revenue adequacy, and promote the public interest.
Price differentiation on the basis of service quality, credit risk, length of contract and for other differences is appropriate to the extent that the proposed response is commensurate with the cost/risk of service provision.
The cost of common infrastructure should be allocated to all existing and expected new customers, provided the costs represent the least cost option to meet projected demand.
Pricing Methodology
Calculating an Aggregate Revenue Requirement
The first step in calculating prices is to determinate an Aggregate Revenue Requirement (ARR) for GAWB in each year of a 20 year a planning period.
The ARR will include: return on capital (including working capital); return of capital; tax expense cost recovery; an amount to recover the cost of drought mitigation and management; an amount to recover present value of the price smoothing effects from the previous regulatory period;

Submission by Gladstone Area Water Board – Appendices
B–2
recovery of an appropriate level of efficient operating, maintenance and administration expenditure; tax expense and paid parental leave cost recovery; return to customers of short-duration contract surcharge revenue (net of GAWB costs) from the previous regulatory period; recovery of revenue lost as the result of supply restrictions and any efficient drought related costs not already incorporated into prices (from drought/restrictions in the previous Review Period);
an amount to recover/repay the present value of revenue variances from forecasts for the previous Review Period as allowed by the hybrid price/revenue cap (and, for the 2020 to 2025 Review Period only, the 2015 to 2020 Review Period temporary revenue cap on delivery services to existing customers); and
and an amount to recover the present value of the price smoothing effects from the previous Review Period (the Price Smoothing Carry-over).
The return on capital is the value of the GAWB's asset base plus working capital multiplied by a nominal, post-tax rate of return.
GAWB's asset base includes: land valued at market value; easements valued at their historic cost indexed for inflation; recreational facilities and fish hatchery assets valued at depreciated optimized replacement cost (DORC); and assets necessarily relocated in the process of creating new assets, valued at their cost of relocation; and the Source, Delivery System and other physical assets valued at DORC, including the full DORC of assets that have been partially or fully funded by capital contributions or subsidies.
GAWB’s opening asset base will be the asset base determined in accordance with accepted QCA recommendations rolled forward. Under a roll-forward approach, the asset values are indexed forward using a relevant index, depreciated where appropriate, and adjusted for new and redundant or disposed assets.
The asset base will include an allowance for capital expenditure reasonably expected to be undertaken during the planning horizon. Any augmentation should provide the least cost solution for meeting reasonably envisaged demand with any resulting surplus of capacity incorporated into the asset base.
Recognised contributed assets (which have been accepted as a capital contribution) should will be included in the asset base for the purpose of determining the revenue requirement and prices.
A working capital allowance should will be determined on the basis of debtors less creditors, plus inventories.
The rate of return will be based on the Capital Asset Pricing Model and consistent with the rates of return decisions made for infrastructure businesses by Australian jurisdictional regulators.
GAWB's cost of tax will be included in the ARR using the statutory rate.
Return of capital (or depreciation) of assets will utilise the straight -line method for all assets that are subject to depreciation.
The Price Smoothing Carry-over will be based on the difference between the smoothed price revenue and the annual revenue that would result from the use of the building block approach, with annual differences capitalised to the commencement of the next Review Period using the rate of return applicable for the previous Review Period. The sum of the capitalised amounts carried forward from the previous Review Period will be subject to price smoothing on a forward-looking basis.

2015 Price Monitoring Investigation
B–3
Allocation of ARR to System Components and Off-takes
Where direct costs can be forecast for components of the Source and/or Delivery System (operating expenditure, planned maintenance, electricity, etc.), these costs will be allocated to components of the Source and/or Delivery System based on the forecasts.
Other asset-related costs (unplanned maintenance, etc.) will be allocated to components of the Source and Delivery System by share of direct costs.
The sum of costs allocated to each Source and Delivery System component is called a "cost pool". Cost pools are allocated to off-takes based on relevant cost drivers, which will be reviewed from time to time.
Administration costs will be allocated to Customers for each customer delivery point using a weighted volumetric basis with weights selected to reflect the relative administrative effort of managing water sources, raw water delivery and treated water delivery.
Setting Prices
Two-part tariffs will be developed for both storage and delivery services for each Customer.
A constant real price component will be set for each source and network segment Source and Delivery System Pricing Zone so that the revenue recovered (using a demand forecast for pricing purposes determined using QCA recommended principles) over the planning horizon will equal the present value of allocated ARR.
The real price For Source services, the zone allocated ARR will be divided into volumetric Storage Volumetric Charge (recovered on monthly metered volume) and access Storage Access Charge (recovered on annual contract volume) components. The volumetric Storage Volumetric Charge component will be based on the estimated Long Run Marginal Cost (LRMC). LRMC will be estimated using the Average Incremental Cost method. The residual amount will be the Storage Access Charge component.
The residual amount will be the access component.
For Delivery System services, the zone allocated ARR will be divided into Delivery Volumetric Charge (recovered on monthly metered volume), Delivery Metered Maximum Daily Quantity (MDQ) Charge (recovered on monthly metered MDQ) and Delivery MDQ Charge (recovered on contract MDQ) components. The Delivery Volumetric Charge component will be based on the estimated variable cost of supply. The Delivery Metered MDQ Charge component will be based on the estimated Long LRMC of capacity. LRMC will be estimated using the Average Incremental Cost method. The residual amount will be the Delivery MDQ Charge component.
An Administration Charge recovers the allocated administration costs.
Overrun Charges may be charged where customers exceed their contracted annual volume reservation or contracted MDQ.
For the 2015 to 2020 Review Period only, customers may be charged transitional volume-based charges for Delivery System services, and no Overrun Charges will be charged where customers exceed their contracted annual volume reservation or contracted MDQ.
Where the LRMC exceeds the current cost of storage services, surplus revenues may be rebated to Customers at a later date or may be used as a contribution to future capital costs and offset against future water charges.

Submission by Gladstone Area Water Board – Appendices
B–4
When supply restrictions are triggered in accordance with GAWB’s Drought Management Plan, the volumetric prices for storage and delivery services will be adjusted to maintain revenues for GAWB and to recoup any efficient drought related costs incurred that were not incorporated into the calculation of the ARR. The adjustment to the volumetric prices required to maintain revenues for GAWB will occur at the time supply restrictions are triggered. The recoupment of additional drought related costs that were not incorporated into the calculation of the ARR will occur at the time approval to recoup this expenditure is received from the QCA.
Customers are entitled to price rebates where those Customers have made capital contributions and where there is sufficient evidence (such as of a contractual nature) that the contribution was made with the intent of obtaining future price benefits provided that: the contribution is not a prepayment for services; has not been fully repaid or rebated; and the associated assets have not expired or have been replaced at GAWB’s expense.
The price rebate will generally only be available to the Customer making the capital contribution. That is, unless otherwise agreed between GAWB and the Customer making the original capital contribution, GAWB will set prices to cover the full return on and return of capital for any new Customer connecting to or using the contributed asset.
Prices are differentiated on the basis of the term of the contract with a supply required for each customer connection. A price differentiation surcharge applying to contracts that have will apply to each customer connection that has an initial term of less than 20 years (short -term contracts connections). Price differentiation surcharges received by GAWB are returned to long term customers after covering in the next Review Period, after deducting GAWB’s costs of servicing those short -term contracts connections. The price differentiation surcharges are determined in accordance with the following table:
Term of contract
Less than two years
2 to less than 5 years
5 to less than 10 years
10 to less than 15 years
15 to less than 20 years
20 years or more
Price Differentiation Surcharge 25% 20% 10% 5% 3% 0%

2015 Price Monitoring Investigation
C–1
Appendix C – Modelled Value of CSS This work updates the 2012 analysis included in section 3.4 of the Strategic Water Plan.1 The analysis is updated for revised project costs (GAWB now estimates that the cost of obtaining the CSS capability would be $50 million in 2016 dollars) and revised estimate of GAWB’s WACC.
Summary Under GAWB’s CSS, GAWB has invested in preparatory works that enable GAWB to commission a new 30 GL p.a. water source within 2 years, 9 months of a trigger. Retaining this response capability requires on-going investment. GAWB must determine whether maintaining the capability is appropriate, given the holding costs.
This analysis compares two strategies: retaining CSS preparatory works (meaning that drought-triggered second source work must commence when storage level falls to 4 years and 9 months from failure); and
abandoning CSS works (meaning that drought-triggered second source work must commence when storage level falls to 8 years from failure).
One thousand simulations of 20-year future storage sequences were undertaken comparing GAWB’s costs ‘with CSS’ (holding costs) with GAWB’s costs ‘without CSS’ (where GAWB undertakes preparatory works whenever the Awoonga Dam storage level drops below the ‘8 years from failure’ threshold). The value of CSS is calculated as the present value of the differences between the ‘without CSS’ costs and the ‘with CSS’ costs.
At the current level of contracted demand (63 GL p.a.), the value of retaining the CSS preparatory works is approximately $30 million. That is, if GAWB had not undertaken the preparatory works between 2006 and 2015, and demand was forecast to be constant at 63 GL p.a. for the next 20 years, GAWB should now be prepared to pay at least $30 million to obtain the preparatory works.
At 78 GL p.a. of contracted demand, GAWB would need to immediately commence preparatory works to comply with its Drought Management Plan (and indeed its demand trigger policy). That is, at 78 GL p.a. of contracted demand, the value of retaining the CSS preparatory works is the full present value of doing the work: approximately $50 million.
As demand grows, the amount GAWB should be prepared to pay increases. If GAWB was contracted to sell its full allocation from Awoonga Dam, GAWB should be prepared to pay the full cost of the preparatory works. Because demand is forecast to grow over time, the value of the CSS expenditure is greater than $30 million and less than $50 million.
Put another way, the expected cost of abandoning the CSS preparatory works is more than $30 million. There is a less than 10% chance that this strategy would be positive in value. There is a more than 90% chance that abandoning the CSS would be the wrong strategy.
This analysis considers only a drought response value of the CSS preparatory works. The analysis does not consider the value of the works in the case of a demand trigger.
1 GAWB, Strategic Water Plan, November 2013.

Submission by Gladstone Area Water Board – Appendices
C–2
Full demand case If GAWB has 78 GL p.a. contracted demand, then even at full capacity Awoonga Dam is less than 8 years from failure (based on the Drought Management Plan assumed inflows). That is, the ‘drought trigger’ for supply construction would be greater than the full supply level of Awoonga Dam. Therefore, in a ‘without CSS’ case, GAWB must engage in some form of preparatory work to develop a second source before demand reaches 78 GL p.a.
GAWB has previously determined that the only sensible development is to maintain its level of preparedness. If GAWB did not maintain its level of preparedness, GAWB could not have reasonable certainty that a water supply augmentation option could be developed within a defined time period and would result in undertaking significant additional expenditure (i.e. to achieve a shorter response time).
The value of GAWB’s level of preparedness is approximately $50 million.
Current demand case GAWB currently has approximately 63 GL of contracted demand. At this demand level, the ‘8 years from failure’ trigger level is 673,400ML.
WWL developed a model to estimate the cost of each strategy over 20 years. The model shows that GAWB should retain the CSS capability.
In only about 10% of climate simulations the ‘without CSS’ case has lower costs than the ‘with CSS’ case. Moreover, in those cases the benefit of the ‘without CSS’ strategy over the ‘with CSS’ strategy is less than $3.5 million.
In about 90% of modelled storage scenarios the ‘with CSS’ strategy pays off. The expected benefit of the ‘with CSS’ strategy is about $30 million.
There are some inflow sequences where the ‘with CSS’ strategy is very valuable indeed (where preparatory works are triggered many times and repeatedly abandoned). Figure 1 shows that there is a 10% probability that the value of CSS exceeds $45 million.

2015 Price Monitoring Investigation
C–3
Figure 1: Value of CSS compared to ‘without CSS’ case
0%
10%
20%
30%
40%
50%
60%
70%
80%
90%
100%
-‐10 0 10 20 30 40 50 60 70
Cumulative Probability
$million Figure 2 shows that the CSS can be regarded as an insurance policy. Under almost all simulations in the ‘with CSS’ case, GAWB spends $4 million NPV over 20 years on holding costs (holding costs are only avoided if construction of the drought response infrastructure is triggered). GAWB’s loss is stopped at $4 million. In the ‘without CSS’ case, GAWB may spend as much as $55 million in repeatedly starting the drought response works only to stop when the Awoonga storage level recovers.
Figure 2: Cumulative Probability Distribution of ‘with CSS’ and ‘without CSS’ Costs
0%
20%
40%
60%
80%
100%
0 10 20 30 40 50 60 70
Cumulative Probability
$million
With CSS Costs
Without CSS Costs

Submission by Gladstone Area Water Board – Appendices
C–4
CSS value model design
The heart of the model is a simulation of future storage levels provided by Gilbert + Sutherland (G+S).
G+S supplied 1,000 simulations of monthly storage levels over the next 20 years. That is, G+S synthesised 1000 sequences of 20-year inflows consistent with historical climate information and, for each inflow sequence, G+S calculated a monthly storage level based on 63 GL p.a. demand (reduced in times of low storage as required by GAWB’s current supply restrictions regime).
G+S also calculated the storage levels for the ‘4 years, 9 months from failure’ and ‘8 years from failure’ triggers (again assuming 63 GL p.a. demand).
WWL then applied expenditure rules based on the storage levels.
For the ‘Without CSS’ case the expenditure rules were: when storage falls below the ‘8 years from failure’ trigger, begin spending on the new source (expenditure ramps up to $1.25 million per annum over a few months and eventually to $1.5 million per month, for a total pre-construction trigger expenditure of $50 million over 40 months);
when storage rises to the ‘stop expenditure’ trigger, stop spending and abandon the expenditure; when expenditure has continued for more than the ‘commitment threshold’ months, continue to spend irrespective of storage levels until CSS milestones have been achieved.
when the CSS milestones have been achieved, the ‘with CSS’ expenditure rules are applied.
For the ‘With CSS’ case the expenditure rule was: when storage is above the ‘4 years, 9 months from failure’ trigger, spend $25,000 per month ($0.3 million per annum) to maintain capability;
when storage is below the ‘4 years, 9 months from failure’ construction of the drought response infrastructure begins.
The value of CSS is calculated as the present value of the differences between the ‘without CSS’ costs and the ‘with CSS’ costs.

2015 Price Monitoring Investigation
Appendix D – Australian Water Prices
Synergies Economic Consulting: Australian Water Prices: Gladstone Area Water Board, August 2014

Submission by Gladstone Area Water Board – Appendices
This page intentionally blank

AAuussttrraalliiaann wwaatteerr pprriicceess
Gladstone Area Water Board
August 2014 Synergies Economic Consulting Pty Ltd
www.synergies.com.au

GAWB
AUSTRALIAN WATER PRICES 01/10/2014 12:11:00 Page 2 of 15
DDiissccllaaiimmeerr
Synergies Economic Consulting (Synergies) has prepared this advice exclusively for the use of
the party or parties specified in the report (the client) and for the purposes specified in the
report. The report is supplied in good faith and reflects the knowledge, expertise and
experience of the consultants involved. Synergies accepts no responsibility whatsoever for any
loss suffered by any person taking action or refraining from taking action as a result of reliance
on the report, other than the client.
In conducting the analysis in the report Synergies has used information available at the date of
publication, noting that the intention of this work is to provide material relevant to the
development of policy rather than definitive guidance as to the appropriate level of pricing to
be specified for particular circumstance.

GAWB
AUSTRALIAN WATER PRICES 01/10/2014 12:11:00 Page 3 of 15
CCoonntteennttss 1 Introduction 4
2 Overview of water supply chain 5
3 Approach 7
4 Assumptions and prices 9
A Graphical presentation 12
B Source List 14

GAWB
AUSTRALIAN WATER PRICES 01/10/2014 12:11:00 Page 4 of 15
11 IInnttrroodduuccttiioonn The Gladstone Area Water Board (GAWB) has asked Synergies Economic Consulting (Synergies) to compile water prices across Australia.
The paper is structured as follows:
section 2 provides an overview of the water supply chain;
section 3 sets out our general approach and assumptions;
section 4 lists the assumptions used and sets out the various prices;
Appendix A sets out the prices in a graph.

GAWB
AUSTRALIAN WATER PRICES 01/10/2014 12:11:00 Page 5 of 15
22 OOvveerrvviieeww ooff wwaatteerr ssuuppppllyy cchhaaiinn The water supply chain is characterised by:
Water source infrastructure.
Water sources are typically dams, groundwater, and ‘manufacturing’ processes such as desalination or recycling1. The structure of water source costs varies according to type. For example, the costs of dams are (normally) exclusively fixed, whilst recycling and desalination plants have a higher proportion of variable costs (e.g. electricity and chemicals).
Unlike most other infrastructure services, the cost of each new water source is generally higher than the previous source, given the limited options for new sources (given the exhaustion of low-cost options) and the lumpiness of supply options that typically involve excess capacity. Hence the average cost of sources can be expected to increase over time.
Water treatment facilities.
Water treatment is required where water in its raw state is not suitable for a specified purpose. Water is typically treated to drinking water (potable) standards.
Treatment costs can vary due to a number of factors, including the quality of raw water received, the treatment process adopted, and the required standard of output. In the short term, costs will vary directly with throughput and quality of raw water, while in the longer term increasing demand will necessitate capacity expansion. There are also potential trade-offs between the cost of treatment and catchment management initiatives to improve raw water quality and reduce contamination risks.
Bulk transport.
Bulk transport assets include trunk pipelines and pump stations. Bulk transportation costs will vary according to the required flow rate, the distance over which water is transported, and to some extent the timing of demand. There may also be treatment costs in the transportation network, particularly where long
1 Recycling and desalination is a hybrid of source and treatment, given water is produced to a standard. For this
report, they have been considered as source in the supply chain.

GAWB
AUSTRALIAN WATER PRICES 01/10/2014 12:11:00 Page 6 of 15
distances from the treatment plant are involved (e.g. additional chlorine dosing). Both raw and potable water can be transported.
Reticulation Infrastructure.
Reticulation assets involve small reservoirs and pipes servicing users within an urban footprint.
In this report we examine prices for 16 water service providers in Australia. These businesses span across different parts of the supply chain. Figure 1 presents the sectors of the supply chain that relates to the water prices set out in this report.
FFiigguurree 11.. SSuuppppllyy cchhaaiinn rreelleevvaanntt ttoo bbuussiinneesssseess’’ wwaatteerr pprriicceess
Water source Treatment
Bulk transport Reticulation
Melbourne Water City West Water South East Water Yarra Valley Water Barwon Water Seqwater Townsville City Council Queensland Urban Utilities - Brisbane
Water Corporation Aqwest Busselton Water SA Water PowerWater Sydney Water Corp Hunter Water (Newcastle) ACTEW Corporation
GAWB’s services and assets relate to the first three elements of the supply chain: source; treatment and bulk transport. GAWB provides water to customers as:
raw water at Awoonga Dam;
raw water via bulk transport infrastructure; and
potable water via bulk transport infrastructure.

GAWB
AUSTRALIAN WATER PRICES 01/10/2014 12:11:00 Page 7 of 15
33 AApppprrooaacchh Water service providers in Australia are diverse and vary according to size, asset age and type, structural arrangements, extent of vertical and horizontal integration and business operations. Prices will vary between providers for a range of reasons, including government policy decisions, recent investments (including in response to droughts) and the scope of supply chain including in the price. We have not examined the reasons for price differences in this report, but simply presented prices based on a standard set of assumptions.
This report does not include prices directly from dams, including rural water service providers (eg SunWater in Queensland, Goulburn-Murray Water in Victoria, and State Water Corporation in NSW). For these businesses, prices have been significantly distorted by government policy decisions. For example, SunWater’s rural irrigation water prices have been set to achieve lower bound cost recovery only, without any return on assets.2 In Victoria, Goulburn-Murray Water’s opening asset base was set at $0 based on a Ministerial decision. In NSW, IPART set State Water Corporation’s opening asset value at $0 for assets put in place prior to 19973.
A number of the 16 businesses examined have had prices determined as part of a regulatory review process. The purpose of this process or framework is to ensure that prices are cost reflective. Each regulator applies its own approach and principles to achieve this cost reflectivity. We have sought to use, as much as possible, prices that have been set or recommended by an independent regulator on the basis that these will reflect full cost recovery.4 Consequently, we have limited the inclusion of prices set directly by a local government (for example, in Queensland where prices outside Gladstone and SEQ are not subject to regulatory scrutiny, we have limited the sample to one council area – Townsville – being Queensland’s second largest city outside of SEQ).
Where large price increases are required to ensure prices reflect economic costs, regulators and governments often elect to ‘phase in’ cost reflective prices over a transition period. For example, prices levied by Seqwater in South East Queensland
2 Except where current prices already provide a small rate of return, in which case prices are kept constant in real
terms.
3 IPART (2004) Bulk Water Prices from 2005/06: Issues Paper. September. p 12. It is acknowledged that this was a regulatory decision, rather than one of government policy.
4 Some prices are set by the respective government. In some cases, cost recovery may be influenced by opening asset valuation decision by governments or regulators.

GAWB
AUSTRALIAN WATER PRICES 01/10/2014 12:11:00 Page 8 of 15
involve a 10-year price path, which finishes in 2017/18. In some cases, prices are transitioning to lower levels due to step-reductions in costs or other factors. For example, IPART included arrangements in its 2012 decision to transition over 4 years reductions to the maximum price chargeable by Sydney Water Corporation.
Where a regulator or government has established a price path to achieve cost reflective tariffs, we included that jurisdiction’s cost reflective tariff (rather than the transition price). That is, we adopt the price in the final year of the price path.
For some businesses, tariffs are set using an inclining or declining block, or fixed charges regardless of use. In order to generate a standard price, we have taken the average cost (per ML) for a 1,000ML / annum user5, given GAWB’s customers typically use this volume or more.6
5 Where charges relate to meter size or connection size, we have adopted a 100mm meter.
6 In doing so, we acknowledge that some businesses may not in fact have customers taking 1,000ML of water per annum.

GAWB
AUSTRALIAN WATER PRICES 01/10/2014 12:11:00 Page 9 of 15
44 AAssssuummppttiioonnss aanndd pprriicceess The assumptions used are summarised below. Attachment B provides the websites referenced.
General
Where relevant, we have adopted each business’ published prices for 2014/15. Where price paths exist that require a future year’s price to be adopted, we have deflated that price by 2.5%, which is the midpoint of the Reserve Bank of Australia’s target range for inflation.
Sydney Water Corporation
Sydney Water’s prices are set by the Independent Pricing and Regulatory Tribunal (IPART). IPART set a price path for the fixed charge, to decrease in real terms over the regulatory period to 2015/16. The usage tariff remains constant in real terms. Accordingly, the published 2014/15 usage charge has been adopted, however the 2015/16 fixed charge (which is lower than the 2014/15 price) indexed to $2014/15.
Melbourne Water
We have sourced prices published on Melbourne Water’s website, for 2014/15.
We have presented prices for Melbourne Water’s three main retail customers: City West Water, South East Water and Yarra Valley Water. Melbourne Water charges these retailers under a two part tariff, including a large fixed charge.
In order to derive a price per ML, forecast demand set by the Essential Services Commission (ESC) for 2014/15 for each of the three retailers7 has been divided into the annual fixed charge, and added to the volumetric charges.
City West, South East, Yarra Valley & Barwon Water
The published 2014/15 prices for the individuals retailers were used. No price path applies for these retailers.
7 See http://www.esc.vic.gov.au/getattachment/653684bc-1058-4cc9-a62b-c31053e7762a/Metropolitan-water-price-
review-2013-18-final-deci.pdf at page 125.

GAWB
AUSTRALIAN WATER PRICES 01/10/2014 12:11:00 Page 10 of 15
Townsville City Council
At the time of preparing this report, Council had not published water use prices.
Instead, we have indexed the 2013/14 consumption tariff to $2014/15.
Seqwater
Seqwater charges a bulk water price path to its local government and Distribution Retail customers (refer QUU below). This price path finishes in 2017/18. The price in the final year of price, which is in nominal terms, was deflated to $2014/15 using assumed CPI at 2.5%.
Queensland Urban Utilities
QUU’s charges are in two parts.
The first part relates to QUU’s charges. These prices were based on the published QUU rates for 2014/15.
The second part is the bulk water price path, which is passed through to customers as a separate line item. We have adopted the 2017/18 price (in $2014/15), consistent with Seqwater above.
Water Corporation, Aqwest & Busselton
The published tariffs for non-residential, metropolitan customers for 2014/15 were used. No price path was published.
SA Water
The published prices for business customers for 2014/15 were used. No price path applies.
PowerWater
The published 2014/15 water charges for commercial users were used in the calculation. No price path was published.
Hunter Water
The published charges for a consumer in Newcastle were applied. No price path applies.
ACTEW
Published 2014/15 prices were used. No price path applies.

GAWB
AUSTRALIAN WATER PRICES 01/10/2014 12:11:00 Page 11 of 15
Gladstone Area Water Board
The 2015/15 weighted average price across potable water connections for Gladstone Regional Council was used, as advised by GAWB. This price is for bulk treated water to the Council.
Prices are set out at Table 1, and presented graphically in Attachment A.
TTaabbllee 11 –– LLiisstt ooff vvaarriioouuss wwaatteerr pprriicceess ((rreettiiccuullaatteedd,, bbuullkk ttrreeaatteedd,, bbuullkk rraaww)) $$22001144//1155
SSttaattee BBuussiinneessss PPrriicceess (($$//MMLL)) (($$22001144//1155))
Vic Melbourne Water for Yarra Valley Water for South East Water for City West Water
2,317 2,412 2,132
City West Water 2,572
South East Water 3,042
Yarra Valley Water 2,754
Barwon Water 2,251
Qld Seqwater 2,987
Townsville Regional Council 2,749
Queensland Urban Utilities - Brisbane 4,587
GAWB (to Gladstone Regional Council) 1,683
WA Water Corporation 2,061
Aqwest 2,095
Busselton Water 1,465
SA SA Water 3,320
NT PowerWater 1,828
NSW Sydney Water Corporation 2,235
Hunter Water (Newcastle) 1,972
ACT ACTEW Corporation 4,863
Based on a 1000ML /annum customer with a 100mm meter. We acknowledge such large customers may not exist in some retail areas.

GAWB
AUSTRALIAN WATER PRICES 01/10/2014 12:11:00 Page 12 of 15
AA GGrraapphhiiccaall pprreesseennttaattiioonn

GAWB
AUSTRALIAN WATER PRICES 01/10/2014 12:11:00 Page 13 of 15
FFiigguurree 11 PPrriicceess ooff vvaarriioouuss AAuussttrraalliiaann wwaatteerr bbuussiinneesssseess
-
500
1,000
1,500
2,000
2,500
3,000
3,500
4,000
4,500
5,000
5,500
Mel
bour
ne W
ater
(for Y
arra
Val
ley
Wat
er)
Mel
bour
ne W
ater
(for S
outh
Eas
t Wat
er)
Mel
bour
ne W
ater
(for C
ity W
est W
ater
)
Yarra
Val
ley
Wat
er
Sout
h E
ast W
ater
City
Wes
t Wat
er
Barw
on W
ater
Tow
nsvi
lle C
ity C
ounc
il
Que
ensl
and
Urb
an U
tiliti
es
Wat
er C
orpo
ratio
n
Aqw
est
Buss
elto
n W
ater
SA W
ater
Pow
erW
ater
Sydn
ey W
ater
Cor
p
Hun
ter W
ater
(New
cast
le)
ACTE
W C
orpo
ratio
n
Seqw
ater
GAW
B (G
lads
tone
Reg
iona
lC
ounc
il Po
tabl
e)
$/M
L
DDaattaa ssoouurrccee:: BBased on a 1000ML /annum customer, with a 100mm meter. Such large customers may not exist in some retail areas.

GAWB
AUSTRALIAN WATER PRICES 01/10/2014 12:11:00 Page 14 of 15
BB SSoouurrccee LLiisstt WWaatteerr SSeerrvviiccee PPrroovviiddeerr SSoouurrccee
Melbourne Water (for Yarra Valley Water, South East Water & City West Water)
http://www.melbournewater.com.au/aboutus/customersandprices/Pages/B
ulk-water.aspx
http://www.esc.vic.gov.au/getattachment/c62ce68b-f5d2-420e-ac99-
0a0c570fb01b/Water-price-review-2013-18-Barwon-Water-Deter-(5).pdf
http://www.esc.vic.gov.au/getattachment/653684bc-1058-4cc9-a62b-
c31053e7762a/Metropolitan-water-price-review-2013-18-final-deci.pdf
Yarra Valley Water
http://www.yvw.com.au/Home/Youraccount/Understandingyourbill/Busines
s/Prices/index.htm
http://www.esc.vic.gov.au/getattachment/85dbf640-d621-4e51-adb0-
c08883213513/Water-price-review-2013-18-Barwon-Water-Deter-(8).pdf
South East Water
http://southeastwater.com.au/Business/Pages/Water-prices-and-
charges.aspx
http://www.esc.vic.gov.au/getattachment/b696c8eb-cead-4ab0-9389-
6b91d4045bf6/Water-price-review-2013-18-Barwon-Water-Deter-(6).pdf
City West Water
http://www.citywestwater.com.au/our_news_water_prices_2014-15.aspx
http://www.esc.vic.gov.au/getattachment/90384707-9a17-46d0-9757-
b392b797344e/Water-price-review-2013-18-Barwon-Water-Deter-(4).pdf
Barwon Water
https://www.barwonwater.vic.gov.au/business/bill/fees
http://www.esc.vic.gov.au/getattachment/cd9200c4-f193-42be-bf54-
ad4eab64af8b/Water-price-review-2013-18-Barwon-Water-Determinat.pdf
Townsville City Council http://www.townsville.qld.gov.au/resident/fees/rates/Pages/default.aspx
Queensland Urban Utilities http://www.urbanutilities.com.au/~/media/quu/pdfs/business/accounts%20
and%20billing/business%20charges%202014_15/brisbane%20bus%20pri
cing%20%202014_final_july.ashx

GAWB
AUSTRALIAN WATER PRICES 01/10/2014 12:11:00 Page 15 of 15
WWaatteerr SSeerrvviiccee PPrroovviiddeerr SSoouurrccee
Water Corporation http://www.watercorporation.com.au/home/business/my-account/your-bill-
and-charges
Aqwest http://aqwest.com.au/Customers/PricingStructure.aspx
Busselton Water http://www.busseltonwater.wa.gov.au/Customers/WaterCharges.aspx
SA Water http://www.sawater.com.au/NR/rdonlyres/69D39660-93D8-406E-8EAE-
5343E1E1AA5F/0/FACTSHEET_NewWaterPrices201415Final.pdf
PowerWater https://www.powerwater.com.au/customers/my_account/pricing
Sydney Water Corp http://www.sydneywater.com.au/SW/accounts-billing/understanding-your-
bill/our-prices/index.htm
Hunter Water (Newcastle)
http://www.hunterwater.com.au/Your-Account/Managing-Your-
Account/Non-residential-Pricing--Charges/Non-residential-Pricing--
Charges.aspx
http://www.ipart.nsw.gov.au/Home/Industries/Water/Reviews/Metro_Pricin
g/Review_of_prices_for_Hunter_Water_Corporation_from_1_July_2013/1
1_Jun_2013_-_Final_Report/Final_Report_-
_Hunter_Water_Corporations_water_sewerage_stormwater_drainage_an
d_other_services_-_1_July_2013_to_30_June_2017
ACTEW Corporation http://www.actew.com.au/Customer%20Accounts%20and%20Services/Pri
cing%20and%20your%20Customer%20Contract/ACT%20business%20w
ater%20prices.aspx
Seqwater http://www.dews.qld.gov.au/policies-initiatives/water-sector-reform/water-
pricing/bulk-water-prices

Submission by Gladstone Area Water Board – Appendices
This page intentionally blank

2015 Price Monitoring Investigation
Appendix E – Operational Benchmarking
Marchment Hill Consulting: Gladstone Area Water Board: Operational Benchmarking Report, July 2014

Submission by Gladstone Area Water Board – Appendices
This page intentionally blank

This document is confidential and intended for the sole use of the client to whom it is addressed. Persons who have not been authorisedto access this document should read no further. Marchment Hill Consulting, its partners, employees and agents neither owe nor acceptany duty of care or responsibility to such persons, and shall not be liable in respect of any loss, damage or expense of any nature which iscaused by any use they may choose to make of this report. The information outlined herein is proprietary and its expression in thisdocument is copyrighted, with all rights reserved to Marchment Hill Consulting. Any form of reproduction, dissemination, copying,disclosure, modification, distribution and/or publication of this document without express written permission from Marchment HillConsulting is strictly prohibited.
Operational Benchmarking
11 July 2014
Gladstone Area Water Board
Final Report

2
1. Executive Summary ………………………………………………………….3
2. Background to Study ………………………………………………………...9
• Objectives and Scope
• Approach
• Peer Group
• Qualifications
3. Analysis of Results ………………………………………………………….14
4. Conclusions ………………………………………………………………….44
Appendix A – Methodology …………………………………………………………………50
Appendix B – Data Sources …………………………………………………………….....54
Appendix C – Peer Group Selection Criteria ……………………………………………..56
Appendix D – Data Definitions ……………………………………………………………..58
Appendix E – Raw Data .…………………………………………………………………..62
Appendix F – Key Assumptions …………………………………………………………….64
Contents

1. Executive Summary

4
Executive Summary
1. General
Marchment Hill Consulting (MHC) has conducted an independent benchmarking study focusing on Operational Expenditure, but including Capital Expenditure and number of Full Time Equivalents (FTEs), as an input to Gladstone Area Water Board’s (GAWB’s) next regulatory pricing submission. The study has been based on comparing GAWB to a peer group of Australian bulk water supply businesses.
The following public data sources have been used to support this benchmarking study:
• Annual Reports
• Water Plans
• National Water Commission Performance Reports, and
• Water business web sites.
A high-level comparison between GAWB and the peer organisations (i.e. at the ‘whole-of-business’ level for operational expenditure, capital expenditure, full time equivalent staff and revenue) has been conducted based on Efficiency, Productivity and Cost Ratios. Operational expenditure has also been compared at a functional level using MHC’s “fingerprinting” methodology to allow estimated functional cost structure breakdowns for the peers to be compared to actual operating cost data for GAWB.

5
Executive Summary (cont’d) - Peer Group Scaling
The peer group can be broadly categorised into three distinct cohorts based on size (small, medium, and large). The scale of GAWB’s business relative to the cohort averages across four proxy indicators of scale, is shown below.
Summary Comments
• Across all four measures, the peer organisations tend to consistently fall within bands corresponding to their respective large, medium and small cohorts
• There is typically an order of magnitude difference between each cohort, except with respect to Mains Length, which shows a narrower spread of values between the groups
• The cohort of large bulk suppliers comprises Peers 2, 5 and 6
• In the medium sized cohort, comprising GAWB, Peer 1 and Peer 7, GAWB ranked mid-way between its two peers on most scaling measures
• In the small cohort, Peer 3 and Peer 4 consistently rated smallest in scale relative to the overall peer group, with the latter being the smallest on all measures.
Average FTEs Water Sourced (Average, GL)
Mains Length (Average, km) PP&E Assets (Average, $m)

6
Executive Summary (cont’d) - Efficiency Ratios
The overall performance of each organisation relative to the peer group average score for each efficiency ratio is shown in the following traffic light matrix.
Better than Peer Group Ratio Average Close To Peer Group Ratio Average Worse than Peer Group Ratio Average
Organisation Opex as a proportion
of RAB
Opex as a proportion
of PP&E
Opex as a proportion of Water
Sales
Capex as a proportion
of RAB
Capex as a proportion of Water
Sales
Summary Comments
Peer 1• GAWB’s efficiency ratios are consistently
superior to the peer group, with GAWB being the only organisation to be better than the average on all five measures
• In terms of the three operating efficiency ratios, GAWB ranked best among its peers on one of these, third on one and fourth on another
• GAWB’s operating efficiency compares favourably to the larger bulk supply entities in the peer group, who could be expected to benefit from economies of scale. On only one measure (Opex to PP&E) did GAWB not have the lowest total Opex ratio of this sub-group
• GAWB’s operating efficiency is also consistently superior to the other small regional integrated and bulk water entities.
Peer 2
Peer 3 n/a n/a
Peer 4n/a n/a
Peer 5
Peer 6
Peer 7 n/a n/a
GAWB

7
Executive Summary (cont’d) - Cost Ratios
The overall performance of each organisation relative to the peer group average score for each cost ratio is shown below.
Better than Peer Group Ratio Average Close To Peer Group Ratio Average Worse than Peer Group Ratio Average
Organisation Opex per unit of Mains Length
Opex per unit of Water
Sourced
Capex per unit of Mains Length
Capex per unit of Water
Sourced
Summary Comments
Peer 1• Cost ratio comparisons can be seen to be
sensitive to significant differences in the physical scale or nature of operations between organisations
• The ratio results for the cohort of large bulk suppliers (Peers 2, 5 and 6) tended to “pull” average figures up
• Only GAWB and its small-medium sized peers (Peer 1 and Peer 4) performed better than the average on all four measures
• GAWB consistently placed in in the lower to middle part of the field among these peer organisations.
Peer 2
Peer 3
Peer 4
Peer 5
Peer 6
Peer 7
GAWB

8
Executive Summary (cont’d) - Productivity Ratios
The overall performance of each organisation relative to the peer group average score for each productivity ratio is shown in the following traffic light matrix.
Better than Peer Group Ratio Average Close To Peer Group Ratio Average Worse than Peer Group Ratio Average
Organisation FTE per unit of Water Sourced
FTE per unit of Mains Length
Summary Comments
Peer 1• GAWB’s result in relation to FTEs per Water
Sourced is superior to all but one of the small and medium regional water authorities and well below the overall peer group average
• On FTEs per unit of Mains Length, GAWB’s performance is superior to that of its most similar peer, Peer 7, and well below the overall peer group average.
Peer 2
Peer 3
Peer 4
Peer 5
Peer 6
Peer 7
GAWB

2. Background to the Study

10
2. Background to the Study
2.1 Objectives and Scope
Marchment Hill Consulting (MHC) was engaged by GAWB in late 2013 to conduct an independent Operational Benchmarking Study to serve as an input to GAWB’s 2015 regulatory pricing submission.
The key objective of this review has been to provide an objective picture of GAWB’s Opex efficiency relative to a set of comparable peer organisations in the Australian water sector, and in doing so to demonstrate that GAWB operates as an efficient bulk water supply business.
The primary focus of this review has been on Operating Expenditure (Opex) efficiency, at both a whole-of-business level, and at a more detailed “functional” level. A selection of Capital Expenditure (Capex) and Productivity ratios has also been provided, however, where data was available to do so.
A complete list of data sources is contained in Appendix B.

11
Background (cont’d)
2.2 Approach
The approach taken to this review has comprised six broad stages, as illustrated below and detailed in Appendix A.

12
Background (cont’d)
2.3 Peer Group
The peer group was selected from a range of candidate water authorities in Australia to provide a balanced selection of large, medium and small organisations, and servicing both metropolitan and regional locations. The peer group comprised eight organisations, including GAWB. Each organisation conducted bulk water supply operations, either as their core business, or as part of a vertically-integrated operation.
The selection criteria for the peer group selection are shown in Appendix C.

13
Background (cont’d)
2.4 Qualifications
Quantitative performance benchmarking poses numerous challenges, and this is particularly so for bulk water businesses in Australia by virtue of their small number and widely differing characteristics. The level of analysis possible is also generally limited by budget, available time, and public availability of data. Given these constraints and challenges, the quality of analysis and conclusions drawn depends heavily on the insights and industry knowledge of those performing the benchmarking analysis. MHC has some of the most extensive water industry benchmarking experience in Australia and has utilised this expertise to bridge gaps in information and mitigate benchmarking challenges. Examples include:
• There is limited consistency in the definitions adopted for the reporting of cost items in annual and other financial reports. As far as possible, Notes to Financial Statements in annual reports have been carefully examined to identify and account for any such inconsistencies
• Operating expenditure and FTEs are rarely publicly reported at the functional level, nor segregated into “bulk” and “non-bulk” components. This has necessitated the functional decomposition of publicly available whole-of-business data, and the application of assumed profiles based on MHC’s proprietary library of water business data and “fingerprinting” methodology, in order to provide estimates of functional expenditures for the peer organisations
• Small water organisations that are incorporated into or affiliated with councils sometimes have water-specific functions embedded within other council functions, or rely on councils for the provision of some or all back-office support services. It is not possible to quantify these without detailed discussions with the water businesses, however, MHC has used its knowledge of the respective businesses to identify and account for these functions in the analysis
• The sourcing arrangements for peer organisations (i.e. the mix of internal to external staff) are generally not publicly available. MHC has used its knowledge of the sourcing practices of the respective organisations both in the selection of the peer group and in the interpretation of results, to address any potential inconsistencies in this regard.

3. Analysis of Results

15
3.1 Benchmarking Analysis – Peer Group Scaling
Peer Group Scaling
• Total Full Time Equivalent Employees (FTEs)
• Volume of Water Sourced
• Length of (Bulk) Mains
• Value of Regulated Asset Base (RAB)
• Value of Property Plant & Equipment (PP&E) assets
Definitions of these metrics and functional expenditure categories are shown in Appendix D.
The size or scale of an organisation can directly influence levels of expenditure, revenue and FTEs required and hence distort comparisons between organisations. Peer Group Scaling factors are used as the denominator of performance ratios in an attempt to “normalise” these metrics and facilitate more meaningful comparison.
Five different Peer Group Scaling factors have been used in this analysis and applied where appropriate:

16
Peer Group Scaling - FTEs
Insights
• Bulk-related FTE numbers vary significantly across the peer group
• Of the organisations included, Peer 2, Peer 5 and Peer 6 can be categorised as large bulk water providers, with 622.6, 305.6 and 265.5 FTEs respectively
• GAWB, Peer 7, and Peer 1 fall into the category of medium bulk water providers, with 80.2, 64.2 and 58.6 FTEs respectively
• Peers 3 and 4 can be regarded as small bulk water operators with an estimated 9 and 7 FTE’s respectively associated with bulk water supply functions
• GAWB’s FTE count places it well below the overall peer group average but as the largest of the three medium-sized bulk suppliers.
Notes
• FTE values used throughout this analysis represent the number of FTEs associated with bulk water supply functions. For bulk-only providers such as GAWB, this represents the full FTE complement of the organisation. For vertically integrated water businesses, this represents only a proportion of their total workforce. In these cases, an estimate of the number of FTEs attributable to bulk supply has been made, drawing on MHC’s proprietary database.
FTEs

17
Peer Group Scaling – Water Sourced
Insights
• Water sourced is the parameter with the greatestvariation across the peer group, with the largest, Peer 5, being some 1000 times that of the smallest, Peer 4
• Peer 5 aside, the peer group fits within a broad range from 4,297 ML to 522,125 ML
• GAWB, Peer 1 and Peer 7 fall into the category of medium bulk water providers, with 60,926, 61,000 and 11,132 ML respectively, although the latter is at the lower end of the cohort on this measure
• Peer 3 and Peer 4 again clearly fall into a distinct bracket of small suppliers with 6,470 and 4,297 ML sourced respectively
• GAWB’s water supply volume places it well below the overall peer group average but as equal-highest of the medium bulk suppliers.
Notes
• The scale of Peer 5’s water sourced volume sets it apart from the peer group. In order to avoid distortion of comparisons, Peer 5 has been excluded from the calculation of averages for some of the benchmark ratios in this study, and this is notated accordingly.
Water Sourced (ML)

18
Peer Group Scaling – Mains Length
Insights
• Mains length exhibits less variation across the peer group than water sourced, but there remains an order of magnitude in difference between the largest (Peer 2) and smallest (Peer 4)
• The variation in mains length is most notable among the large bulk suppliers - Peer 2, Peer 5 and Peer 6 - reflecting the substantially different nature of their networks and operations
• The medium sized suppliers - GAWB, Peer 7, and Peer 1 - have a more consistent range of mains length, with GAWB again positioned broadly mid-way between the other two
• Peer 3 and Peer 4 have broadly comparable bulk networks of approximately 57 and 45 kilometres respectively
• GAWB’s mains length is close to but slightly lower than the overall peer group average, placing it in the middle of the pack among its peers.
Notes
• Mains length varies greatly among the peer organisations, as does the nature and diameter of the mains, and hence the operating costs and asset values per kilometre. Nonetheless, it does provide a valid scaling factor for some ratios
• In the case of the vertically integrated water businesses, published mains length data has been adjusted to provide an estimate of “bulk supply mains” based on MHC’s internal data and experience.
Bulk Mains Length (km)

19
Peer Group Scaling - RAB
Insights
• GAWB has the lowest RAB of the organisations included here, being slightly below that of its medium-sized counterpart Peer 3.
Notes
• Regulated Asset Base (RAB) data was not available for Peer 7, Peer 3 and Peer 4, consequently excluding them from RAB related calculations
RAB ($m)
No data available
No data available
No data available

20
Peer Group Scaling – PP&E
Insights
• GAWB’s PP&E value places it well below the overall peer group average and mid range among the three medium-sized bulk suppliers
• Peer 3 and Peer 4 can be seen to have broadly comparable PP&E figures of $89m and $64m respectively.
Notes
• Property, Plant & Equipment (PP&E) is a publicly-available balance sheet line item which closely approximates the value of the “physical” assets of a water business. This makes it a useful scaling factor and denominator for certain efficiency and cost ratios
PP&E Assets ($m)

21
Summary of Results: Peer Group Scaling
The peer group can be broadly categorised into three distinct cohorts based on size (small, medium, and large). The scale of GAWB’s business relative to the cohort averages across four proxy indicators, is shown below.
Summary Comments
• Across all four measures, the peer organisations tend to consistently fall within bands corresponding to their respective large, medium and small cohorts
• There is typically an order of magnitude difference between each cohort, except with respect to Mains Length, which shows a narrower spread of values between the groups
• The cohort of large bulk suppliers comprises Peer 5,Peer 6 and Peer 2
• In the medium sized cohort, comprising GAWB, Peer 1 and Peer 7, GAWB ranked mid-way between its two peers on most scaling measures
• In the small cohort, Peer 3 and Peer 4 consistently rated smallest in scale relative to the overall peer group, with the latter being the smallest on all measures.
Average FTEs Water Sourced (Average, GL)
Mains Length (Average, km) PP&E Assets (Average, $m)

22
3.2 Benchmarking Analysis – Efficiency Ratios
Efficiency Ratios
• Opex as a proportion of RAB
• Opex as a proportion of PP&E
• Opex as a proportion of Water Sales
• Capex as a proportion of RAB
• Capex as a proportion of Water Sales
Each of these metrics has been calculated with respect to total Opex, functional Opex (i.e. that estimated to relate to each of the four nominated functional areas), and total Capex. The estimation of functional and bulk water expenditure components has been done using MHC’s “fingerprinting” approach, described in Appendix A. Definitions of the metrics and functional expenditure categories are shown in Appendix D.
Efficiency Ratios are financial ratios intended to measure operating or capital efficiency. The indicators assessed here indicate the level of expenditure relative to the financial size of the organisation. In this study, the estimated bulk water supply-related component of the RAB and PP&E assets, and water sales revenue, are used as proxy indicators of the scale of the organisation.
The following efficiency ratios have been calculated:
23
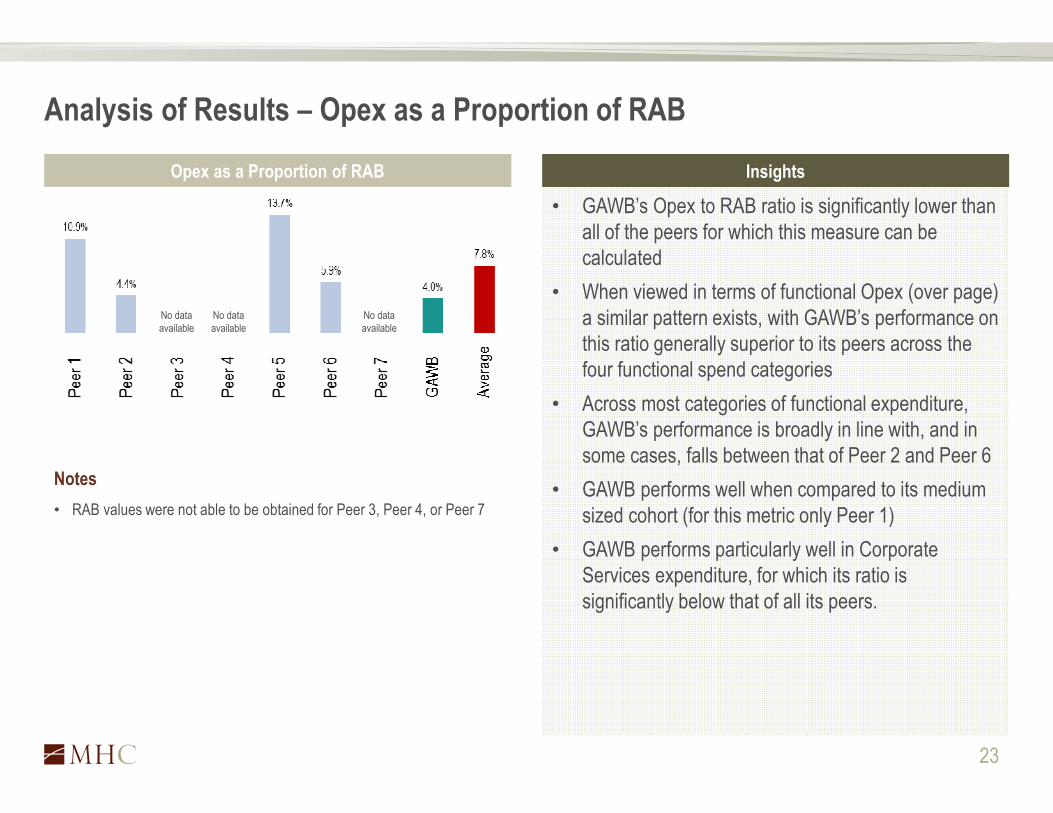
Analysis of Results – Opex as a Proportion of RAB
Opex as a Proportion of RAB Insights
• GAWB’s Opex to RAB ratio is significantly lower than all of the peers for which this measure can be calculated
• When viewed in terms of functional Opex (over page) a similar pattern exists, with GAWB’s performance on this ratio generally superior to its peers across the four functional spend categories
• Across most categories of functional expenditure, GAWB’s performance is broadly in line with, and in some cases, falls between that of Peer 2 and Peer 6
• GAWB performs well when compared to its medium sized cohort (for this metric only Peer 1)
• GAWB performs particularly well in Corporate Services expenditure, for which its ratio is significantly below that of all its peers.
Notes
• RAB values were not able to be obtained for Peer 3, Peer 4, or Peer 7
No data available
No data available
No data available

24
Analysis of Results – Opex as a Proportion of RAB (by Function)
Strategy and Asset Creation Operations
Asset Life Cycle Management Corporate Services
No data available
No data available
No data available
No data available
No data available
No data available
No data available
No data available
No data available
No data available
No data available
No data available

25
Opex as a Proportion of PP&E Insights
• With the exception of Peer 5, the peer group fits within a relatively narrow band on this measure
• GAWB has the third lowest overall Opex to PP&E ratio of the peer group behind Peer 2 and Peer 7
• At a functional level (over page) this pattern continues, with GAWB slightly trailing Peer 2 and Peer 7 in relation to Strategy and Asset Creation, Operations, and Asset Life Cycle expenditure ratios
• GAWB is superior to all its peers in the Corporate Services expenditure category.
Notes
• Property, Plant and Equipment (PP&E) expenditure is intended to approximate the value of the “physical” assets employed by the organisation
• PP&E data is reported in and sourced from publicly available annual financial statements
Analysis of Results – Opex as a Proportion of PP&E

26
Analysis of Results – Opex as a Proportion of PP&E (by Function)
Strategy and Asset Creation
Asset Life Cycle Management Corporate Services
Operations

27
Notes
• Water sales revenue can include both bulk water and retail charge components in the case of vertically integrated businesses
• Water sales is also a function of the applicable tariffs chargeable, which may be driven by political, regulatory or other non-efficiency-related factors
• In this review, these revenue components have not been separated and hence this denominator has not been “normalised”
• This could have the effect of making the vertically integrated business look more favourable, due to the inclusion of larger retail revenues in the denominator.
Analysis of Results – Opex as a Proportion of Water Sales
Opex as a Proportion of Water Sales Insights
• GAWB compares very favourably on this measure against its four bulk water supply peers and against the average
• The three vertically integrated businesses (i.e. Peer 1, Peer 3 and Peer 4) outperform GAWB on this measure, however this is likely due to the inclusion of retail revenue in their total water sales figures, and hence inflating the ratio’s denominator (refer Notes, this page)
• Notwithstanding this effect, GAWB compares very favourably with the vertically integrated businesses in terms of its Corporate Services expenditure ratio (over page) and significantly better than its bulk water peers.

28
Analysis of Results – Opex as a Proportion of Water Sales (by Function)
Strategy and Asset Creation Operations
Asset Life Cycle Management Corporate Services

29
Notes
• GAWB’s data excludes $50.3m capital expenditure associated with the Curtis Island expansion, which is considered a ‘once-off’ or abnormal expenditure item, and therefore was not at that time reflected in the FY13 RAB. This has been excluded to provide consistent treatment of the timing of appearance of Opex, Capex and RAB on GAWB’s financial statements
• RAB data was unavailable for Peer 3, Peer 4 and Peer 7
Analysis of Results – Capex as a Proportion of RAB
Capex as a Proportion of RAB Insights
• GAWB’s capital expenditure relative to RAB was well below the average of the agencies for which RAB data was available.
No data available
No data available
No data available

30
Notes
• GAWB’s data excludes $50.3m capital expenditure associated with the Curtis Island expansion, which is considered a ‘once-off’ or abnormal expenditure item, and therefore was not at that time reflected in the FY13 RAB. This has been excluded to provide consistent treatment of the timing of appearance of Opex, Capex and RAB on GAWB’s financial statements.
Analysis of Results – Capex as a Proportion of Water Sales
Capex as a Proportion of Water Sales Insights
• GAWB’s capital expenditure relative to Water Sales is considerably lower than the peer group average.

31
Summary of Results - Efficiency Ratios
The overall performance of each organisation relative to the peer group average score for each efficiency ratio is shown in the following traffic light matrix.
Better than Peer Group Ratio Average Close To Peer Group Ratio Average Worse than Peer Group Ratio Average
Organisation Opex as a proportion
of RAB
Opex as a proportion
of PP&E
Opex as a proportion of Water
Sales
Capex as a proportion
of RAB
Capex as a proportion of Water
Sales
Summary Comments
Peer 1• GAWB’s efficiency ratios are consistently
superior to the peer group, with GAWB being the only organisation to be better than the average on all five measures
• In terms of the three operating efficiency ratios, GAWB ranked best among its peers on one of these, third on one and fourth on another
• GAWB’s operating efficiency compares favourably to the larger bulk supply entities in the peer group, who could be expected to benefit from economies of scale. On only one measure (Opex to PP&E) did GAWB not have the lowest total Opex ratio of this sub-group
• GAWB’s operating efficiency is also consistently superior to the other small regional integrated and bulk water entities.
Peer 2
Peer 3 n/a n/a
Peer 4n/a n/a
Peer 5
Peer 6
Peer 7 n/a n/a
GAWB

32
3.3 Benchmarking Analysis – Cost Ratios
Each of these metrics has been calculated with respect to total Opex, functional Opex (i.e. that estimated to relate to each of the four nominated functional areas), and total Capex. The estimation of functional and bulk water expenditure components of Opex has been done using MHC’s “fingerprinting” approach, described in Appendix A. Definitions of the metrics and functional expenditure categories are shown in Appendix D.
Cost Ratios are ratios of expenditure to a physical measure of scale or output and are intended to provide an indication of the effectiveness in the allocation of expenditure (measured in cost per size terms). For this analysis, Mains Length and volume of Water Sourced are used as proxy indicators of the scale / size of the organisation and its physical output.
The following cost ratios have been calculated:
Cost Ratios
• Opex per unit of Mains Length
• Opex per unit of Water Sourced
• Capex per unit of Mains Length
• Capex per unit of Water Sourced

33
Analysis of Results – Opex per unit of Mains Length ($/km)
Opex per unit of Mains Length Insights
• Despite significant variability in the results on this ratio, GAWB’s result lies in the middle of the pack and well below the average (even when Peer 6 data is removed)
• GAWB can be seen to be broadly in line with the medium sized cohort (i.e. Peer 7 and Peer 1), but slightly above them on this measure
• GAWB performs well when compared to its medium sized cohort in the Corporate Services area (over page).
Notes
• Mains length varies greatly among the peer organisations, as does the nature and diameter of the mains, and hence the operating costs and asset values per kilometre.
• The results for this metric are distorted by the very low comparative mains length of Peer 6. Accordingly, MHC has used its professional judgement and the “average” figure shown above excludes Peer 6’s data. If not adjusted in this way, the average would be $267,268

34
Analysis of Results – Opex per unit of Mains Length ($/km) (by Function)
Strategy and Asset Creation Operations
Asset Life Cycle Management Corporate Services

35
Analysis of Results – Opex per unit of Water Sourced ($/ML)
Opex to Water Sourced ($/ML) Insights
• The majority of the peer group can be seen to fall within a band between $160 and $314 per ML of water sourced
• GAWB lies within this band and well below the adjusted peer group average
• GAWB can be seen to be closely aligned with the figures of the small and medium sized cohorts on this measure, with the exception of Peer 7
• GAWB performs very well when compared to the small and medium sized cohorts in both the Corporate Services and Asset Life Cycle Management areas (over page).
Notes
• The volume of water sourced is the metric with the greatest range of variation among the peers, with Peer 5’s volume being more than one thousand time that of Peer 4.
• MHC has used its professional judgement and the “average” figure shown above has been calculated excluding the “outlier” Peer 5. If not adjusted in this way, the average would be $412.

36
Analysis of Results – Opex per unit of Water Sourced ($/ML) (by Function)
Strategy and Asset Creation Operations
Asset Life Cycle Management Corporate Services

37
Analysis of Results – Capex per unit of Mains Length ($/km)
Capex per unit of Mains Length Insights
• GAWB’s Capex to Mains Length ratio places it broadly in line with the medium sized cohort (i.e. Peer 7 and Peer 1)
• GAWB’s result is well below the average of the peer group.
Notes
• Peer 2’s performance on this ratio reflects high recent capital investment. This is nonetheless considered a reasonably “normal” expenditure item for a bulk water business, and hence has been included in the analysis
• If Peer 2’s data was excluded from calculation of the “average” figure, the average would reduce to $96,436 – still well above GAWB’s ratio.

38
Analysis of Results – Capex per unit of Water Sourced ($/ML)
Capex per unit of Water Sourced Insights
• GAWB’s Capex to Water Sourced ratio places it in the lower half of both the overall peer group and its medium sized cohort (i.e. Peer 7 and Peer 1), and with a far lower ratio than Peer 4 and Peer 3
• GAWB’s result is well below the average of the peer group.
Notes
• As previously stated, Peer 2’s large recent capital investment is considered a “normal” expenditure item for a bulk water business, and has thus been included in the analysis.

39
Summary of Results - Cost Ratios
The overall performance of each organisation relative to the peer group average score for each cost ratio is shown below.
Better than Peer Group Ratio Average Close To Peer Group Ratio Average Worse than Peer Group Ratio Average
Organisation Opex per unit of Mains Length
Opex per unit of Water
Sourced
Capex per unit of Mains Length
Capex per unit of Water
Sourced
Summary Comments
Peer 1• Cost ratio comparisons can be seen to be
sensitive to significant differences in the physical scale or nature of operations between organisations
• The ratio results for the cohort of large bulk suppliers (Peer 6, Peer 2 and Peer 5) tended to “pull” average figures up
• Only GAWB and its small-medium sized peers Peer 1 and Peer 4 performed better than the average on all four measures
• GAWB consistently placed in in the lower to middle part of the field among these peer organisations.
Peer 2
Peer 3
Peer 4
Peer 5
Peer 6
Peer 7
GAWB

40
3.4 Benchmarking Analysis – Productivity Ratios
Definitions of the metrics are shown in Appendix D.
For this benchmarking study, the productivity ratios are intended to provide a measure of workforce efficiency and compare the number of staff (i.e. based on Total FTEs) to the size of the business (i.e. using physical indicators such as water sourced and mains length as proxy measures).
The following specific productivity ratios have been calculated:
Productivity Ratios
• FTEs per unit of Water Sourced
• FTEs per unit of Mains Length

41
Analysis of Results – FTEs per unit of Water Sourced (FTE/GL)
FTE per GL Water Sourced Insights
• GAWB’s result on this ratio is superior to all but one of the small and medium regional water authorities and well below the adjusted peer group average.
Notes
• As previously noted, Water Sourced varies considerably between peer organisations. Peer 5’s Water Sourced figure is substantially at variance with its peers’ results
• Accordingly, MHC has used its professional judgement and the Peer 5 result has been excluded from the calculation of the “average” in the above graph. Without this adjustment, the average for this ratio would be 1.73.

42
Analysis of Results – FTEs per unit of Mains Length (FTE/km)
FTE per km of Mains Length Insights
• GAWB’s result is far superior to the larger bulk supply agencies, however this is influenced by the fact that these larger agencies’ operations are less reliant on large volumes of pipeline infrastructure
• GAWB’s result on this ratio is superior to that of its most similar peer, Peer 7, and well below the peer group average.
Notes
• Mains length used in this calculation is the estimate of mains length associated with bulk water supply (as opposed to reticulation). This estimate has been based on MHC’s knowledge of similar water business’ network composition.

43
Summary of Results - Productivity Ratios
The overall performance of each organisation relative to the peer group average score for each productivity ratio is shown in the following traffic light matrix.
Better than Peer Group Ratio Average Close To Peer Group Ratio Average Worse than Peer Group Ratio Average
Organisation FTE per unit of Water Sourced
FTE per unit of Mains Length
Summary Comments
Peer 1• GAWB’s result in relation to FTEs per Water
Sourced is superior to all but one of the small and medium regional water authorities and well below the adjusted overall peer group average
• On FTEs per unit of Mains Length, GAWB’s performance is superior to that of its most similar peer, Peer 7, and well below the peer group average.
Peer 2
Peer 3
Peer 4
Peer 5
Peer 6
Peer 7
GAWB

4. Conclusions

45
Conclusions
4.1 General
Marchment Hill Consulting (MHC) has conducted an independent benchmarking study focusing on Operational Expenditure, but including Capital Expenditure and number of Full Time Equivalents (FTEs), as an input to Gladstone Area Water Board’s (GAWB’s) next regulatory pricing submission.
The study has been based on comparing GAWB to a selection of large, medium and small water businesses across Australia that perform (either exclusively or in part) a bulk water supply function. The following public data sources have been used to support this benchmarking study:
• Annual Reports
• Water Plans
• National Water Commission Performance Reports, and
• Web sites of the respective water businesses.
A high-level comparison between GAWB and the peer organisations (i.e. at the ‘whole-of-business’ level for operational expenditure, capital expenditure, full time equivalent staff and revenue) has been conducted based on Efficiency, Productivity and Cost Ratios. Operational expenditure has also been compared at a functional level using MHC’s “fingerprinting” methodology to allow estimated cost structure breakdowns for the peers to be compared to actual operating cost data for GAWB.

46
Conclusions (cont’d)
4.2 Peer Group Scaling
Peer Group Scaling is used to normalise performance metrics with a view to removing distortions caused by differences in organisational size or scale. In this analysis, five metrics have been used as proxy indictors of organisational scale, namely:
– Total Full Time Equivalent Employees (FTEs)
– Volume of Water Sourced
– Length of (Bulk) Mains
– Value of Regulated Asset Base (RAB), and
– Value of Property Plant & Equipment (PP&E) assets.
• Across all scale dimensions, the peer organisations tend to consistently fall within bands corresponding to their respective large, medium and small cohorts.
• There is typically an order of magnitude difference between each cohort, except with respect to Mains Length, which shows a narrower spread of values between the groups.
• In the medium sized cohort, comprising GAWB, Peer 1 and Peer 7, GAWB consistently ranked mid-way between its two peers on most measures.
• GAWB ranked below the overall peer average on all five scaling dimensions.

47
Conclusions (cont’d)
Ratio Metric GAWB Observation
Efficiency Opex as a proportion of RAB GAWB’s performance on this measure is significantly better than its peers at a total Opex level, as well as when viewed at a functional level. GAWB exhibits the best Corporate Services expenditure ratio of any of its peers.
Opex as a proportion of PP&E GAWB’s performance on this measure is superior to the peer group average and ranks third overall behind Peer 2 and Peer 7. At a functional level, GAWB’s Corporate Services expenditure is again far superior to the peer group.
Opex as a proportion of Water Sales GAWB compares very favourably on this measure against its four bulk water supply peers and against the average.
Capex as a proportion of RAB GAWB’s capital expenditure relative to RAB was better than the average of the agencies for which RAB data was available, and far superior to all but one.
Capex as a proportion of Water Sales GAWB’s ratio of capital expenditure to Water Sales is considerably lower than the peer group average.
4.3 Efficiency Ratios
Efficiency Ratios are financial ratios intended to measure operating or capital efficiency. The indicators assessed here indicate the level of expenditure relative to the size of the organisation. In this study, the estimated bulk water supply-related component of the RAB and PP&E assets, and water sales revenue, are used as proxy indicators of the scale of the organisation.

48
Conclusions (cont’d)
Ratio Metric GAWB Observation
Cost Opex per unit of Mains Length GAWB’s result lies in the middle of the pack and well below (i.e. better than) the
average (even when outlying Peer 6 data is removed). GAWB can be seen to
be broadly in line with, but slightly above, Peer 7 and Peer 1 on this measure.
Opex per unit of Water Sourced The majority of the peer group can be seen to fall within a band between $160 and $314 per ML of water sourced. GAWB lies comfortably within this band and well below the peer group average.
Capex per unit of Mains Length GAWB’s Capex to Mains Length ratio places it broadly in line with its medium
sized cohort (i.e. Peer 7 and Peer 1) and well below the average of its peer
group.
Capex per unit of Water Sourced GAWB’s Capex to Water Sourced ratio places it in the lower half of both the overall peer group and its medium sized cohort, and well below the average of the peer group.
4.4 Cost Ratios
Cost Ratios are ratios of expenditure to a physical measure of scale or output and are intended to provide an indication of the effectiveness in the allocation of expenditure (measured in cost per size terms). For this analysis, Mains Length and volume of Water Sourced are used as proxy indicators of the scale of the organisation and its physical output.

49
Conclusions (cont’d)
Ratio Metric GAWB Observation
Productivity FTEs per unit of Water Sourced GAWB’s result in relation to FTEs per Water Sourced is superior to all but one of the small and medium regional water authorities and well below the overall peer group average.
FTEs per unit of Mains Length GAWB’s result on this ratio is superior to that of its closest peer, Peer 7, and
well below the peer group average.
4.5 Productivity Ratios
The productivity ratios are intended to provide a measure of workforce efficiency and compare the number of staff (i.e. based on Total FTEs) to the size of the business (i.e. using physical indicators such as water sourced and mains length as proxy measures).

Appendix A - Methodology

51
Methodology
The methodology adopted by MHC in conducting this review is summarised below. Of the six phase of this approach, phases 1, 2, 4 and 6 are considered to be adequately described in the points below each stage. (Note that the approach taken to selection of the peer group is discussed in Appendix C). Stages 3 (Establish Industry Cost Profile) and 5 (Undertake Benchmarking) warrant further elaboration and this is provided in the following pages.

52
Methodology (cont’d)
Stage 3 – Establish Industry Cost Profiles
Publicly available operating cost data is usually limited to aggregate (whole-of-business) figures, with little visibility of the breakdown of costs by business function, or across different parts of the operation (e.g.. bulk water treatment and supply, versus retail and distribution). One of the objectives of this review was to examine operating efficiency at this lower level, while only working with publicly available data.
Accordingly, MHC applied an approach it terms “fingerprinting”, by which a cost profile (or breakdown) by function can be approximated by using other known data, such as headcount (FTE) breakdowns. As a result of extensive performance benchmarking in the water sector over many years, MHC possesses a database of proprietary data from which it was able to build FTE profiles in accordance with the functional splits sought by GAWB. Definitions of the four functional Opex categories are provided in Appendix D.
This approach is based on the hypothesis that in businesses with largely in-sourced workforces, the operating expenditure distribution can be approximated by the distribution of FTEs. Using actual headcount and operating expense data, MHC was able to establish a close correlation between the two distributions. This was then validated against other actual data points, providing a reasonable level of comfort in the validity of the approach. A similar approach allowed the estimation of the proportion of Opex associated with bulk water supply in vertically integrated businesses, which is also generally not transparent in public domain financial information.
A similar approach, albeit less quantitative, was taken to estimating the proportion of mains length and asset value attributed to bulk water supply operations (as opposed to reticulation). This latter method was based on the extrapolation from known data points and MHC’s water operations expertise, and permits the “normalisation” of both numerators and denominators in those ratios where this is required.

53
Methodology (cont’d)
Stage 5 – Undertake Benchmarking
The resulting cost distributions and proportions were used to estimate the breakdown of total reported Opex into the sub-categories of interest. These included:
• Opex by functional area (i.e.. Strategy and Asset Creation, Asset Life Cycle Management, Operations, and Corporate Services)
• Component of total Opex in vertically integrated businesses attributable to bulk water treatment and supply
• Component of PP&E asset value and RAB attributable to bulk water treatment and supply in the vertically integrated peers
• Proportion of Mains Length attributable to bulk water treatment and supply in the vertically integrated peers

Appendix B – Data Sources

55
Data SourcesCompany Characteristic Source
Peer 2 FTEs Source: Peer 2 Annual Report 2012-13
Number of water treatment plants Source: Peer 2 Annual Report 2012-13
Length of water mains Source: Peer 2 Annual Report 2012-13
Total sourced water Source: Peer 2 Annual Report 2012-13
Annual revenue - water Source: Peer 2 Annual Report 2012-13
Assets (RAB) Source: Peer 2 Regulatory Submission 2012-2013
Assets (PP&E) Source: Peer 2 Annual Report 2012-13
Total Opex Source: Peer 2 Annual Report 2012-13
Total Capex Source: NPR 2011-12.
Other characteristics Source: Web site
Peer 1 FTEs Source: Web site
Number of water treatment plants Source: Web site
Length of water mains Source: Web site
Total sourced water Source: Web site
Annual revenue - water Source: Annual Report 2012-13
Assets (RAB) Source: WaterPlan 3 - ESC
Assets (PP&E) Source: Annual Report 2012-13
Total Opex Source: Annual Report 2012-13
Total Capex Source: Annual Report 2012-13
Other characteristics Source: Web site
Peer 6 FTEs Source: Annual Report 2012-13
Number of water treatment plants Source: Marchment Hill Consulting
Length of water mains Source: Manager, Asset Management
Total sourced water Source: Annual Report 2012-13
Annual revenue - water Source: NPR 2011-12, Annual Report 2012-13
Assets (RAB) Source: Price Determination 2012-16
Assets (PP&E) Source: Annual Report 2012-13
Total Opex Source: Annual Report 2012-13
Total Capex Source: Annual Report 2012-13
Other characteristics Source: Web site
Peer 5 FTEs Source: Annual Report 2012-13
Number of water treatment plants Source: Marchment Hill Consulting
Length of water mains Source: Operations Manager
Total sourced water Source: NPR 2011-12
Annual revenue - water Source: Annual Report 2012-13
Assets (RAB) Source: 2010 Pricing Determination
Assets (PP&E) Source: Annual Report 2012-13
Total Opex Source: Annual Report 2012-13
Total Capex Source: NPR 2011-12
Other characteristics Source: Web site
Company Characteristic Sources
Peer 7 FTEs Source: Annual Report 2012-13
Number of water treatment plants Source: NPR 2011-12
Length of water mains Source: NPR 2011-12
Total sourced water Source: NPR 2012-12
Annual revenue - water Source: NPR 2011-12
Assets (RAB) Not applicable
Assets (PP&E) Source: Annual Report 2012-13
Total Opex Source: Annual Report 2012-13
Total Capex Source: Annual Report 2012-13
Other characteristics Source: NPR 2011-12, Web site
Peer 3 FTEs Source: Quarterly Report
Number of water treatment plants Source: NPR 2011-12
Length of water mains Source: NPR 2011-12
Total sourced water Source: NPR 2011-12
Annual revenue - water Source: Annual Report 2013
Assets (RAB) Not applicable
Assets (PP&E) Source: Annual Report 2013
Total Opex Source: Annual Report 2013
Total Capex Source: Efficiency Report 2013
Other characteristics Source: Web site
Peer 4 FTEs Source: Quarterly Report
Number of water treatment plants Source: NPR 2011-12
Length of water mains Source: NPR 2011-12
Total sourced water Source: NPR 2011-12
Annual revenue - water Source: Annual Report 2012-13
Assets (RAB) Not applicable
Assets (PP&E) Source: Annual Report 2012-13
Total Opex Source: Annual Report 2012-13
Total Capex Source: NPR 2011-12, Efficiency Report 2013
Other characteristics Source: Web site
Gladstone Area Water Board FTEs Source: GAWB
Number of water treatment plants Source: NPR 2011-12
Length of water mains Source: GAWB
Total sourced water Source: GAWB
Annual revenue - water Source: GAWB
Assets (RAB) Source: GAWB
Assets (PP&E) Source: Annual Report 2012-13
Total Opex Source: GAWB
Total Capex Source: GAWB
Other characteristics Source: http://www.gawb.qld.gov.au

Appendix C – Peer Group Selection Criteria

57
Peer Group Selection
Criterion Importance / Relevance Comment
Predominant (or sole) focus on bulk water storage
and treatment role
Highly Desirable Key to comparability of operations and costs. Small number of
candidates. Less critical if storage/treatment costs are separable
Regional location Desirable Aids comparability of asset types, service levels, customer
density
Similarity of size (e.g. with respect to RAB or
publicly disclosed assets)
Desirable Must be sufficiently similar to suggests comparability of cost
structures
Large industrial customer base Desirable Aids comparability of commercial and customer service
transaction costs
Reputation as an efficient operator Highly Desirable Excluded due to difficulty objectively assessing
Similar infrastructure type and age Highly Desirable Aids comparability of operations and maintenance expenditures
Selection of the peer group commenced by identifying a number of key selection criteria, as shown in the table below. A long-list of candidate water businesses possessing these characteristics was then generated, and a simple Multi Criteria Assessment was then used, together with discussions with GAWB, to agree the final peer group.

Appendix D – Data Definitions

59
Data Definitions
Metric DefinitionOpex This is the sum of operating expenditure for labour, materials and contract services for water
only. For the purposes of ratio analysis Opex has been normalised where necessary to include only that component considered to relate to bulk water supply.
Opex – Strategy and Asset Creation That part of Opex relating to the following:• Activities necessary to meet strategic business positioning and corporate governance
requirements, including:• Board and CEO• Strategic planning• Economic regulation• New customer / business development
• The Asset Creation and De-commissioning function including activities to develop and deliver GAWB’s capital expenditure program. These include
• Pre-feasibility, scoping and planning• Non-capital creation and acquisition costs
Opex - Operations That part of Opex relating to the following:• Those activities and inputs required to provide a desired product, including
• Storage• Delivery• Treatment.Note that Hatchery expenses, where undertaken, would normally be included in this category but have been specifically excluded for the purposes of benchmarking.

60
Data Definitions (cont’d)
Metric DefinitionOpex – Asset Life Cycle Management That part of Opex associated with managing and maintaining GAWB’s existing assets. Activities
include:• Maintenance planning and execution• Condition assessments• Land management• Easement maintenance• Recreation area management• Maintenance of corporate assets
Opex – Corporate Services That part of Opex that is undertaken primarily to support the functions and operations of the other activities. Activities include:
• Finance• Procurement• Human Resources• Information Communication & Technology (ICT)• Legal• Provision of corporate facilities (excluding maintenance)• Other administration / reception
Capex This is the capital expenditure for water only.
It is the expenditure associated with the purchase of a generally large items or system having a multi-year lifetime. These expenditures are charged against a authority's earnings over a period of years, based on some predetermined amortisation schedule (straight-line, accelerated, etc), as opposed to an expensed item, which is taken against earnings entirely in the year obtained.

61
Data Definitions (cont’d)
Metric DefinitionRAB Regulatory (or Regulated) Asset Base. The value of assets deemed by the relevant economic
regulator as being allowable for use in determination of pricing under the “building block” approach, as at the end of a given financial year.
PP&E The value of Property, Plant and Equipment assets as recorded on the organisation’s Balance Sheet.
Mains Length The total length in kilometres of water pipelines and mains used to deliver raw or treated water to customers. In the case of vertically integrated water businesses, this review has sought to estimate that portion of mains length associated with bulk supply only (i.e.. excluding reticulation system) and hence references to “mains length” imply that used only for bulk water supply.
Number of FTEs This is the number of Full Time Equivalent staff.
Water Sales The amount earned in revenues for the wholesale and retail sale of water.
Volume of Water Sourced The amount of water sourced from:
• Surface water;
• Groundwater;
• Desalination;
• Recycling;
• Source supplier; and
• Purchased recycled water.
N.B. Due to the unique nature of GAWB’s commercial water supply arrangements which often require water to be reserved for potential use, “Total Reserved and Supplied Water Volume” has been used in GAWB’s case to more accurately reflect the scale of its operations.

Appendix E – Raw Data

63
Raw Data
The following table summarises the raw data obtained for each peer organisation prior to normalisation.
Peer FTEsNumber of water treatment
plants providing full treatment
Length of water mains
Total sourced water
Annual revenue -water
Assets (RAB) Assets (PP&E) Total Opex Total Capex Totex
Peer 1 252 17 2,000
61,000 $ 128,944,000 $ 494,160,000 $ 1,029,288,000 $ 81,135,000 $ 6,261,000 $ 87,396,000
Peer 2 623 46 600
282,431 $ 712,464,000 $ 6,086,112,256 $ 9,658,675,000 $ 266,427,000 $ 529,000,000 $ 795,427,000
Peer 3 38 6 381 6,470
$ 8,402,323 $ - $ 88,518,720 $ 8,238,000 $ 6,640,000 $ 14,878,000
Peer 4 30 3 301 4,297
$ 8,568,981 $ - $ 64,212,433 $ 5,799,000 $ 1,940,000 $ 7,739,000
Peer 5 306 - 250
4,499,240 $ 150,026,000 $ 719,700,000 $ 732,644,000 $ 98,691,000 $ 51,747,677 $ 150,438,677
Peer 6 266 - 85
522,125 $ 201,683,000 $ 1,427,329,000 $ 1,442,195,000 $ 83,790,000 $ 17,699,000 $ 101,489,000
Peer 7 64 2 118
11,132 $ 21,511,000 $ - $ 309,522,000 $ 10,539,000 $ 4,111,000 $ 14,650,000
GAWB 80 2 190
60,926 $ 54,212,000 $ 466,300,000 $ 497,577,000 $ 19,015,181 $ 58,810,000 $ 77,825,181

Appendix F – Key Assumptions

65
Key Assumptions
General Assumptions
• Most data used in this review relates to the 2012/13 Financial Year. Certain expenditure and operating data not available for the 2012/13 year relates to the 2011/12 year as the 2013 National Performance Reports had not been released at the time of analysis. Refer to Appendix B for specific data sources.
• Opex includes all expenses specific to water but excludes depreciation and amortisation, loss on sale of assets and finance costs, as listed in published financial statements and associated notes to those statements.
• Key data used in the calculation of Efficiency Ratios and Cost Ratios has been normalised using either the “fingerprinting” method described in Appendix A, or based on MHC’s proprietary data and knowledge.
• In regard to the estimation of bulk water supply components of key parameters in vertically-integrated water businesses, the following assumptions have been made:
Item Assumption
The percentage of total reported Opex in vertically-integrated business attributable to bulk water supply
23.3%
The percentage of total reported asset value (RAB or PP&E) in a vertically-integrated business attributable to bulk water supply
35%
The percentage of total mains length in vertically-integrated business attributable to bulk water supply
15%

66
Key Assumptions (cont’d)
• As the primary focus of this review has been Operating Efficiency, Capex figures have not been normalised to reflect that Capex associated with bulk water supply versus reticulation, or to separate that Capex associated with Wastewater services in those organisations that provide this service.
• Where the total number of FTEs is not publicly available, the total number of employees has been used.
• Water Sales figures have not been normalised to separate bulk or wholesale sales revenue from retail water supply-related revenue.
• Estimation of the breakdown of total bulk water supply related Opex by function has been done using the fingerprinting methodology described in Appendix A. Key fingerprint assumptions (i.e. the proportion of total bulk Opex attributed to each business function) are summarised below:
Type of Water BusinessStrategy & Asset
CreationAsset Life Cycle
ManagementOperations
Corporate Services
Total
Vertically integrated 13.1% 47.4% 23.0% 16.5% 100%
Bulk water supply 16.7% 34.6% 27.6% 21.1% 100%
GAWB 20.0% 37.4% 33.0% 9.6% 100%

67
Key Assumptions (cont’d)
Organisation-Specific Assumptions
• Peer 7 revised (extended) the useful lives of many of its assets as part of an asset revaluation process in June 2012. This had the effect of significantly reducing depreciation in the 2013 year relative to that of the preceding three years and consequently increasing the “net” Opex figure used in the ratio calculations (i.e.. net of depreciation, amortization, finance costs). In order to remove the distorting effect of this event and provide a picture more representative of typical a year, the 2012 Opex figure has been used in this analysis.
• Peer 2’s asset base includes large recent desalination and network investment, which is atypical of the peer group. Due to difficulties determining an appropriate value for these assets – as would be required to remove them from the RAB and PP&E – they have been included in these asset metrics but with appropriate notations made in the relevant graphs.
• Peer 1’s 2013 Opex includes a once-off charge to provide for unfunded employee superannuation benefits. In the context of the Opex total for that year, this is considered by MHC to have a relatively minor impact on the benchmarking results, and while an irregular event, has been assumed to not be sufficiently extraordinary to warrant its removal from the data.
• Peer 3’s 2013 operational expenses increased over the previous year by 19% due primarily to a periodic spike in maintenance inspections. While an infrequent activity, and one which increases total Opex to a noticeable extent over the previous year, such expenditure is considered a normal part of water business operations and has consequently been included in the Opex figures used in the benchmarking.
• GAWB’s 2013 reported capital expenditure included $50.3m associated with completion of the Curtis Island expansion. Given the size of this expenditure relative to GAWB’s “typical” annual Capex, and the fact that these assets had not yet been reflected in the 2013 RAB or Opex, they have been considered a “once-off” or abnormal expenditure item and excluded from the Capex figure used in the analysis. GAWB’s 2013 reported Capex also included $0.047m associated with its fish hatchery. As this is an atypical category of expenditure for the peer group, this amount has also been excluded from the calculations as part of the normalisation process. For similar reasons, GAWB’s 2013 reported Opex figure has been adjusted to remove $467,810 associated with operation of the hatchery.

68
About MHC
Marchment Hill Consulting is a management consulting firm dedicated to serving the needs of the utilities, infrastructure, and transport sectors in Australia.
Our quarterly journal, QSI Online, shares our insights with the industries we serve and empowers businesses with high quality, content-rich and contemporary information relevant to their industry.
Read it at www.marchmenthill.com/qsi-online
Our Philosophy
The Marchment Hill philosophy, validated and reinforced by our work for clients around the world, holds that the value (V) of a consulting intervention rests on three cornerstones:
Melbourne Level 4, 530 Lonsdale Street
Melbourne, VIC 3000,
Australia
P: +61 3 9602 5604
F: +61 3 9642 5626
Brisbane Level 5, 300 Queen Street
Brisbane, QLD 4000,
Australia
P: +61 7 3010 9366
{ Q } x { S } x { I }
{ }Quality of Insight
V = Support for Change Implementation
of Solution
The clarity, robustness & relevance of the proposed
solution
Securing the understanding,engagement & commitmentof key individuals & groups
Making the change &realising the benefits

2015 Price Monitoring Investigation
Appendix F – Efficiency
GHD: Review of Operations and Asset Life Cycle Management Expenditure for GAWB’s 2015 Price Review, September 2014

Submission by Gladstone Area Water Board – Appendices
This page intentionally blank

Gladstone Area Water Board Review of Operations and Asset Life Cycle Management
Expenditure for GAWB's 2015 Price Review
CONFIDENTIAL FINAL September 2014

GHD | Report for Gladstone Area Water Board - Review of Operations and Asset Life Cycle Management Expenditure
for GAWB's 2015 Price Review, 31/31748 | i
Reliance Statement and Disclaimer This report: has been prepared by GHD for Gladstone Area Water Board (GAWB) and may only be used and relied on by Gladstone Area Water Board for the purpose agreed between GHD and the Gladstone Area Water Board as set out in Section 1 of this report.
GHD otherwise disclaims responsibility to any person other than Gladstone Area Water Board arising in connection with this report. GHD also excludes implied warranties and conditions, to the extent legally permissible.
The services undertaken by GHD in connection with preparing this report were limited to those specifically detailed in the report and are subject to the scope limitations set out in the report.
The opinions, conclusions and any recommendations in this report are based on conditions encountered and information reviewed at the date of preparation of the report. GHD has no responsibility or obligation to update this report to account for events or changes occurring subsequent to the date that the report was prepared.
The opinions, conclusions and any recommendations in this report are based on assumptions made by GHD described throughout this report. GHD disclaims liability arising from any of the assumptions being incorrect.
GHD has prepared this report on the basis of information provided by Gladstone Area Water Board and others who provided information to GHD (including Government authorities), which GHD has not independently verified or checked beyond the agreed scope of work. GHD does not accept liability in connection with such unverified information, including errors and omissions in the report which were caused by errors or omissions in that information.
GHD has not been involved in the preparation of GAWB’s Expenditure Proposal to the QCA and has had no contribution to, or review of GAWB’s Expenditure Proposal to the QCA other than in the Review of Operations and Asset Life Cycle Management Expenditure for GAWB’s 2015 Price Review. GHD shall not be liable to any person for any error in, omission from, or false or misleading statement in, any other part of GAWB’s Expenditure Proposal to the QCA.

GHD | Report for Gladstone Area Water Board - Review of Operations and Asset Life Cycle Management Expenditure
for GAWB's 2015 Price Review, 31/31748 | ii
Executive summary Purpose and scope
GHD has been engaged to provide a review and report on the reasonableness of Gladstone Area Water Board’s (GAWB’s) forecast operational expenditure (opex) for the five-year period commencing 1 July 2015 for its Operations and Asset Life Cycle Management (ALCM) functions. The report is to be used in GAWB’s submission to the Queensland Competition Authority (QCA) for the purpose of the 2015 Price Review.
The review also considers:
• Historic operating expenditure compared with the QCA 2010 determination to identify movements between the QCA allowances and actual cost and performance outcomes.
• Methodologies for forecasting and budgeting, including preventive maintenance.
• Forecast operating expenditure in terms of key expenditure drivers, robustness, efficiency and individual major cost items.
Current regulatory period cost trends and findings
For Operations, actual expenditure for the current period is expected to increase by some 5.2% per annum in real terms, compared to the 1.2% per annum average increase allowed by the QCA to be recovered in customer prices from 1 July 2010. The primary factors causing this additional expenditure are higher than previously forecast costs in the following categories:
• Staffing costs (Total Employment Costs or TEC) of an additional $2.942 million or 35.4% above forecast. The additional costs include new staff appointments, which were predominantly made to insource water treatment plant operations and provide administrative support for operations and maintenance functions.
• Electricity costs of an additional $2.023 million or 27% above forecast, driven by higher electricity tariffs than anticipated, including the impact of the carbon pricing scheme, and an increase in peak period operations and use of an inefficient pump caused by major pump overhaul and other network maintenance activities.
• Consulting Services of an additional $0.439 million, or 200% above forecast, for items such as operations manuals, emergency planning, SCADA optimisation, and human resources and ICT (information, communications and telemetry) consulting.
• Other expenditure of an additional $1.466 million or 26.3% above forecast, for additional expenditure relating to labour hire, software maintenance, legal services and professional engineering services.
The additional staffing costs, within material limits, are considered justified and appropriate to meet current service and risk management requirements for the business, noting that remuneration movements are outside the scope of this assignment.
Incurred electricity costs to date are appropriate, and GAWB has revised its electricity forecast for the remainder of the current period for tariff adjustments and removal of the carbon pricing scheme. While recognising there are operational regime constraints and uncertainties and impacts of the maintenance schedule, GAWB could also consider revising its electricity costs forecast for the remainder of the current period for the balance of peak versus off-peak pumping for Awoonga Dam Pump Station on the basis of a typical operating regime.
Consulting Services and Other costs are reasonable and appropriate, noting that a large proportion of them are specific costs to address operational needs and technical requirements

GHD | Report for Gladstone Area Water Board - Review of Operations and Asset Life Cycle Management Expenditure
for GAWB's 2015 Price Review, 31/31748 | iii
and obligations of GAWB. We recognise the need for much of this expenditure was not identified when the 2010 Price Submission was developed.
For ALCM, actual expenditure for the current period is expected to increase by some 5.6% per annum in real terms, compared to a 1.0% per annum average decrease allowed by the QCA to be recovered in customer prices from 1 July 2010. The primary factors causing this additional expenditure are higher than previously forecast costs in the following categories:
• Staffing costs (TEC) of an additional $5.347 million or 55.3% above forecast, for insourcing of maintenance activities (9 positions), a SCADA Technician, additional Rangers, a Senior Land Officer, and technical and administrative support.
• Professional Services of an additional $815,000 above the forecast of $55,000, for specific studies relating to asset condition or performance, and technical drawing improvements.
• Other expenditure of an additional $3.099 million or 72.2% above forecast, for Asset Purchases and Minor Assets (being tools and equipment for insourced maintenance), Staff Training for new maintenance staff, Cleaning and Waste Removal, Labour Hire, Software Maintenance, Internet/videoconferencing, Consulting Services (including developing the Asset Management Strategy, and enterprise systems architecture), and Legal Advice.
We note that the previous forecasts for maintenance activities were based upon a desktop analysis and the work being outsourced. Insourcing of the maintenance functions has resulted in the significant increases in staff costs, vehicles, and minor plant and equipment costs noted above. In addition, it is apparent that GAWB’s development of asset management capability and planning has resulted in a more scientific approach to maintenance through better knowledge of assets and forecasting of costs. This has resulted in significantly higher preventive maintenance costs than previously allowed.
The ALCM additional staffing costs, within material limits, are considered justified and appropriate to meet current service and risk management requirements for the business. We note that remuneration movements are outside the scope of this assignment.
The additional Professional Services and Consulting Services costs were for a number of studies and initiatives including those relating to asset management and are considered reasonable and necessary to meet specific technical needs and develop asset management strategies and plans for the GAWB business.
Other costs are reasonable and appropriate to address maintenance support needs and technical requirements and obligations of GAWB. We recognise the need for much of this expenditure was not identified when the 2010 Price Submission was developed.
Review of forecasting and budgeting methodologies
We found that, considering the GAWB methodology and forecasting practices:
• GAWB has an appropriate and systematic process to build the budgets and forecasts. Actual and expected expenditure and forecasts are all presented with supporting detail and the ability to track from aggregate expenditure areas back to individual items, providing clarity for internal users and external reviewers.
• GAWB’s overall approach to determining cost escalation is considered reasonable and appropriate, with some specific observations made on considerations for the most significant expenditure components.
• Demand forecasting is typically a significant input to expenditure forecasting for bulk water utilities. In GAWB’s case, most costs are independent of demand and demand impacts in total are minimal. GAWB has not specifically included demand escalators in its Operations

GHD | Report for Gladstone Area Water Board - Review of Operations and Asset Life Cycle Management Expenditure
for GAWB's 2015 Price Review, 31/31748 | iv
and ALCM costs and has consequently absorbed the impacts of demand on costs as part of improving efficiency.
• With respect to governance and review processes, we found that forecasts and budgets are subject to appropriate scrutiny and review prior to approval.
• For preventive maintenance, the preparation of Lifecycle Maintenance Plans (LCMPs) accords with good asset management practice, while reflecting an early stage of maturity in asset management development. The extent of detail and confidence in costs and frequencies of maintenance are based on the best available information at the current time, and should be reviewed and optimised over time.
• GAWB’s management practices are designed to engender prudent spending and cost management, and GAWB is developing its approach to drive efficiencies within the business.
Next regulatory period forecast cost trends and observations
The predominant drivers of forecast expenditure increases in the next regulatory period are cost escalation, especially for electricity and to a lesser extent employment costs. Expenditure attributable to the extension of water delivery services to Curtis Island is excluded from this comparison, to ensure like-for-like comparison over time.
Operations expenditure
Forecast Operations expenditure shows a real average increase of 2.07% per annum from the 2015 base year. We accept the forecast as appropriate and reflecting reasonable costs taking into account cost escalation impacts, noting that:
• Forecast staffing costs (TEC) are based on no increase in staff numbers, with cost escalation based only on salary and wage escalation and progression.
• GAWB’s forecast Electricity costs include removal of the carbon pricing scheme and estimated supplier tariffs. These costs will be revised following final determination of electricity supplier tariffs by the Australian Energy Regulator.
• Other costs are specifically estimated by GAWB according to expected requirements.
Asset lifecycle management expenditure
Forecast ALCM expenditure shows a real average increase of 1.75% per annum from the 2015 base year. We accept the forecast as appropriate and reflecting reasonable costs taking into account cost escalation, noting that:
• Forecast staffing costs (TEC) are based on no increase in staff numbers, with cost escalation based only on salary and wage escalation and progression.
• Professional Services and Other costs are specifically estimated by GAWB according to expected requirements.
We consider there are efficiencies and improvements to be gained over the course of the next period in both Operations and ALCM, especially in maintenance, and note that GAWB is developing its approach to driving efficiencies in the business that will be reflected in a commitment to reduction in the forecast expenditure.

GHD | Report for Gladstone Area Water Board - Review of Operations and Asset Life Cycle Management Expenditure
for GAWB's 2015 Price Review, 31/31748 | v
Table of contents Reliance Statement and Disclaimer .......................................................................................................... i
1. Purpose and scope ........................................................................................................................ 1 1.1 Purpose ................................................................................................................................ 1
1.2 Scope ................................................................................................................................... 1
1.3 Exclusions ............................................................................................................................ 2
1.4 Matters for consideration ..................................................................................................... 2
2. Assignment approach .................................................................................................................... 3 2.1 Methodology ........................................................................................................................ 3
2.2 Basis for cost comparison .................................................................................................... 4
2.3 Material relied upon for the review ....................................................................................... 5
3. Historic and forecast comparison ................................................................................................... 6 3.1 Operations expenditure........................................................................................................ 6
3.2 Asset life cycle management expenditure ......................................................................... 10
4. Forecasting methodology review ................................................................................................. 14
4.1 Forecasting methodology .................................................................................................. 14
4.2 Governance and review ..................................................................................................... 15 4.3 Approach to preventive maintenance ................................................................................ 15
4.4 Efficiency and business improvement ............................................................................... 16
5. Forecast expenditure review ........................................................................................................ 18
5.1 GAWB’s approach to forecast expenditure ....................................................................... 18 5.2 Factors influencing the forecast ......................................................................................... 18
5.3 Operations expenditure...................................................................................................... 19
5.4 Asset life cycle management ............................................................................................. 21

GHD | Report for Gladstone Area Water Board - Review of Operations and Asset Life Cycle Management Expenditure
for GAWB's 2015 Price Review, 31/31748 | vi
Table index Table 1 Interviews and discussions .................................................................................................. 5
Table 2 Movement of costs comparison – operations (2015 $000’s) ............................................... 7
Table 3 Breakdown of cost components - operations (2015 $000’s) ............................................... 7
Table 4 Historic demand comparison ............................................................................................... 7
Table 5 Justification for new operations roles ................................................................................... 8
Table 6 Other operations expenditure analysis (2015 $000s) ........................................................ 10
Table 7 Movement of costs comparison – ALCM (2015 $000s) ..................................................... 11
Table 8 Breakdown of cost components – ALCM (2015 $000s) .................................................... 12
Table 9 Justification for new ALCM roles ....................................................................................... 12
Table 10 Other ALCM expenditure analysis (2015 $000s) ............................................................... 13
Table 11 Forecast demand ............................................................................................................... 18
Table 12 Operations expenditure escalation above CPI .................................................................. 19
Table 13 Summary of GAWB’s estimated electricity cost escalation ............................................... 20
Table 14 Other operations forecast analysis (2015 $000s) .............................................................. 21
Table 15 ALCM expenditure escalation above CPI .......................................................................... 21
Table 16 Other ALCM forecast analysis (2015 $000s) ..................................................................... 23
Figure index Figure 1 Historic and forecast cost comparison - operations ............................................................. 6
Figure 2 Historic and forecast cost comparison – asset life cycle management ............................. 11
Appendices Appendix A – Scope of work
Appendix B – Material relied upon for the review
Appendix C – Detailed cost charts and tables

GHD | Report for Gladstone Area Water Board - Review of Operations and Asset Life Cycle Management Expenditure
for GAWB's 2015 Price Review, 31/31748 | 1
1. Purpose and scope 1.1 Purpose
Gladstone Area Water Board (GAWB) seeks a review and report on the reasonableness of its forecast operational expenditure (opex) for the five-year period commencing 1 July 2015 for its Operations and Asset Life Cycle Management functions. The report is to be used in GAWB’s submission to the Queensland Competition Authority (QCA) for the purpose of the 2015 Price Review.
1.2 Scope
The scope of work will cover the following categories of expenditure within each function:
Operations:
– Water quality and Resource Operations Plan (ROP) monitoring
– Professional services and consultants
– Staffing
– Electricity
– Chemicals
Asset Life Cycle Management
– Maintenance
– Professional services and consultants
The review will cover the following aspects relating to the Operations and Asset Life Cycle Management expenditure:
Review the actual opex incurred along with the opex allowed to be recovered in GAWB’s customer prices from 1 July 2010 in accordance with the 2010 Price Review outcomes (including previously assessed QCA allowance and efficiencies), and actual cost and performance outcomes.
Review the methodology for development of the forecast opex, that is, is the forecast “top down”, “bottom up” driven, and how are the various regulatory and business operational programs developed.
Review the forecast opex for the period 2015 to 2020 in terms of trends compared to historic costs, and understand the key reasons for any significant changes.
Review the forecast opex in terms of its key cost drivers, including the following:
– Business and operating environment changes that are reasonably expected to occur within the regulatory period,
– Statutory, safety, regulatory, environmental and community expectations,
– Proposed performance outcomes compared to historic performance,
– Changes in demand and its influence on opex, – Any capex impacts on opex over the regulatory period, that is, areas of the operational
forecast may either increase or decrease as a result of the capex program, – Cost driver assumptions made in determining the forecast opex, such as the
escalation factors applied to labour, energy, chemical and materials costs.

GHD | Report for Gladstone Area Water Board - Review of Operations and Asset Life Cycle Management Expenditure
for GAWB's 2015 Price Review, 31/31748 | 2
Review efficiency measures implemented during the current period, and proposed strategies designed to improve efficiency in the forecast period.
Review the robustness of the operational forecast, that is, what level of internal review and justification does the operational forecast go through before it is approved.
Review in more detail any specific major cost item or those with significant changes or additional expenditure, such as:
– Preventive maintenance, including inputs, methodologies and approach.
– Operations staffing
– Energy costs.
The detailed scope is provided in Appendix A.
1.3 Exclusions
Opex relating to GAWB’s functions of Strategy and Asset Creation and Corporate Services have been excluded from this review. Other costs asset ownership and holding costs (eg rates, insurance and leases) included within the Asset Life Cycle Management function have been excluded from this assessment.
Remuneration movements are also out of scope for this assignment.
1.4 Matters for consideration
In considering this assignment, GHD is mindful of the processes to be undertaken by the QCA and/or its consultants in the 2015 Price Review of GAWB’s submission. With respect to opex, on 27th February 2014, the Treasurer referred a Direction requiring the QCA to conduct a price monitoring investigation, including the following requirement:
“2) In referring this investigation, the Authority is to consider:
g) for operating expenditure to be included in the forecast revenue, the Authority may investigate the expenditure in any function where GAWB’s forecast expenditure in that function exceeds the level allowed in the Authority’s 2010 pricing practices investigation by an amount that would give rise to a material increase in price.”
GHD will consequently focus the historic component of this review on areas of material overspend compared to the QCA’s 2010 pricing determination.
Beyond this aspect, this review does not attempt to replicate the QCA’s process in its 2015 Price Review. The QCA will use a number of techniques in determining allowable costs and prices, such as cost implications for prices, and benchmarking, which are beyond the scope of this assignment.
GHD will use its knowledge of GAWB’s operations and those of other bulk water entities to consider whether operating expenditure is reasonable and efficient.

GHD | Report for Gladstone Area Water Board - Review of Operations and Asset Life Cycle Management Expenditure
for GAWB's 2015 Price Review, 31/31748 | 3
2. Assignment approach 2.1 Methodology
The following methodology was specifically developed to undertake this review.
Task 1 - Project initiation
The objective of this task was to agree the project scope and obtain key information.
Key sub tasks included:
Initial telephone meeting to confirm project scope, agree dates for interviews and project report delivery, and initiate information exchange.
Information request from GHD to GAWB, requesting key documents including:
– Current organisation structure with roles and staff numbers, along with advice of significant changes during the current regulatory period.
– Current Corporate / Strategic Plan with 5-year outlook.
– 2010 QCA Final Report on opex for GAWB.
– Historic Operations and Asset Life Cycle Management costs from 2010 to present, by spend category or program.
– Forecast Operations and Asset Life Cycle Management costs for the period 2015 to 2020, by spend category or program (aligned with the historical cost data).
– Supporting documents for the forecast opex, including those relating to proposed business requirements, expected performance outcomes and influences, capex implications, and assumptions.
– Demand forecast including its basis and assumptions.
– Any documented governance arrangements for review, approval and monitoring of opex.
– Any documented processes and assumptions for development of opex forecasts.
– Documents relating to efficiency or business improvements, procurement or sourcing strategies.
– Water Quality and Resource Operations Plans.
– Asset management and/or maintenance plans and strategies relevant to opex.
– Any reports or information on labour, energy and material cost escalators.
– Current and forecast service performance indicators.
Task 2 – Information review
GHD reviewed the information provided and requested further information as required, including a proposed list of operational programs, to review and understand:
The current operating and regulatory environment and key issues for discussion.
Strategies, plans and supporting documentation in terms of their input to and justification of the forecast opex.
The methodologies for the development of opex forecasts.
The governance arrangements for managing the opex forecast and opex delivery.
The adequacy and efficiency of historical opex with respect to the underlying obligations, performance outcomes, demand, and the condition and performance of the asset base.

GHD | Report for Gladstone Area Water Board - Review of Operations and Asset Life Cycle Management Expenditure
for GAWB's 2015 Price Review, 31/31748 | 4
The appropriateness of the opex forecast.
The appropriateness of maintenance plans including inspection, planned and corrective maintenance and other programs which may impact on levels of opex.
Identification of areas where significant changes may be required (e.g. substantial new assets or critical work backlogs).
GHD then developed relevant questions and areas of enquiry for follow up during the onsite interviews.
Task 3 – Onsite interviews and discussions
GHD undertook a series of discussions and interviews over a three day period with GAWB’s key managers and operations and maintenance staff. This included:
An initial discussion with key management (CEO, CFO, Strategic Planning and Procurement Manager, and Operations and Maintenance Manager) to understand key issues, regulatory relationship, areas of focus, constraints and opportunities.
Interviews with relevant managers and senior staff, including the areas of:
– Land Management
– Water Operations including water quality and environmental management
– Maintenance
These included discussions on specific areas of focus, such as maintenance planning, operations planning, procurement and sourcing, energy management, chemicals management.
Close out discussion with key management staff on preliminary findings.
Task 4 – Draft report preparation
GHD prepared the draft report for GAWB as required by the Invitation to Offer, in a suitable form for publication with GAWB’s price submission. GHD followed up the interviews with further questions or clarification, as required, as the report was developed.
Task 5 – Final report preparation
GHD submitted the draft report to GAWB to check factual issues and omissions. GHD took into account factual errors or omissions that were identified, considered its findings and prepared a final report.
2.2 Basis for cost comparison
In this report, all cost comparisons are based on financial years. References to a year may be expressed as a financial year in tables and charts, e.g. 2013/14, or refer only to a single year in the text, eg. 2014, being the year in which the 2013/14 financial year ends.
For comparative purposes, all dollars are expressed in 2015 dollars. Information provided by GAWB in nominal dollars (dollars of the day) has been converted to 2015 dollars:
For historic data by using the ABS Consumer Price Index (CPI) for Brisbane (Series A2325816R), and
For forecast data by using GAWB’s forecast CPI.
Costs have been tracked year to year using GAWB’s general ledger (GL) codes. In some cases, we understand some cost codes may have changed for different types of expenditure over years. All figures are rounded to the nearest thousand.

GHD | Report for Gladstone Area Water Board - Review of Operations and Asset Life Cycle Management Expenditure
for GAWB's 2015 Price Review, 31/31748 | 5
2.3 Material relied upon for the review
The material relied upon for the review comprised documents provided by GAWB, supplemented by interviews with key GAWB staff. In general, we have relied upon GAWB’s translation of QCA costs, demands and other data provided in GAWB’s information, and have not independently verified that GAWB’s translation of QCA data is accurate. We do note, however, that GAWB’s total opex accords with the outcomes of the 2010 Price Review and GAWB has sought independent third party verification in relation to its functional translations.
A register of documents relied upon is provided in Appendix B.
Interviews and discussions were held with staff as detailed in Table 1.
Table 1 Interviews and discussions
Date(s) Staff Member Type
9/07/2014 John Tumbers - Operations and Maintenance Manager Interview
9/07/2014 Anthony Ottaway – Chief Financial Officer Interview
9/07/2014 Jim Grayson – Chief Executive Officer Telephone briefing
10/07/2014 Sarah Lunau – Water Quality and Operations Superintendent Interview
10/07/2014 Brett Nicholls – Land Manager Interview
11/07/2014 Anthony Ottaway - Chief Financial Officer John Tumbers – Operations and Maintenance Manager
Interview
15/07/2014 Jim Grayson – Chief Executive Officer John Brennan – Strategic Planning Manager Anthony Ottaway – Chief Financial Officer Sharelle Nicholas – Strategic Development Officer
Telephone debrief
12/09/2014 Jim Grayson – Chief Executive Officer John Brennan – Strategic Planning Manager Anthony Ottaway – Chief Financial Officer Sharelle Nicholas – Strategic Development Officer
Review discussion

GHD | Report for Gladstone Area Water Board - Review of Operations and Asset Life Cycle Management Expenditure
for GAWB's 2015 Price Review, 31/31748 | 6
3. Historic and forecast comparison 3.1 Operations expenditure
3.1.1 Historic and forecast cost comparison
Figure 1 shows the historic and forecast cost comparison for Operations expenditure, along with the QCA forecast amounts allowed to be recovered in GAWB’s customer prices (QCA Allowance) from 1 July 2010 to 30 June 2015 (current regulatory period). For the current period, the QCA Allowance for Operations expenditure is around 1.2% per annum average, while actual expenditure is expected to increase by some 5.5% per annum in real terms, with a flattening of the increase in the latter part of the current period ending 2015.
Forecast Operations expenditure from 1 July 2015 to 30 June 2020 (next regulatory period) shows a real average increase of 2.07% per annum from the 2015 base year. Expenditure attributable to the extension of water delivery services to Curtis Island is excluded from this comparison, to ensure like-for-like comparison over time.
The detailed charts including cost tables are provided in Appendix C.
Figure 1 Historic and forecast cost comparison - operations
3.1.2 Movement between base year forecast and QCA allowance
Table 2 shows the movement between the actual and expected costs for the current regulatory period and the QCA Allowance, in 2015$ terms.
The over expenditure for the period compared to the QCA allowance is $5.454 million or 20.2% in real (2015$) terms.

GHD | Report for Gladstone Area Water Board - Review of Operations and Asset Life Cycle Management Expenditure
for GAWB's 2015 Price Review, 31/31748 | 7
Table 2 Movement of costs comparison – operations (2015 $000’s)
2011 2012 2013 2014 2015 TOTAL
QCA Allowance 5,361 5,300 5,341 5,440 5,618 27,060
Actual/Expected Expenditure 5,527 6,136 6,922 7,091 6,838 32,514
Movement - increase 166 836 1,582 1,651 1,220 5,454
Movement (%) 3.1% 15.8% 29.6% 30.3% 21.7% 20.2%
A breakdown of Operations expenditure is provided in Table 3 showing the major causes of over expenditure as Total Employment Costs (TEC), Electricity and Other costs. It is noted that Chemicals and Operations expenditure declined during the period, demonstrating some efficiencies have been applied where possible.
Table 3 Breakdown of cost components - operations (2015 $000’s)
QCA Allowance
Actual/ Expected
Movement - increase
Movement (%)
Total Employment Cost (TEC) 8,310 11,175 2,866 34.5% Electricity 7,477 9,354 1,877 25.1% Chemicals 4,860 3,642 -1,218 -25.1% Operations 625 427 -198 -31.7% Consulting Services 220 659 439 199.5% Other 5,569 7,257 1,688 30.3%
3.1.3 Analysis of additional expenditure categories
Demand impacts
Consideration has been given as to whether there are any demand impacts driving the higher Operations expenditure. Demand over the current period was compared to the demand forecast used to set prices from 1 July 2010 as detailed in Table 4.
Table 4 Historic demand comparison
Demand Component 2011 2012 2013 2014 Total Variance %
2010 Pricing Forecast Demand (ML) Dam Supply 25,600 25,600 25,600 25,600 102,400
Raw Delivery 17,445 20,063 22,461 23,059 83,028
Potable Delivery 10,268 10,581 10,947 11,166 42,963
Actual Volumetric (ML) (billed volumes) Dam Supply 15,346 12,368 15,176 11,728 54,618
Raw Delivery 16,515 18,625 21,070 22,586 78,796
Potable Delivery 9,217 11,151 11,440 12,506 44,314
Variance: Actuals greater / (less) than 2010 forecast demand (ML) Dam Supply (10,254) (13,232) (10,424) (13,872) (47,782) -47% Raw Delivery (930) (1,438) (1,391) (473) (4,232) -5% Potable Delivery (1,051) 570 492 1,340 1,351 +3%
Source: GAWB 2011 to 2014 Demand. We note slight differences between the 2010 pricing volumes in this table and
those in the QCA Final Report on Investigation of Pricing Practices, recognising that the QCA reports an indicative
forecast.
Dam supply volumes, being those supplied directly from the Awoonga Dam to industry via Sunwater pipelines, were significantly (47%) below the 2010 forecast, but have little influence on Operations costs.

GHD | Report for Gladstone Area Water Board - Review of Operations and Asset Life Cycle Management Expenditure
for GAWB's 2015 Price Review, 31/31748 | 8
Raw delivery was 4232 ML or 5% below forecast. Potable delivery was 1351 ML or 3% above forecast, with the greatest increase in the last year (2014).
On balance, given that the costs of supplying potable water are higher than supplying raw water, the net impact of variations in demand from forecast on overall Operations costs is considered to be minimal. GAWB has not specifically included demand escalators in its Operations and ALCM costs and has consequently absorbed the impacts of demand on costs as part of improving efficiency.
Total employment cost
GAWB in its submission to the QCA proposed a total increase of 3.5 FTE (Full Time Equivalent staff) from 55.9 FTE to 59.4 FTE over the current period. None of these increases were identified for Operations staff. We estimate that Operations staff at the commencement of the period were approximately 16 FTE, which included 5 insourced WTP Operators.
The QCA allowance for staff (TEC) was based on a 7.4% saving in overall staff costs. The basis of the expected Operations component of this saving involved 1.0 FTE reduction in WTP Operators as a result of control system upgrades, resulting in approximately 15 FTE at the end of the period.
GAWB currently has 24.0 FTE allocated to Operations. The net increase of approximately 7.8 FTE includes changes in various role allocations between business units and 7.5 FTE in direct Operations. We sought justification for these additional roles, and our summary is provided in Table 5.
Table 5 Justification for new operations roles
Role FTE Justification Operations Unit Assistance and Support
2.3 Provide executive support and secretarial services to the Operations & Maintenance Manager and assistance to Operations Unit. Coordinate and maintain project, contractual and compliance documentation on behalf of the business unit.
Hatchery Technician
1.0 Engaged as part of an additional hatchery function to manage a Turtle Triage and facility upgrade. This role is not permanent and is partially funded externally.
WTP Operations
3.0 The insourcing proposal for WTP Operations was based on 5 No. 2-shift (8 hour) days plus overtime for call outs. The Gladstone WTP, however, operates on 7 No. 2-shift (12 hour) days due to the inability of the telecommunications network to permit reliable remote monitoring and control, and the number of operational call-outs due to process and asset failures increased overtime. Automation at the WTP is also limited. Staff initially engaged were accumulating significant leave, and were not able to be relieved as necessary. Consequently, 1.0 FTE additional staff were engaged. 2.0 FTE WTP Trainee Operators were engaged to build long term capability and resilience in WTP and network operations. WTP Operators also provide GAWB’s out-of-hours and emergency response on a 24/7 basis from the Gladstone WTP for the raw and treated water network, for example, pipe breaks, water quality complaints, various network and pump station alarms and other network-related calls.
Automation and Control Technician
0.2 Provide engineering direction, implementation, monitoring and maintenance support of GAWB's automation and control assets. Dedicated control and automation resource has achieved significant improvements and stability within the telemetry system and SCADA across the GAWB network.
Technical Assistant
1.0 Additional technical and administrative support required to support the Environmental Scientist and Technical Officer with the water quality and environmental monitoring program, including Curtis Island.
We were advised by GAWB that additional staff appointments were approved by the board or CEO under authority. Justifications and position descriptions were prepared for all roles.

GHD | Report for Gladstone Area Water Board - Review of Operations and Asset Life Cycle Management Expenditure
for GAWB's 2015 Price Review, 31/31748 | 9
We accept these explanations for additional Operations resources as appropriate and reasonable to meet current service and risk management requirements for the business. We note the potential for future reductions in WTP Operations costs as operational capability is developed fully, automation and remote control is established, and the interface between Operations and ALCM functions is managed.
Further analysis would require benchmarking of Operations activities and workload evaluation, which is beyond the scope of this assessment.
Remuneration movements are outside the scope of this assignment.
Electricity
The electricity cost proposed by GAWB for the current period was based on forecast electricity tariff increases of around 8% for uncontracted energy, and was accepted by the QCA.
Actual electricity tariff increases were greater than anticipated, including the impact of the carbon pricing scheme, alone adding approximately 14.2% to costs in the 2013 and 2014 years. The abandonment of the carbon pricing scheme commencing 1 July 2014 will reduce energy costs in the final year of the current period.
We note that over 60% of electricity costs relate to the Awoonga Dam Pump Station, and increased electricity costs also incurred due to an increase on peak hour operations from typically 25% of consumption to over 50% of consumption. This was apparently due to peak operations and use of an inefficient pump caused by major pump overhaul in 2013, and other pipeline failures and delivery network maintenance activities.
Incurred electricity actual costs for the current period to date are appropriate, and GAWB has forecast its electricity costs for the remainder of the current period for tariff adjustments and removal of the carbon pricing scheme and associated refunds. While recognising there are operational regime constraints and uncertainties and impacts of the maintenance schedule, we suggest that GAWB could also consider revising the electricity costs for the balance of peak versus off-peak pumping for Awoonga Dam Pump Station on the basis of a typical operating regime.
Consulting services
Consulting services are expected to exceed the QCA Allowance of $220,000 by a further $439,000. These consulting services were required to support a range of Operations-related activities which included operations manuals, emergency planning, SCADA optimisation, and human resources and ICT (information, communications and telemetry) consulting. This expenditure was not planned or considered when the 2010 Price Submission was developed, but proved to be necessary for ongoing business and improvement. The expenditure is considered reasonable.
Other expenditure
Other costs exceeded the QCA allowance of $5.569 million by a further $1.466 million. Significant components of this over expenditure (over the current period) are detailed in Table 6, along with our analysis.

GHD | Report for Gladstone Area Water Board - Review of Operations and Asset Life Cycle Management Expenditure
for GAWB's 2015 Price Review, 31/31748 | 10
Table 6 Other operations expenditure analysis (2015 $000s)
Description QCA Allowance
Expected Cost Comment
Labour Hire 0 627 Additional resources to support WTP Operators following insourcing, to cover relief and overtime.
Software Maintenance 89 206 Higher than forecast software licencing and maintenance costs.
Legal Services 0 159 Procurement legal services required to ensure compliance with Government purchasing policies and efficient procurement practices.
Professional Services - Engineer
0 241 Engineering services required for network modelling, audits and reviews, SCADA assistance and to evaluate the relocation of the Fish Hatchery.
We accept these costs as justified and appropriate, while recognising the need for much of this expenditure was not identified when the 2010 Price Submission was developed. Allowances for the final year of the current period have been specifically estimated and the amounts are considered reasonable, including reduced labour hire to allow for contingency events.
3.2 Asset life cycle management expenditure
3.2.1 Historic and forecast cost comparison
Figure 2 shows the historic and forecast cost comparison for Asset Life Cycle Management (ALCM) expenditure comprising the five largest cost components along with the balance (termed Other), compared to the QCA Allowance for the current regulatory period. It is evident that the allowable QCA ALCM expenditure shows a decrease of some 1.0% per annum average, while actual expenditure is expected to increase by some 5.6% per annum in real terms, with a small decrease in the latter part of the current period ending 2015.
Forecast ALCM expenditure shows a real average increase of 1.75% per annum from the 2015 base year. Expenditure attributable to the extension of water delivery services to Curtis Island is excluded from this comparison, to ensure like-for-like comparison over time.
The detailed charts including cost tables are provided in Appendix C.

GHD | Report for Gladstone Area Water Board - Review of Operations and Asset Life Cycle Management Expenditure
for GAWB's 2015 Price Review, 31/31748 | 11
Figure 2 Historic and forecast cost comparison – asset life cycle management
3.2.2 Movement between base year forecast and QCA allowance
Table 7 shows the movement between the actual and expected costs for the current regulatory period and the QCA allowance, in 2015$ terms.
The over expenditure for the period compared to the QCA allowance is $10.449 million or 35.1% in real terms.
Table 7 Movement of costs comparison – ALCM (2015 $000s)
2011 2012 2013 2014 2015 TOTAL
QCA Allowance 6,315 5,813 5,578 6,139 6,047 29,892
Actual/Expected Expenditure 6,898 8,215 7,832 8,879 8,566 40,391
Movement – increase 583 2,402 2,254 2,741 2,519 10,499
Movement – increase (%) 9.2% 41.3% 40.4% 44.7% 41.6% 35.1%
A breakdown of ALCM expenditure is provided in Table 8, showing the major causes of additional expenditure as Total Employment Costs (TEC), Motor Vehicles and Other costs. It is noted that Maintenance expenditure declined during the period, recognising that GAWB’s expenditure forecasts for the 2010 price review were based upon GAWB outsourcing its maintenance functions. During the regulatory period, GAWB insourced a number of its maintenance activities to recruit efficiencies and to facilitate improvements in its asset management function which significantly impacted on the results above. Overall TEC and Maintenance costs were also affected by abnormal events which increased these costs beyond what was provided for as business-as-usual, including Awoonga Dam Spillway Repairs and Sludge Pond Solids Dewatering from Yarwun Treatment Plant following cyclone events and consequent poor raw water quality, and unanticipated Asbestos Removal from Fitzsimmons St Reservoir. Some of these costs were not recovered from insurance.

GHD | Report for Gladstone Area Water Board - Review of Operations and Asset Life Cycle Management Expenditure
for GAWB's 2015 Price Review, 31/31748 | 12
Table 8 Breakdown of cost components – ALCM (2015 $000s)
QCA Allowance
Actual/ Expected
Movement - increase
Movement (%)
Total Employment Cost (TEC) 9,677 15,024 5,347 55.3%
Maintenance 10,988 10,367 -621 -5.7%
Insurance 3,671 3,458 -213 -5.8%
Motor Vehicles 1,206 3,278 2,072 172% Professional Services 55 870 815 1482% Other 4,295 7,395 3,099 72.2%
Further analysis of the Insurance and Motor Vehicle lease components are outside the scope of this assignment.
3.2.1 Analysis of additional expenditure
Total employment cost
We estimate that ALCM staff at the commencement of the period were approximately 19 FTE.
The QCA allowance for staff (TEC) was based on a 7.4% saving in overall staff costs and did not take into account GAWB in-sourcing its maintenance activities. There were no ALCM staff reductions identified by the QCA in its analysis over the current period.
GAWB currently has 35.1 FTE allocated to ALCM activities. The net increase of approximately 16.3 FTE includes changes in various role allocations between business units and 15.6 FTE in direct ALCM activities. We sought justification for these additional roles, and our summary is provided in Table 9.
Table 9 Justification for new ALCM roles
Role FTE Justification Operations Administration
1.3 Provide executive support and secretarial services to the Operations & Maintenance Manager and assistance to Operations Unit. Coordinate and maintain project, contractual and compliance documentation on behalf of the business unit.
Senior Land Officer
1.0 Provide organisation support and secretarial services to the Land Manager.
Automation and Control Technician
0.8 Provide engineering and maintenance support of GAWB's automation and control assets. Shared with Operations.
Maintenance Fitters and Electricians
9.0 4.0 FTE Maintenance Fitters and Electricians appointed to insource mechanical and electrical maintenance previously undertaken by Gladstone Regional Council (GRC), after options evaluation and market testing. The appointments provided the opportunity for in-house on-call arrangements for emergency maintenance. It was also proposed that these staff would undertake inspections and maintenance on network assets such as valves. Cost savings were anticipated from reduced contact costs to GRC. Additional workload to meet preventive maintenance requirements, backlog maintenance and breakdown repairs necessitated additional appointments of 4.0 FTE additional staff. 1.0 FTE Apprentice Fitter was engaged to build long term capability and resilience in maintenance services.
Rangers 2.0 Additional Rangers required when easement maintenance activities were in sourced (previously undertaken by contractor maintenance).
Capital Works Programming
0.6 Administer and manage the capital works program including monitoring, forecasting, phasing and managing of project.
Technical Officer Projects
0.9 Assist in delivery of GAWB's capital expenditure and operational program of work. Provide technical support and advice.

GHD | Report for Gladstone Area Water Board - Review of Operations and Asset Life Cycle Management Expenditure
for GAWB's 2015 Price Review, 31/31748 | 13
We have been provided with a board report providing justification for the appointment of four (4) maintenance fitters and electricians, and a business case for additional rangers. All additional staff appointments were approved by the board or CEO under authority. Justifications and position descriptions were prepared for all roles.
We accept these explanations for additional ALCM resources as reasonable and appropriate for the business. We note the potential for future reductions in ALCM costs as asset management capability is developed, backlog maintenance is reduced and improved reliability is achieved, the interface between Operations and ALCM functions is managed, and the land management backlog is reduced.
Further analysis would require benchmarking of ALCM activities and workload evaluation, which is beyond the scope of this assessment.
Remuneration movements are outside the scope of this assignment.
Professional services
Professional services are expected to exceed the QCA allowance of $55,000 by a further $815,000. Review of these costs indicates the services were required for various investigations for dam safety compliance, condition assessments and repair or refurbishment investigations, flood event services, and drawing improvements. Most of this expenditure was not planned or considered when the 2010 Price Submission was developed, but proved to be necessary for ongoing business and improvement. The expenditure is considered reasonable.
Other expenditure
Other costs exceeded the QCA allowance of $4.295 million by a further $3.099 million. Significant components of this over expenditure are detailed in Table 10, along with our analysis.
Table 10 Other ALCM expenditure analysis (2015 $000s)
Description QCA Allowance
Expected Cost Comment
Asset Purchases and Minor Assets
0 692 Tools and equipment for insourced maintenance and operational activities.
Staff Training 0 241 Training for maintenance staff. Cleaning and Waste Removal
281 510 Clean up and sludge removal resulting from cyclones and poor raw water quality
Labour Hire 0 387 Additional resources required to support network and mechanical / electrical maintenance activities prior to insourcing.
Software Maintenance
107 297 Higher than forecast software licencing and maintenance costs.
Internet / Videoconferencing
58 175 Provision of higher speed internet services and systems to support videoconferencing.
Consulting Services 0 639 Engineering services required to support 5-phase capital works development process.
Legal Advice 0 230 Procurement legal services required but no allowance provided.
We accept these costs as justified and appropriate, while recognising the need for much of this expenditure was not identified when the 2010 Price Submission was developed. Allowances for the final year of the current period have been specifically estimated and the amounts are considered reasonable, including reduced labour hire to allow for contingency events.

GHD | Report for Gladstone Area Water Board - Review of Operations and Asset Life Cycle Management Expenditure
for GAWB's 2015 Price Review, 31/31748 | 14
4. Forecasting methodology review 4.1 Forecasting methodology
Budgeting process, including base year costs
GAWB advises that it effectively undertakes a bottom-up ‘zero-based budgeting’ (ZBB) approach to developing its forecasts each year, and that this process is also informed by actual expenditure in the current and prior periods.
We found that the ZBB approach is applied to many of the cost components of the forecast, including the major components of employment costs, preventive maintenance, electricity, chemicals, motor vehicles, and consulting costs. In other cases, reasonably consistent year-on-year costs are forecast historically. New projects are specifically costed. Significant change was identified in the preventive maintenance component, as GAWB has moved from an historic and desktop-based determination of maintenance costs, to a life cycle management approach. This area is specifically discussed below.
Each year, budget and forecast templates are completed in each responsibility area, with explanations for movements in expenditure provided by the responsible manager.
Actual and expected expenditure and forecasts are all presented with supporting detail and the ability to track from aggregate expenditure areas back to individual items. This capability provides clarity for internal users and external reviewers.
Our opinion, considering both the methodology and the forecasting practice evident in this review, is that an appropriate and systematic process has been used to build the budgets and forecasts.
Demand forecasting
GAWB forecasts demand using its Demand Forecast Methodology which, for the period 2015 to 2020, accords with the QCA’s 2010 recommendation that the forecasts ‘should reflect existing contracted volumes, anticipated contracted volumes and a component to reflect expected long term growth.’ GAWB does, however, seek to vary the forecast approach of the QCA for its longer term forecasts.
Demand is typically a significant input to expenditure forecasting for bulk water utilities. In GAWB’s case, most costs are independent of demand and the expected minor variations in demand currently have a relatively small impact on costs. Consequently, GAWB has not specifically included demand escalators in its Operations and ALCM costs and has consequently absorbed the impacts of demand on costs as part of improving efficiency.
Escalation
Forecast escalation is determined by considering each expenditure area and the influences on costs. Specific escalation indices have been determined for the major expenditure areas of salaries and wages, electricity, chemicals, Council costs, and insurances, with other costs escalated at estimated CPI.
The overall approach to escalation is considered reasonable and appropriate, while specific observations on the application of escalation factors and considerations for the most significant expenditure components are provided elsewhere in this report.

GHD | Report for Gladstone Area Water Board - Review of Operations and Asset Life Cycle Management Expenditure
for GAWB's 2015 Price Review, 31/31748 | 15
4.2 Governance and review
GAWB has an appropriate governance structure in place for the regulatory and commercial environment of the business.
The governance and review process for developing the expenditure forecast involves multiple steps:
Internal Finance review of completed budget templates developed by each responsibility area.
Annual management discussion and review of draft budgets in February including consideration of cost drivers and new initiatives. This process culminates in presentation of the draft budgets to the board for information and feedback.
Revised draft budgets are provided to the board in March for review and feedback.
Final budget provided for approval of board in April.
Final approved budget built into Corporate Plan for submission to the Minister for Energy and Water Supply by the end of April.
We are advised by GAWB that its board actively scrutinises GAWB’s budgets with consideration of all expenditure increases, one-off expenditures, or new projects requiring justification.
Our opinion of the governance and review processes is that forecasts and budgets are subject to appropriate scrutiny and review prior to approval.
4.3 Approach to preventive maintenance
GAWB has progressively assumed full maintenance responsibilities for its assets during the course of the past four years. The forecast cost for preventive maintenance for the current period was calculated from fixed maintenance schedules based on asset life, and historic costs.
Notwithstanding large increases in staff costs relating to maintenance activities, the outcome of costs in the maintenance category (non-staff) are expected to be close to the QCA allowance for the current period.
For the last year of the current period (2015) and the forecast period, preventive maintenance schedules and non-staff costs have been determined through the preparation of Lifecycle Maintenance Plans (LCMPs) for each major facility and asset or asset class. Some 49 LCMPs have been prepared along with an overall preventive maintenance plan, with the facilitation of consultants Assetivity. Each LCMP summarises asset details, current and future levels of service, utilisation, condition, major overhaul or repair events and key asset risks. Life Cycle Strategies include acquisition, operation, maintenance and disposal. 10-year estimates are developed for both operating and capital expenditure. Opex includes regular external inspection and well as cyclic overhauls. Staff costs are not included in the LCMPs.
In addition, the maintenance expenditure includes breakdown and corrective maintenance and repairs. These costs are based on average historic costs or estimates for breakdown maintenance.
Our review of a sample of LCMPs and the aggregate maintenance program identifies that:
These are ‘first generation’ LCMPs based on documenting current knowledge.
The LCMPs were informed by an Asset Criticality analysis, which assisted to determine assets which require preventive maintenance and/or condition assessment.

GHD | Report for Gladstone Area Water Board - Review of Operations and Asset Life Cycle Management Expenditure
for GAWB's 2015 Price Review, 31/31748 | 16
Asset lives, maintenance and inspection frequencies, and renewals have been based on maintainers’ experience, manufacturers’ recommendations, known condition and failure history.
Estimated unit costs of activities are based on historic knowledge (contract or actual values) where possible, or indicative estimates based on experience.
There are some activities which are identified in the LCMPs and Assetivity report that do not have costs allocated against them. In general, these are not considered significant and can be contained within the overall forecast.
The LCMP-derived preventive maintenance component of expenditure typically comprises around 71% (varying from year to year) of maintenance expenditure. This is not uncommon at this stage of maturity of asset management development.
The balance of the maintenance expenditure (29%) includes estimates of breakdown and corrective maintenance based on average historic costs.
The preparation of LCMPs accords with good asset management practice, while reflecting an early stage of maturity in asset management development. The extent of detail and confidence in costs and frequencies of maintenance are based on the best available information at the current time. The overall forecast maintenance expenditure is considered conservative, i.e. more likely to be an over estimate of long term expenditure requirements. We would anticipate that, as these maintenance schedules and unit costs are refined over time, the overall costs will reduce.
4.4 Efficiency and business improvement
The QCA, through its incentive regulation mechanism, specifically seeks efficient costs and improved productivity in its regulated water businesses. Aside from being good commercial practice to minimise costs while meeting service requirements and managing risk, there are always customer pressures for lower prices.
In the QCA’s 2010 Final Determination, considerable attention was given by the QCA and its consultants to efficiency improvements over the current period. A broad target of 9% savings in total operating costs by 2015 was determined. Specific efficiencies referenced in determining the broad target were identified in a number of areas including:
Reducing annual reviews of Drought Management Plan and AWSIM-D model.
Insourcing of some operational activities.
Preventive maintenance, especially reduced frequencies of maintenance.
Routine maintenance, allowing for initial increases due to backlog maintenance.
Control system upgrades.
Staff reductions.
Capitalisation of staff costs relating to capital projects.
GAWB has progressed with a number of these strategies, such as reducing annual reviews of strategic plans, insourcing of water treatment plant operations (while identifying best value to deliver service outcomes for other activities), addressing maintenance backlogs and refining routine maintenance, and capitalisation of staff costs.
Nevertheless, GAWB’s costs increased significantly above the QCA allowance. GAWB does not recover any over spend of approved opex, which negatively effects profitability. Conversely, any underspend of approved opex would be to GAWB's benefit.

GHD | Report for Gladstone Area Water Board - Review of Operations and Asset Life Cycle Management Expenditure
for GAWB's 2015 Price Review, 31/31748 | 17
GAWB’s practices are designed to engender prudent spending and cost management, and GAWB is currently developing its approach to driving efficiencies within the business for the forecast period. This will assist to bring further efficiencies to the business.

GHD | Report for Gladstone Area Water Board - Review of Operations and Asset Life Cycle Management Expenditure
for GAWB's 2015 Price Review, 31/31748 | 18
5. Forecast expenditure review 5.1 GAWB’s approach to forecast expenditure
For recurring expenditure, GAWB has applied cost escalation drivers to the 2015 base year to determine forecast costs for the 2016 to 2020 regulatory period. For non-recurring expenditure, GAWB has prepared specific forecasts for each non-recurring item. The timing and costs included for these non-recurring forecasts is dependent upon the nature of the proposed expenditure.
5.2 Factors influencing the forecast
Cost escalation drivers
Cost escalation drivers relevant to Operations and ALCM expenditure include CPI, wages and salaries, electricity costs, insurance costs, chemical costs and professional services costs have been quantified by GAWB and applied to the forecast. These are individually considered in the analysis below.
Customer demand
A summary of the contracted demand forecast is provided in Table 11, along with the forecast percentage changes in demand. Raw water delivered directly from the Awoonga Dam is ignored for this review as it has little influence on operating costs. We understand the potable volume is forecast to decline slightly in 2015 because of reduced use for Curtis Island.
Table 11 Forecast demand
Demand Component 2015 2016 2017 2018 2019 2020
GAWB Demand Forecast (ML)
Raw Contract (ML) 24,327 24,302 24,267 24,267 24,267 24,267
Raw Contract (% increase) -0.10% -0.14% 0.00% 0.00% 0.00%
Potable Contract (ML) 11,971 12,786 12,983 13,198 13,427 13,661
Potable Contract (% increase) 6.80% 1.54% 1.65% 1.74% 1.74%
Source: 140903 GAWB Demand Model Note: % increase in Raw Contract from 2015 to 2016 reflects change from volumetric forecast to contracted forecast.
As noted previously, GAWB has not specifically included demand escalators in its Operations and ALCM costs and has consequently absorbed the impacts of demand on costs as part of improving efficiency.
New service requirements and obligations
No new service requirements such as statutory, regulatory, safety, environmental or community expectations were identified by GAWB that would have an impact on the forecast expenditure.
New assets
The only materially significant assets to be included in GAWB’s asset base are the extensions to Curtis Island. The incorporation of the extensions to GAWB’s delivery network to Curtis Island will impact the overall level of GAWB’s Operations and ALCM functions. Expenditure attributable to the extension of water delivery services to Curtis Island is excluded from this comparison, to ensure like-for-like comparison over time. The impact of the Curtis Island forecast expenditure is included in a separate report that we understand will be part of GAWB’s confidential submissions to the QCA.

GHD | Report for Gladstone Area Water Board - Review of Operations and Asset Life Cycle Management Expenditure
for GAWB's 2015 Price Review, 31/31748 | 19
5.3 Operations expenditure
5.3.1 Base year and forecast increases
Table 12 shows the percentage increases in expenditure for the base year of 2015, and the forecast period, adjusted to reflect constant 2015 dollars.
Table 12 Operations expenditure escalation above CPI
Cost Component Escalation by Year %
2015 2016 2017 2018 2019 2020 TEC 6.45 1.39 0.64 0.88 1.10 1.46
Electricity -9.96 7.33 7.32 7.10 3.75 3.75
Chemicals 7.73 0 0 0 0 0
Consulting Services -29.4 61.4 -49.4 58.4 -30.4 -9.7
Other Costs -12.73 1.14 -3.12 0.01 0.93 -0.30
5.3.2 Base year review
Our findings from review of the 2015 costs are:
TEC costs increase by 6.45% from 2014 to 2015. This increase is caused by the application of full time salaries and wage allowances for staff where in the previous year vacancies had occurred due to staff turnover. This increase is offset by reductions in Labour Hire, included in Other costs in 2015. No additional staff are proposed from 2014. A component of the additional costs in 2015 is for salary and wage escalation and progression. The bonus pool addition is nominal. We understand two-thirds of the Hatchery Technician or equivalent role is offset by appropriate external revenues. The forecast is considered reasonable and appropriate.
GAWB has forecast its Electricity costs for the base year of 2015 for tariff adjustments and removal of the carbon pricing scheme and associated refunds, reflected in a reduction of costs by 9.96%. We note previous suggestions regarding revision of the forecast electricity costs.
Chemicals costs show a higher increase in the base year due to recent increases in the cost of Sodium Hypochlorite chemical. Costs are calculated by a bottom-up build of chemical quantities. The forecast is considered reasonable and appropriate.
Consulting Services for 2015 are variable and reflect annual reviews and activities, comprising operations manuals, emergency scenario planning, and annual salary reviews. The expenditure is considered reasonable.
Other Costs decline, and are considered in more detail below.
5.3.3 Operations expenditure forecast review findings
Total employment cost
Forecast TEC costs are based on no increase in staff numbers, with cost escalation based only on salary and wage escalation and progression. The escalation factor is in accordance with a Mercer review of remuneration market movements and is accepted as reasonable.
We would expect some efficiency in TEC to be generated in the near future (say, years 3 to 5 of the forecast period) from review and consolidation of network and WTP operations.

GHD | Report for Gladstone Area Water Board - Review of Operations and Asset Life Cycle Management Expenditure
for GAWB's 2015 Price Review, 31/31748 | 20
Electricity
GAWB has estimated overall electricity cost increases by applying its Electricity Cost Escalation Methodology, examining all cost components of total tariffs and the basis for the forecast.
A summary of GAWB’s estimated escalation and forecast electricity costs, along with GHD’s analysis, is provided in Table 13.
Table 13 Summary of GAWB’s estimated electricity cost escalation
Measure Escalation by Year %
2016 2017 2018 2019 2020
GAWB Overall Escalation Factor* 9.83 9.82 9.60 6.25 6.25
Less CPI 2.50 2.50 2.50 2.50 2.50
GAWB Real Escalation Factor 7.33 7.32 7.10 3.75 3.75
GAWB Year-on-year Forecast Cost Increase** 7.33 7.32 7.10 3.75 3.75
GHD estimate of Demand Influence on Cost*** 0.07% 0.85% 1.13% 1.18% 1.18%
Notes: * From GAWB Electricity Cost Escalation, dated 14/9/2014 taking into account electricity tariff components
** From GAWB Forecast Cost spreadsheet “Compare forecast provided to most recent with explation for mvmts”
*** Based on GAWB forecast demand, assuming ADPS accounts for 62% of electricity costs.
The above analysis indicates that GAWB’s Electricity forecast is consistent with its proposed escalation factors, and that built-in efficiencies in Electricity, by ignoring demand, amount to around 1% per annum.
The forecast and escalation factors are considered appropriate and reasonable. We also recognise that when Ergon Energy’s pricing submission is published in October 2014, GAWB, if there is a material change compared to the current forecast, will adjust its electricity cost escalation and forecast expenditure. There may be further scope to adjust the forecast for the balance of peak versus off-peak pumping for Awoonga Dam Pump Station, as previously noted.
Chemicals
Chemicals costs are escalated at CPI. Forecast costs have not adjusted for demand as they are not material and GAWB will absorb these increases as efficiency improvements.
Consulting services
Forecast consulting services include the items listed for the base year, plus three-yearly updates of the Fisheries and Hatchery Management Plans and the Emergency Action Plan, plus a major review of the Disaster Management Plan. The forecast and CPI cost escalation is considered reasonable.
Other costs
Areas of significant current period overspend have been reviewed in Table 14 and compared to forecast expenditure for the next regulatory period.

GHD | Report for Gladstone Area Water Board - Review of Operations and Asset Life Cycle Management Expenditure
for GAWB's 2015 Price Review, 31/31748 | 21
Table 14 Other operations forecast analysis (2015 $000s)
Description
Expected Current Period Cost
Forecast Expenditure Comment
Labour Hire 627 750 Additional resources to support WTP Operators should not be required to same extent.
Software Maintenance 206 362 Ongoing software licencing and maintenance costs are reasonable.
Legal Services 159 260 Procurement legal services. Professional Services - Engineer
241 Nil Once-off costs removed.
In general, Other costs appear reasonable at an overall level, with increases in Labour Hire and Legal Services being non-material.
5.4 Asset life cycle management
5.4.1 Base year and forecast escalation
Table 15 shows the percentage increases in expenditure for the base year of 2015, and the forecast period, excluding Curtis Island costs, adjusted to reflect constant 2015 dollars.
Table 15 ALCM expenditure escalation above CPI
Cost Component
Escalation by Year %
2015 2016 2017 2018 2019 2020
TEC 10.11 3.09 0.64 0.88 1.10 1.46
Maintenance -9.18 6.50 -4.88 21.99 -14.71 12.06
Insurance Expense 2.72 2.50 2.50 2.50 2.50 2.50
MV Lease payments and fuel / oil 4.40 -0.20 0.02 0.01 0 0
Professional Services-Engineer -59.5 4.35 -25.78 0.90 0.90 0.90
Consulting Services -85.3 0.0 145.4 -33.0 -20.0 110.1
Other -0.28 1.90 -4.43 0.16 1.46 -0.36
5.4.2 Base year review
Our findings from review of the 2015 costs are:
TEC costs increase by approximately 10% from 2014 to 2015. This increase is caused by the application of full time salaries and wage allowances for staff where in the previous year vacancies had occurred due to staff turnover for Assistant Maintenance Planner / Scheduler and Ranger positions. This increase is offset by reductions in Labour Hire, included in Other costs in 2015. No additional staff are proposed from 2014. A component of the additional costs in 2015 is for salary and wage escalation and progression. The forecast is considered reasonable and appropriate.
Maintenance expenditure for the base year reflects a transition into the LCMP-based forecast, and is considered reasonable.
Insurance and Motor Vehicle Lease costs are out of scope.
Professional Services - Engineer, and Consulting Services reflect a considerable decline in expenditure, due to significant one-off costs relating to increased asset-related activities in the immediate past. The base year expenditure is considered reasonable.

GHD | Report for Gladstone Area Water Board - Review of Operations and Asset Life Cycle Management Expenditure
for GAWB's 2015 Price Review, 31/31748 | 22
Other Costs show a moderate increase in the base year, and are considered in more detail below.
5.4.3 ACLM expenditure forecast review findings
Total employment cost
Forecast TEC costs are based on no increase in staff numbers, with cost escalation based only on salary and wage escalation and progression. The escalation factor is in accordance with a Mercer review of remuneration market movements and is accepted as reasonable.
We would expect some efficiencies in TEC to be generated in the near future (say, years 3 to 5 of the forecast period) from review and integration of maintenance and operations activities.
Maintenance
Expenditure variations over the forecast period are caused by specific changes in preventive and periodic maintenance in accordance with the LCMP schedules and additional major maintenance items.
Over the forecast period, we would expect efficiencies to be brought into the maintenance schedules in terms of, for example, reduced frequencies of some preventive maintenance, and reduced unit costs of repeat activities over time as efficiencies are built into contract costs of new activities not previously carried out.
A maintenance contingency of $300,000 has been allowed for each year of the forecast. This contingency has been determined as prudent by the board, and required CEO approval prior to accessing the amount. Historic amounts of unanticipated expenditure during the current period due to abnormal events (cyclones and discovery of asbestos at a major asset) beyond typical expectations for breakdown maintenance, were identified at around $452,000 per annum including possible insurance claims (not all of which is recoverable), and around $123,000 excluding possible insurance claims. The maintenance contingency of $300,000 per annum for unanticipated events is considered reasonable and appropriate.
Professional services – engineer and consulting services
Services include:
Professional Services – Engineer: for activities including Annual Asbestos Surveys, Drawings, Concept Designs for various new projects, and Surveys.
Consulting Services: for activities including Telemetry,/SCADA/Comms consulting, and insurance valuation.
These costs are considered reasonable.
Other costs
Areas of significant current period overspend have been reviewed in Table 16 and compared to forecast expenditure for the next regulatory period.

GHD | Report for Gladstone Area Water Board - Review of Operations and Asset Life Cycle Management Expenditure
for GAWB's 2015 Price Review, 31/31748 | 23
Table 16 Other ALCM forecast analysis (2015 $000s)
Description
Expected Current Period Cost
Forecast Expenditure Comment
Asset Purchases and Minor Assets
692 444 Reduced budget for tools and equipment for insourced maintenance and operational activities.
Staff Training 241 554 Increased ongoing training. Cleaning and Waste Removal
510 613 Cost escalation for increased clean up and waste removal.
Labour Hire 387 275 Level of labour hire reduced due to allowances in TEC.
Software Maintenance
297 528 Ongoing software licencing and maintenance costs are reasonable.
Internet / Videoconferencing
175 246 Ongoing costs appear reasonable.
Legal Advice 230 261 Ongoing costs appear reasonable.
In summary, increases in other costs are considered reasonable.

GHD | Report for Gladstone Area Water Board - Review of Operations and Asset Life Cycle Management Expenditure for
GAWB's 2015 Price Review, 31/31748
Appendices

GHD | Report for Gladstone Area Water Board - Review of Operations and Asset Life Cycle Management Expenditure
for GAWB's 2015 Price Review, 31/31748
Appendix A – Scope of work

GGLLAADDSSTTOONNEE AARREEAA WWAATTEERR BBOOAARRDD
IINNVVIITTAATTIIOONN TTOO OOFFFFEERR FFOORR
RREEVVIIEEWW OOFF OOPPEERRAATTIIOONNSS AANNDD AASSSSEETT LLIIFFEE CCYYCCLLEE MMAANNAAGGEEMMEENNTT EEXXPPEENNDDIITTUURREE FFOORR GGAAWWBB’’SS 22001155 PPRRIICCEE
RREEVVIIEEWW
Offer No: CO2013-001 Enquiries Contact Officer: John Brennan Strategic Planning Manager [email protected] Telephone: (07) 3020 8031 Fax: (07) 4972 5632
This document may contain confidential matter relating to the business affairs and financial interests of the Gladstone Area Water Board. The contents are copyright and cannot be disclosed by any Government Agency in response to a Right to Information (RTI) request pursuant to the exemptions contained in Part 3, Schedule 4 of the RTI Act.

Gladstone Area Water Board 2015 QCA Price Review
Commercial-in-Confidence Page 2 of 7
TTAABBLLEE OOFF CCOONNTTEENNTTSS
TABLE OF CONTENTS 2
1. BACKGROUND INFORMATION 3 1.1 Gladstone Area Water Board ...................................................................................... 3
2. OBJECTIVES 3
3. SCOPE OF WORKS 4 3.1 Background ........................................................................................................................ 4 3.2 Operations ............................................................................................................................. 4 3.3 Maintenance .......................................................................................................................... 5 3.4 Engagement Requirements ............................................................................................... 5 3.5 Key Deliverables ............................................................................................................... 6 3.6 Timing Requirements ...................................................................................................... 6
4. EVALUATION PROCESS & CRITERIA 6 4.1 Evaluation Process .......................................................................................................... 6 4.2 Evaluation Criteria ............................................................................................................ 7
5. TERMS & CONDITIONS OF OFFER 7 5.1 Confidentiality .................................................................................................................... 7 5.2 Terms & Conditions of Offer ........................................................................................ 7

Gladstone Area Water Board 2015 QCA Price Review
Commercial-in-Confidence Page 3 of 7
11.. BBAACCKKGGRROOUUNNDD IINNFFOORRMMAATTIIOONN
11..11 GGLLAADDSSTTOONNEE AARREEAA WWAATTEERR BBOOAARRDD Gladstone Area Water Board (GAWB) is a commercialised Statutory Authority operating under the Water Act 2000 and responsible to the Minister for Energy and Water Supply.
GAWB’s main role is to supply water in bulk to major consumers in the Gladstone Region, including the supply of potable water to the Gladstone Regional Council. Approximately 20% of the bulk water supplied is potable water with the remaining 80% raw water supplied to industry.
GAWB owns and operates:
• Awoonga Dam on the Boyne River south of Gladstone;
• delivery pipelines and ancillary infrastructure;
• water treatment plants in Gladstone and Yarwun;
• water reservoirs and pumping stations at Awoonga, and treated water pumping stations at Benaraby, Calliope, Glen Eden, Boat Creek, Gladstone Water Treatment Plant and Yarwun Water Treatment Plant;
• untreated water reservoirs at Gladstone (Fitzsimmons Street) and Toolooa, and treated water reservoirs at Boyne Island, East End, Golegumma, South Gladstone, Yarwun and Curtis Island;
• the Lake Awoonga Recreation Area adjacent to Awoonga Dam and large areas of land under and around Lake Awoonga;
• a main administration building in Gladstone City; and
• a fish hatchery in Gladstone City.
GAWB is in the process of preparing its submissions to the Queensland Competition Authority (QCA) in relation to its forthcoming price monitoring investigation into GAWB’s pricing practices for the 5-year period commencing 1 July 2015.
22.. OOBBJJEECCTTIIVVEESS
GAWB is seeking a review of and report on the reasonableness (or otherwise) of the forecast five (5) year expenditure (from 1 July 2015) for its Operations and Asset Life Cycle Management functions.

Gladstone Area Water Board 2015 QCA Price Review
Commercial-in-Confidence Page 4 of 7
33.. SSCCOOPPEE OOFF WWOORRKKSS
33..11 BBAACCKKGGRROOUUNNDD GAWB’s reports its operational expenditure on a functional basis. GAWB’s four functional categories are:
• Strategy and Asset Creation; • Operations; • Asset Life Cycle Management; and • Corporate Services
For the period from 1 July 2010 to 30 June 2015, GAWB’s operational expenditure relating to Strategy and Asset Creation and Corporate Services has been consistent with the operational expenditure recommended by the QCA in 2010 however operational expenditure relating to Operations and Asset Life Cycle Management functions have exceeded the levels recommended by the QCA in 2010.
Recognising that the overspend in these two functional areas will continue in the next regulatory period, notwithstanding GAWB contends that this expenditure is efficient and prudent, GAWB is seeking a review of the appropriateness of the functional expenditure encompassing GAWB’s forecasts for 2016 to 2020, with reference to the base year (2015).
33..22 OOPPEERRAATTIIOONNSS GAWB’s operations functions includes the day-to-day expenditure of operating GAWB’s water source and delivery network including water quality, pump stations operations and the operations of GAWB’s two water treatment plants.
Forecast expenditure for the base year is circa $7M primarily comprising:
- Water quality and ROP monitoring expenditure of $0.57M
- Professional services and consultants of $0.34M
- Staffing expenditure of $2.9M
- Electricity expenditure of $2.1M
- Chemicals expenditure of $0.8M
The QCA previously assessed the efficient expenditure in the base year of circa $5.5M. As such, an overspend in the base year expenditure of circa $1.5M has been forecast. The overspend is primarily within the following expenditure categories:
- Electricity $0.45M
- Staffing Expenditure $1.108M
The electricity expenditure overspend has been driven by higher electricity costs and the impact of network maintenance on pump/(s) utilisation. Staffing expenditure relates to both additional staff, to which we will seek your comment on, and

Gladstone Area Water Board 2015 QCA Price Review
Commercial-in-Confidence Page 5 of 7
remuneration movements different to that forecast (which will be out of scope for this engagement).
33..33 MMAAIINNTTEENNAANNCCEE The Asset Life Cycle Management function entails those activities necessary to identify record, repair and maintain existing assets. The base year expenditure for this function circa $8.3 M primarily comprises:
- Maintenance expenditure, including internal staffing costs of $5.8M
- Professional services and consultants of $0.37M
- Asset ownership and holding costs (rates insurance leases) of $1.38M (out of scope for the purpose of this assignment)
The QCA previously assessed the efficient expenditure in the base year of circa $5.8M. As such, an overspend in the base year of expenditure for Asset Life Cycle Management of circa $2.5M has been forecast, notwithstanding the GAWB contends this expenditure is both prudent and efficient. The overspend is primarily within the following expenditure categories:
- Staffing expenditure and maintenance costs of $1.43M. This is influenced by a number of factors:
o In-sourcing of maintenance activities
o Development of detailed Life Cycle Maintenance Plans for assets compared to previous desktop analysis
- Increase in motor vehicle costs of $0.52M. This is relevant for the scope to the extent upon which the fleet expenditure relates to operations or asset maintenance activities
- Consulting and professional services costs of $0.281M. These costs are relates to specific advice on maintenance and other activities. These costs were under forecasts at the previous price review.
33..44 EENNGGAAGGEEMMEENNTT RREEQQUUIIRREEMMEENNTTSS Undertake a review of Operations and Asset Management Life Cycle Management expenditure forecasts for the 2015 to 2020 period through inspection of relevant documents and interviews with GAWB staff as necessary. The purpose of the review will be to provide consideration of the appropriateness (or otherwise) of GAWB’s expenditure forecasts for these functions including specific consideration of:
• Methodologies used to determine forecasts.
• Inputs, methodologies and approach used to develop preventative maintenance schedules
• Analysing the assumptions used in determining the values used in the forecasts • Movements between the previously assessed QCA efficiencies and base year
forecasts.
GAWB will provide:

Gladstone Area Water Board 2015 QCA Price Review
Commercial-in-Confidence Page 6 of 7
• access to relevant documentation including:
o Asset criticality analysis report o Life Cycle Maintenance Plans for operational assets o Budget spreadsheets o Documented assumptions o Variance analysis and forecasts
• Access to relevant staff involved in the compilation of the maintenance expenditure forecasts
It is expected that the consultant will provide:
• Personnel to review documentation and conduct interviews as necessary • Necessary resources to compile and present the report.
33..55 KKEEYY DDEELLIIVVEERRAABBLLEESS GAWB requires the consultant to articulate its findings in relation to the detailed requirements in the form of a written report to be provided to GAWB to support its submissions to the QCA and to be publically available.
The consultant is required to:
• Provide a draft written report on the findings of the Operations and Asset Life Cycle Management expenditure review.
• Provide a final written report on the findings of the Operations and Asset Life Cycle Management expenditure review.
The report will be used in GAWB’s submissions to the QCA for the purpose of the 2015 Price Review.
33..66 TTIIMMIINNGG RREEQQUUIIRREEMMEENNTTSS The following time requirements will apply:
• Draft Report – 16 July 2014
• Final Report – 25 July 2014
44.. EEVVAALLUUAATTIIOONN PPRROOCCEESSSS && CCRRIITTEERRIIAA
44..11 EEVVAALLUUAATTIIOONN PPRROOCCEESSSS The Offer evaluation process will involve an assessment of Offers received against the criteria listed below. GAWB reserves the right to short-list Offer/s during the evaluation process using the evaluation criteria contained below. The evaluation process may also involve discussions with Offeror/s, finance and corporate checks, a demonstration from short-listed Offeror/s and site visit assessment.

Gladstone Area Water Board 2015 QCA Price Review
Commercial-in-Confidence Page 7 of 7
44..22 EEVVAALLUUAATTIIOONN CCRRIITTEERRIIAA Offers received will be evaluated against the following criteria:
• Capability to meet the Objectives;
• Capability to deliver the Key Deliverables within the Timing Requirements;
• The proposed costs of the Consultant to deliver the above; and
• The experience and expertise of the Consultant team. Please provide the names of the Consultant team that will perform the work together with resumes (of no greater than 2 pages for each).
55.. TTEERRMMSS && CCOONNDDIITTIIOONNSS OOFF OOFFFFEERR
55..11 CCOONNFFIIDDEENNTTIIAALLIITTYY All information contained in this document, provided by GAWB or received by the GAWB as part of this Invitation to Offer process, shall be fully regarded as ‘Commercial-in-Confidence’.
55..22 TTEERRMMSS && CCOONNDDIITTIIOONNSS OOFF OOFFFFEERR • The Due Date for a response to this Invitation to Offer is Wednesday 18 June
2014
• Responses are to be provided to GAWB by 5:00PM on the Due Date and sent via email. Responses are to be addressed to:
John Brennan
Strategic Planning Manager

GHD | Report for Gladstone Area Water Board - Review of Operations and Asset Life Cycle Management Expenditure for
GAWB's 2015 Price Review, 31/31748
Appendix B – Material relied upon for the review Document register for the Review of Operations and Asset Life Cycle Management Expenditure for GAWB's 2015 Price Review.
Document Document File Name
REGULATORY Treasurer Price Monitoring Referral
GAWB Price Monitoring Referral 2015-20 FINAL.pdf
Board Paper re 2015 Price Review
EDOCS_n298362_v1_15_Item_2_03(b)_2015_Price_Review_-_Draft_Operating_Expenditure_Submission.pdf
Letter re 2015 Price Review Approach
26062014 Letter to Rick Stankiewicz RE GAWB's QCA Submission.pdf
CORPORATE GAWB Organisation Chart Organisation Chart 2 July 2014.pdf GAWB Corporate Plan 2014/15 EDOCS_n294693_v1_GAWB_Corporate_Plan_201415–201819.pdf GAWB Procurement Plan EDOCS_n121982_v5_Agency_Procurement_Plan.pdf GAWB KPIs KPIs 2011 to 2014.pdf Remuneration Policy EDOCS_n36542_v11_Employee_Remuneration_Policy.doc COSTS 2010 to 2013 Costs Operations & ALC costs.xls 2014 Costs Operations & ALC 2014.xls Zone Price Impacts 140718B - GAWB - Opex Increase vs Zone Price.xls Forecast Costs Operations ALC 2016 to 2020.xls Forecast Costs Reconciled Operations & ALC 2015 to 2020 reconciled.xls Revised Costs and Comparison Copy of Compare forecast provided to most recent with explation for
mvmts.xls Revised Costs and Comparison Compare forecast provided to most recent with explation for mvmts –
updated check of GHD numbers.xlsx Response to Questions Email 15/7/14: Final information requested Cost Benchmarking 140530 - GAWB Benchmarking Final Report.pdf, Marchment Hill
Consulting Cost Review Responses Review of one off costs & additional details on consult and engineering
serv.xls
Staff Costs Review TEC mvmt query Email re Training Costs Email: Additional GAWB information DEMAND 2015 Price Review - Demand Forecast Methodology
EDOCS_n289249_v1A_12_Item_2_02(b)(i)_Demand_Forecast_Methodology_-_WWL.pdf
Demand Forecast EDOCS_n289072_v1_12_Item_2_04(a)_Demand_Forecasts.pdf Demand forecast to QCA 2011 to 2014 Demand - Volumetric to QCA.xls Demand Forecast 140904 - GAWB - Demand Forecast for Price Reset.xls Demand Forecast 140903-GAWB-Demand Model.xls Corporate Plan Demand Corporate Plan demand - 2014_15.pdf ELECTRICITY Electricity Cost Escalation 140711-GAWB-Electricity Cost Escalation.doc Electricity Cost Escalation 140904-GAWB-Electricity Cost Escalation.doc Energy Consumption Energy Consumption.xls CHEMICALS Chemical Cost Escalation Chemicals email.pdf FLEET Fleet Details COPY
EDOCS_n274746_v1_Consolidated_Fleet_Spreadsheet_20140101.xls LABOUR

GHD | Report for Gladstone Area Water Board - Review of Operations and Asset Life Cycle Management Expenditure
for GAWB's 2015 Price Review, 31/31748
Document Document File Name
GAWB Capability Plan 08 Item 2.05 Capability Plan EDOCS_n275840_v2A.doc
GAWB Capability Plan Capability Plan presentation to HR&R Cttee, 18 Dec 2013.ppt GAWB Capability Plan Email: Capability Plan Salary Movement EDOCS_n247856_v1_01_Item_2_03(a)_Market_Movement_-
_Attachment_-_Mercers_Advice.pdf Salary Movement EDOCS_n247861_v1_01_Item_2_03_Market_Movement.doc Salary Movement EDOCS_n256753_v1_01_Item_2_04_Senior_Executives_Remuneratio
n_Movement.doc Salary Movement EDOCS_n256760_v1_01_Item_2_05_Staff_Remuneration_Movement.
doc Salary Movement EDOCS_n258680_v1_01_Item_2_01_Snr_Exec_Job_Value_Outcomes
_-_Attach_Mercers_Report.pdf HR Manual EDOCS_n36741_v9_HR_Manual_-
_Performance_Management_System (2).doc GAWB Capability Plan Example_Capability_Plan_reconciliation_for_FTE.xls Labour Budget Template L4 Labour Budget Template version 7 3 214.xls O&M Review Board Paper Future of OM (Draft).doc Position Descriptions PDs to send to GHD.zip Labour Movements Movement in labour ALC and operations only Labour Movements Movement in labour ALC and operations only update 290714.xls Outsourcing Review 20140710161059750 Board Paper Delivery of O&M Services +
HWA.pdf Land and Hatchery Email: RE GAWB 2015 Price Review Draft Report - Land and Hatchery Staffing Email: RE 2015 Price Reviews Questions Easement Maintenance In-house_easement_maintenance_-_Project_OM2012-001_-
_Project_Plan.pdf Turtle Triage EDOCS_n165919_v1_J1000_Funding_Agreement_Queensland_Gas_
Corporation_Interim_Turtle_Care_Facility_and_Support.pdf Senior Land Officer EDOCS_n268900_v1A_PD_Senior_Land_Officer.doc Training Costs GL 2241 Staff training forecast.pdf Staff Movements Mvmt in FTEs.xls CURTIS ISLAND Curtis Island Costs Email: Additional GAWB information CI Insurance CI Insurance.pdf O&M Costs CI O&M costs 2013_14.pdf Forecast Costs Curtis Island forecast GRC Costs GRC 375mm water connection.pdf ASSET PLANS Asset Investigation 140708-GAWB-North Industrial Potable Augmentation Summary Boyne Resource Operations Plan
boyne-rop.pdf
DRINKING WATER QUALITY DWQMP EDOCS_n286497_v2_GAWB_Drinking_Water_Quality_Management_
Plan_2014.pdf DWQMP EDOCS_n287510_v1_GAWB_DWQMP_Amendment_Attachment_201
4_pdf DWQMP Annual Report EDOCS_n273899_v1_DWQMP_Annual_Report_2013.pdf LIFE CYCLE ASSET MANAGEMENT
LCMP List LCMP List.doc LCMPs EDOCS_n276251_v1_LCMP_-_Reservoir_-_Toolooa.pdf LCMPs EDOCS_n276246_v1_LCMP_-_Reservoir_-
_Fitzsimmons_St_50ML.pdf LCMPs EDOCS_n276239_v1_LCMP_-_Pump_Station_-_High_Lift.pdf LCMPs EDOCS_n276230_v1_LCMP_-_Pipeline_-_DICL_Piping.pdf

GHD | Report for Gladstone Area Water Board - Review of Operations and Asset Life Cycle Management Expenditure
for GAWB's 2015 Price Review, 31/31748
Document Document File Name
LCMPs EDOCS_n276229_v1_LCMP_-_Pipeline_-_Common_Systems.pdf LCMPs EDOCS_n276226_v1_LCMP_-_GWTP_-_Treatment_Circuit_No_1.pdf LCMPs EDOCS_n276211_v1_LCMP_-_ADPS_-_Pumps_1_and_2.pdf MAINTENANCE Maintenance Costs Maint data 2011 to 2014.xls Maintenance Costs Maint data 2011 to 2014 with queries.xls Asset Criticality EDOCS_n276291_v1_Report_OM_Assetivity_GAWB_AMS_Criticality_
Analysis_Report_13_Sept_2013 Maintenance Budgets EDOCS_n274255_v3_Report_-_O&M_-_Assetivity_-_LCMP_s_-
__Budget_Expenditure_-_January_2014

GHD | Report for Gladstone Area Water Board - Review of Operations and Asset Life Cycle Management Expenditure for
GAWB's 2015 Price Review, 31/31748
Appendix C – Detailed cost charts and tables

GHD | Report for Gladstone Area Water Board - Review of Operations and Asset Life Cycle Management Expenditure for
GAWB's 2015 Price Review, 31/31748

GHD www.ghd.com.auTel. (03) 8687 8000 Fax. (03) 8687 8111
180 Lonsdale Street Melbourne Vic 3000
Items2011 QCA 2012 QCA 2013 QCA 2014 QCA 2015 QCA 2016 2017 2018 2019 2020
2221 + 2212 + 2215 + 2222 + 2223 + 2224 + 2225 + 2226 + 2227 (TEC) $2,509,175 $1,886,796 $2,804,065 $1,872,691 $3,086,646 $1,925,431 $3,152,800 $1,971,256 $3,471,602 $2,021,033 $3,576,251 $3,598,635 $3,629,600 $3,668,680 $3,720,9612120 (Maintenance) $1,982,331 $2,546,836 $2,496,233 $2,115,667 $1,610,869 $1,806,537 $2,241,605 $2,338,543 $2,035,813 $2,180,946 $2,164,916 $2,061,754 $2,504,136 $2,144,754 $2,397,1112405 (Insurance Expense) $583,366 $708,464 $693,402 $726,726 $750,100 $746,588 $706,097 $744,991 $725,294 $744,482 $742,985 $761,106 $779,670 $798,686 $818,1662092 + 2091 +MV (MV Lease payments and fuel / oil) $540,081 $279,265 $637,132 $272,494 $812,669 $265,726 $824,619 $256,556 $749,546 $257,968 $748,089 $748,264 $748,351 $748,376 $748,4002025 (Operations) $0 $0 $0 $0 $0 $02360 (Professional Services-Engineer) $178,845 $54,967 $289,448 $0 $141,256 $0 $185,307 $0 $75,000 $0 $78,180 $58,514 $59,028 $59,546 $60,0692356 (Consulting Services) $0 $0 $90,860 $0 $60,857 $0 $424,852 $0 $62,420 $0 $62,420 $150,970 $102,420 $82,420 $170,970Other $1,104,811 $839,004 $1,203,913 $825,608 $1,370,581 $834,678 $1,344,203 $827,411 $1,446,650 $842,779 $1,471,251 $1,412,310 $1,414,365 $1,432,939 $1,428,247Total $6,898,609 $6,315,332 $8,215,053 $5,813,186 $7,832,978 $5,578,960 $8,879,484 $6,138,758 $8,566,326 $6,047,208 $8,844,092 $8,791,554 $9,237,570 $8,935,401 $9,343,924
Actual / Expected - 2015 Dollars Forecast - 2015 Dollars
$0
$1,000,000
$2,000,000
$3,000,000
$4,000,000
$5,000,000
$6,000,000
$7,000,000
$8,000,000
$9,000,000
$10,000,000
2011 2012 2013 2014 2015 2016 2017 2018 2019 2020
Asse
t Lift
Cyc
le C
osts
(at 2
015
Dolla
rs)
Financial Year
Asset Life Cycle (2015 Dollars)2356 (Consulting Services)2025 (Operations)2405 (Insurance Expense)2092 + 2091 + MV (MV Lease payments and fuel / oil)2120 (Maintenance)2221 + 2212 + 2215 + 2222 + 2223 + 2224 + 2225 + 2226 + 2227 (TEC)Other
Actual / Expected
Forecast
ChartsG:\31\31748\Analysis\Operations_ACL_GHD_Analysis_RevisedData_18092014.xlsm
18/09/2014 11:44 AM
Page 3 of 4

GHD www.ghd.com.auTel. (03) 8687 8000 Fax. (03) 8687 8111
180 Lonsdale Street Melbourne Vic 3000
2011 QCA 2012 QCA 2013 QCA 2014 QCA 2015 QCA 2016 2017 2018 2019 20202221 + 2212 + 2215 + 2222 + 2223 + 2224 + 2225 + 2226 + 2227 (TEC) $1,943,515 $1,681,365 $1,949,198 $1,668,668 $2,303,289 $1,613,427 $2,411,942 $1,652,109 $2,567,575 $1,694,102 $2,602,442 $2,618,750 $2,641,305 $2,669,772 $2,707,8542181 (Electricity) $1,468,169 $1,349,974 $1,719,968 $1,382,958 $1,964,475 $1,479,563 $2,210,659 $1,578,662 $1,990,567 $1,686,586 $2,132,917 $2,285,239 $2,443,533 $2,532,931 $2,625,5992191 (Chemicals) $609,773 $932,459 $688,304 $951,952 $786,293 $973,481 $749,799 $991,232 $807,737 $1,010,710 $807,737 $807,737 $807,737 $807,737 $807,7372025 (Operations) $244,966 $165,875 $145,566 $118,916 $32,480 $115,993 $0 $111,910 $3,996 $112,615 $3,996 $3,996 $3,996 $3,996 $3,9962356 (Consulting Services) $78,244 $43,973 $91,819 $44,003 $206,394 $44,099 $165,658 $44,005 $116,944 $43,974 $186,944 $96,804 $151,944 $106,944 $96,804Other $1,182,129 $1,187,627 $1,541,313 $1,133,875 $1,630,288 $1,114,796 $1,552,880 $1,062,270 $1,351,171 $1,070,021 $1,366,260 $1,324,603 $1,324,691 $1,336,704 $1,332,728Total $5,526,796 $5,361,272 $6,136,168 $5,300,371 $6,923,218 $5,341,359 $7,090,938 $5,440,187 $6,837,991 $5,618,008 $7,100,297 $7,137,129 $7,373,207 $7,458,084 $7,574,718
ItemsActual / Expected - 2015 Dollars Forecast - 2015 Dollars
$0
$1,000,000
$2,000,000
$3,000,000
$4,000,000
$5,000,000
$6,000,000
$7,000,000
$8,000,000
2011 2012 2013 2014 2015 2016 2017 2018 2019 2020
Ope
ratio
n Co
sts
(at 2
015
dolla
rs)
Financial Year
Operations (2015 Dollars)2356 (Consulting Services)
2025 (Operations)
2191 (Chemicals)
2181 (Electricity)
2221 + 2212 + 2215 + 2222 + 2223 + 2224 +2225 + 2226 + 2227 (TEC) Other Actual / Expected
Forecast
ChartsG:\31\31748\Analysis\Operations_ACL_GHD_Analysis_RevisedData_18092014.xlsm
18/09/2014 11:44 AM
Page 4 of 4

GHD
180 Lonsdale Street Melbourne, Victoria 3000 T: (03) 8687 8000 F: (03) 8687 8111 E: [email protected]
© GHD 2014
This document is and shall remain the property of GHD. The document may only be used for the purpose for which it was commissioned and in accordance with the Terms of Engagement for the commission. Unauthorised use of this document in any form whatsoever is prohibited. G:\31\31748\WP\235223 Final GHD Report 2015 Price Review Rev 3.docx
Document Status
Rev No.
Author Reviewer Approved for Issue Name Signature Name Signature Date
Final D Vincent D Vincent
22/9/14
1 D Vincent Minor edits only D Vincent
24/9/14
2 D Vincent Minor edits only D Vincent
26/9/14
3 D Vincent Minor edits only D Vincent
30/9/14

www.ghd.com