
1 2009 OPERS Health Care Jason Davis Devon Hooper OPERS Ohio University March 18, 2009.

20151935
An 80-Year Tradition of Balancing Change to Ensure Stability
Popular Annual Financial Report For the year ended December 31, 2015
Sylvia Joab, OPERS Retiree (since 2006) with her daughter,Rhonda Caldwell –Garrett, OPERS Benefits Supervisor (since 2015)
Ohio Public Employees Retirement System


Letter of Transmittal – From OPERS Leadership 1
2015 Financial Highlights and Summary Comparative Financial Statements 2
Investments Summary 5
OPERS’ Net Position 6
Ohio’s Public Employees by Employer Type 6
Funding Retiree Pension Benefits 7
Average Retiree Pension Benefits 9
Pension Benefits by Type 10
Funding Retiree Health Care Coverage 11
OPERS Health Care Trusts 12
Health Care by Cost Type 14
OPERS Members 15
Good for Ohio and Economic Impact 16
OPERS Board of Trustees 19
TABLE OF CONTENTS
Popular Annual Financial Report(for the year ended December 31, 2015)
“I appreciate OPERS because I knew I had a solid retirement waiting for me when I left my position at OSU after 38 years. It’s comforting to know my daughter Rhonda, an OPERS benefits supervisor, will have the same waiting for her. After my husband passed away in March, I was totally lost. Rhonda guided me through the process. I couldn’t have figured it all out without her. She not only did that for me, but she helps OPERS members and retirees to understand their benefits every single day.”
Who We Serve
Sylvia Joab, OPERS Retiree (since 2006) with her daughter,Rhonda Caldwell –Garrett, OPERS Benefits Supervisor (since 2015)
2015 Popular Annual Financial Report


Dear Fellow Members:
On behalf of the Ohio Public Employees Retirement System (OPERS or System) Board of Trustees, management and staff, it is our pleasure to present this 2015 Popular Annual Financial Report for the fiscal year ended December 31, 2015. Our 2015 activities reflect the results of our efforts to balance the changes deemed necessary to ensure the longevity of the System well beyond our first 80 years. The key activities of 2015 are summarized below:
MEDICARE CONNECTOR Fiscal year 2015 marked a key milestone as OPERS implemented the OPERS Medicare Connector. Beginning with January 2016 coverage, Medicare-eligible retirees will select an individual Medicare supplement or Medicare Advantage plan, and a prescription drug plan. Throughout the year, we provided extensive communications to help educate eligible retirees in anticipation of the enrollment period in late 2015. This included guidance on using the new Health Reimbursement Arrangement Plan (HRA) which will provide reimbursement of qualified medical expenses.
NEW GASB STANDARDSIn 2015, the Governmental Accounting Standards Board (GASB) required a new pension standard be implemented for most OPERS-reporting employers. We worked throughout 2014 and 2015 to educate and prepare all affected public employers so the necessary tools and information required for implementation were available by the GASB-mandated implementation date. We also began providing guidance on new GASB requirements announced in 2015 for health care financial reporting that will impact the System, as well as employers, similar to the new pension standards.
OPERS continues to be a strong system as we report our 80th year of business. Our strength, balance and longevity result from our ability to anticipate and adapt to change while remaining steadfast in our mission and principles. OPERS delivers on our promise to provide retirement security to generations of members. We appreciate the work and achievements of those who have come before us in the first 80 years and we look forward to the next 80 years.
Letter of Transmittal
From OPERS Leadership
ContinuingPension Implementation
Re-employed Retirees Health Care Coverage
CIO Hired
The System continued to implement elements of 2012 pension legislation. These included changes to the defined contribution plan and education and outreach for members and other stakeholders to ensure a full understanding.
Because federal law does not allow retirees re-employed in OPERS-covered positions to participate in the HRA Plan, we developed alternative health insurance solutions. As with all changes we propose or initiate, those affected received extensive education and outreach.
After an extensive search, Richard Shafer was selected as OPERS Chief Investment Officer.
OTHER KEY ACTIVITIES AND ACHIEVEMENTS
Karen E. Carraher, CPAExecutive Director
Blake W. SherryChief Operating Officer
Jennifer H. Starr, CPAChief Financial Officer
Blake W. Sherry, Karen E. Carraher and Jennifer H. Starr
2015 Popular Annual Financial Report 1

PENSION FUNDINGFunded status measures the progress of accumulating the funds necessary to meet future obligations. Historically, periods of diminished funded status were made up as market conditions improved. Similarly, years of enhanced funded status are eroded when market conditions are poor. OPERS continues to maintain this necessary balance by constantly monitoring and adapting to market conditions. We have remained in compliance with the 30-year funding window required by law—and will continue to work toward that mandate for the next 80 years and beyond.
The December 31, 2015 valuation shows a funded status of 85.0%, with the unfunded liability expected to be funded within 19 years.
HEALTH CARE FUNDINGOPERS is not required by law to provide health care coverage. However, OPERS has historically set aside money for these costs. The combined actions of pre-funding and making changes to the OPERS health care plans have yielded favorable results. As of theDecember 31, 2014 valuation, which is the most recent actuarial valuation, OPERS health care was 62.2% funded, with funds expected to be sufficient for future health care needs.
2015 Financial Highlights
Pension liabilities are
85% funded We have remained in compliance
with the 30-year funding window required by law
INVESTMENT RESULTSThe 2015 investment market was frustrating and yielded low returns for all the OPERS pension and health care portfolios. The OPERS total return was a loss of 0.03% or (0.03%), substantially less than the expected rate of return of 8% but better than the benchmark return of (0.06%).
While these results are disappointing, OPERS is a long-term investor. We have managed to maintain a strong funding status throughout the market turmoil.
OPERS invests in a diverse set of asset classes to minimize risk. We periodically review the asset allocation to balance the appropriate level of expected risk and return, relative to the characteristics of the liabilities we ultimately expect to fund.
A complete discussion of OPERS’ investment returns, activities, asset allocation strategy, and policies governing those activities can be found in the Investment Section of the 2015 Comprehensive Annual Financial Report available at www.opers.org.
Health care costs are
62% funded
2 2015 Popular Annual Financial Report
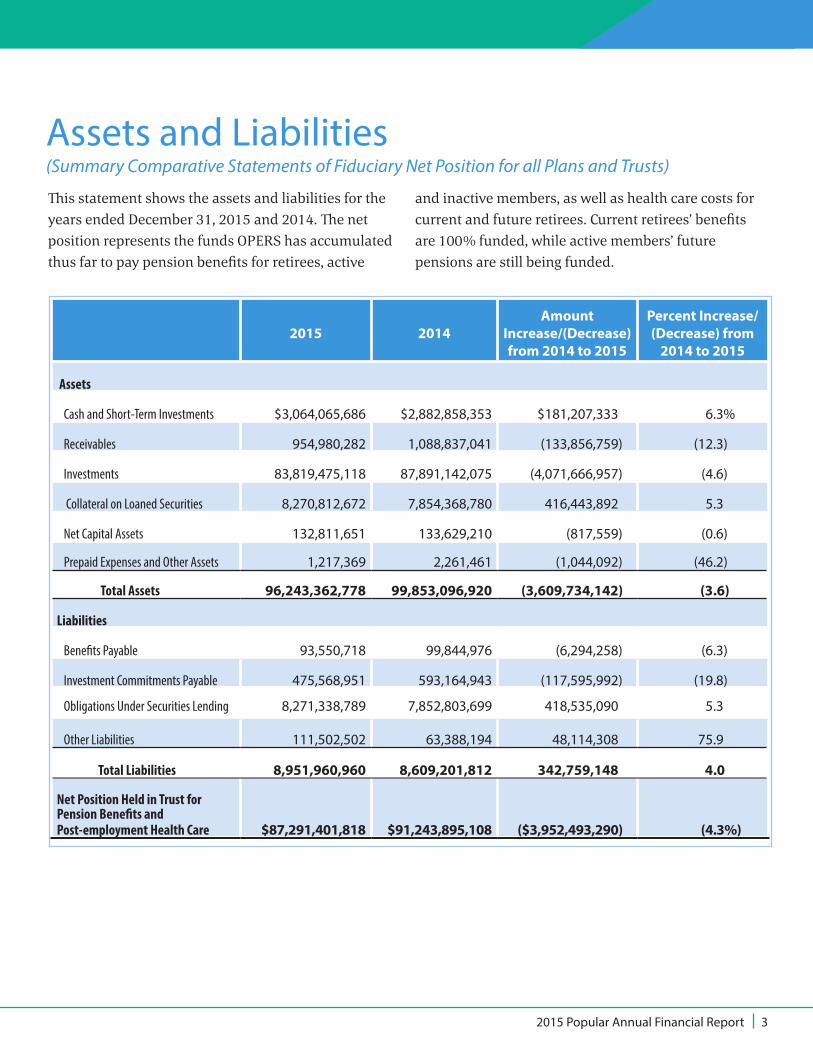
Assets and Liabilities (Summary Comparative Statements of Fiduciary Net Position for all Plans and Trusts)
This statement shows the assets and liabilities for the years ended December 31, 2015 and 2014. The net position represents the funds OPERS has accumulated thus far to pay pension benefits for retirees, active
and inactive members, as well as health care costs for current and future retirees. Current retirees’ benefits are 100% funded, while active members’ future pensions are still being funded.
2015 Popular Annual Financial Report 3
2015 2014Amount
Increase/(Decrease) from 2014 to 2015
Percent Increase/(Decrease) from
2014 to 2015
Assets
Cash and Short-Term Investments $3,064,065,686 $2,882,858,353 $181,207,333 6.3%
Receivables 954,980,282 1,088,837,041 (133,856,759) (12.3)
Investments 83,819,475,118 87,891,142,075 (4,071,666,957) (4.6)
Collateral on Loaned Securities 8,270,812,672 7,854,368,780 416,443,892 5.3
Net Capital Assets 132,811,651 133,629,210 (817,559) (0.6)
Prepaid Expenses and Other Assets 1,217,369 2,261,461 (1,044,092) (46.2)
Total Assets 96,243,362,778 99,853,096,920 (3,609,734,142) (3.6)
Liabilities
Benefits Payable 93,550,718 99,844,976 (6,294,258) (6.3)
Investment Commitments Payable 475,568,951 593,164,943 (117,595,992) (19.8)
Obligations Under Securities Lending 8,271,338,789 7,852,803,699 418,535,090 5.3
Other Liabilities 111,502,502 63,388,194 48,114,308 75.9
Total Liabilities 8,951,960,960 8,609,201,812 342,759,148 4.0
Net Position Held in Trust for Pension Benefits and Post-employment Health Care $87,291,401,818 $91,243,895,108 ($3,952,493,290) (4.3%)

Income and Expenses(Summary Comparative Statements of Changes in Fiduciary Net Position for all Plans and Trusts)
This statement shows the annual additions (income) and deductions (expenses) for the System. Investment earnings and contributions typically make up the majority of the income; however, investment returns were minimal in 2015. These results provided net investment income of $9.4 million in 2015 compared to $5.8 billion in 2014.
The deductions largely represent pension benefits, health care expenses and refunds of contributions. The increase in this activity is the result of an increase in retirees, continued increases in health care costs and refunded accounts and refund values increasing from 2014 to 2015.
2015 2014Amount
Increase/(Decrease) from 2014 to 2015
Percent Increase/(Decrease) from
2014 to 2015 Additions
Member Contributions* $1,332,308,994 $1,307,428,830 $24,880,164 1.9%
Employer Contributions 1,864,823,741 1,829,907,525 34,916,216 1.9
Contracts and Other Receipts 172,067,637 270,728,202 (98,660,565) (36.4)
Retiree-Paid Health Care Premiums* 248,601,375 238,406,380 10,194,995 4.3
Federal Subsidy 175,930,875 176,619,891 (689,016) (0.4)
Net Income from Investing Activity 9,415,961 5,775,317,835 (5,765,901,874) (99.8)
Other Income/(Expense), net (4,887,359) 8,304,360 (13,191,719) (158.9)
Interplan Activity 19,759,373 10,357,663 9,401,710 90.8
Total Additions 3,818,020,597 9,617,070,686 (5,799,050,089) (60.3)Deductions
Pension Benefits 5,401,880,992 5,112,123,787 289,757,205 5.7
Health Care Expenses 1,822,571,428 1,740,814,106 81,757,322 4.7
Refunds of Contributions 449,265,410 425,701,829 23,563,581 5.5
Administrative Expenses 77,036,684 74,114,491 2,922,193 3.9
Interplan Activity 19,759,373 10,357,663 9,401,710 90.8
Total Deductions 7,770,513,887 7,363,111,876 407,402,011 5.5
Net Increase/(Decrease) (3,952,493,290) 2,253,958,810 (6,206,452,100) (275.4)Net Position Held in Trust, Beginning of Year 91,243,895,108 88,989,936,298 2,253,958,810 2.5
Net Position Held in Trust, End of Year $87,291,401,818 $91,243,895,108 ($3,952,493,290) (4.3%)* Retiree-Paid Health Care Premiums for 2014 were previously included in Member Contributions. These lines have been restated to appropriately reflect the reclassification.
4 2015 Popular Annual Financial Report

Financial markets were not strong in 2015. Wall Street signaled robust expectations for the market in early 2015 but those expectations did not become reality and returns were muted. The most common message from experts for investing in any economy is to keep asset allocation plans intact in both strong and weak markets. Adhering to Board policies, OPERS did just that in 2015. While the actuarially established benchmark return for each portfolio was not attained, the Defined Benefit portfolio did provide a positive return and, most importantly, remained positioned for better results.
The Total Investments Summary relates to the System-wide investments and includes the assets of all four portfolios. The OPERS total investment portfolio must continue to produce returns over the long term that will sustain the funding status of the System. The past 10 years of returns by portfolio and in total are included in the table below.
Investments SummaryTOTAL INVESTMENTS SUMMARY (as of December 31, 2015, $ in billions)
Hedge Funds and Derivatives$12.438
Cash and Short-Term Investments$3.065
Fixed Income$21.777
International Equities$15.771
Private Equity$9.079
Real Estate$8.289
Domestic Equities$16.466
Year Total Portfolio Return
Total DefinedBenefit Return
Total 401(h) Health Care Trust Return
Total 115 Health Care
Trust Return*
Total Defined Contribution
Return
2015 (0.03%) 0.33% (2.18%) (3.23%) (1.71%)
2014 6.70 6.96 5.28 (0.03) 4.83
2013 14.00 14.38 11.36 20.45
2012 14.40 14.54 13.72 13.37
2011 0.20 0.36 (0.38) (2.59)
2010 13.90 13.98 13.93 13.74
2009 20.06 19.09 24.80 26.44
2008 (26.92) (27.15) (25.77) (28.00)
2007 8.52 8.89 6.87 5.80
2006 14.66 15.05 12.78 12.96
HISTORICAL INVESTMENT RETURNS
*The 115 Health Care Trust was established in September 2014. Returns are two-month cumulative returns in 2014 since funding of the 115 Health Care Trust
portfolio began in November 2014.
2015 Popular Annual Financial Report 5

OPERS’ Net PositionHere’s the history of OPERS’ total net position (or net assets) for the last five years. As of December 31, 2015, net position was approximately $87 billion.
$100,000
$90,000
$80,000
$70,000
$60,000
$50,0002012 2013 2014 2015
$81BILLION
$89BILLION
$91BILLION $87
BILLION
Ohio’s Public Employees by Employer Type
2011
$74BILLION
STATE
COUNTIES
MUNICIPALITIES
MISCELLANEOUS
LIBRARIES
TOWNSHIPS
LAW ENFORCEMENT/PUBLIC SAFETY
260
215
244
498
253
1,309
239
124,590
94,528
58,812
21,622
12,778
11,252
7,927
Employees
Employers
VILLAGES 665 13,959
OPERS serves more than 345,000 actively contributing members and nearly 3,700 employers who provide services to Ohio residents. This chart displays the number
of active members who work in each of the primary employer groups, providing services that touch the lives of every Ohioan.
6 2015 Popular Annual Financial Report

Funding Retiree Pension Benefits(Pension Funding Status)Retiree pension benefits are funded by contributions from members and employers and income earned from investing these funds over the member’s career. Retiree pensions are 100% funded at the time of retirement. Funded status measures the progress of accumulating the funds necessary to meet future obligations. By law, OPERS must remain within a 30-year funding window—
meaning the System will pay all liabilities within 30 years.
As of the December 31, 2015 actuarial valuation, OPERS has a funded status of 85.0%, with the unfunded liability expected to be funded within 19 years.
*This table includes the funded ratio and funding years based on actuarial assumptions and includes the smoothing of investment gains and losses over a closed four-year period. Information shown on this funding basis is used to monitor the funding status of OPERS.
** Results reflecting the provisions of Senate Bill 343.
PENSION VALUATION ASSETS VS. ACCRUED LIABILITIES – FUNDING BASIS * (ALL PLANS) ($ in millions)
$100,000
$90,000
$80,000
$70,000
$60,000
2011 2012** 2013 2014 2015
Funded RatiosFundingYears
77.4% 80.9% 82.4% 83.9% 85.0%
30 26 24 21 19
Pension Assets
Accrued Liabilities
$78,061
$91,832
2015 Popular Annual Financial Report 7

GASB 67 requires the System’s valuation for financial reporting to be calculated using market values of assets (rather than smoothed assets). The information shown
here is not used by OPERS to monitor funding and is for accounting and financial reporting purposes only.
2015
26%OPERS EMPLOYERS
22%OPERS MEMBERS
52%OPERS INVESTMENTRETURNS
For those retiring in 2015, 74% of the lifetime pension is
funded by employee payroll deductions and investment
income. The remaining 26% is funded by employer
contributions. For every dollar paid by employers, the
economy realized a direct return of $3.87.
Funding Retiree Pension Benefits(Pension Funding Status–continued)
PENSION VALUATION ASSETS VS. ACCRUED LIABILITIES–ACCOUNTING BASIS* (ALL PLANS)($ in millions)
OPERS PENSIONS
2014
$100,000
$90,000
$80,000
$70,000
$60,000$74,560
$91,832
Funded Ratios 86.5% 81.2%
8 2015 Popular Annual Financial Report
Pension Assets
Accrued Liabilities

Average Retiree Pension BenefitsThe graphic below shows the average benefits paid to retirees receiving a benefit under the Traditional Pension Plan. The cost of retirements will continue to increase
as new retirees with higher final average salaries replace long-time retirees with lower final average salaries.
AVERAGE DEFINED BENEFITS PAID OPERS RETIREES, TRADITIONAL PENSION PLAN
Average age at retirement57.6 years
December 31, 2015
Average service at retirement22.9 years
AverageFinal Average
Salary$40,600
Average pension at retirement
$20,092
Average age on valuation date69.9 years
Average pension on valuation date
$25,600
In 2015 Joan Stack was nominated by her peers and won the highest OPERS associate honor, the Neil V. Toth Leadership Award. As Head Trader for OPERS Internal Equities Trading, Joan is responsible for the outcome of portfolio management decisions on a daily basis that impact billions of dollars in funds OPERS invests to provide secure retirements for our members. Joan was named one of the Wall Street Women 2014 Mentors of the Year by Traders magazine.
Who Serves Our Members
Joan StackOPERS Investments – Member since 2003
2015 Popular Annual Financial Report 9

Pension Benefits by TypeOPERS’ mission is to provide financial security for our members in retirement. We do that by accepting contributions throughout an individual’s working career. With careful, systematic investing to maximize earnings and the compounding effect of long-term contributions, OPERS has maintained an 80-year tradition of providing financial security to our members.
OPERS provides retirement benefits that include pension payments, disability benefits and survivor benefits. Retirees meeting specific requirements may also receive health care coverage. See page 14 for health care costs by type.
In general, defined benefit pensions (Traditional Pension and Combined plans) are determined by a formula based on the number of years of service and the highest years of salary, multiplied by a factor determined by statute.
The information below shows the trend in retiree pension benefits for the past five years. The graph tracks upward, and will continue to do so, as the number of retirees increases. In addition, as members continue to work longer, the value of their retirement benefit will continue to grow through wage increases—making the final average salary and service years higher.
2015201420132012
$603.4$624.0
$634.4 $642.9
MILLIONMILLION
MILLIONMILLION
Disabilities
2015201420132012
$170.1$174.8
$178.6$182.5
MILLIONMILLION
MILLIONMILLION
Survivors
2015201420132012
$34.4$13.6
$10.6 $12.0MILLIONMILLION
MILLION MILLION
Other Systems/Death/QEBA
$4.6
$4.3
$4.1
$3.8
BILLION
BILLION
BILLION
BILLION
2015201420132012
2011
$165.5MILLION
2011
$578.0MILLION
2011
$31.4MILLION
$3.6BILLION
2011
10 2015 Popular Annual Financial Report
Annuities and Installment Payments

Funding Retiree Health Care Coverage(Health Care Funding Status)
OPERS is not required by law to provide health care coverage to retirees. However, OPERS recognizes the importance of access to quality health care in retirement and has historically pre-funded this expense. OPERS has made changes to the health care program to make it sustainable. The combined actions of pre-funding
health care and the changes to the program design have yielded favorable results. As of the December 31, 2014, the most recent health care actuarial valuation, OPERS was 62.2% funded, with funds expected to be sufficient to fund future health care needs.
Health Care Assets
Accrued Liabilities
2010* 2011 2012 2013 2014
$40,000
$30,000
$20,000
$10,000
$0
*Information after completion of experience study.
**Solvency years represent an estimate of the number of years the fund will be able to provide health care under the intermediate actuarial assumptions. Indefinite indicates funds are expected to be sufficient to fund future health care needs.
Funded RatiosSolvencyYears
40.4% 39.1% 63.6% 60.8% 62.2%
11 10 Indefinite** Indefinite** Indefinite**
HEALTH CARE RATIOS – VALUATION ASSETS VS. ACCRUED LIABILITIES($ in millions)
$12,062$19,405
2015 Popular Annual Financial Report 11
For 80 years, OPERS has been delivering on the promise of providing a secure retirement for our members. In that time, OPERS has successfully evolved through cold wars, world war and moon shots; great economies, the Great Depression and the most recent recession.
OPERS Health Care Trusts401(H) HEALTH CARE TRUSTThe 401(h) Health Care Trust (401(h) Trust) was established under Section 401(h) of the Internal Revenue Code (IRC). This trust is pre-funded and holds the portion of employer contributions of the Traditional Pension Plan and Combined Plan that are set aside for funding retiree health care. The health care portion of the employer contribution rate for the Traditional Pension and Combined plans is comparable, as the same coverage options are provided to participants in both plans. Employer contributions to this trust ceased in September 2014 upon the establishment of the 115 Health Care Trust. The funds in the 401(h) Trust will continue to be used to fund health care expenses for retirees and their dependents.
115 HEALTH CARE TRUSTAs OPERS prepared to change the manner of funding health care for Medicare-eligible retirees, it needed a trust that could accommodate a Health Reimbursement Arrangement (HRA). In 2014, OPERS established the 115 Health Care Trust (115 Trust) under Section 115 of the IRC to support an HRA Plan. The HRA provides reimbursement for eligible health care expenses of retirees in the Traditional Pension Plan and Combined Plan.
Effective October 1, 2015, the HRA was launched in conjunction with the OPERS Medicare Connector. While employer contributions to this trust began in September 2014, the initial health care disbursements from the 115 Health Care Trust commenced with January 2016 premium reimbursements.
VOLUNTARY EMPLOYEES’ BENEFICIARY ASSOCIATION TRUSTMember-Directed Plan participants are provided with a Retiree Medical Account (RMA). The funding vehicle of the RMA is a Voluntary Employees’ Beneficiary Association Trust (VEBA Trust) established under Section 501(c)(9) of the IRC. The VEBA Trust holds the portion of employer contributions of the Member-Directed Plan that are set aside for funding retiree health care.
Upon separation or retirement, the participant may use the vested funds in his RMA to reimburse for qualified health care expenses. Vesting requirements for the RMA have changed over the life of the plan. The RMA originally required 10 years of participation to fully vest in the contributions and interest earned on the account. Effective January 1, 2009, contributions and interest vested with the participant over a five-year period. Effective July 1, 2015, new participants to the RMA are required to participate for 15 years to become fully vested.
SUBSEQUENT EVENTIn March 2016, OPERS received two favorable rulings from the Internal Revenue Service allowing OPERS to consolidate all health care assets into the 115 Health Care Trust. Transition to the new health care trust structure will occur during 2016. The Combining Statements of Changes in Fiduciary Net Position for the year ending December 31, 2016 will reflect a partial year of activity in the 401(h) Health Care Trust and VEBA Trust prior to the termination of these trusts and the assets and liabilities, or net position, of these trusts being consolidated into the 115 Health Care Trust.
12 2015 Popular Annual Financial Report

OPERS Health Care Trusts (continued)
401(h) Health Care Trust VEBA Trust Total
Active Members 11,235 11,235
Inactive Members 4,764 4,764
Covered Lives:
Retirees & Primary Beneficiaries 170,687 4,063 174,750
Dependents & Other Beneficiaries 52,110 52,110
Total Members 222,797 20,062 242,859
HEALTH CARE COVERED LIVES*
*The 115 Health Care Trust is not included in this table as the OPERS Medicare Connector, funded by the 115 Health Care Trust, participants were eligible for allocations beginning January 1, 2016. The covered lives are already included in the 401(h) Health Care Trust participant amounts.
“In a letter, a member praised Angie for making her feel special. The
member said Angie’s helpfulness turned a call she dreaded into an
enjoyable experience. Thanks, Angie!”
Who Serves Our Members
Angie MooreOPERS Member Counselor – Member since 2004
2015 Popular Annual Financial Report 13
The values included in the table below represent the number of lives covered by the OPERS health care plans funded through the 401(h) Health Care Trust and VEBA Trust in 2015. The counts for the table reflect the number of retirees and primary beneficiaries as well as the number of additional dependents and other beneficiaries receiving coverage. In addition to a retiree, a primary beneficiary could be the survivor of a deceased retiree continuing to receive coverage on the member’s account.
The values in this row are representative of OPERS’ contributing membership. The values for dependents and other beneficiaries represent family members receiving primarily dental and vision coverage though a member’s account. These counts represent all Traditional Pension Plan and Combined Plan retirees, dependents and beneficiaries receiving post-employment health care coverage.

Although not required, health care coverage remains available to defined benefit retirees and their dependents. Beginning January 1, 2015, new retirees were required to have 20 years of qualifying service credit to receive health care coverage. On average, disability recipients comprise 11% of the retiree population but represent 24-26% of health care expenses. OPERS periodically reviews and modifies the health care program, which the OPERS Board of
Trustees has the authority to change, to maintain the solvency of health care for current and future retirees. Plan design changes effective in 2012, with phased-in implementation dates, are designed to strengthen the health care program to preserve access to, and provide affordable, meaningful health care coverage to all our members—both current and future.
Health Care by Cost Type
Medical/Dental/Vision/Disease Management
Prescription Drug
2012 2013 2014 2015
$1,008.0
$672.7
$985.5
$634.5
$973.8
$551.4
$943.0
$541.6
MILLIONMILLION
MILLION
MILLIONMILLION
MILLIONMILLION
($ in millions)
Medicare Part B
Allowance Payment to Wellness RMA
Allowance Payment to HRA
2012 2013 2014 2015
$112
.5
$112
.8
$114
.0
$77.
9
$10.
8
$4.6
$4.7
$16.
5 $45.
2
14 2015 Popular Annual Financial Report
$922.6
$530.4MILLION
2011
MILLION
MILLION
$109
.1
$13.
5
2011

OPERS MembersOPERS offers its members three different retirement plans – the Traditional Pension Plan, the Member-Directed Plan and the Combined Plan. Each offers
different features and allows members to select the option that best fits their needs and retirement goals.
A defined benefit plan under which a member’s retirement benefit is
based on a formula set by law and determined by the member’s years
of contributing service and final average salary.
A defined contribution plan inwhich both the member and
employer contributions are invested at the direction of the member.
The member’s retirement benefit is based on member contributions,
vested employer contributions and the gains and losses on those
contributions.
A retirement plan with both a defined benefit and a defined
contribution component. Member contributions are deposited into a defined contribution account and employer contributions are
deposited into a defined benefit plan.
The chart below displays the number of active, inactive and retired members in each plan as of December 31, 2015. Inactive members are no longer contributing to
OPERS, but have not refunded their account or may be eligible to receive a retirement benefit.
Traditional Pension Plan
Combined Plan
Member-Directed Plan Total
Active Members 326,795 7,587 11,240 345,622
Average Age 42.4 43.3 42.5
Average Service Credit (Years) 9.6 7.3 4.7
Average Salary (FAS) $33,979 $44,954 $41,503
Inactive Members 509,194 2,031 4,824 516,049
Average Age 39.0 42.1 38.8
Average Service Credit (Years) 1.3 4.2 2.7
Average Salary (FAS) $5,759 $32,694 $29,117
Retired Members 205,211 196 194 205,601
Average Age 68.7 66.7 67.6
Average Service Credit (Years) 22.1 9.8 N/A
Average Annual Benefit $25,766 $5,753 $4,480
Total Members 1,041,200 9,814 16,258 1,067,272
THE TRADITIONAL PENSION PLAN
THE MEMBER-DIRECTED PLAN THE COMBINED PLAN
2015 Popular Annual Financial Report 15

Good for OhioAs the largest public pension system in Ohio, and the 11th largest in the U.S., OPERS is a significant economic driver for the state. The majority of our one million members and retirees live and work in Ohio, providing economic stability throughout the state.
$3.87For every dollar received, $3.87 is returned to the
Ohio economy90% of OPERS
retirees livein Ohio
For every dollar received by OPERS from public employers in 2015, $3.87 is returned to the economy through pension and health care payments made to retirees— retirees who spend the majority of retirement proceeds on goods and services within the state.
“The word that comes to mind when I think of OPERS is ‘security.’ Security for me, my wife and my entire family. I will be a third generation OPERS benefit recipient - following in the footsteps of both my parents and my grandmother. I have firsthand knowledge of the significance and value of receiving an OPERS pension and I am extremely proud to be a member.”
Who We Serve
16 2015 Popular Annual Financial Report
Brian McSweeney, Traffic Line Crew Supervisor, Ohio Department of Transportation – Member since 1986

Good for Ohio (continued)
$0 - $10 million
$10 - $15 million
$15 - $25 million
$25 - $50 million
$50 - $100 million
$100 million +
OPERS’ ECONOMIC IMPACT IN OHIO
Of the 205,581 retirees in OPERS, 184,513, or 90.0%, remain Ohio residents as of December 31, 2015. Pension benefit payments approaching $4.9 billion
this year were distributed throughout Ohio to retirees and their beneficiaries, representing OPERS’ impact on the state’s economy.
646670 6,762
603611
2,840
1,085
960 1,338
8111,045
922659385
457
1,806562
513
816
782
915
715
1,156
1,9741,015
4,275
21,294
7,6962,326
9081,058
6611,261
656
834 7,2412,264
2,138
1,298
3,038
23,477
728
1,433
2,167
562
602
1,511
2,701
1,404
1,231
4,876
3,162
1,207
3,572 1,607
2,726
3,680
1,159
494
980
381
1,127
366394
390
836
2,120
596
876
763
688
362
816
2,876
1,319824
8941,9134,117
7,822
1,735
827660
906
1,664
597
1,701
668
Adams
Allen Ashland
Ashtabula
Athens
Auglaize
Belmont
Brown
Butler
Carroll
Champaign
Clark
Clermont
Clinton
Columbiana
Coshocton
Crawford
Cuyahoga
Darke
De�ance
Delaware
Erie
Fair�eld
Fayette
Franklin
Fulton
Gallia
Geauga
Greene
Guernsey
Hamilton
Hancock
Hardin
Harrison
Henry
Highland
Hocking
Holmes
Huron
Jackson
Je�erson Knox
Lake
Lawrence
Licking
Logan
Lorain
Lucas
Madison
Mahoning
Marion
Medina
Meigs
Mercer
Miami
Monroe MontgomeryMorgan
Morrow
Muskingum
Noble
Ottawa
Paulding
Perry Pickaway
Pike
Portage
Preble
Putnam
Richland
Ross
Sandusky
Scioto
Seneca
Shelby
Stark
Summit
Trumbull
Tuscarawas
Union
Van Wert
Vinton
Warren Washington
Wayne
Williams
Wood
Wyandot
2015 Popular Annual Financial Report 17
2015 PENSION BENEFIT PAYMENTS AND RETIREES BY COUNTY

Good for Ohio (continued)
OPERS’ 2015 pension benefit payments to Ohio participants
(90% live in Ohio) $4.9 Billion
OPERS’ 2015 health care costs on behalf of retirees and their beneficiaries
$1.8 Billion
Assets invested with Ohio-based companies $1.4 Billion as of
December 31, 2015
Assets under management with Ohio-qualified investment managers
$1.4 Billion as of December 31, 2015
Fees paid in 2015 to in-state custodian and to Ohio-qualified investment
managers $11.5 Million
Assets under management by in-state custodian $85.9 Billionas of December 31, 2015
18 2015 Popular Annual Financial Report

Board of Trustees members as of January 2016OPERS management and staff work closely with the members of the OPERS Board of Trustees—the governing body of OPERS that is ultimately responsible for the administration and management
of all OPERS activities. This dedicated Board meets monthly and receives no compensation, but is reimbursed for necessary expenses.
Front row (left to right): Charles Latsa, Representative for Non-teaching College/University Employees; Robert C. Smith,Treasurer-Appointed Investment Expert; James Tilling, General Assembly Appointed Investment Expert
Standing: Patrick Smith, Designee for Robert Blair, Director of the Ohio Department of Administrative Services (StatutoryMember); Cinthia Sledz, Representative for Miscellaneous Employees and Board Chair; Christopher Mabe, Representativefor State Employees; Sean Loftus, Representative for County Employees; John W. Maurer, Representative for Retirees;Steve Toth, Representative for Retirees; Ken Thomas, Representative for Municipal Employees
Not Shown in Photo: Governor’s Appointee–Vacant
2015 Popular Annual Financial Report 19

This Popular Annual Financial Report is derived from information contained in the OPERS Comprehensive Annual Financial
Report (CAFR) for the year ended December 31, 2015, but does not contain detailed financial information by plan, nor is
it presented in a manner to conform to Generally Accepted Accounting Principles (GAAP). For a complete set of financial
definitions included in this summary report please refer to the OPERS CAFR, which is prepared in conformity with GAAP and
may be obtained by visiting our website at www.opers.org or by contacting OPERS to request a copy.
Additionally, those interested in learning more about the OPERS health care program are invited to obtain a copy of the
OPERS 2015 Health Care Report. That report is also available at www.opers.org as of June 30, 2016.
More information is always available.
By Phone: By Mail:
Member Services Center Ohio Public Employees Retirement System
1-800-222-PERS (7377) 277 E. Town St.
8 a.m. - 4:30 p.m. Monday-Friday Columbus, OH 43215
Online: Online Accounts:
www.opers.org https://member.opers.org
MissionTo provide secure retirement
benefits for our members.
VisionTo be your trusted retirement partner
delivering responsive high-quality service every time, all the time.


