2015 MPC Water Pipe Sizing - UMN CCAPS...Water Pipe Sizing Procedure Step 1 • Using Table 610.4,...
74
2015 Minnesota Plumbing Code Water Pipe Sizing Workshop
Transcript of 2015 MPC Water Pipe Sizing - UMN CCAPS...Water Pipe Sizing Procedure Step 1 • Using Table 610.4,...

2015 Minnesota Plumbing Code Water Pipe Sizing Workshop

2015 Minnesota Water Pipe Sizing Workshop
Copyright © 2016 IAPMO 1
Water Pipe Sizing Important Tables

2015 Minnesota Water Pipe Sizing Workshop
Copyright © 2016 IAPMO 2

2015 Minnesota Water Pipe Sizing Workshop
Copyright © 2016 IAPMO 3

2015 Minnesota Water Pipe Sizing Workshop
Copyright © 2016 IAPMO 4
Steps for Sizing Water Piping Water Pipe Sizing Procedure
Step 1 • Using Table 610.4, find the correct Pressure Range and Length Table to use.
Step 2 • The street service/meter and the building supply must be sized first. • This step establishes the largest pipe size required for the building.
Step 3
• Starting at the most remote cold water outlet in the system, size the main line back towards the meter, adding in the demand for each branch until the main line size equals the established building supply size.
• At this point the main line sizing is completed. • (Attention must be given to the location of the Water Heater supply branch
connection to the main line)
Step 4 • Size each branch and fixture supply. (Stay in same Length Column)
Determining Fixture Loads

2015 Minnesota Water Pipe Sizing Workshop
Copyright © 2016 IAPMO 5
Water Pipe Sizing Example – Private Use Directions: Identify the number of fixture units each numbered pipe segment and determine the correct sizing. The relevant tables needed for these calculations are provided on the previous pages. Your work table is on the following page.

2015 Minnesota Water Pipe Sizing Workshop
Copyright © 2016 IAPMO 6
Pipe Section
Fixture Units
Pipe Size
Pipe Section
Fixture Units
Pipe Size
Pipe Section
Fixture Units
Pipe Size
1 16 31
2 17 32
3 18 33
4 19 34
5 20 35
6 21 36
7 22 37
8 23 38
9 24 39
10 25 40
11 26 41
12 27 42
13 28 43
14 29 44
15 30 45
46
47
48
49
2015 Minnesota Water Pipe Sizing Workshop
Copyright © 2016 IAPMO 7
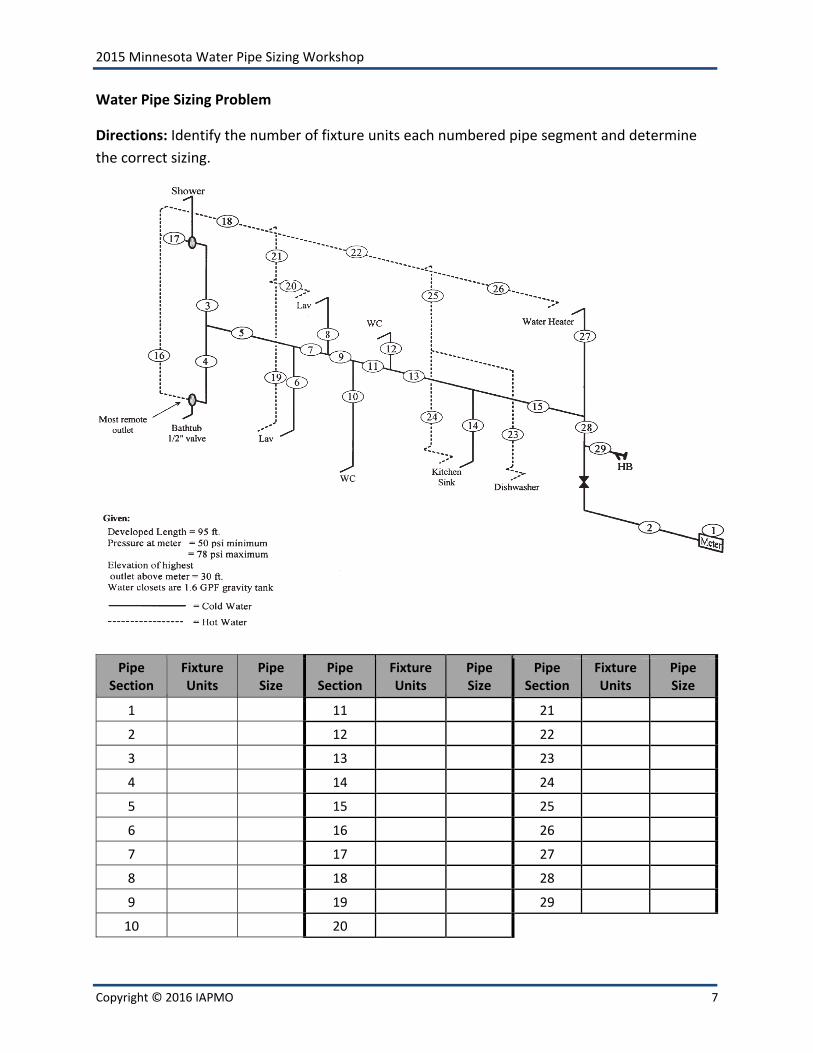
Water Pipe Sizing Problem
Directions: Identify the number of fixture units each numbered pipe segment and determine the correct sizing.
Pipe Section
Fixture Units
Pipe Size
Pipe Section
Fixture Units
Pipe Size
Pipe Section
Fixture Units
Pipe Size
1 11 21
2 12 22
3 13 23
4 14 24
5 15 25
6 16 26
7 17 27
8 18 28
9 19 29
10 20

2015 Minnesota Water Pipe Sizing Workshop
Copyright © 2016 IAPMO 8
Water Pipe Sizing Problem 2
Directions: Identify the number of fixture units each numbered pipe segment and determine the correct sizing. Your work table is located on the following page.

2015 Minnesota Water Pipe Sizing Workshop
Copyright © 2016 IAPMO 9
Pipe Section
Fixture Units Pipe Size Pipe
Section Fixture Units Pipe Size Pipe
Section Fixture Units Pipe Size Pipe
Section Fixture Units Pipe Size
1 16 31 46
2 17 32 47
3 18 33 48
4 19 34 49
5 20 35 50
6 21 36 51
7 22 37 52
8 23 38 53
9 24 39 54
10 25 40 55
11 26 41 56
12 27 42 57
13 28 43
14 29 44
15 30 45

2015 Minnesota Plumbing Code – DWV Sizing Workshop
Copyright © 2017 IAPMO 1
Drain Waste and Vent Sizing - Example
Directions: Identify the number of fixture units each numbered pipe segment and determine the correct sizing. The relevant tables needed for these calculations are provided on the following pages.

2015 Minnesota Plumbing Code – DWV Sizing Workshop
Copyright © 2017 IAPMO 2
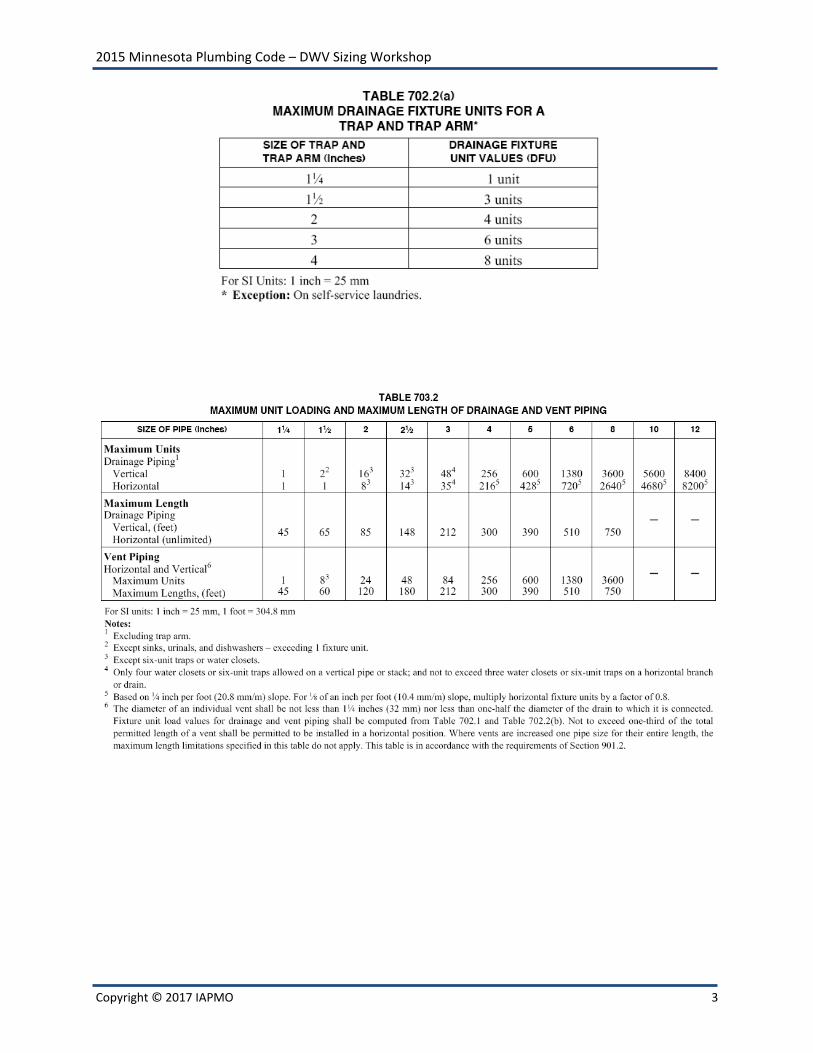
Important Tables
2015 Minnesota Plumbing Code – DWV Sizing Workshop
Copyright © 2017 IAPMO 3

2015 Minnesota Plumbing Code – DWV Sizing Workshop
Copyright © 2017 IAPMO 4
DWV Sizing Worksheet
Pipe
Section Fixture Units Pipe Size Pipe
Section Fixture Units Pipe Size Pipe
Section Fixture Units Pipe Size
1 16 31
2 17 32
3 18 33
4 19 34
5 20 35
6 21
7 22
8 23
9 24
10 25
11 26
12 27
13 28
14 29
15 30

2015 Minnesota Plumbing Code – DWV Sizing Workshop
Copyright © 2017 IAPMO 5
DWV Sizing Problem
Directions: Identify the number of fixture units each numbered pipe segment and determine the correct sizing.
Pipe Section Fixture Units Pipe Size
A
B
C
D
E
F
G
2015 Minnesota Plumbing Code – DWV Sizing Workshop
Copyright © 2017 IAPMO 6
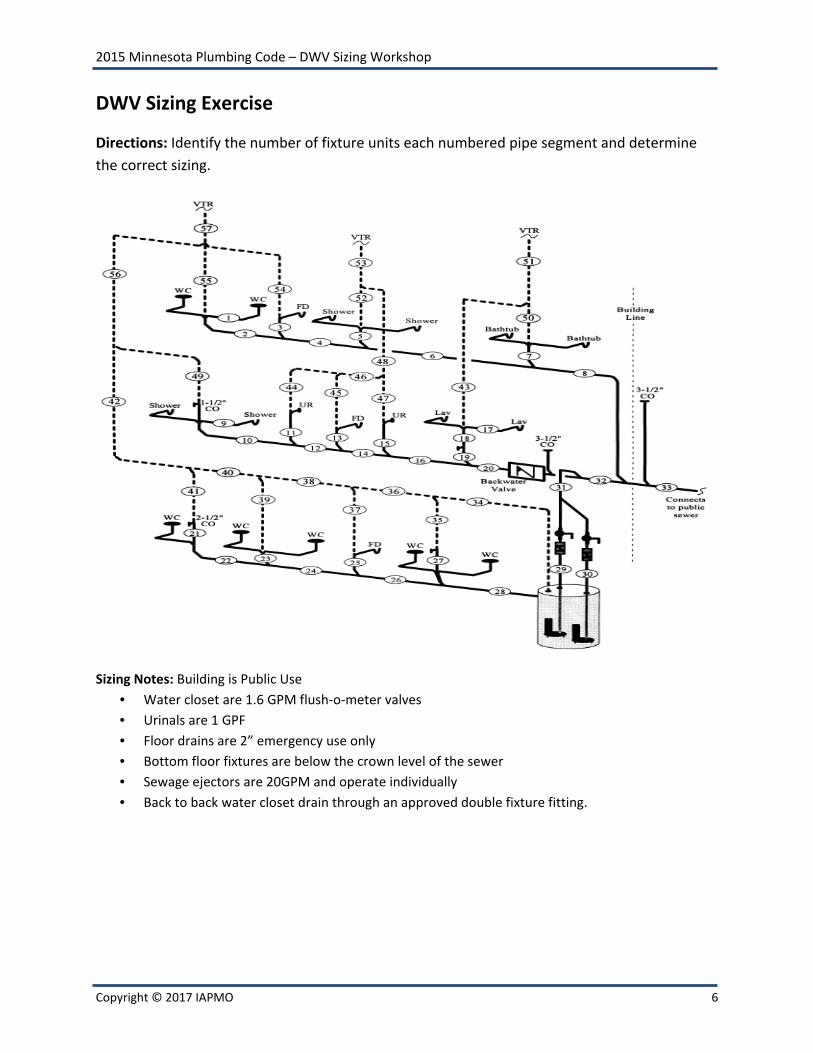
DWV Sizing Exercise
Directions: Identify the number of fixture units each numbered pipe segment and determine the correct sizing.
Sizing Notes: Building is Public Use • Water closet are 1.6 GPM flush-o-meter valves • Urinals are 1 GPF • Floor drains are 2” emergency use only • Bottom floor fixtures are below the crown level of the sewer • Sewage ejectors are 20GPM and operate individually • Back to back water closet drain through an approved double fixture fitting.

2015 Minnesota Plumbing Code – DWV Sizing Workshop
Copyright © 2017 IAPMO 7
DWV Sizing Worksheet
Pipe Section
Fixture Units Pipe Size Pipe
Section Fixture Units Pipe Size Pipe
Section Fixture Units Pipe Size Pipe
Section Fixture Units Pipe Size
1 16 31 46
2 17 32 47
3 18 33 48
4 19 34 49
5 20 35 50
6 21 36 51
7 22 37 52
8 23 38 53
9 24 39 54
10 25 40 55
11 26 41 56
12 27 42 57
13 28 43
14 29 44
15 30 45

2015 Minnesota Plumbing Code – DWV Sizing Workshop
Copyright © 2017 IAPMO 8

2015 Minnesota Plumbing Code – DWV Sizing Workshop
Copyright © 2017 IAPMO 1
Drain Waste and Vent Sizing - Example
Directions: Identify the number of fixture units each numbered pipe segment and determine the correct sizing. The relevant tables needed for these calculations are provided on the following pages.

2015 Minnesota Plumbing Code – DWV Sizing Workshop
Copyright © 2017 IAPMO 2
Important Tables

2015 Minnesota Plumbing Code – DWV Sizing Workshop
Copyright © 2017 IAPMO 3

2015 Minnesota Plumbing Code – DWV Sizing Workshop
Copyright © 2017 IAPMO 4
DWV Sizing Worksheet
Pipe
Section Fixture Units Pipe Size Pipe
Section Fixture Units Pipe Size Pipe
Section Fixture Units Pipe Size
1 16 31
2 17 32
3 18 33
4 19 34
5 20 35
6 21
7 22
8 23
9 24
10 25
11 26
12 27
13 28
14 29
15 30

2015 Minnesota Plumbing Code – DWV Sizing Workshop
Copyright © 2017 IAPMO 5
DWV Sizing Problem
Directions: Identify the number of fixture units each numbered pipe segment and determine the correct sizing.
Pipe Section Fixture Units Pipe Size
A
B
C
D
E
F
G

2015 Minnesota Plumbing Code – DWV Sizing Workshop
Copyright © 2017 IAPMO 6
DWV Sizing Exercise
Directions: Identify the number of fixture units each numbered pipe segment and determine the correct sizing.
Sizing Notes: Building is Public Use • Water closet are 1.6 GPM flush-o-meter valves • Urinals are 1 GPF • Floor drains are 2” emergency use only • Bottom floor fixtures are below the crown level of the sewer • Sewage ejectors are 20GPM and operate individually • Back to back water closet drain through an approved double fixture fitting.

2015 Minnesota Plumbing Code – DWV Sizing Workshop
Copyright © 2017 IAPMO 7
DWV Sizing Worksheet
Pipe Section
Fixture Units Pipe Size Pipe
Section Fixture Units Pipe Size Pipe
Section Fixture Units Pipe Size Pipe
Section Fixture Units Pipe Size
1 16 31 46
2 17 32 47
3 18 33 48
4 19 34 49
5 20 35 50
6 21 36 51
7 22 37 52
8 23 38 53
9 24 39 54
10 25 40 55
11 26 41 56
12 27 42 57
13 28 43
14 29 44
15 30 45

2015 Minnesota Plumbing Code – DWV Sizing Workshop
Copyright © 2017 IAPMO 8

Emerging Technology in the Plumbing and Mechanical Industries Emerging Technologies in Plumbing and Mechanical Systems
Overview
• Let’s examine new technologies in the Plumbing and Mechanical Industry!
• Discuss how these new products affect our bottom line
• Can sustainability be achieved without causing unintended consequences to health and safety?
• How will we approach these changes?
Complicated Times
• Water Conservation
• Energy Conservation
• Sustainability
• Comforts and Expectations
• New Laws and Regulations
• Health and Well Being
When we see new innovative products and installations on the jobsite we do one of three things:
New Product Inspections
• I’ve never seen that – Red Tag it!!

New Product Inspections
• I’ve never seen that – COVER IT UP!!
New Product Inspections
• I’ve never seen that – tell me more, show me how this works and is in compliance with the code!
301.2 Alternate Materials and Methods of ConstructionEquivalencyNothing in this code is intended to preventthe use of systems, methods, or devices of equivalent or superior quality, strength, fire resistance, effectiveness, durability, and safety over those prescribed by this code. Technical documentation shall be submitted to the Authority Having Jurisdiction to demonstrate equivalency. The AHJ shall have the authority to approve or disapprove the system, method, or device for the intended purpose.
Let’s look at some new plumbing product innovations…..
“Reinvent the Toilet” Challenge

• The Reinvent the Toilet Challenge aims to create a toilet that:– Removes germs from human waste and recovers
valuable resources such as energy, clean water, and nutrients.
– Operates “off the grid” without connections to water, sewer, or electrical lines.
– Costs less than US$.05 cents per user per day.– Promotes sustainable and financially profitable
sanitation services and businesses that operate in poor, urban settings.
– Is a truly aspirational next-generation product that everyone will want to use—in developed as well as developing nations.
• The Caltech system is an onsite electrochemical wastewater treatment and recycling unit that can be powered by solar panels
Royal Society of the Arts
• an improved design of the toilet (e.g. sit type, squat type, hybrid) that creates a positive everyday experience for someone with a disability or impairment
• an intuitive flush operation mechanism requiring minimal instructions
• ideas to minimize misuse and abuse of the toilet e.g. theft and vandalism
• designs which improve personal safety, particularly for vulnerable users e.g. females, older people
• intuitive design that encourages minimal hand contact and good hygiene
• designs which focus on privacy e.g. aural, visual and odour• an improved design in terms of cleaning and maintenance
Wellbeing Toilet

The “IOTA”

Urinal Video Game Urinal Alcohol Level Detector
Analyzer Sensor

Thermostatically Activated Flow Control Valve
• Self actuating thermostatic balancing valve controls temperature

Thermostatically and Continuously Adjusting the Return Flow Rate to
maintain water temperature
Located at the end of each hot
water supply branch
downstream of the last fixture.
Controlling the Return Water Flow where a
traditional balancing valve or circuit setter
would be located.
• Thermostatically Self-Adjusting the Return Water Flow Rate to maintain the water temperature.
• Increasing the Return Flow of water that Cools below the specified set-point.
• Reducing the Return Flow of water that is still Hot.
• Conserving Energy and Water by only reheating water that needs heating, and minimizing water waste from waiting for hot water to get to the tap.
Self-adjusting thermostatically
controlled balancing valves compensate for a
wide variety of changing variables in a DHW system
Tankless Technology

Proximity Sensing
Water Conservation & Reuse
What ways does your area conserve, capture and reuse water?

Water Conservation & Reuse
We are continually finding new ways to reuse and recycle water
Water Conservation & Reuse
Greywater Treatment

Let’s look at some enginnering innovations…..
• What about making water out of thin air?

KEMPER Potable Water Hygiene System
67
Siphonic Roof Drains
Grease Interceptor Bioremediation

BlueBot™ Element (Aerobic) to remediate wastewater component, stabilize biofuel (preventing hydrolysis) and biologically reduce sulfur and phosphorus, heavy metals and other contaminants
Smart Phone App based Monitoring and Control (24/7)
Super Energy Efficient Components
(50 Watts/element - $3.60/month)
Custom Microbial blends
CleanBlu® How it works
Why CleanBlu®?
CleanBlu® solution Current solution
First and only commercially and technically viable method to convert brown-grease into Biodiesel
Automated process, email notification when biofuel is ready for collection and transportation
Allows complete conversion of FOG into Biodiesel
Shredder Mix System for Grease Interceptors

Let’s look at some new mechanical innovations…..
Radiant Heating Ceiling Drywall

Contour Crafting 3D Printing
Contour Crafting 3D Printing
Charles Darwin
“It is not the strongest of the species that survives, nor the most intelligent that survives. It is the one that is most adaptable to change.In the struggle for survival, the fittest win out at the expense of their rivals because they succeed in adapting themselves best to their environment.”
Discussion
• Any new technologies your jurisdiction or demographic is seeing?
Questions?

12/15/2017
1
“Is Our Water Supply Vulnerable to Terrorism?
How It Can Be Protected.”
1
Daniel W. Rademacher
Own and operate Plumbing Code and Design Consulting, LLC www.pcdconsultingservices.com
Employed 6 years as Plumbing/Mechanical Designer III for a national A & E firm. Served as the Chief Plumbing/Mechanical Inspector for the State of Montana for
8 years. Served as a Plumbing/Mechanical Inspector for 2 years. Licensed Plumber. UA Journeyman & Apprentice Instructor. ASSE Instructor for Backflow Assemblies Testing and Cross Connection
Inspection and Surveys. Serve on the ASSE Product Standards Committee and Professional
Qualifications Standards Committee NITC Med-Gas Certifications and Inspections. American Society of Plumbing Engineers. National Seminar Instructor for IAPMO. Serve on the IAPMO Education and Training Committee. 2014 IAPMO “Industry Person of the Year” Award Recipient. IAPMO Certified Plumbing/Mechanical Inspector
2
3
BREAKS AND CELL PHONES
• PLEASE FEEL FREE TO USE THE BATHROOM AT ANYTIME.
• PLEASE TURN YOUR CELL PHONE TO SILENT MODE.
12/15/2017
2
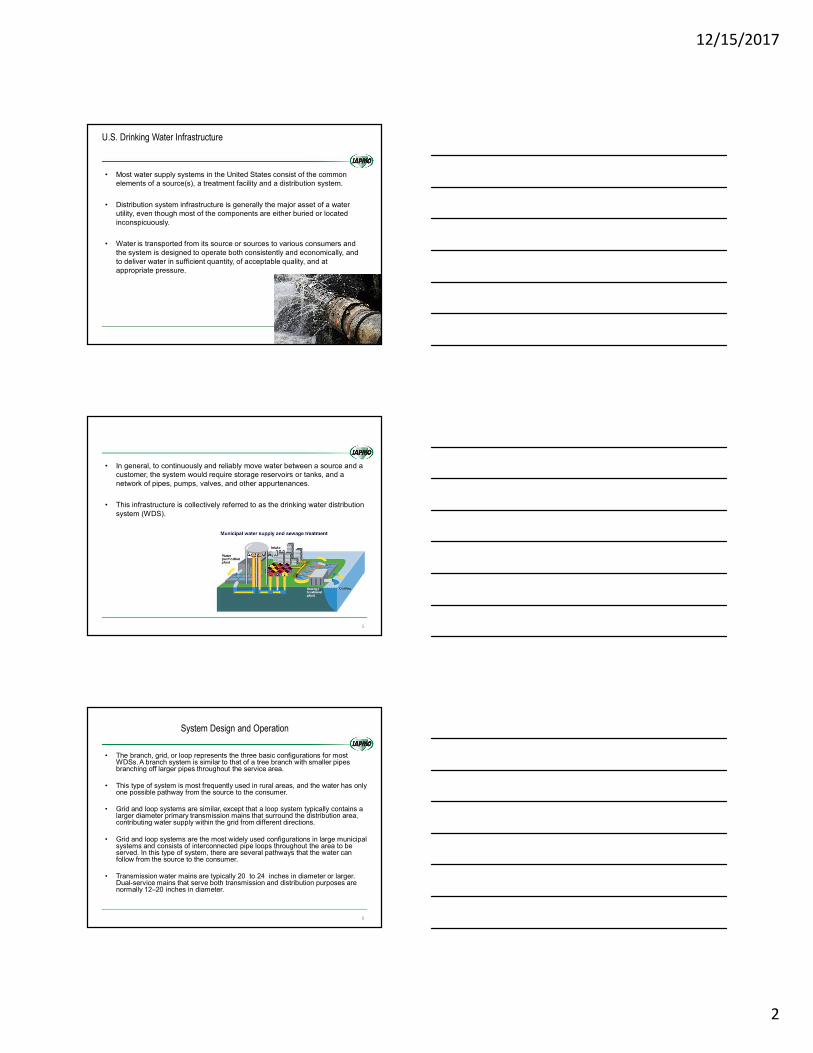
U.S. Drinking Water Infrastructure
• Most water supply systems in the United States consist of the common elements of a source(s), a treatment facility and a distribution system.
• Distribution system infrastructure is generally the major asset of a water utility, even though most of the components are either buried or located inconspicuously.
• Water is transported from its source or sources to various consumers and the system is designed to operate both consistently and economically, and to deliver water in sufficient quantity, of acceptable quality, and at appropriate pressure.
• In general, to continuously and reliably move water between a source and a customer, the system would require storage reservoirs or tanks, and a network of pipes, pumps, valves, and other appurtenances.
• This infrastructure is collectively referred to as the drinking water distribution system (WDS).
5
System Design and Operation
• The branch, grid, or loop represents the three basic configurations for most WDSs. A branch system is similar to that of a tree branch with smaller pipes branching off larger pipes throughout the service area.
• This type of system is most frequently used in rural areas, and the water has only one possible pathway from the source to the consumer.
• Grid and loop systems are similar, except that a loop system typically contains a larger diameter primary transmission mains that surround the distribution area, contributing water supply within the grid from different directions.
• Grid and loop systems are the most widely used configurations in large municipal systems and consists of interconnected pipe loops throughout the area to be served. In this type of system, there are several pathways that the water can follow from the source to the consumer.
• Transmission water mains are typically 20 to 24 inches in diameter or larger. Dual-service mains that serve both transmission and distribution purposes are normally 12–20 inches in diameter.
6
12/15/2017
3
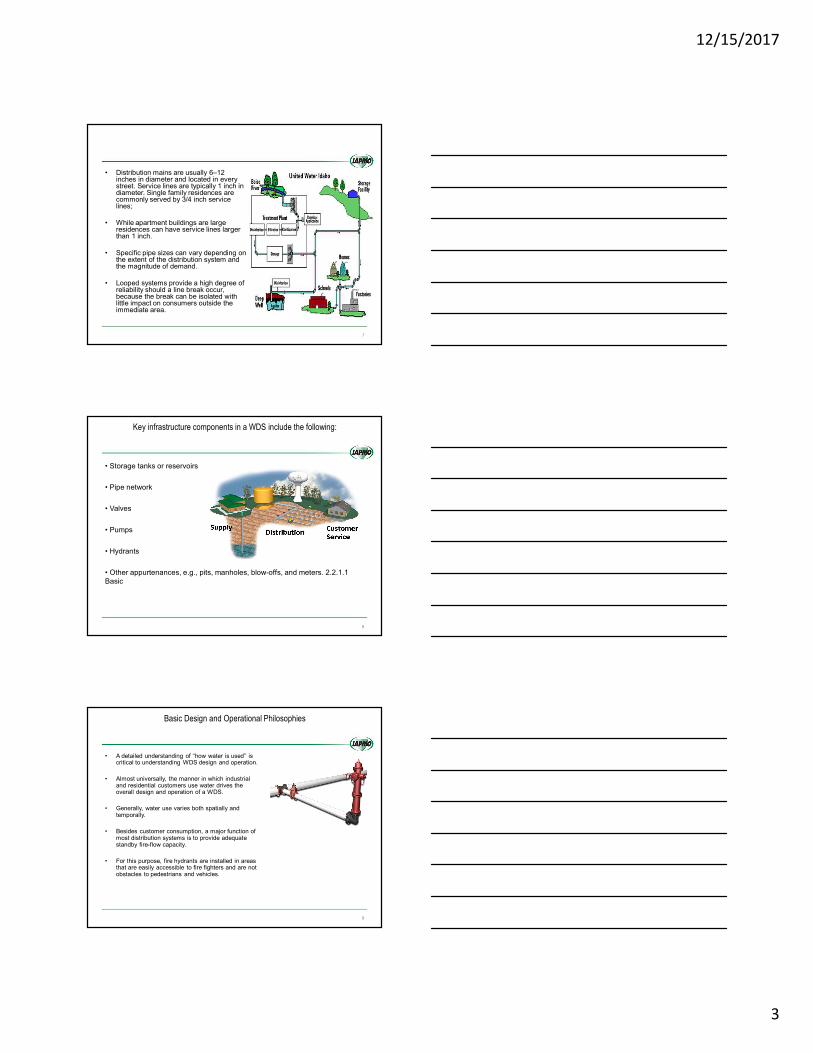
• Distribution mains are usually 6–12 inches in diameter and located in every street. Service lines are typically 1 inch in diameter. Single family residences are commonly served by 3/4 inch service lines;
• While apartment buildings are large residences can have service lines larger than 1 inch.
• Specific pipe sizes can vary depending on the extent of the distribution system and the magnitude of demand.
• Looped systems provide a high degree of reliability should a line break occur, because the break can be isolated with little impact on consumers outside the immediate area.
7
Key infrastructure components in a WDS include the following:
• Storage tanks or reservoirs
• Pipe network
• Valves
• Pumps
• Hydrants
• Other appurtenances, e.g., pits, manholes, blow-offs, and meters. 2.2.1.1 Basic
8
Basic Design and Operational Philosophies
• A detailed understanding of ‘‘how water is used’’ is critical to understanding WDS design and operation.
• Almost universally, the manner in which industrial and residential customers use water drives the overall design and operation of a WDS.
• Generally, water use varies both spatially and temporally.
• Besides customer consumption, a major function of most distribution systems is to provide adequate standby fire-flow capacity.
• For this purpose, fire hydrants are installed in areas that are easily accessible to fire fighters and are not obstacles to pedestrians and vehicles.
9

12/15/2017
4
• The ready-to-serve requirements for firefighting are governed by the National Fire Protection Association (NFPA), which establishes standards for fire-fighting capacity of distribution systems (NFPA 2003).
• In order to satisfy this need for adequate standby capacity and pressure (as mentioned earlier), most distribution systems use standpipes, elevated tanks, and large storage reservoirs.
• Additionally, most large distribution systems are ‘‘zoned.’’ Zones are areas or sections of a distribution system of relatively constant elevation.
• Zones can be used to maintain relatively constant pressures in the system over a range of ground elevations. Sometimes, zone development occurs as a result of the manner in which the system has expanded.
• Supervisory Control and Data Acquisition (SCADA) systems are key components in operating water distribution networks and have become standard for all medium to large drinking water utilities.
10
11
SCADA Systems
• As with society in general, the use of computer technology in water and waste water technology has become increasingly prevalent.
• The computer systems for most medium to large water utilities typically include the financial system, the Human Resource system, Laboratory Information Management Systems (LIMS), SCADA systems, and Computerized Maintenance Management Systems (CMMS).
• SCADA systems are generally run by the utility itself and are available on a 24 h a day, 7 days a week basis. SCADA systems are a computer-controlled type of industrial control system (ICS) that monitors and controls physical industrial processes.
• SCADA systems historically distinguish themselves from other ICS systems by being integrated into large-scale processes that can include multiple sites and large distances.
• These processes include industrial, infrastructure, and facility-based processes.
12

12/15/2017
5
A water utility SCADA system usuallyconsists of:
• A human–machine interface (HMI) through which the human operator monitors and controls the process
• A supervisory (computer) system, gathering (acquiring) data on the process and sending commands (control) to the process
• Remote terminal units (RTUs) connecting to sensors in the process, and sending digital data to the supervisory system
• Programmable logic controllers (PLCs), which are more economical, versatile, flexible, and configurable than special-purpose RTUs
• Communication infrastructure connecting the supervisory system to the RTUs
• Various process and analytical instrumentation
13
Size and Distribution of U.S. Drinking Water Utilities
• Water utilities in the United States vary greatly in size, ownership, and type of operation.
• The Safe Drinking Water Act (SDWA 1974) defines public water systems as consisting of community water supply systems; transient, noncommunity water supply (TNCWS) systems; and nontransient, noncommunity water supply (NTNCWS) systems.
• A community water supply system serves year-round residents and ranges in size from those that serve as few as 25 people to those that serve several million.
• A TNCWS system serves areas such as campgrounds or gas stations where people do not remain for a long period of time.
14
• Some utilities rely primarily on surface water supplies while others rely primarily on groundwater.
• Surface water is the primary source for 22 % of the community water supply systems, while groundwater is used by 78 % of community water supply systems.
• Of the noncommunity water supply systems (both transient and nontransient), 97 % are served by groundwater.
• Many systems serve communities using multiple sources of supply such as a combination of groundwater and surface water sources.
• In a grid/looped system, the mixing of water from different sources can have a detrimental influence on water quality, including taste and odor, in the distribution system.
15

12/15/2017
6
Vulnerable Characteristics of U.S. Water SupplySystems to Intentional Threats
• Water systems are vulnerable to a range of intentional threats including physical disruption, contamination, and cyber attack.
• Vulnerable implies the existence of a threat , as ‘‘a potential adversarial intent to cause harm or damage by adversely changing the states of the system.’’
• Similarly, again in the context of terrorism, vulnerability is to be the ‘‘manifestation of the inherent states of a system
• (e.g., physical, technical, organizational, and cultural) that can be exploited by an adversary to cause harm or damage.’’
16
• Vulnerable characteristics of water systems include their physical attributes, e.g., reservoirs, tanks, and pump stations.
• The distribution system itself may be vulnerable to sabotage or intentional contamination.
• The ‘‘trusted insider’’ is a potential threat because he or she has presumably extensive knowledge of the water system and its operation, and, therefore, capability.
• The largest water systems, i.e., those supporting the largest populations, are believed to be the most vulnerable water systems to attack.
17
• In addition to physical attributes, a water utility’s SCADA could be vulnerable to cyber attack, for example, turning pumps on or off, filling or emptying tanks inappropriately, or causing water hammer events.
• Cyber attacks could also affect the administrative side of the water system business or operation creating confusion by straining already-strained resources and possibly leading to denial of service for some or possibly leading to compromised water quality.
18
12/15/2017
7
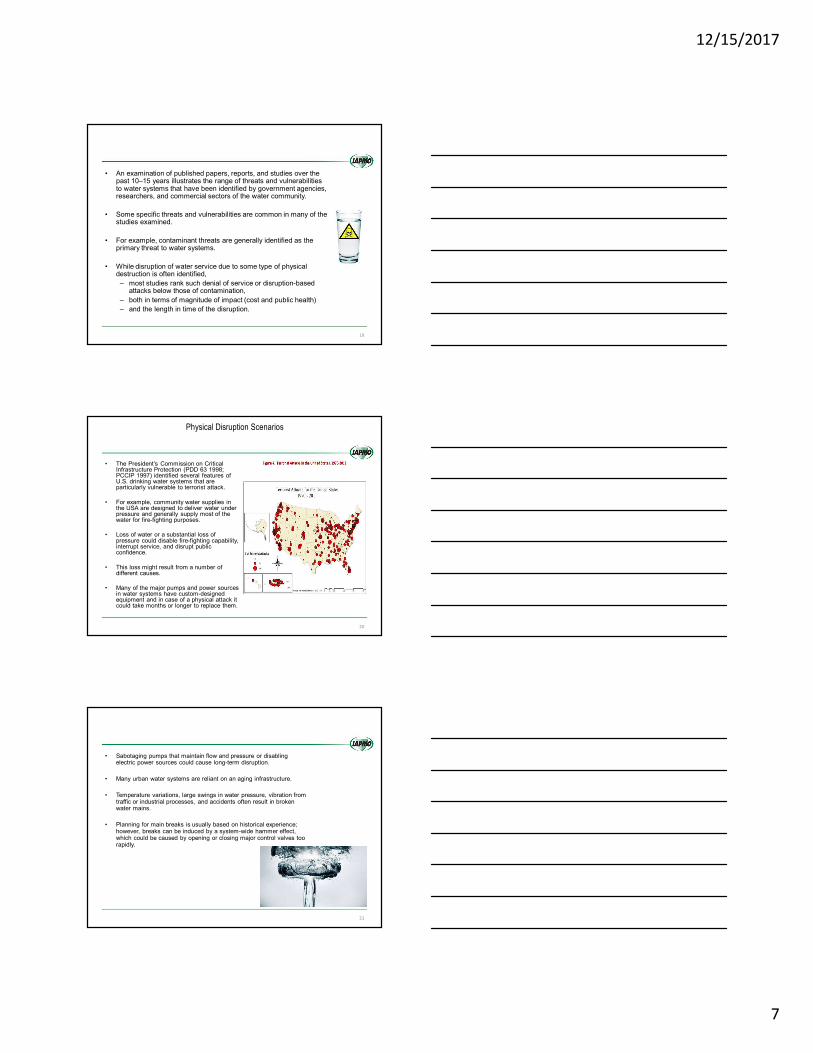
• An examination of published papers, reports, and studies over the past 10–15 years illustrates the range of threats and vulnerabilities to water systems that have been identified by government agencies, researchers, and commercial sectors of the water community.
• Some specific threats and vulnerabilities are common in many of the studies examined.
• For example, contaminant threats are generally identified as the primary threat to water systems.
• While disruption of water service due to some type of physical destruction is often identified, – most studies rank such denial of service or disruption-based
attacks below those of contamination, – both in terms of magnitude of impact (cost and public health) – and the length in time of the disruption.
19
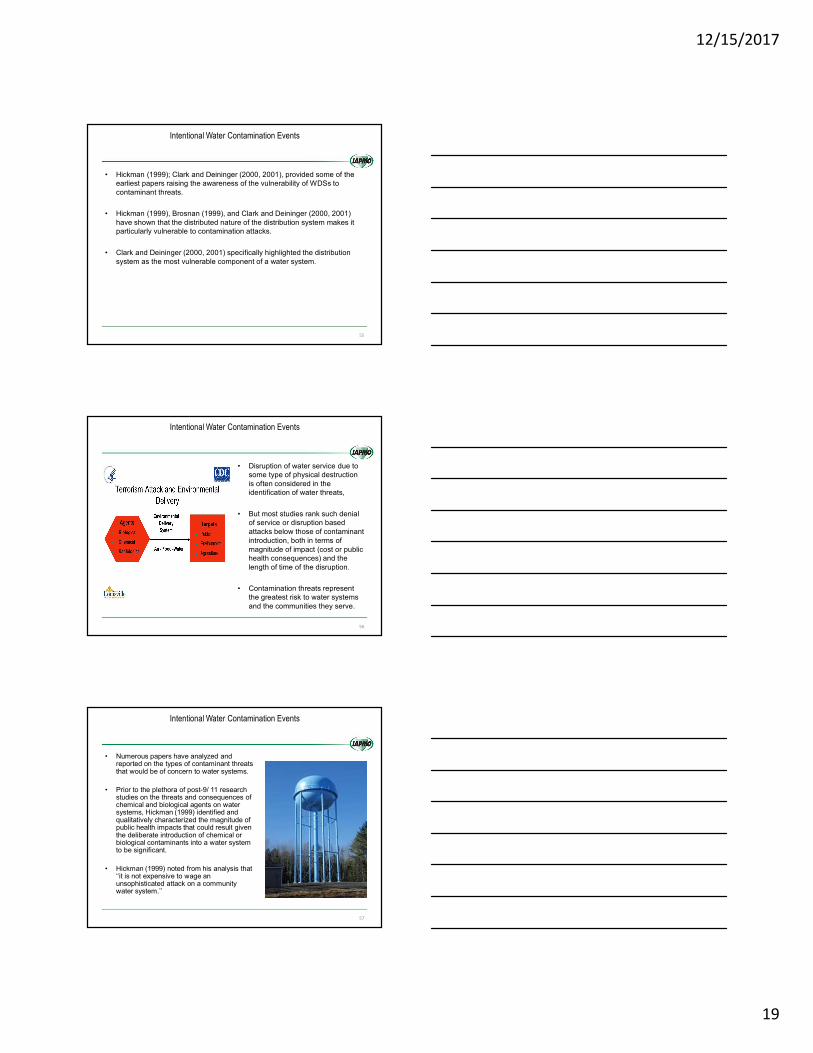
Physical Disruption Scenarios
• The President’s Commission on Critical Infrastructure Protection (PDD 63 1998; PCCIP 1997) identified several features of U.S. drinking water systems that are particularly vulnerable to terrorist attack.
• For example, community water supplies in the USA are designed to deliver water under pressure and generally supply most of the water for fire-fighting purposes.
• Loss of water or a substantial loss of pressure could disable fire-fighting capability, interrupt service, and disrupt public confidence.
• This loss might result from a number of different causes.
• Many of the major pumps and power sources in water systems have custom-designed equipment and in case of a physical attack it could take months or longer to replace them.
20
• Sabotaging pumps that maintain flow and pressure or disabling electric power sources could cause long-term disruption.
• Many urban water systems are reliant on an aging infrastructure.
• Temperature variations, large swings in water pressure, vibration from traffic or industrial processes, and accidents often result in broken water mains.
• Planning for main breaks is usually based on historical experience; however, breaks can be induced by a system-wide hammer effect, which could be caused by opening or closing major control valves too rapidly.
21

12/15/2017
8
• This could result in simultaneous main breaks that might exceed the community’s capability to respond in a timely manner, causing widespread outages.
• Recognizing this vulnerability, water systems have been incorporating valves that cannot be opened or closed rapidly.
• However, many urban systems still have valves that could cause severe water hammer effects. Interrupting the water flow to agricultural and industrial users could have large economic consequences.
• For example, the California aqueduct, which carries water from northern parts of the state to the Los Angeles/San Diego area, also serves to irrigate the agricultural areas in mid-state.
• Pumping stations are used to maintain the flow of water.
22
• Loss of irrigation water for a growing season, even in years of normal rainfall, would likely result in billions of dollars of loss to California and significant losses to U.S. agricultural exports.
• Another problem associated with many community water systems is the potential for release of chlorine to the air.
• Most water systems use gaseous chlorine as a disinfectant, which is normally delivered and stored in railway tank cars.
• Generally, there is only minimal protection against access to these cars.
• The release of chlorine gas, whether intentional or unintentional, could injure nearby populations.
23
Examples of Unintentional Contamination
• Pressure transient regimes are inevitable because all systems will, at some time, be started up, switched off, or undergo rapid flow changes such as those caused by hydrant flushing.
• They will also likely experience the effects of human errors, equipment breakdowns, earthquakes, or other risky disturbances.
• Intrusion occurrences in live distribution systems and observed 15 surge events that resulted in a negative pressure.
• Negative pressure transients can occur in the distribution system and that the intruded water can travel downstream from the site of entry.
• In fact, soil and water samples were collected adjacent to drinking water pipelines and then tested for occurrence of total and fecal coliforms, Clostridium perfringens, Bacillus subtilis, coliphage, and enteric viruses.
• The microorganisms and enteric viruses were detected in more than 50 % of the samples examined.
24

12/15/2017
9
Milwaukee, Wisconsin, USA
• In 1993, Milwaukee, Wisconsin, experienced the largest waterborne disease outbreak in documented United States history.
• The etiological agent was determined to be the Cryptosporidium protozoan.
• In combination with the simultaneous occurrence of frozen ground conditions, recent storms resulted in high levels of surface water runoff while changes in the normal treatment protocols were being introduced were the probable causes of the outbreak.
• The source of the organism was never officially identified but it was suspected to be caused by the cattle genotype due to runoff from pastures or possibly discharges from a sewage treatment plant outlet two miles upstream in Lake Michigan.
• The Centers for Disease Control and Prevention (CDC) showed that this outbreak was caused by Cryptosporidium oocysts that passed through the filtration system of one of the city’s water-treatment plants.
• Over the span of approximately 2 weeks, 403,000 of an estimated 1.61 million residents in the Milwaukee area (of which 880,000 were served by the malfunctioning treatment plant) became ill with the stomach cramps, fever, diarrhea, and dehydration caused by the pathogen.
• At least 104 deaths have been attributed to this outbreak, mostly among elderly and immuno-compromised people.
25
Cabool, Missouri, USA
• Cabool, Missouri, a town of approximately 2,100 people, located in the Southeastern corner of Missouri, experienced a large outbreak of Escherichia coli during the winter of 1989–1990.
• The waterborne disease outbreak resulted in 243 cases, with 32 hospitalizations and 4 deaths.
• This was the largest waterborne outbreak of E. coli O157:H7 that had been reported in the United States at the time.
• A precursor model to EPANET WDS modeling software package was applied to examine the movement of water and contaminants in the system.
• (EPANET is a public sector model that can simulate hydraulic and water quality transport of drinking water networks.)
• The modeling effort revealed that the pattern of illness occurrence was consistent with water movement patterns in the distribution system assuming two water line breaks.
• It was concluded, therefore, that some disturbance in the system, possibly the two line breaks and simultaneous meter replacements, allowed contamination to enter the water system.
• Analysis showed that the simulated contaminant movement covered 85 % of the infected population.
26
Gideon Missouri, USA
• In 1993, the town of Gideon, Missouri, located in a rural, agricultural area, suffered an outbreak of salmonellosis that ultimately affected more than 650 people and caused 7 deaths.
• At the time of the outbreak, Gideon had a population of 1,100. In early November, the town water system had experienced a major taste and odor event.
• In response, the water system was systematically flushed on November 10.
• The first cases of acute gastroenteritis were reported on November 29 and diagnosed as Salmonella typhimurium.
• However, the outbreak investigation later revealed that diarrhea cases in Gideon started around November 12 with a peak incidence around November 20.
27

12/15/2017
10
• By early December, there was a 250 % increase in absenteeism in the Gideon schools and a 600 % increase in anti-diarrheal medication sales.
• Over 40 % of nursing home residents suffered from diarrhea and seven people died.
• The U.S. EPA was requested to conduct a field study by the Missouri Department of Health (MDOH) and the CDC in early January of 1994.
• The study utilized water quality modeling to reach the conclusion that the contamination source was bird droppings in the city’s largest municipal tank.
• The tank’s hatches had severely deteriorated leaving the surface of the water open to contamination by roosting birds.
28
Walkerton Ontario, Canada
• The first documented outbreak of Escherichia coli 0157:H7 and Campylobacter spp. bacterial gastroenteritis associated with a municipal water supply in Canada occurred in the small rural town of Walkerton, Ontario (population 1261) in May 2000.
• At the time of the outbreak, the town’s drinking water was supplied by three wells (Wells 5, 6, and 7), which fed a common distribution system.
• In order to understand the factors that caused the outbreak, a water quality model of the Walkerton WDS was developed.
• Using a cross-sectional study, it was demonstrated that during the outbreak, residents living in homes connected to the municipal water supply and consuming Walkerton water were 11.7 times more likely to have developed gastroenteritis than those not exposed to Walkerton water.
29
• Modeling of the Walkerton water system required estimations of the following parameters for use in the water quality model:
• Pipe diameter and length, location, age, and composition of all water pipes
• Size, storage capacity, and active volumes of the two stand pipes (water towers) in the system
• Well pump specifications (including pump curves)
• Pipe friction
30

12/15/2017
11
• The results of this study clearly supported the hypothesis that Well 5 was likely the only well involved in the Walkerton E. coli/Campylobacter waterborne outbreak.
• The results also suggested that an extreme rainfall event, which occurred just prior to the peak of the outbreak, may have played a significant role in the propagation of the contaminants.
• The primary cause of the contamination event, however, was human negligence.
• The Well 5 chlorinator was not working prior to the outbreak and the responsible operator knew it, but did not report nor correct the problem.
31
Examples of Intentional Contamination
• Attacks on water supply systems have been recorded as long as 4,500 years ago.
• Significant harm to public health could be caused by introducing chemical or biological agents into drinking water supplies and the distribution system.
• With the internet and a small amount of money is all that is needed for an act of terrorism.
• Tanks, reservoirs, and the distribution system are key vulnerabilities.
• Allmann and Carlson (2005) showed how commercially available distribution system modeling tools could be used to study intentional contamination events and demonstrated
• That service connections and fire hydrants were likely the most vulnerable components of the water system.
32
World Wide Acts of Terrorism on Public Water Systems
• In 1992 The Kurdistan Workers' Party (PKK) put lethal concentrations of potassium cyanide in the water tanks of a Turkish Air Force compound in Istanbul.
• In 2000, workers at the Cellatex chemical plant in northern France dumped 5000 liters of sulfuric acid into a tributary of the Meuse River when they were denied workers’ benefits.
• In 2000 in Queensland, Australia, police arrested a man for using a computer and radio transmitter to take control of the Maroochy Shirewastewater system and release sewage into parks, rivers and property
33

12/15/2017
12
• In Lusaka, Zambia, in 1999, a bomb destroyed the main water pipeline, cutting off water for the city 3 million.
• In 2001 Water flow to Kumanovo (population 100,000) was cut off for 12 days in conflict between ethnic Albanians and Macedonian forces.
• The Revolutionary Armed Forces of Colombia (FARC) detonated a bomb inside a tunnel in the Chingaza Dam, which provides most of Bogotá’s water.
• Four incendiary devices were found in the pumping station of a Michigan water-bottling plant. The Earth Liberation Front (ELF) claimed responsibility, accusing Ice Mountain WaterCompany of stealing water for profit.
• In 2003 Jordanian authorities arrested Iraqi agents in connection with a failed plot to poison the water supply that serves American troops in the eastern Jordanian desert near the border with Iraq.
• In 2006 Tamil Tiger rebels cut the water supply to government-held villages in northeastern Sri Lanka. Sri Lankan government forces then launched attacks on the reservoir, declaring the Tamil actions to be terrorism
34
• The following two case studies are examples of intentional contamination events in a water system.
• It is noteworthy that in the first example the perpetrators were able to culture the bacterium in their own laboratory.
• The second example illustrates that a small amount of a pesticide can be strategically placed to cause a significant amount of damage and loss of service.
35
The Dalles, Oregon, USA
• In 1984, the Rajneeshee religious cult, using vials of the highly toxic bacterium S. typhimurium [S. enterica serovar Typhimurium], attempted to contaminate a water supply tank and salad bars in a number of area restaurants in The Dalles, Oregon.
• Their intent was to cause massive causalities or widespread panic.
36

12/15/2017
13
• The attack resulted in a community outbreak of salmonellosis in which at least 751 cases were documented in a county that typically reports fewer than 5 cases per year.
• It is not clear if the WDS was chlorinated or what role, if any, disinfectant played in possibly mitigating the consequences from the contamination event.
• The cult apparently cultured the organisms in their own laboratories.
37
Pittsburgh, Pennsylvania, USA
• In 1980 in Pittsburgh, Pennsylvania, an unknown perpetrator introduced chlordane into the Pittsburgh distribution system.
• The insecticide was injected at an isolated valve location on a large distribution main feeding, an area of the distribution system of Pittsburgh.
• The contamination event affected an area of the distribution system serving approximately 10,500 people.
38
• It was thought that eight or more gallons of commercial grade chlordane were introduced into the system.
• The highest measured concentrations of chlordane were 144,000 ug/L and the estimated average concentration across the 2,000 plus customers was estimated to be about 100 ug/L,
• Which was about 50 times the maximum contaminant level (MCL) permitted for chlordane in drinking water.
39

12/15/2017
14
• The event was first discovered and reported to the utility by customers experiencing taste and odor problems with their tap water.
• The utility quickly recognized that there was a water contamination problem due to the number and location of the complaints and, as a result, dispatched personnel to investigate.
• Utility personnel quickly confirmed (odor was easy to confirm) that there was a contamination event and the likely contaminant was a pesticide.
• Public health and water utility officials issued a warning through various outlets, i.e., radio, television, and newspaper, to water customers, ‘‘do not drink or cook with water until further notice”.
40
• Subsequent sampling and analysis found chlordane concentrations at or above 1 mg/L in many locations .
• The utility sought to quickly contain the event, closing valves in order to prevent the contamination from reaching a storage tank.
• The utility requested and received permission from public health and regulatory officials to initiate hydrant flushing of the pesticide contaminated water to storm sewers in the identified area.
• After the contamination was believed to be contained, restoration plans were developed and implemented.
• Water usage was restored in 1 month, but 9 months of flushing and monitoring were required prior to the release of the water for unrestricted use and some residential appliances and selected pipes had to be replaced.
41
• The utility and public health officials initially considered shutting down the water system instead of issuing the ‘‘do not use for drinking or cooking’’ order, but the problems associated with no water for sanitation or fire fighting were deemed too critical.
• Alternative drinking water was brought in and administered from various locations throughout the contaminated area, especially for residences experiencing high concentrations of chlordane.
• Additionally, people with sensitive skin were offered the opportunity to bathe nearby but outside the contaminated area.
42

12/15/2017
15
• The first action level established was to allow bathing when chlordane concentration dropped sufficiently (below 10 ug/L).
• Chlordane concentration of 10 ug/L was identified as the odor detection limit for chlordane in heated water.
• Public health officials allowed drinking and cooking when chlordane concentration dropped below 3 ug/L. However, 3 ug/L was only allowed for 1 month in order to minimize exposure.
• Additional target action levels were set as the system was flushed and restored, specifically 1 ug/L a month after establishing the 3 ug/L action level, 0.2 ug/L within 2 months, and no greater than the 0.05 ug/ L within about 7 months from the start of the event.
43
• The chlordane incident in Pittsburgh is noteworthy in that extended flushing and intensive monitoring do not tell the whole story.
• In some cases, customer plumbing was replaced.
• Such decisions seemed to be based on cost-benefit calculations.
• Health authorities established progressively lower action levels during the course of the restoration to ensure that customer exposure was minimized.
• Monitoring continued for months after the system had been restored to unrestricted use.
44
Cybersecurity
• Growth in the use of the Internet throughout the world has dramatically changed the way that both private and public sectors organizations communicate and conduct business.
• Although it was originally developed by the U.S. Department of Defense, the vast majority of the Internet is owned and operated by various entitles in the public and private sectors.
• It is becoming increasingly recognized that all countries need to prepare for the potential of debilitating Internet disruptions.
45

12/15/2017
16
• Therefore in the USA, the Department of Homeland Security (DHS) at the Federal level has been assigned to develop an integrated public/private plan for Internet recovery, should it be impaired.
• The U.S. Government Accountability Office (GAO) was asked to
– (1) identify examples of major disruptions to the Internet,
– (2) identify the primary laws and regulations governing recovery of the Internet in the event of a major disruption,
– (3) evaluate DHS plans for facilitating recovery from Internet disruptions, and
– (4) assess challenges to such efforts.
46
The Threat of Terrorism to Urban Water Systems
• As discussed previously, it has become generally accepted that water systems and their customers are vulnerable to terrorist attacks.
• The President’s Commission on Critical Infrastructure (PDD 63 1998) was formed to evaluate the vulnerability of the nation’s critical infrastructure to internal and external terrorism and has highlighted this issue.
• There are a wide range of vulnerabilities associated with municipal water systems including the expansive and spatially distributed infrastructure that can easily be damaged or sabotaged through:
– physical destruction,
– cyber attack or control,
– or through the introduction of contamination.
47
• As Beering (2002) points out, ‘‘Threats must be analyzed ‘in perspective’.’’
• The utility must assess its weakest points, and then consider what actions a potential attacker might employ against them.
• Further, it has been noted that we need to analyze consequences to prioritize responses, identify critical components, harden or secure those that can reasonably be better protected, and develop response plans (Beering 2002; Gleick 2006).
48

12/15/2017
17
• Start with a brief discussion on threats to water systems. Broadly, we categorize threats to water systems as either internal or external in origin.
• Next, provide some rationale as to why the security emphasis in the water community should be focused on water contamination threats.
• Next,discuss water contamination events from the perspective of what is known from selected published papers and reports that have examined the nature and consequences of intentional contamination events.
49
• Specifically, contamination from the perspective of:
– (1) contaminant quantity, method, and location selection within the water system for contamination injection or release,
– (2) water contaminants, and
– (3) magnitude of possible consequences.
• Finally, countermeasures that could be employed to defend against possible threats and water system vulnerabilities.
50
Internal and External Threats
• Threats or perpetrators can generally be categorized as either internal or external to the water utility or its community. Reports suggests the ‘‘trusted insider’’ is perhaps the greatest vulnerability.
• The most likely ‘‘vulnerable’’ water systems to be the relatively small number of water systems serving the largest populated cities in the country.
51

12/15/2017
18
• Internal threats might include disgruntled employees who may or may not be currently employed at the organization.
• For example, as discussed earlier, in Pittsburgh, some believe the unknown perpetrator was a disgruntled employee.
• Other insider attacks might include a scenario where pipelines from drinking WDS were deliberately cross-connected with a wastewater collection pipeline.
• Insiders, – including current employees, – former employees, – contractors and vendors, – pose a particularly dangerous threat since they
have specific knowledge of the utilities’ weaknesses.
52
• External threats may range from simple vandals to nation-sponsored terrorist threats.
• Critical infrastructure is an attractive target for terrorists due to the potential consequences and ripple effects of a successful attack.
• The distribution components of a water system are especially at risk due to the potentially large number of illness and death that could result from an attack.
53
• DHS has issued advisories to water utilities indicating that al-Qaida has shown interest in using
– cyanide, – Botulinum toxin (Botox), – Salmonella typhi (the causative agent of typhoid fever), – and Bacillus anthracis (the causative agent of the disease anthrax) to attack U.S.
water systems (U.S. DHS 2003).
• Terrorist organizations such as al- Qaida are not the only external sources with motives to use chemical or biological weapons to attack a water system.
54
12/15/2017
19
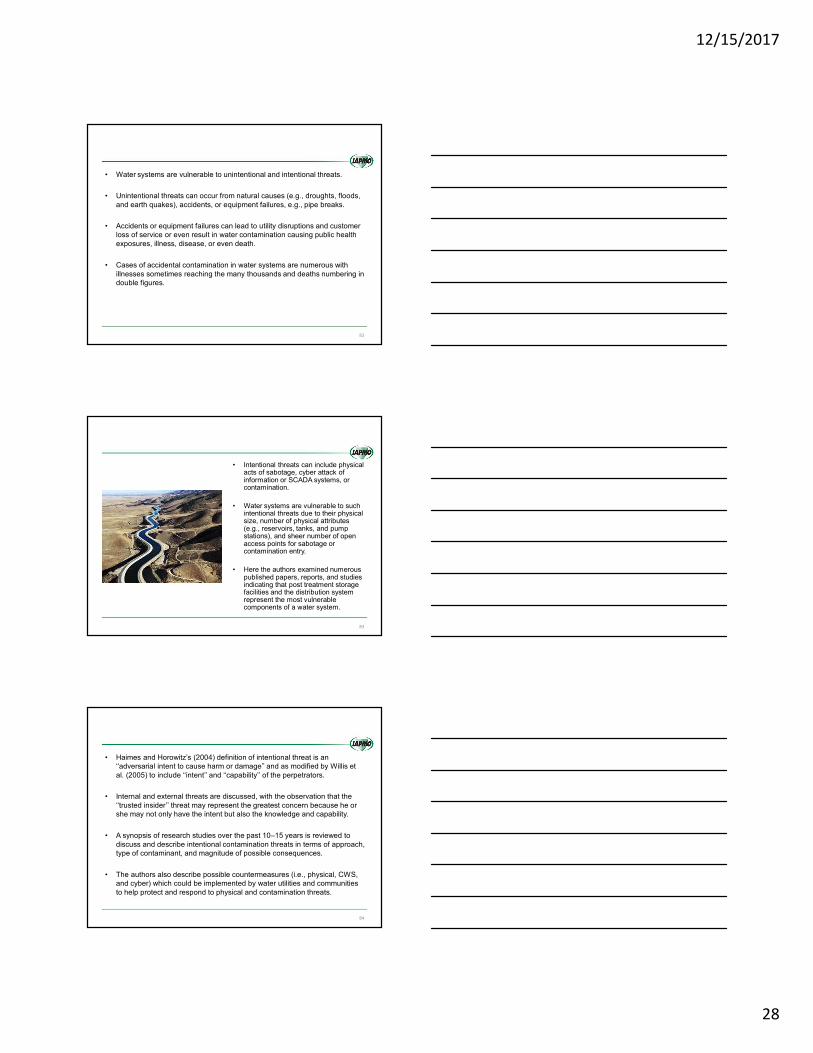
Intentional Water Contamination Events
• Hickman (1999); Clark and Deininger (2000, 2001), provided some of the earliest papers raising the awareness of the vulnerability of WDSs to contaminant threats.
• Hickman (1999), Brosnan (1999), and Clark and Deininger (2000, 2001) have shown that the distributed nature of the distribution system makes it particularly vulnerable to contamination attacks.
• Clark and Deininger (2000, 2001) specifically highlighted the distribution system as the most vulnerable component of a water system.
55
Intentional Water Contamination Events
• Disruption of water service due to some type of physical destruction is often considered in the identification of water threats,
• But most studies rank such denial of service or disruption based attacks below those of contaminant introduction, both in terms of magnitude of impact (cost or public health consequences) and the length of time of the disruption.
• Contamination threats represent the greatest risk to water systems and the communities they serve.
56
Intentional Water Contamination Events
• Numerous papers have analyzed and reported on the types of contaminant threats that would be of concern to water systems.
• Prior to the plethora of post-9/ 11 research studies on the threats and consequences of chemical and biological agents on water systems, Hickman (1999) identified and qualitatively characterized the magnitude of public health impacts that could result given the deliberate introduction of chemical or biological contaminants into a water system to be significant.
• Hickman (1999) noted from his analysis that ‘‘it is not expensive to wage an unsophisticated attack on a community water system.’’
57

12/15/2017
20
Intentional Water Contamination Events
• In 2005, American Water Works Association (AWWA) hosted and led a water utility forum to raise awareness of contamination threats to water systems and identify key research questions that needed to be answered in order to design effective contamination warning systems (CWSs) and response capabilities (Roberson and Morley 2005).
• In 2007, EPA launched the WS Initiative (WSi), a pilot program to deploy and evaluate CWSs as demonstration projects at four major cities across the country (U.S. EPA 2007).
• These efforts and others demonstrate the need to focus on water contamination threats to water systems.
58
Intentional Water Contamination Events
• In the following sections, the intentional threat is discussed from the perspective of
– (1) approach,
– (2) contaminant, and
– (3) magnitude of potential consequences.
• Current research work is cited to frame the magnitude of possible public health consequences that could occur given a terrorist attack on an urban water system.
59
Approach
• Contamination of a distribution system could occur through contaminant release – (e.g., dumping chemicals or
pesticides into a water tank) – or injection (pressurized back flow
of a chemical solution into the distribution system through a service connection).
• Fire hydrants, tanks, reservoirs, or pump stations are vulnerable to both contaminant release and contaminant injection.
• Pressurized backflow could theoretically occur anywhere in the distribution system and simply requires a pump with the necessary power to overcome the distribution system line pressure where the injection is to occur.
60

12/15/2017
21
• The amount of material needed to deliberately contaminate a water source (such as a reservoir or aquifer) is large and generally exceeds what an individual or small group of terrorists could easily acquire, produce, or transport.
• However, contaminants introduced into a tank or directly into the distribution system would be diluted less and would reside in the system for shorter times prior to public exposure and ingestion, thus diminishing the effects of disinfectants and chemical decomposition and oxidation.
61
• A number of researchers have investigated intentional contamination events in WDSs.
• Early work by Hickman (1999), Uber et al. (2004), and Allmann and Carlson (2005) demonstrated the feasibility and shed light on the magnitude of consequences that could result due to intentional contamination of WDSs.
• Hickman observed that such consequences would be significant. Uber et al. (2004) estimated the consequences that could range from 6 % to above 50 % of the population being exposed to lethal concentrations of a toxic contaminant.
• Allmann and Carlson (2005) estimated that a single pressure zone (an area of four square miles) could be contaminated at a concentration corresponding to a lethal dose for the chemical agent VX (Allmann and Carlson 2005).
62
• However, less toxic contaminants could be used to contaminant even larger areas at lethal dose concentrations.
• The application of hydraulic modeling to a better understanding of possible high-rise building contamination,
– noting that contamination can originate from outside or from within the building and
– the extent of contamination is ‘‘most sensitive to the operational aspects of the internal water system.’’
63

12/15/2017
22
• Generally, early studies analyzed a small number of contamination scenarios and later studies have analyzed ensembles or collections of contamination scenarios to provide a statistical analysis of the consequences by injection location.
• Probabilistic approaches have been applied to the study of contamination events to understand how water usage influences exposure and consequences (Khanal et al. 2006) or better predict the timing of when people drink to better assess dose (Davis and Janke 2008, 2009).
64
• Davis and Janke (2011) and Davis et al. (2010) quantified the consequences from contamination events for a diverse set of 12 real distribution systems.
• Their modeling and simulation work showed that significant (those similar to worst case) consequences from intentional contamination events would likely only occur at a minority of release or injection locations.
• These studies also demonstrated that the size of the area exhibiting certain public health consequences was relatively small for less toxic contaminants compared to the size of the area for very toxic contaminants with the relationship being proportional to the quantity of contaminant released or injected.
65
• Grayman et al. (2008) constructed EPANET-based hydraulic models to examine the movement of contaminants within high-rise buildings.
• Their work showed that contamination movement within residential buildings were very sensitive to the water usage patterns at the fixture level, toilets, faucets, showers, etc.
• In high-rise buildings, contamination entering the building from the municipal distribution system along with its movement through the high-rise building was found to be most sensitive to the operational practices of the building’s water system, i.e., pump operation in filling and draining the building’s tanks.
• Janke et al. (2009) and collaborators later applied the high-rise building model to study consequences and sensor monitoring location performance in two real, but artificially modified system models.
• These papers along with others illustrated the influence of model detail on estimating consequences.
66

12/15/2017
23
• The nature of the contamination event can be described, generally, by three aspects:
– (1) type and quantity of the contaminant released as well as the behavior of the contaminant once released into the system,
– (2) location or locations in the water system where the contaminant is introduced, and
– (3) the type and distribution of the population downstream of the contaminant introduction and their behavior as the contamination progresses through the water system.
67
Water Threat Contaminants
• The President’s Commission on Critical Infrastructure Protection (PCCIP 1997) concluded that there is a credible threat to the nation’s water supply system from certain known biological agents.
• Certain chemical agents have also been identified that might constitute a credible threat against water supply systems.
• The U.S. Army Combined Arms Support Command evaluated 27 agents for the potential for weaponization.
• Seven of twenty-seven agents are listed as having the potential for being ‘‘weaponized’’ and 14 others are listed as either possible or probable weapons.
68
• A number of these organisms are listed as definite or probable threats in water (Clark and Deininger 2000; Burrows and Renner 1999).
• In addition, newly discovered or emerging pathogens may pose a threat to water supply systems.
• One such pathogen was isolated during an EPA study (Clark and Deininger2000) in Peru.
• Several chemical agents have also been identified that might constitute a credible threat against water supply systems.
• Although much is known about chemical and biological agents dispersed in air, less is known about these agents in potable water.
69

12/15/2017
24
• Allman and Carlson (2005) conducted a study utilizing a commercial distribution system modeling software program to show how a drinking water system could be impacted by the intentional introduction of chemical contaminants.
• They examined four highly toxic chemicals such as
– c-parathion,
– VX,
– sodium monofluoroacetate
– and cyanide,
– along with a WDS considering water quality models under various scenarios to determine the influence of feed methodology, location, and the contaminant on the effect of contamination.
• Their results showed that it was possible to accomplish large-scale contamination of a drinking water system through backflow into major network water supply lines.
70
Magnitude of Potential Consequences
• Consequences of a water contamination event can be significant.
• A contamination event in a water system can adversely affect the people, the businesses, and the community it serves due to fear, loss of water service, significant economic costs for decontamination and recovery, and the magnitude of adverse public health effects.
• Public health consequences can be described and estimated as – (1) exposures (i.e., people through their places of residence and business witness
contamination in their tap water) – (2) doses (i.e., people within the community served by the water system ingest
contaminated water or somehow accumulate some measurable quantity of the contaminant or contaminants in their bodies), or
– (3) health effects, i.e., given some ingested mass of contaminant a health effect can be estimated.
• Health effects can occur within the short term, i.e., within days or weeks of exposure, or in the long term, i.e., within months or years. Within the short term, health effects could include sickness, incapacitation, or death.
• In the long term (i.e., Yrs), health effects could include increased cancer risk, although such health effects may be difficult to link to WDS contamination.
71
• A historical evaluation of unintentional contamination events in water systems can provide some insight on the magnitude of adverse public health effects that can occur from contamination events in water systems.
• Approximately 690,000–1,790,000 Salmonella typhi cases, 20,000 hospitalizations, and 400 deaths occur annually in the USA, costing approximately $2.6 billon dollars (US) (Economic Research Service 2008; Scallan et al. 2011).
• Salmonella causes 35 % of all foodborne hospitalizations, 10 % of waterborne disease deaths, and 28 % of foodborne disease deaths (Craun et al. 2006; Scallan et al. 2011).
• Unintentional Salmonella outbreaks can infect large numbers of people. The intentional introduction of Salmonella into a WDS could affect a far greater number of people. Salmonella was used as a biological terror agent in The Dalles, Oregon in 1984 (Torok et al. 1997).
72

12/15/2017
25
• Predicting the consequences from intentional contamination can be difficult.
• Most modeling and simulation studies have examined intentional contamination events from the perspective of a single contamination event.
• Further, actual intentional contamination events have resulted in fairly localized consequences.
• Little, if any, has been published estimating the consequences from multiple, concurrent contamination events in WDS.
• Most studies have only varied the location of the contaminant release in the WDS and the various parameters describing the contaminant and how the contaminant is released or injected into the WDS.
• A few researchers have studied the behavior of potential receptors downstream of the contamination event.
73
• Davis and Janke (2011) studied the magnitude of potential consequences, termed ‘‘impacts,’’ given a range of dose thresholds or levels (representing a range of contaminant toxicities), location of contaminant release in the WDS, size of population served by the water system, and quantity of contaminant (mass) released.
• In Davis et al. (2010), the authors examined the nature of the consequences or ‘‘impacts’’ for 12 real and diverse water systems while looking at the sensitivity of the consequences to – (1) mass of contaminant injected, – (2) time of contaminant injection, – (3) duration (hr) of contaminant injection, – (4) distribution of population within the WDS model, – (5) tap water ingestion pattern, i.e., time of day when people drink and
how much. – In Davis et al. (2013) 2013), consequences were estimated while
considering contaminant decay or loss.
74
• These studies showed that the magnitude of public health consequences are most influenced by – (1) size and nature of the particular WDS, – (2) toxicity, quantity of contamination injected, and behavior of the contamination within the
WDS, and – (3) location of the contamination injection.
• Given no prior knowledge of the particular WDS, the results further indicated that a random selection of a particular contamination injection location could result in consequences that approach between one-thousandth and one-tenth of the particular system’s worst case consequences (Davis et al. 2010), ranging from only a few people to many thousands, which could represent a significant fraction of the population served by the water system.
• Their work also showed that public health consequences from very toxic contaminants can vary substantially between water systems and is largely a function of the population served.
• However, for less toxic contaminants, public health consequences can be similar across a wide range and size of water systems.
• For less toxic contaminants, network population does not significantly influence the magnitude of consequences and increasing the quantity of contaminant injected will have a significant influence on the magnitude of consequences (Davis et al. 2010).
75

12/15/2017
26
Countermeasures Against Terrorism
• Access to a free water surface such as exists in a water reservoir should be eliminated.
• For example, the ventilation devices in a reservoir must be constructed in such a way as to prevent contamination of the reservoir.
• The intakes, pumping stations, treatment plants, tanks, and reservoirs should be fenced to secure them against casual vandalism.
• Beyond that, intrusion alarms should be installed to notify the operator that an individual has entered a restricted area.
• An immediate response might be to shut down a part of the pumping system until the appropriate authorities determine that there is no threat to the system.
76
• An important extension of the security concept against terrorist attack would be the planning and construction of separate water lines that are fed from a protected water supply-source, which would only be activated during an emergency.
• Many of the older cities in the United States have separate water lines that have been installed for fire protection in heavily developed downtown areas.
• These water lines might be upgraded for possible use to supply the population with safe water during emergency conditions.
• Such proactive planning for WS, including the continuous maintenance and monitoring of chlorine residual in the water, would help to ensure the safety of most water supply systems.
• Nevertheless, it is of vital importance that system planners and managers be constantly on the alert to prohibit deliberate sabotage of municipal water supply systems.
77
Contamination Warning System
• Among the different threats to a WDS a deliberate chemical or biological contaminant injection is the most difficult to address, both because of the uncertainty of the type of the injected contaminant and its consequences, and the uncertainty of the location and injection time.
• In principle, a pollutant can be injected at any WDS connection (node) using a pump or a mobile pressurized tank.
• Although backflow preventers provide an obstacle to such actions, they do not exist at all connections (i.e., generally very rare), they are not always functional at all connections, and they can be overcome.
78

12/15/2017
27
Contamination Warning System
• Online Water Quality Monitoring
• Consumer Complaint Surveillance
• Public Health Surveillance
• Enhanced Security Monitoring
• Routine Sampling and Analysis
• Cyber Security Countermeasures
79
Summary and Conclusions
• A reliable source of clean, potable water is fundamental to a community’s health and viability.
• Water is the most essential commodity, one that is used every day, by every person in the USA and around the world.
• Protecting water supply and infrastructure is central to maintaining the water commodity for a community and its survival.
• Most water supply systems in the USA consist of a water source(s), treatment facility, and distribution system.
• The distribution system infrastructure is typically the biggest asset and liability of a water utility.
80
• WDS infrastructure is necessarily complex in part because of the required redundancy needed to ensure clean and reliable tap water for every customer every day.
• WDSs are also complex because of the manner in which the infrastructure have been built, i.e., in parallel with cities and communities growing and expanding to meet the needs of the people they support.
• Water supply infrastructure in the USA is one of the oldest infrastructures.
• With this complex and aging infrastructure are numerous potential threats and risks.
81
12/15/2017
28
• Water systems are vulnerable to unintentional and intentional threats.
• Unintentional threats can occur from natural causes (e.g., droughts, floods, and earth quakes), accidents, or equipment failures, e.g., pipe breaks.
• Accidents or equipment failures can lead to utility disruptions and customer loss of service or even result in water contamination causing public health exposures, illness, disease, or even death.
• Cases of accidental contamination in water systems are numerous with illnesses sometimes reaching the many thousands and deaths numbering in double figures.
82
• Intentional threats can include physical acts of sabotage, cyber attack of information or SCADA systems, or contamination.
• Water systems are vulnerable to such intentional threats due to their physical size, number of physical attributes (e.g., reservoirs, tanks, and pump stations), and sheer number of open access points for sabotage or contamination entry.
• Here the authors examined numerous published papers, reports, and studies indicating that post treatment storage facilities and the distribution system represent the most vulnerable components of a water system.
83
• Haimes and Horowitz’s (2004) definition of intentional threat is an ‘‘adversarial intent to cause harm or damage’’ and as modified by Willis et al. (2005) to include ‘‘intent’’ and ‘‘capability’’ of the perpetrators.
• Internal and external threats are discussed, with the observation that the ‘‘trusted insider’’ threat may represent the greatest concern because he or she may not only have the intent but also the knowledge and capability.
• A synopsis of research studies over the past 10–15 years is reviewed to discuss and describe intentional contamination threats in terms of approach, type of contaminant, and magnitude of possible consequences.
• The authors also describe possible countermeasures (i.e., physical, CWS, and cyber) which could be implemented by water utilities and communities to help protect and respond to physical and contamination threats.
84

12/15/2017
29
• Due to the magnitude of public health and economic consequences which could result from a contamination event, the consideration of online CWSs has become the focus of the water community.
• EPA began the WS Initiative pilot utility program to field test a five component conceptual model for a CWS at five large water utilities in the U.S. customer complaint surveillance, public health surveillance, and enhanced security monitoring are important components of the proposed CWS architecture.
• In terms of the earliest detection and concomitant response, the online contamination monitoring component promises the best opportunity to minimize the consequences of intentional contamination.
85
• However, while many utilities implement some form of monitoring and surveillance activities few operate in a manner to meet the primary objective of a CWS – timely detection of the contamination incident.
• The reasons for this are many, e.g., technical difficulties, immature technologies, lack of resources, and institutional constraints.
• Effective online contamination monitoring (i.e., to ensure timely detection of contamination) must be integrated with routine monitoring and routine monitoring must be integrated with operations.
86
• The authors review the state of research related to
– (1) development of methodologies and tools for assessing the consequences of water contamination events;
– (2) development of methodologies and tools for the optimal placement of sensors in a distribution system;
– (3) use of water quality sensors to detect contamination and function as part of an event detection system (EDS); and
– (4) development of methodologies and tools for responding to contamination events.
• Effectively monitoring for detecting and responding to contamination events, unintentional or intentional, will require an integration of real-time analytical (SCADA) data with infrastructure-aware predictive models.
87

12/15/2017
30
• Water systems, especially the distribution system, are vulnerable to unintentional and intentional threats.
• Water contamination threats likely represent the greatest threat to the water utilities and communities they serve, due to the possible significant public health, including loss of life, and economic consequences which could occur.
• Online contamination monitoring that is integrated with real-time operational control is likely the only approach which can promise early detection and potentially effective response.
• Effective response is, however, dependent on the timely identification of the contamination source location.
88
• The vulnerability of our distribution systems to disruption and contamination by potential terrorist or malicious acts has been well documented.
• These potential attack scenarios have the ability, if orchestrated successfully, to produce casualties on a massive scale.
• Studies conducted by personnel at Hach Homeland Security Technologies Colorado State University and the U.S. Army Corps of Engineers among others have shown that attacks on drinking water supplies could be mounted for between $0.05 and $5.00 per death, using rudimentary techniques, and could amass casualties in the thousands over a period of hours.
89
• The most likely scenario for such an attack, in which the goal is to inflict mass casualties, is to orchestrate a simple backflow contamination event.
• A backflow attack occurs when a pump is used to overcome the pressure gradient that is present in the distribution system's pipes.
• This is usually around 80 lbs/in2 and can be easily achieved by using pumps available for rent or purchase at most home improvement stores.
90

12/15/2017
31
• After the pressure gradient present in the system has been overcome and a contaminant introduced, siphoning effects act to pull the contaminant into the flowing system.
• Once the contaminant is present in the pipes, the normal movement of water in the system acts to disseminate the contaminant throughout the network effecting areas surrounding the introduction point.
• The introduction point can be anywhere in the system such as a fire hydrant, commercial building or residence. See figure 1.
91
• Backflows occur via accident on a regular basis and are of great concern to the water industry.
• Accidental backflow events have been found to be responsible for many incidents of water borne illness and even death in the United States.
• According to the USEPA, backflow events caused 57 disease outbreaks and 9734 cases of water borne disease between 1981 and 1998.
92
• To prevent such accidental backflows many systems have been equipped with backflow prevention devices.
• These means of preventing backflow are very useful in preventing the all too common accidental event, but it should be noted that these devices are installed to prevent accidental backflows.
• They are all physical devices that can be removed or disabled quite easily by a would be terrorist thus, rendering them ineffective in preventing deliberate attempts at contamination by all but the most amateurish perpetrators.
93

12/15/2017
32
• Intentional dissemination of contaminants through a backflow event is in fact a very critical vulnerability.
• Studies conducted by the U.S. Air Force and Colorado State University have shown this to be a highly effective means of contaminating a system.
• These studies show a few gallons of highly toxic material was enough, if injected at a strategic location via the proper method, to contaminate an entire system supplying a population of 100,000 people in a matter of a few hours.
94
• Material and significant contamination was not relegated to only the areas surrounding the introduction point.
• Material flowed through each neighborhood and then reentered main trunk lines, thus, making its way to the next area until the contaminant had permeated the entire system.
• Using computer simulations, when a military nerve agent material was used over 20% of the population was determined to have received a dose adequate to result in death and when a common chemical was used in place of the warfare agent the result was a casualty rate of over 10%.
95
• Thousands of deaths could result from this very inexpensive and low-tech mode of attack.
• There is no doubt that this form of assault meets all of the terrorist's criteria for an attack.
• It would cause mass casualties, be inexpensive, and actually offer the terrorists a good chance of avoiding apprehension.
• Unfortunately, because monitoring for contamination in the distribution system typically is limited to infrequent grab samples, the first indications of such an attack are likely to be casualties showing up at local hospitals.
• A terrorist could launch such an attack and be on a plane out of the country before the first casualty is reported.
96

12/15/2017
33
• These sorts of attacks can occur from any access point to the water system.
• Wherever water can be drawn out, material can be forced back into the system.
• Some areas, however, are more vulnerable than others.
• Access points near high flow areas and larger pipes would be favored because they would disseminate the material to a wider area more quickly, however, any access point except for those at the very end of long deadhead lines could be used to effectively access the system.
97
• It should be obvious from the large number of accidental backflows that occur and the fact that terrorist organizations have shown an interest in attacking water, the distribution system is a prime candidate for such an attack.
• The fact is a bona fide terrorist is virtually inundated by possible candidate substances and locations that would be very effective in such a role.
• The possibilities are virtually endless.
• Protecting against and/or detecting such an attack is difficult.
98
• Recent breakthroughs in the online detection of contaminants have made the deployment of a cost effective early warning system capable of detecting and categorizing such events a reality.
• The simple truth is that these systems are not widely deployed and, in locations where they are, the ubiquitous nature of potential attack sites makes 100% coverage of the population an effective impossibility until such time as it becomes practical to deploy sensors on every tap.
99

12/15/2017
34
Questions & Answers
100
Thank you !
101
102
Protecting Water Supply Critical Infrastructure: An Overview Robert Janke, Michael E. Trybyand Robert M. Clark
Examining water distribution system vulnerabilities By Dan Kroll and Katy Craig