2015 MasterCard African Cities Growth Index · 2015 MasterCard African Cities Growth Index 5 The...
38
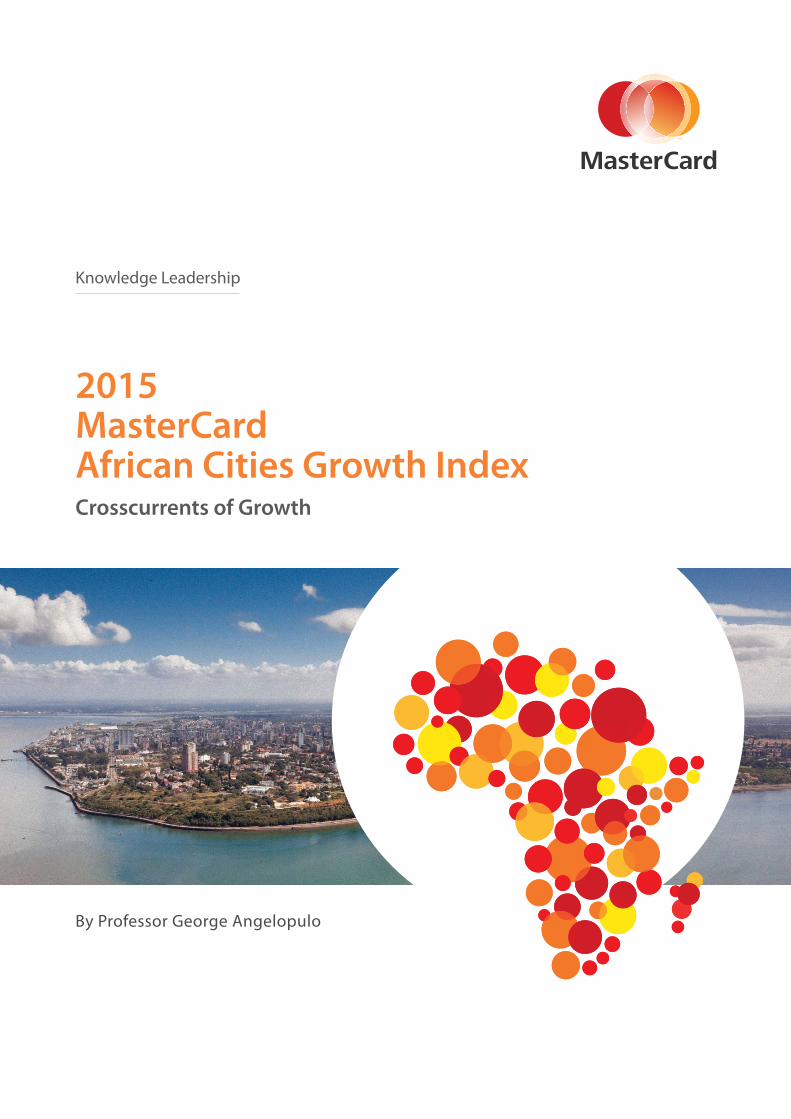
2015 MasterCard African Cities Growth Index Crosscurrents of Growth By Professor George Angelopulo Knowledge Leadership
Transcript of 2015 MasterCard African Cities Growth Index · 2015 MasterCard African Cities Growth Index 5 The...
2015MasterCardAfrican Cities Growth IndexCrosscurrents of Growth
By Professor George Angelopulo
Knowledge Leadership
AcknowledgementsDesmond Choong (The Quiet Analyst LTD.) for technical support
during data gathering and analysis.
Copyright MasterCard 2015
2015 MasterCard African Cities Growth Index 3
Table of Contents
Introduction
ONE | MEASURING CITY GROWTH
TWO | THE BROADER INFLUENCES ON CITY GROWTH IN AFRICA
THREE | THE 2015 CITY RANKINGS
Large CitiesFIGURE 1: The 2015 ACGI Large City Ranking
FIGURE 2: Changes in Ranking - Large Cities
Medium CitiesFIGURE 3: The 2015 ACGI Medium City Ranking
FIGURE 4: Changes in Ranking - Medium Cities
Small CitiesFIGURE 5: The 2015 ACGI Small City Ranking
FIGURE 6: Changes in Ranking - Small Cities
International Benchmark CitiesFIGURE 7: The 2015 ACGI International Benchmark City Ranking
FIGURE 8: Changes in Ranking – International Benchmark Cities
FIGURE 9: The 2015 ACGI Consolidated City Ranking
FOUR | DISCUSSION
After the Commodities BoomRegional and Urban IntegrationRegional and Continental Trajectories
Technical Notes | Cities
Technical Notes | Data Indicators
Technical Notes | Data Processing
Technical Notes | Inclusive Urban Growth
About the author
5
11
12
15
16
16
18
19
19
20
21
21
22
23
24
25
26
28
30
33
34
35
7
8
11
24
4 2015 MasterCard African Cities Growth Index
2015 MasterCard African Cities Growth Index 5
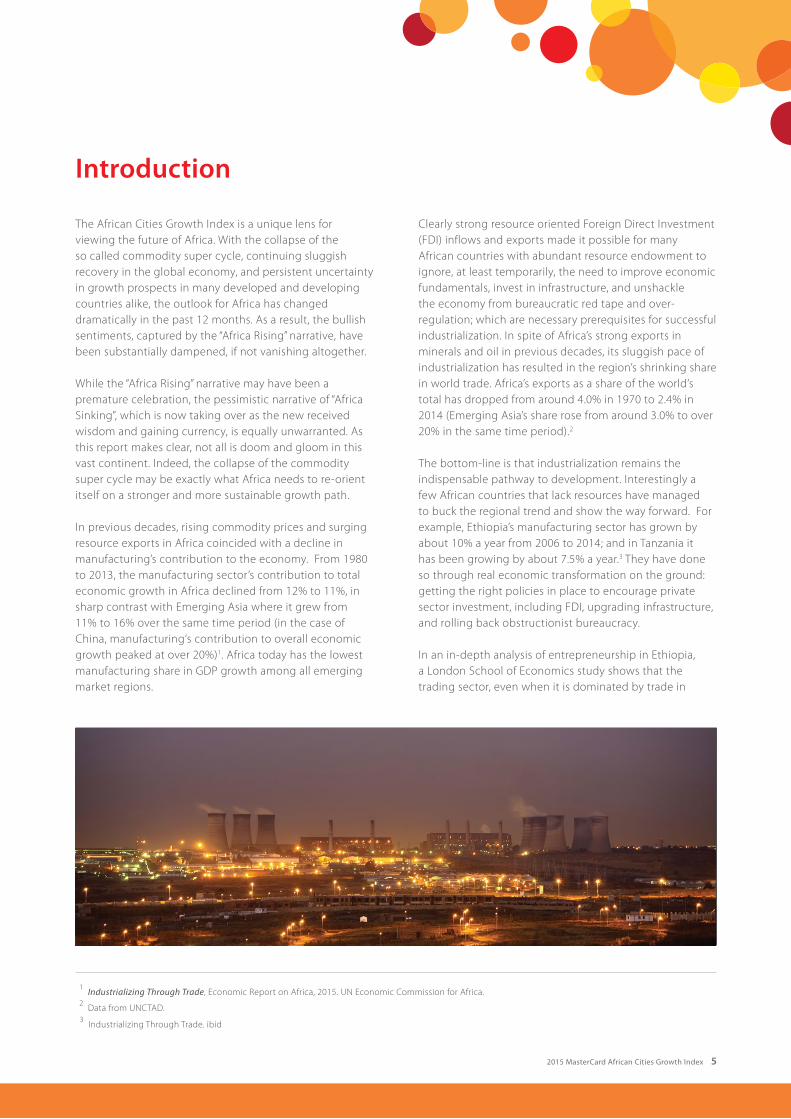
The African Cities Growth Index is a unique lens for viewing the future of Africa. With the collapse of the so called commodity super cycle, continuing sluggish recovery in the global economy, and persistent uncertainty in growth prospects in many developed and developing countries alike, the outlook for Africa has changed dramatically in the past 12 months. As a result, the bullish sentiments, captured by the “Africa Rising” narrative, have been substantially dampened, if not vanishing altogether. While the “Africa Rising” narrative may have been a premature celebration, the pessimistic narrative of “Africa Sinking”, which is now taking over as the new received wisdom and gaining currency, is equally unwarranted. As this report makes clear, not all is doom and gloom in this vast continent. Indeed, the collapse of the commodity super cycle may be exactly what Africa needs to re-orient itself on a stronger and more sustainable growth path.
In previous decades, rising commodity prices and surging resource exports in Africa coincided with a decline in manufacturing’s contribution to the economy. From 1980 to 2013, the manufacturing sector’s contribution to total economic growth in Africa declined from 12% to 11%, in sharp contrast with Emerging Asia where it grew from 11% to 16% over the same time period (in the case of China, manufacturing‘s contribution to overall economic growth peaked at over 20%)1. Africa today has the lowest manufacturing share in GDP growth among all emerging market regions.
Clearly strong resource oriented Foreign Direct Investment (FDI) inflows and exports made it possible for many African countries with abundant resource endowment to ignore, at least temporarily, the need to improve economic fundamentals, invest in infrastructure, and unshackle the economy from bureaucratic red tape and over-regulation; which are necessary prerequisites for successful industrialization. In spite of Africa’s strong exports in minerals and oil in previous decades, its sluggish pace of industrialization has resulted in the region’s shrinking share in world trade. Africa’s exports as a share of the world’s total has dropped from around 4.0% in 1970 to 2.4% in 2014 (Emerging Asia’s share rose from around 3.0% to over 20% in the same time period).2
The bottom-line is that industrialization remains the indispensable pathway to development. Interestingly a few African countries that lack resources have managed to buck the regional trend and show the way forward. For example, Ethiopia’s manufacturing sector has grown by about 10% a year from 2006 to 2014; and in Tanzania it has been growing by about 7.5% a year.3 They have done so through real economic transformation on the ground: getting the right policies in place to encourage private sector investment, including FDI, upgrading infrastructure, and rolling back obstructionist bureaucracy.
In an in-depth analysis of entrepreneurship in Ethiopia, a London School of Economics study shows that the trading sector, even when it is dominated by trade in
Introduction
1 Industrializing Through Trade, Economic Report on Africa, 2015. UN Economic Commission for Africa.
2 Data from UNCTAD.
3
Industrializing Through Trade. ibid
6 2015 MasterCard African Cities Growth Index
commodities, could function as an important generator of new businesses and investment in manufacturing, under the right conditions.4 This is because the trading sector typically has the deepest understanding of both the local and international market conditions, and have the best overseas connections in sourcing “know how”, “know who”, and “know what” to channel new investment into industrial production in general and manufacturing in particular. So the collapse of the commodity super cycle does not mean a dead end for Africa. It could be a turning point for the region to leverage its success in commodity trades to reinvigorate industrialization. But there is no short cut to navigating successfully such a turning point, it requires that Africa get the basics right.
And Africa’s dynamic and fast growing cities are the strategic nodes where such an economic transformation could happen. Cities powerfully concentrate human resources and capability to create the necessary critical mass to support business investment and operations, and at the same time they are gateways for reaching out
to the global market. Getting the basics right therefore also means making sure that cities in Africa can function effectively as centers of commerce, productive hubs for industries, and vibrant markets for consumers. This new edition of African Cities Growth Index provides a timely assessment of their potential. It is a roadmap to Africa’s future.
Dr Yuwa Hedrick-Wong
Dr Yuwa Hedrick-Wong is Chief Economist of the MasterCard Center for Inclusive Growth. He is also HSBC Professor of International Business at the University of British Columbia, Canada, and Global Economic Advisor at MasterCard.
4 Sutton, J. and N. Kellow. 2010. An Enterprise Map of Ethiopia. International Growth Centre. The London School of Economics and Political Science.
2015 MasterCard African Cities Growth Index 7
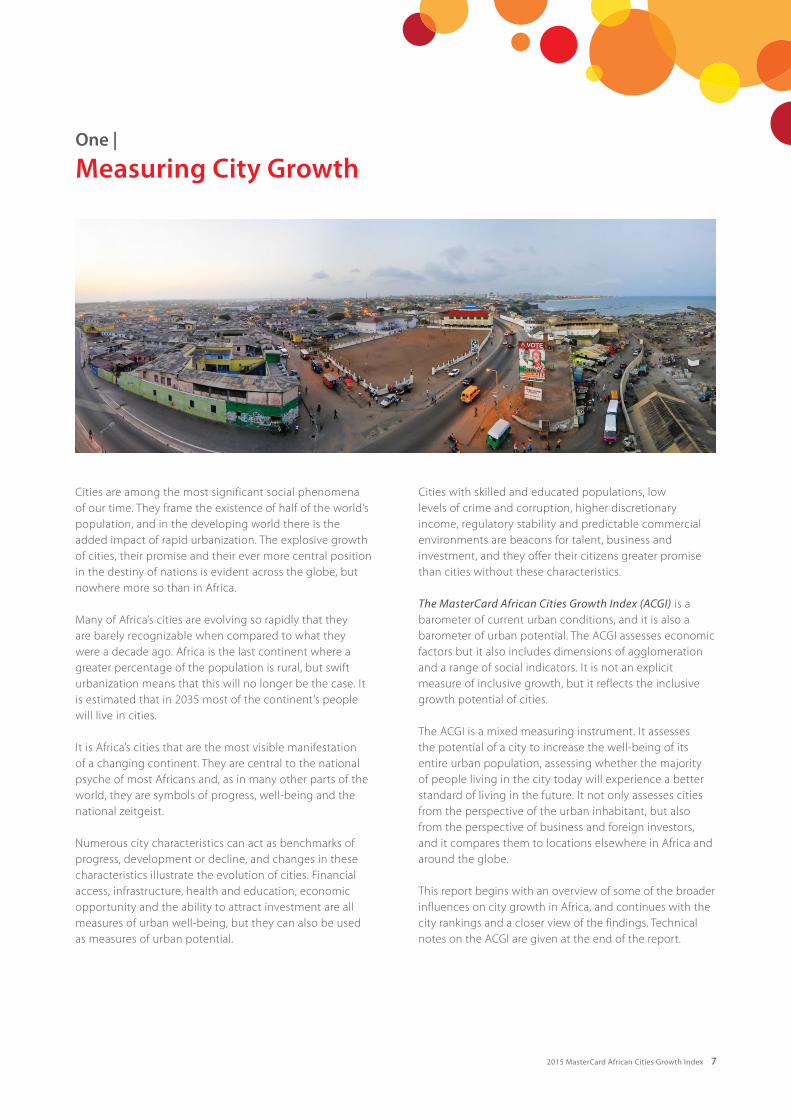
Cities are among the most significant social phenomena of our time. They frame the existence of half of the world’s population, and in the developing world there is the added impact of rapid urbanization. The explosive growth of cities, their promise and their ever more central position in the destiny of nations is evident across the globe, but nowhere more so than in Africa.
Many of Africa’s cities are evolving so rapidly that they are barely recognizable when compared to what they were a decade ago. Africa is the last continent where a greater percentage of the population is rural, but swift urbanization means that this will no longer be the case. It is estimated that in 2035 most of the continent’s people will live in cities.
It is Africa’s cities that are the most visible manifestation of a changing continent. They are central to the national psyche of most Africans and, as in many other parts of the world, they are symbols of progress, well-being and the national zeitgeist.
Numerous city characteristics can act as benchmarks of progress, development or decline, and changes in these characteristics illustrate the evolution of cities. Financial access, infrastructure, health and education, economic opportunity and the ability to attract investment are all measures of urban well-being, but they can also be used as measures of urban potential.
Cities with skilled and educated populations, low levels of crime and corruption, higher discretionary income, regulatory stability and predictable commercial environments are beacons for talent, business and investment, and they offer their citizens greater promise than cities without these characteristics.
The MasterCard African Cities Growth Index (ACGI) is a barometer of current urban conditions, and it is also a barometer of urban potential. The ACGI assesses economic factors but it also includes dimensions of agglomeration and a range of social indicators. It is not an explicit measure of inclusive growth, but it reflects the inclusive growth potential of cities.
The ACGI is a mixed measuring instrument. It assesses the potential of a city to increase the well-being of its entire urban population, assessing whether the majority of people living in the city today will experience a better standard of living in the future. It not only assesses cities from the perspective of the urban inhabitant, but also from the perspective of business and foreign investors, and it compares them to locations elsewhere in Africa and around the globe.
This report begins with an overview of some of the broader influences on city growth in Africa, and continues with the city rankings and a closer view of the findings. Technical notes on the ACGI are given at the end of the report.
One |
Measuring City Growth
8 2015 MasterCard African Cities Growth Index
A range of interrelated conditions enhanced growth in most large African cities over the past decade. Of course, growth was not uniform across all cities but conditions of life and economic opportunity have improved in most. The main driver of growth was the commodities boom and with it came improved investment, infrastructure, access to finance, a more positive business orientation, economic diversification and the expansion of the consumer sector.
However, the past two years have seen a significant change in Africa’s economic trajectory and this has affected its major cities. Some of the causes of this change have undermined growth while others have enhanced it.
The shift is due largely to the slowdown in the global economy. Following the surge in economic activity that began in the early 2000s, export-driven growth in low-income countries averaged 6.2 percent per annum from 2000 to 2014. Growth was four times higher than it was between 1990 and 2000 among mineral and metal exporters, which comprise two thirds of all low-income countries. Africa mirrored these GDP growth figures.
By 2013, however, Africa had lower GDP growth following a decline in commodity prices. This was led by slowing growth in China, a consequence of its evolution from an investment-led to a consumer-led economy, and a rebalancing in the relative growth of services versus manufacturing.
A languishing European economy, slow growth in the USA and a sharp drop in the economic performance of the remaining BRICS countries further undermined fast growth. From the beginning of 2011 to mid-2014, metal and mineral prices dropped approximately 30 percent and agricultural products by around 15 percent, although the price of oil continued to increase. From mid-2014 to April 2015 there were further reductions across the board as overall metal and mineral prices dropped slightly and agricultural goods fell by around five percent. The greatest declines in price were experienced in the energy sector, with natural gas falling by over 30 percent and oil by over 40 percent.
The lower oil price means that Africa’s oil exporters, which had contributed around half of the continent’s GDP,
are suffering a sharp reduction in revenue and foreign reserves. Equatorial Guinea, Algeria, Nigeria, Angola, Libya and Gabon, for example, earn the bulk of their fiscal revenue from oil. Libya needs an oil price of over $215, Algeria over $110, and Nigeria over $120 to balance their budgets5. Countries such as Cameroon and Ghana are not as dependent on oil, but their economies are severely affected by the drop in its price.
The commodities boom and its aftermath have both positive and negative effects. Incisive poverty reduction requires sustained growth of around seven percent per year over a long period, and this would require investment rates of a massive one quarter of the continent’s GDP. Africa requires $93 billion a year in infrastructure development but current economic conditions will make this difficult to achieve.
A negative consequence of the commodities price super cycle was that with very few exceptions, African countries’ manufacturing as a percentage of GDP fell in comparison to commodities. Unlike other developing regions, Africa built up its services sector and not its manufacturing sector, and it is likely that this will stand it in good stead during the current period of slower economic activity. However, to increase the benefits that accrue from a high value service sector, education, and as the economist Ricardo Hausmann emphasizes, education with productivity, needs to be amplified across the continent.
The oil price affects oil exporters detrimentally but offers an economic stimulus to oil importers. The pressure on oil exporters is reflected in Ghana’s rate of inflation, the devaluation of Nigeria’s naira, and a sharp decline in non-oil economic sectors that rely on government spending in the least diversified economies such as Equatorial Guinea and Angola. On the other hand, oil importers such as South Africa and Kenya have resumed rates of inflation within their target ranges.
The regional effect of the Ebola outbreak in Western Africa has been striking. Twenty-seven thousand cases were recorded with over 11,000 fatalities in Guinea, Sierra Leone and Liberia, with single digit numbers recorded elsewhere in Africa and around the globe6. Despite expectations to the contrary, it is only in the three countries in which it
Two |
The Broader Influences on City Growth in Africa
5 Deutsche Bank; Thomson Reuters; World Bank
6 WHO
2015 MasterCard African Cities Growth Index 9
reached epidemic proportions – Guinea, Sierra Leone and Liberia – that its economic effect has been substantial. The reduction in their combined economic growth is estimated at $2.2 billion, but with very different effects in each country.
Liberia’s 2015 GDP is estimated to grow at three percent, Guinea’s to contract by 0.2 percent, and Sierra Leone’s to contract by a massive 23.5 percent7. Cross-border trade, travel, consumer and investor confidence have been eroded and risk aversion has constrained economic activity across the entire region. However, the impact on the greater African economy is significantly lower than what was originally projected. It could reach $6,2 billion – far less than the $25 billion originally estimated8.
The continent has been affected by unrest, conflict and uncertainty in some places, and increasing stability and democracy in others.
The Boko Haram insurgency has destabilized the north east of Nigeria and its neighbors Cameroon, Niger and Chad. El-Shabaab, and to a lesser extent the country’s conflicting clans, continue to destabilize Somalia and its adjacent countries. The civil war in South Sudan has not been resolved, and the Darfur and southern state conflicts of Sudan show few signs of imminent resolution.
Libya is governed by two conflicting factions and the country’s instability is exacerbated by the presence of over 1700 armed groups. The Libyan conflict has a destabilizing effect on the whole of the Maghreb. The eastern provinces of the Democratic Republic of Congo remain unstable, while further east in Burundi violence preceded President Nkurunziza’s re-election for a third term in the 2015 elections.
With the intervention of the United Nations (UN), the ethnic and religious conflict in the Central African Republic has abated but not disappeared. A quarter of its population has been displaced and the conflict has had severe consequences in the region. Elections planned for October 2015 were postponed because of instability in the country. Burkina Faso’s October 2015 elections were also postponed due to political turmoil.
On the other side of the coin, the democratic process was strengthened in Nigeria when, for the first time, an incumbent was legitimately replaced in government by the opposition in an election.
Elections in Zambia, Lesotho, Benin, Sudan and Togo were peacefully concluded despite a degree of disputation in some of the results. Sudan’s elections were the first since the South seceded in 2011, and the results were a landslide for the incumbent National Congress and the president, Omar al-Bashir, although the election was marred by the boycott of the majority of the opposition.
Northern Africa is the only region that has not experienced greater human development in areas such as education, health or poverty reduction in the period 2000 to 2013, than it had in the periods 1980-20009. On balance, Tunisia has benefited from the Arab Spring with a more vibrant democracy, improved business confidence and greater financial market integration. Egypt and Morocco have experienced greater confidence and improvements in investment, manufacturing and imports, but Libya languishes with high levels of internal strife that affect the region as a whole. Other than Northern Africa, all other regions have seen significant improvements over the past decade as a result of greater political stability, commodity prices and improved economic policies.
One of the greatest dividends of the past decade’s growth in Africa has been the establishment of a growing middle class. Although it isn’t dominant in the population mix of most African cities, it is nonetheless a crucial link in their transformation. The middle class has increased demand (and supply) of services and products, had a major impact on consumption, competition, and the more equitable spread of the benefits of the continent’s growing economies.
The mixed conditions in Africa – improved average living standards, greater political stability, infrastructure investment, domestic demand and private consumption, and the negative effects of lower commodity prices, conflict and disease – have resulted in lower, but still positive economic growth.
7 World Bank
8 World Bank
9 OECD
10 2015 MasterCard African Cities Growth Index
In 2014, Africa attracted $128 billion in FDI, up from $52 billion in 2013. Technology, media, telecommunications (at around 20 percent) and financial services (around 18 percent) attracted the most investment. The USA was the greatest investor followed jointly by South Africa and the UK, and then the UAE, France, Germany and China in that order. Projections for Africa as a whole suggest growth of 4.2 percent in 2015. Eastern Africa is expected to have the highest regional growth rate at 5.6 percent, followed by Central Africa (5.5 percent), Western Africa (5 percent), Northern Africa (4.5 percent) and Southern Africa (3.1 percent)10.
One constant among the majority of African cities is swift population growth. Almost every city in the ACGI has grown organically and through migration. This growth is so rapid that two of the cities that were previously categorized as small cities are now better described as medium-sized cities. It is likely that there will be a steady increase in the populations of all major cities in Africa and a steady transition towards the larger city categories in the ACGI.
10 Ernst & Young; World Bank; OECD
Two Continued |
The Broader Influences on City Growth in Africa
2015 MasterCard African Cities Growth Index 11
Three |
The 2015 City Rankings
The 74 cities of the 2015 ACGI are divided into three groups according to population size. The cities are found across the African continent and its island states. The Index also refers to a fourth group of cities outside Africa, the International Benchmark Cities, and these are included for international comparison.
(i) Large Cities – population over one million(ii) Medium Cities – population between 500,000 and one million(iii) Small Cities – population under 500,000
The Index’s values are based on an assessment model that is described in the Technical Notes at the end of this report. Four ACGI score levels categorize inclusive growth potential:
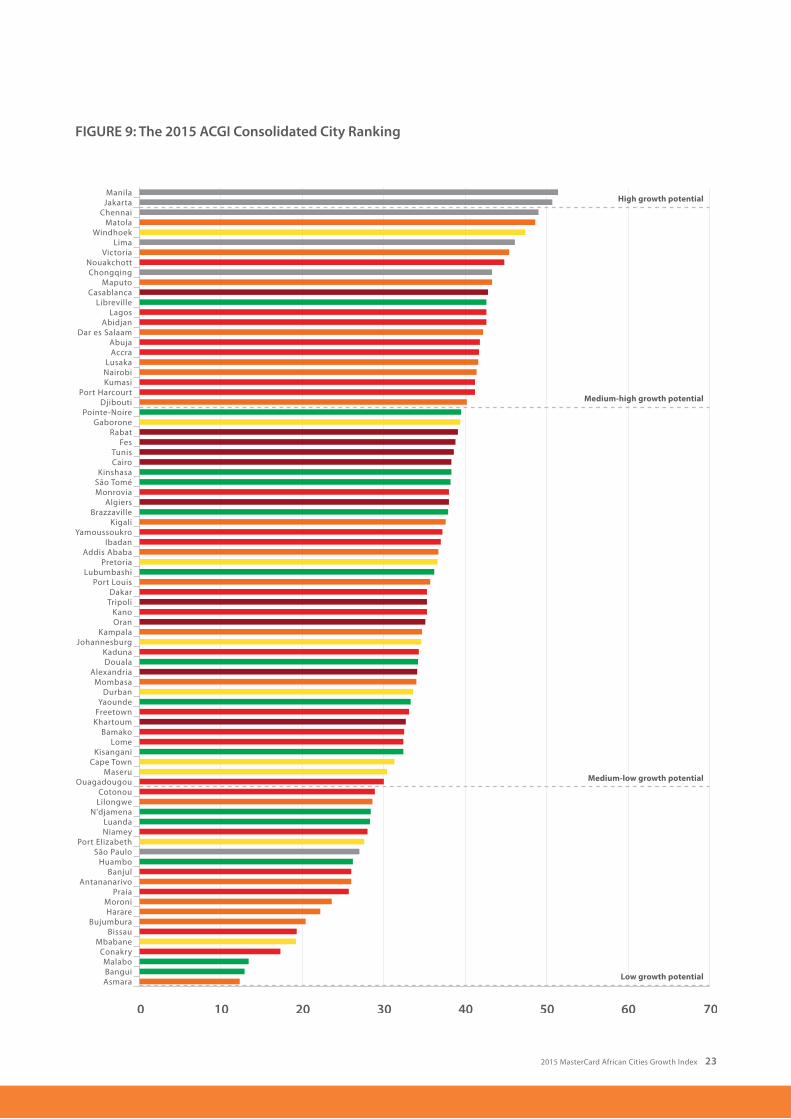
(i) High inclusive growth potential - 50 and above (ii) Medium-high inclusive growth potential - 40-49.99 (iii) Medium-low inclusive growth potential - 30-39.99 (iv) Low inclusive growth potential - 0-29.99
The growth described in the AGCI is somewhat different to that normally associated with the term ‘growth’. It does not relate explicitly to city GDP growth or pure growth in the city’s economy, although this is one factor considered in the ACGI. Instead it refers to a concept of inclusive growth in which rapid economic growth is considered essential in the alleviation of poverty, and includes equal opportunity access to markets and resources, a broad improvement in the standard of living and an open, unbiased regulatory environment for businesses and individuals. It allows for economic diversification, competition, and creative destruction; leading to greater socioeconomic opportunities and a more level business and investment playing field.
Large Cities
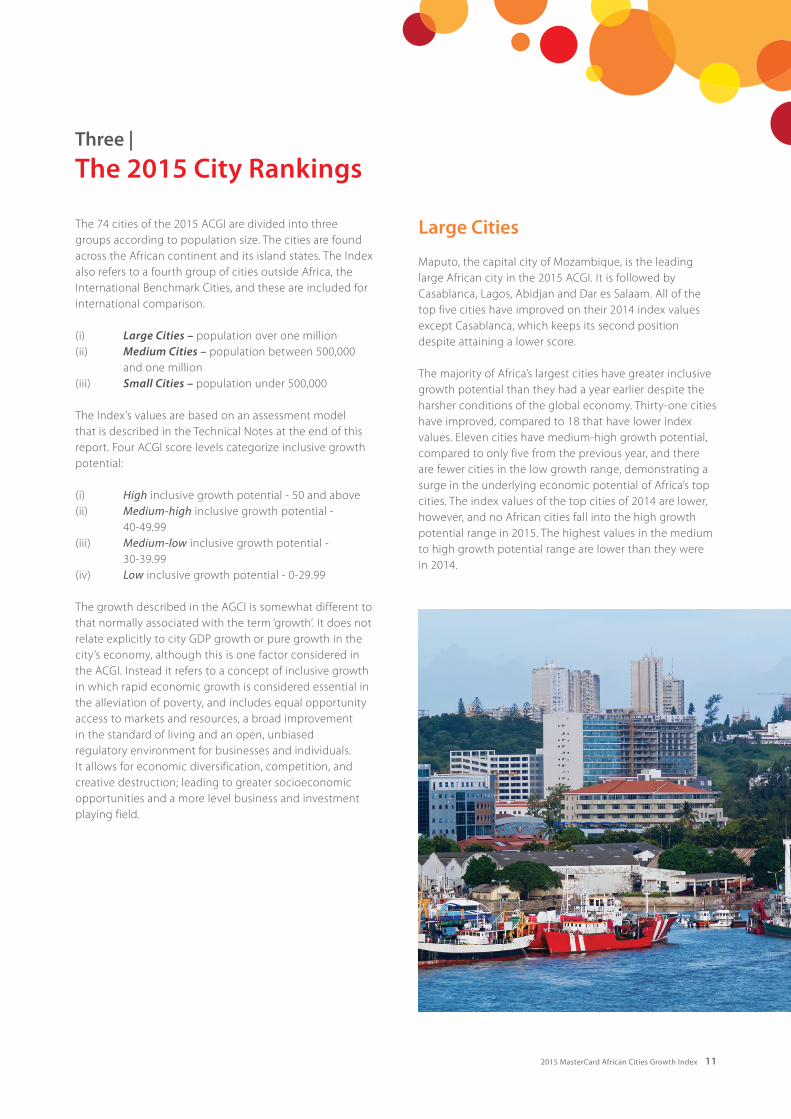
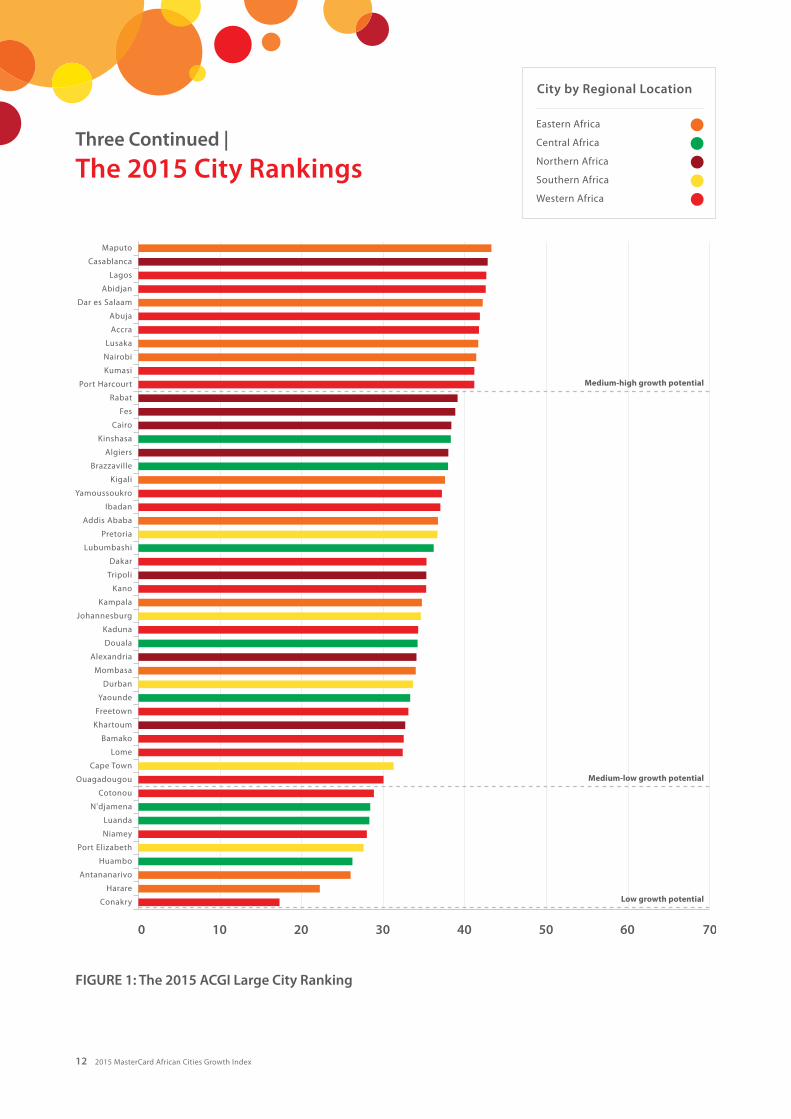
Maputo, the capital city of Mozambique, is the leading large African city in the 2015 ACGI. It is followed by Casablanca, Lagos, Abidjan and Dar es Salaam. All of the top five cities have improved on their 2014 index values except Casablanca, which keeps its second position despite attaining a lower score.
The majority of Africa’s largest cities have greater inclusive growth potential than they had a year earlier despite the harsher conditions of the global economy. Thirty-one cities have improved, compared to 18 that have lower index values. Eleven cities have medium-high growth potential, compared to only five from the previous year, and there are fewer cities in the low growth range, demonstrating a surge in the underlying economic potential of Africa’s top cities. The index values of the top cities of 2014 are lower, however, and no African cities fall into the high growth potential range in 2015. The highest values in the medium to high growth potential range are lower than they were in 2014.
12 2015 MasterCard African Cities Growth Index
FIGURE 1: The 2015 ACGI Large City Ranking
Three Continued |
The 2015 City Rankings

2015 MasterCard African Cities Growth Index 13
Maputo’s number one ranking is directly due to its share of Mozambique’s FDI, which as a percentage of national GDP is among the highest in the world, and almost three times greater than the next highest city in the Index. Maputo has the third highest GDP per capita growth and enjoys a stable political climate.
Although not among its strongest characteristics, it boasts constantly improving levels of government effectiveness, regulatory quality, ease of doing business, voice and accountability. Surprising for its level of development, urban inhabitants’ access to a financial account falls into the upper third of the ACGI cities. At the other end of the scale, Maputo has among the lowest levels of population growth and middle class households as a percentage of total households. Health and education rank among the lowest on the Index. Access to electricity, sanitation and water is low but improving.
Maputo has growing economic assets that come with their own set of challenges. The city is in a strong position to reduce Mozambique’s reliance on foreign aid, contributing to the country achieving its economic and social development goals. However, high levels of natural resource exploitation in Mozambique could lead to a decline in economic activity in other sectors. This, and the danger of increasing concentration in the economy, means that Maputo faces challenges in economic diversification, human skills and infrastructure development. Maputo retains many of its past constraints, but at this time it also has the greatest opportunity for inclusive growth.
Casablanca is the only North African city at the higher level of growth potential, supported by Morocco’s relative stability in a turbulent region. The city has high levels of fixed capital formation, health, access to electricity, water and sanitation. It is at the upper end of the cell phone subscription and air connectivity scales, with government effectiveness just beneath the levels of Kigali and the South African cities that rank highest in that factor.
It ranks at the upper end of the scale with regards to its rule of law, control of corruption and ease of doing business, and is in the second tier of middle class households as a percentage of households after the Egyptian and Libyan cities. Casablanca does, however, rank among the lowest cities in household consumption expenditure growth and city population growth.
Nigeria’s Lagos takes the third spot and obtains a marginally higher index value compared to its 2014 ranking. Its third place is also the result of previously higher ranked cities’ declines in score. Lagos, and to a lesser extent the other Nigerian cities of Abuja (ranked sixth) and Port Harcourt (ranked eleventh), show some improvement across many variables of assessment. Perhaps the most significant figure coming out of Lagos is its increase in the percentage of middle class households. This figure is at the upper end of the scale, and while not at the top, its significance rests in the sheer numbers that it represents and its ultimate effect on consumption in the city.
The Nigerian cities’ rankings are suppressed by lower levels of political stability, rule of law, control of corruption and ease of doing business. Lagos and the other Nigerian cities are also handicapped by their positions at the lower end of the health, education, electricity, sanitation and water indices. There are low levels of gross fixed capital formation, but reasonable levels of financial access, air connectivity and air capacity.
Abidjan (Ivory Coast), ranked fourth, is noted for its GDP per capita growth and strong growth in household consumption. The city continues to suffer from poor levels of service in education and health. The Ebola outbreaks in neighboring Guinea and Liberia have constrained economic activity, but not to the extent originally anticipated.
Rounding up the top five large cities, Dar es Salaam, Tanzania’s capital city, ranks second in household consumption expenditure growth and is experiencing high levels of infrastructure development. Its existing service infrastructure and delivery in areas such as water supply and sanitation are, however, at the lower end of the scale.
The potential for inclusive growth in the Ghanaian cities of Accra (now seventh on the Index after being ranked first in the previous two ACGI studies) and Kumasi (ranked tenth) is lower than it was in the recent past. Ghana’s expected accrual of revenue from its Jubilee oil fields has not reached its original expectations and this has been exacerbated by the collapse of the oil price. The cost of wage increases, subsidies and debt repayments undermine economic expansion in its cities.
14 2015 MasterCard African Cities Growth Index
Despite declining in this year’s ranking, both cities still rank among the top cities in the assessment. Kumasi shows higher GDP growth and household consumption increases than Accra. They offer comparatively high levels of access to electricity, but its sporadic supply has affected growth and confidence. Although political activity is vigorous, there is stability across Ghana, and it has among the higher levels of regulatory quality, voice and accountability. Corruption control is at the highest levels of the scale. Population growth in Kumasi is substantially higher than it is in Accra, and Kumasi also has a higher proportion of middle class households.
Lusaka (Zambia) and Nairobi (Kenya) have both shown strong improvement since 2014. Both show positive progress in a number of variables with few areas of particular strength or weakness. One or two areas do, however, bear noting. Nairobi has the highest percentage of the population with a financial account, ranking higher than the South African cities, and Lusaka benefits from Zambia’s political stability, sharp improvement in global competitiveness and absence of violence.
A number of the cities that are not in the top rankings should be considered for different reasons.
The South African cities of Cape Town, Durban, Johannesburg, Port Elizabeth and Pretoria have all shown marked declines in their rankings, falling to the bottom half of medium to low growth cities, and in the case of Port Elizabeth, to low growth levels. Their positions are the result of decreasing economic growth and household consumption, and the more fundamental problems of labor inefficiency, low productivity, high unemployment, decreasing competitiveness and poor education. It is only in areas of established infrastructure – financial and physical – and relatively high levels of governance, that the South African cities retain the potential to improve the economic well-being of their growing populations. It is estimated that 80 percent of South Africa’s population will be living in cities by 2050. Despite its problems, South Africa is second only to Mauritius among African countries in the World Economic Forum’s (WEF) Global Competitiveness Index. Freetown in Sierra Leone – the third placed city in 2014 now ranked at 35 – and Conakry in Guinea, which was poorly placed in 2014, have tumbled in the rankings, for reasons that can be directly attributed to the Ebola
outbreak. These cities will only regain or improve on their original positions when the threat of Ebola is eradicated in the region. The buoyancy of the regional economies following the outbreak of Ebola suggests that once the epidemic is eradicated, economic recovery in both cities will be swift. Freetown benefits from Sierra Leone’s high levels of FDI, placing it just after Maputo and Brazzaville in FDI rankings.
Many of the figures available for Tripoli (Libya) are flawed as they are the result of rebounds to normal levels following periods of economic contraction in GDP growth, for example, or as consequences of the broader conflict in Libya. It is extremely difficult and perhaps unrealistic to gauge the growth potential of the city until it once again stabilizes.
Addis Ababa in Ethiopia is promising in certain areas. The city does not rank particularly highly on its overall score because of poor ratings in education, sanitation, cellular telephony, regulatory quality, voice and accountability. However it enjoys the highest growth in GDP per capita, and high growth in household consumption, gross fixed capital formation and air connectivity.
Kinshasa and Lubumbashi in the Democratic Republic of Congo (DRC) have high GDP per capita growth. Ouagadougou in Burkino Faso shares high household consumption growth with the two DRC cities and it also has the highest population growth. Niamey and Algiers reflect the high rates of gross fixed capital formation as a percentage of GDP that are evident in Niger and Algeria respectively.
Kigali in Rwanda also has high GDP figures, a high percentage of its population with financial accounts, following only the cities in Kenya and South Africa, and it scores highest in corruption control. Rwanda ranks third among African countries in its global competitiveness. Bamako in Mali leads all other cities in mobile subscriptions and Cotonou in Benin attains high scores in a number of governance indices.
Three Continued |
The 2015 City Rankings
2015 MasterCard African Cities Growth Index 15
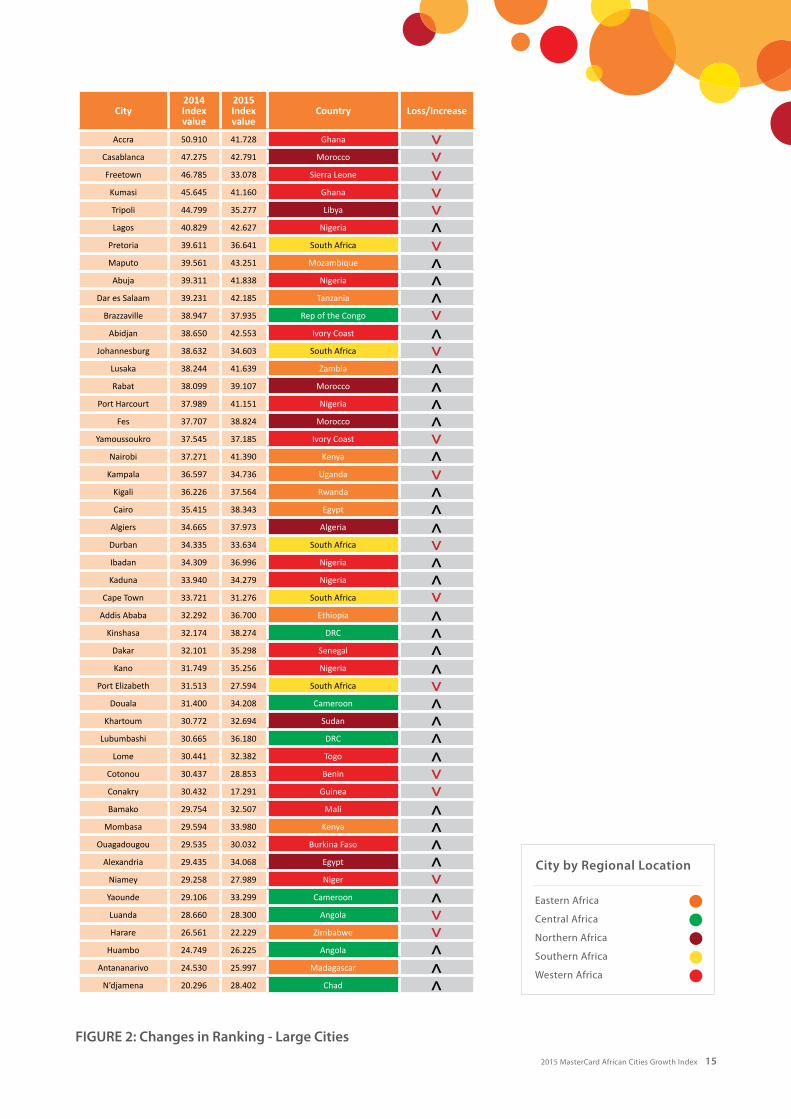
FIGURE 2: Changes in Ranking - Large Cities
City2014 Index value
2015 Index value
Country Loss/Increase
Accra 50.910 41.728 Ghana
Casablanca 47.275 42.791 Morocco
Freetown 46.785 33.078 Sierra Leone
Kumasi 45.645 41.160 Ghana
Tripoli 44.799 35.277 Libya
Lagos 40.829 42.627 Nigeria
Pretoria 39.611 36.641 South Africa
Maputo 39.561 43.251 Mozambique
Abuja 39.311 41.838 Nigeria
Dar es Salaam 39.231 42.185 Tanzania
Brazzaville 38.947 37.935 Rep of the Congo
Abidjan 38.650 42.553 Ivory Coast
Johannesburg 38.632 34.603 South Africa
Lusaka 38.244 41.639 Zambia
Rabat 38.099 39.107 Morocco
Port Harcourt 37.989 41.151 Nigeria
Fes 37.707 38.824 Morocco
Yamoussoukro 37.545 37.185 Ivory Coast
Nairobi 37.271 41.390 Kenya
Kampala 36.597 34.736 Uganda
Kigali 36.226 37.564 Rwanda
Cairo 35.415 38.343 Egypt
Algiers 34.665 37.973 Algeria
Durban 34.335 33.634 South Africa
Ibadan 34.309 36.996 Nigeria
Kaduna 33.940 34.279 Nigeria
Cape Town 33.721 31.276 South Africa
Addis Ababa 32.292 36.700 Ethiopia
Kinshasa 32.174 38.274 DRC
Dakar 32.101 35.298 Senegal
Kano 31.749 35.256 Nigeria
Port Elizabeth 31.513 27.594 South Africa
Douala 31.400 34.208 Cameroon
Khartoum 30.772 32.694 Sudan
Lubumbashi 30.665 36.180 DRC
Lome 30.441 32.382 Togo
Cotonou 30.437 28.853 Benin
Conakry 30.432 17.291 Guinea
Bamako 29.754 32.507 Mali
Mombasa 29.594 33.980 Kenya
Ouagadougou 29.535 30.032 Burkina Faso
Alexandria 29.435 34.068 Egypt
Niamey 29.258 27.989 Niger
Yaounde 29.106 33.299 Cameroon
Luanda 28.660 28.300 Angola
Harare 26.561 22.229 Zimbabwe
Huambo 24.749 26.225 Angola
Antananarivo 24.530 25.997 Madagascar
N’djamena 20.296 28.402 Chad
16 2015 MasterCard African Cities Growth Index
Three Continued |
The 2015 City Rankings
Medium Cities
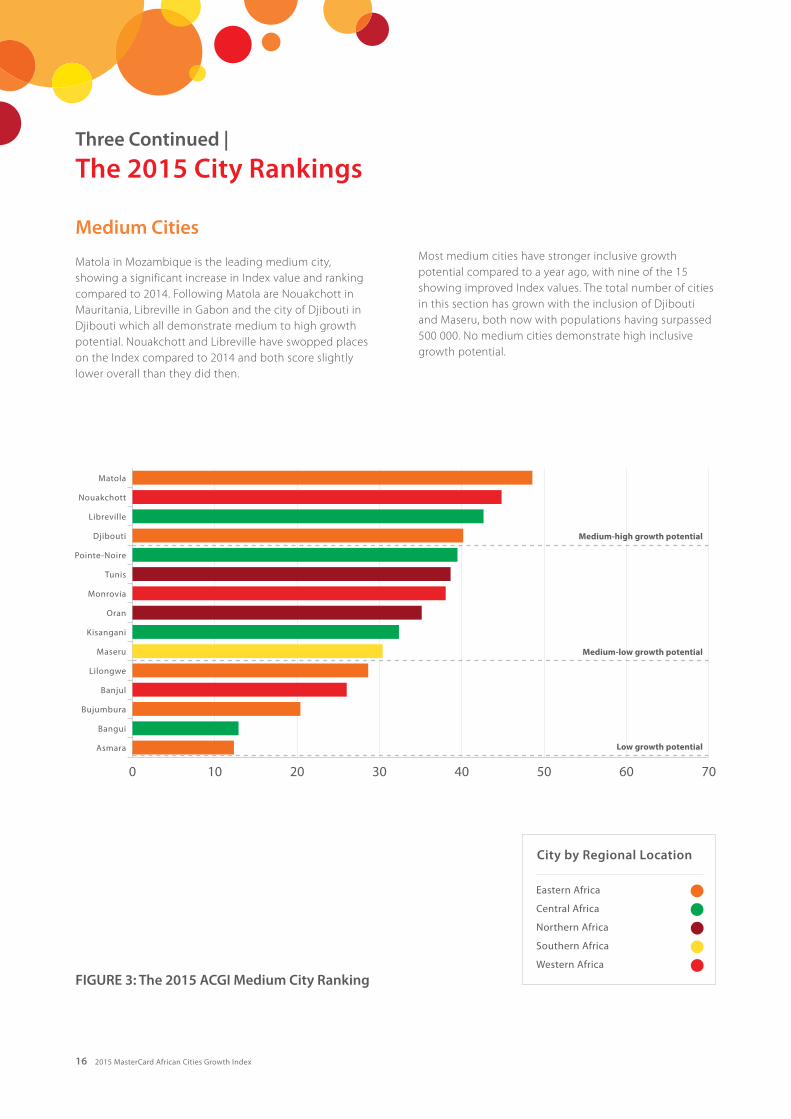
Matola in Mozambique is the leading medium city, showing a significant increase in Index value and ranking compared to 2014. Following Matola are Nouakchott in Mauritania, Libreville in Gabon and the city of Djibouti in Djibouti which all demonstrate medium to high growth potential. Nouakchott and Libreville have swopped places on the Index compared to 2014 and both score slightly lower overall than they did then.
Most medium cities have stronger inclusive growth potential compared to a year ago, with nine of the 15 showing improved Index values. The total number of cities in this section has grown with the inclusion of Djibouti and Maseru, both now with populations having surpassed 500 000. No medium cities demonstrate high inclusive growth potential.
FIGURE 3: The 2015 ACGI Medium City Ranking
2015 MasterCard African Cities Growth Index 17
Matola is adjacent to Maputo in Mozambique and is part of the Maputo agglomeration, with the cities showing parallels in elements of the index. Matola shares the benefits of some of the highest FDI as a percentage of GDP in the world, high GDP per capita growth, improving governance, a stable political environment and a growing number of citizens with financial accounts. Compared to Maputo, its population growth rate is faster; it has higher rates of household expenditure growth – indeed the highest rates of all medium-sized cities – and a higher percentage of middle class households. Matola has relatively poor but improving levels of health, education and service infrastructure.
Nouakchott benefits from Mauritania’s comparatively recent increases in FDI and infrastructure investment. Economic growth is led by the country’s extractive industries. The city scores in the middle position of most indices. Access to water is problematic and the city regularly has water supply crises.
Libreville, the capital city, is home to roughly half the population of Gabon. It is politically stable and fares comparatively well in health, education and infrastructure development. Its mobile cellular subscription rate is the highest of all cities assessed in the 2015 ACGI.
The city of Djibouti in Djibouti ranked second in the 2014 Small Cities category but in 2015 it falls into the medium city category, significantly increasing its index value at the same time. The city ranks highest in GDP per capita growth and in access to water. It benefits from substantial FDI and improved corruption control. However, it is restrained by its financial infrastructure, education, existing and developing physical infrastructure and poor cellular uptake.
The significant declines in the Index values of Tunis, the capital of Tunisia, and Banjul in The Gambia, are notable. Tunis, which ranked first in 2014 in the medium city category, has dropped below the medium to high growth potential range. It retains the highest positions in health, education, services infrastructure, air connectivity, governance, ease of doing business and middle class households as a percentage of all households. However, its economic fundamentals have weakened during a time of political transition. Banjul relies heavily on tourism, which was severely affected by fears of Ebola, and it suffered further economic constraints as a result of diminished confidence by investors and international donors.
18 2015 MasterCard African Cities Growth Index
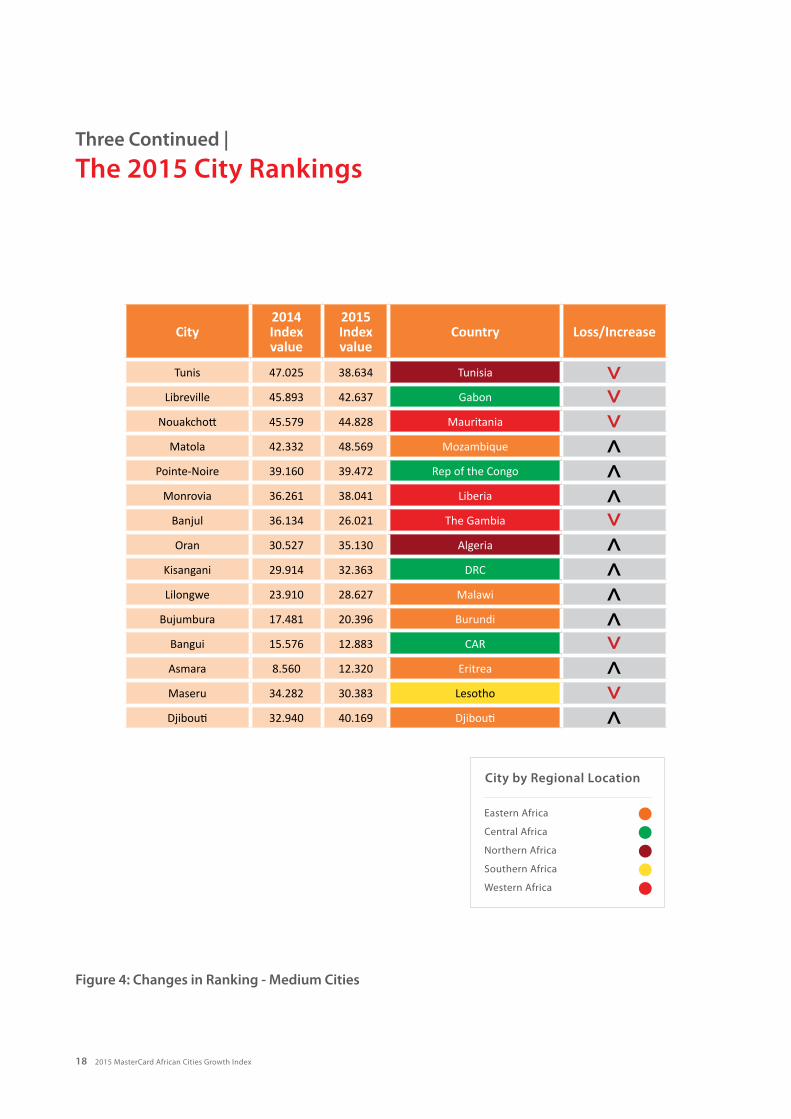
Figure 4: Changes in Ranking - Medium Cities
Three Continued |
The 2015 City Rankings
City2014 Index value
2015 Index value
Country Loss/Increase
Tunis 47.025 38.634 Tunisia
Libreville 45.893 42.637 Gabon
Nouakchott 45.579 44.828 Mauritania
Matola 42.332 48.569 Mozambique
Pointe-Noire 39.160 39.472 Rep of the Congo
Monrovia 36.261 38.041 Liberia
Banjul 36.134 26.021 The Gambia
Oran 30.527 35.130 Algeria
Kisangani 29.914 32.363 DRC
Lilongwe 23.910 28.627 Malawi
Bujumbura 17.481 20.396 Burundi
Bangui 15.576 12.883 CAR
Asmara 8.560 12.320 Eritrea
Maseru 34.282 30.383 Lesotho
Djibouti 32.940 40.169 Djibouti
2015 MasterCard African Cities Growth Index 19
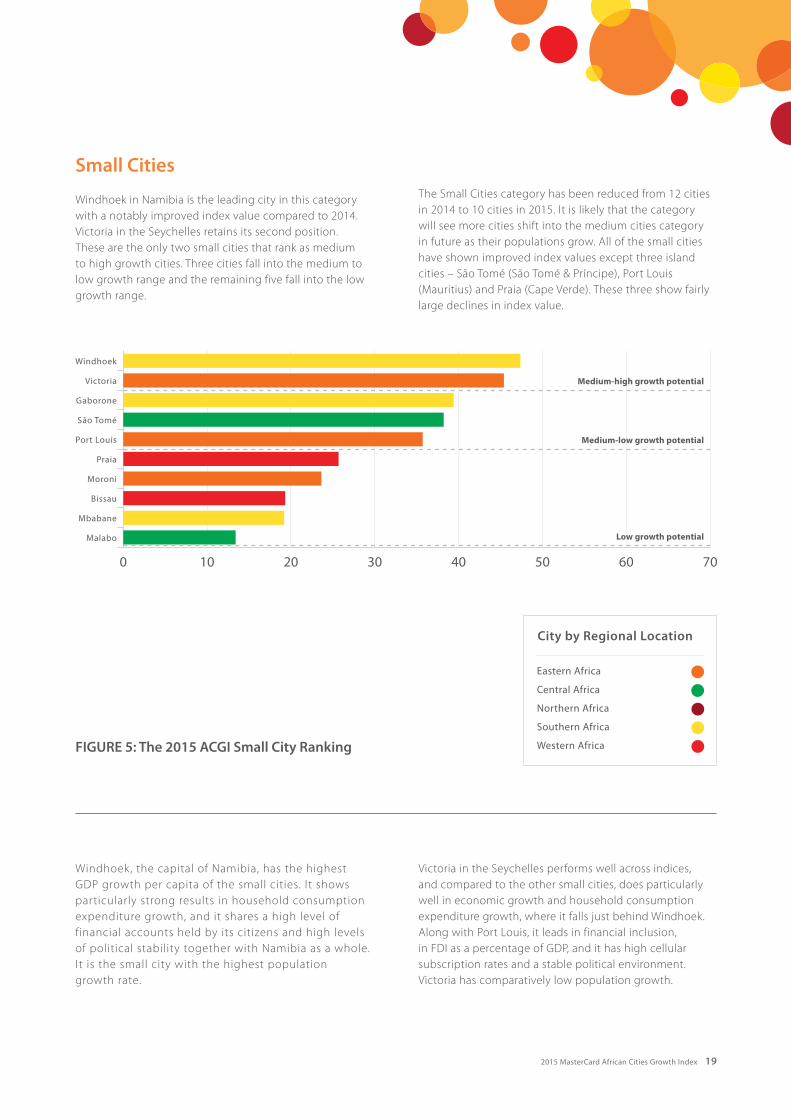
FIGURE 5: The 2015 ACGI Small City Ranking
Small Cities
Windhoek in Namibia is the leading city in this category with a notably improved index value compared to 2014. Victoria in the Seychelles retains its second position. These are the only two small cities that rank as medium to high growth cities. Three cities fall into the medium to low growth range and the remaining five fall into the low growth range.
The Small Cities category has been reduced from 12 cities in 2014 to 10 cities in 2015. It is likely that the category will see more cities shift into the medium cities category in future as their populations grow. All of the small cities have shown improved index values except three island cities – São Tomé (São Tomé & Príncipe), Port Louis (Mauritius) and Praia (Cape Verde). These three show fairly large declines in index value.
Windhoek, the capital of Namibia, has the highest GDP growth per capita of the small cities. I t shows particularly strong results in household consumption expenditure growth, and it shares a high level of financial accounts held by its citizens and high levels of political stability together with Namibia as a whole. I t is the small city with the highest population growth rate.
Victoria in the Seychelles performs well across indices, and compared to the other small cities, does particularly well in economic growth and household consumption expenditure growth, where it falls just behind Windhoek. Along with Port Louis, it leads in financial inclusion, in FDI as a percentage of GDP, and it has high cellular subscription rates and a stable political environment. Victoria has comparatively low population growth.
20 2015 MasterCard African Cities Growth Index
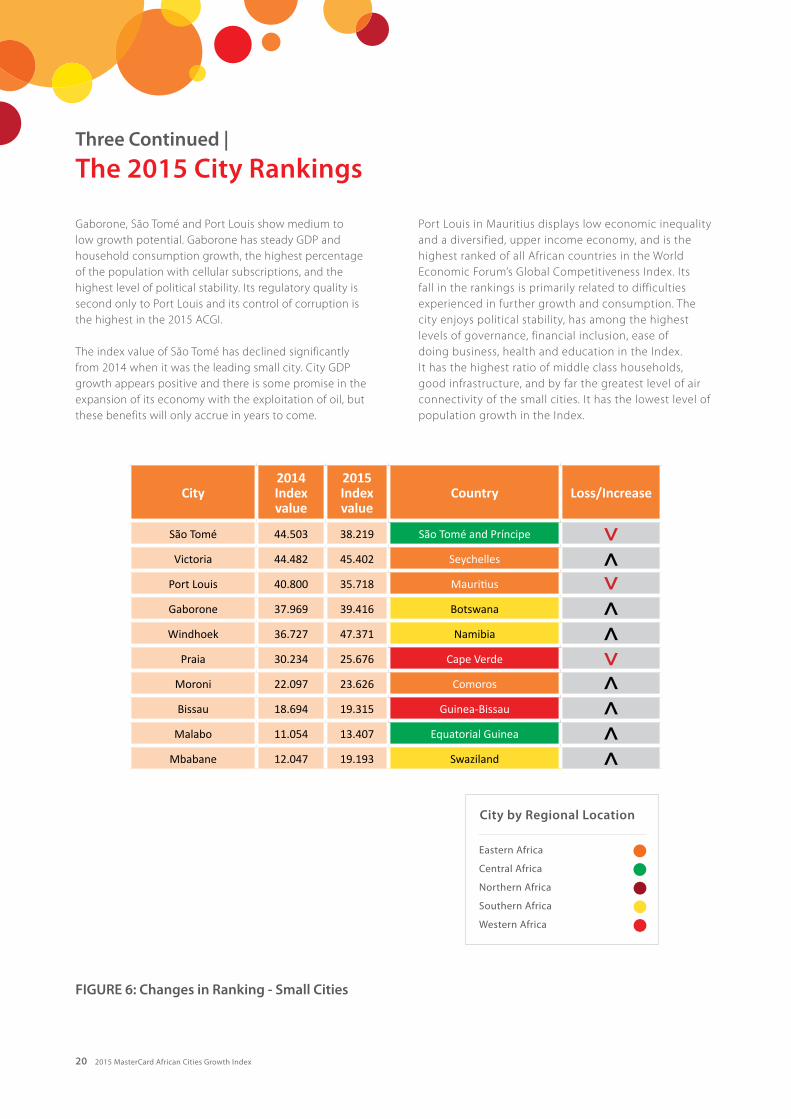
Gaborone, São Tomé and Port Louis show medium to low growth potential. Gaborone has steady GDP and household consumption growth, the highest percentage of the population with cellular subscriptions, and the highest level of political stability. Its regulatory quality is second only to Port Louis and its control of corruption is the highest in the 2015 ACGI.
The index value of São Tomé has declined significantly from 2014 when it was the leading small city. City GDP growth appears positive and there is some promise in the expansion of its economy with the exploitation of oil, but these benefits will only accrue in years to come.
Port Louis in Mauritius displays low economic inequality and a diversified, upper income economy, and is the highest ranked of all African countries in the World Economic Forum’s Global Competitiveness Index. Its fall in the rankings is primarily related to difficulties experienced in further growth and consumption. The city enjoys political stability, has among the highest levels of governance, financial inclusion, ease of doing business, health and education in the Index. It has the highest ratio of middle class households, good infrastructure, and by far the greatest level of air connectivity of the small cities. It has the lowest level of population growth in the Index.
FIGURE 6: Changes in Ranking - Small Cities
Three Continued |
The 2015 City Rankings
City2014 Index value
2015 Index value
Country Loss/Increase
São Tomé 44.503 38.219 São Tomé and Príncipe
Victoria 44.482 45.402 Seychelles
Port Louis 40.800 35.718 Mauritius
Gaborone 37.969 39.416 Botswana
Windhoek 36.727 47.371 Namibia
Praia 30.234 25.676 Cape Verde
Moroni 22.097 23.626 Comoros
Bissau 18.694 19.315 Guinea-Bissau
Malabo 11.054 13.407 Equatorial Guinea
Mbabane 12.047 19.193 Swaziland
2015 MasterCard African Cities Growth Index 21
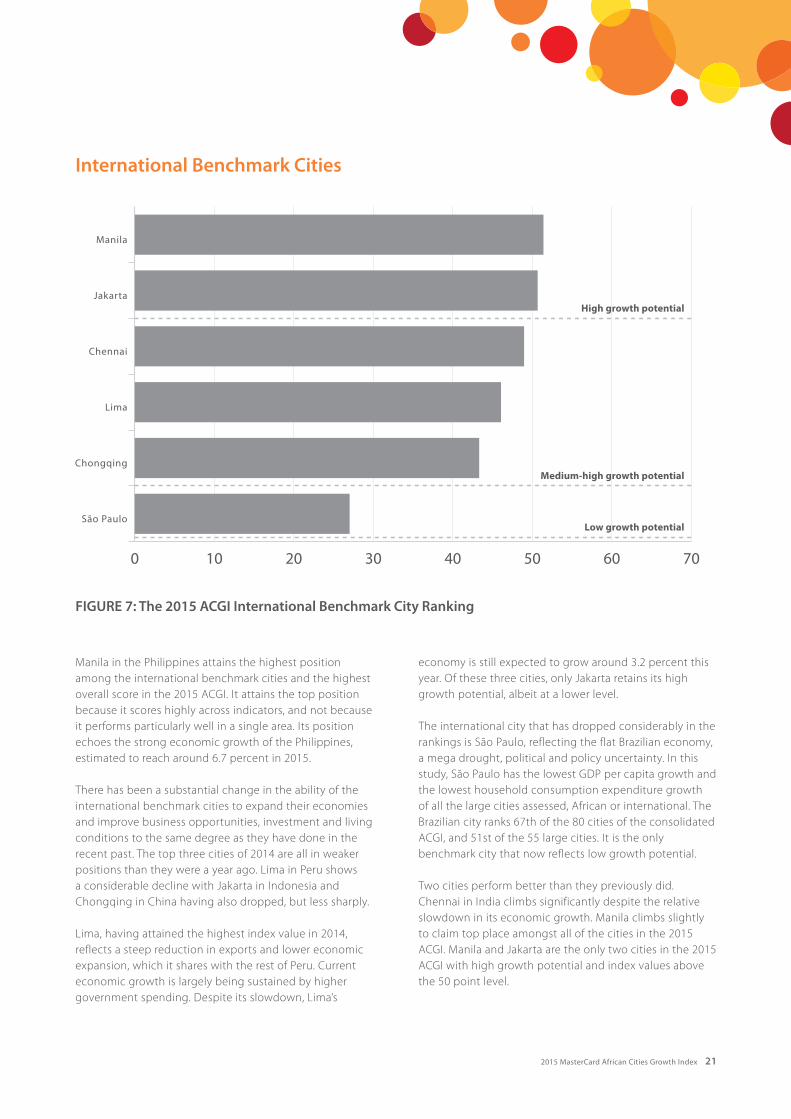
Manila in the Philippines attains the highest position among the international benchmark cities and the highest overall score in the 2015 ACGI. It attains the top position because it scores highly across indicators, and not because it performs particularly well in a single area. Its position echoes the strong economic growth of the Philippines, estimated to reach around 6.7 percent in 2015.
There has been a substantial change in the ability of the international benchmark cities to expand their economies and improve business opportunities, investment and living conditions to the same degree as they have done in the recent past. The top three cities of 2014 are all in weaker positions than they were a year ago. Lima in Peru shows a considerable decline with Jakarta in Indonesia and Chongqing in China having also dropped, but less sharply.
Lima, having attained the highest index value in 2014, reflects a steep reduction in exports and lower economic expansion, which it shares with the rest of Peru. Current economic growth is largely being sustained by higher government spending. Despite its slowdown, Lima’s
economy is still expected to grow around 3.2 percent this year. Of these three cities, only Jakarta retains its high growth potential, albeit at a lower level.
The international city that has dropped considerably in the rankings is São Paulo, reflecting the flat Brazilian economy, a mega drought, political and policy uncertainty. In this study, São Paulo has the lowest GDP per capita growth and the lowest household consumption expenditure growth of all the large cities assessed, African or international. The Brazilian city ranks 67th of the 80 cities of the consolidated ACGI, and 51st of the 55 large cities. It is the only benchmark city that now reflects low growth potential.
Two cities perform better than they previously did. Chennai in India climbs significantly despite the relative slowdown in its economic growth. Manila climbs slightly to claim top place amongst all of the cities in the 2015 ACGI. Manila and Jakarta are the only two cities in the 2015 ACGI with high growth potential and index values above the 50 point level.
FIGURE 7: The 2015 ACGI International Benchmark City Ranking
International Benchmark Cities
22 2015 MasterCard African Cities Growth Index
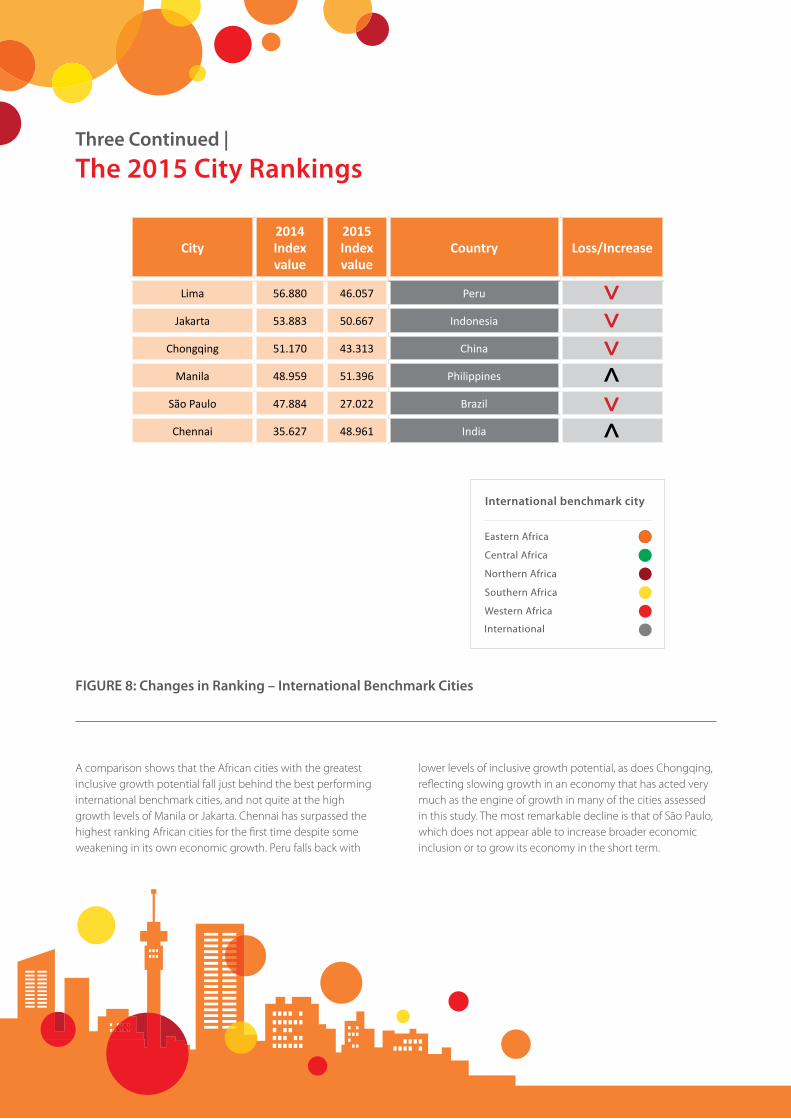
A comparison shows that the African cities with the greatest inclusive growth potential fall just behind the best performing international benchmark cities, and not quite at the high growth levels of Manila or Jakarta. Chennai has surpassed the highest ranking African cities for the first time despite some weakening in its own economic growth. Peru falls back with
lower levels of inclusive growth potential, as does Chongqing, reflecting slowing growth in an economy that has acted very much as the engine of growth in many of the cities assessed in this study. The most remarkable decline is that of São Paulo, which does not appear able to increase broader economic inclusion or to grow its economy in the short term.
FIGURE 8: Changes in Ranking – International Benchmark Cities
Three Continued |
The 2015 City Rankings
City2014 Index value
2015 Index value
Country Loss/Increase
Lima 56.880 46.057 Peru
Jakarta 53.883 50.667 Indonesia
Chongqing 51.170 43.313 China
Manila 48.959 51.396 Philippines
São Paulo 47.884 27.022 Brazil
Chennai 35.627 48.961 India
2015 MasterCard African Cities Growth Index 23
FIGURE 9: The 2015 ACGI Consolidated City Ranking
24 2015 MasterCard African Cities Growth Index
Four |
Discussion
After the Commodities Boom
Commodity exports remain the foundation of many African economies and the source of growth in many of their cities. For a number of commodity exporters the medium term outlook remains challenging with commodities unlikely to drive growth to the degree that they did in the past decade.
The effects are already evident. Lower oil revenues undermine efforts to resolve the crisis in South Sudan and they exacerbate Ghana’s economic recovery challenges. Equatorial Guinea’s ability to proceed with its economic and social development plans has been severely curtailed. Nigeria has reduced its capital spending and the naira has depreciated sharply. However some large exporters like Nigeria and Angola have sovereign wealth funds and low debt that give them the leeway to sustain their current infrastructure projects, at least in the near future. A decline in other economic sectors has been the consequence of the resource boom for many cities, but a number of countries have undertaken industrial diversification strategies to counter this, and the strategy is beginning to generate economic benefits.
Importers are experiencing a decrease in the costs of production, increased profit and greater investment opportunities. For exporters who don’t rely on metal and mineral exports, continued growth is more attainable with the stimulus of cheaper oil, and growth is more attainable in regions where domestic consumption has become a factor in their economies.
Consumption is playing a greater role in most of Africa’s urban economies with increasing disposable income and fast growing urban populations. Cities are hubs of economic activity because the highest earners are disproportionately concentrated there.
The size of a growing number of African urban agglomerations is astounding: greater Lagos has a population of 13 million; Cairo, 12 million; Kinshasa, 10 million; Luanda, six million; the urban clusters around Dar es Salaam, Johannesburg, Nairobi and Kano each has a population of over four million; Cape Town and Ibadan have over three million inhabitants. Africa’s cities have a combined population of 200 million people, a $1 trillion GDP, half a trillion dollars consumer spend, 17
million middle income households and 80 percent of the continent’s high income households11.
African urban markets are widening but also deepening. At the 2015 WEF on Africa, Martin Emodi of UBS noted that the increase in wealthy Africans has created a demand for specialized financial services, with growth now on par with Asia. Mobile financial services, although relatively established in parts of Africa, still have great potential for growth on the continent. Eight of the 10 countries with the highest utilization of mobile financial services are in Africa, where the bulk of online banking occurs in urban environments. South Africa’s National Business Initiative (NBI) has identified the development of new consumption opportunities as one area in which Africa can deliver $350 billion more per year in revenue and savings.
While these are the obvious attractions of its urban markets, the difficulties of operating in Africa are becoming increasingly clear, because markets are so diverse.
Johannesburg’s spend on transport services and vehicles is double that of Lagos, but Lagos’s spend on food and non-alcoholic beverages is five times greater than in Johannesburg12. The expansion of Standard Chartered Bank into Africa has been constrained by both managerial capacity and financial constraints. Wal-Mart has found it difficult to add new African stores to its existing 25 beyond its South African home market, facing problems such as logistics, high rental costs and duties. On the other hand, Shoprite has doubled its African outlets to 300, in part by developing its own properties with local partners. In a difficult patchwork of markets, Africa’s cities offer some of the highest opportunities for growth, but with caveats that are becoming increasingly identifiable.
Although the global economy is expected to grow at its slowest since the 2008 financial crisis, its 2.9% expansion should, with current levels of FDI and development assistance, sustain the economic growth of Africa’s citie13.
11, 12 Oxford Economics
13 OECD
2015 MasterCard African Cities Growth Index 25
Regional and Urban Integration
One of the greatest barriers to African cities’ economic expansion is the low level of internal trade within the continent. Africa’s regional trade relative to its total trade is 12 percent against Europe’s 72 percent and South East Asia’s 50 percent14. Knowing that transport, trade and physical distribution are positively correlated with levels of development, we can see that constraints on the movement of people, products, capital, information and ideas between the urban hubs of Africa are an enormous obstacle to their economic expansion.
The benefits of increased regional linkages are evident in a number of examples. The International Air Transport Association (IATA) notes that by opening just 12 identified markets, African aviation will increase the continent’s GDP by $1.3 billion per year and expand employment by over 150 000 jobs. A liberalization agreement in the early 2000s between South Africa and Kenya led to a 69 percent increase in air passenger traffic between the two countries15. Yet most African countries have not liberalized internal markets despite having done so in air marketsoutside Africa.
Restraint on trade and connectivity is physical but it is also financial. The World Bank identifies poor access to finance as a greater problem to business in Africa than poor infrastructure or corruption, with a shortfall in infrastructure finance running into the tens of billions of dollars every year. Standard Chartered made 10 percent of its profit in Africa in 2014 but its African loans accounted for only three percent of its global total. Financial infrastructure needs to develop in parallel with physical infrastructure and regulatory stability.
Conditions in Africa today should be seen in the light of Germany’s experience between 1825 and 1855 when its elimination of borders, tariffs and customs reduced costs equivalent to 130 kilometers of additional transport per unit of trade. More recently during the 1990s the USA-
Canadian border added costs equivalent to an extra 2,800 kilometers of transport per unit of trade16. Not unlike Germany, Africa’s economy will reduce its dependence on external demand and gain greater flexibility, independence and diversity through increased integration and the reduction of barriers.
The need for integration on the continent is widely recognized but there are very real impediments to its realization. African economies are mostly small, and moves to integration come at high cost and fears of reduced local oversight and control. A solution is regional collaboration with pooled resources that can meet the high costs of infrastructure development, coordination and skills development. A step in this direction has been taken with the launch of the Tripartite Free Trade Area. This planned Cape to Cairo trade zone will span 26 countries and three economic blocks. If fully realized, it will have a significant impact on economic growth in many African cities.
14 World Bank; WEF
15 IATA
16 Angelopulo G 2014. Connectivity. Communicatio 40(3):209-222.
26 2015 MasterCard African Cities Growth Index
Regional and Continental Trajectories
The African medium to high growth potential cities are all located in Eastern and Western Africa with the exception of Windhoek, Casablanca and Libreville. The highest ranking of these are primarily located in the east. However not all cities from Eastern and Western Africa are concentrated in the upper half of the ranking. Cities from both regions are evenly spread throughout the Index.
The Southern African cities perform very differently. If one includes South Africa’s neighbors Mozambique and Zimbabwe, it is evident that Africa’s cities with the greatest inclusive growth potential – Matola and Maputo in Mozambique, Windhoek in Namibia and to a lesser extent Gaborone in Botswana – surround cities in a region of anemic and low growth potential – Mbabane in Swaziland, Harare in Zimbabwe, Maseru in Lesotho and the cities of South Africa.
With the exception of Casablanca in Morocco, all North African cities fall into the medium to low growth potential range, and all Central Africa’s cities except Libreville are clustered in a region of lower growth potential. Luanda and Huambo in Angola have had limited success in translating the benefits of the country’s oil boom into a more diversified, equitable economy, and remain with the cities of Chad, Equatorial Guinea and the CAR in a region of low equitable growth potential.
A closer look at the region shows that Eastern African large cities have all undergone a uniform increase in growth potential except Kampala in Uganda, which shows a slight dip, and Harare in Zimbabwe, which shows a very significant drop to just above Conakry in Guinea, one of the cities contending with the Ebola crisis. Every medium city from the Eastern African region significantly improved its potential for inclusive growth over the past year. Djibouti’s growth potential was sufficient to move it into the medium to high growth range, the only city in the region to do so.
All three Eastern African small cities are located in island states. Victoria (Seychelles) and Moroni (Comoros) retain steady Index values, albeit at very different levels. Victoria scores comparatively well at 45.4 points and Moroni much lower at 23.6 points. Port Louis in Mauritius drops from the
medium to high growth range to the medium to low range. Reflecting these findings, six of the top 10 African tourism economies are in Eastern Africa17.
All Central African large cities have increased their index values except Brazzaville in the Republic of the Congo, which decreases slightly, and Luanda in Angola, which remains at the same level as before. The second Angolan city, Huambo, improves slightly. Kinshasa and Lubumbashi in the DRC show a significant improvement despite unrest in the east of the country. N’djamena in Chad shows a substantial increase off the bottom of the earlier rankings, and Yaounde in Cameroon reflects a significant increasein ranking. Of the medium sized cities, Pointe-Noire in the Republic of Congo is roughly unchanged but the effects of the reduced oil price may ultimately affect its ranking. Kisangani in the DRC improved slightly while Libreville in Gabon and Bangui in the CAR experienced reduced index values. The unsettled conditions in the CAR continue to undermine economic development in its capitalcity Bangui.
São Tomé in São Tomé and Príncipe drops from the highest small city position in 2014 to fourth this year, and is now more accurately typified as a city with medium to low equitable growth potential. Malabo in Equatorial Guinea improves its index value slightly.
Casablanca in Morocco, the highest scoring large city in Northern Africa, attains a lower score than it did in 2014 but Fes and Rabat, also in Morocco, have both improved. Cairo and Alexandria in Egypt attain higher scores this year while Tripoli in Libya declines significantly. The Northern African cities in Egypt, Algeria and Morocco reflect generally high levels of infrastructure, health and education in the comparative rankings. Tunis in Tunisia, the highest ranking medium sized city in 2014, lost more than eight points in the past year, while Oran in Algeria improved significantly. No Northern African small cities are included in the 2015 ACGI.
The only large cities in Southern Africa are South African, and all fall from their 2014 ACGI levels. Slow economic
2015 MasterCard African Cities Growth Index 27
growth combined with increasing populations support the prognosis that South Africa’s cities are likely to experience greater inequality over the next decade. Johannesburg, the African city with the largest economy, is not expected to generate equitable growth but it is expected to remain the African city with the most high income earners up to 2030, when it should also be overtaken by Lagos and Cairo in economic size18.
Not all of South Africa’s cities fare equally, with an 11 point spread between them. Pretoria is the South African city with the greatest potential for inclusive growth, followed by Johannesburg, Durban, Cape Town and Port Elizabeth. The key points differentiating the South African cities are population growth, with Pretoria growing significantly faster than Johannesburg; middle class households as a percentage of all households in the order of Pretoria, then Cape Town; GDP growth per capita is generally poor in comparison to all large cities except Harare, led by Durban and then Cape Town; while household expenditure growth is led by Pretoria and then Johannesburg. The last significant differentiator is air connectivity. Johannesburg and Pretoria share the airport with the greatest air connectivity in Africa while the other South African cities have airports with much less connectivity.
The only medium-sized city in Southern Africa is Maseru in Lesotho, which has moved up a category because of its population size. The capital of Lesotho loses index value at a similar rate to South Africa, its neighbor. Three Southern African small cities are included in the ACGI: Windhoek in Namibia, which has improved its position and is the highest scoring small African city; Gaborone in Botswana, which increases its index value slightly; and Mbabane in Swaziland, which also increased its score in 2015. The three small cities are closely linked to conditions in South Africa but they have avoided the ‘South African contagion’.
Western Africa is the region with the greatest mix in results among the large cities. All Nigerian cities improve on their 2014 scores. The effects of lower oil prices and a successful political transfer of power have not yet filtered through the data and it is possible that these will have both negative and positive effects on the future standing of Nigeria’s cities. Both Ghanaian cities attain lower scores, Accra more so than Kumasi, but both cities still have scores that are comparable to the higher-ranked of the ACGI cities. In the Ivory Coast, Abidjan has improved and Yamoussoukro remains similar to what it was in 2014. Dakar in Senegal
has shown a marked improvement that is reinforced by a steadily improving services sector.
Sierra Leone’s Freetown shows a massive decline from its third place position in 2014. The Ebola outbreak is the primary cause, with the city suffering substantially from the 25 percent reduction in the economy of the country. For the same reason, Conakry in Guinea attains only half the index value of a year previously. Cotonou in Benin and Niamey in Niger are slightly down. All other Western African cities have improved.
The three medium-sized cities of West Africa also show mixed results. Monrovia (Liberia) has improved although it drops a position in the ranking, Nouakchott (Mauritania) and Banjul (The Gambia) fall – Nouakchott very slightly but Banjul by a full 10 points for reasons presented above. Of Western Africa’s small cities, Praia in Cape Verde loses its position as a medium to low growth potential city with a score that has deteriorated since 2014, and Bissau in Guinea-Bissau remains steady but with low growth potential.
The rough pattern of growth by region identified in this study – Eastern Africa followed by Western Africa, Central Africa, Northern Africa and Southern Africa – is also indicated in other studies and longer term regionalGDP projections19.
In its Global Economic Prospects of 2015, the World Bank suggests that African growth will be constrained but resilient. In declining order of significance, a slowdown in BRICS and internal conflict are seen as the scenarios that will have the greatest impact on economic growth, with a collapse of capital flows and drought seen as other, more minor events that could slow growth. In the absence of such events, it appears with the evidence at hand that the cities assessed in the ACGI will continue to grow, but at a slower pace.
17 WEF
18, 19 Oxford Economics
28 2015 MasterCard African Cities Growth Index
Conclusion |
Technical Notes
Cities
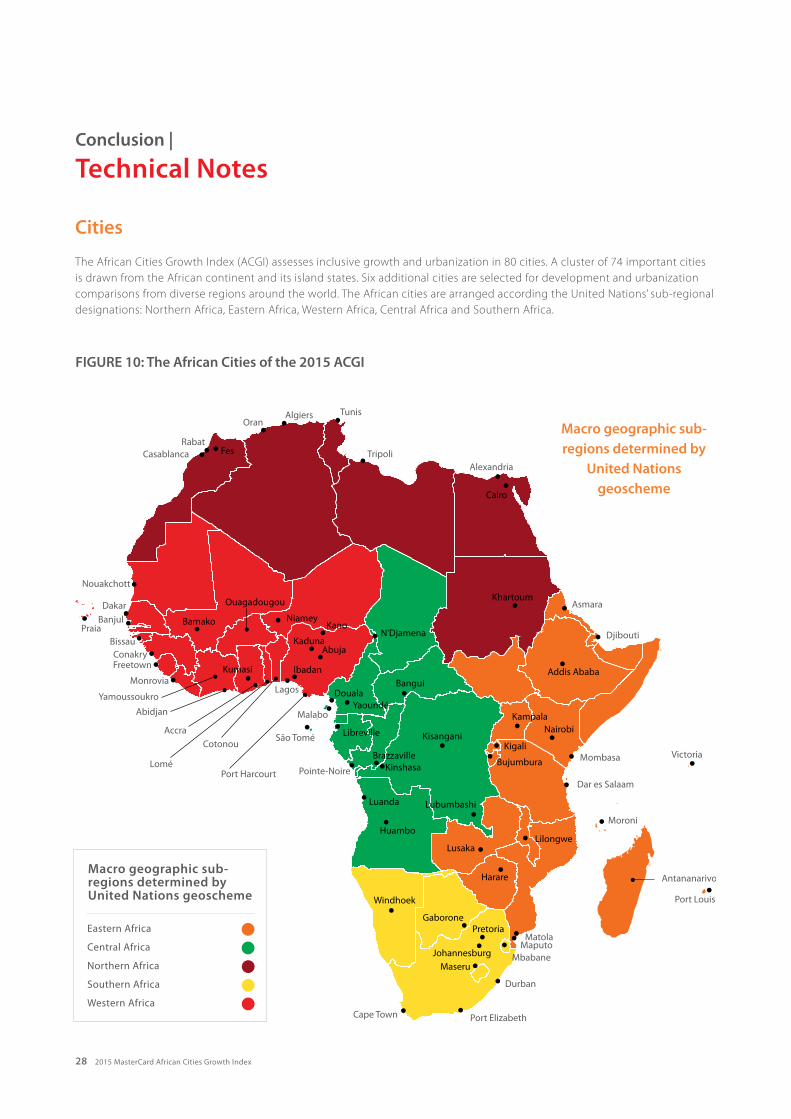
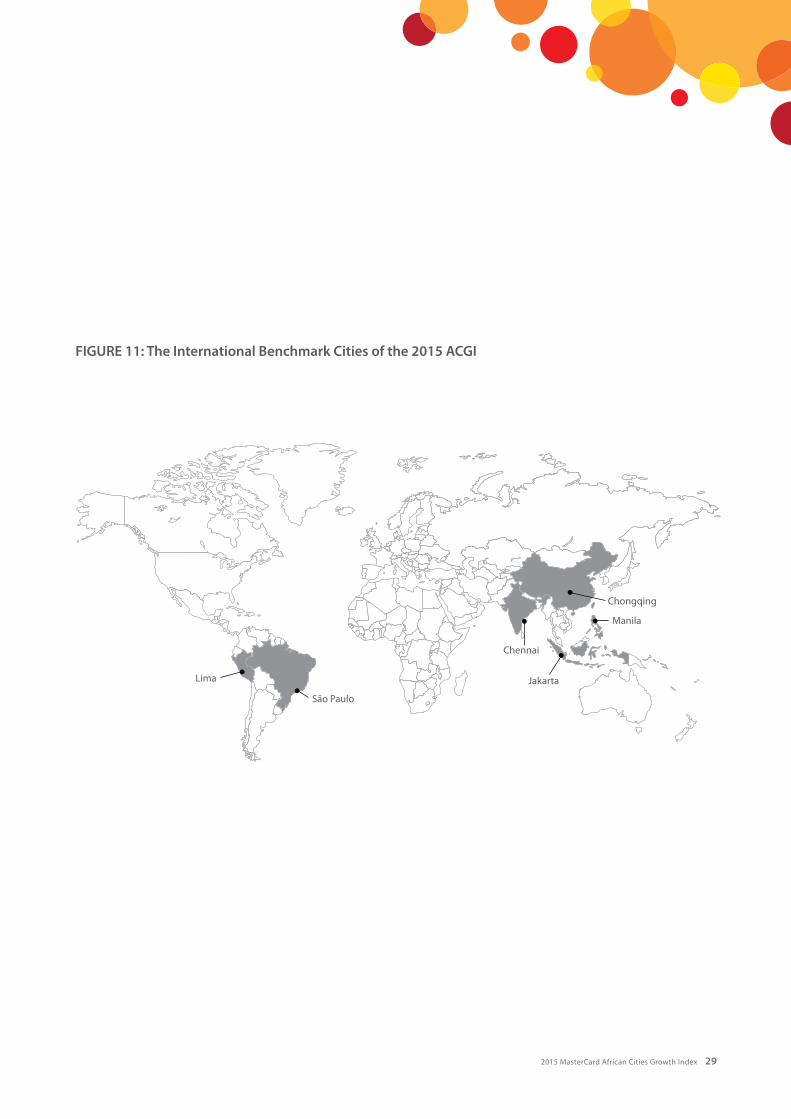
The African Cities Growth Index (ACGI) assesses inclusive growth and urbanization in 80 cities. A cluster of 74 important cities is drawn from the African continent and its island states. Six additional cities are selected for development and urbanization comparisons from diverse regions around the world. The African cities are arranged according the United Nations’ sub-regional designations: Northern Africa, Eastern Africa, Western Africa, Central Africa and Southern Africa.
FIGURE 10: The African Cities of the 2015 ACGI
Macro geographic sub-regions determined by
United Nations geoscheme
2015 MasterCard African Cities Growth Index 29
FIGURE 11: The International Benchmark Cities of the 2015 ACGI
30 2015 MasterCard African Cities Growth Index
Data Indicators
The ACGI analyses inclusive growth and urbanization using two composite sets of indicators titled alpha and beta sets.
The alpha set includes the following variables: • Gross Fixed Capital Formation as a percentage of GDP – Value of net fixed asset acquisition in the economy including new value added to the economy rather than consumed and land improvements, plant, machinery, roads, railways, schools, buildings. (2013). Multiply by 100 as the data is already a percentage. Sources: World Bank, World Development Indicators & United Nations (http://data.worldbank.org/data-catalog/world-development-indicators).
• Electricity – Percentage of urban population with access to electricity. Doing Business component: a composite measure of the procedures, time and cost for a small to medium-size business to get a new electricity connection for a standardized warehouse with standardized electricity needs. The warehouse is assumed to be located in the largest business city, in an area where electricity is most easily available. Libya uses 2011 for 2012, as 2012 data is not available. (Updated, 2014). Data as is, already indexed. Source: World Bank (www.doingbusiness.org).
• Water – Percentage of the population with access to water. (Latest 2012). Multiply by 100 as the data is already a percentage. Moroni (2010), Malabo (2006), Asmara (2008), Tripoli (2001) using single point older data due to lack of updates. Source: World Bank, World Development Indicators (http://data.worldbank.org/data-catalog/world-development-indicators).
• Sanitation – Percentage of the population with access to sanitation facilities. (Latest 2012). Multiply by 100 as the data is already a percentage. Moroni (2010), Malabo (2006), Asmara (2008) using single point older data due to lack of updates. Source: World Bank, World Development Indicators (http://data.worldbank.org/data-catalog/world-development-indicators).
• Health – A component of the overall HDI Ranking, the Health Index measures average life expectancy in each country at birth, expressed as an index using a minimum value of 20 years and observed maximum value over 1980-2010. (Latest 2013). Source: United Nations (http://hdrstats.undp.org/en/tables/).
• Education – A component of the overall HDI Ranking, the Education Index is measured by the adult literacy rate (with two-thirds weighting) and the combined primary, secondary, and tertiary gross enrolment ratio (with one-third weighting). The adult literacy rate gives an indication of the ability to read and write, while the GER gives an indication of the level of education from nursery (UK and others)/kindergarten (USA and others) to post-graduate education. (Latest 2013). Source: United Nations (http://hdrstats.undp.org/en/tables/).
• Financial Access – Denotes the percentage of respondents with an account (self or together with someone else) at a bank, credit union, another financial institution such as cooperative, microfinance institution, post office if applicable, including respondents who reported having a debit card, adjusted for urban population. (2014). Multiply by 100 as the data is already a percentage. Source: World Bank, FINDEX.
• Air Connectivity – Special cut of the MasterCard Global Destination Cities Project. (2014). Measures the number of annual flights to the base city from other cities with each city pair weighted by whether the flight route was domestic (weight:1), intra-regional (weight:2) or inter-regional (weight:3). A base city’s Air Connectivity score is the sum of these weighted flight route scores. No scheduled flights out of Yamoussoukro (Ivory Coast). Negative raw scores are set at 0. Divisor is Jakarta-2012 from 2014 Report. Source: MasterCard Model (http://www.masterintelligence.com/upload/325/262/Insights-GlobalDestinationCitiesIndex-S5.pdf ).
• Air Capacity – Special cut of the MasterCard Global Destination Cities Project. (2014). Measures by number the annual seat capacity to the base city from other cities with each city pair weighted by whether the flight route was domestic (weight:1), intra-regional (weight:2) or inter-regional (weight:3). A base city’s Air Capacity score is the sum of these weighted flight route scores. No scheduled flights out of Yamoussoukro (Ivory Coast). Negative raw scores are set at 0. Divisor is Jakarta-2012 from 2014 Report. Source: MasterCard Model (http://www.masterintelligence.com/upload/325/262/Insights-GlobalDestinationCitiesIndex-S5.pdf ).
• GDP Per Capita Growth – Projected average real GDP per capita growth at city level. (2014-2019). Negative raw scores are set at 0. Divisor is Chongqing (2012) from 2014 Report. Source: Canback Danglar (www.cgidd.com).
2015 MasterCard African Cities Growth Index 31
• Foreign Direct Investment as a percentage of GDP – Direct investment in production or business by a company from another country. (Latest 2013). Negative raw scores are set at 0. Divisor is Democratic Republic of Congo-2011 from 2014 Report. Source: UNCTAD (www.unctad.org).
• Household Consumption Expenditure Growth – Projected household consumption real growth at city level. (2014-2019). Negative raw scores are set at 0. Divisor is Chongqing (2012) from 2014 Report. Source: Canback Danglar (www.cgidd.com).
• Mobile Telephone Subscriptions – Mobile cell telephone subscriptions as percentage of population aged 15-64 years old. (2013). Negative raw scores are set at 0. Divisor is South Africa-2011 from 2014 Report. Source: ITU (www.cgidd.com).
The beta set includes the following variables: • Political Stability and Absence of Violence – Reflects perceptions of the likelihood that the government will be destabilized or overthrown by unconstitutional or violent means, including politically motivated violence and terrorism. (2013). Raw index range is from -3.5 to 3.5, transformed to a 0 -100 range using a linear transformation. Source: World Bank, World Governance Indicators (http://info.worldbank.org/governance/wgi/index.aspx#home).
• Regulatory Quality – Reflects perceptions of the ability of the government to formulate and implement sound policies and regulations that permit and promote private sector development. (2013). Raw index range is from -3.5 to 3.5, transformed to a 0 -100 range using a linear transformation. Source: World Bank, World Governance Indicators (http://info.worldbank.org/governance/wgi/index.aspx#home).
• Voice and Accountability – Reflects perceptions of the extent to which a country’s citizens are able to participate in selecting their government, as well as freedom of expression, freedom of association, and a free media. (2013). Raw index range is from -3.5 to 3.5, transformed to a 0 -100 range using a linear transformation. Source: World Bank, World Governance Indicators (http://info.worldbank.org/governance/wgi/index.aspx#home).
• Government Effectiveness – Reflects perceptions of the quality of public services, the quality of the civil service and the degree of its independence from political pressures, the quality of policy formulation and implementation, and the credibility of the government’s commitment to such policies. (2013). Raw index range is from -3.5 to 3.5, transformed to a 0 -100 range using a linear transformation. Source: World Bank, World Governance Indicators (http://info.worldbank.org/governance/wgi/index.aspx#home).
• Rule of Law – Reflects perceptions of the extent to which agents have confidence in and abide by the rules of society, and in particular the quality of contract enforcement, property rights, the police, and the courts, as well as the likelihood of crime and violence. (2013). Raw index range is from -3.5 to 3.5, transformed to a 0 -100 range using a linear transformation. Source: World Bank, World Governance Indicators (http://info.worldbank.org/governance/wgi/index.aspx#home).
32 2015 MasterCard African Cities Growth Index
• Control of Corruption – Reflects perceptions of the extent to which public power is exercised for private gain, including both petty and grand forms of corruption, as well as “capture” of the state by elites and private interests. (2013). Raw index range is from -3.5 to 3.5, transformed to a 0 -100 range using a linear transformation. Source: World Bank, World Governance Indicators (http://info.worldbank.org/governance/wgi/index.aspx#home). • Doing Business – Ease of doing business index of regulations divided into 10 components directly affecting businesses, excluding electricity component. (2014). Libya uses 2011 for 2012, as 2012 not available. Data as is, already indexed. Source: World Bank, World Governance Indicators (www.doingbusiness.org).
• City Population Growth – Growth in city numbers as a percentage of city population. (2013). Negative raw scores are set at 0. Divisor is Abuja-2012 from 2014 Report. Source: Canback Danglar (www.cgidd.com).
• GDP Per Capita Growth – GDP per capita real growth at city level. (Updated 2014). GDP per Capita real growth at the city level. Gaborone, Praia, Moroni, Djibouti, Malabo, Bissau, Maseru, Port Louis, Windhoek, São Tomé, Victoria, Mbabane, Banjul use urban area figures adjusted to the population of the relevant city. Negative raw scores are set at 0. Divisor is Chongqing (2012) from 2014 Report. Source: Canback Danglar (www.cgidd.com).
• National Urbanization – Percentage of urban population to total population. (Updated 2013). Multiply by 100 as data is already a percentage. Source: United Nations (United Nations, World Urbanization Prospects: The 2011 Revision).
• Household Consumption Expenditure Growth – Household consumption real growth at city level. (Updated 2014). Gaborone, Praia, Moroni, Djibouti, Malabo, Bissau, Maseru, Port Louis, Windhoek, São Tomé, Victoria, Mbabane, Banjul use urban area figures adjusted to the population of the relevant city. Negative raw scores are set at 0. Divisor is Chongqing (2012) from 2014 Report. Source: Canback Danglar (www.cgidd.com).
• Middle Class Households as a Percentage of Total Households – Households in each city are classified by their socio-economic status as defined by the AMAI. (2014).
A/B: Upper Class – This is the segment with the highest material living standards. The profile of the family head of these homes is composed of individuals with an education level of a Bachelor’s degree or higher. They live in luxury houses or apartments with all services and amenities.
C+: Upper Mid – This segment contains those with income and/or lifestyle slightly superior to those of the middle class. The profile of the family head of these homes is of individuals with an educational level of Bachelor’s degree. Generally they live in houses or apartments of their own, some are luxury homes and they have all amenities.
C: Middle Class – This segment contains what is typically known as middle class. The profile of the family head of these homes is of individuals with an educational level of mostly high school. Homes belonging to this segment are houses or apartments that can be owned or rented with some amenities.
D+: Lower Mid – This segment includes those homes with income and/or lifestyle slightly inferior to those of the middle class. They possess the best living standards among the lower class. The profile of the family head of these homes is composed of individuals with an educational level of junior high or elementary school completed. Homes belonging to this segment are in their majority owned, although some people rent the property and some are social interest homes. D: Low – This is the middle segment of the lower classes. The profile of the family head of these homes is formed by individuals with an educational level averaging elementary school (complete in most cases). Homes belonging to this segment are owned or rented like, tenement houses and social interest habitational units or they are underfrozen rents.
E: Lowest - This segment is not usually included in marketing segmentation. The profile of the family head is of individuals with an educational level of unfinished elementary school. These people usually lack properties, so they live or use other resources to acquire housing. Usually many generations live under the same roof, and they are frugal.
For this project we assume the middle class to comprise of levels D+, C, C+. Gaborone, Praia, Moroni, Djibouti, Malabo, Bissau, Maseru, Port Louis, Windhoek, São Tomé, Victoria, Mbabane, Banjul use urban area figures adjusted to the population of the relevant city. Multiply by 100 as the data is already a percentage. Source: Canback Danglar (www.cgidd.com).
20 http://www.potgieter.org/doku.php?id=mv index
2015 MasterCard African Cities Growth Index 33
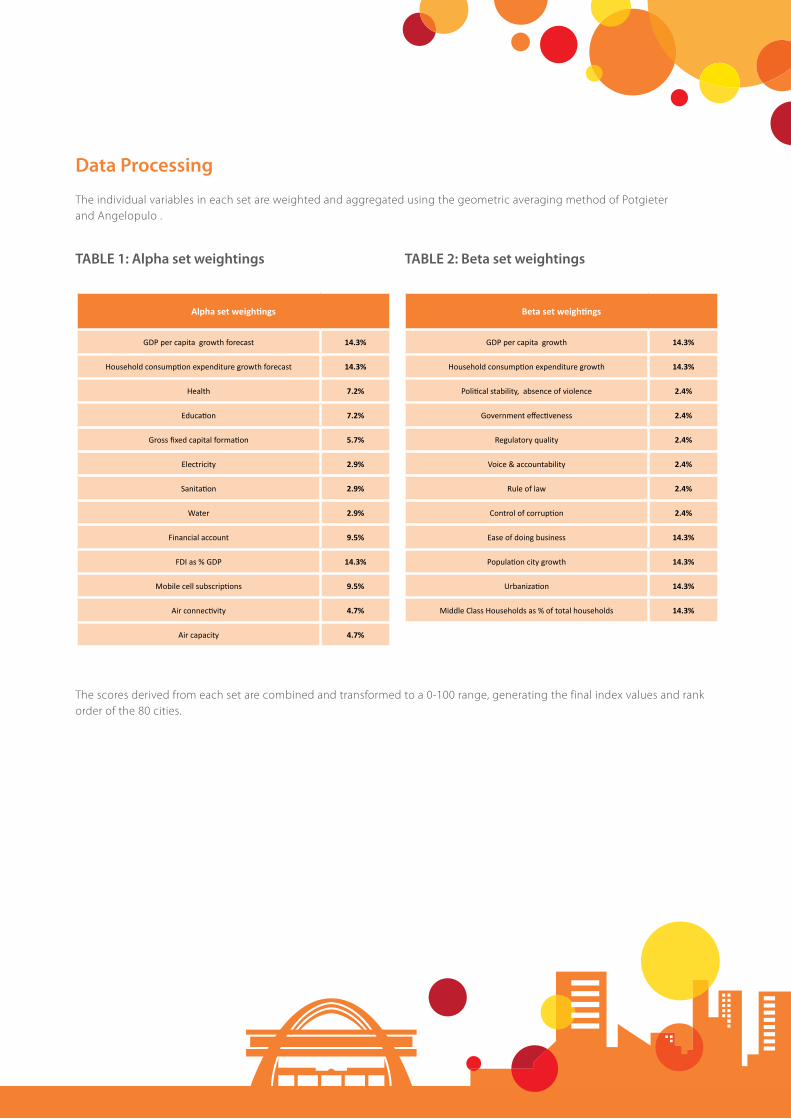
Data Processing
The individual variables in each set are weighted and aggregated using the geometric averaging method of Potgieterand Angelopulo .
The scores derived from each set are combined and transformed to a 0-100 range, generating the final index values and rank order of the 80 cities.
TABLE 1: Alpha set weightings TABLE 2: Beta set weightings
Alpha set weightings
GDP per capita growth forecast 14.3%
Household consumption expenditure growth forecast 14.3%
Health 7.2%
Education 7.2%
Gross fixed capital formation 5.7%
Electricity 2.9%
Sanitation 2.9%
Water 2.9%
Financial account 9.5%
FDI as % GDP 14.3%
Mobile cell subscriptions 9.5%
Air connectivity 4.7%
Air capacity 4.7%
Beta set weightings
GDP per capita growth 14.3%
Household consumption expenditure growth 14.3%
Political stability, absence of violence 2.4%
Government effectiveness 2.4%
Regulatory quality 2.4%
Voice & accountability 2.4%
Rule of law 2.4%
Control of corruption 2.4%
Ease of doing business 14.3%
Population city growth 14.3%
Urbanization 14.3%
Middle Class Households as % of total households 14.3%
34 2015 MasterCard African Cities Growth Index
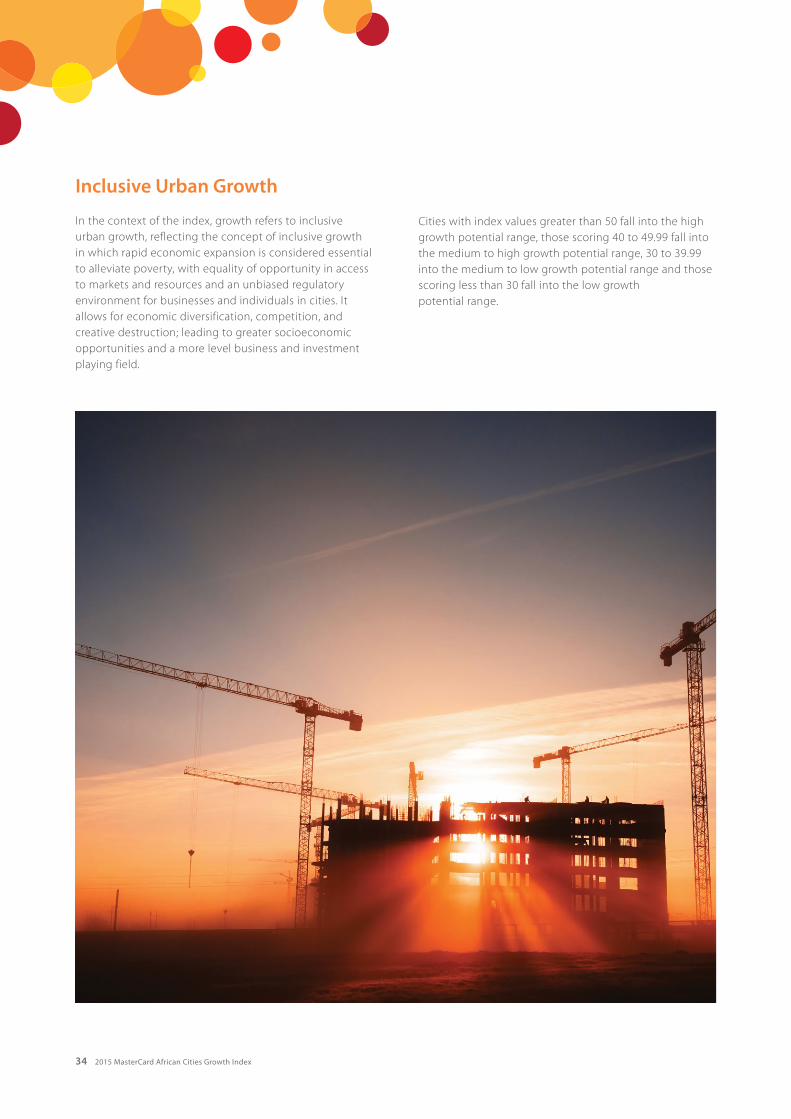
Inclusive Urban Growth
In the context of the index, growth refers to inclusive urban growth, reflecting the concept of inclusive growth in which rapid economic expansion is considered essential to alleviate poverty, with equality of opportunity in access to markets and resources and an unbiased regulatory environment for businesses and individuals in cities. It allows for economic diversification, competition, and creative destruction; leading to greater socioeconomic opportunities and a more level business and investment playing field.
Cities with index values greater than 50 fall into the high growth potential range, those scoring 40 to 49.99 fall into the medium to high growth potential range, 30 to 39.99 into the medium to low growth potential range and those scoring less than 30 fall into the low growthpotential range.
2015 MasterCard African Cities Growth Index 35
Professor George Angelopulo has been with the University of South Africa (Unisa) since 1993, focusing on the communication and research contexts of organisations and business, media, marketing, social dynamics and urbanisation. His particular interest is the development and application of methodologies that can be used to understand these phenomena and the interactions between them.
George holds a DLitt et Phil from the University of Johannesburg, and other than his affiliation with Unisa is also a visiting faculty member and research collaborator at CENTRUM Católica, the business school of the Pontificia Universidad Católica del Perú. He has developed diagnostics for stakeholder perception analysis that include the iBrand Barometer® and Communication Prioritization Index®, participated as a member of the MasterCard Africa Knowledge Panel, the Media Policy and Democracy Project, the global Media Concentration Project of Columbia University’s Institute of Tele Information, and he conducts research for the MasterCard African Cities Growth Index. Prior to his academic career George was involved in media and marketing in Sub-Saharan Africa.
About the author |
Professor George Angelopulo
36 2015 MasterCard African Cities Growth Index
Notes