2015 Local Public Health Act Performance Measures (Data … · Domain 6: Enforce Public Health Laws...
95
2015 Local Public Health Act Performance Measures DATA BOOK AUGUST 2016 HEALTH PARTNERSHIPS DIVISION, PUBLIC HEALTH PRACTICE SECTION MDH Health Partnerships Division Public Health Practice Section PO Box 64957 St. Paul, MN 55164-0975 Phone: 651-201-3880 Email: [email protected] Online: www.health.state.mn.us/divs/opi/
Transcript of 2015 Local Public Health Act Performance Measures (Data … · Domain 6: Enforce Public Health Laws...
2015 Local Public Health Act Performance Measures DATA BOOK
AUGUST 2016
HEALTH PARTNERSHIPS DIVISION, PUBLIC HEALTH PRACTICE SECTION
MDH Health Partnerships Division Public Health Practice Section PO Box 64957 St. Paul, MN 55164-0975 Phone: 651-201-3880 Email: [email protected] Online: www.health.state.mn.us/divs/opi/
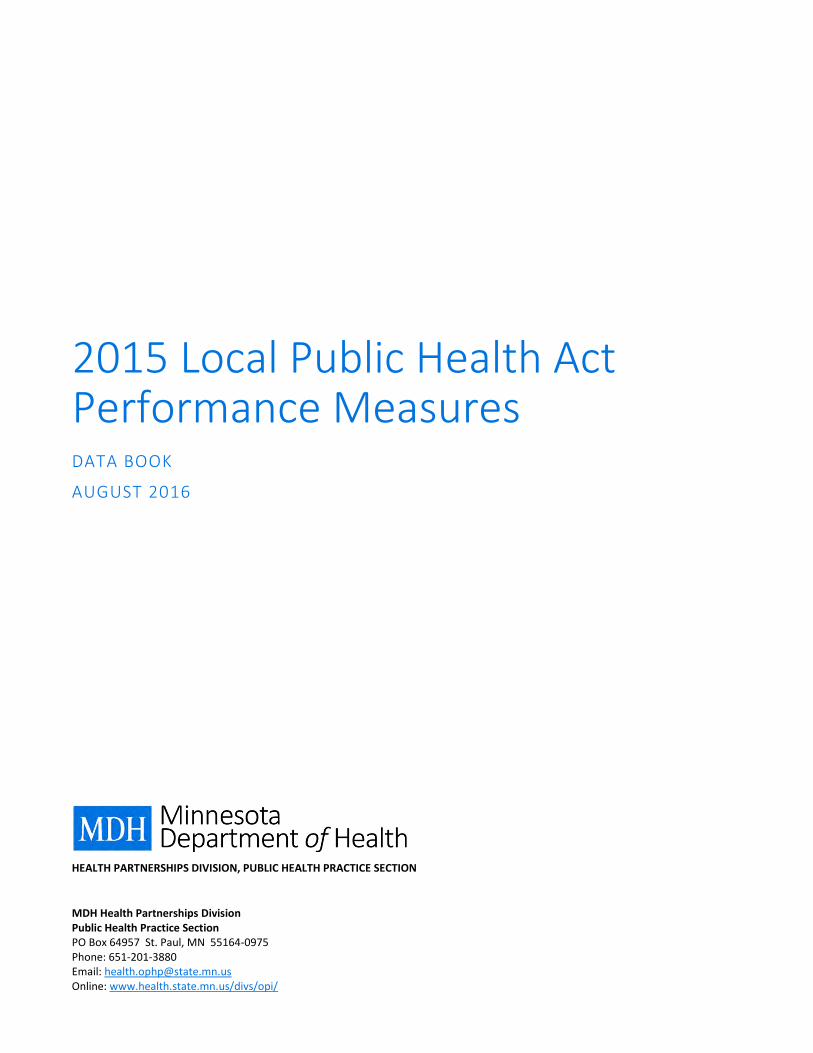
Contents About the Annual Reporting Data Book ...................................................................................................................................... 3 Assure an Adequate Local Public Health Infrastructure: Capacity Measures from National Standards ..................................... 4
Subset of 37 Key Public Health Measures, 2015-2018 ............................................................................................................ 5 Key Subset of Public Health Measures by Population ............................................................................................................. 7 Domain 1: Conduct and Disseminate Assessments Focused on Population Health Status and Public Health Issues Facing the Community ........................................................................................................................................................................ 9 Domain 2: Investigate Health Problems and Environmental Public Health Hazards to Protect the Community .................. 11 Domain 3: Inform and Educate about Public Health Issues and Functions ........................................................................... 12 Domain 5: Develop Public Health Policies and Plans ............................................................................................................. 14 Domain 6: Enforce Public Health Laws .................................................................................................................................. 16 Domain 7: Promote Strategies to Improve Access to Health Care ........................................................................................ 17 Domain 8: Maintain a Competent Public Health Workforce ................................................................................................. 20 Domain 9: Evaluate and Continuously Improve Processes, Programs, and Interventions .................................................... 21 Domain 10: Contribute to and Apply the Evidence Base of Public Health ............................................................................ 24 Domain 11: Maintain Administrative and Management Capacity ........................................................................................ 25 Domain 12: Maintain Capacity to Engage the Public Health Governing Entity ..................................................................... 26
Assure an Adequate Local Public Health Infrastructure: Minnesota-Specific Measures ........................................................... 28 Workforce Competency ......................................................................................................................................................... 28 School Health ......................................................................................................................................................................... 32 Health Equity ......................................................................................................................................................................... 33 Organizational Quality Improvement Maturity ..................................................................................................................... 38 Organizational QI Maturity Score .......................................................................................................................................... 44 Health Informatics ................................................................................................................................................................. 46 Voluntary Public Health Accreditation................................................................................................................................... 51
Promote Healthy Communities and Healthy Behaviors ............................................................................................................ 56 Active Living ........................................................................................................................................................................... 56 Healthy Eating ........................................................................................................................................................................ 59 Tobacco-Free Living ............................................................................................................................................................... 62 Alcohol ................................................................................................................................................................................... 64 Maternal and Child Health (WIC) ........................................................................................................................................... 68
Prevent the Spread of Communicable Diseases ........................................................................................................................ 69 Immunizations ....................................................................................................................................................................... 69 Infectious Disease Services .................................................................................................................................................... 74
Protect Against Environmental Health Hazards......................................................................................................................... 78 Indoor Air: Minnesota Clean Indoor Air Act .......................................................................................................................... 78 Indoor Air: Mold .................................................................................................................................................................... 79 Blood Lead ............................................................................................................................................................................. 81 Drinking Water Protection and Well Management ............................................................................................................... 82 Extreme Weather ................................................................................................................................................................... 84 Nuisance Investigations ......................................................................................................................................................... 85
Assure Health Services ............................................................................................................................................................... 88 Clinical-Community Linkages ................................................................................................................................................. 88 Barriers and Services.............................................................................................................................................................. 89 Provision of Public Health Services ........................................................................................................................................ 93
Community Health Boards by Population ................................................................................................................................. 94 Areas of Public Health Responsibility ........................................................................................................................................ 95
2015 LOCAL PUBLIC HEALTH ACT PERFORMANCE MEASURES [DATA BOOK]
MDH HEALTH PARTNERSHIPS DIVISION 3 APRIL 2016
About the Annual Reporting Data Book Minnesota community health boards report annually to the Minnesota Department of Health on Local Public Health Act (LPH Act) performance measures that span six areas of public health responsibility (see appendices for six areas).
The purpose of this data book is to present state-level findings for each of the LPH Act measures. This report communicates findings from the 2015 reporting period. For more information on tailored reports specific to each community health board, contact:
Minnesota Department of Health Health Partnerships Division, Public Health Practice Section Phone: 651-201-3880 Email: [email protected] Online: www.health.state.mn.us
This report does not include data on the area of public health responsibility “Prepare and respond to emergencies;” data for that area of responsibility is collected by the MDH Emergency Preparedness and Response Section.
Reporting Instructions Instructions for reporting on all six areas of public health responsibility can be found online: www.health.state.mn.us/ppmrs/. Data reported was collected between January 1 and December 31, 2015.
Interpretation and Assistance In the interest of swift release and of transparency, the Public Health Practice Section has released this data book. We understand that there are data limitations and that measures are not fully described here. If there are measures that interest you, or you would like further assistance, we are happy to discuss these with you. Please contact us using the information above.
The State Community Health Services Advisory Committee (SCHSAC) Performance Improvement Steering Committee has reviewed these findings and will release recommendations for system improvement later this year.
Community Health Board Population In this report, you will often see data broken out by community health board population; for more information on how community health boards are divided by population, please refer to the appendices. MDH has used population data from 2014 for this report, which is the most recently available population data.
Funding for This Report This report was supported by funds made available from the Centers for Disease Control and Prevention, Office for State, Tribal, Local, and Territorial Support, under Federal Award Identification Number (FAIN) B01OT009029. The content in this report is that of the authors, and does not necessarily represent the official position of or endorsement by the Centers for Disease Control and Prevention.
2015 LOCAL PUBLIC HEALTH ACT PERFORMANCE MEASURES [DATA BOOK] ASSURE AN ADEQUATE LOCAL PUBLIC HEALTH INFRASTRUCTURE: CAPACITY MEASURES FROM NATIONAL STANDARDS
MDH HEALTH PARTNERSHIPS DIVISION 4 APRIL 2016
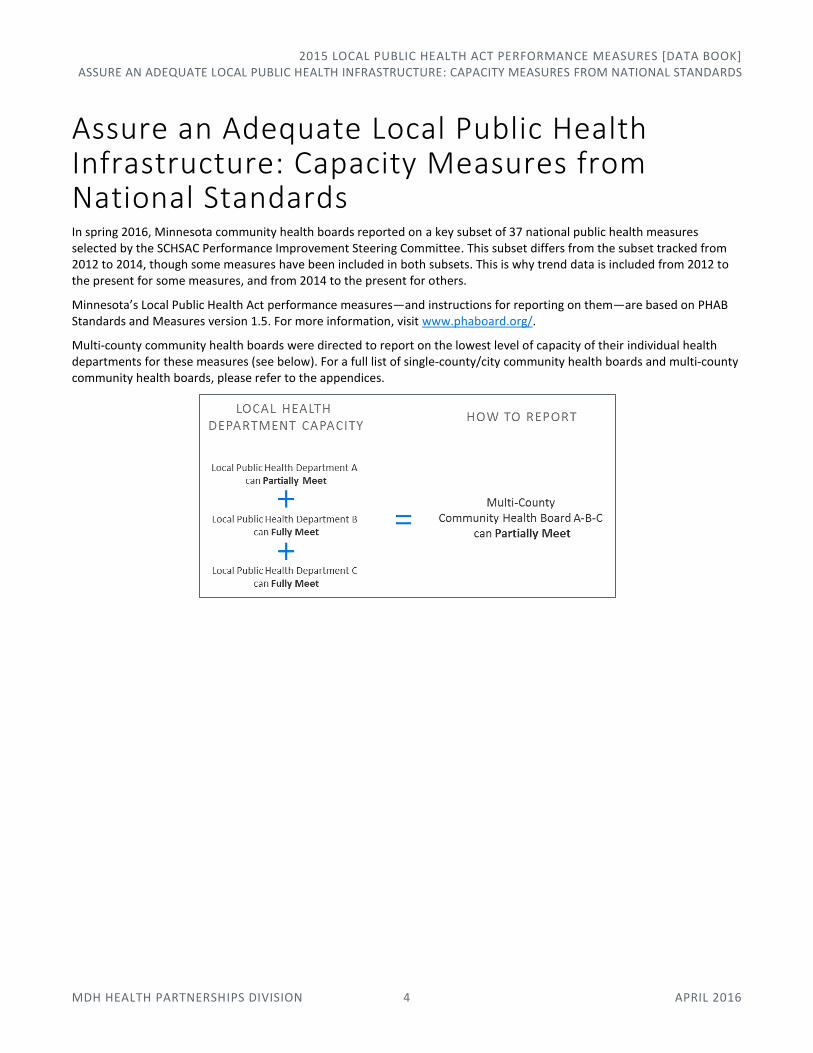
Assure an Adequate Local Public Health Infrastructure: Capacity Measures from National Standards In spring 2016, Minnesota community health boards reported on a key subset of 37 national public health measures selected by the SCHSAC Performance Improvement Steering Committee. This subset differs from the subset tracked from 2012 to 2014, though some measures have been included in both subsets. This is why trend data is included from 2012 to the present for some measures, and from 2014 to the present for others.
Minnesota’s Local Public Health Act performance measures—and instructions for reporting on them—are based on PHAB Standards and Measures version 1.5. For more information, visit www.phaboard.org/.
Multi-county community health boards were directed to report on the lowest level of capacity of their individual health departments for these measures (see below). For a full list of single-county/city community health boards and multi-county community health boards, please refer to the appendices.
2015 LOCAL PUBLIC HEALTH ACT PERFORMANCE MEASURES [DATA BOOK] ASSURE AN ADEQUATE LOCAL PUBLIC HEALTH INFRASTRUCTURE: CAPACITY MEASURES FROM NATIONAL STANDARDS
MDH HEALTH PARTNERSHIPS DIVISION 5 APRIL 2016
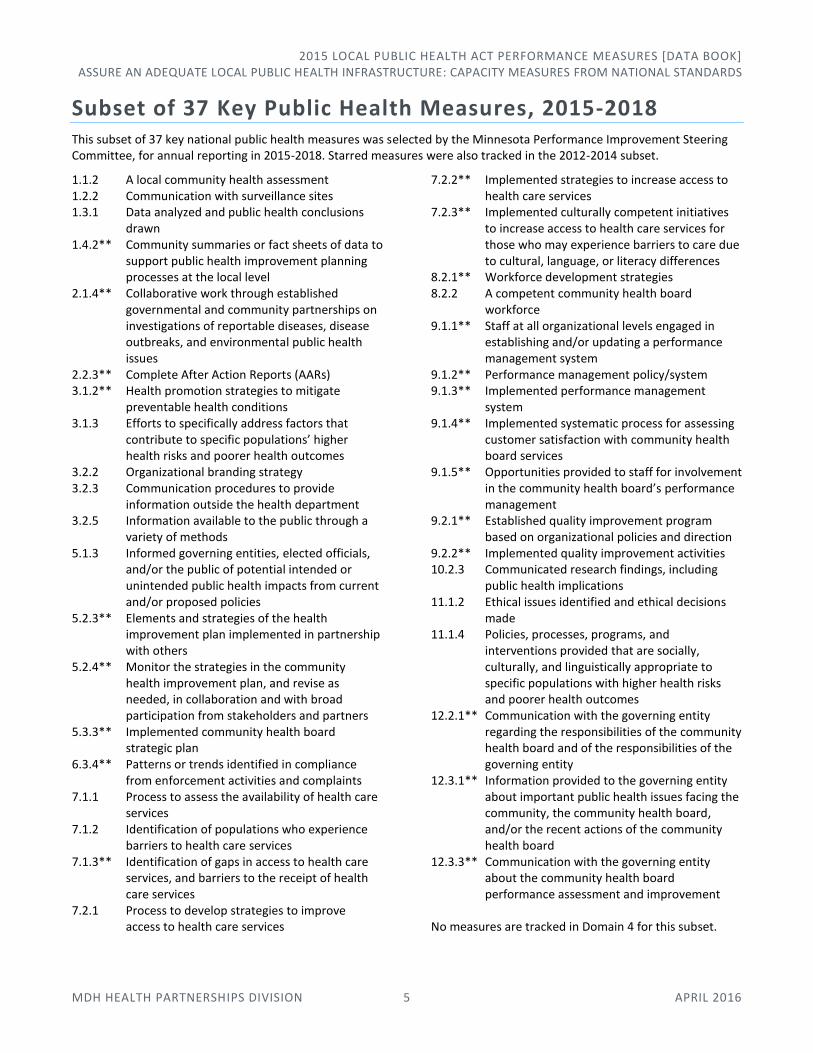
Subset of 37 Key Public Health Measures, 2015-2018 This subset of 37 key national public health measures was selected by the Minnesota Performance Improvement Steering Committee, for annual reporting in 2015-2018. Starred measures were also tracked in the 2012-2014 subset.
1.1.2 A local community health assessment 1.2.2 Communication with surveillance sites 1.3.1 Data analyzed and public health conclusions
drawn 1.4.2** Community summaries or fact sheets of data to
support public health improvement planning processes at the local level
2.1.4** Collaborative work through established governmental and community partnerships on investigations of reportable diseases, disease outbreaks, and environmental public health issues
2.2.3** Complete After Action Reports (AARs) 3.1.2** Health promotion strategies to mitigate
preventable health conditions 3.1.3 Efforts to specifically address factors that
contribute to specific populations’ higher health risks and poorer health outcomes
3.2.2 Organizational branding strategy 3.2.3 Communication procedures to provide
information outside the health department 3.2.5 Information available to the public through a
variety of methods 5.1.3 Informed governing entities, elected officials,
and/or the public of potential intended or unintended public health impacts from current and/or proposed policies
5.2.3** Elements and strategies of the health improvement plan implemented in partnership with others
5.2.4** Monitor the strategies in the community health improvement plan, and revise as needed, in collaboration and with broad participation from stakeholders and partners
5.3.3** Implemented community health board strategic plan
6.3.4** Patterns or trends identified in compliance from enforcement activities and complaints
7.1.1 Process to assess the availability of health care services
7.1.2 Identification of populations who experience barriers to health care services
7.1.3** Identification of gaps in access to health care services, and barriers to the receipt of health care services
7.2.1 Process to develop strategies to improve access to health care services
7.2.2** Implemented strategies to increase access to health care services
7.2.3** Implemented culturally competent initiatives to increase access to health care services for those who may experience barriers to care due to cultural, language, or literacy differences
8.2.1** Workforce development strategies 8.2.2 A competent community health board
workforce 9.1.1** Staff at all organizational levels engaged in
establishing and/or updating a performance management system
9.1.2** Performance management policy/system 9.1.3** Implemented performance management
system 9.1.4** Implemented systematic process for assessing
customer satisfaction with community health board services
9.1.5** Opportunities provided to staff for involvement in the community health board’s performance management
9.2.1** Established quality improvement program based on organizational policies and direction
9.2.2** Implemented quality improvement activities 10.2.3 Communicated research findings, including
public health implications 11.1.2 Ethical issues identified and ethical decisions
made 11.1.4 Policies, processes, programs, and
interventions provided that are socially, culturally, and linguistically appropriate to specific populations with higher health risks and poorer health outcomes
12.2.1** Communication with the governing entity regarding the responsibilities of the community health board and of the responsibilities of the governing entity
12.3.1** Information provided to the governing entity about important public health issues facing the community, the community health board, and/or the recent actions of the community health board
12.3.3** Communication with the governing entity about the community health board performance assessment and improvement
No measures are tracked in Domain 4 for this subset.
2015 LOCAL PUBLIC HEALTH ACT PERFORMANCE MEASURES [DATA BOOK] ASSURE AN ADEQUATE LOCAL PUBLIC HEALTH INFRASTRUCTURE: CAPACITY MEASURES FROM NATIONAL STANDARDS
MDH HEALTH PARTNERSHIPS DIVISION 6 APRIL 2016
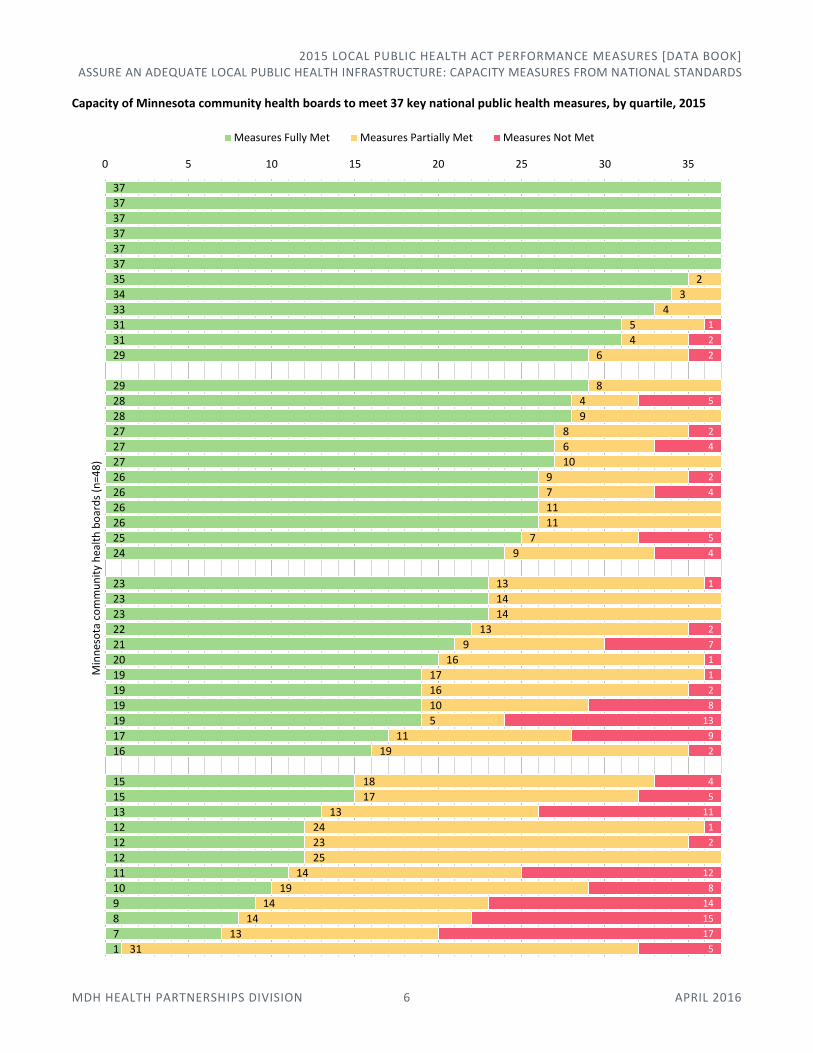
Capacity of Minnesota community health boards to meet 37 key national public health measures, by quartile, 2015
37
37
37
37
37
37
35
34
33
31
31
29
29
28
28
27
27
27
26
26
26
26
25
24
23
23
23
22
21
20
19
19
19
19
17
16
15
15
13
12
12
12
11
10
9
8
7
1
2
3
4
5
4
6
8
4
9
8
6
10
9
7
11
11
7
9
13
14
14
13
9
16
17
16
10
5
11
19
18
17
13
24
23
25
14
19
14
14
13
31
1
2
2
5
2
4
2
4
5
4
1
2
7
1
1
2
8
13
9
2
4
5
11
1
2
12
8
14
15
17
5
0 5 10 15 20 25 30 35
Min
nes
ota
co
mm
un
ity
hea
lth
bo
ard
s (n
=48
)
Measures Fully Met Measures Partially Met Measures Not Met
2015 LOCAL PUBLIC HEALTH ACT PERFORMANCE MEASURES [DATA BOOK] ASSURE AN ADEQUATE LOCAL PUBLIC HEALTH INFRASTRUCTURE: CAPACITY MEASURES FROM NATIONAL STANDARDS
MDH HEALTH PARTNERSHIPS DIVISION 7 APRIL 2016
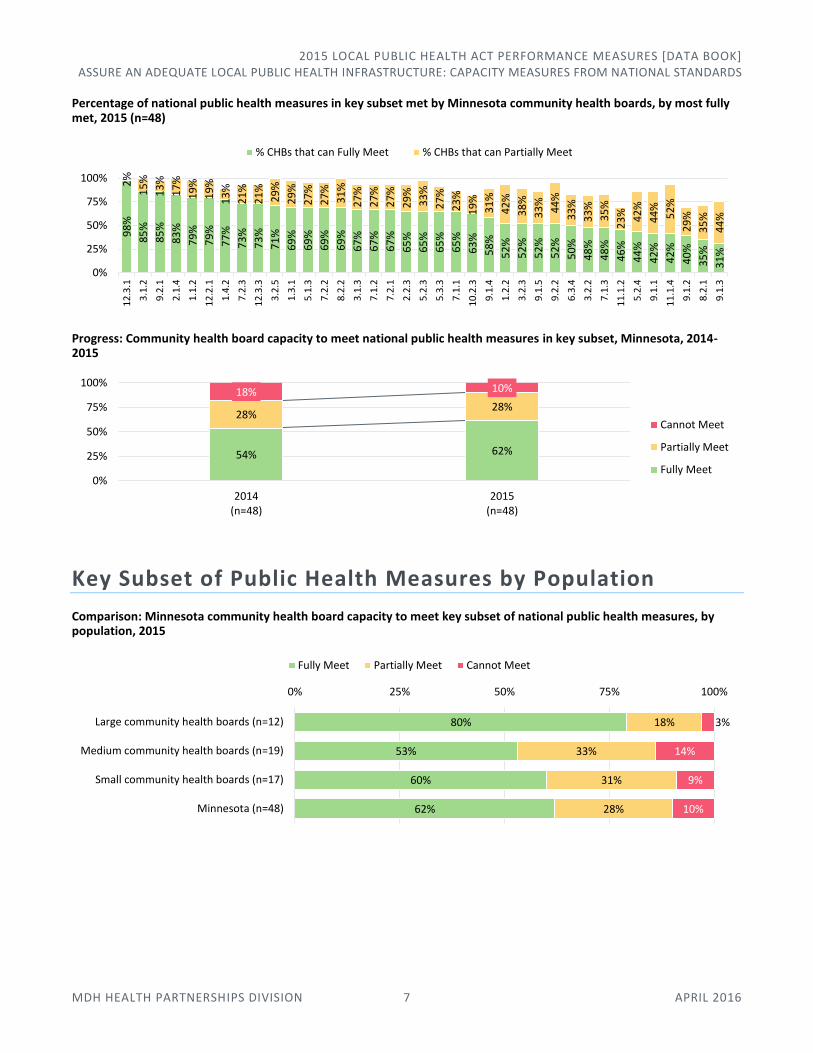
Percentage of national public health measures in key subset met by Minnesota community health boards, by most fully met, 2015 (n=48)
Progress: Community health board capacity to meet national public health measures in key subset, Minnesota, 2014-2015
Key Subset of Public Health Measures by Population
Comparison: Minnesota community health board capacity to meet key subset of national public health measures, by population, 2015
98
%
85
%
85
%
83
%
79
%
79
%
77
%
73
%
73
%
71
%
69
%
69
%
69
%
69
%
67
%
67
%
67
%
65
%
65
%
65
%
65
%
63
%
58
%
52
%
52
%
52
%
52
%
50
%
48
%
48
%
46
%
44
%
42
%
42
%
40
%
35
%
31
%
2%
15
%
13
%
17
%
19
%
19
%
13
%
21
%
21
%
29
%
29
%
27
%
27
%
31
%
27
%
27
%
27
%
29
%
33
%
27
%
23
%
19
%
31
%
42
%
38
%
33
%
44
%
33
%
33
%
35
%
23
% 42
%
44
%
52
%
29
%
35
%
44
%
0%
25%
50%
75%
100%
12
.3.1
3.1
.2
9.2
.1
2.1
.4
1.1
.2
12
.2.1
1.4
.2
7.2
.3
12
.3.3
3.2
.5
1.3
.1
5.1
.3
7.2
.2
8.2
.2
3.1
.3
7.1
.2
7.2
.1
2.2
.3
5.2
.3
5.3
.3
7.1
.1
10
.2.3
9.1
.4
1.2
.2
3.2
.3
9.1
.5
9.2
.2
6.3
.4
3.2
.2
7.1
.3
11
.1.2
5.2
.4
9.1
.1
11
.1.4
9.1
.2
8.2
.1
9.1
.3
% CHBs that can Fully Meet % CHBs that can Partially Meet
54% 62%
28%28%
18% 10%
0%
25%
50%
75%
100%
2014(n=48)
2015(n=48)
Cannot Meet
Partially Meet
Fully Meet
80%
53%
60%
62%
18%
33%
31%
28%
3%
14%
9%
10%
0% 25% 50% 75% 100%
Large community health boards (n=12)
Medium community health boards (n=19)
Small community health boards (n=17)
Minnesota (n=48)
Fully Meet Partially Meet Cannot Meet

2015 LOCAL PUBLIC HEALTH ACT PERFORMANCE MEASURES [DATA BOOK] ASSURE AN ADEQUATE LOCAL PUBLIC HEALTH INFRASTRUCTURE: CAPACITY MEASURES FROM NATIONAL STANDARDS
MDH HEALTH PARTNERSHIPS DIVISION 8 APRIL 2016
Comparison: Range and median of national public health measures fully met, Minnesota community health boards, by population, 2015
National public health measures most and least able to be fully met by Minnesota community health boards, by population, 2015
Large boards (n=12)
Medium boards (n=19)
Small boards (n=17)
Minnesota (n=48)
Most able to meet (tied)
2.1.4: Collaborative partnerships for investigation
9.2.1: Established QI program
12.2.1: Communication with governing entity RE: responsibilities
12.3.1: Info. provided to governing entity
Least able to meet (tied) (tied)
3.2.2: Organizational branding strategies
6.3.4: Compliance patterns from enforcement
8.2.1: Workforce development strategies
9.1.1: Engagement in performance management system
9.1.3: Implemented performance management system
Progress and comparison: Community health board capacity to fully meet key subset of national public health measures, by population, Minnesota, 2014-2015
Not included: Edina (population growth moved it from a “small” to a “medium” community health board between 2014 and 2015).
Median: 30 key measures
Med.: 23.5 key measures
Median: 19 key measures
Median: 23 key measures
0 5 10 15 20 25 30 35
Large community health boards (n=12)
Medium community health boards (n=19)
Small community health boards (n=17)
Minnesota (n=48)
69% 80%
23% 18%
8% 3%
0%
25%
50%
75%
100%
2014 2015
Large community health boards (n=12)
43% 50%
30%35%
27% 15%
2014 2015
Medium community health boards (n=18)
54% 60%
29%31%
17% 9%
2014 2015
Small community health boards (n=17)
Cannot Meet
Partially Meet
Fully Meet
2015 LOCAL PUBLIC HEALTH ACT PERFORMANCE MEASURES [DATA BOOK] ASSURE AN ADEQUATE LOCAL PUBLIC HEALTH INFRASTRUCTURE: CAPACITY MEASURES FROM NATIONAL STANDARDS
MDH HEALTH PARTNERSHIPS DIVISION 9 APRIL 2016
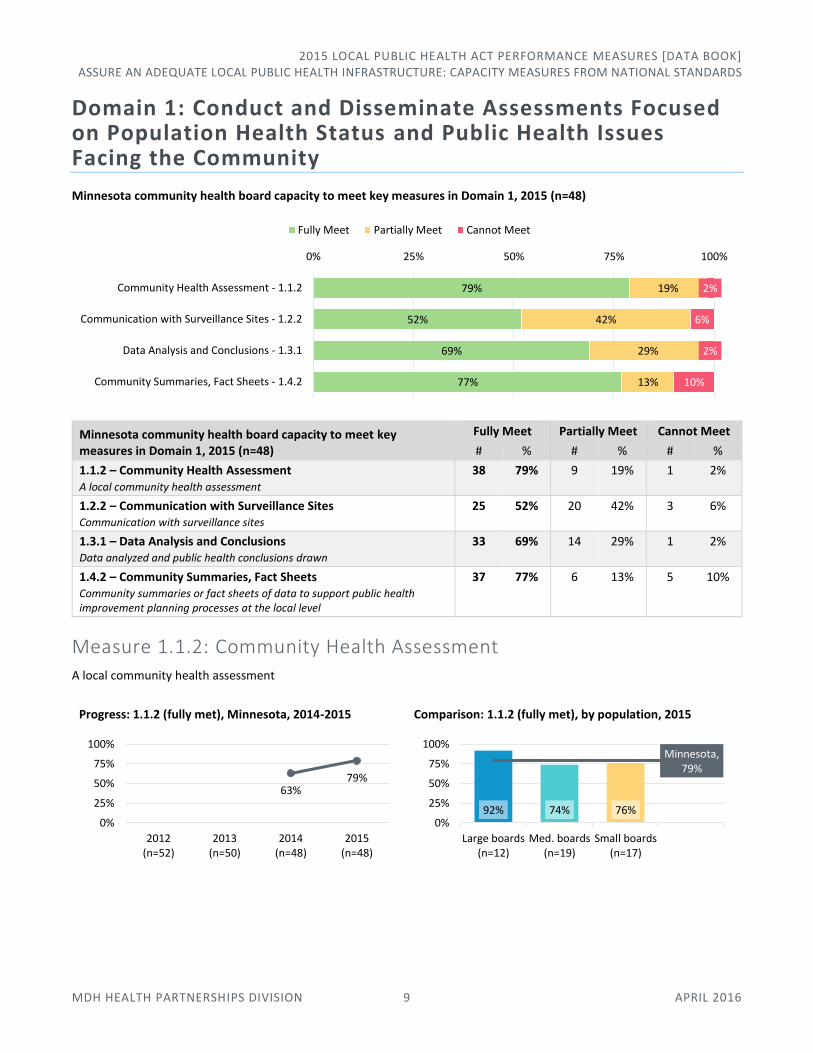
Domain 1: Conduct and Disseminate Assessments Focused on Population Health Status and Public Health Issues Facing the Community
Minnesota community health board capacity to meet key measures in Domain 1, 2015 (n=48)
Minnesota community health board capacity to meet key measures in Domain 1, 2015 (n=48)
Fully Meet Partially Meet Cannot Meet
# % # % # %
1.1.2 – Community Health Assessment A local community health assessment
38 79% 9 19% 1 2%
1.2.2 – Communication with Surveillance Sites Communication with surveillance sites
25 52% 20 42% 3 6%
1.3.1 – Data Analysis and Conclusions Data analyzed and public health conclusions drawn
33 69% 14 29% 1 2%
1.4.2 – Community Summaries, Fact Sheets Community summaries or fact sheets of data to support public health improvement planning processes at the local level
37 77% 6 13% 5 10%
Measure 1.1.2: Community Health Assessment A local community health assessment
Progress: 1.1.2 (fully met), Minnesota, 2014-2015
Comparison: 1.1.2 (fully met), by population, 2015
79%
52%
69%
77%
19%
42%
29%
13%
2%
6%
2%
10%
0% 25% 50% 75% 100%
Community Health Assessment - 1.1.2
Communication with Surveillance Sites - 1.2.2
Data Analysis and Conclusions - 1.3.1
Community Summaries, Fact Sheets - 1.4.2
Fully Meet Partially Meet Cannot Meet
63%79%
0%
25%
50%
75%
100%
2012(n=52)
2013(n=50)
2014(n=48)
2015(n=48)
92% 74% 76%
Minnesota, 79%
0%
25%
50%
75%
100%
Large boards(n=12)
Med. boards(n=19)
Small boards(n=17)
2015 LOCAL PUBLIC HEALTH ACT PERFORMANCE MEASURES [DATA BOOK] ASSURE AN ADEQUATE LOCAL PUBLIC HEALTH INFRASTRUCTURE: CAPACITY MEASURES FROM NATIONAL STANDARDS
MDH HEALTH PARTNERSHIPS DIVISION 10 APRIL 2016
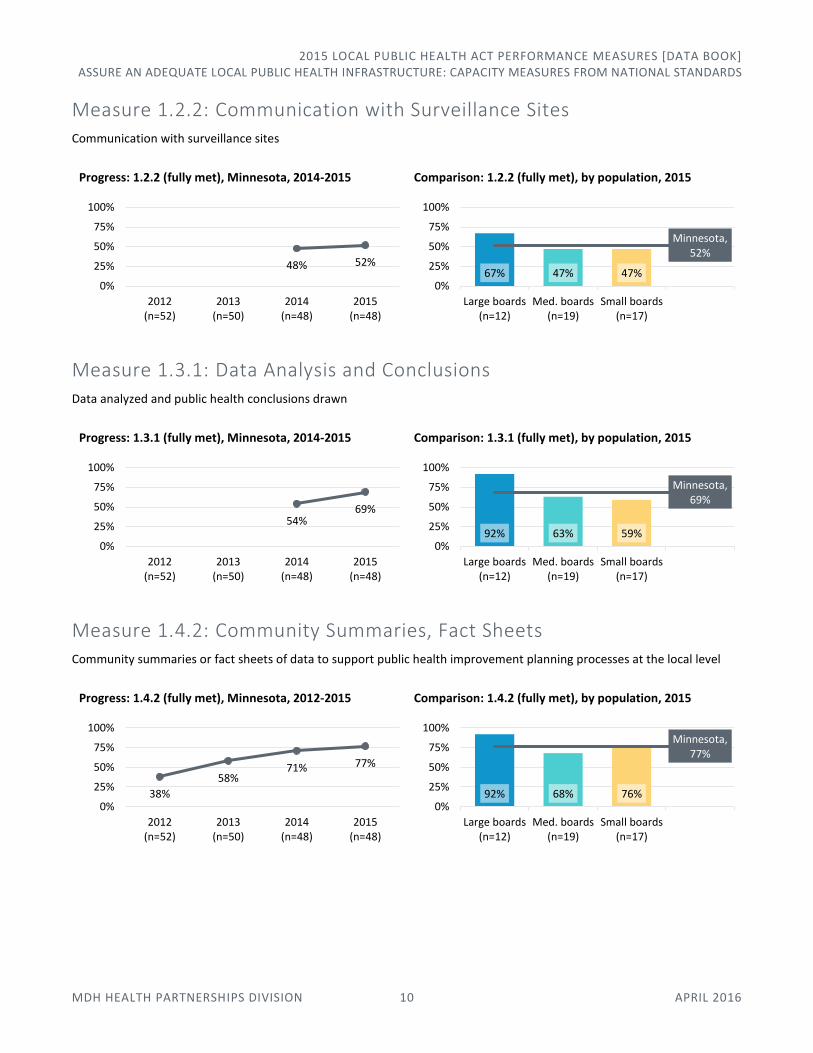
Measure 1.2.2: Communication with Surveillance Sites Communication with surveillance sites
Progress: 1.2.2 (fully met), Minnesota, 2014-2015
Comparison: 1.2.2 (fully met), by population, 2015
Measure 1.3.1: Data Analysis and Conclusions Data analyzed and public health conclusions drawn
Progress: 1.3.1 (fully met), Minnesota, 2014-2015
Comparison: 1.3.1 (fully met), by population, 2015
Measure 1.4.2: Community Summaries, Fact Sheets Community summaries or fact sheets of data to support public health improvement planning processes at the local level
Progress: 1.4.2 (fully met), Minnesota, 2012-2015
Comparison: 1.4.2 (fully met), by population, 2015
48% 52%
0%
25%
50%
75%
100%
2012(n=52)
2013(n=50)
2014(n=48)
2015(n=48)
67% 47% 47%
Minnesota, 52%
0%
25%
50%
75%
100%
Large boards(n=12)
Med. boards(n=19)
Small boards(n=17)
54%69%
0%
25%
50%
75%
100%
2012(n=52)
2013(n=50)
2014(n=48)
2015(n=48)
92% 63% 59%
Minnesota, 69%
0%
25%
50%
75%
100%
Large boards(n=12)
Med. boards(n=19)
Small boards(n=17)
38%
58%71% 77%
0%
25%
50%
75%
100%
2012(n=52)
2013(n=50)
2014(n=48)
2015(n=48)
92% 68% 76%
Minnesota, 77%
0%
25%
50%
75%
100%
Large boards(n=12)
Med. boards(n=19)
Small boards(n=17)
2015 LOCAL PUBLIC HEALTH ACT PERFORMANCE MEASURES [DATA BOOK] ASSURE AN ADEQUATE LOCAL PUBLIC HEALTH INFRASTRUCTURE: CAPACITY MEASURES FROM NATIONAL STANDARDS
MDH HEALTH PARTNERSHIPS DIVISION 11 APRIL 2016
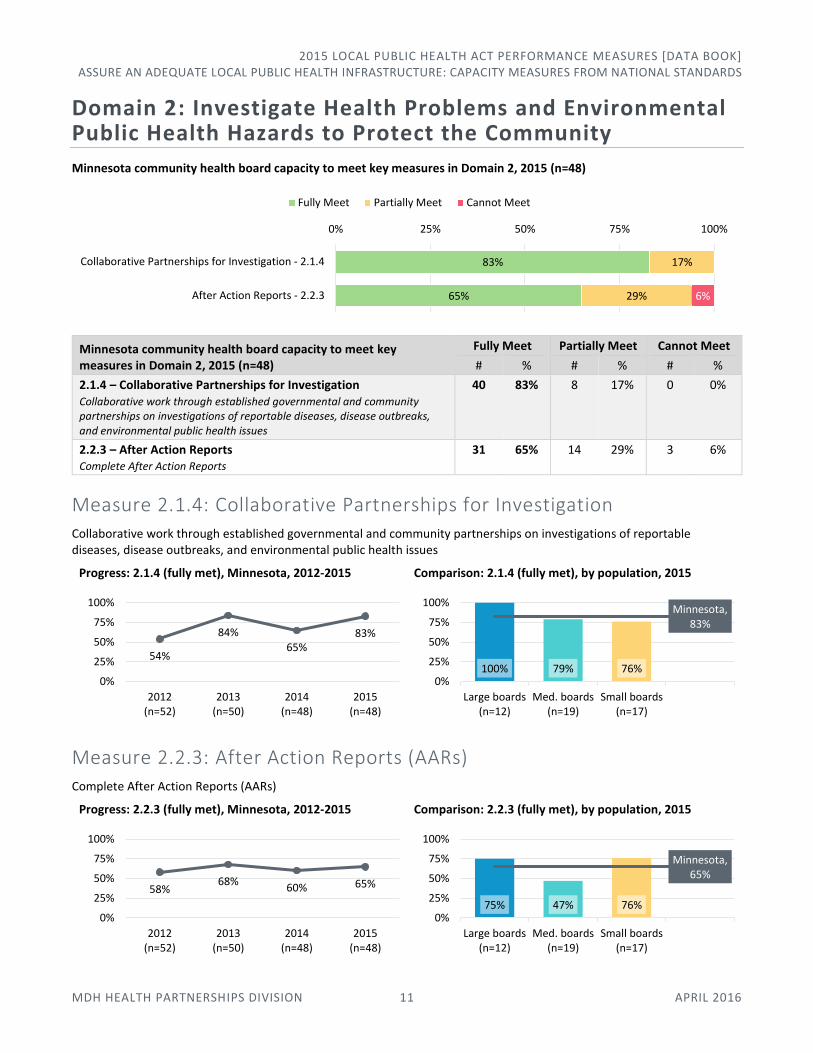
Domain 2: Investigate Health Problems and Environmental Public Health Hazards to Protect the Community
Minnesota community health board capacity to meet key measures in Domain 2, 2015 (n=48)
Minnesota community health board capacity to meet key measures in Domain 2, 2015 (n=48)
Fully Meet Partially Meet Cannot Meet
# % # % # %
2.1.4 – Collaborative Partnerships for Investigation Collaborative work through established governmental and community partnerships on investigations of reportable diseases, disease outbreaks, and environmental public health issues
40 83% 8 17% 0 0%
2.2.3 – After Action Reports Complete After Action Reports
31 65% 14 29% 3 6%
Measure 2.1.4: Collaborative Partnerships for Investigation Collaborative work through established governmental and community partnerships on investigations of reportable diseases, disease outbreaks, and environmental public health issues
Progress: 2.1.4 (fully met), Minnesota, 2012-2015
Comparison: 2.1.4 (fully met), by population, 2015
Measure 2.2.3: After Action Reports (AARs) Complete After Action Reports (AARs)
Progress: 2.2.3 (fully met), Minnesota, 2012-2015
Comparison: 2.2.3 (fully met), by population, 2015
83%
65%
17%
29% 6%
0% 25% 50% 75% 100%
Collaborative Partnerships for Investigation - 2.1.4
After Action Reports - 2.2.3
Fully Meet Partially Meet Cannot Meet
54%
84%
65%83%
0%
25%
50%
75%
100%
2012(n=52)
2013(n=50)
2014(n=48)
2015(n=48)
100% 79% 76%
Minnesota, 83%
0%
25%
50%
75%
100%
Large boards(n=12)
Med. boards(n=19)
Small boards(n=17)
58%68%
60% 65%
0%
25%
50%
75%
100%
2012(n=52)
2013(n=50)
2014(n=48)
2015(n=48)
75% 47% 76%
Minnesota, 65%
0%
25%
50%
75%
100%
Large boards(n=12)
Med. boards(n=19)
Small boards(n=17)

2015 LOCAL PUBLIC HEALTH ACT PERFORMANCE MEASURES [DATA BOOK] ASSURE AN ADEQUATE LOCAL PUBLIC HEALTH INFRASTRUCTURE: CAPACITY MEASURES FROM NATIONAL STANDARDS
MDH HEALTH PARTNERSHIPS DIVISION 12 APRIL 2016
Domain 3: Inform and Educate about Public Health Issues and Functions
Minnesota community health board capacity to meet key measures in Domain 3, 2015 (n=48)
Minnesota community health board capacity to meet key measures in Domain 3, 2015 (n=48)
Fully Meet Partially Meet Cannot Meet
# % # % # %
3.1.2 – Health Promotion Strategies Health promotion strategies to mitigate preventable health conditions
41 85% 7 15% 0 0%
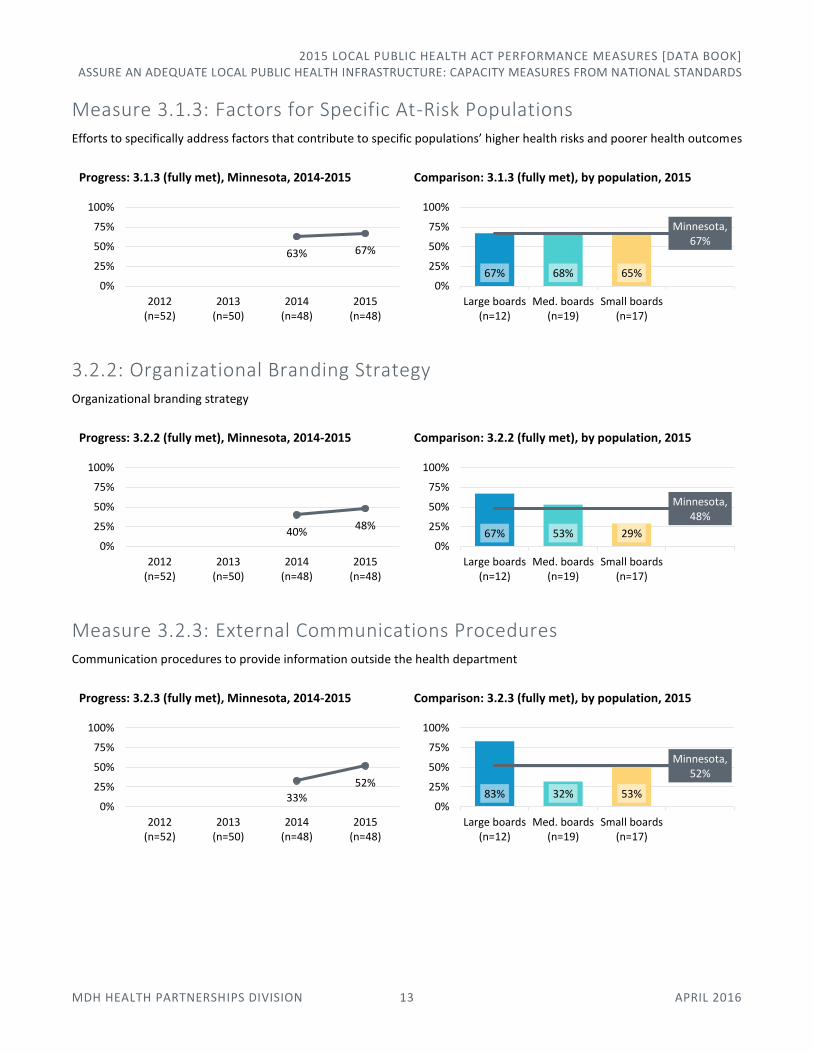
3.1.3 – Factors for Specific At-Risk Populations Efforts to specifically address factors that contribute to specific populations’ higher health risks and poorer health outcomes
32 67% 13 27% 3 6%
3.2.2 – Organizational Branding Strategy Organizational branding strategy
23 48% 16 33% 9 19%
3.2.3 – External Communications Procedures Communication procedures to provide information outside the community health board
25 52% 18 38% 5 10%
3.2.5 – Policies’ Impact on Public Health Informed governing entities, elected officials, and/or the public of potential intended or unintended public health impacts from current and/or proposed policies
34 71% 14 29% 0 0%
Measure 3.1.2: Health Promotion Strategies Health promotion strategies to mitigate preventable health conditions
Progress: 3.1.2 (fully met), Minnesota, 2012-2015
Comparison: 3.1.2 (fully met), by population, 2015
85%
67%
48%
52%
71%
15%
27%
33%
38%
29%
6%
19%
10%
0% 25% 50% 75% 100%
Health Promotion Strategies - 3.1.2
Factors for Specific At-Risk Populations - 3.1.3
Organizational Branding Strategy - 3.2.2
External Communications Procedures - 3.2.3
Policies' Impact on Public Health - 3.2.5
Fully Meet Partially Meet Cannot Meet
48%
80% 85% 85%
0%
25%
50%
75%
100%
2012(n=52)
2013(n=50)
2014(n=48)
2015(n=48)
92% 68% 100%
Minnesota, 85%
0%
25%
50%
75%
100%
Large boards(n=12)
Med. boards(n=19)
Small boards(n=17)
2015 LOCAL PUBLIC HEALTH ACT PERFORMANCE MEASURES [DATA BOOK] ASSURE AN ADEQUATE LOCAL PUBLIC HEALTH INFRASTRUCTURE: CAPACITY MEASURES FROM NATIONAL STANDARDS
MDH HEALTH PARTNERSHIPS DIVISION 13 APRIL 2016
Measure 3.1.3: Factors for Specific At-Risk Populations Efforts to specifically address factors that contribute to specific populations’ higher health risks and poorer health outcomes
Progress: 3.1.3 (fully met), Minnesota, 2014-2015
Comparison: 3.1.3 (fully met), by population, 2015
3.2.2: Organizational Branding Strategy Organizational branding strategy
Progress: 3.2.2 (fully met), Minnesota, 2014-2015
Comparison: 3.2.2 (fully met), by population, 2015
Measure 3.2.3: External Communications Procedures Communication procedures to provide information outside the health department
Progress: 3.2.3 (fully met), Minnesota, 2014-2015
Comparison: 3.2.3 (fully met), by population, 2015
63% 67%
0%
25%
50%
75%
100%
2012(n=52)
2013(n=50)
2014(n=48)
2015(n=48)
67% 68% 65%
Minnesota, 67%
0%
25%
50%
75%
100%
Large boards(n=12)
Med. boards(n=19)
Small boards(n=17)
40%48%
0%
25%
50%
75%
100%
2012(n=52)
2013(n=50)
2014(n=48)
2015(n=48)
67% 53% 29%
Minnesota, 48%
0%
25%
50%
75%
100%
Large boards(n=12)
Med. boards(n=19)
Small boards(n=17)
33%52%
0%
25%
50%
75%
100%
2012(n=52)
2013(n=50)
2014(n=48)
2015(n=48)
83% 32% 53%
Minnesota, 52%
0%
25%
50%
75%
100%
Large boards(n=12)
Med. boards(n=19)
Small boards(n=17)

2015 LOCAL PUBLIC HEALTH ACT PERFORMANCE MEASURES [DATA BOOK] ASSURE AN ADEQUATE LOCAL PUBLIC HEALTH INFRASTRUCTURE: CAPACITY MEASURES FROM NATIONAL STANDARDS
MDH HEALTH PARTNERSHIPS DIVISION 14 APRIL 2016
Measure 3.2.5: Variety of Publicly Available Information Information available to the public through a variety of methods
Progress: 3.2.5 (fully met), Minnesota, 2014-2015
Comparison: 3.2.5 (fully met), by population, 2015
Domain 5: Develop Public Health Policies and Plans
Minnesota community health board capacity to meet key measures in Domain 5, 2015 (n=48)
Minnesota community health board capacity to meet key measures in Domain 5, 2015 (n=48)
Fully Meet Partially Meet Cannot Meet
# % # % # %
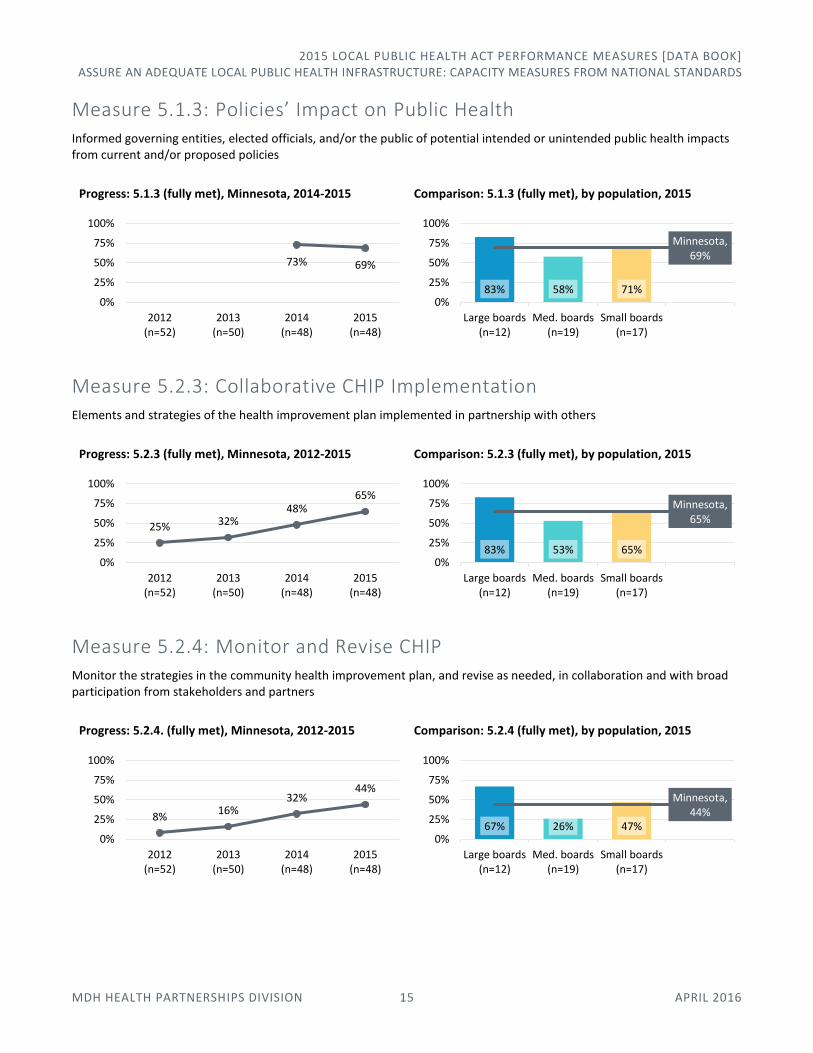
5.1.3 – Policies’ Impact on Public Health Informed governing entities, elected officials, and/or the public of potential intended or unintended public health impacts from current and/or proposed policies
33 69% 13 27% 2 4%
5.2.3 – Collaborative CHIP Implementation Elements and strategies of the health improvement plan implemented in partnership with others
31 65% 16 33% 1 2%
5.2.4 – Monitor and Revise CHIP Monitor the strategies in the community health improvement plan, and revise as needed, in collaboration and with broad participation from stakeholders and partners
21 44% 20 42% 7 15%
5.3.3 – An Implemented Strategic Plan Implemented community health board strategic plan
31 65% 13 27% 4 8%
46%
71%
0%
25%
50%
75%
100%
2012(n=52)
2013(n=50)
2014(n=48)
2015(n=48)
92% 58% 71%
Minnesota, 71%
0%
25%
50%
75%
100%
Large boards(n=12)
Med. boards(n=19)
Small boards(n=17)
69%
65%
44%
65%
27%
33%
42%
27%
4%
2%
15%
8%
0% 25% 50% 75% 100%
Policies' Impact on Public Health - 5.1.3
Collaborative CHIP Implementation - 5.2.3
Monitor and Revise CHIP - 5.2.4
An Implemented Strategic Plan - 5.3.3
Fully Meet Partially Meet Cannot Meet
2015 LOCAL PUBLIC HEALTH ACT PERFORMANCE MEASURES [DATA BOOK] ASSURE AN ADEQUATE LOCAL PUBLIC HEALTH INFRASTRUCTURE: CAPACITY MEASURES FROM NATIONAL STANDARDS
MDH HEALTH PARTNERSHIPS DIVISION 15 APRIL 2016
Measure 5.1.3: Policies’ Impact on Public Health Informed governing entities, elected officials, and/or the public of potential intended or unintended public health impacts from current and/or proposed policies
Progress: 5.1.3 (fully met), Minnesota, 2014-2015
Comparison: 5.1.3 (fully met), by population, 2015
Measure 5.2.3: Collaborative CHIP Implementation Elements and strategies of the health improvement plan implemented in partnership with others
Progress: 5.2.3 (fully met), Minnesota, 2012-2015
Comparison: 5.2.3 (fully met), by population, 2015
Measure 5.2.4: Monitor and Revise CHIP Monitor the strategies in the community health improvement plan, and revise as needed, in collaboration and with broad participation from stakeholders and partners
Progress: 5.2.4. (fully met), Minnesota, 2012-2015
Comparison: 5.2.4 (fully met), by population, 2015
73% 69%
0%
25%
50%
75%
100%
2012(n=52)
2013(n=50)
2014(n=48)
2015(n=48)
83% 58% 71%
Minnesota, 69%
0%
25%
50%
75%
100%
Large boards(n=12)
Med. boards(n=19)
Small boards(n=17)
25% 32%48%
65%
0%
25%
50%
75%
100%
2012(n=52)
2013(n=50)
2014(n=48)
2015(n=48)
83% 53% 65%
Minnesota, 65%
0%
25%
50%
75%
100%
Large boards(n=12)
Med. boards(n=19)
Small boards(n=17)
8%16%
32%44%
0%
25%
50%
75%
100%
2012(n=52)
2013(n=50)
2014(n=48)
2015(n=48)
67% 26% 47%
Minnesota, 44%
0%
25%
50%
75%
100%
Large boards(n=12)
Med. boards(n=19)
Small boards(n=17)

2015 LOCAL PUBLIC HEALTH ACT PERFORMANCE MEASURES [DATA BOOK] ASSURE AN ADEQUATE LOCAL PUBLIC HEALTH INFRASTRUCTURE: CAPACITY MEASURES FROM NATIONAL STANDARDS
MDH HEALTH PARTNERSHIPS DIVISION 16 APRIL 2016
Measure 5.3.3: An Implemented Strategic Plan Implemented community health board strategic plan
Progress: 5.3.3 (fully met), Minnesota, 2012-2015
Comparison: 5.3.3 (fully met), by population, 2015
Domain 6: Enforce Public Health Laws
Minnesota community health board capacity to meet key measure in Domain 6, 2015 (n=48)
Minnesota community health board capacity to meet key measure in Domain 6, 2015 (n=48)
Fully Meet Partially Meet Cannot Meet
# % # % # %
6.3.4 – Compliance Patterns from Enforcement Patterns or trends identified in compliance from enforcement activities and complaints
24 50% 16 33% 8 17%
Measure 6.3.4: Compliance Patterns from Enforcement Patterns or trends identified in compliance from enforcement activities and complaints
Progress: 6.3.4 (fully met), Minnesota, 2012-2015
Comparison: 6.3.4 (fully met), by population, 2015
17% 24%
56%65%
0%
25%
50%
75%
100%
2012(n=52)
2013(n=50)
2014(n=48)
2015(n=48)
83% 47% 71%
Minnesota, 65%
0%
25%
50%
75%
100%
Large boards(n=12)
Med. boards(n=19)
Small boards(n=17)
50% 33% 17%
0% 25% 50% 75% 100%
Compliance Patterns from Enforcement - 6.3.4
Fully Meet Partially Meet Cannot Meet
17%30%
42%50%
0%
25%
50%
75%
100%
2012(n=52)
2013(n=50)
2014(n=48)
2015(n=48)
50% 53% 47%
Minnesota, 50%
0%
25%
50%
75%
100%
Large boards(n=12)
Med. boards(n=19)
Small boards(n=17)
2015 LOCAL PUBLIC HEALTH ACT PERFORMANCE MEASURES [DATA BOOK] ASSURE AN ADEQUATE LOCAL PUBLIC HEALTH INFRASTRUCTURE: CAPACITY MEASURES FROM NATIONAL STANDARDS
MDH HEALTH PARTNERSHIPS DIVISION 17 APRIL 2016
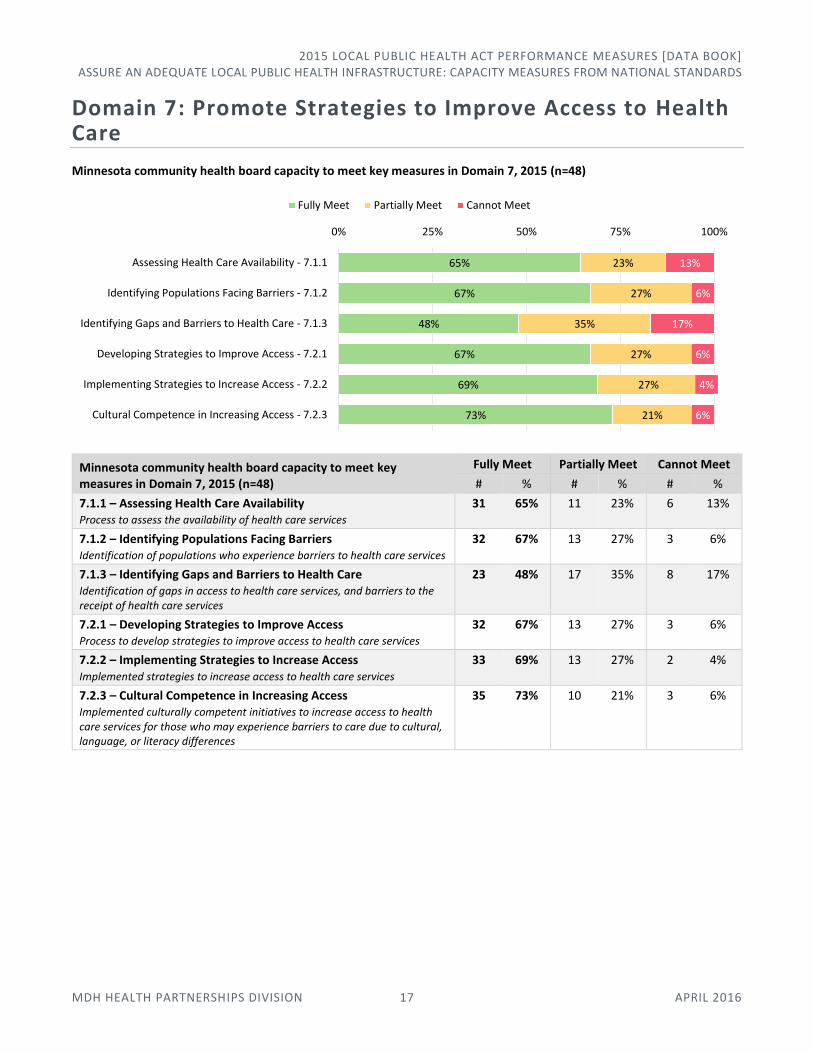
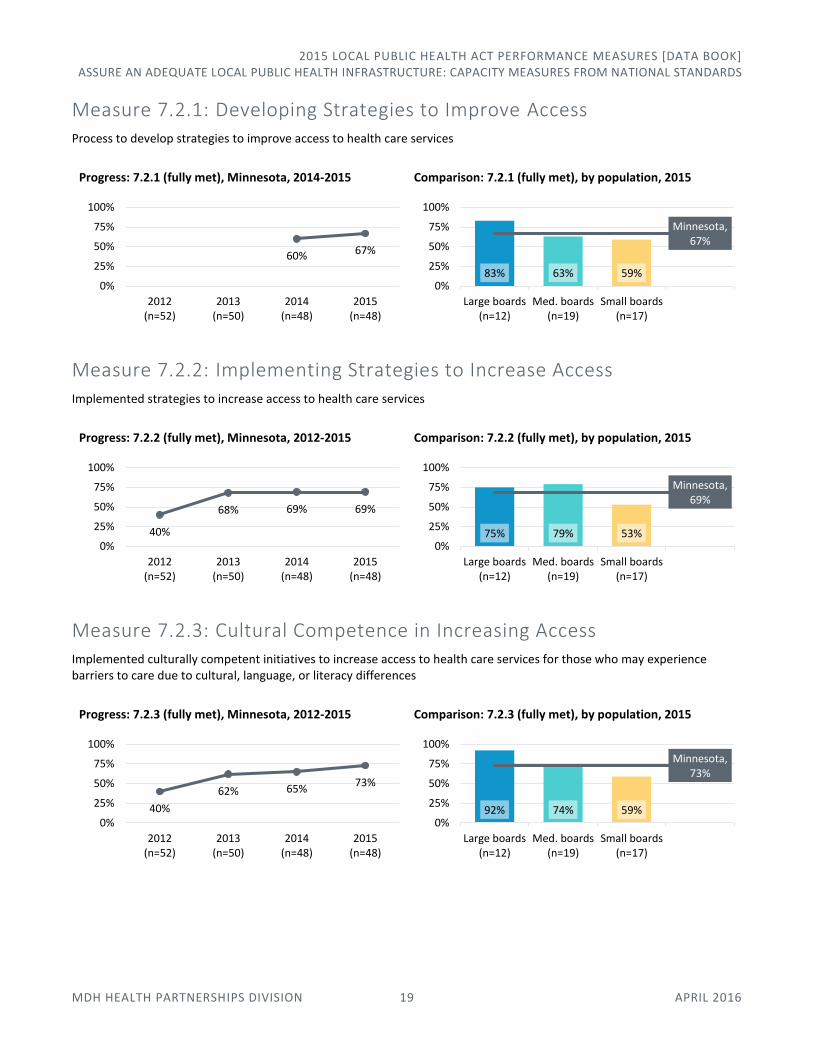
Domain 7: Promote Strategies to Improve Access to Health Care
Minnesota community health board capacity to meet key measures in Domain 7, 2015 (n=48)
Minnesota community health board capacity to meet key measures in Domain 7, 2015 (n=48)
Fully Meet Partially Meet Cannot Meet
# % # % # %
7.1.1 – Assessing Health Care Availability Process to assess the availability of health care services
31 65% 11 23% 6 13%
7.1.2 – Identifying Populations Facing Barriers Identification of populations who experience barriers to health care services
32 67% 13 27% 3 6%
7.1.3 – Identifying Gaps and Barriers to Health Care Identification of gaps in access to health care services, and barriers to the receipt of health care services
23 48% 17 35% 8 17%
7.2.1 – Developing Strategies to Improve Access Process to develop strategies to improve access to health care services
32 67% 13 27% 3 6%
7.2.2 – Implementing Strategies to Increase Access Implemented strategies to increase access to health care services
33 69% 13 27% 2 4%
7.2.3 – Cultural Competence in Increasing Access Implemented culturally competent initiatives to increase access to health care services for those who may experience barriers to care due to cultural, language, or literacy differences
35 73% 10 21% 3 6%
65%
67%
48%
67%
69%
73%
23%
27%
35%
27%
27%
21%
13%
6%
17%
6%
4%
6%
0% 25% 50% 75% 100%
Assessing Health Care Availability - 7.1.1
Identifying Populations Facing Barriers - 7.1.2
Identifying Gaps and Barriers to Health Care - 7.1.3
Developing Strategies to Improve Access - 7.2.1
Implementing Strategies to Increase Access - 7.2.2
Cultural Competence in Increasing Access - 7.2.3
Fully Meet Partially Meet Cannot Meet
2015 LOCAL PUBLIC HEALTH ACT PERFORMANCE MEASURES [DATA BOOK] ASSURE AN ADEQUATE LOCAL PUBLIC HEALTH INFRASTRUCTURE: CAPACITY MEASURES FROM NATIONAL STANDARDS
MDH HEALTH PARTNERSHIPS DIVISION 18 APRIL 2016
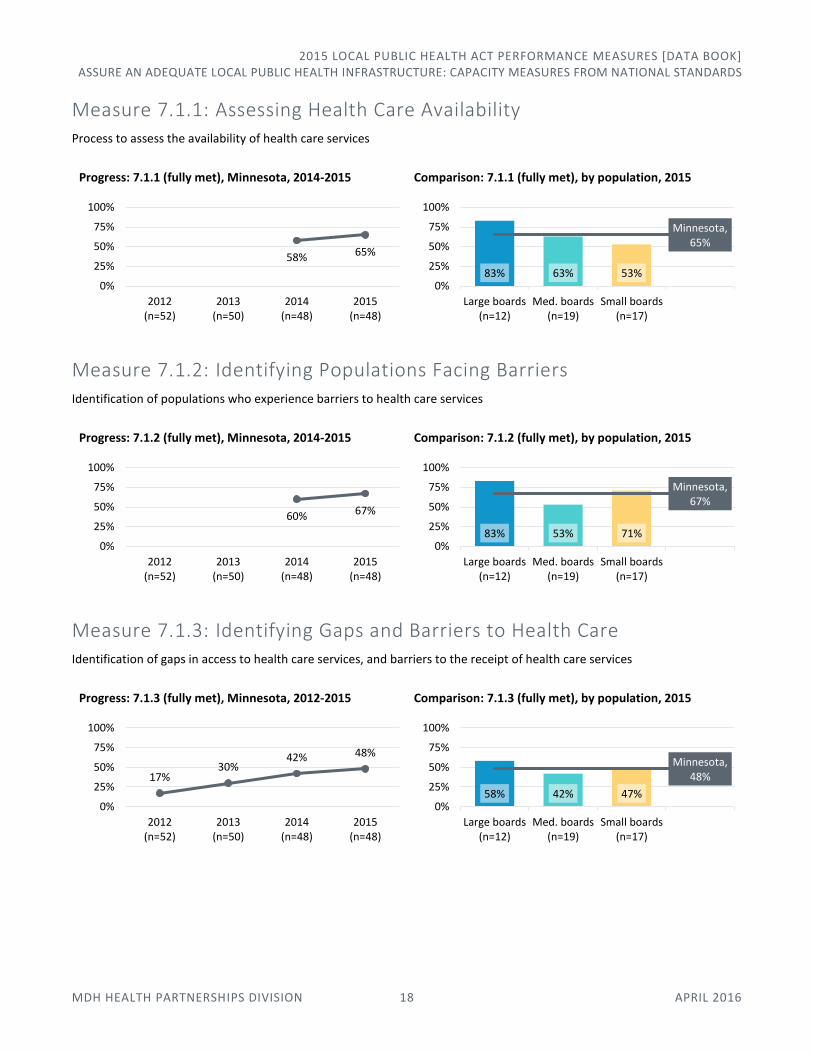
Measure 7.1.1: Assessing Health Care Availability Process to assess the availability of health care services
Progress: 7.1.1 (fully met), Minnesota, 2014-2015
Comparison: 7.1.1 (fully met), by population, 2015
Measure 7.1.2: Identifying Populations Facing Barriers Identification of populations who experience barriers to health care services
Progress: 7.1.2 (fully met), Minnesota, 2014-2015
Comparison: 7.1.2 (fully met), by population, 2015
Measure 7.1.3: Identifying Gaps and Barriers to Health Care Identification of gaps in access to health care services, and barriers to the receipt of health care services
Progress: 7.1.3 (fully met), Minnesota, 2012-2015
Comparison: 7.1.3 (fully met), by population, 2015
58% 65%
0%
25%
50%
75%
100%
2012(n=52)
2013(n=50)
2014(n=48)
2015(n=48)
83% 63% 53%
Minnesota, 65%
0%
25%
50%
75%
100%
Large boards(n=12)
Med. boards(n=19)
Small boards(n=17)
60% 67%
0%
25%
50%
75%
100%
2012(n=52)
2013(n=50)
2014(n=48)
2015(n=48)
83% 53% 71%
Minnesota, 67%
0%
25%
50%
75%
100%
Large boards(n=12)
Med. boards(n=19)
Small boards(n=17)
17%30%
42% 48%
0%
25%
50%
75%
100%
2012(n=52)
2013(n=50)
2014(n=48)
2015(n=48)
58% 42% 47%
Minnesota, 48%
0%
25%
50%
75%
100%
Large boards(n=12)
Med. boards(n=19)
Small boards(n=17)
2015 LOCAL PUBLIC HEALTH ACT PERFORMANCE MEASURES [DATA BOOK] ASSURE AN ADEQUATE LOCAL PUBLIC HEALTH INFRASTRUCTURE: CAPACITY MEASURES FROM NATIONAL STANDARDS
MDH HEALTH PARTNERSHIPS DIVISION 19 APRIL 2016
Measure 7.2.1: Developing Strategies to Improve Access Process to develop strategies to improve access to health care services
Progress: 7.2.1 (fully met), Minnesota, 2014-2015
Comparison: 7.2.1 (fully met), by population, 2015
Measure 7.2.2: Implementing Strategies to Increase Access Implemented strategies to increase access to health care services
Progress: 7.2.2 (fully met), Minnesota, 2012-2015
Comparison: 7.2.2 (fully met), by population, 2015
Measure 7.2.3: Cultural Competence in Increasing Access Implemented culturally competent initiatives to increase access to health care services for those who may experience barriers to care due to cultural, language, or literacy differences
Progress: 7.2.3 (fully met), Minnesota, 2012-2015
Comparison: 7.2.3 (fully met), by population, 2015
60% 67%
0%
25%
50%
75%
100%
2012(n=52)
2013(n=50)
2014(n=48)
2015(n=48)
83% 63% 59%
Minnesota, 67%
0%
25%
50%
75%
100%
Large boards(n=12)
Med. boards(n=19)
Small boards(n=17)
40%
68% 69% 69%
0%
25%
50%
75%
100%
2012(n=52)
2013(n=50)
2014(n=48)
2015(n=48)
75% 79% 53%
Minnesota, 69%
0%
25%
50%
75%
100%
Large boards(n=12)
Med. boards(n=19)
Small boards(n=17)
40%
62% 65%73%
0%
25%
50%
75%
100%
2012(n=52)
2013(n=50)
2014(n=48)
2015(n=48)
92% 74% 59%
Minnesota, 73%
0%
25%
50%
75%
100%
Large boards(n=12)
Med. boards(n=19)
Small boards(n=17)

2015 LOCAL PUBLIC HEALTH ACT PERFORMANCE MEASURES [DATA BOOK] ASSURE AN ADEQUATE LOCAL PUBLIC HEALTH INFRASTRUCTURE: CAPACITY MEASURES FROM NATIONAL STANDARDS
MDH HEALTH PARTNERSHIPS DIVISION 20 APRIL 2016
Domain 8: Maintain a Competent Public Health Workforce
Minnesota community health board capacity to meet key measures in Domain 8, 2015 (n=48)
Minnesota community health board capacity to meet key measures in Domain 8, 2015 (n=48)
Fully Meet Partially Meet Cannot Meet
# % # % # %
8.2.1 – Workforce Development Strategies Workforce development strategies
17 35% 17 35% 14 29%
8.2.2 – Competent Workforce A competent community health board workforce
33 69% 15 31% 0 0%
Measure 8.2.1: Workforce Development Strategies Workforce development strategies
Progress: 8.2.1 (fully met), Minnesota, 2012-2015
Comparison: 8.2.1 (fully met), by population, 2015
Measure 8.2.2: Competent Workforce A competent community health board workforce
Progress: 8.2.2 (fully met), Minnesota, 2014-2015
Comparison: 8.2.2 (fully met), by population, 2015
35%
69%
35%
31%
29%
0% 25% 50% 75% 100%
Workforce Development Strategies - 8.2.1
Competent Workforce - 8.2.2
Fully Meet Partially Meet Cannot Meet
13% 8%23%
35%
0%
25%
50%
75%
100%
2012(n=52)
2013(n=50)
2014(n=48)
2015(n=48)
58% 16% 41%
Minnesota, 35%
0%
25%
50%
75%
100%
Large boards(n=12)
Med. boards(n=19)
Small boards(n=17)
56%69%
0%
25%
50%
75%
100%
2012(n=52)
2013(n=50)
2014(n=48)
2015(n=48)
83% 53% 76%
Minnesota, 69%
0%
25%
50%
75%
100%
Large boards(n=12)
Med. boards(n=19)
Small boards(n=17)
2015 LOCAL PUBLIC HEALTH ACT PERFORMANCE MEASURES [DATA BOOK] ASSURE AN ADEQUATE LOCAL PUBLIC HEALTH INFRASTRUCTURE: CAPACITY MEASURES FROM NATIONAL STANDARDS
MDH HEALTH PARTNERSHIPS DIVISION 21 APRIL 2016
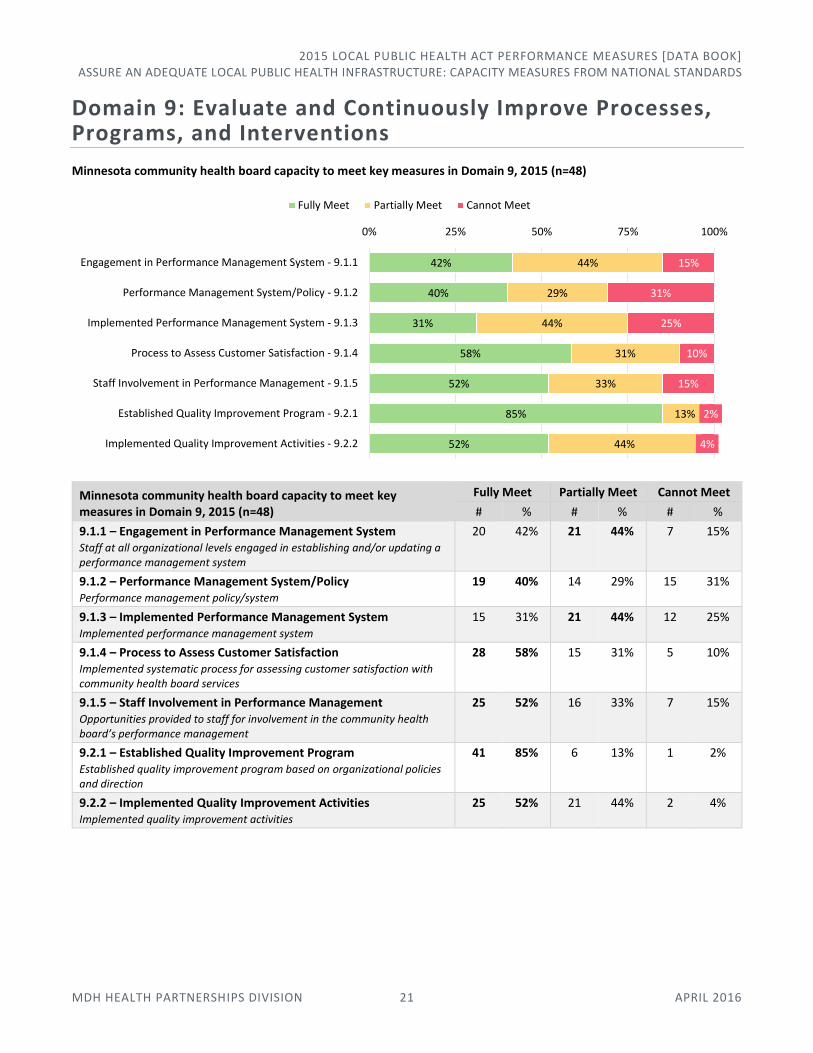
Domain 9: Evaluate and Continuously Improve Processes, Programs, and Interventions
Minnesota community health board capacity to meet key measures in Domain 9, 2015 (n=48)
Minnesota community health board capacity to meet key measures in Domain 9, 2015 (n=48)
Fully Meet Partially Meet Cannot Meet
# % # % # %
9.1.1 – Engagement in Performance Management System Staff at all organizational levels engaged in establishing and/or updating a performance management system
20 42% 21 44% 7 15%
9.1.2 – Performance Management System/Policy Performance management policy/system
19 40% 14 29% 15 31%
9.1.3 – Implemented Performance Management System Implemented performance management system
15 31% 21 44% 12 25%
9.1.4 – Process to Assess Customer Satisfaction Implemented systematic process for assessing customer satisfaction with community health board services
28 58% 15 31% 5 10%
9.1.5 – Staff Involvement in Performance Management Opportunities provided to staff for involvement in the community health board’s performance management
25 52% 16 33% 7 15%
9.2.1 – Established Quality Improvement Program Established quality improvement program based on organizational policies and direction
41 85% 6 13% 1 2%
9.2.2 – Implemented Quality Improvement Activities Implemented quality improvement activities
25 52% 21 44% 2 4%
42%
40%
31%
58%
52%
85%
52%
44%
29%
44%
31%
33%
13%
44%
15%
31%
25%
10%
15%
2%
4%
0% 25% 50% 75% 100%
Engagement in Performance Management System - 9.1.1
Performance Management System/Policy - 9.1.2
Implemented Performance Management System - 9.1.3
Process to Assess Customer Satisfaction - 9.1.4
Staff Involvement in Performance Management - 9.1.5
Established Quality Improvement Program - 9.2.1
Implemented Quality Improvement Activities - 9.2.2
Fully Meet Partially Meet Cannot Meet

2015 LOCAL PUBLIC HEALTH ACT PERFORMANCE MEASURES [DATA BOOK] ASSURE AN ADEQUATE LOCAL PUBLIC HEALTH INFRASTRUCTURE: CAPACITY MEASURES FROM NATIONAL STANDARDS
MDH HEALTH PARTNERSHIPS DIVISION 22 APRIL 2016
Measure 9.1.1: Engagement in Performance Management System Staff at all organizational levels engaged in establishing and/or updating a performance management system
Progress: 9.1.1 (fully met), Minnesota, 2012-2015
Comparison: 9.1.1 (fully met), by population, 2015
Measure 9.1.2: Performance Management System/Policy Performance management policy/system
Progress: 9.1.2 (fully met), Minnesota, 2014-2015
Comparison: 9.1.2 (fully met), by population, 2015
Measure 9.1.3: Implemented Performance Management System Implemented performance management system
This measure was previously listed as two separate measures in PHAB Standards and Measures 1.0, and was tracked differently by MDH in 2012-2013.
Progress: 9.1.3 (fully met), Minnesota, 2012-2015
Comparison: 9.1.3 (fully met), by population, 2015
21% 26%42% 42%
0%
25%
50%
75%
100%
2012(n=52)
2013(n=50)
2014(n=48)
2015(n=48)
75% 32% 29%
Minnesota, 42%
0%
25%
50%
75%
100%
Large boards(n=12)
Med. boards(n=19)
Small boards(n=17)
48%40%
0%
25%
50%
75%
100%
2012(n=52)
2013(n=50)
2014(n=48)
2015(n=48)
58% 21% 47%
Minnesota, 40%
0%
25%
50%
75%
100%
Large boards(n=12)
Med. boards(n=19)
Small boards(n=17)
13%
12%
23%31%
0%
25%
50%
75%
100%
2012(n=52)
2013(n=50)
2014(n=48)
2015(n=48)
9.1.2 (v1.0) 9.1.3 (v1.0) 9.1.3 (v1.5)
58% 16% 29%
Minnesota, 31%
0%
25%
50%
75%
100%
Large boards(n=12)
Med. boards(n=19)
Small boards(n=17)
2015 LOCAL PUBLIC HEALTH ACT PERFORMANCE MEASURES [DATA BOOK] ASSURE AN ADEQUATE LOCAL PUBLIC HEALTH INFRASTRUCTURE: CAPACITY MEASURES FROM NATIONAL STANDARDS
MDH HEALTH PARTNERSHIPS DIVISION 23 APRIL 2016
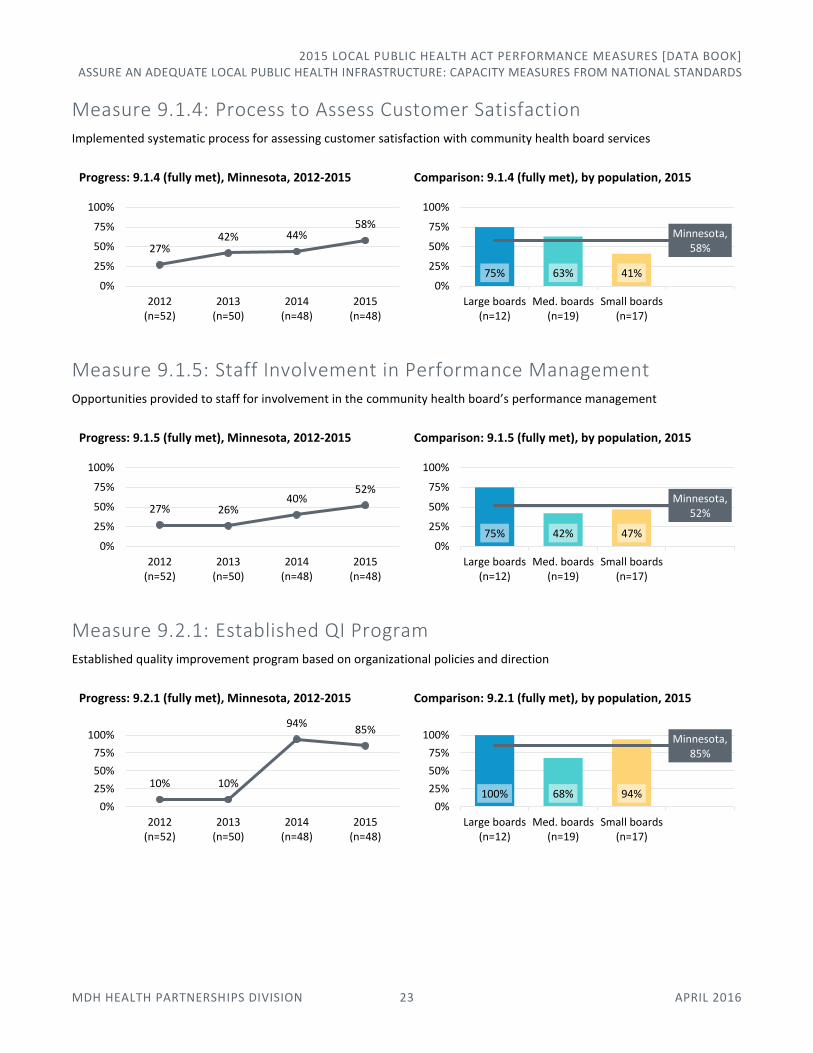
Measure 9.1.4: Process to Assess Customer Satisfaction Implemented systematic process for assessing customer satisfaction with community health board services
Progress: 9.1.4 (fully met), Minnesota, 2012-2015
Comparison: 9.1.4 (fully met), by population, 2015
Measure 9.1.5: Staff Involvement in Performance Management Opportunities provided to staff for involvement in the community health board’s performance management
Progress: 9.1.5 (fully met), Minnesota, 2012-2015
Comparison: 9.1.5 (fully met), by population, 2015
Measure 9.2.1: Established QI Program Established quality improvement program based on organizational policies and direction
Progress: 9.2.1 (fully met), Minnesota, 2012-2015
Comparison: 9.2.1 (fully met), by population, 2015
27%42% 44%
58%
0%
25%
50%
75%
100%
2012(n=52)
2013(n=50)
2014(n=48)
2015(n=48)
75% 63% 41%
Minnesota, 58%
0%
25%
50%
75%
100%
Large boards(n=12)
Med. boards(n=19)
Small boards(n=17)
27% 26%40%
52%
0%
25%
50%
75%
100%
2012(n=52)
2013(n=50)
2014(n=48)
2015(n=48)
75% 42% 47%
Minnesota, 52%
0%
25%
50%
75%
100%
Large boards(n=12)
Med. boards(n=19)
Small boards(n=17)
10% 10%
94%85%
0%
25%
50%
75%
100%
2012(n=52)
2013(n=50)
2014(n=48)
2015(n=48)
100% 68% 94%
Minnesota, 85%
0%
25%
50%
75%
100%
Large boards(n=12)
Med. boards(n=19)
Small boards(n=17)

2015 LOCAL PUBLIC HEALTH ACT PERFORMANCE MEASURES [DATA BOOK] ASSURE AN ADEQUATE LOCAL PUBLIC HEALTH INFRASTRUCTURE: CAPACITY MEASURES FROM NATIONAL STANDARDS
MDH HEALTH PARTNERSHIPS DIVISION 24 APRIL 2016
Measure 9.2.2: Implemented QI Activities Implemented quality improvement activities
Progress: 9.2.2 (fully met), Minnesota, 2012-2015
Comparison: 9.2.2 (fully met), by population, 2015
Domain 10: Contribute to and Apply the Evidence Base of Public Health
Minnesota community health board capacity to meet key measure in Domain 10, 2015 (n=48)
Minnesota community health board capacity to meet key measure in Domain 10, 2015 (n=48)
Fully Meet Partially Meet Cannot Meet
# % # % # %
10.2.3 – Communicated Research Findings Communicated research findings, including public health implications
30 63% 9 19% 9 19%
Measure 10.2.3: Communicated Research Findings Communicated research findings, including public health implications
Progress: 10.2.3 (fully met), Minnesota, 2014-2015
Comparison: 10.2.3 (fully met), by population, 2015
23%32%
50% 52%
0%
25%
50%
75%
100%
2012(n=52)
2013(n=50)
2014(n=48)
2015(n=48)
83% 32% 53%
Minnesota, 52%
0%
25%
50%
75%
100%
Large boards(n=12)
Med. boards(n=19)
Small boards(n=17)
63% 19% 19%
0% 25% 50% 75% 100%
Communicated Research Findings - 10.2.3
Fully Meet Partially Meet Cannot Meet
63% 63%
0%
25%
50%
75%
100%
2012(n=52)
2013(n=50)
2014(n=48)
2015(n=48)
83% 63% 47%
Minnesota, 63%
0%
25%
50%
75%
100%
Large boards(n=12)
Med. boards(n=19)
Small boards(n=17)

2015 LOCAL PUBLIC HEALTH ACT PERFORMANCE MEASURES [DATA BOOK] ASSURE AN ADEQUATE LOCAL PUBLIC HEALTH INFRASTRUCTURE: CAPACITY MEASURES FROM NATIONAL STANDARDS
MDH HEALTH PARTNERSHIPS DIVISION 25 APRIL 2016
Domain 11: Maintain Administrative and Management Capacity
Minnesota community health board capacity to meet key measures in Domain 11, 2015 (n=48)
Minnesota community health board capacity to meet key measures in Domain 11, 2015 (n=48)
Fully Meet Partially Meet Cannot Meet
# % # % # %
11.1.2 – Ethical Issues and Decisions Ethical issues identified and ethical decisions made
22 46% 11 23% 15 31%
11.1.4 – Policies Appropriate to Specific Populations Policies, processes, programs, and interventions provided that are socially, culturally, and linguistically appropriate to specific populations with higher health risks and poorer health outcomes
20 42% 25 52% 3 6%
Measure 11.1.2: Ethical Issues and Decisions Ethical issues identified and ethical decisions made
Progress: 11.1.2 (fully met), Minnesota, 2014-2015
Comparison: 11.1.2 (fully met), by population, 2015
Measure 11.1.4: Policies Appropriate to Specific Populations Policies, processes, programs, and interventions provided that are socially, culturally, and linguistically appropriate to specific populations with higher health risks and poorer health outcomes
Progress: 11.1.4 (fully met), Minnesota, 2014-2015
Comparison: 11.1.4 (fully met), by population, 2015
46%
42%
23%
52%
31%
6%
0% 25% 50% 75% 100%
Ethical Issues and Decisions - 11.1.2
Policies Appropriate to Specific Populations - 11.1.4
Fully Meet Partially Meet Cannot Meet
31%46%
0%
25%
50%
75%
100%
2012(n=52)
2013(n=50)
2014(n=48)
2015(n=48)
67% 37% 41%
Minnesota, 46%
0%
25%
50%
75%
100%
Large boards(n=12)
Med. boards(n=19)
Small boards(n=17)
29%42%
0%
25%
50%
75%
100%
2012(n=52)
2013(n=50)
2014(n=48)
2015(n=48)
75% 21% 41%
Minnesota, 42%
0%
25%
50%
75%
100%
Large boards(n=12)
Med. boards(n=19)
Small boards(n=17)

2015 LOCAL PUBLIC HEALTH ACT PERFORMANCE MEASURES [DATA BOOK] ASSURE AN ADEQUATE LOCAL PUBLIC HEALTH INFRASTRUCTURE: CAPACITY MEASURES FROM NATIONAL STANDARDS
MDH HEALTH PARTNERSHIPS DIVISION 26 APRIL 2016
Domain 12: Maintain Capacity to Engage the Public Health Governing Entity
Minnesota community health board capacity to meet key measures in Domain 12, 2015 (n=48)
Minnesota community health board capacity to meet key measures in Domain 12, 2015 (n=48)
Fully Meet Partially Meet Cannot Meet
# % # % # %
12.2.1 – Communication with Governing Entity Regarding Community Health Board Responsibilities Communication with the governing entity regarding the responsibilities of the community health board and of the responsibilities of the governing entity
38 79% 9 19% 1 2%
12.3.1 – Information Provided to Governing Entity Information provided to the governing entity about important public health issues facing the community, the community health board, and/or the recent actions of the community health board
47 98% 1 2% 0 0%
12.3.3 – Communication with Governing Entity Regarding Community Health Board Performance Communication with the governing entity about the community health board performance assessment and improvement
35 73% 10 21% 3 6%
Measure 12.2.1: Communication with Governing Entity on Responsibilities Communication with the governing entity regarding the responsibilities of the community health board and of the responsibilities of the governing entity
This measure was previously listed as two separate measures in PHAB Standards and Measures 1.0 (12.2.1 and 12.2.2), and was tracked differently by MDH in 2012-2013 before being combined into one measure in PHAB Standards and Measures 1.5 (12.2.1).
Progress: 12.2.1 (fully met), Minnesota, 2012-2015
Comparison: 12.2.1 (fully met), by population, 2015
79%
98%
73%
19%
2%
21%
2%
6%
0% 25% 50% 75% 100%
Communication with Gov. Entity on Responsibilities - 12.2.1
Information Provided to Governing Entity - 12.3.1
Communication with Gov. Entity on Performance - 12.2.1
Fully Meet Partially Meet Cannot Meet
83%
85%71%
90%
71%79%
0%
25%
50%
75%
100%
2012(n=52)
2013(n=50)
2014(n=48)
2015(n=48)
12.2.1 (v1.0) 12.2.2 (v1.0)
12.2.1 (v1.5)
100% 68% 76%
Minnesota, 79%
0%
25%
50%
75%
100%
Large boards(n=12)
Med. boards(n=19)
Small boards(n=17)

2015 LOCAL PUBLIC HEALTH ACT PERFORMANCE MEASURES [DATA BOOK] ASSURE AN ADEQUATE LOCAL PUBLIC HEALTH INFRASTRUCTURE: CAPACITY MEASURES FROM NATIONAL STANDARDS
MDH HEALTH PARTNERSHIPS DIVISION 27 APRIL 2016
Measure 12.3.1: Information Provided to Governing Entity Information provided to the governing entity about important public health issues facing the community, the community health board, and/or the recent actions of the community health board
Progress: 12.3.1 (fully met), Minnesota, 2012-2015
Comparison: 12.3.1 (fully met), by population, 2015
Measure 12.3.3: Communication with Governing Entity on Performance Communication with the governing entity about the community health board performance assessment and improvement
Progress: 12.3.3 (fully met), Minnesota, 2012-2015
Comparison: 12.3.3 (fully met), by population, 2015
83%96% 96% 98%
0%
25%
50%
75%
100%
2012(n=52)
2013(n=50)
2014(n=48)
2015(n=48)
100% 95% 100%
Minnesota, 98%
0%
25%
50%
75%
100%
Large boards(n=12)
Med. boards(n=19)
Small boards(n=17)
48%
70% 67% 73%
0%
25%
50%
75%
100%
2012(n=52)
2013(n=50)
2014(n=48)
2015(n=48)
92% 53% 82%
Minnesota, 73%
0%
25%
50%
75%
100%
Large boards(n=12)
Med. boards(n=19)
Small boards(n=17)

2015 LOCAL PUBLIC HEALTH ACT PERFORMANCE MEASURES [DATA BOOK] ASSURE AN ADEQUATE LOCAL PUBLIC HEALTH INFRASTRUCTURE: MINNESOTA-SPECIFIC MEASURES
MDH HEALTH PARTNERSHIPS DIVISION 28 APRIL 2016
Assure an Adequate Local Public Health Infrastructure: Minnesota-Specific Measures In this area of responsibility:
Workforce Competency
School Health
Health Equity
Organizational QI Maturity
Health Informatics
Public Health Accreditation
Statutory Requirements
Local Public Health Act Grant Activities
Workforce Competency Community health boards need a trained and competent workforce. The Core Competencies for Public Health Professionals, developed by the Council on Linkages between Academia and Public Health Practice, offer a starting point to identify professional development needs and develop a training plan.
MORE INFORMATION
MDH Health Partnerships Division, Public Health Practice Section 651-201-3880 | [email protected] www.health.state.mn.us/divs/opi/pm/corecomp/
Workforce competency strengths and gaps, Minnesota community health boards, 2015 (n=48)
Workforce competency strengths and gaps
1. Please select the top two strengths in the workforce of your CHB. (Select one.)
2. Please select the top two gaps in the workforce of your CHB. (Select one.)
Minnesota, 2015 (n=48)
Strength Gap
# % # %
Analysis/assessment 3 6% 13 27%
Policy development/program planning 16 33% 8 17%
Communication 14 29% 3 6%
Cultural competency 11 23% 9 19%
Community dimensions of practice 16 33% 7 15%
Public health sciences 3 6% 22 46%
Financial planning and management 10 21% 7 15%
Leadership and systems thinking 22 46% 4 8%
Informatics 1 2% 23 48%
8%
17%
15%
6%
19%
15%
27%
46%
48%
0%25%50%75%100%
Leadership and systems thinking
Policy development/program planning
Community dimensions of practice
Communication
Cultural competency
Financial planning and management
Analysis/assessment
Public health sciences
Informatics
Gaps
46%
33%
33%
29%
23%
21%
6%
6%
2%
0% 25% 50% 75% 100%
Strengths

2015 LOCAL PUBLIC HEALTH ACT PERFORMANCE MEASURES [DATA BOOK] ASSURE AN ADEQUATE LOCAL PUBLIC HEALTH INFRASTRUCTURE: MINNESOTA-SPECIFIC MEASURES
MDH HEALTH PARTNERSHIPS DIVISION 29 APRIL 2016
Comparison: Workforce strengths and gaps, Minnesota community health boards, by population, 2015
Workforce competency strengths, by community health board population, Minnesota, 2015
Large community health boards (n=12)
Medium community health boards (n=19)
Small community health boards (n=17) Minnesota (n=48)
1 Leadership and systems thinking
1 Leadership and systems thinking
1 Leadership and systems thinking
1 Leadership and systems thinking
2 Community dimensions of practice
2 Policy dev./program planning
2 Community dimensions of practice
2 Policy dev./program planning
3 Policy dev./program planning
Communication Communication Community dimensions of practice
Cultural competency 4 Financial planning and management
4 Policy dev./program planning
4 Communication
5 Public health sciences 5 Community dimensions of practice
5 Cultural competency 5 Cultural competency
6 Communication 6 Cultural competency 6 Financial planning and management
6 Financial planning and management
Financial planning and management
7 Analysis/assessment 7 Analysis/assessment 7 Analysis/assessment
n/r Analysis/assessment Public health sciences 8 Informatics Public health sciences
Informatics n/r Informatics n/r Public health sciences 9 Informatics
n/r = Not ranked
0%
33
%
8%
33
% 42
%
17
%
8%
58
%
0%5%
37
%
37
%
16
% 26
%
5%
32
% 42
%
0%1
2% 2
9%
35
%
24
% 35
%
0%
18
%
41
%
6%
6%
33
%
29
%
23
% 33
%
6% 2
1%
46
%
2%St
ren
gth
s
Large boards (n=12) Medium boards (n=19) Small boards (n=17) Minnesota (n=48)
42
%
17
% 8%
8%
8%
33
%
33
%
0%
50
%
16
%
11
% 5%
26
%
26
%
47
%
11
% 5%
53
%
29
%
24
%
6%
18
% 6%
53
%
6%
18
%
41
%27
% 17
% 6%
19
%
15
%
46
%
15
% 8%
48
%
Analysis/assessment
Policydevelopment/
programplanning
Communication Culturalcompetency
Communitydimensions of
practice
Public healthsciences
Financialplanning andmanagement
Leadership andsystemsthinking
Informatics
Gap
s
2015 LOCAL PUBLIC HEALTH ACT PERFORMANCE MEASURES [DATA BOOK] ASSURE AN ADEQUATE LOCAL PUBLIC HEALTH INFRASTRUCTURE: MINNESOTA-SPECIFIC MEASURES
MDH HEALTH PARTNERSHIPS DIVISION 30 APRIL 2016
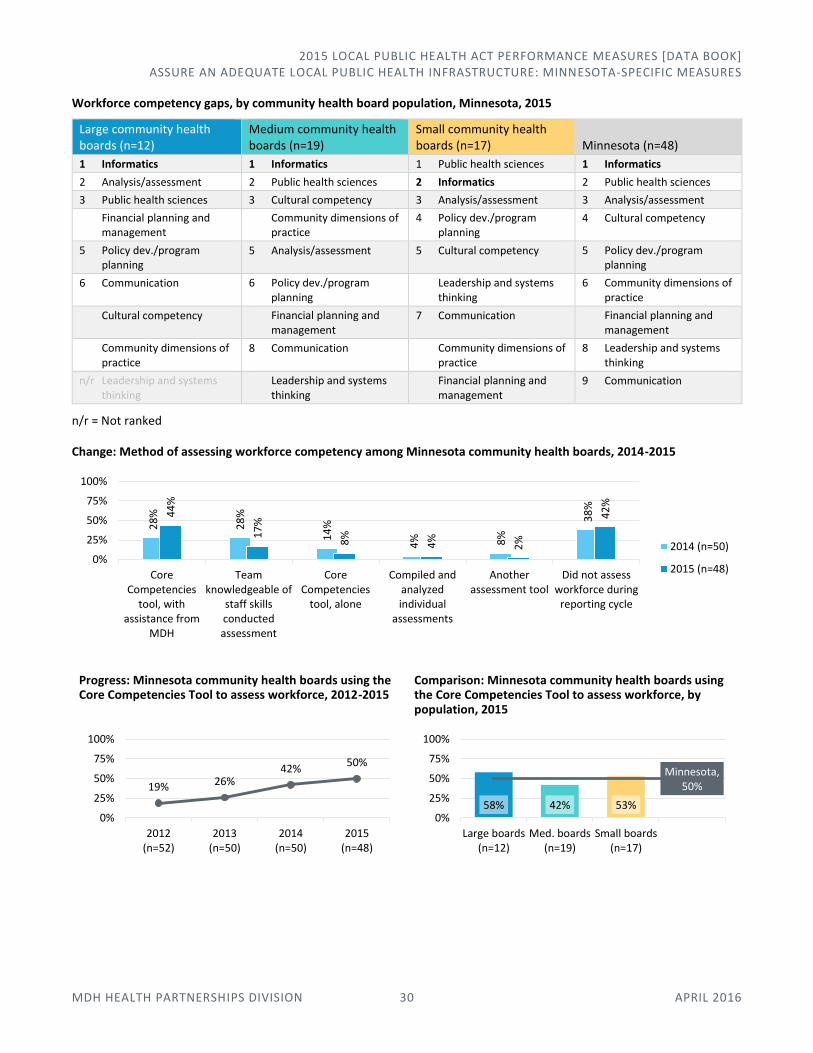
Workforce competency gaps, by community health board population, Minnesota, 2015
Large community health boards (n=12)
Medium community health boards (n=19)
Small community health boards (n=17) Minnesota (n=48)
1 Informatics 1 Informatics 1 Public health sciences 1 Informatics
2 Analysis/assessment 2 Public health sciences 2 Informatics 2 Public health sciences
3 Public health sciences 3 Cultural competency 3 Analysis/assessment 3 Analysis/assessment
Financial planning and management
Community dimensions of practice
4 Policy dev./program planning
4 Cultural competency
5 Policy dev./program planning
5 Analysis/assessment 5 Cultural competency 5 Policy dev./program planning
6 Communication 6 Policy dev./program planning
Leadership and systems thinking
6 Community dimensions of practice
Cultural competency Financial planning and management
7 Communication Financial planning and management
Community dimensions of practice
8 Communication Community dimensions of practice
8 Leadership and systems thinking
n/r Leadership and systems thinking
Leadership and systems thinking
Financial planning and management
9 Communication
n/r = Not ranked
Change: Method of assessing workforce competency among Minnesota community health boards, 2014-2015
Progress: Minnesota community health boards using the Core Competencies Tool to assess workforce, 2012-2015
Comparison: Minnesota community health boards using the Core Competencies Tool to assess workforce, by population, 2015
28
%
28
%
14
%
4% 8%
38
%
44
%
17
%
8%
4%
2%
42
%
0%
25%
50%
75%
100%
CoreCompetencies
tool, withassistance from
MDH
Teamknowledgeable of
staff skillsconductedassessment
CoreCompetencies
tool, alone
Compiled andanalyzedindividual
assessments
Anotherassessment tool
Did not assessworkforce during
reporting cycle
2014 (n=50)
2015 (n=48)
19% 26%42%
50%
0%
25%
50%
75%
100%
2012(n=52)
2013(n=50)
2014(n=50)
2015(n=48)
58% 42% 53%
Minnesota, 50%
0%
25%
50%
75%
100%
Large boards(n=12)
Med. boards(n=19)
Small boards(n=17)
2015 LOCAL PUBLIC HEALTH ACT PERFORMANCE MEASURES [DATA BOOK] ASSURE AN ADEQUATE LOCAL PUBLIC HEALTH INFRASTRUCTURE: MINNESOTA-SPECIFIC MEASURES
MDH HEALTH PARTNERSHIPS DIVISION 31 APRIL 2016
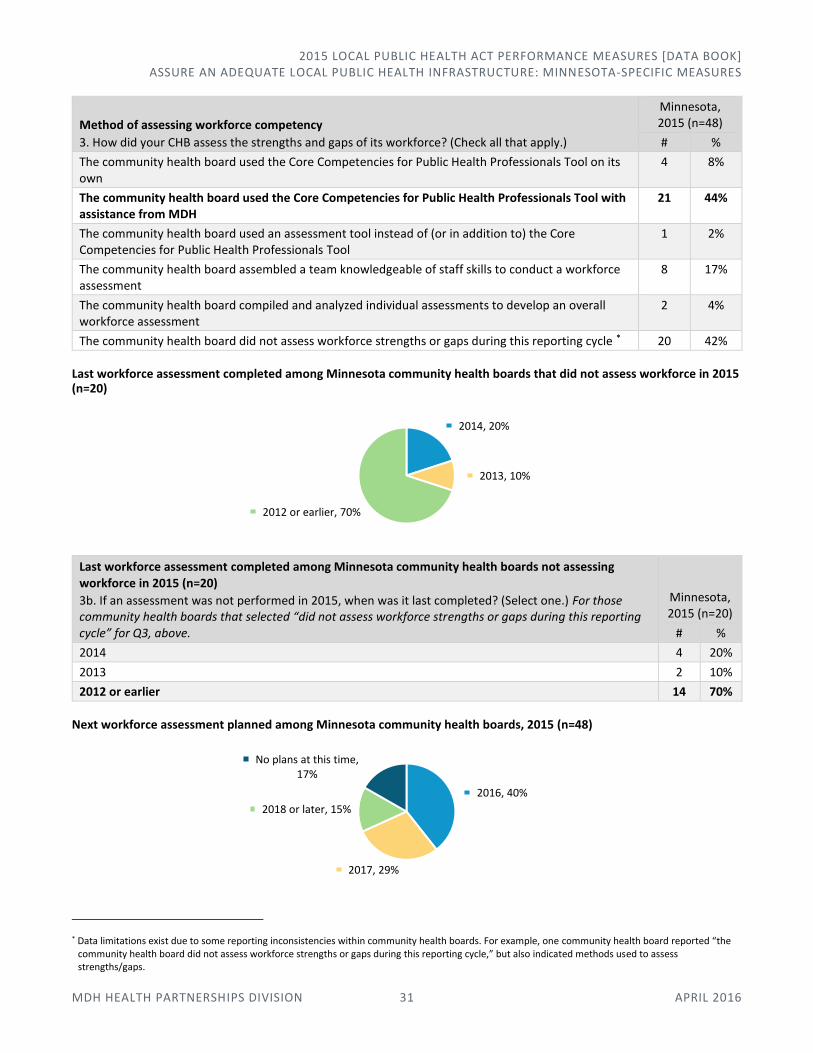
Method of assessing workforce competency
3. How did your CHB assess the strengths and gaps of its workforce? (Check all that apply.)
Minnesota, 2015 (n=48)
# %
The community health board used the Core Competencies for Public Health Professionals Tool on its own
4 8%
The community health board used the Core Competencies for Public Health Professionals Tool with assistance from MDH
21 44%
The community health board used an assessment tool instead of (or in addition to) the Core Competencies for Public Health Professionals Tool
1 2%
The community health board assembled a team knowledgeable of staff skills to conduct a workforce assessment
8 17%
The community health board compiled and analyzed individual assessments to develop an overall workforce assessment
2 4%
The community health board did not assess workforce strengths or gaps during this reporting cycle * 20 42%
Last workforce assessment completed among Minnesota community health boards that did not assess workforce in 2015 (n=20)
Last workforce assessment completed among Minnesota community health boards not assessing workforce in 2015 (n=20)
3b. If an assessment was not performed in 2015, when was it last completed? (Select one.) For those community health boards that selected “did not assess workforce strengths or gaps during this reporting cycle” for Q3, above.
Minnesota, 2015 (n=20)
# %
2014 4 20%
2013 2 10%
2012 or earlier 14 70%
Next workforce assessment planned among Minnesota community health boards, 2015 (n=48)
* Data limitations exist due to some reporting inconsistencies within community health boards. For example, one community health board reported “the community health board did not assess workforce strengths or gaps during this reporting cycle,” but also indicated methods used to assess strengths/gaps.
2014, 20%
2013, 10%
2012 or earlier, 70%
2016, 40%
2017, 29%
2018 or later, 15%
No plans at this time, 17%

2015 LOCAL PUBLIC HEALTH ACT PERFORMANCE MEASURES [DATA BOOK] ASSURE AN ADEQUATE LOCAL PUBLIC HEALTH INFRASTRUCTURE: MINNESOTA-SPECIFIC MEASURES
MDH HEALTH PARTNERSHIPS DIVISION 32 APRIL 2016
Comparison: Next workforce assessment planned among community health boards, by year of most recent assessment completed, 2015 (n=48)
Next workforce assessment planned among Minnesota community health boards
4. When does your community health board next plan to assess its workforce? (Select one.)
Minnesota, 2015 (n=48)
# %
2016 19 40%
2017 14 29%
2018 or later 7 15%
No plans to assess workforce at this time 8 17%
School Health Public health nurses and staff within the Minnesota school system work to support positive health outcomes for children and youth in all school settings.
MORE INFORMATION
MDH Community and Family Health Division, School Health Nursing (651) 201-3631 | www.health.state.mn.us/divs/cfh/program/shn/
School health activities conducted by Minnesota community health boards, 2015 (n=48)
21%
65%
39%
32%
25%
29%
21%
5%
15%
25%
5%
17%
0% 25% 50% 75% 100%
Boards that assessed workforce in 2015 (n=28)
Boards that did not assess workforce in 2015 (n=20)
Minnesota (n=48)
Next assessment: 2016 Next assessment: 2017 Next assessment: 2018 or later No plans at this time
96%
94%
92%
90%
90%
81%
69%
63%
58%
52%
42%
21%
0%
0% 25% 50% 75% 100%
Wellness activities
Provide public health updates/resources
Information and referral
Partnership activities
Consultations
Community crisis management
Facilitate or coordinate joint meetings
Environmental
Conduct trainings for staff
Conduct trainings for students
Provide health services in the schools
Employ school nurses
Community health board does not partner with school health
2015 LOCAL PUBLIC HEALTH ACT PERFORMANCE MEASURES [DATA BOOK] ASSURE AN ADEQUATE LOCAL PUBLIC HEALTH INFRASTRUCTURE: MINNESOTA-SPECIFIC MEASURES
MDH HEALTH PARTNERSHIPS DIVISION 33 APRIL 2016
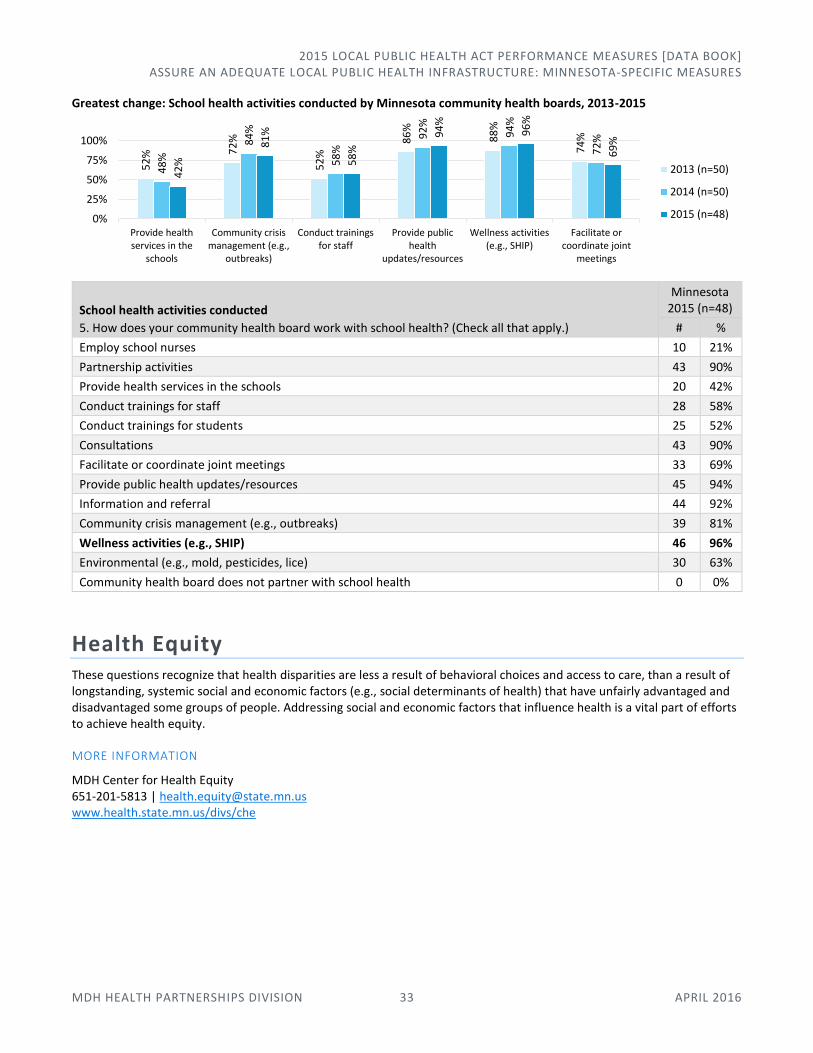
Greatest change: School health activities conducted by Minnesota community health boards, 2013-2015
School health activities conducted
5. How does your community health board work with school health? (Check all that apply.)
Minnesota 2015 (n=48)
# %
Employ school nurses 10 21%
Partnership activities 43 90%
Provide health services in the schools 20 42%
Conduct trainings for staff 28 58%
Conduct trainings for students 25 52%
Consultations 43 90%
Facilitate or coordinate joint meetings 33 69%
Provide public health updates/resources 45 94%
Information and referral 44 92%
Community crisis management (e.g., outbreaks) 39 81%
Wellness activities (e.g., SHIP) 46 96%
Environmental (e.g., mold, pesticides, lice) 30 63%
Community health board does not partner with school health 0 0%
Health Equity These questions recognize that health disparities are less a result of behavioral choices and access to care, than a result of longstanding, systemic social and economic factors (e.g., social determinants of health) that have unfairly advantaged and disadvantaged some groups of people. Addressing social and economic factors that influence health is a vital part of efforts to achieve health equity.
MORE INFORMATION
MDH Center for Health Equity 651-201-5813 | [email protected] www.health.state.mn.us/divs/che
52
% 72
%
52
%
86
%
88
%
74
%
48
%
84
%
58
%
92
%
94
%
72
%
42
%
81
%
58
%
94
%
96
%
69
%
0%
25%
50%
75%
100%
Provide healthservices in the
schools
Community crisismanagement (e.g.,
outbreaks)
Conduct trainingsfor staff
Provide publichealth
updates/resources
Wellness activities(e.g., SHIP)
Facilitate orcoordinate joint
meetings
2013 (n=50)
2014 (n=50)
2015 (n=48)
2015 LOCAL PUBLIC HEALTH ACT PERFORMANCE MEASURES [DATA BOOK] ASSURE AN ADEQUATE LOCAL PUBLIC HEALTH INFRASTRUCTURE: MINNESOTA-SPECIFIC MEASURES
MDH HEALTH PARTNERSHIPS DIVISION 34 APRIL 2016
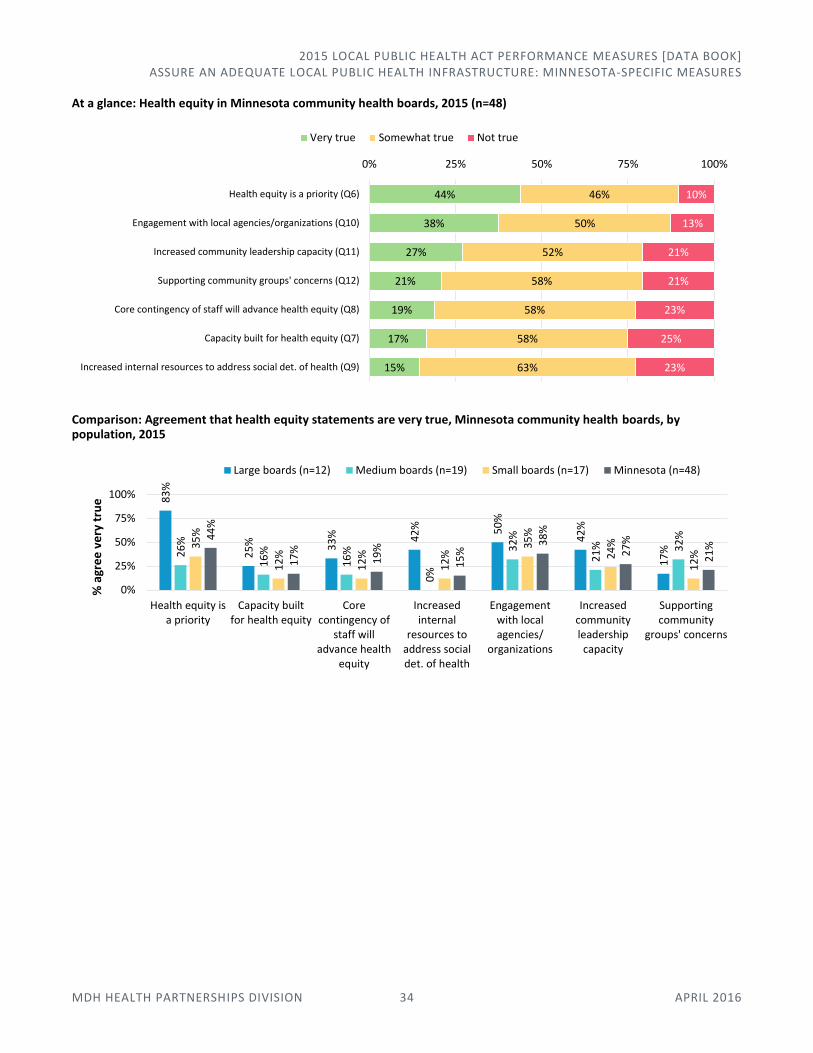
At a glance: Health equity in Minnesota community health boards, 2015 (n=48)
Comparison: Agreement that health equity statements are very true, Minnesota community health boards, by population, 2015
44%
38%
27%
21%
19%
17%
15%
46%
50%
52%
58%
58%
58%
63%
10%
13%
21%
21%
23%
25%
23%
0% 25% 50% 75% 100%
Health equity is a priority (Q6)
Engagement with local agencies/organizations (Q10)
Increased community leadership capacity (Q11)
Supporting community groups' concerns (Q12)
Core contingency of staff will advance health equity (Q8)
Capacity built for health equity (Q7)
Increased internal resources to address social det. of health (Q9)
Very true Somewhat true Not true
83
%
25
% 33
% 42
% 50
%
42
%
17
%26
%
16
%
16
%
0%
32
%
21
% 32
%
35
%
12
%
12
%
12
%
35
%
24
%
12
%
44
%
17
%
19
%
15
%
38
%
27
%
21
%
0%
25%
50%
75%
100%
Health equity isa priority
Capacity builtfor health equity
Corecontingency of
staff willadvance health
equity
Increasedinternal
resources toaddress socialdet. of health
Engagementwith localagencies/
organizations
Increasedcommunityleadershipcapacity
Supportingcommunity
groups' concerns
% a
gre
e v
ery
tru
e
Large boards (n=12) Medium boards (n=19) Small boards (n=17) Minnesota (n=48)

2015 LOCAL PUBLIC HEALTH ACT PERFORMANCE MEASURES [DATA BOOK] ASSURE AN ADEQUATE LOCAL PUBLIC HEALTH INFRASTRUCTURE: MINNESOTA-SPECIFIC MEASURES
MDH HEALTH PARTNERSHIPS DIVISION 35 APRIL 2016
Health equity in Minnesota community health boards, 2015 (n=48)
Very true Somewhat
true Not true I don’t know
# % # % # % # %
6. Health equity is a priority My community health board has identified health equity as a priority, with specific intent to address social determinants of health.
21 44% 22 46% 5 10% 0 0%
7. Capacity built for health equity My community health board has built capacity (e.g., human resources, funding, training staff) to achieve health equity by addressing social determinants of health.
8 17% 28 58% 12 25% 0 0%
8. Core contingency of staff will advance health equity My community health board has established a core contingency of staff who are poised to advance a health equity agenda.
9 19% 28 58% 11 23% 0 0%
9. Increased internal resources to address social determinants of health My community health board has increased the amount of internal resources directed to addressing social determinants of health.
7 15% 30 63% 11 23% 0 0%
10. Engagement with local agencies/organizations My community health board has engaged with local government agencies or other external organizations to support policies and programs to achieve health equity.
18 28% 24 50% 6 13% 0 0%
11. Increased community leadership capacity My community health board has made deliberate efforts to build the leadership capacity of community members to advocate on issues affecting social determinants of health.
13 27% 25 52% 10 21% 0 0%
12. Supporting community groups’ concerns My community health board has provided resources to community groups to support their self-identified concerns for achieving health equity in their communities.
10 21% 28 58% 10 21% 0 0%
Health equity is a priority My community health board has identified health equity as a priority, with specific intent to address social determinants of health.
Progress: Health equity is a priority (very true), Minnesota, 2014-2015
Comparison: Health equity is a priority (very true), by population, 2015
54%44%
0%
25%
50%
75%
100%
2014(n=50)
2015(n=48)
83% 26% 35%
Minnesota, 44%
0%
25%
50%
75%
100%
Large boards(n=12)
Med. boards(n=19)
Small boards(n=17)
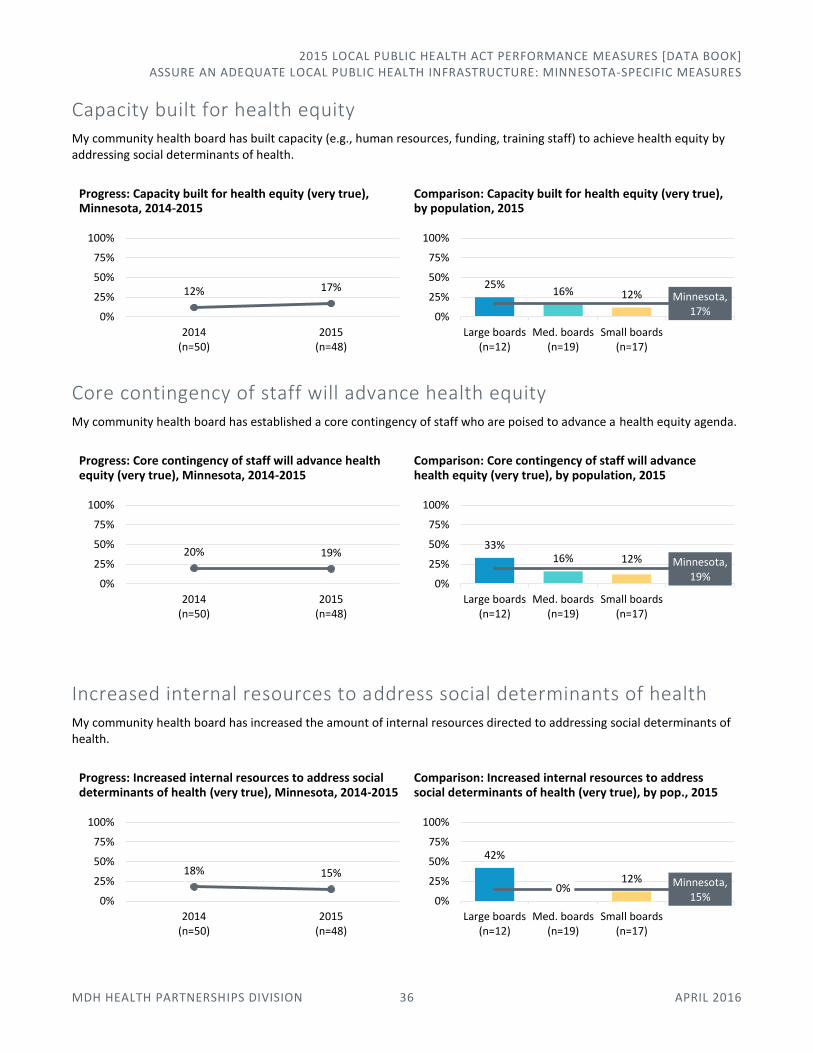
2015 LOCAL PUBLIC HEALTH ACT PERFORMANCE MEASURES [DATA BOOK] ASSURE AN ADEQUATE LOCAL PUBLIC HEALTH INFRASTRUCTURE: MINNESOTA-SPECIFIC MEASURES
MDH HEALTH PARTNERSHIPS DIVISION 36 APRIL 2016
Capacity built for health equity My community health board has built capacity (e.g., human resources, funding, training staff) to achieve health equity by addressing social determinants of health.
Progress: Capacity built for health equity (very true), Minnesota, 2014-2015
Comparison: Capacity built for health equity (very true), by population, 2015
Core contingency of staff will advance health equity My community health board has established a core contingency of staff who are poised to advance a health equity agenda.
Progress: Core contingency of staff will advance health equity (very true), Minnesota, 2014-2015
Comparison: Core contingency of staff will advance health equity (very true), by population, 2015
Increased internal resources to address social determinants of health My community health board has increased the amount of internal resources directed to addressing social determinants of health.
Progress: Increased internal resources to address social determinants of health (very true), Minnesota, 2014-2015
Comparison: Increased internal resources to address social determinants of health (very true), by pop., 2015
12% 17%
0%
25%
50%
75%
100%
2014(n=50)
2015(n=48)
25%16% 12% Minnesota,
17%0%
25%
50%
75%
100%
Large boards(n=12)
Med. boards(n=19)
Small boards(n=17)
20% 19%
0%
25%
50%
75%
100%
2014(n=50)
2015(n=48)
33%16% 12% Minnesota,
19%0%
25%
50%
75%
100%
Large boards(n=12)
Med. boards(n=19)
Small boards(n=17)
18% 15%
0%
25%
50%
75%
100%
2014(n=50)
2015(n=48)
42%
0%12% Minnesota,
15%0%
25%
50%
75%
100%
Large boards(n=12)
Med. boards(n=19)
Small boards(n=17)

2015 LOCAL PUBLIC HEALTH ACT PERFORMANCE MEASURES [DATA BOOK] ASSURE AN ADEQUATE LOCAL PUBLIC HEALTH INFRASTRUCTURE: MINNESOTA-SPECIFIC MEASURES
MDH HEALTH PARTNERSHIPS DIVISION 37 APRIL 2016
Engagement with local agencies/organizations My community health board has engaged with local government agencies or other external organizations to support policies and programs to achieve health equity.
Progress: Engagement with local agencies/organizations (very true), Minnesota, 2014-2015
Comparison: Engagement with local agencies/organizations (very true), by population, 2015
Increased community leadership capacity My community health board has made deliberate efforts to build the leadership capacity of community members to advocate on issues affecting social determinants of health.
Progress: Increased community leadership capacity (very true), Minnesota, 2014-2015
Comparison: Increased community leadership capacity (very true), by population, 2015
Supporting community groups’ concerns My community health board has provided resources to community groups to support their self-identified concerns for achieving health equity in their communities.
Progress: Supporting community groups’ concerns (very true), Minnesota, 2014-2015
Comparison: Supporting community groups’ concerns (very true), by population, 2015
30%38%
0%
25%
50%
75%
100%
2014(n=50)
2015(n=48)
50% 32% 35%
Minnesota, 38%
0%
25%
50%
75%
100%
Large boards(n=12)
Med. boards(n=19)
Small boards(n=17)
18%27%
0%
25%
50%
75%
100%
2014(n=50)
2015(n=48)
42% 21% 24%
Minnesota, 27%
0%
25%
50%
75%
100%
Large boards(n=12)
Med. boards(n=19)
Small boards(n=17)
16% 21%
0%
25%
50%
75%
100%
2014(n=50)
2015(n=48)
17%32%
12% Minnesota, 21%
0%
25%
50%
75%
100%
Large boards(n=12)
Med. boards(n=19)
Small boards(n=17)

2015 LOCAL PUBLIC HEALTH ACT PERFORMANCE MEASURES [DATA BOOK] ASSURE AN ADEQUATE LOCAL PUBLIC HEALTH INFRASTRUCTURE: MINNESOTA-SPECIFIC MEASURES
MDH HEALTH PARTNERSHIPS DIVISION 38 APRIL 2016
Organizational Quality Improvement Maturity Collecting this data allows the measurement and tracking of progress in quality improvement (QI) culture across the local public health system, from year to year. Assessing organizational QI maturity can help a community health board monitor progress, identify key areas for improvement, and determine additional education or training needed for staff and leadership.
MORE INFORMATION
MDH Health Partnerships Division, Public Health Practice Section 651-201-3880 | [email protected] www.health.state.mn.us/divs/opi/qi/
SUGGESTED PARAMETERS FOR QUESTIONS 14-16 AND QUESTIONS 18-23
Strongly agree suggests that the statement is consistently true within the community health board—whether the community health board includes one or many local health departments.
Agree suggests the statement is generally true within the community health board. In a multi-county community health board, this may mean that the statement is consistently true in one local health department, but not generally evident in another.
Neutral suggests that the statement is neither true nor untrue. Perhaps the statement is widely inconsistent across program areas of a single-county or city community health board, or across individual health departments of a multi-county community health board.
Disagree suggests that the statement is not generally evident within the community health board.
Strongly disagree suggests the statement is not at all true or evident within the community health board—whether the community health board includes one or more local health departments.
SUGGESTED PARAMETERS FOR QUESTION 17
Strongly agree suggests that the entire community health board is covered by a QI plan (via a single community health board QI plan, or the individual plans of separate health departments)
Agree suggests the entire community health board is covered by a QI plan (via a single community health board QI plan or the individual plans of separate health departments), but the plan(s) is/are not being implemented across the community health board
Neutral suggests a QI plan is (or plans are) being developed
Disagree suggests the entire community health board is not covered by a QI plan, although a planning team(s) is/are in development
Strongly disagree suggests the entire community health board is not covered by a plan, and there is no progress to develop one
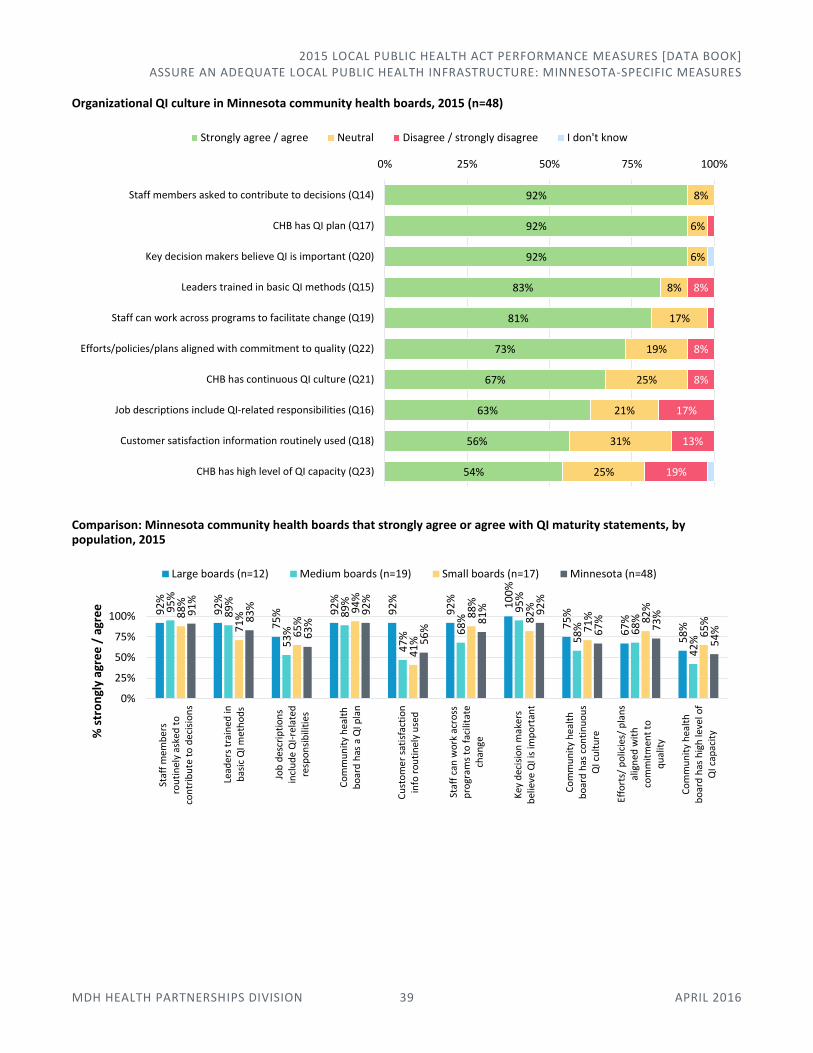
2015 LOCAL PUBLIC HEALTH ACT PERFORMANCE MEASURES [DATA BOOK] ASSURE AN ADEQUATE LOCAL PUBLIC HEALTH INFRASTRUCTURE: MINNESOTA-SPECIFIC MEASURES
MDH HEALTH PARTNERSHIPS DIVISION 39 APRIL 2016
Organizational QI culture in Minnesota community health boards, 2015 (n=48)
Comparison: Minnesota community health boards that strongly agree or agree with QI maturity statements, by population, 2015
92%
92%
92%
83%
81%
73%
67%
63%
56%
54%
8%
6%
6%
8%
17%
19%
25%
21%
31%
25%
8%
8%
8%
17%
13%
19%
0% 25% 50% 75% 100%
Staff members asked to contribute to decisions (Q14)
CHB has QI plan (Q17)
Key decision makers believe QI is important (Q20)
Leaders trained in basic QI methods (Q15)
Staff can work across programs to facilitate change (Q19)
Efforts/policies/plans aligned with commitment to quality (Q22)
CHB has continuous QI culture (Q21)
Job descriptions include QI-related responsibilities (Q16)
Customer satisfaction information routinely used (Q18)
CHB has high level of QI capacity (Q23)
Strongly agree / agree Neutral Disagree / strongly disagree I don't know
92
%
92
%
75
% 92
%
92
%
92
% 10
0%
75
%
67
%
58
%
95
%
89
%
53
%
89
%
47
% 68
%
95
%
58
% 68
%
42
%
88
%
71
%
65
%
94
%
41
%
88
%
82
%
71
% 82
%
65
%
91
%
83
%
63
%
92
%
56
%
81
% 92
%
67
%
73
%
54
%
0%
25%
50%
75%
100%
Staf
f m
emb
ers
rou
tin
ely
aske
d t
oco
ntr
ibu
te t
o d
ecis
ion
s
Lead
ers
trai
ned
inb
asic
QI m
eth
od
s
Job
des
crip
tio
ns
incl
ud
e Q
I-re
late
dre
spo
nsi
bili
ties
Co
mm
un
ity
hea
lth
bo
ard
has
a Q
I pla
n
Cu
sto
me
r sa
tisf
acti
on
info
ro
uti
nel
y u
sed
Staf
f ca
n w
ork
acr
oss
pro
gram
s to
fac
ilita
tech
ange
Key
dec
isio
n m
aker
sb
elie
ve Q
I is
imp
ort
ant
Co
mm
un
ity
hea
lth
bo
ard
has
co
nti
nu
ou
sQ
I cu
ltu
re
Effo
rts/
po
licie
s/ p
lan
sal
ign
ed w
ith
com
mit
men
t to
qu
alit
y
Co
mm
un
ity
hea
lth
bo
ard
has
hig
h le
vel o
fQ
I cap
acit
y% s
tro
ngl
y ag
ree
/ a
gre
e
Large boards (n=12) Medium boards (n=19) Small boards (n=17) Minnesota (n=48)
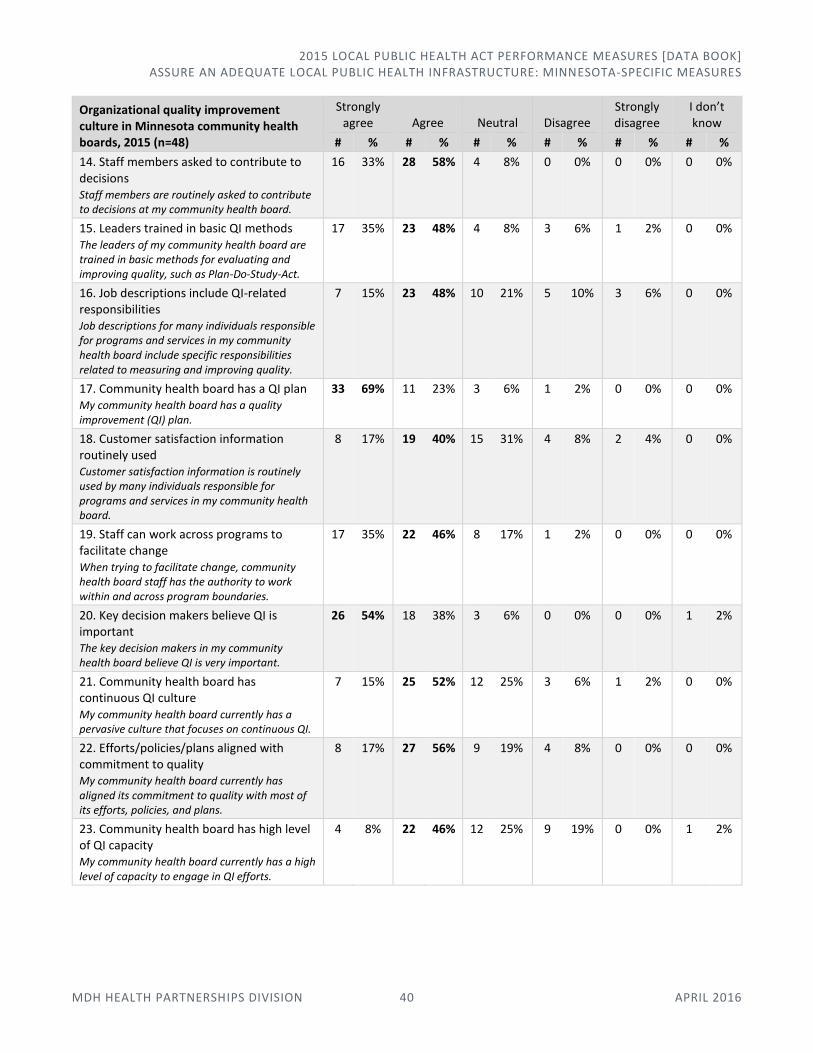
2015 LOCAL PUBLIC HEALTH ACT PERFORMANCE MEASURES [DATA BOOK] ASSURE AN ADEQUATE LOCAL PUBLIC HEALTH INFRASTRUCTURE: MINNESOTA-SPECIFIC MEASURES
MDH HEALTH PARTNERSHIPS DIVISION 40 APRIL 2016
Organizational quality improvement culture in Minnesota community health boards, 2015 (n=48)
Strongly agree Agree Neutral Disagree
Strongly disagree
I don’t know
# % # % # % # % # % # %
14. Staff members asked to contribute to decisions Staff members are routinely asked to contribute to decisions at my community health board.
16 33% 28 58% 4 8% 0 0% 0 0% 0 0%
15. Leaders trained in basic QI methods The leaders of my community health board are trained in basic methods for evaluating and improving quality, such as Plan-Do-Study-Act.
17 35% 23 48% 4 8% 3 6% 1 2% 0 0%
16. Job descriptions include QI-related responsibilities Job descriptions for many individuals responsible for programs and services in my community health board include specific responsibilities related to measuring and improving quality.
7 15% 23 48% 10 21% 5 10% 3 6% 0 0%
17. Community health board has a QI plan My community health board has a quality improvement (QI) plan.
33 69% 11 23% 3 6% 1 2% 0 0% 0 0%
18. Customer satisfaction information routinely used Customer satisfaction information is routinely used by many individuals responsible for programs and services in my community health board.
8 17% 19 40% 15 31% 4 8% 2 4% 0 0%
19. Staff can work across programs to facilitate change When trying to facilitate change, community health board staff has the authority to work within and across program boundaries.
17 35% 22 46% 8 17% 1 2% 0 0% 0 0%
20. Key decision makers believe QI is important The key decision makers in my community health board believe QI is very important.
26 54% 18 38% 3 6% 0 0% 0 0% 1 2%
21. Community health board has continuous QI culture My community health board currently has a pervasive culture that focuses on continuous QI.
7 15% 25 52% 12 25% 3 6% 1 2% 0 0%
22. Efforts/policies/plans aligned with commitment to quality My community health board currently has aligned its commitment to quality with most of its efforts, policies, and plans.
8 17% 27 56% 9 19% 4 8% 0 0% 0 0%
23. Community health board has high level of QI capacity My community health board currently has a high level of capacity to engage in QI efforts.
4 8% 22 46% 12 25% 9 19% 0 0% 1 2%
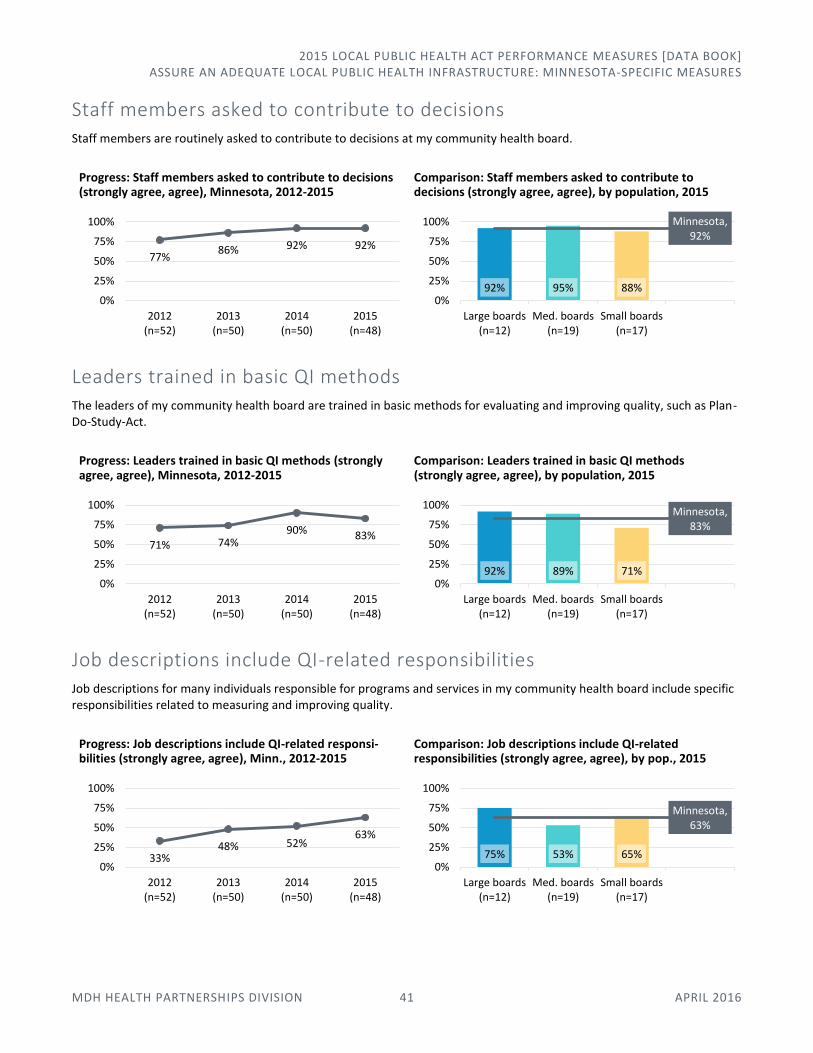
2015 LOCAL PUBLIC HEALTH ACT PERFORMANCE MEASURES [DATA BOOK] ASSURE AN ADEQUATE LOCAL PUBLIC HEALTH INFRASTRUCTURE: MINNESOTA-SPECIFIC MEASURES
MDH HEALTH PARTNERSHIPS DIVISION 41 APRIL 2016
Staff members asked to contribute to decisions Staff members are routinely asked to contribute to decisions at my community health board.
Progress: Staff members asked to contribute to decisions (strongly agree, agree), Minnesota, 2012-2015
Comparison: Staff members asked to contribute to decisions (strongly agree, agree), by population, 2015
Leaders trained in basic QI methods The leaders of my community health board are trained in basic methods for evaluating and improving quality, such as Plan-Do-Study-Act.
Progress: Leaders trained in basic QI methods (strongly agree, agree), Minnesota, 2012-2015
Comparison: Leaders trained in basic QI methods (strongly agree, agree), by population, 2015
Job descriptions include QI-related responsibilities Job descriptions for many individuals responsible for programs and services in my community health board include specific responsibilities related to measuring and improving quality.
Progress: Job descriptions include QI-related responsi-bilities (strongly agree, agree), Minn., 2012-2015
Comparison: Job descriptions include QI-related responsibilities (strongly agree, agree), by pop., 2015
77%86% 92% 92%
0%
25%
50%
75%
100%
2012(n=52)
2013(n=50)
2014(n=50)
2015(n=48)
92% 95% 88%
Minnesota, 92%
0%
25%
50%
75%
100%
Large boards(n=12)
Med. boards(n=19)
Small boards(n=17)
71% 74%90% 83%
0%
25%
50%
75%
100%
2012(n=52)
2013(n=50)
2014(n=50)
2015(n=48)
92% 89% 71%
Minnesota, 83%
0%
25%
50%
75%
100%
Large boards(n=12)
Med. boards(n=19)
Small boards(n=17)
33%48% 52%
63%
0%
25%
50%
75%
100%
2012(n=52)
2013(n=50)
2014(n=50)
2015(n=48)
75% 53% 65%
Minnesota, 63%
0%
25%
50%
75%
100%
Large boards(n=12)
Med. boards(n=19)
Small boards(n=17)
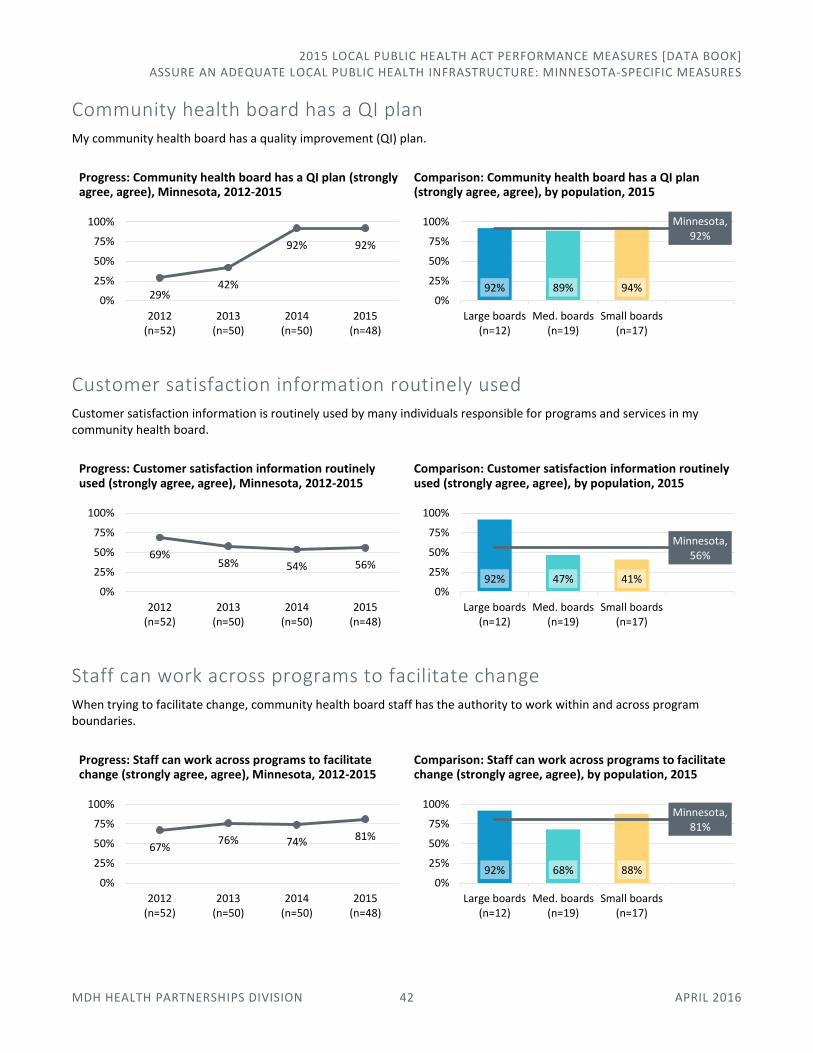
2015 LOCAL PUBLIC HEALTH ACT PERFORMANCE MEASURES [DATA BOOK] ASSURE AN ADEQUATE LOCAL PUBLIC HEALTH INFRASTRUCTURE: MINNESOTA-SPECIFIC MEASURES
MDH HEALTH PARTNERSHIPS DIVISION 42 APRIL 2016
Community health board has a QI plan My community health board has a quality improvement (QI) plan.
Progress: Community health board has a QI plan (strongly agree, agree), Minnesota, 2012-2015
Comparison: Community health board has a QI plan (strongly agree, agree), by population, 2015
Customer satisfaction information routinely used Customer satisfaction information is routinely used by many individuals responsible for programs and services in my community health board.
Progress: Customer satisfaction information routinely used (strongly agree, agree), Minnesota, 2012-2015
Comparison: Customer satisfaction information routinely used (strongly agree, agree), by population, 2015
Staff can work across programs to facilitate change When trying to facilitate change, community health board staff has the authority to work within and across program boundaries.
Progress: Staff can work across programs to facilitate change (strongly agree, agree), Minnesota, 2012-2015
Comparison: Staff can work across programs to facilitate change (strongly agree, agree), by population, 2015
29%42%
92% 92%
0%
25%
50%
75%
100%
2012(n=52)
2013(n=50)
2014(n=50)
2015(n=48)
92% 89% 94%
Minnesota, 92%
0%
25%
50%
75%
100%
Large boards(n=12)
Med. boards(n=19)
Small boards(n=17)
69%58% 54% 56%
0%
25%
50%
75%
100%
2012(n=52)
2013(n=50)
2014(n=50)
2015(n=48)
92% 47% 41%
Minnesota, 56%
0%
25%
50%
75%
100%
Large boards(n=12)
Med. boards(n=19)
Small boards(n=17)
67%76% 74% 81%
0%
25%
50%
75%
100%
2012(n=52)
2013(n=50)
2014(n=50)
2015(n=48)
92% 68% 88%
Minnesota, 81%
0%
25%
50%
75%
100%
Large boards(n=12)
Med. boards(n=19)
Small boards(n=17)
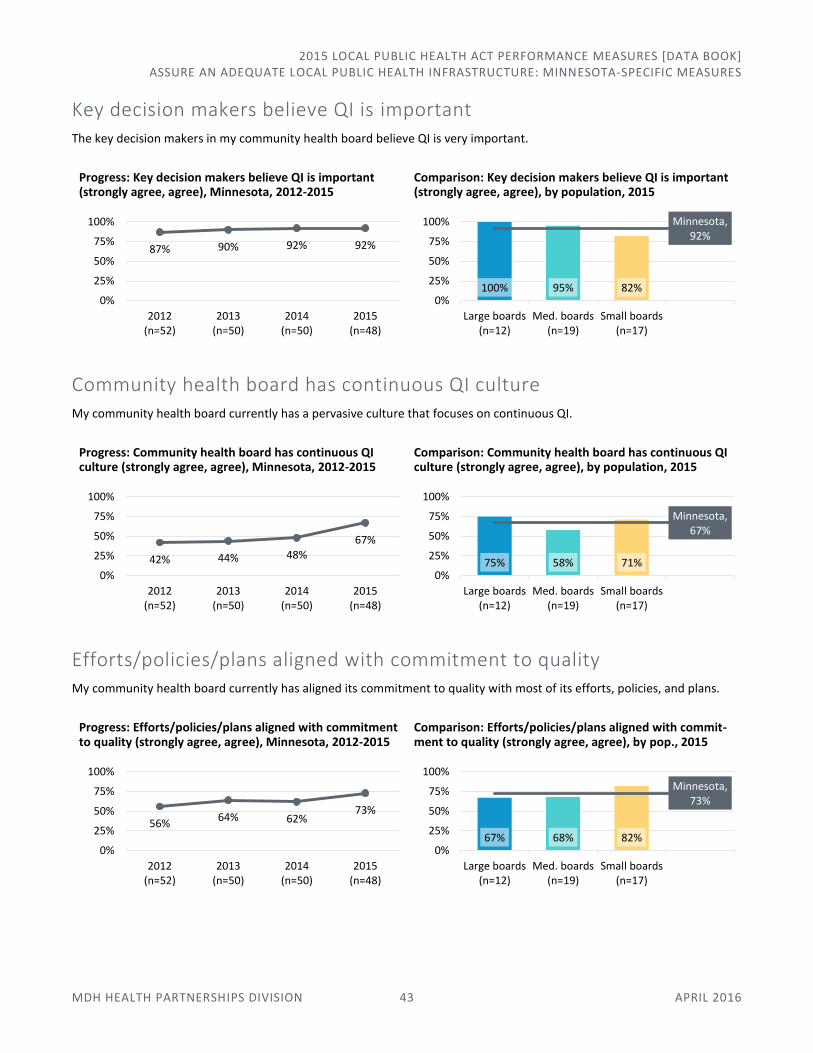
2015 LOCAL PUBLIC HEALTH ACT PERFORMANCE MEASURES [DATA BOOK] ASSURE AN ADEQUATE LOCAL PUBLIC HEALTH INFRASTRUCTURE: MINNESOTA-SPECIFIC MEASURES
MDH HEALTH PARTNERSHIPS DIVISION 43 APRIL 2016
Key decision makers believe QI is important The key decision makers in my community health board believe QI is very important.
Progress: Key decision makers believe QI is important (strongly agree, agree), Minnesota, 2012-2015
Comparison: Key decision makers believe QI is important (strongly agree, agree), by population, 2015
Community health board has continuous QI culture My community health board currently has a pervasive culture that focuses on continuous QI.
Progress: Community health board has continuous QI culture (strongly agree, agree), Minnesota, 2012-2015
Comparison: Community health board has continuous QI culture (strongly agree, agree), by population, 2015
Efforts/policies/plans aligned with commitment to quality My community health board currently has aligned its commitment to quality with most of its efforts, policies, and plans.
Progress: Efforts/policies/plans aligned with commitment to quality (strongly agree, agree), Minnesota, 2012-2015
Comparison: Efforts/policies/plans aligned with commit-ment to quality (strongly agree, agree), by pop., 2015
87% 90% 92% 92%
0%
25%
50%
75%
100%
2012(n=52)
2013(n=50)
2014(n=50)
2015(n=48)
100% 95% 82%
Minnesota, 92%
0%
25%
50%
75%
100%
Large boards(n=12)
Med. boards(n=19)
Small boards(n=17)
42% 44% 48%
67%
0%
25%
50%
75%
100%
2012(n=52)
2013(n=50)
2014(n=50)
2015(n=48)
75% 58% 71%
Minnesota, 67%
0%
25%
50%
75%
100%
Large boards(n=12)
Med. boards(n=19)
Small boards(n=17)
56%64% 62%
73%
0%
25%
50%
75%
100%
2012(n=52)
2013(n=50)
2014(n=50)
2015(n=48)
67% 68% 82%
Minnesota, 73%
0%
25%
50%
75%
100%
Large boards(n=12)
Med. boards(n=19)
Small boards(n=17)

2015 LOCAL PUBLIC HEALTH ACT PERFORMANCE MEASURES [DATA BOOK] ASSURE AN ADEQUATE LOCAL PUBLIC HEALTH INFRASTRUCTURE: MINNESOTA-SPECIFIC MEASURES
MDH HEALTH PARTNERSHIPS DIVISION 44 APRIL 2016
Community health board has high level of QI capacity My community health board currently has a high level of capacity to engage in QI efforts.
Progress: Community health board has high level of QI capacity (strongly agree, agree), Minnesota, 2012-2015
Comparison: Community health board has high level of QI capacity (strongly agree, agree), by population, 2015
Organizational QI Maturity Score
Progress, comparison: Median organizational QI maturity score, Minnesota community health boards, by population, 2012-2015†
Median organizational QI maturity score, Minnesota community health boards,† by population, 2012-2015 2012 2013 2014 2015
Large community health boards 3.8 3.5 4.4 4.1
Medium community health boards 3.5 3.7 3.7 4.0
Small community health boards 3.1 3.6 3.8 3.9
Minnesota 3.5 3.6 3.9 4.0
† 2011 data was obtained from the University of Southern Maine as part of the Multi-State Learning Collaborative Survey. MDH was able to obtain data for 56 respondents (80 percent response rate), representing a mix of community health boards and local health departments. Data for 2012-2015 was obtained from annual reporting and the reporting entity was the community health board.
23%36%
48% 54%
0%
25%
50%
75%
100%
2012(n=52)
2013(n=50)
2014(n=50)
2015(n=48)
58% 42% 65%
Minnesota, 54%
0%
25%
50%
75%
100%
Large boards(n=12)
Med. boards(n=19)
Small boards(n=17)
3.2
3.5
4.03.8
4.1
3.1
3.9
2.5
3.0
3.5
4.0
4.5
5.0
2011 2012(n=52)
2013(n=50)
2014(n=50)
2015(n=48)
Minnesota
Large community health boards
Medium community health boards
Small community health boards
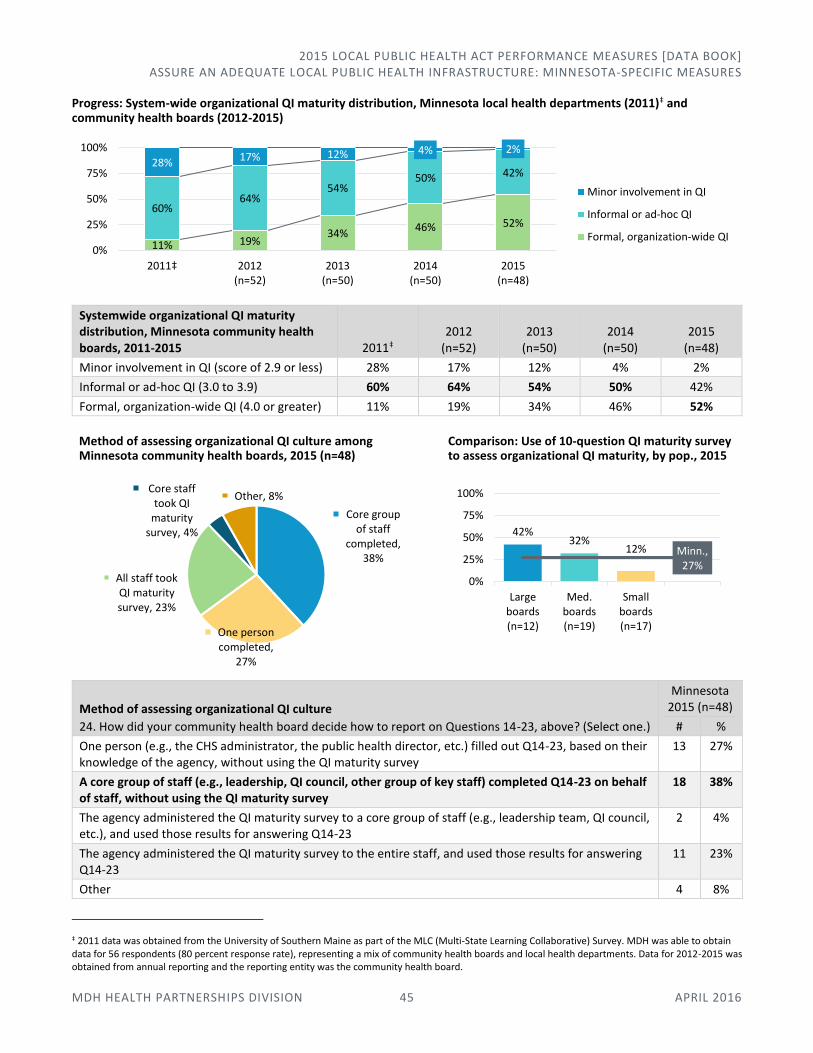
2015 LOCAL PUBLIC HEALTH ACT PERFORMANCE MEASURES [DATA BOOK] ASSURE AN ADEQUATE LOCAL PUBLIC HEALTH INFRASTRUCTURE: MINNESOTA-SPECIFIC MEASURES
MDH HEALTH PARTNERSHIPS DIVISION 45 APRIL 2016
Progress: System-wide organizational QI maturity distribution, Minnesota local health departments (2011)‡ and community health boards (2012-2015)
Systemwide organizational QI maturity distribution, Minnesota community health boards, 2011-2015 2011‡
2012 (n=52)
2013 (n=50)
2014 (n=50)
2015 (n=48)
Minor involvement in QI (score of 2.9 or less) 28% 17% 12% 4% 2%
Informal or ad-hoc QI (3.0 to 3.9) 60% 64% 54% 50% 42%
Formal, organization-wide QI (4.0 or greater) 11% 19% 34% 46% 52%
Method of assessing organizational QI culture among Minnesota community health boards, 2015 (n=48)
Comparison: Use of 10-question QI maturity survey to assess organizational QI maturity, by pop., 2015
Method of assessing organizational QI culture
24. How did your community health board decide how to report on Questions 14-23, above? (Select one.)
Minnesota 2015 (n=48)
# %
One person (e.g., the CHS administrator, the public health director, etc.) filled out Q14-23, based on their knowledge of the agency, without using the QI maturity survey
13 27%
A core group of staff (e.g., leadership, QI council, other group of key staff) completed Q14-23 on behalf of staff, without using the QI maturity survey
18 38%
The agency administered the QI maturity survey to a core group of staff (e.g., leadership team, QI council, etc.), and used those results for answering Q14-23
2 4%
The agency administered the QI maturity survey to the entire staff, and used those results for answering Q14-23
11 23%
Other 4 8%
‡ 2011 data was obtained from the University of Southern Maine as part of the MLC (Multi-State Learning Collaborative) Survey. MDH was able to obtain data for 56 respondents (80 percent response rate), representing a mix of community health boards and local health departments. Data for 2012-2015 was obtained from annual reporting and the reporting entity was the community health board.
11% 19%34%
46% 52%60%
64%54%
50% 42%28% 17% 12% 4% 2%
0%
25%
50%
75%
100%
2011‡ 2012(n=52)
2013(n=50)
2014(n=50)
2015(n=48)
Minor involvement in QI
Informal or ad-hoc QI
Formal, organization-wide QI
Core group of staff
completed, 38%
One person completed,
27%
All staff took QI maturity survey, 23%
Core staff took QI
maturity survey, 4%
Other, 8%
42%32%
12% Minn., 27%
0%
25%
50%
75%
100%
Largeboards(n=12)
Med.boards(n=19)
Smallboards(n=17)

2015 LOCAL PUBLIC HEALTH ACT PERFORMANCE MEASURES [DATA BOOK] ASSURE AN ADEQUATE LOCAL PUBLIC HEALTH INFRASTRUCTURE: MINNESOTA-SPECIFIC MEASURES
MDH HEALTH PARTNERSHIPS DIVISION 46 APRIL 2016
Health Informatics These questions are used extensively by the MDH Office of Health Information Technology and the Minnesota e-Health Advisory Committee to develop programs, inform policy, and support community collaborative efforts. The MDH Office of Health Information Technology cites the data in assessment reports, fact sheets, and briefs.
MORE INFORMATION
MDH Office of Health Information Technology 651-201-5508 | [email protected] www.health.state.mn.us/divs/hpsc/ohit/
Software applications used by Minnesota community health boards for EHR systems, 2015 (n=48)
Greatest change: Software applications used by Minnesota community health boards for EHR systems, 2013-2015
Software applications used for EHR systems
25. Which software application does your community health board use for the public health electronic health record (EHR) system? (Check all that apply.)
Minnesota 2015 (n=48)
# %
PH-Doc 27 56%
CareFacts Information Systems 6 13%
CHAMP Software 17 35%
Digital Health Department 2 4%
Decade Software 1 2%
Custom-built local system 3 6%
Other 6 13%
No electronic record in place 1 2%
56%
35%
13%
6%
4%
2%
13%
2%
0% 25% 50% 75% 100%
PH-Doc
CHAMP Software
CareFacts Information Systems
Custom-built local system
Digital Health Department
Decade Software
Other
No electronic record in place
44
%
40
%
16
%
8%
6%
2% 1
6%
2%
56
%
36
%
12
%
8%
4%
2% 1
0%
2%
56
%
35
%
13
%
6%
4%
2% 1
3%
2%
0%
25%
50%
75%
100%
PH-Doc CHAMPSoftware
CareFactsInformation
Systems
Custom-builtlocal system
DigitalHealth
Department
DecadeSoftware
Other No electronicrecord in
place
2013 (n=50)
2014 (n=50)
2015 (n=48)

2015 LOCAL PUBLIC HEALTH ACT PERFORMANCE MEASURES [DATA BOOK] ASSURE AN ADEQUATE LOCAL PUBLIC HEALTH INFRASTRUCTURE: MINNESOTA-SPECIFIC MEASURES
MDH HEALTH PARTNERSHIPS DIVISION 47 APRIL 2016
Partners with which Minnesota community health boards electronically transmitted, or needed to share, client/patient information, 2015 (n=48)
Partners with which community health boards electronically transmitted, or needed to share, client/patient information
26. In the past year, with which of the following partners did you need to share client/patient health information (using any method or format, either electronic or manual)? (Check all that apply.) 27. In the past year, with which of the following partners did you electronically transmit (send or receive) patient/client health information, assuming appropriate consents were obtained? (Check all that apply.)
Minnesota 2015 (n=48)
Needed to Share
Electronically Transmitted
# % # %
Primary care clinics, including mobile clinics 47 98% 24 50%
Hospitals 43 90% 20 42%
Behavioral health providers 40 83% 15 31%
Dental providers 28 58% 5 10%
Home health agencies 33 69% 10 21%
Long-term care facilities 34 71% 15 31%
Jails/correctional facilities 20 42% 5 10%
Social services and supports (e.g., housing, transportation, food, legal aid) 47 98% 24 50%
Counties or departments within our community health board 39 81% 23 48%
Health or county-based purchasing plans 42 88% 29 60%
Minnesota Department of Health 48 100% 36 75%
Minnesota Department of Human Services 45 94% 25 52%
Other state agencies 12 25% 4 8%
Federal agencies 14 29% 5 10%
Other 10 21% 6 13%
None of the above 0 0% 6 13%
100%
98%
98%
94%
90%
88%
83%
81%
71%
69%
58%
42%
29%
25%
21%
75%
50%
50%
52%
42%
60%
31%
48%
31%
21%
10%
10%
10%
8%
13%
13%
0% 25% 50% 75% 100%
Minnesota Department of Health
Primary care clinics, including mobile clinics
Social services and supports
Minnesota Department of Human Services
Hospitals
Health or county-based purchasing plans
Behavioral health providers
Counties or departments within our community health board
Long-term care facilities
Home health agencies
Dental providers
Jails/correctional facilities
Federal agencies
Other state agencies
Other
None of the above
Needed to Share Electronically Transmitted
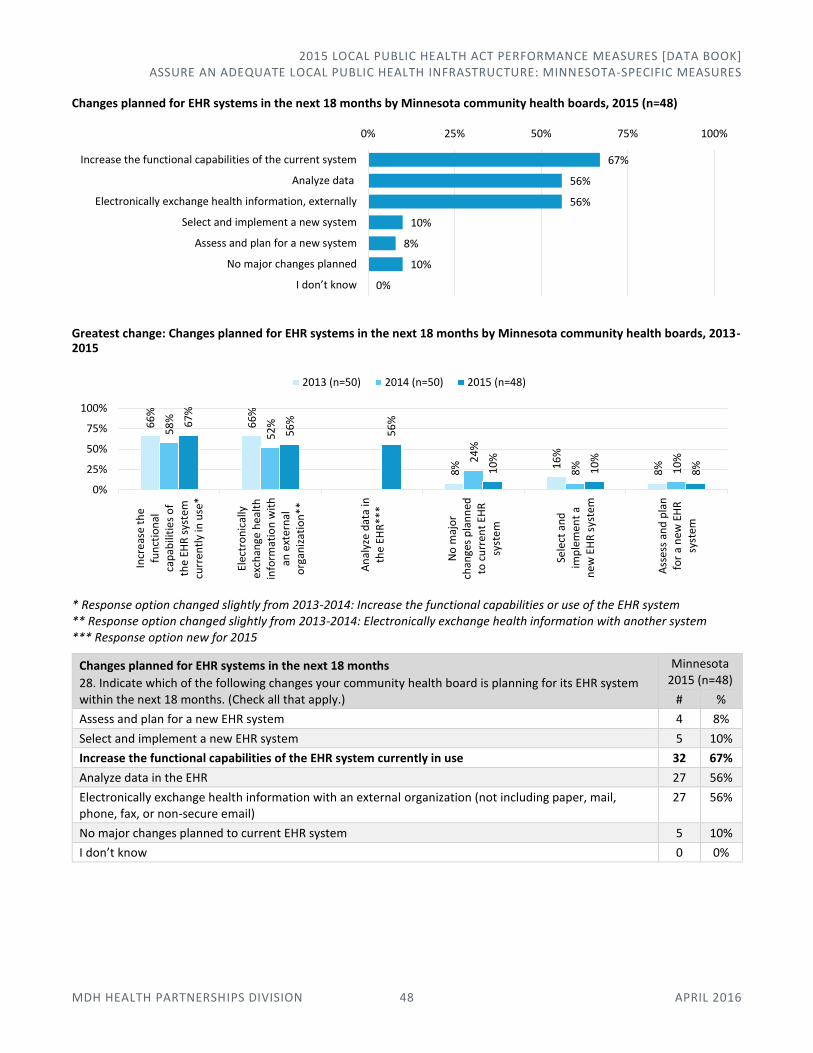
2015 LOCAL PUBLIC HEALTH ACT PERFORMANCE MEASURES [DATA BOOK] ASSURE AN ADEQUATE LOCAL PUBLIC HEALTH INFRASTRUCTURE: MINNESOTA-SPECIFIC MEASURES
MDH HEALTH PARTNERSHIPS DIVISION 48 APRIL 2016
Changes planned for EHR systems in the next 18 months by Minnesota community health boards, 2015 (n=48)
Greatest change: Changes planned for EHR systems in the next 18 months by Minnesota community health boards, 2013-2015
* Response option changed slightly from 2013-2014: Increase the functional capabilities or use of the EHR system ** Response option changed slightly from 2013-2014: Electronically exchange health information with another system *** Response option new for 2015
Changes planned for EHR systems in the next 18 months
28. Indicate which of the following changes your community health board is planning for its EHR system within the next 18 months. (Check all that apply.)
Minnesota 2015 (n=48)
# %
Assess and plan for a new EHR system 4 8%
Select and implement a new EHR system 5 10%
Increase the functional capabilities of the EHR system currently in use 32 67%
Analyze data in the EHR 27 56%
Electronically exchange health information with an external organization (not including paper, mail, phone, fax, or non-secure email)
27 56%
No major changes planned to current EHR system 5 10%
I don’t know 0 0%
67%
56%
56%
10%
8%
10%
0%
0% 25% 50% 75% 100%
Increase the functional capabilities of the current system
Analyze data
Electronically exchange health information, externally
Select and implement a new system
Assess and plan for a new system
No major changes planned
I don’t know
66
%
66
%
8% 1
6%
8%
58
%
52
%
24
%
8% 10
%
67
%
56
%
56
%
10
%
10
%
8%
0%
25%
50%
75%
100%
Incr
eas
e th
efu
nct
ion
alca
pab
iliti
es
of
the
EHR
sys
tem
curr
en
tly
in u
se*
Elec
tro
nic
ally
exch
ange
he
alth
info
rmat
ion
wit
han
ext
ern
alo
rgan
izat
ion
**
An
alyz
e d
ata
inth
e EH
R**
*
No
maj
or
chan
ges
pla
nn
edto
cu
rren
t EH
Rsy
stem
Sele
ct a
nd
imp
lem
ent
an
ew
EH
R s
yste
m
Ass
ess
and
pla
nfo
r a
new
EH
Rsy
stem
2013 (n=50) 2014 (n=50) 2015 (n=48)

2015 LOCAL PUBLIC HEALTH ACT PERFORMANCE MEASURES [DATA BOOK] ASSURE AN ADEQUATE LOCAL PUBLIC HEALTH INFRASTRUCTURE: MINNESOTA-SPECIFIC MEASURES
MDH HEALTH PARTNERSHIPS DIVISION 49 APRIL 2016
Greatest challenges related to secure electronic exchange of health information with outside organizations, Minnesota community health boards, 2015 (n=48)
Comparison: Greatest challenges related to secure electronic exchange of information with outside organizations, Minnesota community health boards, by population and greatest spread, 2015
Greatest challenges related to secure electronic exchange of health information with outside organizations
29. Indicate your greatest challenges related to secure electronic exchange of health information with outside organizations (e.g., health providers, social services, state agencies)? (Select up to five items.)
Minnesota 2015 (n=48)
# %
We lack the ability to electronically exchange health information 6 13%
Our partners are not able to electronically exchange health information 19 40%
We do not know if our partners are able to electronically exchange health information 23 48%
Managing consent to share information (e.g., HIPAA, privacy, or legal concerns) 31 65%
Planning for and executing data use agreements 27 56%
Inadequate vendor options for health information exchange 9 19%
Inadequate technical support to implement health information exchange 18 38%
Our IT staff do not understand our needs for heath IT and/or health informatics 14 29%
Inadequate broadband/Internet access 0 0%
Inadequate set-up and/or subscription fees for health information exchange 7 15%
Inadequate leadership support (e.g., community health board, management) 2 4%
Unclear value on return on investment 11 23%
Other 15 31%
65%
56%
48%
40%
38%
29%
23%
19%
15%
13%
4%
0%
31%
0% 25% 50% 75% 100%
Managing consent to share information
Planning for/executing data use agreements
Unknown if partners can exchange
Partners not able to exchange
Inadequate technical support for implementation
IT staff does not understand needs
Unclear value on ROI
Inadequate vendor options
Inadeaquate set-up/subscription fees
Lack ability to exchange
Inadequate leadership support
Inadeaquate broadband/internet access
Other
25
%
75
%
25
%
67
%
8%
8%
42
% 53
%
47
%
47
%
26
%
21
%
18
%
71
%
35
% 59
%
6%
6%
29
%
65
%
38
% 56
%
15
%
13
%
0%
25%
50%
75%
100%
IT staff does notunderstand needs
Managing consentto share information
Inadequatetechnical support for
implementation
Planning for/executing data use
agreements
Inadeaquate set-up/subscription fees
Lack ability toexchange
Large boards (n=12) Medium boards (n=19) Small boards (n=17) Minnesota (n=48)
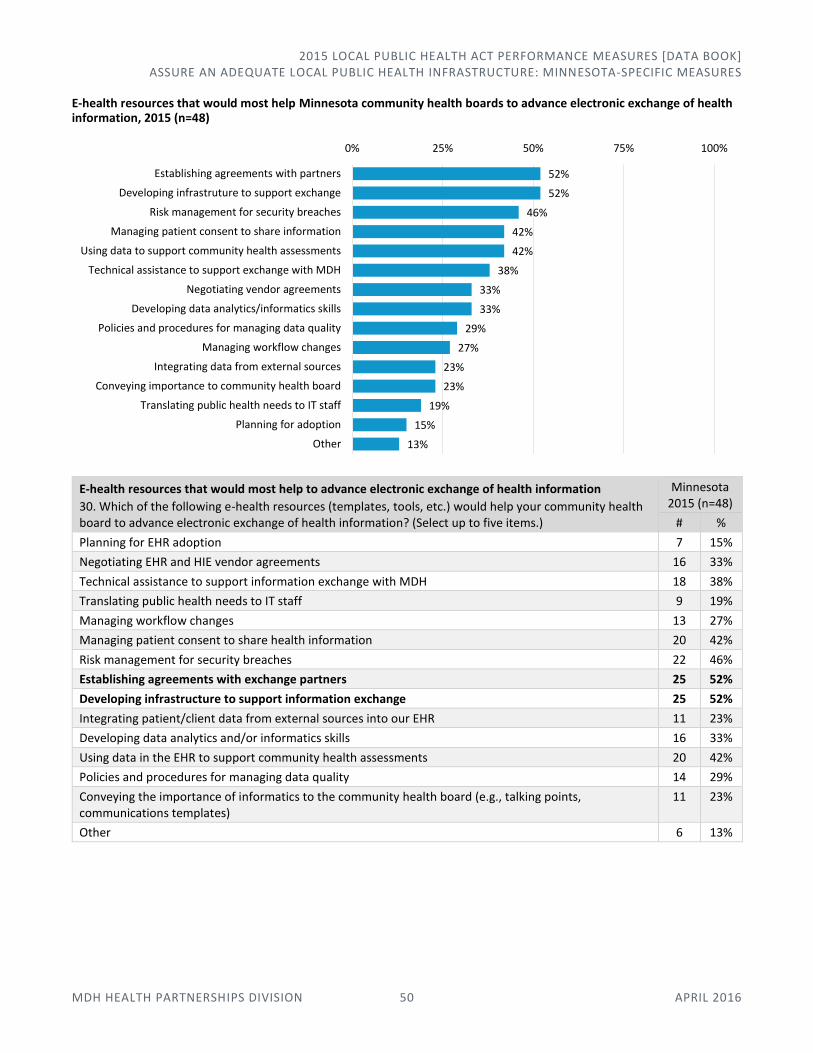
2015 LOCAL PUBLIC HEALTH ACT PERFORMANCE MEASURES [DATA BOOK] ASSURE AN ADEQUATE LOCAL PUBLIC HEALTH INFRASTRUCTURE: MINNESOTA-SPECIFIC MEASURES
MDH HEALTH PARTNERSHIPS DIVISION 50 APRIL 2016
E-health resources that would most help Minnesota community health boards to advance electronic exchange of health information, 2015 (n=48)
E-health resources that would most help to advance electronic exchange of health information
30. Which of the following e-health resources (templates, tools, etc.) would help your community health board to advance electronic exchange of health information? (Select up to five items.)
Minnesota 2015 (n=48)
# %
Planning for EHR adoption 7 15%
Negotiating EHR and HIE vendor agreements 16 33%
Technical assistance to support information exchange with MDH 18 38%
Translating public health needs to IT staff 9 19%
Managing workflow changes 13 27%
Managing patient consent to share health information 20 42%
Risk management for security breaches 22 46%
Establishing agreements with exchange partners 25 52%
Developing infrastructure to support information exchange 25 52%
Integrating patient/client data from external sources into our EHR 11 23%
Developing data analytics and/or informatics skills 16 33%
Using data in the EHR to support community health assessments 20 42%
Policies and procedures for managing data quality 14 29%
Conveying the importance of informatics to the community health board (e.g., talking points, communications templates)
11 23%
Other 6 13%
52%
52%
46%
42%
42%
38%
33%
33%
29%
27%
23%
23%
19%
15%
13%
0% 25% 50% 75% 100%
Establishing agreements with partners
Developing infrastruture to support exchange
Risk management for security breaches
Managing patient consent to share information
Using data to support community health assessments
Technical assistance to support exchange with MDH
Negotiating vendor agreements
Developing data analytics/informatics skills
Policies and procedures for managing data quality
Managing workflow changes
Integrating data from external sources
Conveying importance to community health board
Translating public health needs to IT staff
Planning for adoption
Other

2015 LOCAL PUBLIC HEALTH ACT PERFORMANCE MEASURES [DATA BOOK] ASSURE AN ADEQUATE LOCAL PUBLIC HEALTH INFRASTRUCTURE: MINNESOTA-SPECIFIC MEASURES
MDH HEALTH PARTNERSHIPS DIVISION 51 APRIL 2016
Comparison: E-health resources that would most help Minnesota community health boards to advance electronic exchange of health information, by population and greatest spread, 2015
Top three E-health resources that would most help Minnesota community health boards to advance electronic exchange of health information, by population, 2015
Large community health boards (n=12)
Medium community health boards (n=19)
Small community health boards (n=17) Minnesota (n=48)
1 Technical assistance to support exchange with MDH
1 Developing infrastructure to support exchange
1 Risk management for security breaches
1 Establishing agreements with partners
2 Risk management for security breaches
2 Establishing agreements with partners
Using data to support community health assessments
Developing infrastructure to support exchange
3 Establishing agreements with partners
3 Managing patient consent to share information
3 Establishing agreements with partners
3 Risk management for security breaches
Developing infrastructure to support exchange
Voluntary Public Health Accreditation This information is used to help understand and improve Minnesota’s public health system. Systematic information on accreditation preparation is useful for networking, mentoring, and sharing among community health boards, and enables monitoring system-level progress to implement the SCHSAC recommendation that all community health boards are prepared to apply for voluntary national accreditation by 2020 (as well as a national goal to increase percentage of population served by an accredited health department). Additional benefits of these measures include information to target technical assistance and training, and information for community health boards on how their decisions/actions related to accreditation compare to others.
MORE INFORMATION
MDH Health Partnerships Division, Public Health Practice Section 651-201-3880 | [email protected] www.health.state.mn.us/divs/opi/
25
%
58
%
25
%
0% 8
%
25
%
50
%68
%
42
%
37
%
32
%
37
% 53
%
32
%53
%
18
%
59
%
6%
35
%
41
% 59
%
52
%
38
%
42
%
15
% 29
% 42
%
46
%
0%
25%
50%
75%
100%
Developinginfrastruture to
support exchange
Technicalassistance to
support exchangewith MDH
Using data tosupport communityhealth assessments
Planning foradoption
Policies andprocedures formanaging data
quality
Managing patientconsent to share
information
Risk managementfor security
breaches
Large boards (n=12) Medium boards (n=19) Small boards (n=17) Minnesota (n=48)
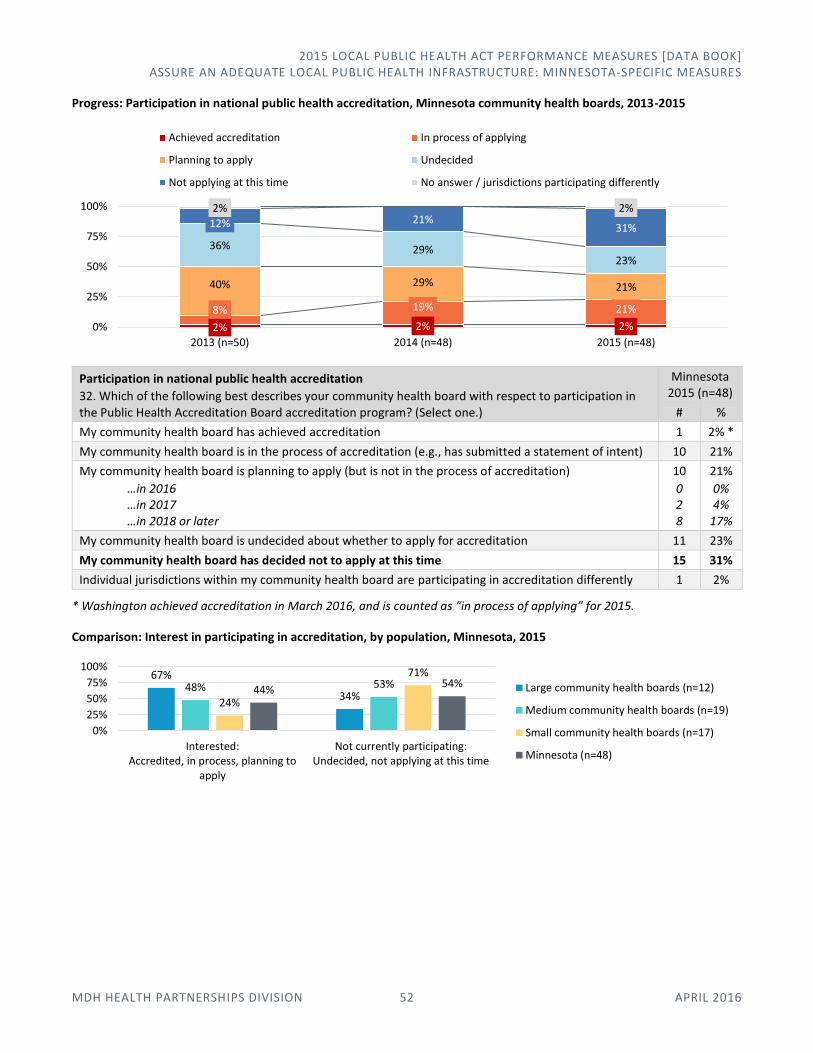
2015 LOCAL PUBLIC HEALTH ACT PERFORMANCE MEASURES [DATA BOOK] ASSURE AN ADEQUATE LOCAL PUBLIC HEALTH INFRASTRUCTURE: MINNESOTA-SPECIFIC MEASURES
MDH HEALTH PARTNERSHIPS DIVISION 52 APRIL 2016
Progress: Participation in national public health accreditation, Minnesota community health boards, 2013-2015
Participation in national public health accreditation
32. Which of the following best describes your community health board with respect to participation in the Public Health Accreditation Board accreditation program? (Select one.)
Minnesota 2015 (n=48)
# %
My community health board has achieved accreditation 1 2% *
My community health board is in the process of accreditation (e.g., has submitted a statement of intent) 10 21%
My community health board is planning to apply (but is not in the process of accreditation)
…in 2016 …in 2017 …in 2018 or later
10
0 2 8
21%
0% 4%
17%
My community health board is undecided about whether to apply for accreditation 11 23%
My community health board has decided not to apply at this time 15 31%
Individual jurisdictions within my community health board are participating in accreditation differently 1 2%
* Washington achieved accreditation in March 2016, and is counted as “in process of applying” for 2015.
Comparison: Interest in participating in accreditation, by population, Minnesota, 2015
2% 2% 2%
8% 19% 21%
40% 29% 21%
36% 29%23%
12% 21%31%
2% 2%
0%
25%
50%
75%
100%
2013 (n=50) 2014 (n=48) 2015 (n=48)
Achieved accreditation In process of applying
Planning to apply Undecided
Not applying at this time No answer / jurisdictions participating differently
67%
34%48% 53%
24%
71%
44%54%
0%
25%
50%
75%
100%
Interested:Accredited, in process, planning to
apply
Not currently participating:Undecided, not applying at this time
Large community health boards (n=12)
Medium community health boards (n=19)
Small community health boards (n=17)
Minnesota (n=48)
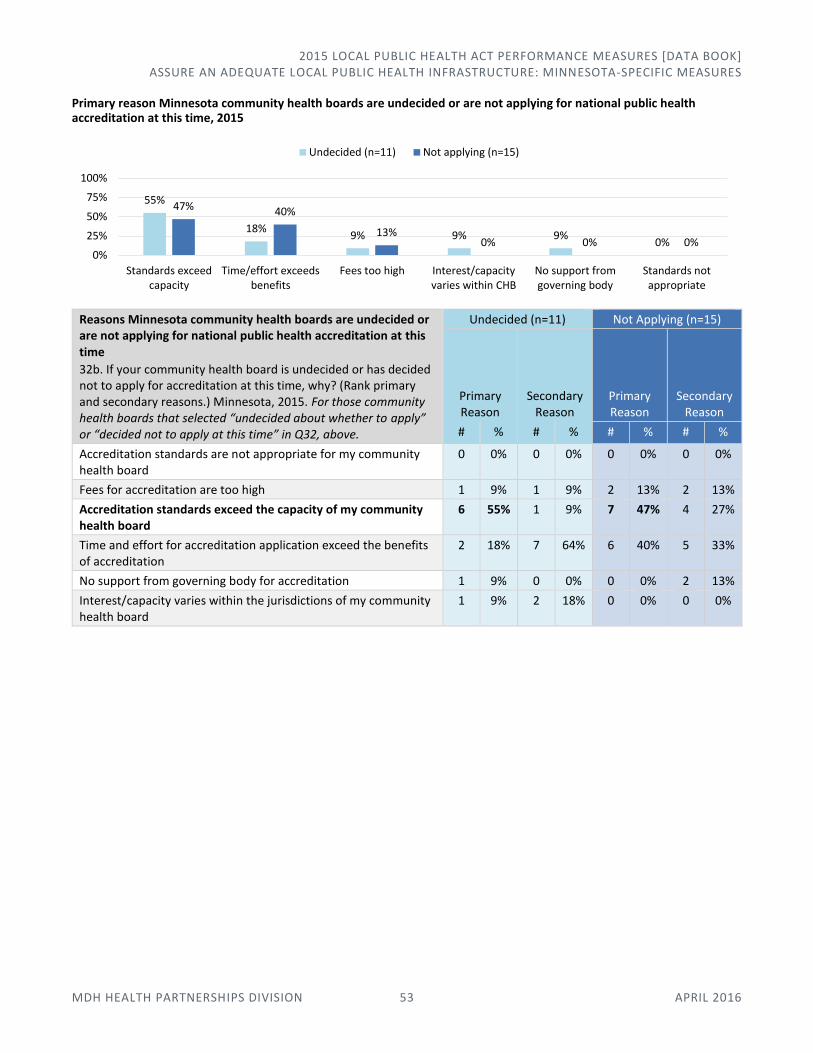
2015 LOCAL PUBLIC HEALTH ACT PERFORMANCE MEASURES [DATA BOOK] ASSURE AN ADEQUATE LOCAL PUBLIC HEALTH INFRASTRUCTURE: MINNESOTA-SPECIFIC MEASURES
MDH HEALTH PARTNERSHIPS DIVISION 53 APRIL 2016
Primary reason Minnesota community health boards are undecided or are not applying for national public health accreditation at this time, 2015
Reasons Minnesota community health boards are undecided or are not applying for national public health accreditation at this time
32b. If your community health board is undecided or has decided not to apply for accreditation at this time, why? (Rank primary and secondary reasons.) Minnesota, 2015. For those community health boards that selected “undecided about whether to apply” or “decided not to apply at this time” in Q32, above.
Undecided (n=11) Not Applying (n=15)
Primary Reason
Secondary Reason
Primary Reason
Secondary Reason
# % # % # % # %
Accreditation standards are not appropriate for my community health board
0 0% 0 0% 0 0% 0 0%
Fees for accreditation are too high 1 9% 1 9% 2 13% 2 13%
Accreditation standards exceed the capacity of my community health board
6 55% 1 9% 7 47% 4 27%
Time and effort for accreditation application exceed the benefits of accreditation
2 18% 7 64% 6 40% 5 33%
No support from governing body for accreditation 1 9% 0 0% 0 0% 2 13%
Interest/capacity varies within the jurisdictions of my community health board
1 9% 2 18% 0 0% 0 0%
55%
18%9% 9% 9%
0%
47% 40%
13%0% 0% 0%
0%
25%
50%
75%
100%
Standards exceedcapacity
Time/effort exceedsbenefits
Fees too high Interest/capacityvaries within CHB
No support fromgoverning body
Standards notappropriate
Undecided (n=11) Not applying (n=15)
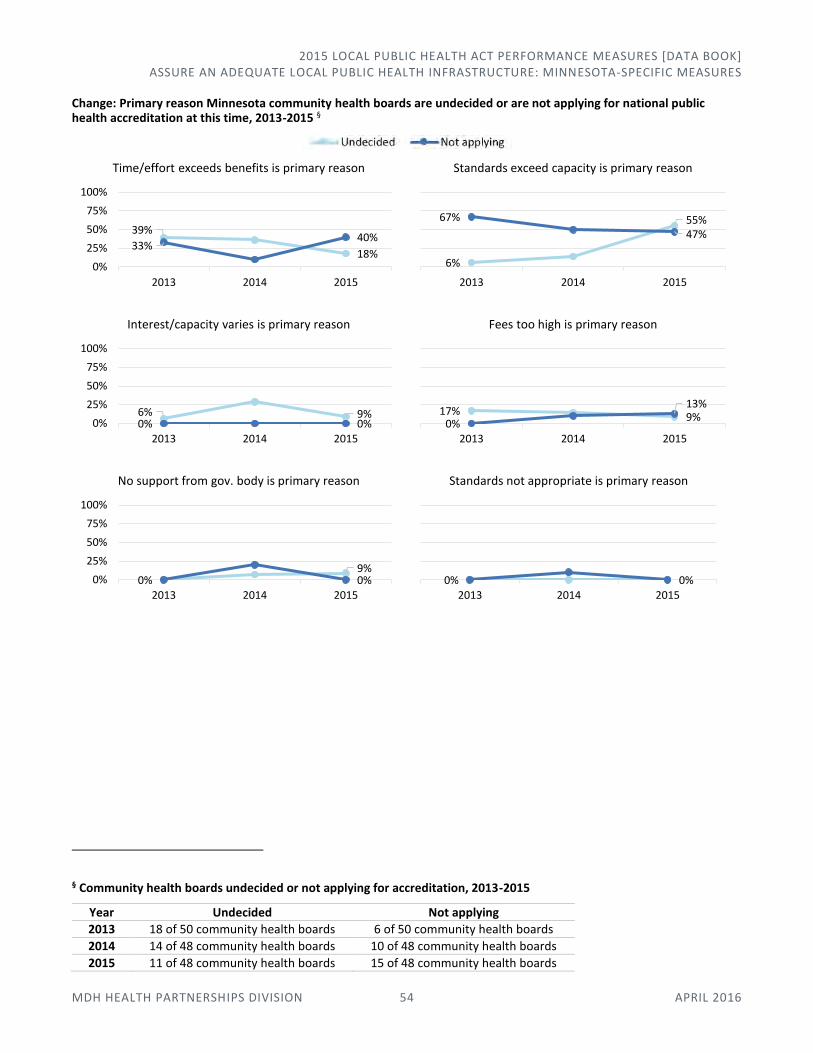
2015 LOCAL PUBLIC HEALTH ACT PERFORMANCE MEASURES [DATA BOOK] ASSURE AN ADEQUATE LOCAL PUBLIC HEALTH INFRASTRUCTURE: MINNESOTA-SPECIFIC MEASURES
MDH HEALTH PARTNERSHIPS DIVISION 54 APRIL 2016
Change: Primary reason Minnesota community health boards are undecided or are not applying for national public health accreditation at this time, 2013-2015 §
§ Community health boards undecided or not applying for accreditation, 2013-2015
Year Undecided Not applying
2013 18 of 50 community health boards 6 of 50 community health boards
2014 14 of 48 community health boards 10 of 48 community health boards
2015 11 of 48 community health boards 15 of 48 community health boards
39%
18%33%
40%
0%
25%
50%
75%
100%
2013 2014 2015
Time/effort exceeds benefits is primary reason
6%
55%67%
47%
2013 2014 2015
Standards exceed capacity is primary reason
6% 9%0% 0%0%
25%
50%
75%
100%
2013 2014 2015
Interest/capacity varies is primary reason
17% 9%0%
13%
2013 2014 2015
Fees too high is primary reason
0%9%0%0%
25%
50%
75%
100%
2013 2014 2015
No support from gov. body is primary reason
0% 0%2013 2014 2015
Standards not appropriate is primary reason

2015 LOCAL PUBLIC HEALTH ACT PERFORMANCE MEASURES [DATA BOOK] ASSURE AN ADEQUATE LOCAL PUBLIC HEALTH INFRASTRUCTURE: MINNESOTA-SPECIFIC MEASURES
MDH HEALTH PARTNERSHIPS DIVISION 55 APRIL 2016
Participation in national public health accreditation, Minnesota community health boards, 2015
Achieved accreditation
Hennepin
In process of applying
Bloomington Minneapolis Dakota Olmsted Edina Richfield Goodhue St. Paul-Ramsey Meeker-McLeod-Sibley Washington *
Planning to apply
Carver North Country Chisago Polk-Norman-Mahnomen Freeborn Stearns Kandiyohi-Renville SWHHS Morrison-Todd-Wadena Wright
* Washington achieved accreditation in March 2016, and is counted as “in process of applying” for 2015.

2015 LOCAL PUBLIC HEALTH ACT PERFORMANCE MEASURES [DATA BOOK] PROMOTE HEALTHY COMMUNITIES AND HEALTHY BEHAVIORS
MDH HEALTH PARTNERSHIPS DIVISION 56 APRIL 2016
Promote Healthy Communities and Healthy Behaviors In this area of responsibility:
Active Living
Healthy Eating
Tobacco-Free Living
Alcohol
Maternal and Child Health (WIC)
Active Living These strategies have strong evidence-based support for their efficacy and align with current Statewide Health Improvement Program (SHIP) reporting and focus. Funding-related questions could be important for tracking what happens to services when funds are made available as well as the ramifications of funding cuts to service provision.
MORE INFORMATION
MDH Office of Statewide Health Improvement Initiatives, Physical Activity Unit 651-201-5443 | [email protected] SHIP Grantee Support: www.health.state.mn.us/healthreform/ship/
Settings in which Minnesota community health boards implemented evidence-based strategies to promote active living, 2015 (n=48)
Settings in which community health boards implemented evidence-based strategies to promote active living
1. Indicate the settings where your community health board implemented evidence-based strategies to promote active living, and whether your community health board used SHIP and/or non-SHIP funding. (Check all that apply.)
Minnesota, 2015 (n=48)
Used SHIP funding and/or SHIP match for
strategy
Used other (non-SHIP) funding for
strategy
Was not involved in
strategy
# % # % # %
Community 45 94% 18 38% 2 4%
Child care 40 83% 9 19% 6 13%
Schools 46 96% 10 21% 1 2%
Workplace 45 94% 10 21% 3 6%
94%83%
96% 94%
38%
19% 21% 21%4%
13%2% 6%
0%
25%
50%
75%
100%
Community setting Child care setting Schools setting Workplace setting
Used SHIP funding and/or SHIP match for strategy
Used other (non-SHIP)funding for strategy
Was not involved in strategy
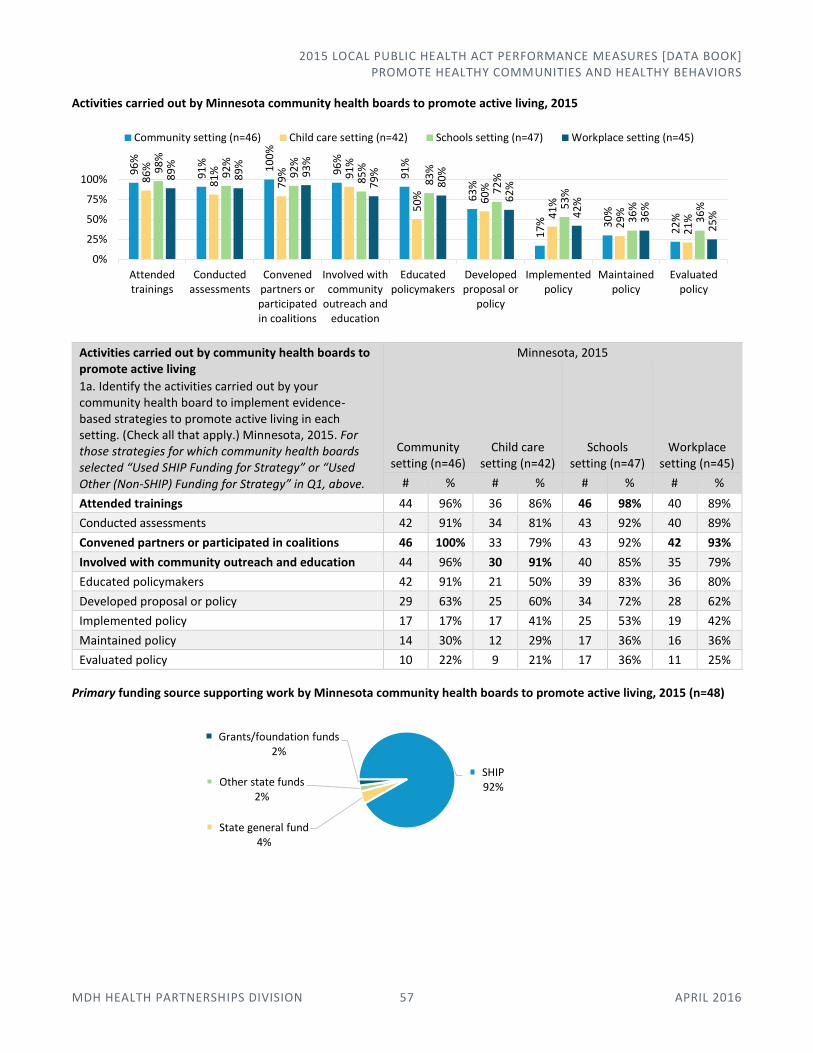
2015 LOCAL PUBLIC HEALTH ACT PERFORMANCE MEASURES [DATA BOOK] PROMOTE HEALTHY COMMUNITIES AND HEALTHY BEHAVIORS
MDH HEALTH PARTNERSHIPS DIVISION 57 APRIL 2016
Activities carried out by Minnesota community health boards to promote active living, 2015
Activities carried out by community health boards to promote active living
1a. Identify the activities carried out by your community health board to implement evidence-based strategies to promote active living in each setting. (Check all that apply.) Minnesota, 2015. For those strategies for which community health boards selected “Used SHIP Funding for Strategy” or “Used Other (Non-SHIP) Funding for Strategy” in Q1, above.
Minnesota, 2015
Community setting (n=46)
Child care setting (n=42)
Schools setting (n=47)
Workplace setting (n=45)
# % # % # % # %
Attended trainings 44 96% 36 86% 46 98% 40 89%
Conducted assessments 42 91% 34 81% 43 92% 40 89%
Convened partners or participated in coalitions 46 100% 33 79% 43 92% 42 93%
Involved with community outreach and education 44 96% 30 91% 40 85% 35 79%
Educated policymakers 42 91% 21 50% 39 83% 36 80%
Developed proposal or policy 29 63% 25 60% 34 72% 28 62%
Implemented policy 17 17% 17 41% 25 53% 19 42%
Maintained policy 14 30% 12 29% 17 36% 16 36%
Evaluated policy 10 22% 9 21% 17 36% 11 25%
Primary funding source supporting work by Minnesota community health boards to promote active living, 2015 (n=48)
96
%
91
% 10
0%
96
%
91
%
63
%
17
% 30
%
22
%
86
%
81
%
79
% 91
%
50
% 60
%
41
%
29
%
21
%
98
%
92
%
92
%
85
%
83
%
72
%
53
%
36
%
36
%
89
%
89
%
93
%
79
%
80
%
62
%
42
%
36
%
25
%
0%
25%
50%
75%
100%
Attendedtrainings
Conductedassessments
Convenedpartners orparticipatedin coalitions
Involved withcommunity
outreach andeducation
Educatedpolicymakers
Developedproposal or
policy
Implementedpolicy
Maintainedpolicy
Evaluatedpolicy
Community setting (n=46) Child care setting (n=42) Schools setting (n=47) Workplace setting (n=45)
SHIP92%
State general fund4%
Other state funds2%
Grants/foundation funds2%
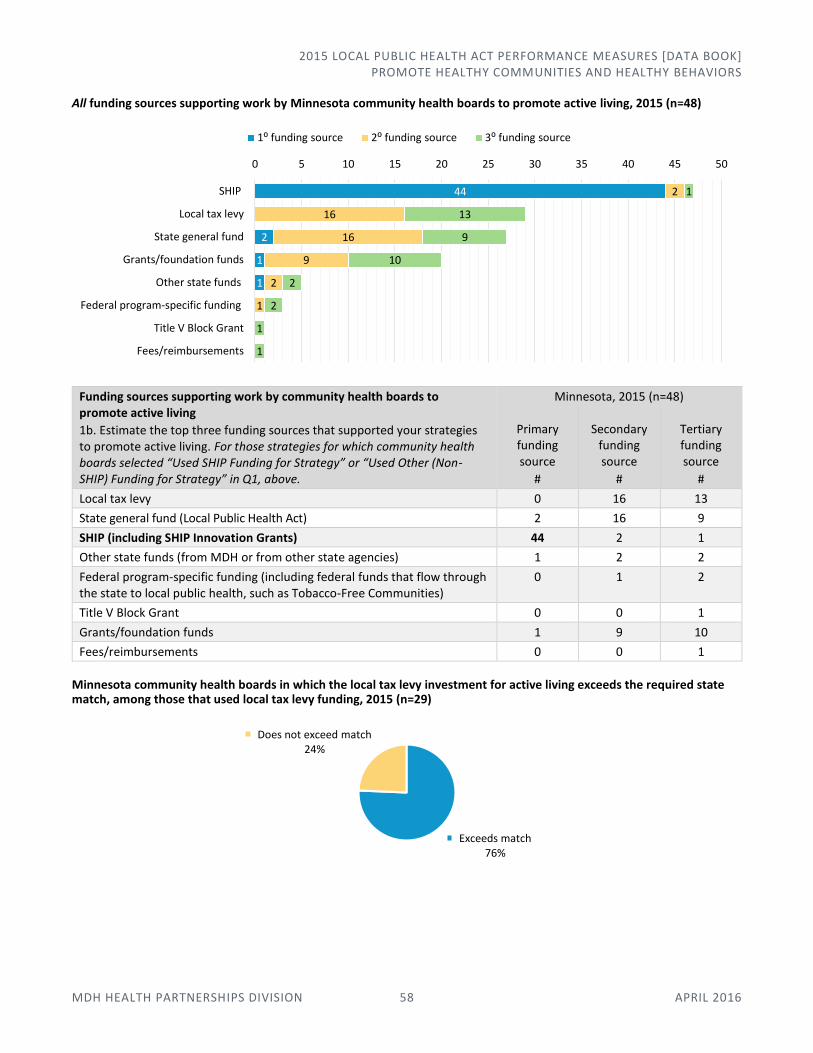
2015 LOCAL PUBLIC HEALTH ACT PERFORMANCE MEASURES [DATA BOOK] PROMOTE HEALTHY COMMUNITIES AND HEALTHY BEHAVIORS
MDH HEALTH PARTNERSHIPS DIVISION 58 APRIL 2016
All funding sources supporting work by Minnesota community health boards to promote active living, 2015 (n=48)
Funding sources supporting work by community health boards to promote active living
1b. Estimate the top three funding sources that supported your strategies to promote active living. For those strategies for which community health boards selected “Used SHIP Funding for Strategy” or “Used Other (Non-SHIP) Funding for Strategy” in Q1, above.
Minnesota, 2015 (n=48)
Primary funding source
#
Secondary funding source
#
Tertiary funding source
#
Local tax levy 0 16 13
State general fund (Local Public Health Act) 2 16 9
SHIP (including SHIP Innovation Grants) 44 2 1
Other state funds (from MDH or from other state agencies) 1 2 2
Federal program-specific funding (including federal funds that flow through the state to local public health, such as Tobacco-Free Communities)
0 1 2
Title V Block Grant 0 0 1
Grants/foundation funds 1 9 10
Fees/reimbursements 0 0 1
Minnesota community health boards in which the local tax levy investment for active living exceeds the required state match, among those that used local tax levy funding, 2015 (n=29)
44
2
1
1
2
16
16
9
2
1
1
13
9
10
2
2
1
1
0 5 10 15 20 25 30 35 40 45 50
SHIP
Local tax levy
State general fund
Grants/foundation funds
Other state funds
Federal program-specific funding
Title V Block Grant
Fees/reimbursements
1⁰ funding source 2⁰ funding source 3⁰ funding source
Exceeds match76%
Does not exceed match24%
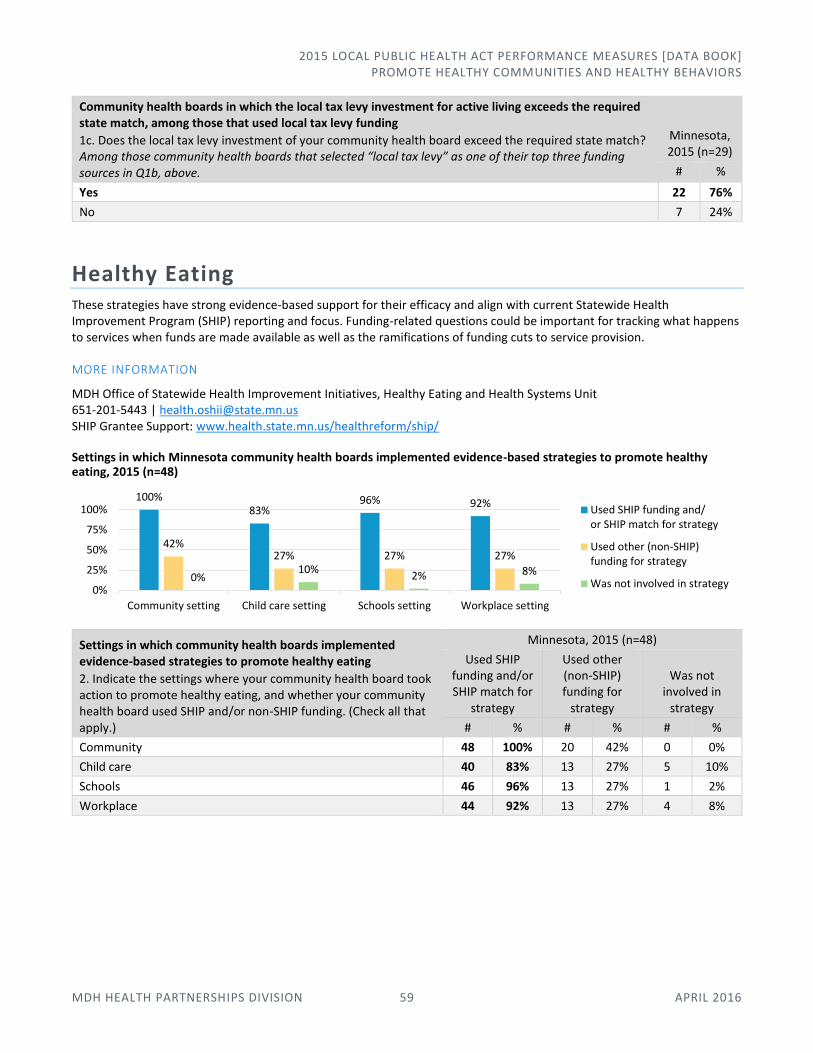
2015 LOCAL PUBLIC HEALTH ACT PERFORMANCE MEASURES [DATA BOOK] PROMOTE HEALTHY COMMUNITIES AND HEALTHY BEHAVIORS
MDH HEALTH PARTNERSHIPS DIVISION 59 APRIL 2016
Community health boards in which the local tax levy investment for active living exceeds the required state match, among those that used local tax levy funding
1c. Does the local tax levy investment of your community health board exceed the required state match? Among those community health boards that selected “local tax levy” as one of their top three funding sources in Q1b, above.
Minnesota, 2015 (n=29)
# %
Yes 22 76%
No 7 24%
Healthy Eating These strategies have strong evidence-based support for their efficacy and align with current Statewide Health Improvement Program (SHIP) reporting and focus. Funding-related questions could be important for tracking what happens to services when funds are made available as well as the ramifications of funding cuts to service provision.
MORE INFORMATION
MDH Office of Statewide Health Improvement Initiatives, Healthy Eating and Health Systems Unit 651-201-5443 | [email protected] SHIP Grantee Support: www.health.state.mn.us/healthreform/ship/
Settings in which Minnesota community health boards implemented evidence-based strategies to promote healthy eating, 2015 (n=48)
Settings in which community health boards implemented evidence-based strategies to promote healthy eating
2. Indicate the settings where your community health board took action to promote healthy eating, and whether your community health board used SHIP and/or non-SHIP funding. (Check all that apply.)
Minnesota, 2015 (n=48)
Used SHIP funding and/or SHIP match for
strategy
Used other (non-SHIP) funding for
strategy
Was not involved in
strategy
# % # % # %
Community 48 100% 20 42% 0 0%
Child care 40 83% 13 27% 5 10%
Schools 46 96% 13 27% 1 2%
Workplace 44 92% 13 27% 4 8%
100%83%
96% 92%
42%27% 27% 27%
0%10%
2% 8%
0%
25%
50%
75%
100%
Community setting Child care setting Schools setting Workplace setting
Used SHIP funding and/or SHIP match for strategy
Used other (non-SHIP)funding for strategy
Was not involved in strategy
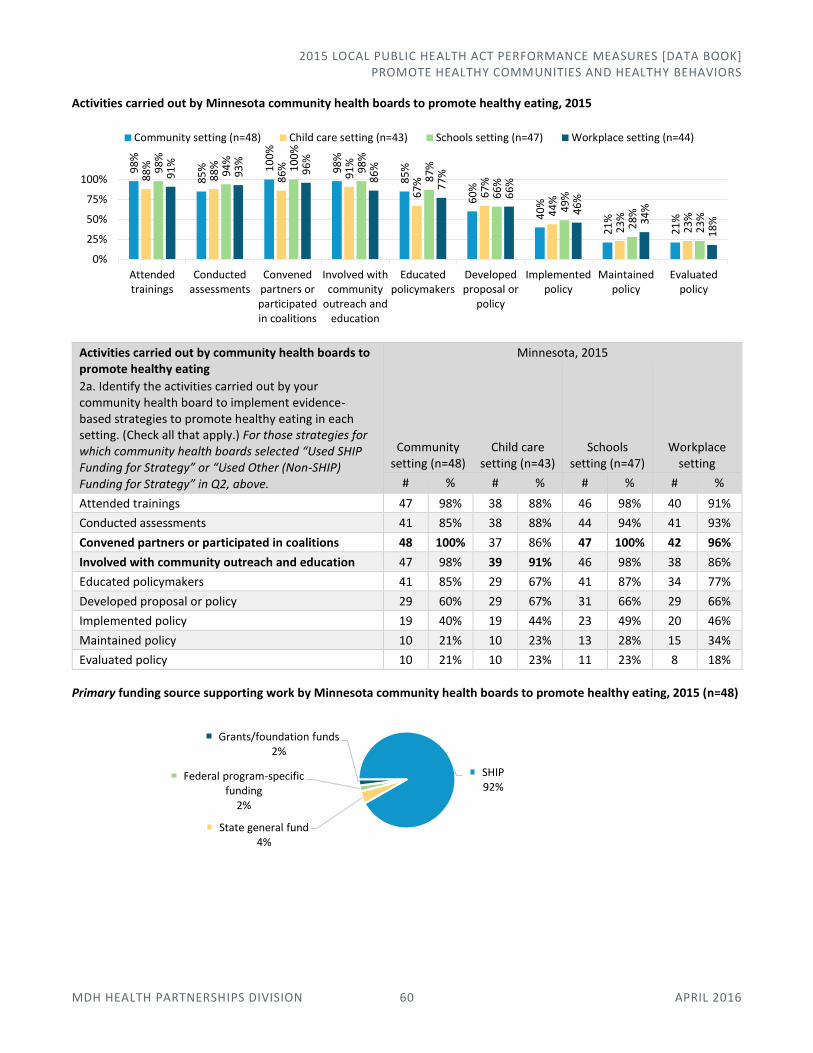
2015 LOCAL PUBLIC HEALTH ACT PERFORMANCE MEASURES [DATA BOOK] PROMOTE HEALTHY COMMUNITIES AND HEALTHY BEHAVIORS
MDH HEALTH PARTNERSHIPS DIVISION 60 APRIL 2016
Activities carried out by Minnesota community health boards to promote healthy eating, 2015
Activities carried out by community health boards to promote healthy eating
2a. Identify the activities carried out by your community health board to implement evidence-based strategies to promote healthy eating in each setting. (Check all that apply.) For those strategies for which community health boards selected “Used SHIP Funding for Strategy” or “Used Other (Non-SHIP) Funding for Strategy” in Q2, above.
Minnesota, 2015
Community setting (n=48)
Child care setting (n=43)
Schools setting (n=47)
Workplace setting
# % # % # % # %
Attended trainings 47 98% 38 88% 46 98% 40 91%
Conducted assessments 41 85% 38 88% 44 94% 41 93%
Convened partners or participated in coalitions 48 100% 37 86% 47 100% 42 96%
Involved with community outreach and education 47 98% 39 91% 46 98% 38 86%
Educated policymakers 41 85% 29 67% 41 87% 34 77%
Developed proposal or policy 29 60% 29 67% 31 66% 29 66%
Implemented policy 19 40% 19 44% 23 49% 20 46%
Maintained policy 10 21% 10 23% 13 28% 15 34%
Evaluated policy 10 21% 10 23% 11 23% 8 18%
Primary funding source supporting work by Minnesota community health boards to promote healthy eating, 2015 (n=48)
98
%
85
% 10
0%
98
%
85
%
60
%
40
%
21
%
21
%
88
%
88
%
86
%
91
%
67
%
67
%
44
%
23
%
23
%
98
%
94
%
10
0%
98
%
87
%
66
%
49
%
28
%
23
%
91
%
93
%
96
%
86
%
77
%
66
%
46
%
34
%
18
%
0%
25%
50%
75%
100%
Attendedtrainings
Conductedassessments
Convenedpartners orparticipatedin coalitions
Involved withcommunity
outreach andeducation
Educatedpolicymakers
Developedproposal or
policy
Implementedpolicy
Maintainedpolicy
Evaluatedpolicy
Community setting (n=48) Child care setting (n=43) Schools setting (n=47) Workplace setting (n=44)
SHIP92%
State general fund4%
Federal program-specific funding
2%
Grants/foundation funds2%
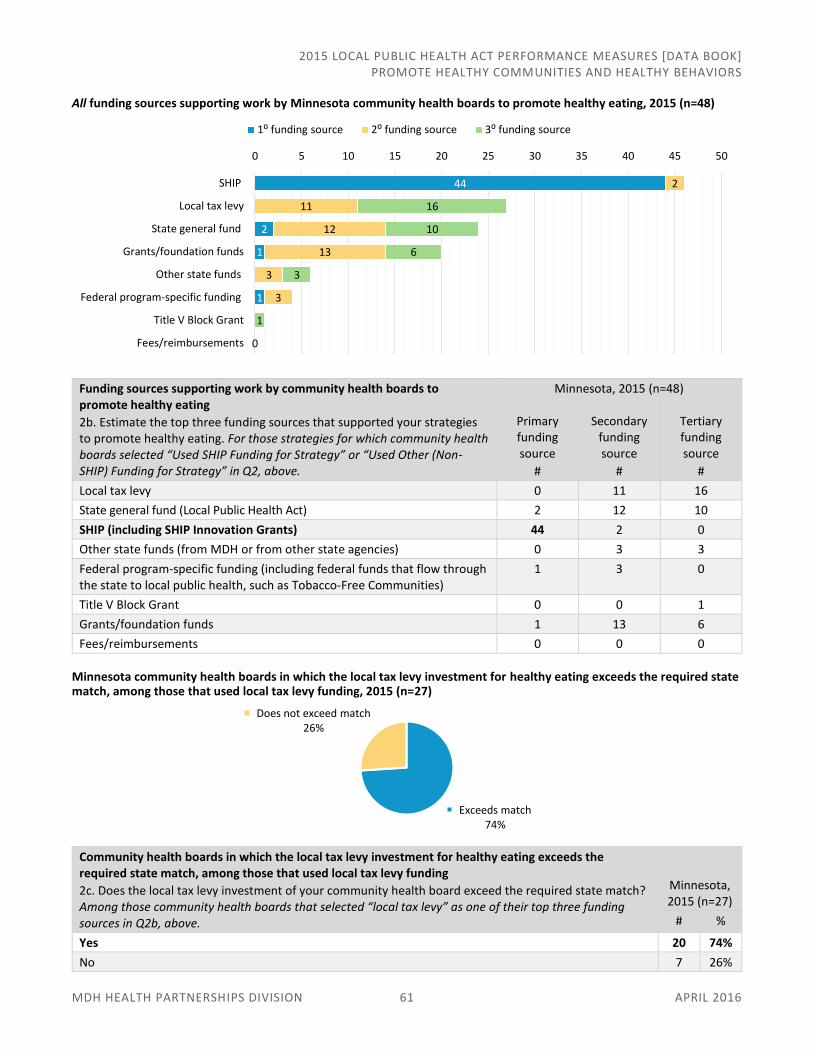
2015 LOCAL PUBLIC HEALTH ACT PERFORMANCE MEASURES [DATA BOOK] PROMOTE HEALTHY COMMUNITIES AND HEALTHY BEHAVIORS
MDH HEALTH PARTNERSHIPS DIVISION 61 APRIL 2016
All funding sources supporting work by Minnesota community health boards to promote healthy eating, 2015 (n=48)
Funding sources supporting work by community health boards to promote healthy eating
2b. Estimate the top three funding sources that supported your strategies to promote healthy eating. For those strategies for which community health boards selected “Used SHIP Funding for Strategy” or “Used Other (Non-SHIP) Funding for Strategy” in Q2, above.
Minnesota, 2015 (n=48)
Primary funding source
#
Secondary funding source
#
Tertiary funding source
#
Local tax levy 0 11 16
State general fund (Local Public Health Act) 2 12 10
SHIP (including SHIP Innovation Grants) 44 2 0
Other state funds (from MDH or from other state agencies) 0 3 3
Federal program-specific funding (including federal funds that flow through the state to local public health, such as Tobacco-Free Communities)
1 3 0
Title V Block Grant 0 0 1
Grants/foundation funds 1 13 6
Fees/reimbursements 0 0 0
Minnesota community health boards in which the local tax levy investment for healthy eating exceeds the required state match, among those that used local tax levy funding, 2015 (n=27)
Community health boards in which the local tax levy investment for healthy eating exceeds the required state match, among those that used local tax levy funding
2c. Does the local tax levy investment of your community health board exceed the required state match? Among those community health boards that selected “local tax levy” as one of their top three funding sources in Q2b, above.
Minnesota, 2015 (n=27)
# %
Yes 20 74%
No 7 26%
44
2
1
1
2
11
12
13
3
3
16
10
6
3
1
0
0 5 10 15 20 25 30 35 40 45 50
SHIP
Local tax levy
State general fund
Grants/foundation funds
Other state funds
Federal program-specific funding
Title V Block Grant
Fees/reimbursements
1⁰ funding source 2⁰ funding source 3⁰ funding source
Exceeds match74%
Does not exceed match26%
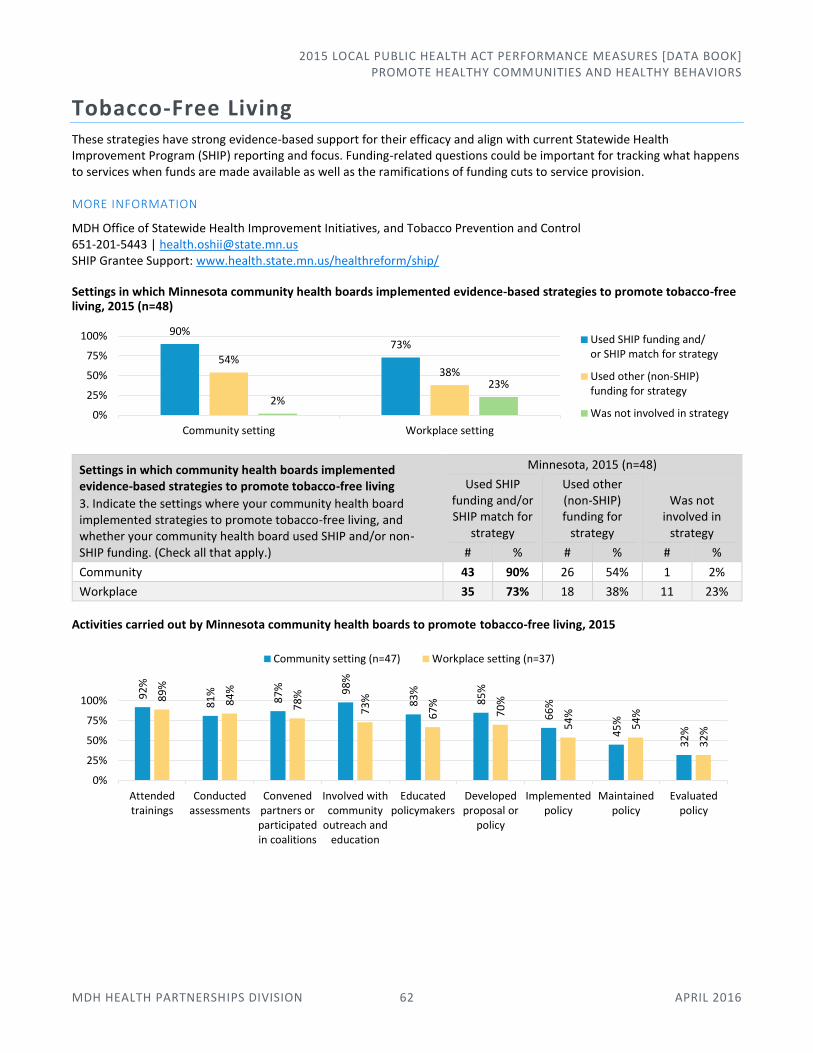
2015 LOCAL PUBLIC HEALTH ACT PERFORMANCE MEASURES [DATA BOOK] PROMOTE HEALTHY COMMUNITIES AND HEALTHY BEHAVIORS
MDH HEALTH PARTNERSHIPS DIVISION 62 APRIL 2016
Tobacco-Free Living These strategies have strong evidence-based support for their efficacy and align with current Statewide Health Improvement Program (SHIP) reporting and focus. Funding-related questions could be important for tracking what happens to services when funds are made available as well as the ramifications of funding cuts to service provision.
MORE INFORMATION
MDH Office of Statewide Health Improvement Initiatives, and Tobacco Prevention and Control 651-201-5443 | [email protected] SHIP Grantee Support: www.health.state.mn.us/healthreform/ship/
Settings in which Minnesota community health boards implemented evidence-based strategies to promote tobacco-free living, 2015 (n=48)
Settings in which community health boards implemented evidence-based strategies to promote tobacco-free living
3. Indicate the settings where your community health board implemented strategies to promote tobacco-free living, and whether your community health board used SHIP and/or non-SHIP funding. (Check all that apply.)
Minnesota, 2015 (n=48)
Used SHIP funding and/or SHIP match for
strategy
Used other (non-SHIP) funding for
strategy
Was not involved in
strategy
# % # % # %
Community 43 90% 26 54% 1 2%
Workplace 35 73% 18 38% 11 23%
Activities carried out by Minnesota community health boards to promote tobacco-free living, 2015
90%73%
54%38%
2%
23%
0%
25%
50%
75%
100%
Community setting Workplace setting
Used SHIP funding and/or SHIP match for strategy
Used other (non-SHIP)funding for strategy
Was not involved in strategy
92
%
81
%
87
% 98
%
83
%
85
%
66
%
45
%
32
%
89
%
84
%
78
%
73
%
67
%
70
%
54
%
54
%
32
%
0%
25%
50%
75%
100%
Attendedtrainings
Conductedassessments
Convenedpartners orparticipatedin coalitions
Involved withcommunity
outreach andeducation
Educatedpolicymakers
Developedproposal or
policy
Implementedpolicy
Maintainedpolicy
Evaluatedpolicy
Community setting (n=47) Workplace setting (n=37)
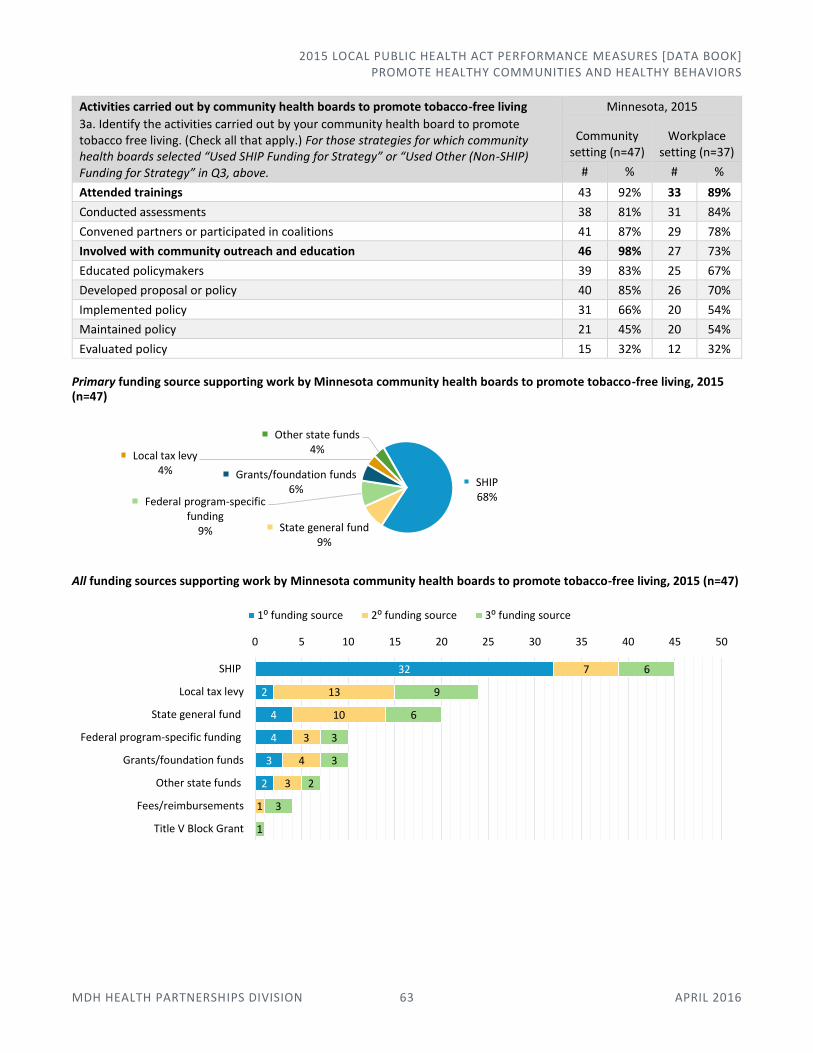
2015 LOCAL PUBLIC HEALTH ACT PERFORMANCE MEASURES [DATA BOOK] PROMOTE HEALTHY COMMUNITIES AND HEALTHY BEHAVIORS
MDH HEALTH PARTNERSHIPS DIVISION 63 APRIL 2016
Activities carried out by community health boards to promote tobacco-free living
3a. Identify the activities carried out by your community health board to promote tobacco free living. (Check all that apply.) For those strategies for which community health boards selected “Used SHIP Funding for Strategy” or “Used Other (Non-SHIP) Funding for Strategy” in Q3, above.
Minnesota, 2015
Community setting (n=47)
Workplace setting (n=37)
# % # %
Attended trainings 43 92% 33 89%
Conducted assessments 38 81% 31 84%
Convened partners or participated in coalitions 41 87% 29 78%
Involved with community outreach and education 46 98% 27 73%
Educated policymakers 39 83% 25 67%
Developed proposal or policy 40 85% 26 70%
Implemented policy 31 66% 20 54%
Maintained policy 21 45% 20 54%
Evaluated policy 15 32% 12 32%
Primary funding source supporting work by Minnesota community health boards to promote tobacco-free living, 2015 (n=47)
All funding sources supporting work by Minnesota community health boards to promote tobacco-free living, 2015 (n=47)
SHIP68%
State general fund9%
Federal program-specific funding
9%
Grants/foundation funds6%
Local tax levy4%
Other state funds4%
32
2
4
4
3
2
7
13
10
3
4
3
1
6
9
6
3
3
2
3
1
0 5 10 15 20 25 30 35 40 45 50
SHIP
Local tax levy
State general fund
Federal program-specific funding
Grants/foundation funds
Other state funds
Fees/reimbursements
Title V Block Grant
1⁰ funding source 2⁰ funding source 3⁰ funding source
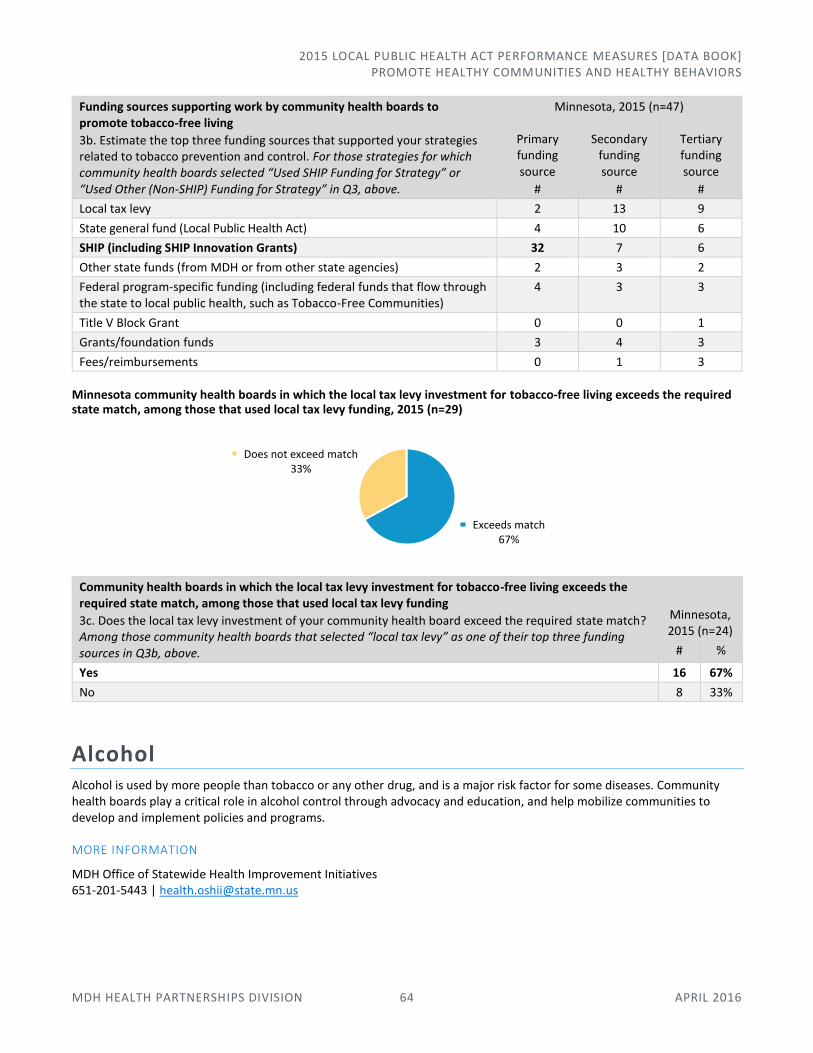
2015 LOCAL PUBLIC HEALTH ACT PERFORMANCE MEASURES [DATA BOOK] PROMOTE HEALTHY COMMUNITIES AND HEALTHY BEHAVIORS
MDH HEALTH PARTNERSHIPS DIVISION 64 APRIL 2016
Funding sources supporting work by community health boards to promote tobacco-free living
3b. Estimate the top three funding sources that supported your strategies related to tobacco prevention and control. For those strategies for which community health boards selected “Used SHIP Funding for Strategy” or “Used Other (Non-SHIP) Funding for Strategy” in Q3, above.
Minnesota, 2015 (n=47)
Primary funding source
#
Secondary funding source
#
Tertiary funding source
#
Local tax levy 2 13 9
State general fund (Local Public Health Act) 4 10 6
SHIP (including SHIP Innovation Grants) 32 7 6
Other state funds (from MDH or from other state agencies) 2 3 2
Federal program-specific funding (including federal funds that flow through the state to local public health, such as Tobacco-Free Communities)
4 3 3
Title V Block Grant 0 0 1
Grants/foundation funds 3 4 3
Fees/reimbursements 0 1 3
Minnesota community health boards in which the local tax levy investment for tobacco-free living exceeds the required state match, among those that used local tax levy funding, 2015 (n=29)
Community health boards in which the local tax levy investment for tobacco-free living exceeds the required state match, among those that used local tax levy funding
3c. Does the local tax levy investment of your community health board exceed the required state match? Among those community health boards that selected “local tax levy” as one of their top three funding sources in Q3b, above.
Minnesota, 2015 (n=24)
# %
Yes 16 67%
No 8 33%
Alcohol Alcohol is used by more people than tobacco or any other drug, and is a major risk factor for some diseases. Community health boards play a critical role in alcohol control through advocacy and education, and help mobilize communities to develop and implement policies and programs.
MORE INFORMATION
MDH Office of Statewide Health Improvement Initiatives 651-201-5443 | [email protected]
Exceeds match67%
Does not exceed match33%

2015 LOCAL PUBLIC HEALTH ACT PERFORMANCE MEASURES [DATA BOOK] PROMOTE HEALTHY COMMUNITIES AND HEALTHY BEHAVIORS
MDH HEALTH PARTNERSHIPS DIVISION 65 APRIL 2016
Change: Strategies used by Minnesota community health boards related to alcohol use, 2013-2015
*Not asked in 2013.
Strategies used by community health boards related to alcohol use
4. Indicate the strategies used by your community health board related to alcohol use. (Check all that apply.)
Minnesota 2015 (n=48)
# %
Policy advocacy (strengthening local ordinances) 12 25%
Policies to reduce drink specials in bars and restaurants 0 0%
Alcohol compliance checks 19 40%
Beverage server training 17 35%
Alcohol outlet density in the community 1 2%
Social host ordinances 17 35%
Alcohol use at community festivals and county fairs 13 27%
Drinking and driving 25 52%
Health education messages 31 65%
Working on barriers faced by underserved populations to reduce disparities in alcohol use 6 13%
Screening, counseling, and/or referral in health care settings 13 27%
Other 9 19%
None of the above 6 13%
Other examples:
Health department staff facilitated a community chemical health initiative focused on prevention of alcohol and drug use with youth
----- County has a SAMSHA Drug Free Coalition grant; the above work is done through that coalition, and has two public health staff and one community health board commissioner on the coalition
----- County Substance Prevention and Intervention Initiative DWI Court
Public health staff participate in community chemical health coalitions; patients of our various public health clinics are provided information/referrals to resources and services for chemical health addiction
Source investigation: Law enforcement strategy where an investigation is carried out at underage drinking parties to identify the person who was the source of providing the alcohol
Youth groups regarding ATOD
Through a DHS grant, we have a program called Project Harmony, which is a multi-disciplinary case management program that assists pregnant women or parenting women of children under eight years old to obtain and maintain sobriety; we have employed a recovery coach that plays a pivotal role in this program
64
%
42
%
38
%
38
%
32
%
28
%
30
%
14
%
4%
4%
58
%
36
%
36
%
34
%
34
%
30
%
28
%
34
%
12
%
8%
8%
65
%
52
%
40
%
35
%
35
%
27
%
27
%
25
%
13
%
2%
0%
0%
25%
50%
75%
100%
Hea
lth
ed
uca
tio
nm
essa
ges
Dri
nki
ng
and
dri
vin
g
Alc
oh
ol c
om
plia
nce
chec
ks
Bev
erag
e se
rver
trai
nin
g
Soci
al h
ost
ord
inan
ces
Alc
oh
ol u
se a
tco
mm
un
ity
fest
ival
s an
dco
un
ty f
airs
Scre
enin
g, c
ou
n-
selin
g, r
efer
ral i
nH
C s
etti
ngs
*
Po
licy
advo
cacy
Wo
rkin
g o
nb
arri
ers
face
d b
yu
nd
erse
rved
po
pu
lati
on
s
Alc
oh
ol o
utl
etd
ensi
ty in
th
eco
mm
un
ity
Po
licie
s to
red
uce
dri
nk
spec
ials
inb
ars
and
rest
aura
nts
2013 (n=50) 2014 (n=50) 2015 (n=48)

2015 LOCAL PUBLIC HEALTH ACT PERFORMANCE MEASURES [DATA BOOK] PROMOTE HEALTHY COMMUNITIES AND HEALTHY BEHAVIORS
MDH HEALTH PARTNERSHIPS DIVISION 66 APRIL 2016
----- County Health and Human Services plays an active role in the community's 'Drug Task Force;' this group of community partners advocates for decreased use of alcohol among youth, and also works on strategies to reduce the use of drugs both illicit and prescription in the community
Evaluation and education in our WIC clinics
Activities carried out by community health boards related to alcohol use
4a. Identify the activities carried out by your community health board in relation to alcohol use. (Check all that apply.) Among those community health boards that selected strategies below in Q4, above.
Minnesota, 2015
n Att
end
ed t
rain
ings
Co
nd
uct
ed a
sses
smen
ts
Co
nve
ned
par
tner
s o
r
par
tici
pat
e in
co
alit
ion
s
Invo
lved
wit
h c
om
mu
nit
y
ou
trea
ch a
nd
ed
uca
tio
n
Edu
cate
d p
olic
ymak
ers
Dev
elo
ped
pro
po
sal o
r
po
licy
Imp
lem
ente
d p
olic
y
Mai
nta
ined
po
licy
Eval
uat
ed p
olic
y
Policy advocacy (strengthening local ordinances)
12 83% 50% 83% 75% 67% 58% 50% 33% 25%
Alcohol compliance checks 19 26% 47% 68% 63% 42% 21% 21% 37% 16%
Beverage server training 17 71% 29% 88% 88% 59% 24% 24% 24% 24%
Alcohol outlet density in the community 1 0% 0% 100% 100% 100% 0% 0% 0% 0%
Social host ordinances 17 29% 29% 53% 77% 41% 35% 41% 47% 18%
Alcohol use at community festivals and county fairs
13 31% 46% 69% 54% 31% 31% 23% 31% 15%
Drinking and driving 25 60% 32% 96% 92% 52% 4% 4% 8% 4%
Health education messages 31 55% 26% 81% 90% 55% 3% 3% 3% 3%
Working on barriers faced by underserved populations to reduce disparities in alcohol use
6 83% 50% 83% 67% 67% 0% 0% 17% 0%
Screening, counseling, and/or referral in health care settings
13 54% 62% 34% 62% 8% 0% 0% 0% 0%
Change: Primary funding source supporting work by Minnesota community health boards related to alcohol use, 2014-2015
43%
22%
15%
17%
5%
13%
20%
15%
22%
5% 12%
5%
0%
25%
50%
75%
100%
2014 (n=40) 2015 (n=41)
Fees/reimbursements
Grants/foundation funds
Title V Block Grant
Federal program-specific funding
Other state funds
SHIP
State general fund
Local tax levy
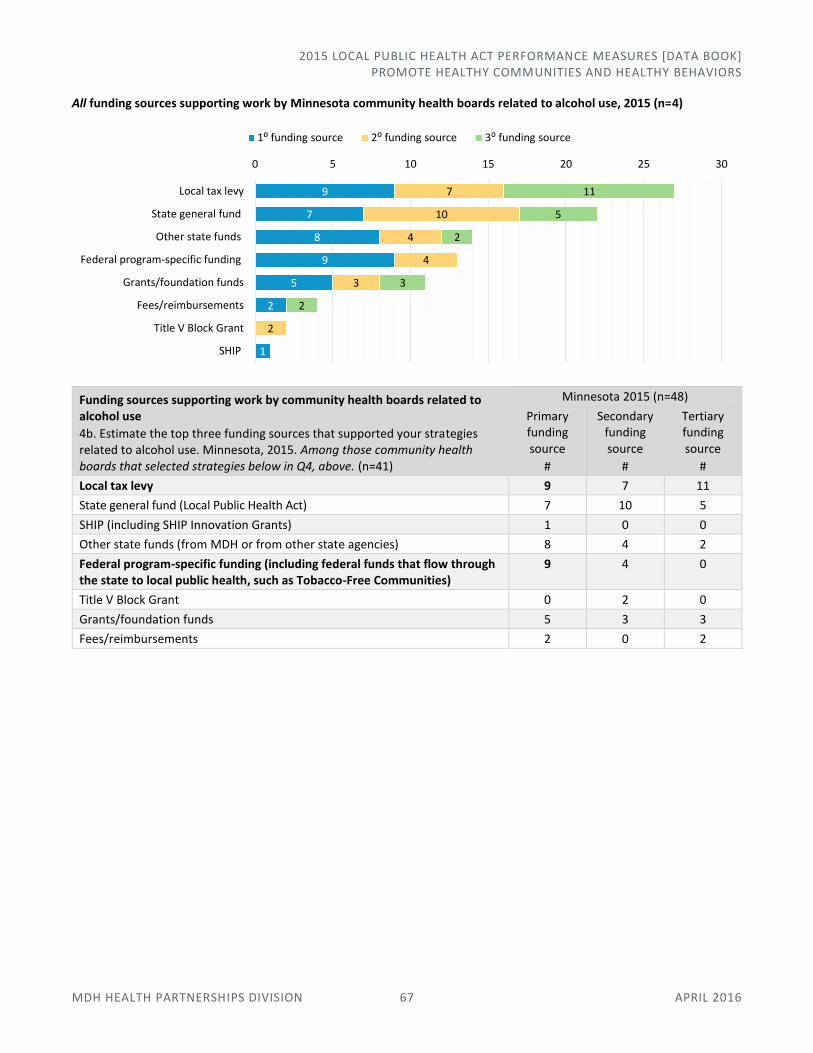
2015 LOCAL PUBLIC HEALTH ACT PERFORMANCE MEASURES [DATA BOOK] PROMOTE HEALTHY COMMUNITIES AND HEALTHY BEHAVIORS
MDH HEALTH PARTNERSHIPS DIVISION 67 APRIL 2016
All funding sources supporting work by Minnesota community health boards related to alcohol use, 2015 (n=4)
Funding sources supporting work by community health boards related to alcohol use
4b. Estimate the top three funding sources that supported your strategies related to alcohol use. Minnesota, 2015. Among those community health boards that selected strategies below in Q4, above. (n=41)
Minnesota 2015 (n=48)
Primary funding source
#
Secondary funding source
#
Tertiary funding source
#
Local tax levy 9 7 11
State general fund (Local Public Health Act) 7 10 5
SHIP (including SHIP Innovation Grants) 1 0 0
Other state funds (from MDH or from other state agencies) 8 4 2
Federal program-specific funding (including federal funds that flow through the state to local public health, such as Tobacco-Free Communities)
9 4 0
Title V Block Grant 0 2 0
Grants/foundation funds 5 3 3
Fees/reimbursements 2 0 2
9
7
8
9
5
2
1
7
10
4
4
3
2
11
5
2
3
2
0 5 10 15 20 25 30
Local tax levy
State general fund
Other state funds
Federal program-specific funding
Grants/foundation funds
Fees/reimbursements
Title V Block Grant
SHIP
1⁰ funding source 2⁰ funding source 3⁰ funding source
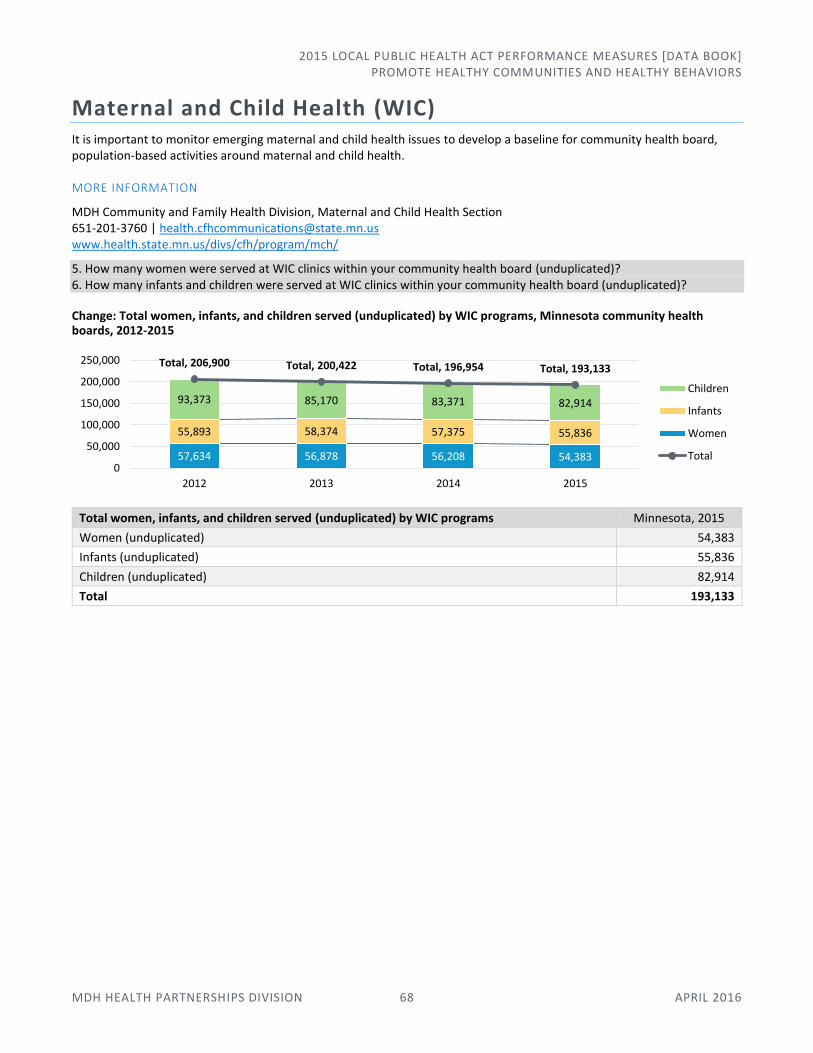
2015 LOCAL PUBLIC HEALTH ACT PERFORMANCE MEASURES [DATA BOOK] PROMOTE HEALTHY COMMUNITIES AND HEALTHY BEHAVIORS
MDH HEALTH PARTNERSHIPS DIVISION 68 APRIL 2016
Maternal and Child Health (WIC) It is important to monitor emerging maternal and child health issues to develop a baseline for community health board, population-based activities around maternal and child health.
MORE INFORMATION
MDH Community and Family Health Division, Maternal and Child Health Section 651-201-3760 | [email protected] www.health.state.mn.us/divs/cfh/program/mch/
5. How many women were served at WIC clinics within your community health board (unduplicated)? 6. How many infants and children were served at WIC clinics within your community health board (unduplicated)?
Change: Total women, infants, and children served (unduplicated) by WIC programs, Minnesota community health boards, 2012-2015
Total women, infants, and children served (unduplicated) by WIC programs Minnesota, 2015
Women (unduplicated) 54,383
Infants (unduplicated) 55,836
Children (unduplicated) 82,914
Total 193,133
57,634 56,878 56,208 54,383
55,893 58,374 57,375 55,836
93,373 85,170 83,371 82,914
Total, 206,900 Total, 200,422 Total, 196,954 Total, 193,133
0
50,000
100,000
150,000
200,000
250,000
2012 2013 2014 2015
Children
Infants
Women
Total

2015 LOCAL PUBLIC HEALTH ACT PERFORMANCE MEASURES [DATA BOOK] PREVENT THE SPREAD OF COMMUNICABLE DISEASES
MDH HEALTH PARTNERSHIPS DIVISION 69 APRIL 2016
Prevent the Spread of Communicable Diseases In this area of responsibility:
Immunizations
Infectious Disease Services
Immunizations Immunization rates serve as an important measure of preventive care and overall public health.
MORE INFORMATION
MDH Infectious Disease Epidemiology, Prevention, and Control Division, Vaccine Preventable Disease Section 651-201-5414 | www.health.state.mn.us/divs/idepc/immunize/
1. What is the number and percent of children in your community health board aged 24-35 months who are up-to-date on immunizations?
Rate of children aged 24-35 months who are up-to-date on immunizations, Minnesota community health boards, 2015 (n=48)
88%
47%
0% 25% 50% 75% 100%
% Children Up-to-Date
Min
nes
ota
co
mm
un
ity
hea
lth
bo
ard
s (n
=48
)

2015 LOCAL PUBLIC HEALTH ACT PERFORMANCE MEASURES [DATA BOOK] PREVENT THE SPREAD OF COMMUNICABLE DISEASES
MDH HEALTH PARTNERSHIPS DIVISION 70 APRIL 2016
Comparison: Rate of children aged 24-35 months who are up-to-date on immunizations, Minnesota community health boards, by population, 2015
Comparison: Range and median: Rate of children aged 24-35 months who are up-to-date on immunizations, by community health board population, Minnesota, 2015
Range, median: Child immunizations, 2015
Large community health boards (n=12)
Medium community health boards (n=19)
Small community health boards (n=17) Minnesota (n=48)
Minimum 61% 47% 64% 47%
Median 73% 76% 77% 75%
Maximum 80% 88% 85% 88%
Minnesota community health boards providing immunizations, 2015 (n=48)
0%
25%
50%
75%
100%
0 5,000 10,000 15,000 20,000
Per
cen
t o
f C
hild
ren
Up
t-to
-Dat
e
Total Number of Children Aged 24-35 Months (Denominator)
Large community health boards
Large boards (n=12)
0 200 400 600 800 1,000 1,200
Total Number of Children Aged 24-35 Months (Denominator)
Medium and small community health boards
Medium boards (n=19) Small boards (n=17)
Median: 73%
Median: 76%
Median: 77%
Median: 75%
0% 25% 50% 75% 100%
Large community health boards (n=12)
Medium community health boards (n=19)
Small community health boards (n=17)
Minnesota (n=48)
Provides immunizations94%
Does not provide immunizations
6%
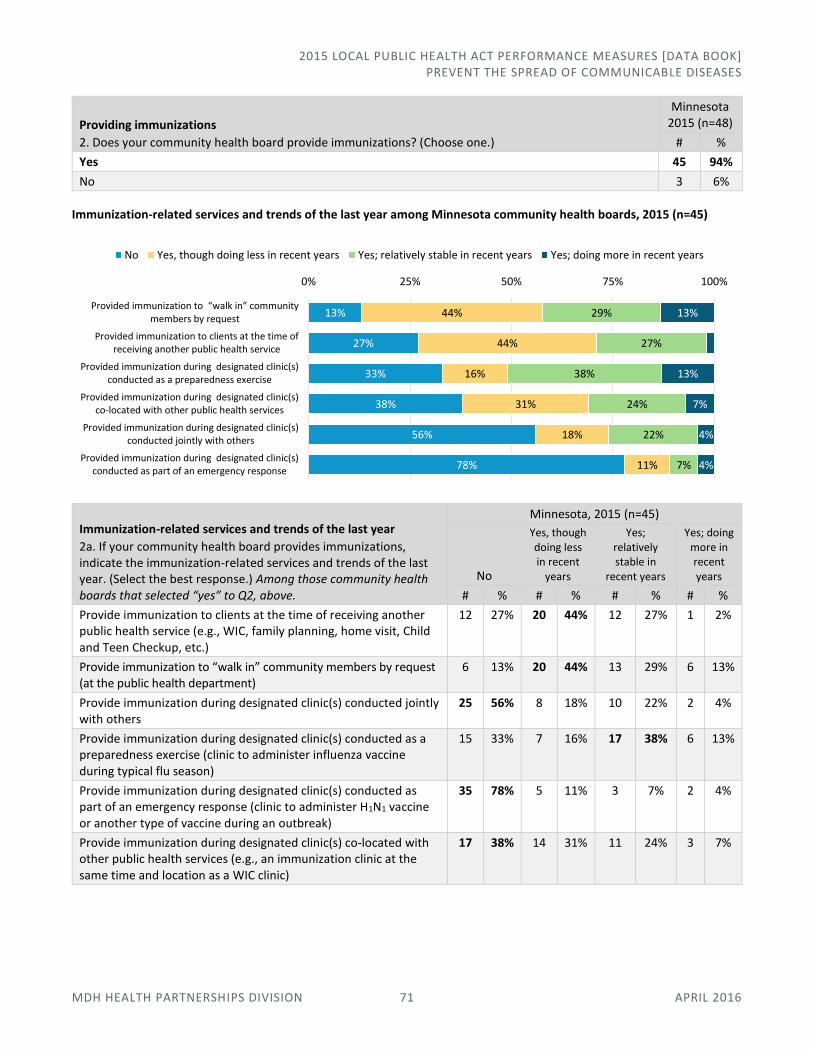
2015 LOCAL PUBLIC HEALTH ACT PERFORMANCE MEASURES [DATA BOOK] PREVENT THE SPREAD OF COMMUNICABLE DISEASES
MDH HEALTH PARTNERSHIPS DIVISION 71 APRIL 2016
Providing immunizations
2. Does your community health board provide immunizations? (Choose one.)
Minnesota 2015 (n=48)
# %
Yes 45 94%
No 3 6%
Immunization-related services and trends of the last year among Minnesota community health boards, 2015 (n=45)
Immunization-related services and trends of the last year
2a. If your community health board provides immunizations, indicate the immunization-related services and trends of the last year. (Select the best response.) Among those community health boards that selected “yes” to Q2, above.
Minnesota, 2015 (n=45)
No
Yes, though doing less in recent
years
Yes; relatively stable in
recent years
Yes; doing more in recent years
# % # % # % # %
Provide immunization to clients at the time of receiving another public health service (e.g., WIC, family planning, home visit, Child and Teen Checkup, etc.)
12 27% 20 44% 12 27% 1 2%
Provide immunization to “walk in” community members by request (at the public health department)
6 13% 20 44% 13 29% 6 13%
Provide immunization during designated clinic(s) conducted jointly with others
25 56% 8 18% 10 22% 2 4%
Provide immunization during designated clinic(s) conducted as a preparedness exercise (clinic to administer influenza vaccine during typical flu season)
15 33% 7 16% 17 38% 6 13%
Provide immunization during designated clinic(s) conducted as part of an emergency response (clinic to administer H1N1 vaccine or another type of vaccine during an outbreak)
35 78% 5 11% 3 7% 2 4%
Provide immunization during designated clinic(s) co-located with other public health services (e.g., an immunization clinic at the same time and location as a WIC clinic)
17 38% 14 31% 11 24% 3 7%
13%
27%
33%
38%
56%
78%
44%
44%
16%
31%
18%
11%
29%
27%
38%
24%
22%
7%
13%
13%
7%
4%
4%
0% 25% 50% 75% 100%
Provided immunization to “walk in” community members by request
Provided immunization to clients at the time ofreceiving another public health service
Provided immunization during designated clinic(s)conducted as a preparedness exercise
Provided immunization during designated clinic(s)co-located with other public health services
Provided immunization during designated clinic(s)conducted jointly with others
Provided immunization during designated clinic(s)conducted as part of an emergency response
No Yes, though doing less in recent years Yes; relatively stable in recent years Yes; doing more in recent years

2015 LOCAL PUBLIC HEALTH ACT PERFORMANCE MEASURES [DATA BOOK] PREVENT THE SPREAD OF COMMUNICABLE DISEASES
MDH HEALTH PARTNERSHIPS DIVISION 72 APRIL 2016
Minnesota community health boards intentionally re-examining role in providing immunization services, 2015 (n=48)
Intentional re-examination of role in providing immunization services
3. Is your community health board intentionally re-examining its role in providing immunization services? (Select the best response.)
Minnesota 2015 (n=48)
# %
No 24 50%
No, but recently completed 6 13%
Yes, currently underway 14 29%
Yes, planned 4 8%
Minnesota community health boards that refer clients for immunizations, 2015 (n=48)
Referring clients for immunizations
4. Does your community health board refer clients for immunizations (e.g., medical home, Federally Qualified Health Center, Rural Health Clinic, etc.)? (Select the best response.)
Minnesota 2015 (n=48)
# %
No 6 13%
Yes, though doing less in recent years 8 17%
Yes; relatively stable in recent years 24 50%
Yes; doing more in recent years 10 21%
No, 50%
No, but recently completed, 13%
Yes, currently underway, 29%
Yes, planned, 8%
No13%
Yes, though doing less in recent years
17%
Yes; relatively stable in recent years
49%
Yes; doing more in recent years
21%

2015 LOCAL PUBLIC HEALTH ACT PERFORMANCE MEASURES [DATA BOOK] PREVENT THE SPREAD OF COMMUNICABLE DISEASES
MDH HEALTH PARTNERSHIPS DIVISION 73 APRIL 2016
Immunization-related activities performed by Minn. community health boards, 2015 (n=48)
Immunization-related activities
5. Which of the following immunization-related activities did your community health board perform last year? (Check all that apply.)
Minnesota, 2015 (n=48)
Ro
uti
nel
y
Du
rin
g an
em
er-
gen
cy r
esp
on
se
For
infl
uen
za
vacc
inat
ion
For
no
n-i
nfl
uen
za
vacc
inat
ion
No
t p
erfo
rmed
# % # % # % # % # %
Provided education to the community 39 81% 8 17% 30 63% 23 48% 1 2%
Engaged with immunization providers to discuss immunization coverage
41 85% 4 8% 17 35% 22 46% 3 6%
Engaged with partners to coordinate services 34 71% 5 10% 22 46% 13 27% 6 13%
Used MIIC data to engage immunization providers in immunization improvement activities
39 81% 2 4% 7 15% 17 35% 7 15%
Conducted reminder/recall outreach for county/community health board clinic patients
33 69% 1 2% 7 15% 19 40% 12 25%
Conducted reminder/recall for county residents 21 44% 1 2% 2 4% 9 19% 25 52%
Used QI tools and processes to improve immunization practices or delivery in the community health board
25 52% 1 2% 3 6% 10 21% 20 42%
Served as a resource [to immunization providers in your community health board’s jurisdiction] on current recommendations and best practices regarding immunization
44 92% 4 8% 18 38% 20 42% 1 2%
Conducted population-based needs assessment informed by immunization coverage levels in MIIC
22 46% 1 2% 5 10% 7 15% 23 48%
Mentored one or more community health boards to help them improve immunization rates
6 13% 0 0% 0 0% 0 0% 42 88%
Other 1 2% 0 0% 0 0% 0 0% 47 98%
0%
25%
50%
75%
100%
Pro
vid
ed e
du
cati
on
to
com
mu
nit
y
Enga
ged
wit
h p
rovi
de
rs t
od
iscu
ss c
ove
rage
Enga
ged
wit
h p
artn
ers
toco
ord
inat
e se
rvic
es
Use
d M
IIC
dat
a to
en
gage
pro
vid
ers
in im
pro
vem
en
tac
tivi
tie
s
Co
nd
uct
ed r
emin
der
/re
call
ou
tre
ach
fo
r cl
inic
pat
ien
ts
Co
nd
uct
ed r
emin
der
/re
call
for
cou
nty
res
iden
ts
Use
d Q
I to
ols
an
d p
roce
sses
to im
pro
ve p
ract
ice
s o
rd
eliv
ery
Serv
ed a
s a
reso
urc
e o
ncu
rre
nt
reco
mm
end
atio
ns
and
bes
t p
ract
ices
Co
nd
uct
ed p
op
ula
tio
n-
bas
ed n
eed
s as
sess
men
tin
form
ed b
y M
IIC
Men
tore
d o
ne
or
mo
reC
HB
s to
hel
p im
pro
ve r
ate
s
Routinely During an emergency response For influenza vaccination For non-influenza vaccination Not performed

2015 LOCAL PUBLIC HEALTH ACT PERFORMANCE MEASURES [DATA BOOK] PREVENT THE SPREAD OF COMMUNICABLE DISEASES
MDH HEALTH PARTNERSHIPS DIVISION 74 APRIL 2016
Infectious Disease Services Controlling communicable diseases is perhaps the oldest and most fundamental public health responsibility. For decades, it was the primary responsibility of local boards of health and, in fact, the main reason for their creation. In Minnesota, it is a statutory mandate of local boards of health to control communicable diseases in their jurisdiction.
MORE INFORMATION
MDH Infectious Disease Epidemiology, Prevention and Control Division, Field Services Epidemiologists 651-201-5414 | www.health.state.mn.us/divs/idepc/epis.html
Change: Minnesota community health boards' significant involvement in infectious disease-related prevention, 2013-2015
“Significant involvement” relates to staff resources (i.e., time spent and activities performed by staff in your community health board), not necessarily the number of cases of a particular infection.
Involvement in infectious disease-related prevention
6. If your community health board was significantly involved in other infectious disease-related prevention, activities, or services, please indicate its focus on the following list. (Check all that apply.)
“Significant involvement” relates to staff resources (i.e., time spent and activities performed by staff in your community health board), not necessarily the number of cases of a particular infection.
Minnesota 2015 (n=48)
# %
Chlamydia 27 56%
Tick-borne illness 21 44%
Animal bites 17 35%
Pertussis 25 52%
HIV/AIDS 14 29%
Tuberculosis 14 29%
Ebola 5 10%
Sexually transmitted infections (other than chlamydia) 5 10%
Other 22 46%
None of the above 8 17%
Greatest change: Ways in which Minnesota community health boards most frequently addressed chlamydia, 2013-2015
*Not asked in 2013.
36
%
62
%
32
%
30
%
24
%
6%
6%
24
%
50
%
28
%
20
%
10
%
36
%
6% 10
%
56
%
52
%
44
%
35
%
29
%
13
%
10
%
2%
0%
25%
50%
75%
100%
Chlamydia Pertussis Tick-borneillness
Animal bites HIV/AIDS Ebola * Sexuallytransmittedinfections
Influenza
2013 (n=50)
2014 (n=50)
2015 (n=48)
67
%
39
%
44
%
50
%
50
%
50
%
92
%
58
%
58
%
48
%
48
%
78
%
41
%
48
%
0%
25%
50%
75%
100%
Provided referrals Conductedassessments
Conductedcommunity outreach
and education*
Provided directservices
Attended trainings
2013 (n=18)
2014 (n=12)
2015 (n=27)
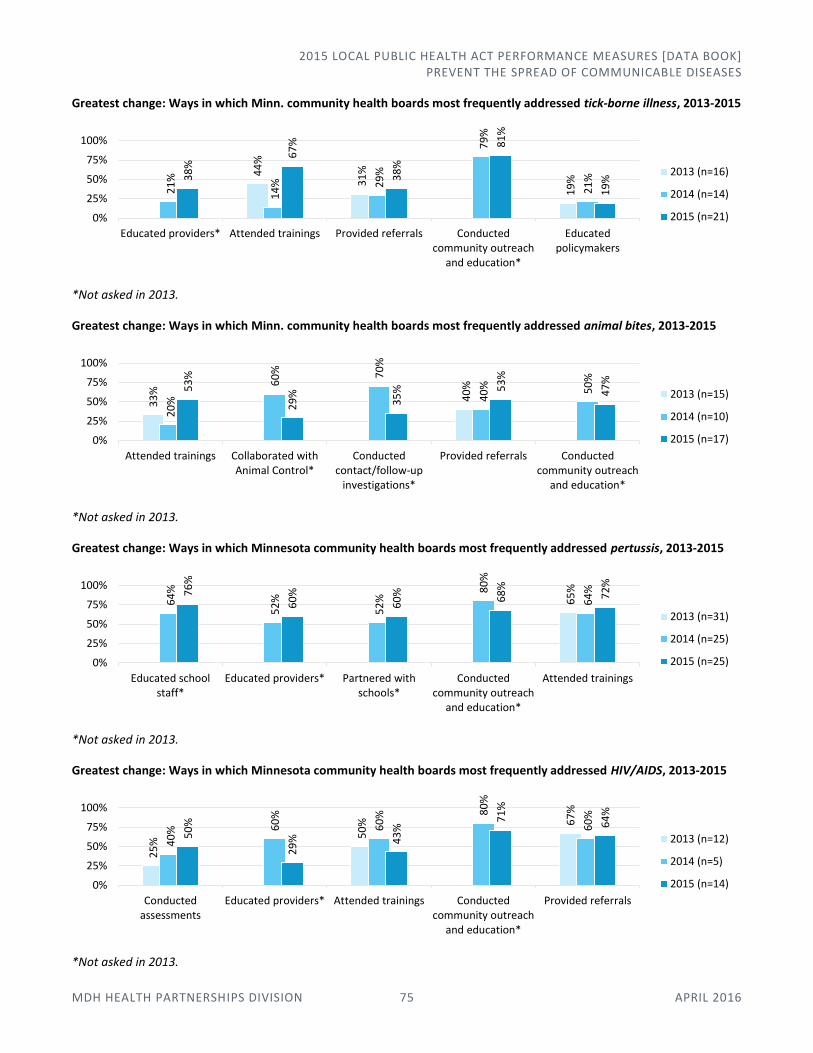
2015 LOCAL PUBLIC HEALTH ACT PERFORMANCE MEASURES [DATA BOOK] PREVENT THE SPREAD OF COMMUNICABLE DISEASES
MDH HEALTH PARTNERSHIPS DIVISION 75 APRIL 2016
Greatest change: Ways in which Minn. community health boards most frequently addressed tick-borne illness, 2013-2015
*Not asked in 2013.
Greatest change: Ways in which Minn. community health boards most frequently addressed animal bites, 2013-2015
*Not asked in 2013.
Greatest change: Ways in which Minnesota community health boards most frequently addressed pertussis, 2013-2015
*Not asked in 2013.
Greatest change: Ways in which Minnesota community health boards most frequently addressed HIV/AIDS, 2013-2015
*Not asked in 2013.
44
%
31
%
19
%
21
%
14
% 29
%
79
%
21
%38
%
67
%
38
%
81
%
19
%
0%
25%
50%
75%
100%
Educated providers* Attended trainings Provided referrals Conductedcommunity outreach
and education*
Educatedpolicymakers
2013 (n=16)
2014 (n=14)
2015 (n=21)
33
%
40
%
20
%
60
% 70
%
40
% 50
%
53
%
29
%
35
% 53
%
47
%
0%
25%
50%
75%
100%
Attended trainings Collaborated withAnimal Control*
Conductedcontact/follow-up
investigations*
Provided referrals Conductedcommunity outreach
and education*
2013 (n=15)
2014 (n=10)
2015 (n=17)
65
%
64
%
52
%
52
%
80
%
64
%76
%
60
%
60
% 68
%
72
%
0%
25%
50%
75%
100%
Educated schoolstaff*
Educated providers* Partnered withschools*
Conductedcommunity outreach
and education*
Attended trainings
2013 (n=31)
2014 (n=25)
2015 (n=25)
25
%
50
% 67
%
40
% 60
%
60
% 80
%
60
%
50
%
29
% 43
%
71
%
64
%
0%
25%
50%
75%
100%
Conductedassessments
Educated providers* Attended trainings Conductedcommunity outreach
and education*
Provided referrals
2013 (n=12)
2014 (n=5)
2015 (n=14)
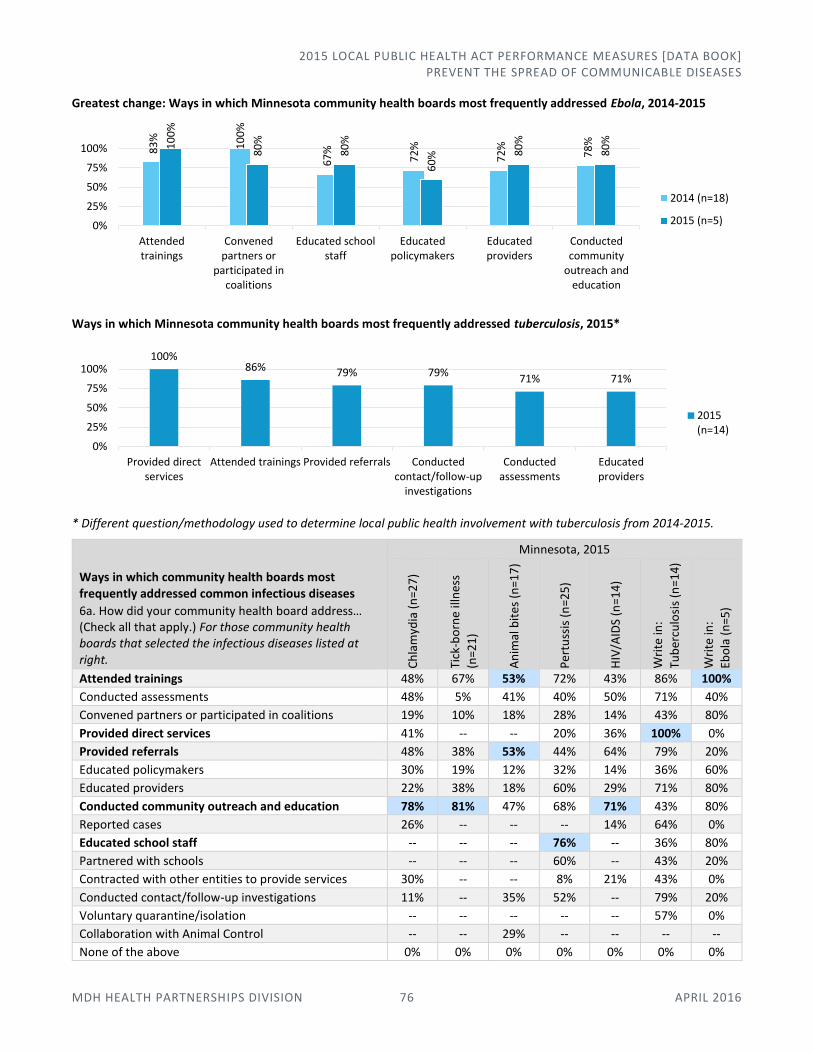
2015 LOCAL PUBLIC HEALTH ACT PERFORMANCE MEASURES [DATA BOOK] PREVENT THE SPREAD OF COMMUNICABLE DISEASES
MDH HEALTH PARTNERSHIPS DIVISION 76 APRIL 2016
Greatest change: Ways in which Minnesota community health boards most frequently addressed Ebola, 2014-2015
Ways in which Minnesota community health boards most frequently addressed tuberculosis, 2015*
* Different question/methodology used to determine local public health involvement with tuberculosis from 2014-2015.
Ways in which community health boards most frequently addressed common infectious diseases
6a. How did your community health board address… (Check all that apply.) For those community health boards that selected the infectious diseases listed at right.
Minnesota, 2015
Ch
lam
ydia
(n
=27
)
Tick
-bo
rne
illn
ess
(n=2
1)
An
imal
bit
es (
n=1
7)
Per
tuss
is (
n=2
5)
HIV
/AID
S (n
=14
)
Wri
te in
:
Tub
ercu
losi
s (n
=14
)
Wri
te in
:
Ebo
la (
n=5
)
Attended trainings 48% 67% 53% 72% 43% 86% 100%
Conducted assessments 48% 5% 41% 40% 50% 71% 40%
Convened partners or participated in coalitions 19% 10% 18% 28% 14% 43% 80%
Provided direct services 41% -- -- 20% 36% 100% 0%
Provided referrals 48% 38% 53% 44% 64% 79% 20%
Educated policymakers 30% 19% 12% 32% 14% 36% 60%
Educated providers 22% 38% 18% 60% 29% 71% 80%
Conducted community outreach and education 78% 81% 47% 68% 71% 43% 80%
Reported cases 26% -- -- -- 14% 64% 0%
Educated school staff -- -- -- 76% -- 36% 80%
Partnered with schools -- -- -- 60% -- 43% 20%
Contracted with other entities to provide services 30% -- -- 8% 21% 43% 0%
Conducted contact/follow-up investigations 11% -- 35% 52% -- 79% 20%
Voluntary quarantine/isolation -- -- -- -- -- 57% 0%
Collaboration with Animal Control -- -- 29% -- -- -- --
None of the above 0% 0% 0% 0% 0% 0% 0%
83
%
10
0%
67
%
72
%
72
%
78
%10
0%
80
%
80
%
60
% 80
%
80
%
0%
25%
50%
75%
100%
Attendedtrainings
Convenedpartners or
participated incoalitions
Educated schoolstaff
Educatedpolicymakers
Educatedproviders
Conductedcommunity
outreach andeducation
2014 (n=18)
2015 (n=5)
100%86% 79% 79%
71% 71%
0%
25%
50%
75%
100%
Provided directservices
Attended trainings Provided referrals Conductedcontact/follow-up
investigations
Conductedassessments
Educatedproviders
2015(n=14)
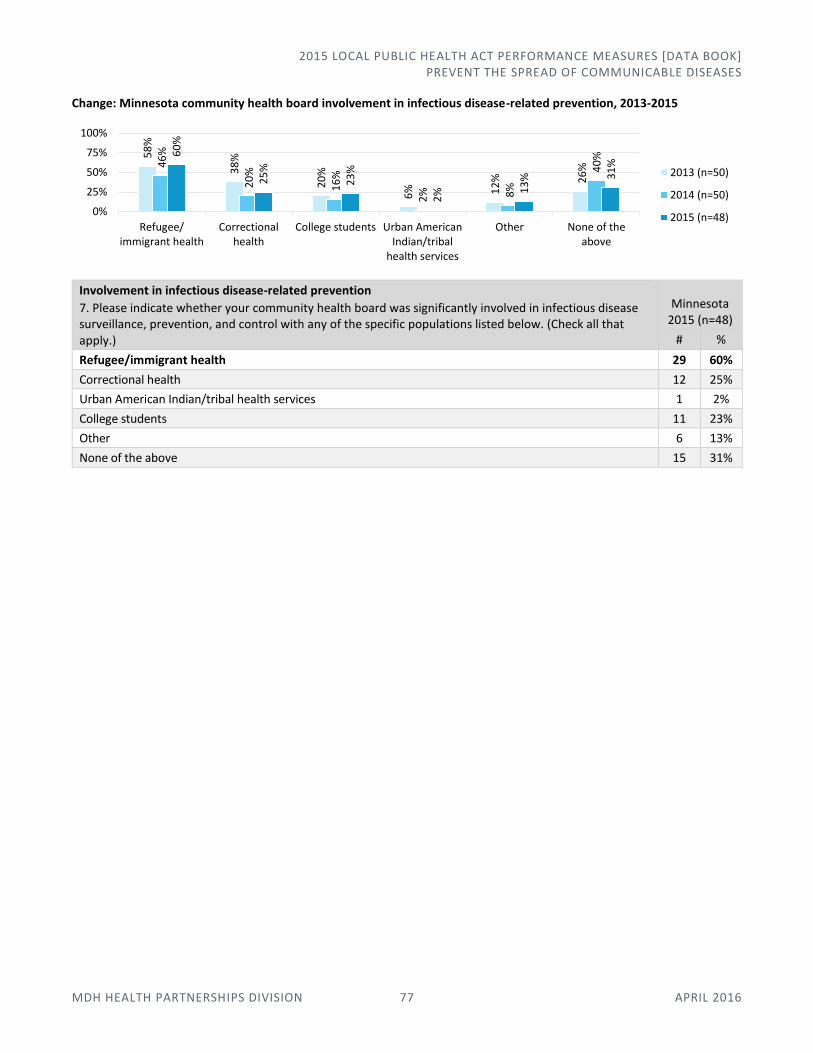
2015 LOCAL PUBLIC HEALTH ACT PERFORMANCE MEASURES [DATA BOOK] PREVENT THE SPREAD OF COMMUNICABLE DISEASES
MDH HEALTH PARTNERSHIPS DIVISION 77 APRIL 2016
Change: Minnesota community health board involvement in infectious disease-related prevention, 2013-2015
Involvement in infectious disease-related prevention
7. Please indicate whether your community health board was significantly involved in infectious disease surveillance, prevention, and control with any of the specific populations listed below. (Check all that apply.)
Minnesota 2015 (n=48)
# %
Refugee/immigrant health 29 60%
Correctional health 12 25%
Urban American Indian/tribal health services 1 2%
College students 11 23%
Other 6 13%
None of the above 15 31%
58
%
38
%
20
%
6% 12
% 26
%46
%
20
%
16
%
2% 8%
40
%60
%
25
%
23
%
2% 1
3% 3
1%
0%
25%
50%
75%
100%
Refugee/immigrant health
Correctionalhealth
College students Urban AmericanIndian/tribal
health services
Other None of theabove
2013 (n=50)
2014 (n=50)
2015 (n=48)
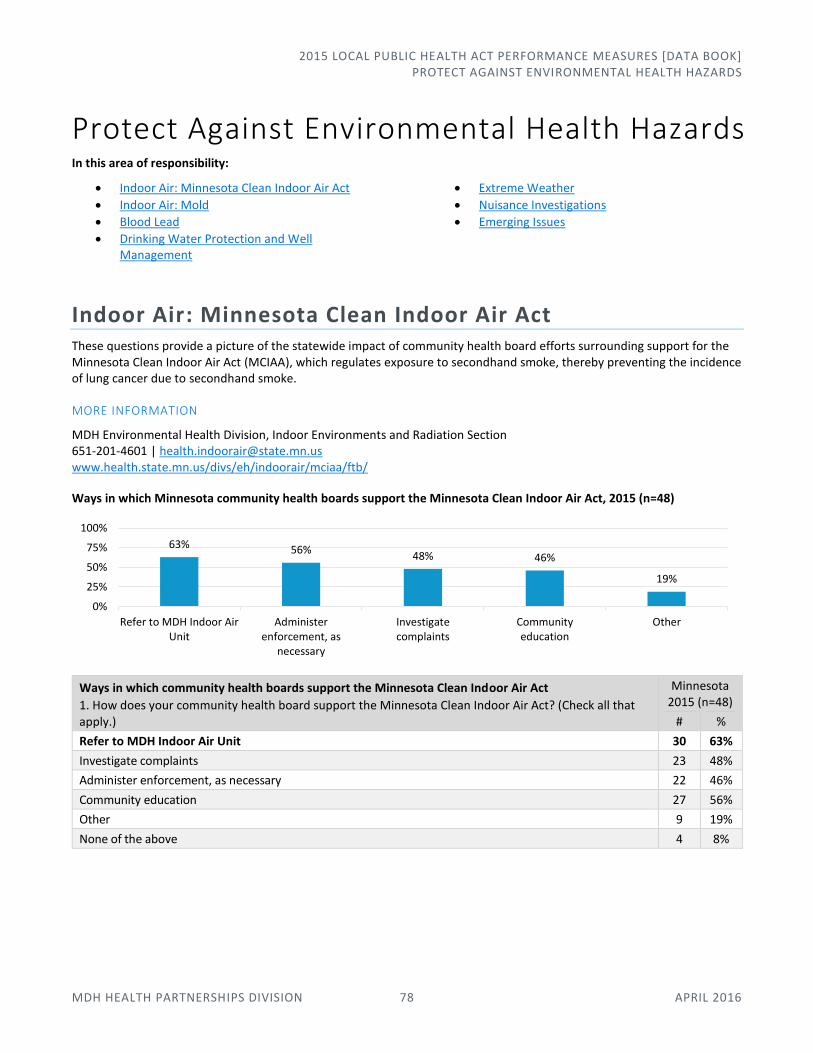
2015 LOCAL PUBLIC HEALTH ACT PERFORMANCE MEASURES [DATA BOOK] PROTECT AGAINST ENVIRONMENTAL HEALTH HAZARDS
MDH HEALTH PARTNERSHIPS DIVISION 78 APRIL 2016
Protect Against Environmental Health Hazards In this area of responsibility:
Indoor Air: Minnesota Clean Indoor Air Act
Indoor Air: Mold
Blood Lead
Drinking Water Protection and Well Management
Extreme Weather
Nuisance Investigations
Emerging Issues
Indoor Air: Minnesota Clean Indoor Air Act These questions provide a picture of the statewide impact of community health board efforts surrounding support for the Minnesota Clean Indoor Air Act (MCIAA), which regulates exposure to secondhand smoke, thereby preventing the incidence of lung cancer due to secondhand smoke.
MORE INFORMATION
MDH Environmental Health Division, Indoor Environments and Radiation Section 651-201-4601 | [email protected] www.health.state.mn.us/divs/eh/indoorair/mciaa/ftb/
Ways in which Minnesota community health boards support the Minnesota Clean Indoor Air Act, 2015 (n=48)
Ways in which community health boards support the Minnesota Clean Indoor Air Act
1. How does your community health board support the Minnesota Clean Indoor Air Act? (Check all that apply.)
Minnesota 2015 (n=48)
# %
Refer to MDH Indoor Air Unit 30 63%
Investigate complaints 23 48%
Administer enforcement, as necessary 22 46%
Community education 27 56%
Other 9 19%
None of the above 4 8%
63% 56%48% 46%
19%
0%
25%
50%
75%
100%
Refer to MDH Indoor AirUnit
Administerenforcement, as
necessary
Investigatecomplaints
Communityeducation
Other

2015 LOCAL PUBLIC HEALTH ACT PERFORMANCE MEASURES [DATA BOOK] PROTECT AGAINST ENVIRONMENTAL HEALTH HAZARDS
MDH HEALTH PARTNERSHIPS DIVISION 79 APRIL 2016
Change: Types of facilities for which Minnesota community health boards enforce MCIAA, 2014-2015
Types of facilities for which community health boards enforce the Minnesota Clean Indoor Air Act
1a. For what types of facilities does your community health board enforce the Minnesota Clean Indoor Air Act? (Select one.) Among those community health boards that selected “administer enforcement, as necessary” from Q1, above.
Minnesota 2015 (n=22)
# %
All public places and places of employment 14 64%
Food, beverage, and lodging establishments only 8 36%
Indoor Air: Mold Growing awareness of the health effects of mold exposure has prompted some community health boards to play a variety of roles in promoting mold awareness, clean-up and removal.
MORE INFORMATION
MDH Environmental Health Division, Indoor Air Program 651-201-4601 | [email protected] www.health.state.mn.us/divs/eh/indoorair/mold/
Mold-related actions taken by Minnesota community health boards, 2015 (n=48)
69% 64%
28% 36%
3%
0%
25%
50%
75%
100%
2014 (n=39) 2015 (n=22)
No answer
Food, beverage, and lodgingestablishments only
All public places and places ofemployment
46
%
13
%
13
%
6% 10
%
13
%
0% 6%
81
%
19
% 29
% 40
%
71
%
41
%
31
%
33
%
13
%
77
%
65
%
58
%
25
%
52
% 69
%
63
%
0%
25%
50%
75%
100%
Provided info.to general
public
Providedtechnical info.
toprofessionals
Provided info.to policy-makers
Coordinatedservices
Madereferrals
Included checkfor presence of
mold
Accompaniedinspectors
from anotherdepartment
upon request
Conductedinspections
specifically formold
As a preventive measure In response to complaints or emergencies Did not take this action

2015 LOCAL PUBLIC HEALTH ACT PERFORMANCE MEASURES [DATA BOOK] PROTECT AGAINST ENVIRONMENTAL HEALTH HAZARDS
MDH HEALTH PARTNERSHIPS DIVISION 80 APRIL 2016
Mold-related actions taken by community health boards
2. Identify the actions related to mold taken by your community health board in the past year, and indicate whether the action taken was as a preventive measure, in response to complaints/emergencies, or both. (Check all that apply.)
Minnesota, 2015 (n=48)
As a preventive measure
In response to complaints or emergencies
Did not take this action
# % # % # %
Provided information (including training) to the general public 22 46% 39 81% 6 13%
Provided technical information (including training) to professionals 6 13% 9 19% 37 77%
Provided information to policymakers 6 13% 14 29% 31 65%
Coordinated services 3 6% 19 40% 28 58%
Made referrals 5 10% 34 71% 12 25%
Included a check for the presence of mold 6 13% 20 41% 25 52%
Accompanied inspectors from another department upon request 0 0% 15 31% 33 69%
Conducted inspections specifically for mold 3 6% 16 33% 30 63%
Actions taken by Minnesota community health boards that conducted inspections specifically for mold, 2015 (n=18)
Actions taken by comm. health boards that conducted inspections specifically for mold
2a. If your community health board conducted inspections specifically for mold, what types of establishments were inspected? (Check all that apply.) 2b. If your community health board conducted inspections specifically for mold, does the community health board issue orders to building owners or operators to correct mold or moisture problems? (If yes, check all that apply.)
For those community health boards that selected “conducted inspections specifically for mold as a preventive measure” and/or “conducted inspections specifically for mold in response to complaints or emergencies” in Q2, above.
Minnesota, 2015 (n=18)
Conducted inspections
specifically for mold
Issued orders to building owners or
operators to correct mold or
moisture problems
# % # %
Residence, owner-occupied 7 39% 2 11%
Residence, rented 15 83% 8 44%
Commercial, owned 3 17% 3 17%
Commercial, rented 2 11% 3 17%
Licensed (e.g., food, lodging, etc.) 7 39% 9 50%
Public (e.g., school, government) 4 22% 4 22%
Other ** 0 0% 2 11%
Community health board does not issue orders to building owners or operators to correct mold or moisture problems
--- --- 5 28%
** Data limitations exist due to some reporting inconsistencies within community health boards. For example, one community health board reported “other” and wrote in that they only issue recommendations, but then indicated the statute/rule/ordinance cited when they issued orders.
83%
39% 39%22% 17% 11%
0%
44% 50%
11%22% 17% 17% 11%
0%
25%
50%
75%
100%
Residence,rented
Licensed(e.g., food,
lodging, etc.)
Residence,owner-occupied
Public(e.g., school,government)
Commercial,owned
Commercial,rented
Other **
Conducted inspections specifically for mold
Issued orders to building owners or operators to correct mold or moisture problems
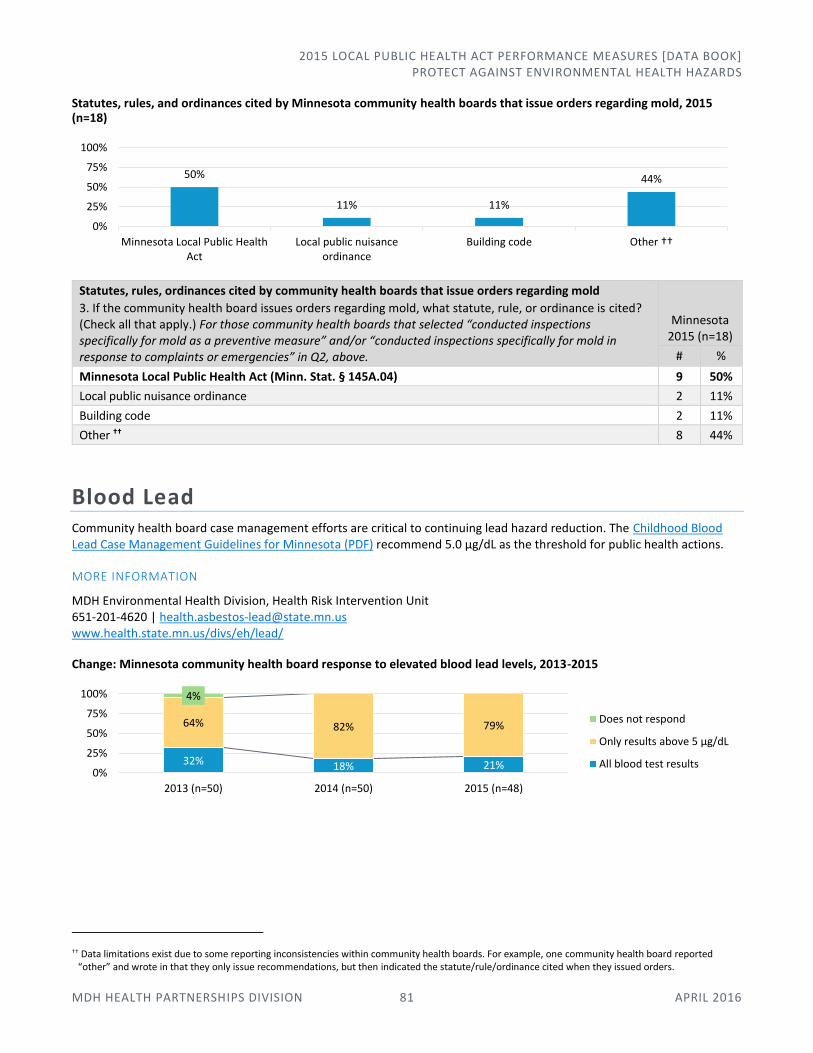
2015 LOCAL PUBLIC HEALTH ACT PERFORMANCE MEASURES [DATA BOOK] PROTECT AGAINST ENVIRONMENTAL HEALTH HAZARDS
MDH HEALTH PARTNERSHIPS DIVISION 81 APRIL 2016
Statutes, rules, and ordinances cited by Minnesota community health boards that issue orders regarding mold, 2015 (n=18)
Statutes, rules, ordinances cited by community health boards that issue orders regarding mold
3. If the community health board issues orders regarding mold, what statute, rule, or ordinance is cited? (Check all that apply.) For those community health boards that selected “conducted inspections specifically for mold as a preventive measure” and/or “conducted inspections specifically for mold in response to complaints or emergencies” in Q2, above.
Minnesota 2015 (n=18)
# %
Minnesota Local Public Health Act (Minn. Stat. § 145A.04) 9 50%
Local public nuisance ordinance 2 11%
Building code 2 11%
Other †† 8 44%
Blood Lead Community health board case management efforts are critical to continuing lead hazard reduction. The Childhood Blood Lead Case Management Guidelines for Minnesota (PDF) recommend 5.0 μg/dL as the threshold for public health actions.
MORE INFORMATION
MDH Environmental Health Division, Health Risk Intervention Unit 651-201-4620 | [email protected] www.health.state.mn.us/divs/eh/lead/
Change: Minnesota community health board response to elevated blood lead levels, 2013-2015
†† Data limitations exist due to some reporting inconsistencies within community health boards. For example, one community health board reported “other” and wrote in that they only issue recommendations, but then indicated the statute/rule/ordinance cited when they issued orders.
50%
11% 11%
44%
0%
25%
50%
75%
100%
Minnesota Local Public HealthAct
Local public nuisanceordinance
Building code Other ††
32% 18% 21%
64% 82% 79%
4%
0%
25%
50%
75%
100%
2013 (n=50) 2014 (n=50) 2015 (n=48)
Does not respond
Only results above 5 μg/dL
All blood test results
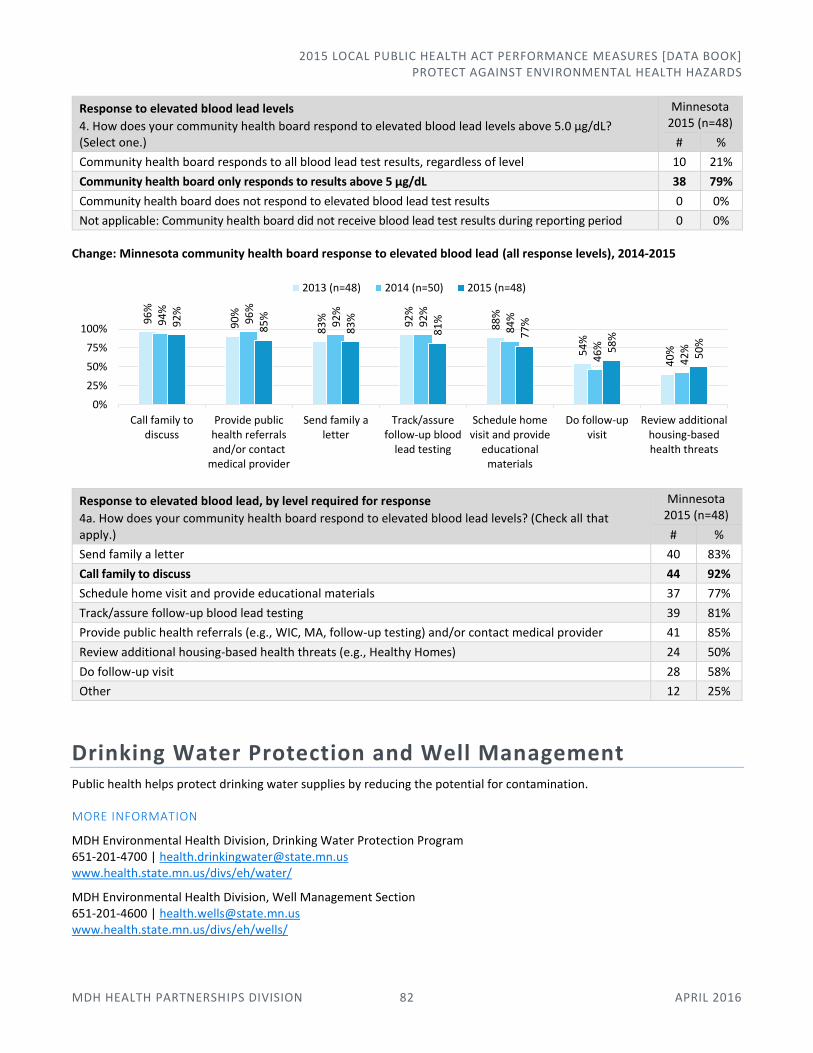
2015 LOCAL PUBLIC HEALTH ACT PERFORMANCE MEASURES [DATA BOOK] PROTECT AGAINST ENVIRONMENTAL HEALTH HAZARDS
MDH HEALTH PARTNERSHIPS DIVISION 82 APRIL 2016
Response to elevated blood lead levels
4. How does your community health board respond to elevated blood lead levels above 5.0 μg/dL? (Select one.)
Minnesota 2015 (n=48)
# %
Community health board responds to all blood lead test results, regardless of level 10 21%
Community health board only responds to results above 5 μg/dL 38 79%
Community health board does not respond to elevated blood lead test results 0 0%
Not applicable: Community health board did not receive blood lead test results during reporting period 0 0%
Change: Minnesota community health board response to elevated blood lead (all response levels), 2014-2015
Response to elevated blood lead, by level required for response
4a. How does your community health board respond to elevated blood lead levels? (Check all that apply.)
Minnesota 2015 (n=48)
# %
Send family a letter 40 83%
Call family to discuss 44 92%
Schedule home visit and provide educational materials 37 77%
Track/assure follow-up blood lead testing 39 81%
Provide public health referrals (e.g., WIC, MA, follow-up testing) and/or contact medical provider 41 85%
Review additional housing-based health threats (e.g., Healthy Homes) 24 50%
Do follow-up visit 28 58%
Other 12 25%
Drinking Water Protection and Well Management Public health helps protect drinking water supplies by reducing the potential for contamination.
MORE INFORMATION
MDH Environmental Health Division, Drinking Water Protection Program 651-201-4700 | [email protected] www.health.state.mn.us/divs/eh/water/
MDH Environmental Health Division, Well Management Section 651-201-4600 | [email protected] www.health.state.mn.us/divs/eh/wells/
96
%
90
%
83
% 92
%
88
%
54
%
40
%
94
%
96
%
92
%
92
%
84
%
46
%
42
%
92
%
85
%
83
%
81
%
77
%
58
%
50
%
0%
25%
50%
75%
100%
Call family todiscuss
Provide publichealth referralsand/or contact
medical provider
Send family aletter
Track/assurefollow-up blood
lead testing
Schedule homevisit and provide
educationalmaterials
Do follow-upvisit
Review additionalhousing-basedhealth threats
2013 (n=48) 2014 (n=50) 2015 (n=48)
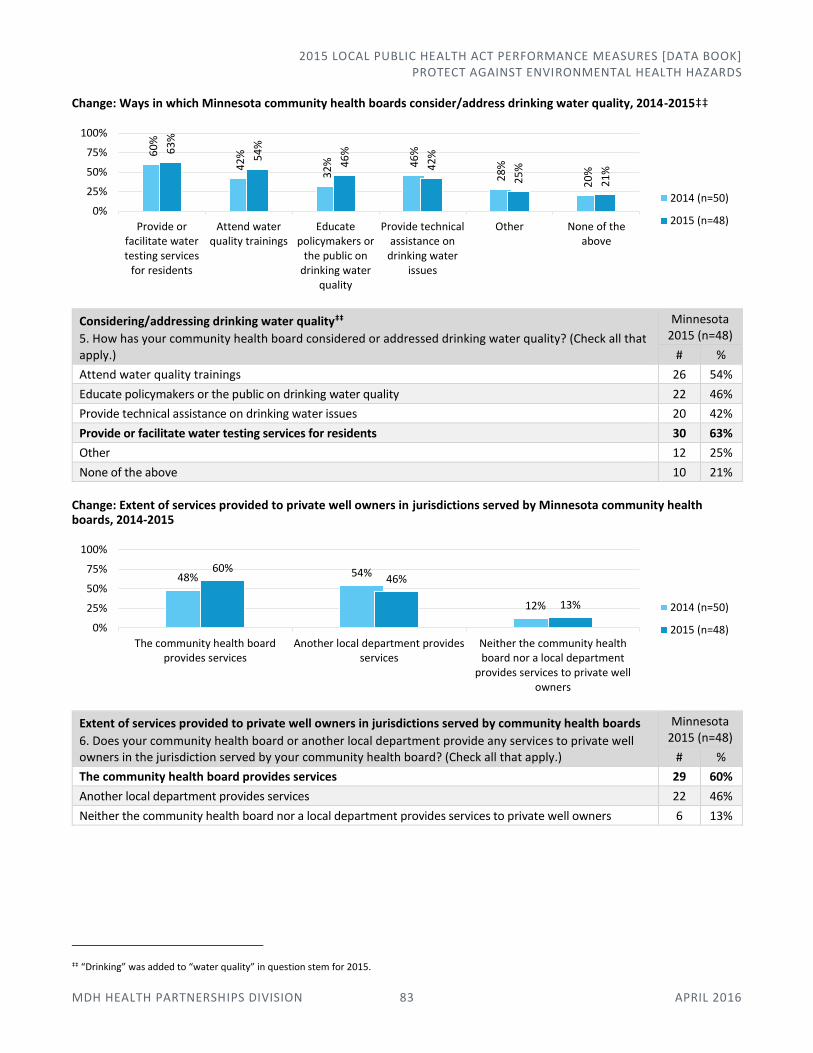
2015 LOCAL PUBLIC HEALTH ACT PERFORMANCE MEASURES [DATA BOOK] PROTECT AGAINST ENVIRONMENTAL HEALTH HAZARDS
MDH HEALTH PARTNERSHIPS DIVISION 83 APRIL 2016
Change: Ways in which Minnesota community health boards consider/address drinking water quality, 2014-2015‡‡
Considering/addressing drinking water quality‡‡
5. How has your community health board considered or addressed drinking water quality? (Check all that apply.)
Minnesota 2015 (n=48)
# %
Attend water quality trainings 26 54%
Educate policymakers or the public on drinking water quality 22 46%
Provide technical assistance on drinking water issues 20 42%
Provide or facilitate water testing services for residents 30 63%
Other 12 25%
None of the above 10 21%
Change: Extent of services provided to private well owners in jurisdictions served by Minnesota community health boards, 2014-2015
Extent of services provided to private well owners in jurisdictions served by community health boards
6. Does your community health board or another local department provide any services to private well owners in the jurisdiction served by your community health board? (Check all that apply.)
Minnesota 2015 (n=48)
# %
The community health board provides services 29 60%
Another local department provides services 22 46%
Neither the community health board nor a local department provides services to private well owners 6 13%
‡‡ “Drinking” was added to “water quality” in question stem for 2015.
60
%
42
%
32
% 46
%
28
%
20
%
63
%
54
%
46
%
42
%
25
%
21
%
0%
25%
50%
75%
100%
Provide orfacilitate watertesting services
for residents
Attend waterquality trainings
Educatepolicymakers or
the public ondrinking water
quality
Provide technicalassistance on
drinking waterissues
Other None of theabove
2014 (n=50)
2015 (n=48)
48% 54%
12%
60%46%
13%
0%
25%
50%
75%
100%
The community health boardprovides services
Another local department providesservices
Neither the community healthboard nor a local department
provides services to private wellowners
2014 (n=50)
2015 (n=48)
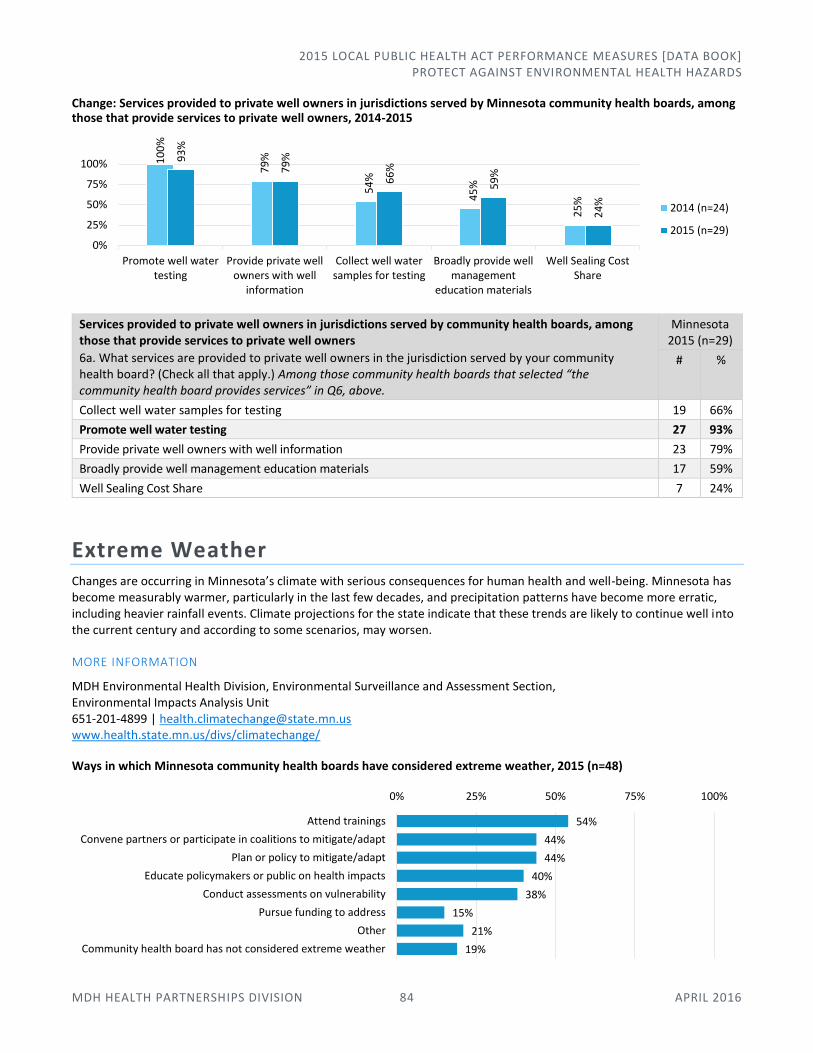
2015 LOCAL PUBLIC HEALTH ACT PERFORMANCE MEASURES [DATA BOOK] PROTECT AGAINST ENVIRONMENTAL HEALTH HAZARDS
MDH HEALTH PARTNERSHIPS DIVISION 84 APRIL 2016
Change: Services provided to private well owners in jurisdictions served by Minnesota community health boards, among those that provide services to private well owners, 2014-2015
Services provided to private well owners in jurisdictions served by community health boards, among those that provide services to private well owners
6a. What services are provided to private well owners in the jurisdiction served by your community health board? (Check all that apply.) Among those community health boards that selected “the community health board provides services” in Q6, above.
Minnesota 2015 (n=29)
# %
Collect well water samples for testing 19 66%
Promote well water testing 27 93%
Provide private well owners with well information 23 79%
Broadly provide well management education materials 17 59%
Well Sealing Cost Share 7 24%
Extreme Weather Changes are occurring in Minnesota’s climate with serious consequences for human health and well-being. Minnesota has become measurably warmer, particularly in the last few decades, and precipitation patterns have become more erratic, including heavier rainfall events. Climate projections for the state indicate that these trends are likely to continue well into the current century and according to some scenarios, may worsen.
MORE INFORMATION
MDH Environmental Health Division, Environmental Surveillance and Assessment Section, Environmental Impacts Analysis Unit 651-201-4899 | [email protected] www.health.state.mn.us/divs/climatechange/
Ways in which Minnesota community health boards have considered extreme weather, 2015 (n=48)
10
0%
79
%
54
%
45
%
25
%
93
%
79
%
66
%
59
%
24
%
0%
25%
50%
75%
100%
Promote well watertesting
Provide private wellowners with well
information
Collect well watersamples for testing
Broadly provide wellmanagement
education materials
Well Sealing CostShare
2014 (n=24)
2015 (n=29)
54%
44%
44%
40%
38%
15%
21%
19%
0% 25% 50% 75% 100%
Attend trainings
Convene partners or participate in coalitions to mitigate/adapt
Plan or policy to mitigate/adapt
Educate policymakers or public on health impacts
Conduct assessments on vulnerability
Pursue funding to address
Other
Community health board has not considered extreme weather
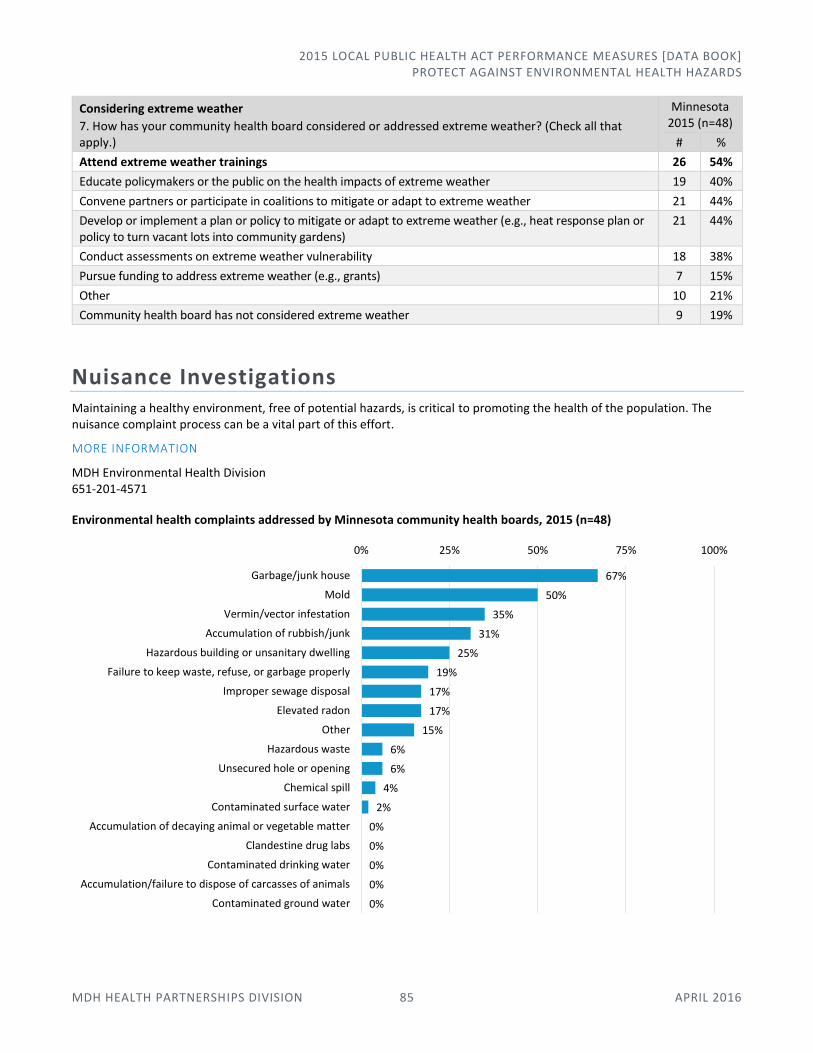
2015 LOCAL PUBLIC HEALTH ACT PERFORMANCE MEASURES [DATA BOOK] PROTECT AGAINST ENVIRONMENTAL HEALTH HAZARDS
MDH HEALTH PARTNERSHIPS DIVISION 85 APRIL 2016
Considering extreme weather
7. How has your community health board considered or addressed extreme weather? (Check all that apply.)
Minnesota 2015 (n=48)
# %
Attend extreme weather trainings 26 54%
Educate policymakers or the public on the health impacts of extreme weather 19 40%
Convene partners or participate in coalitions to mitigate or adapt to extreme weather 21 44%
Develop or implement a plan or policy to mitigate or adapt to extreme weather (e.g., heat response plan or policy to turn vacant lots into community gardens)
21 44%
Conduct assessments on extreme weather vulnerability 18 38%
Pursue funding to address extreme weather (e.g., grants) 7 15%
Other 10 21%
Community health board has not considered extreme weather 9 19%
Nuisance Investigations Maintaining a healthy environment, free of potential hazards, is critical to promoting the health of the population. The nuisance complaint process can be a vital part of this effort.
MORE INFORMATION
MDH Environmental Health Division 651-201-4571
Environmental health complaints addressed by Minnesota community health boards, 2015 (n=48)
67%
50%
35%
31%
25%
19%
17%
17%
15%
6%
6%
4%
2%
0%
0%
0%
0%
0%
0% 25% 50% 75% 100%
Garbage/junk house
Mold
Vermin/vector infestation
Accumulation of rubbish/junk
Hazardous building or unsanitary dwelling
Failure to keep waste, refuse, or garbage properly
Improper sewage disposal
Elevated radon
Other
Hazardous waste
Unsecured hole or opening
Chemical spill
Contaminated surface water
Accumulation of decaying animal or vegetable matter
Clandestine drug labs
Contaminated drinking water
Accumulation/failure to dispose of carcasses of animals
Contaminated ground water
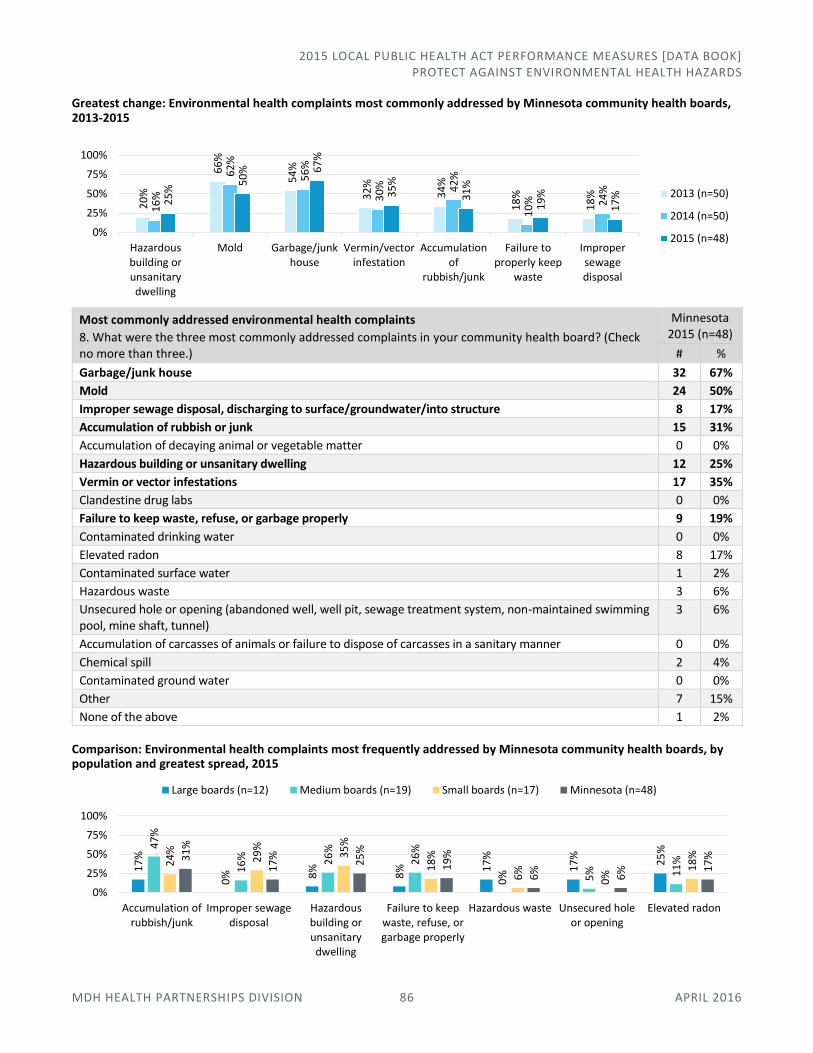
2015 LOCAL PUBLIC HEALTH ACT PERFORMANCE MEASURES [DATA BOOK] PROTECT AGAINST ENVIRONMENTAL HEALTH HAZARDS
MDH HEALTH PARTNERSHIPS DIVISION 86 APRIL 2016
Greatest change: Environmental health complaints most commonly addressed by Minnesota community health boards, 2013-2015
Most commonly addressed environmental health complaints
8. What were the three most commonly addressed complaints in your community health board? (Check no more than three.)
Minnesota 2015 (n=48)
# %
Garbage/junk house 32 67%
Mold 24 50%
Improper sewage disposal, discharging to surface/groundwater/into structure 8 17%
Accumulation of rubbish or junk 15 31%
Accumulation of decaying animal or vegetable matter 0 0%
Hazardous building or unsanitary dwelling 12 25%
Vermin or vector infestations 17 35%
Clandestine drug labs 0 0%
Failure to keep waste, refuse, or garbage properly 9 19%
Contaminated drinking water 0 0%
Elevated radon 8 17%
Contaminated surface water 1 2%
Hazardous waste 3 6%
Unsecured hole or opening (abandoned well, well pit, sewage treatment system, non-maintained swimming pool, mine shaft, tunnel)
3 6%
Accumulation of carcasses of animals or failure to dispose of carcasses in a sanitary manner 0 0%
Chemical spill 2 4%
Contaminated ground water 0 0%
Other 7 15%
None of the above 1 2%
Comparison: Environmental health complaints most frequently addressed by Minnesota community health boards, by population and greatest spread, 2015
20
%
66
%
54
%
32
%
34
%
18
%
18
%
16
%
62
%
56
%
30
% 42
%
10
% 24
%
25
%
50
% 67
%
35
%
31
%
19
%
17
%
0%
25%
50%
75%
100%
Hazardousbuilding orunsanitarydwelling
Mold Garbage/junkhouse
Vermin/vectorinfestation
Accumulationof
rubbish/junk
Failure toproperly keep
waste
Impropersewagedisposal
2013 (n=50)
2014 (n=50)
2015 (n=48)
17
%
0% 8
%
8% 1
7%
17
%
25
%47
%
16
% 26
%
26
%
0% 5% 11
%24
%
29
%
35
%
18
%
6%
0%
18
%31
%
17
%
25
%
19
%
6%
6% 1
7%
0%
25%
50%
75%
100%
Accumulation ofrubbish/junk
Improper sewagedisposal
Hazardousbuilding orunsanitarydwelling
Failure to keepwaste, refuse, orgarbage properly
Hazardous waste Unsecured holeor opening
Elevated radon
Large boards (n=12) Medium boards (n=19) Small boards (n=17) Minnesota (n=48)
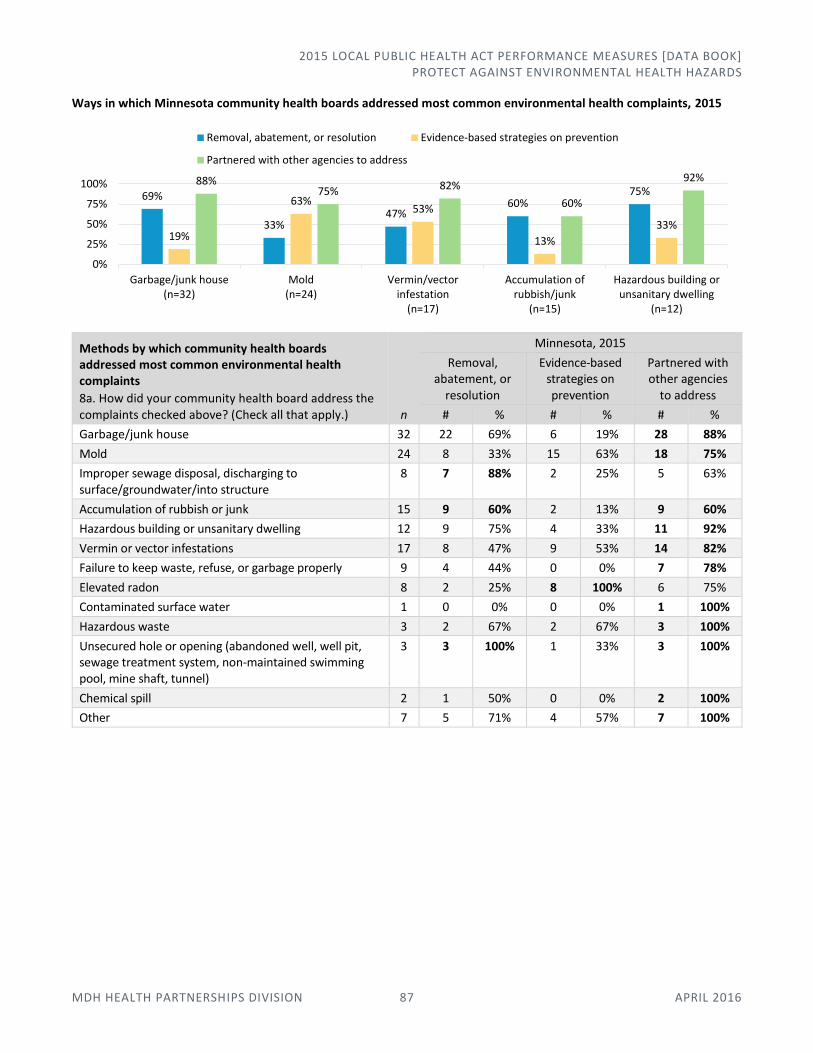
2015 LOCAL PUBLIC HEALTH ACT PERFORMANCE MEASURES [DATA BOOK] PROTECT AGAINST ENVIRONMENTAL HEALTH HAZARDS
MDH HEALTH PARTNERSHIPS DIVISION 87 APRIL 2016
Ways in which Minnesota community health boards addressed most common environmental health complaints, 2015
Methods by which community health boards addressed most common environmental health complaints
8a. How did your community health board address the complaints checked above? (Check all that apply.) n
Minnesota, 2015
Removal, abatement, or
resolution
Evidence-based strategies on prevention
Partnered with other agencies
to address
# % # % # %
Garbage/junk house 32 22 69% 6 19% 28 88%
Mold 24 8 33% 15 63% 18 75%
Improper sewage disposal, discharging to surface/groundwater/into structure
8 7 88% 2 25% 5 63%
Accumulation of rubbish or junk 15 9 60% 2 13% 9 60%
Hazardous building or unsanitary dwelling 12 9 75% 4 33% 11 92%
Vermin or vector infestations 17 8 47% 9 53% 14 82%
Failure to keep waste, refuse, or garbage properly 9 4 44% 0 0% 7 78%
Elevated radon 8 2 25% 8 100% 6 75%
Contaminated surface water 1 0 0% 0 0% 1 100%
Hazardous waste 3 2 67% 2 67% 3 100%
Unsecured hole or opening (abandoned well, well pit, sewage treatment system, non-maintained swimming pool, mine shaft, tunnel)
3 3 100% 1 33% 3 100%
Chemical spill 2 1 50% 0 0% 2 100%
Other 7 5 71% 4 57% 7 100%
69%
33%47%
60%75%
19%
63%53%
13%
33%
88%75% 82%
60%
92%
0%
25%
50%
75%
100%
Garbage/junk house(n=32)
Mold(n=24)
Vermin/vectorinfestation
(n=17)
Accumulation ofrubbish/junk
(n=15)
Hazardous building orunsanitary dwelling
(n=12)
Removal, abatement, or resolution Evidence-based strategies on prevention
Partnered with other agencies to address

2015 LOCAL PUBLIC HEALTH ACT PERFORMANCE MEASURES [DATA BOOK] ASSURE HEALTH SERVICES
MDH HEALTH PARTNERSHIPS DIVISION 88 APRIL 2016
Assure Health Services In this area of responsibility:
Clinical-Community Linkages
Barriers and Services
Provision of Public Health Services
Clinical-Community Linkages There is growing local, state, and national awareness about the importance of clinical-community linkages to support health promotion and prevention activities, and facilitate smooth health care delivery. This question characterizes the role of public health in such activities.
MORE INFORMATION
MDH Office of Statewide Health Improvement Initiatives 651-201-5443 | [email protected] www.health.state.mn.us/divs/oshii/
MDH Health Promotion and Chronic Disease Division 651-201-3600 | www.health.state.mn.us/divs/hpcd/
Ways in which Minnesota community health boards promoted clinical-community linkages, 2015 (n=48)
Comparison: Ways in which Minnesota community health boards promoted clinical-community linkages, 2015 (n=48)
67%
56%
52%
2%
0% 25% 50% 75% 100%
Screen-Counsel-Refer-Follow-up in Clinical setting
Workplace strategy in the Health Care setting
Establishing a community evidence-based practice program
Not applicable
92%
50%67%
53%68%
42%
65%47% 53%
67%56% 52%
0%
25%
50%
75%
100%
Screen-Counsel-Refer-Follow-upin Clinical setting
Workplace strategy inHealth Care setting
Establishing a community evidence-based practice program
Large boards (n=12) Medium boards (n=19) Small boards (n=17) Minnesota (n=48)
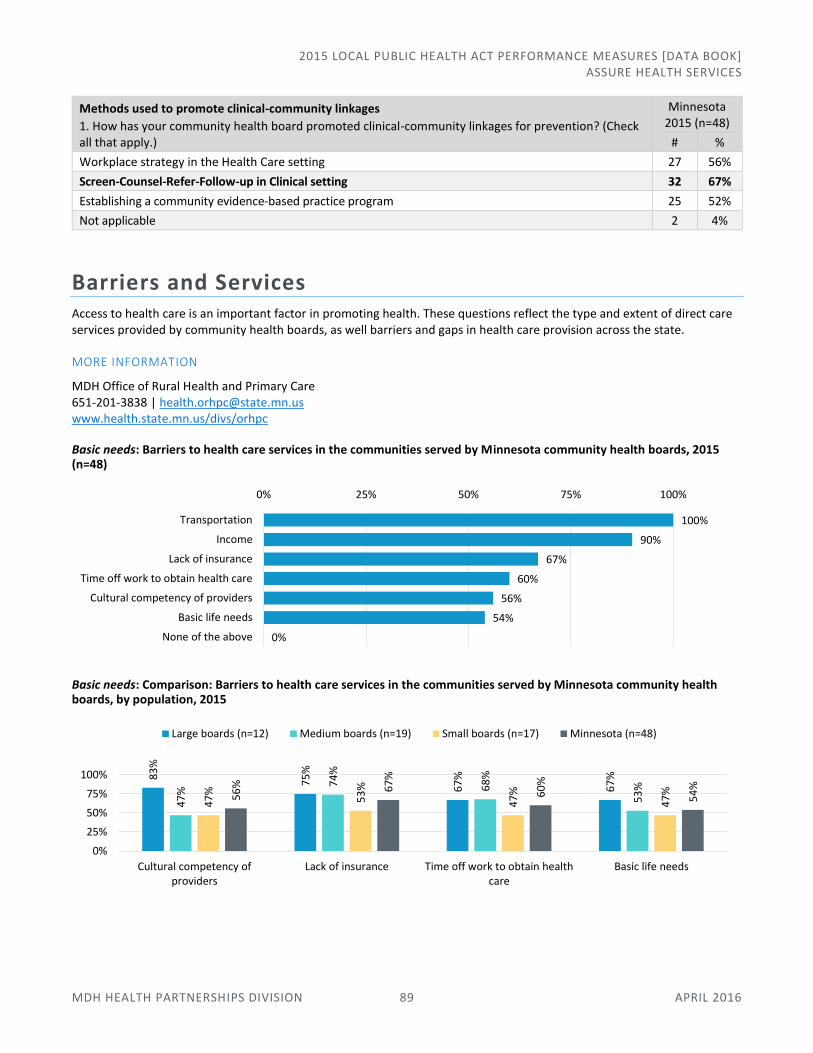
2015 LOCAL PUBLIC HEALTH ACT PERFORMANCE MEASURES [DATA BOOK] ASSURE HEALTH SERVICES
MDH HEALTH PARTNERSHIPS DIVISION 89 APRIL 2016
Methods used to promote clinical-community linkages
1. How has your community health board promoted clinical-community linkages for prevention? (Check all that apply.)
Minnesota 2015 (n=48)
# %
Workplace strategy in the Health Care setting 27 56%
Screen-Counsel-Refer-Follow-up in Clinical setting 32 67%
Establishing a community evidence-based practice program 25 52%
Not applicable 2 4%
Barriers and Services Access to health care is an important factor in promoting health. These questions reflect the type and extent of direct care services provided by community health boards, as well barriers and gaps in health care provision across the state.
MORE INFORMATION
MDH Office of Rural Health and Primary Care 651-201-3838 | [email protected] www.health.state.mn.us/divs/orhpc
Basic needs: Barriers to health care services in the communities served by Minnesota community health boards, 2015 (n=48)
Basic needs: Comparison: Barriers to health care services in the communities served by Minnesota community health boards, by population, 2015
100%
90%
67%
60%
56%
54%
0%
0% 25% 50% 75% 100%
Transportation
Income
Lack of insurance
Time off work to obtain health care
Cultural competency of providers
Basic life needs
None of the above
83
%
75
%
67
%
67
%
47
%
74
%
68
%
53
%
47
%
53
%
47
%
47
%56
% 67
%
60
%
54
%
0%
25%
50%
75%
100%
Cultural competency ofproviders
Lack of insurance Time off work to obtain healthcare
Basic life needs
Large boards (n=12) Medium boards (n=19) Small boards (n=17) Minnesota (n=48)
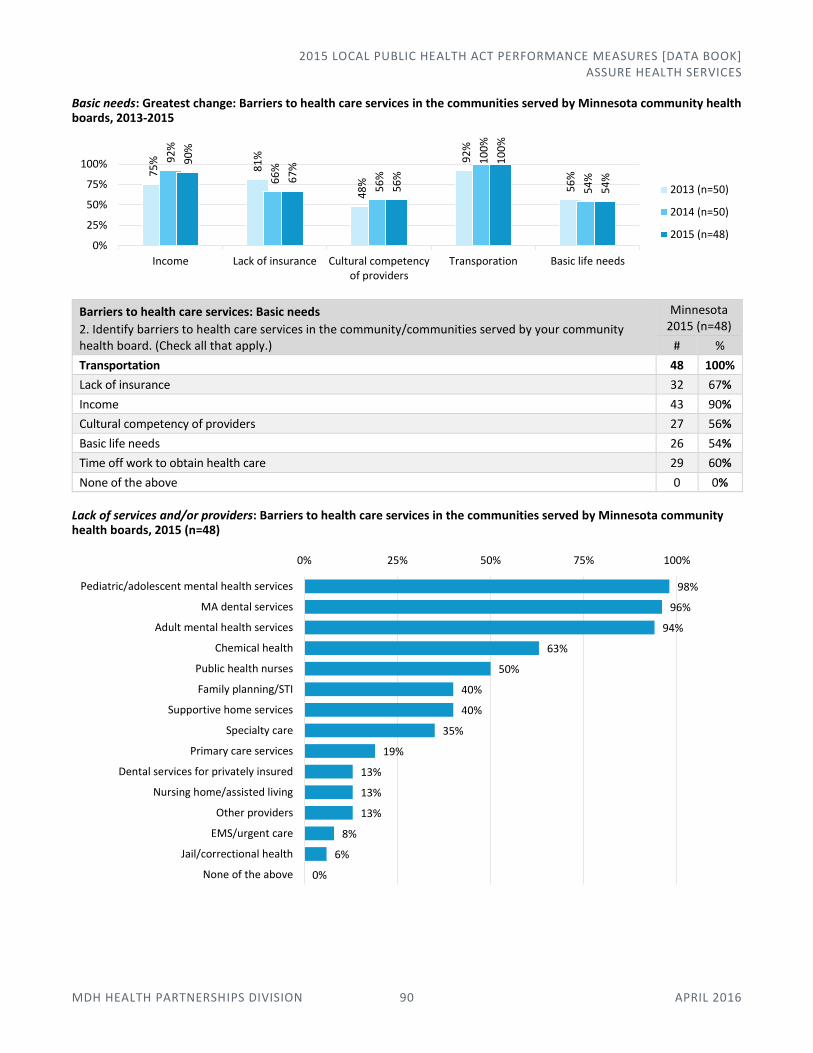
2015 LOCAL PUBLIC HEALTH ACT PERFORMANCE MEASURES [DATA BOOK] ASSURE HEALTH SERVICES
MDH HEALTH PARTNERSHIPS DIVISION 90 APRIL 2016
Basic needs: Greatest change: Barriers to health care services in the communities served by Minnesota community health boards, 2013-2015
Barriers to health care services: Basic needs
2. Identify barriers to health care services in the community/communities served by your community health board. (Check all that apply.)
Minnesota 2015 (n=48)
# %
Transportation 48 100%
Lack of insurance 32 67%
Income 43 90%
Cultural competency of providers 27 56%
Basic life needs 26 54%
Time off work to obtain health care 29 60%
None of the above 0 0%
Lack of services and/or providers: Barriers to health care services in the communities served by Minnesota community health boards, 2015 (n=48)
75
%
81
%
48
%
92
%
56
%
92
%
66
%
56
%
10
0%
54
%
90
%
67
%
56
%
10
0%
54
%
0%
25%
50%
75%
100%
Income Lack of insurance Cultural competencyof providers
Transporation Basic life needs
2013 (n=50)
2014 (n=50)
2015 (n=48)
98%
96%
94%
63%
50%
40%
40%
35%
19%
13%
13%
13%
8%
6%
0%
0% 25% 50% 75% 100%
Pediatric/adolescent mental health services
MA dental services
Adult mental health services
Chemical health
Public health nurses
Family planning/STI
Supportive home services
Specialty care
Primary care services
Dental services for privately insured
Nursing home/assisted living
Other providers
EMS/urgent care
Jail/correctional health
None of the above
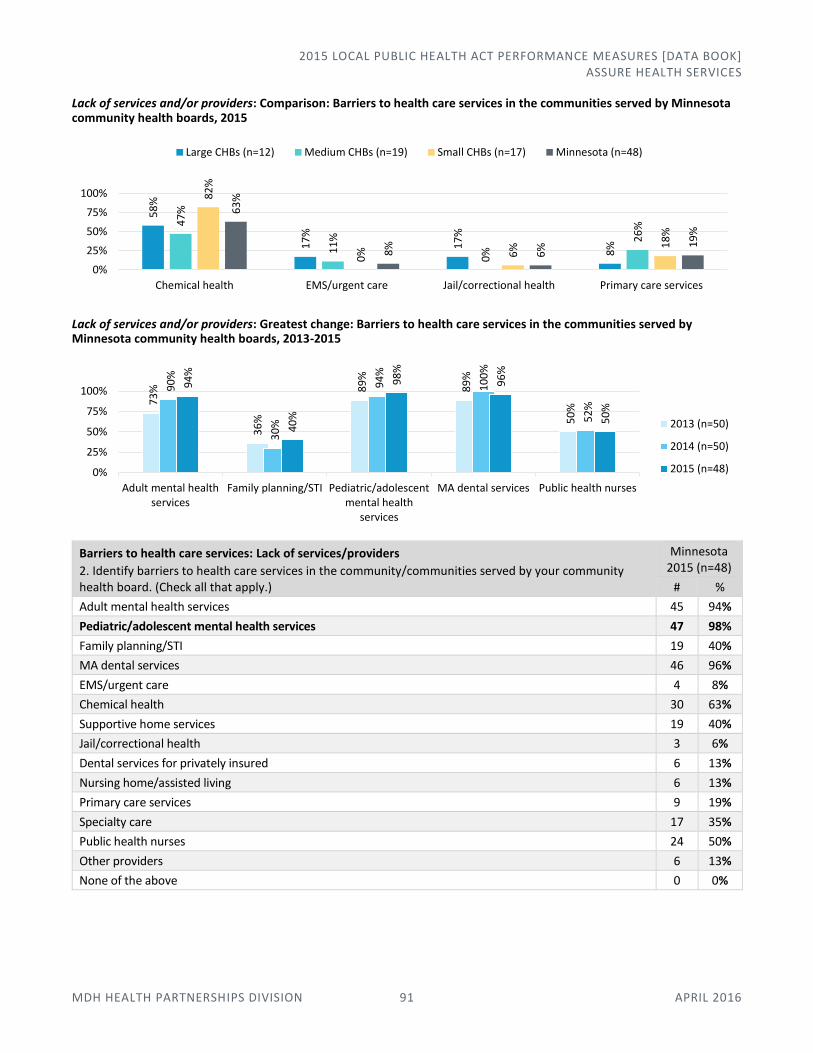
2015 LOCAL PUBLIC HEALTH ACT PERFORMANCE MEASURES [DATA BOOK] ASSURE HEALTH SERVICES
MDH HEALTH PARTNERSHIPS DIVISION 91 APRIL 2016
Lack of services and/or providers: Comparison: Barriers to health care services in the communities served by Minnesota community health boards, 2015
Lack of services and/or providers: Greatest change: Barriers to health care services in the communities served by Minnesota community health boards, 2013-2015
Barriers to health care services: Lack of services/providers
2. Identify barriers to health care services in the community/communities served by your community health board. (Check all that apply.)
Minnesota 2015 (n=48)
# %
Adult mental health services 45 94%
Pediatric/adolescent mental health services 47 98%
Family planning/STI 19 40%
MA dental services 46 96%
EMS/urgent care 4 8%
Chemical health 30 63%
Supportive home services 19 40%
Jail/correctional health 3 6%
Dental services for privately insured 6 13%
Nursing home/assisted living 6 13%
Primary care services 9 19%
Specialty care 17 35%
Public health nurses 24 50%
Other providers 6 13%
None of the above 0 0%
58
%
17
%
17
%
8%
47
%
11
%
0%
26
%
82
%
0% 6% 1
8%
63
%
8%
6% 1
9%
0%
25%
50%
75%
100%
Chemical health EMS/urgent care Jail/correctional health Primary care services
Large CHBs (n=12) Medium CHBs (n=19) Small CHBs (n=17) Minnesota (n=48)7
3%
36
%
89
%
89
%
50
%
90
%
30
%
94
%
10
0%
52
%
94
%
40
%
98
%
96
%
50
%
0%
25%
50%
75%
100%
Adult mental healthservices
Family planning/STI Pediatric/adolescentmental health
services
MA dental services Public health nurses
2013 (n=50)
2014 (n=50)
2015 (n=48)

2015 LOCAL PUBLIC HEALTH ACT PERFORMANCE MEASURES [DATA BOOK] ASSURE HEALTH SERVICES
MDH HEALTH PARTNERSHIPS DIVISION 92 APRIL 2016
Ways in which Minnesota community health boards identified barriers to health care, 2015 (n=48)
Methods used to identify barriers to health care
2a. How did you identify the health care barriers in your community health board? (Choose the best response.) For those community health boards that identified any barriers in Q2, above.
Minnesota 2015 (n=48)
# %
One person identified the barriers based knowledge of the jurisdiction and/or clients; we did not assemble or review quantitative data
5 10%
Multiple people provided input to identify the barriers based on knowledge of the jurisdiction and/or clients; we did not assemble or review quantitative data
36 75%
An assessment process involved gathering and reviewing quantitative data 8 17%
Other 3 6%
Partners engaged by Minnesota community health boards that used multiple people to provide input on barriers to health care, 2015 (n=36)
Partners engaged by community health boards that used multiple people to provide input on barriers to health care
2b. If multiple people provided input to identify the barriers based on knowledge of the jurisdiction and/or clients, please indicate which partners you engaged. (Check all that apply.) For those community health boards that selected “multiple people provided input” in Q2a, above.
Minnesota 2015 (n=36)
# %
Internal partners only 10 28%
External partners only 2 6%
Both internal and external partners 24 67%
Partners engaged by Minnesota community health boards that used an assessment involving gathering/analyzing data to identify barriers to health care, 2015 (n=8)
Multiple people provided input to identify barriers
69%
Assessment process involved gathering and
reviewing data15%
One person identified barriers
10%
Other6%
Both internal and external partners
66%
Internal partners only28%
External partners only6%
Both internal and external partners
75%
External partners only25%

2015 LOCAL PUBLIC HEALTH ACT PERFORMANCE MEASURES [DATA BOOK] ASSURE HEALTH SERVICES
MDH HEALTH PARTNERSHIPS DIVISION 93 APRIL 2016
Partners engaged by community health boards that used an assessment involving gathering/analyzing data to identify barriers to health care
2c. If an assessment process involved gathering and reviewing quantitative data, please indicate which partners you engaged. (Check all that apply.) For those community health boards that selected “an assessment process involved gathering and reviewing quantitative data” in Q2a, above.
Minnesota 2015 (n=8)
# %
Internal partners only 0 0%
External partners only 2 25%
Both internal and external partners 6 75%
We engaged no partners 0 0%
Provision of Public Health Services MDH understands that home health and correctional health services are not provided in all community health boards. These services are included here to track, over time, how widely they are provided by community health boards.
MORE INFORMATION
MDH Office of Rural Health and Primary Care 651-201-3838 | [email protected] www.health.state.mn.us/divs/orhpc
Activities performed by Minnesota community health boards related to public health services, 2015 (n=48)
Greatest change: Provision of/contracting for public health services by Minnesota community health boards, 2012-2015
* In 2012, this response option was listed as “Home Care” rather than “Licensed Home Care.”
Activities performed related to public health services
3. For the following services, indicate whether your community health board performed the activities listed. (Check all that apply.)
Minnesota, 2015 (n=48)
Primary Care: Medical
Primary Care: Dental
Licensed Home Care
Correctional Health
# % # % # % # %
Provided services 7 15% 5 10% 13 27% 19 37%
Contracted for services 6 13% 5 10% 2 4% 3 6%
Did not provide services 38 79% 38 79% 33 69% 28 58%
15% 10%27%
37%
13% 10% 4% 6%
79% 79%69%
58%
0%
25%
50%
75%
100%
Primary Care: Medical Primary Care: Dental Licensed Home Care Correctional Health
Provided services
Contracted for services
Did not provide services
15
% 29
% 40
%
40
%
34
%
30
% 44
%
44
%
30
%
26
%
30
% 38
%
21
%
21
% 31
% 42
%
0%
25%
50%
75%
100%
Primary Care: Medical Primary Care: Dental Licensed Home Care* Correctional Health
2012 (n=52)
2013 (n=50)
2014 (n=50)
2015 (n=48)

2015 LOCAL PUBLIC HEALTH ACT PERFORMANCE MEASURES [DATA BOOK] APPENDICES
MDH HEALTH PARTNERSHIPS DIVISION 94 APRIL 2016
Community Health Boards by Population
Large community health boards (>100,000 residents), n=12
Hennepin 1,212,064 St. Paul-Ramsey 532,655 Dakota 412,529 Minneapolis 411,273 Anoka 341,864 Carlton-Cook-Lake-St. Louis
252,433 Washington 249,283 Partnership4Health 158,675 Stearns 152,912 Olmsted 150,287 Scott 139,672 Wright 129,918
Medium community health boards (50,000-100,000 residents), n=19
Carver 97,338 Sherburne 91,126 Bloomington 86,652 North Country 78,946 SWHHS 74,272 Aitkin-Itasca-Koochiching 74,216 Meeker-McLeod-Sibley 73,907 Morrison-Todd-Wadena 70,831 Horizon 66,917 Blue Earth 65,385 Rice 65,151 Isanti-Mille Lacs 64,297 Crow Wing 63,265 Brown-Nicollet 58,385 Kandiyohi-Renville 57,310 Dodge-Steele 56,926 Chisago 54,025 Winona 51,097 Edina 50,261
Small community health boards (<50,000 residents), n=17
Quin County 47,632 Le Sueur-Waseca 46,795 Goodhue 46,423 Kanabec-Pine 45,025 Polk-Norman-Mahnomen 43,848 Countryside 43,673 Fillmore-Houston 39,514 Benton 39,506 Mower 39,323 Richfield 36,157 Faribault-Martin 34,412 Freeborn 30,840 Cass 28,559 Des Moines Valley 21,902 Nobles 21,590 Wabasha 21,362 Watonwan 11,083

2015 LOCAL PUBLIC HEALTH ACT PERFORMANCE MEASURES [DATA BOOK] APPENDICES
MDH HEALTH PARTNERSHIPS DIVISION 95 APRIL 2016
Areas of Public Health Responsibility Online: MDH: Areas of Public Health Responsibility within the Local Public Health Act
Assure an adequate local public health infrastructure Assure an adequate local public health infrastructure by maintaining the basic foundational capacities to a well-functioning public health system that includes data analysis and utilization; health planning; partnership development and community mobilization; policy development, analysis, and decision support; communication; and public health research, evaluation, and quality improvement.
Promote healthy communities and healthy behavior Promote healthy communities and healthy behavior through activities that improve health in a population, such as investing in healthy families; engaging communities to change policies, systems, or environments to promote positive health or prevent adverse health; providing information and education about healthy communities or population health status; and addressing issues of health equity, health disparities, and the social determinants to health.
Prevent the spread of communicable diseases Prevent the spread of communicable disease by preventing diseases that are caused by infectious agents through detecting acute infectious diseases, ensuring the reporting of infectious diseases, preventing the transmission of infectious diseases, and implementing control measures during infectious disease outbreaks.
Protect against environmental health hazards Protect against environmental health hazards by addressing aspects of the environment that pose risks to human health, such as monitoring air and water quality; developing policies and programs to reduce exposure to environmental health risks and promote healthy environments; and identifying and mitigating environmental risks such as food and waterborne diseases, radiation, occupational health hazards, and public health nuisances.
Prepare and respond to emergencies Prepare and respond to emergencies by engaging in activities that prepare public health departments to respond to events and incidents and assist communities in recovery, such as providing leadership for public health preparedness activities with a community; developing, exercising, and periodically reviewing response plans for public health threats; and developing and maintaining a system of public health workforce readiness, deployment, and response.
Assure health services Assure health services by engaging in activities such as assessing the availability of health-related services and health care providers in local communities, identifying gaps and barriers in services; convening community partners to improve community health systems; and providing services identified as priorities by the local assessment and planning process.