2015 Global Macro and Multi-Asset Outlook - Plurimi...
16
2015 Global Macro and Multi-Asset Outlook MMXV
Transcript of 2015 Global Macro and Multi-Asset Outlook - Plurimi...

2015 Global Macro and Multi-Asset Outlook
MMXV

1
For Professional Investors and Advisors only
40% of German bonds currently in issue have a negative yield to maturity.
Apple’s market cap of $650 billion is almost $200 billion larger than the market cap.
of all Eurozone banks.
There are currently 2.5 billion people who need more water than they have access
to. This will rise to 6 billion by 2050 according to the OECD and UN forecasts.
The S&P 500 index has moved step for step with the US Federal reserve balance
sheet since 2009. In October 2014 the Fed announced it was ending Quantitative
easing.
There is 30x more gold than palladium on the planet.
All the platinum ever mined would fit into an average sized living room.
One in every six people in the world is Indian and one in five is Chinese. Developing
economies make up 84% of the world’s population.
80% of the world’s GDP is supported by 0 interest rate policies.
German house prices are down in real terms from 25 years ago.

2015 Global Macro and Multi-Asset Outlook
Equities: We expect mixed performance from
equities. We forecast that US equities will deliver
negative returns based on premium valuations, a
strong USD and a relatively less accommodative
central bank. We anticipate a sharp rally in
European banks, and strength from European
equities with foreign revenues. Large cap. US
technology and European pharmaceuticals are
well positioned for 2015. Europe and emerging
Asia trade at most compelling valuations
Fixed Income: We expect capital losses from
sovereign fixed income with greater than five
years to maturity. Emerging market inflation linked
bonds offer significant real yields, and in euro
terms will likely be 2015’s best performing fixed
income sector. 2014 marked the end of the 30
year fixed income bull market
Currencies: EUR will be the carry trade currency
of choice. The zero interest rate policy and
expansion of ECB’s balance sheet, eventually
through explicit quantitative easing will push
EUR/USD to 1.09 by the end of 2015. JPY will
continue to lose value vs. the USD but strengthen
vs. euro.
Real Estate: We are bullish of listed residential
property companies in Germany. The zero interest
rate policy of the ECB is appropriate for the
Eurozone but will fuel a property bubble in
Germany.
Commodities: We expect positive real yields on
US 10 year bonds will continue to keep negative
pressure on gold prices, while palladium and
platinum will benefit from increased industrial
demand and uncertain supply dynamics.
Alternatives: 2018 Dividend futures on the Euro
Stoxx 50 are trading 50% below consensus
estimates and 15% below 2014 dividend levels.
We expect these futures to deliver very strong
performance in 2015.
Selected forecast returns for 2015 (%)
Source: Plurimi Investment Managers (PIM). Forecasts are based on closing 2/12/2014 values. Expected returns are based on PIM’s proprietary models utilising a combination of valuation, growth, momentum and quality factors.
Current
2015 y/e
forecast
2015 Return (With yield)
S&P 500 2070 2015 -1%
FTSE 100 6717 7000 7%
Euro Stoxx 50 3248 3350 7%
Nikkei 17720 18500 6%
DJ 600 Banks 144 170 23%
Russel 2000 1177 1110 -5%
Euro50 2018
Dividends 108 118 9%
German Residential 100 112 12%
US S&P Utilities 463 430 -5%
EUR/USD 1.24 1.09 -12%
USD/JPY 120 125 +3%
German 10 Year 0.8 1.4 -5%
US 10 Year 2.3 2.6 -1%
UK 10 Year 2.0 2.6 -2%
Brent Oil $70/bbl $80/bbl 5%*
Gold $1200/oz $1070/oz -11%
Platinum $1203/oz 1220/oz 2%
Palladium $804/oz $865/oz 8%
2
The 800 million euro expansion of the ECB’s
balance sheet will be the most important factor
driving asset class performance in 2015.
FX will be a major component of returns in 2015,
helping assets priced in euros and yen.
Over the next market cycle major asset classes
will produce nominal and real returns that are
significantly lower than historic levels.
2015 Outlook

2015 Outlook
2014 Review
During 2014 we saw the global economy grow by approximately 3% with about 3% inflation. These numbers
are in line with 25 year global averages, but regionally there were significant divergences. The Eurozone saw
growth of less than 1%, the US grew slightly more than 2%, the UK grew by 3% and the Chinese economy
continued to expand by about 7.5%. Developed economies experienced inflation at slightly more than 1% while
emerging markets saw inflation rates of about 5%.
Developed central bank monetary policy was without exception accommodative in 2014, however in the fourth
quarter of 2014 the US Federal Reserve (Fed) ended quantitative easing (QE) supported by solid economic
data. In sharp contrast, the European Central Bank (ECB) announced plans to significantly expand its balance
sheet and the Bank of Japan (BoJ) responded to slower-than-desired inflation dynamics with an acceleration of
its programme of qualitative and quantitative easing (QQE).
Policy Outlook
We expect central bank policy will continue to be the most important driver of asset class returns in 2015 and
for several years to come. Of all policies the most important for investors is the end of the Fed’s balance sheet
expansion and the rebuilding of the ECB’s balance sheet. ECB President Mario Draghi has suggested EUR
800 million will be added to the ECB’s balance sheet to get back to its early 2012 levels. An accommodative
stance on monetary policy is needed in Europe as Germany seems unlikely to loosen its current budget plans
leaving the onus on monetary policy to reflate the Eurozone economy.
0
500000
1000000
1500000
2000000
2500000
3000000
3500000
4000000
4500000
5000000
01/03/1999 01/03/2002 01/03/2005 01/03/2008 01/03/2011 01/03/2014 01/03/2017
FEDBalance
ECBBalance
ECB and Federal Reserve Balance Sheets ($ Millions)
Based on ECB
announcement
in October
2014
If explicit
quantitative
easing is
undertaken
Key Investment Chart for 2015
Source: Bloomberg, Plurimi Investment Managers estimates
The ECB saw its balance sheet contract
in 2012 and 2013. We believe this was
the unintended consequence of interest
rate policies which led to early repayment
of the ECB’s long-term refinancing
operations (LTRO) by euro-zone banks.
The shrinking balance sheet was
essentially a tightening of monetary
conditions and led to a very strong euro
in 2012 and 2013, despite the very poor
economy and financial conditions within
the Eurozone. The effect of the trillion
dollar expansion of the ECB balance
sheet should not be underestimated. The
impact will offset the previous contraction
and we expect improved financial
conditions in the Eurozone, in a similar
scale to those regions which have
implemented significant QE over previous
years.
“We will do whatever it takes” Mario Draghi July 2012
This is what it takes….
3

Economic Outlook
There are a wide range of forces that will shape the economic outlook in the coming years, including
demographics, fiscal and monetary policies, geopolitics, technological advances and trade relations between
countries.
7 Year forecastGDP (% per
annum)
Inflation (%
per annum)
United States 2.3 2.7
Eurozone 1.3 2.2
United Kingdom 1.8 2.8
Switzerland 1.7 2.1
Japan 0.6 2.0
Developed Asia 4.0 3.9
Emerging Markets 4.9 5.0
Two years ago we worried that massive levels of
balance sheet expansion and unconventional
global policy would lead to pressures that would
unleash inflationary consequences across the
globe. In fact, inflation has trended lower, while
the implications of dis-inflation and the threat of
deflationary pressures in Europe grow more
likely as we enter 2015. We do not expect this to
change in the coming year, but do expect the
embers of inflation to begin to light towards the
end of the decade as loose policy will be carried
on for too long.
In 2015 we expect Europe will avoid deflation
and recession through proactive monetary
policies, and some fiscal stimulus from slippage
on budgets. China, the U.S. and India will
continue to be the primary engines of global
growth. Over the coming 7 years we expect a
long deleveraging cycle will lead to developed
market growth slightly below the historic 25 year
average. We expect higher inflation and more
restrictive monetary policy towards the end of the
cycle, but low inflation will keep global monetary
policy very easy in 2015. The Federal Reserve
(Fed) and the Bank of England (BOE) is likely to
start normalising short-term rates in the third or
fourth quarter of 2015.
2015 forecastsGDP (% per
annum)
Inflation (%
per annum)
United States 2.8 1.5
Eurozone 1.1 0.7
United Kingdom 2.6 1.8
Switzerland 1.4 0.7
Japan 1.2 1.7
Developed Asia 4.0 3.0
Emerging Markets 5.5 5.0
30
60
90
120
01/01/1991 01/01/1997 01/01/2003 01/01/2009 01/01/2015
US
UK
Euro
Source: Bloomberg, International Monetary Fund
Based on IMF forecasts, the developed
world has managed to stabilize
debt/GDP ratios. Much of the developed
world remains with debt levels above
the generally accepted level of
sustainability of 80% of GDP. Should
deflation occur it would pose a
tremendous risk to debt sustainability.
We believe central banks will continue
proactive policies to reflate the global
economy, and view deflationary risks as
much more serious than the possible
inflationary consequences of current
policies.
Gross Debt/GDP
4
2015 Outlook
Source: mrb, Plurimi Investment Managers estimates

Economic and Policy Outlook
Our expectation is that the global economic expansion will continue but remain relatively subdued and
deflationary pressures will continue to exist within the Eurozone. We expect central banks will only normalise
policy once they are absolutely convinced we are on the path to sustainable growth, meaning short term
interest rates will remain near zero for most of 2015. All of this sounds very good for fixed income. However the
most important component is the starting yield. Risk aversion has remained at elevated levels following the
financial crisis. Economic and policy uncertainty has led investors to keep significant amounts of cash un-
invested and made them reluctant to rotate into growth assets. Defensive yield plays, have pushed government
bond yields to record lows. Such low yields increase the odds of capital losses in 2015, and make the
possibility of positive real returns over a market cycle close to non-existent.
Mario Draghi’s message to the world could not be clearer. Faced with the need to halt persistently decelerating
inflation, Mr. Draghi has shown a clear willingness on the part of the ECB to help the Eurozone
economies. Over the past two years the ECB has shifted its focus from stabilizing the financial system and
saving the monetary union from collapse to combating weak growth and excessively low inflation. Zero interest
rates influenced by private sector weakness is of benefit to the broader financial system.
Economic anxiety has made corporates hesitant to increase capital spending in recent years, despite the
rebound in corporate profits and record low borrowing rates. There is evidence that this is improving, led by
capital spending in the U.S. Central bank policy is addressing private sector deleveraging pressures and the
financial systems. The non-financial business sector is generally healthy and the ultra-accommodative policy
should begin to create longer-term capital spending projects as the economic expansion within the US
continues to gain traction.
Summary
• Modest acceleration in global growth to slightly above 3%.
• Cheap oil and policy fuelling growth.
• Global Inflation to remain subdued.
• China to slow but will remain second biggest contributor to global growth.
The growth picture in Japan and the Euro area remain vulnerable but we expect both these economies to
perform better in 2015. Easing financial conditions will be designed to increase lending, lower oil prices and
increasingly competitive currency dynamics will facilitate growth. Despite our somewhat optimistic view we do
acknowledge there is a real downside risk scenario in the Eurozone and deflationary pressures will remain.
Should the ECB fail to deliver on its balance sheet expansion pledges or slow its reflationary policies, our
expectations for some growth in the Eurozone would change.
China’s housing and credit imbalances are of particular risk to their overall economic performance and it is
against these risks that portfolio protection may prove to be most useful.
Key Risks
• ECB failing to deliver.
• Europe’s inability to avert further deterioration.
• Adverse geopolitical developments.
• China slowing more than expected.
5
2015 Outlook

Equity Outlook
The US Federal Reserve balance sheet has tripled since early 2009, driven by QE1, QE2 and QE3 and it
currently sits at about $4.5 trillion. The S&P 500 has closely tracked this growth over the past five years, and
you can argue that the most significant moves in equities have come from the announcements of the various
QE programs implemented by the Fed.
S&P 500 and Federal Reserve Balance Sheet
600
800
1,000
1,200
1,400
1,600
1,800
2,000
1,500,000
2,000,000
2,500,000
3,000,000
3,500,000
4,000,000
4,500,000
2009 2010 2011 2012 2013 2014
FED Reserves SPX
In October 2014 the Fed ended its QE
policy, and now only rolls over maturing
bonds rather than engaging in new asset
purchases. The liquidity boost and
positive environment for risk assets since
the balance sheet expansion began has
led to the S&P 500 rising by more than
180% from the February 2009 lows.
Since the beginning of QE, S&P 500
earnings per share have doubled, and
during the same period the earnings
multiple on the S&P 500 has risen by
60%. Going forward we expect S&P 500
earnings growth to roughly track U.S.
economic growth. Profit margins were
already near record levels in 2014 and
hoping for further expansion requires
optimism which is not supported by the
current pricing environment. Falling
energy prices will be a net positive for
profit margins, but reduced slack in the
labour force and an economy which is not
strong enough to force significantly higher
prices will lead to margins in line with
2014. By the end of 2015 we expect the
S&P will trade at 15.5x our 2016 forecast
of $130 per share, leaving it at 2015 at
year end.Without QE fuelling equity returns, we believe the US
will see broad indices fall slightly in 2015.
• Equities will provide lower returns than recent years but will outperform bonds in 2015.
• US Equity valuations are no longer compelling and future returns will be driven by growth rather than multiple
expansion.
• The regions with the most supportive monetary policy will deliver the strongest local currency returns.
• European Banks will benefit from low valuations and very accommodative central bank policy.
• Asian equities are trading below average valuations and will benefit from much lower oil prices and global
economic recovery.
Summary
6
2015 Outlook
Source: Bloomberg, PIM

We expect global earnings to moderately improve in 2015, consistent with our positive global economic
forecast. Consensus earnings forecasts are still ahead of our own but have fallen towards levels which may be
possible following a raft of estimate reductions in October.
0
10
20
30
40
50
60
S&P 500INDEX
RUSSELL2000
INDEX
EuroStoxx 50
Pr
STXE 600 € Pr
FTSE 100INDEX
SWISSMARKETINDEX
MSCIASIA
APEX 50
MSCI EM TOPIXINDEX
(TOKYO)
MSCIJAPAN
+/- 1 SD 10Y Average Current
0
5
10
15
20
25
S&P 500INDEX
RUSSELL2000
INDEX
EuroStoxx 50
Pr
STXE 600 € Pr
FTSE 100INDEX
SWISSMARKETINDEX
MSCIASIA
APEX 50
MSCI EM TOPIXINDEX
(TOKYO)
MSCIJAPAN
+/- 1 SD 10Y Average Current
Equities benefit from global growth, look
much better priced than bonds, and will
have policy remaining supportive for most
of the coming year. Our main concerns
with equities are based around current
valuations. On an earnings basis
American and European shares ended
2014 trading at significantly higher
multiples than their 10 year averages. On
a trailing earnings basis the US market is
trading at 19x and small cap companies
ended the year at 52x trailing earnings.
U.S. dollar strength has led to euro area
earnings expectations to edge higher and
Japanese earnings are rising in local
currency terms. We expect this will create
a significant tailwind for Japanese and
Eurozone earnings and equity prices in
2015.
On a consensus 1 year forward basis, US
and European equities are also trading
significantly above their 10 year averages.
The rally in equities has pushed most
regions above 10 year average earnings
multiples, with the US and Europe both
trading more than 1 standard deviation
above their mean at the end of 2014.
Asian equities are trading at small
premiums to European stocks, but at
significant discounts to American multiples
and also below their 10 year average
multiple.
We believe that the P/E multiple
expansion phase of current bull market is
over in the United States. As 3Q ends we
expect the market will be pricing in future
FED hikes and historically the P/E
multiple contracts by about 9% after the
initial Fed hike
Trailing P/E
One year forward P/E estimate
2015 S&P 500 Target
2016 eps of $130 * 15.5 multiple = 2015
7
2015 Outlook
Source: Bloomberg, PIM
Source: Bloomberg, PIM

Multiples of book values also show US equities trading above 10 year averages, while Europe and Asia are
below historic multiples. Trading at almost 2.8x book value, the S&P will need to deliver very high returns on
equity for an extended period of time to justify these multiples.
0.6
1.1
1.6
2.1
2.6
3.1
S&P 500INDEX
RUSSELL2000
INDEX
EuroStoxx 50
Pr
STXE 600 € Pr
FTSE 100INDEX
SWISSMARKET
INDEX
MSCIASIA
APEX 50
MSCI EM TOPIXINDEX
(TOKYO)
MSCIJAPAN
+/- 1 SD 10Y Average Current
Low interest rates and record profit
margins have created an environment
where the market is trading significantly
above book value in The U.S.
At 2.8 x book the S&P must maintain
record profit margins, and continue to
grow earnings at near double digit rates.
Fair Value P/B = (ROE – growth)/(Cost of
Equity– growth)
We are sceptical that earnings growth
will significantly outstrip economic
growth and as the Fed eventually moves
towards higher rates we expect a
reversion toward the mean on global
P/B ratios.
1 year forward P/B estimate
The macro forces that are likely to prevail over the cyclical horizon favour Asian and European equities over
their U.S. counterparts, and the Eurozone is likely to be a prime beneficiary of this coming rotation.
Japan
Europe
UK
US
Excess Profit (PoE-CoE)
3 6 9 12
0.2
1.0
0.4
0.6
0.8
Log of P/B vs. Excess Profit
Equities expensive
Equities Cheap
We expect global equities to generate
a total return of 7% in local currency
terms in 2015. Global valuations are in
line with historic norms, but slightly
overvalued in regions which have
already engaged in balance sheet
expansion. We expect regions now
beginning or in the midst of this
process will see the best performance.
Earnings growth will be strongest in
Japan and Continental Europe, as
both regions benefit from
currency weakness.
7
2015 Outlook
Source: Bloomberg, PIM
Source: Bloomberg, PIM

Fixed Income Outlook
Government bonds have had a strong 2014 after selling off in 2013. We believe this reflects the tug of war
between global deleveraging, disinflation, excess savings, a strengthening global economy and expected
policy moves resulting in higher interest rates in the US and UK next year.
On Fed policy the market is currently priced for the Fed to start hiking in Q4 and raise the policy rate to 0.5-
0.6% by the end 2015 and 1.5% by the end of 2016. Consensus is below the “Fed dots” and we also believe
short term rates will not be raised as quickly as the Fed dots indicate. We do however, expect 10 year US
bond yields to rise over the coming year at rate slightly faster than forward pricing. Despite the recent growth
scare, most current data suggests that the global economic expansion is continuing and may even be
strengthening. This will put upward pressure on real bond yields.
10-Year Government Bond Yield (%)
Fair Value Measure** (%)
8
2
4
6
10
1990 2000 2010
Poor value
Good value
Fixed income generally does not offer many compelling investment opportunities, however we expect corporate
bonds will outperform government bonds in 2015. High yield spreads have widened since the June lows. Given
our positive economic views we expect to see high-yield spreads fall back to where they bottomed in mid 2014.
Investment grade spreads are less compelling, but should still narrow on the back of stronger growth and this
will be more than offset by rising government yields.
An improving global trade cycle will encourage EM bond spreads to narrow further. Inflation linked bonds from
emerging markets offer real yields of almost 3%. 2015 may not see emerging market currencies appreciate
meaningfully vs. the USD, but over the longer term higher economic growth, better demographics and lower
levels of debt will all lead to currency appreciation.
We expect the first Fed rate
hike to occur in Q4 2015, and
signal the beginning of the
end for ultra-accommodative
policy, and the end of the 30
bond bull market.
8
2015 Outlook
Source: Bloomberg, MRB, PIM

Commodities Outlook
Commodities have been the worst performing asset class in 2014. The chart below shows that almost every
commodity is below its 10 year average price as we exit 2014, with only Palladium more than 1 standard deviation
above its 10 year average price.
Oil: We expect oil prices to be significantly higher by the end of the year, but continued weakness at the beginning of
2015 would not be a surprise. Demand growth will eventually cut into the current supply glut of oil, but while OPEC
has removed itself from supporting prices we can see short term weakness. We anticipate global oil demand
accelerating in 2015 on lower prices and expanding global recovery. Geopolitics will influence prices and there are
both positive and negative scenarios for the price of oil. By the end of 2015 we expect Brent to be trading at $80/bbl.
0
0.2
0.4
0.6
0.8
1
1.2
1.4
1.6
1.8
Commodities (10Y Average = 1)
+/- 1 SD 10Y Average Current
Precious Metals
With US 10 year bonds above rates of inflation, and the macro economic backdrop strong enough to hurt safe
haven demand we believe there is little incentive for investors to own gold. The outlook for platinum and
palladium are much better. Palladium supply/demand has been in deficit for years. This gives a firm
foundation for further price gains going forward. We expect industrial demand to continue to be strong and
supply will continue to face risks of disruption with South Africa and Russia being the largest producing
regions.
Platinum and palladium long term supply is more price-sensitive than long-term demand, while short term
supply is less influenced by the spot price. We estimate that over 25% of palladium being currently produced
is done at higher costs than spot prices. We expect that prices will move higher over the coming year, or else
there will be a supply response.
9
2015 Outlook
Source: Bloomberg, PIM

100
110
120
130
140
150
160
170
180
2014 2015 2016 2017 2018 2019 2020
Future
Consensus
EURO STOXX 50 dividends are close
to levels from 2009 while S&P 500
are 75% above their 2007 peak. The
AQR/ stress test of banks and more
clarity on solvency II should support
financials’ capacity to increase
dividends in the coming years.
Structured product demand on the
Euro Stoxx 50 has led to futures
becoming inverted. As banks sell
dividends following sales on products
that are on price return index. We
expect double digit annual returns for
the 2016,2017 and 2018 dividend
futures.
Germany's housing market is
the third cheapest globally,
according to the OECD
0 20 40 60 80 100 120 140 160
Japan
Germany
USA
Ireland
Switzerland
Portugal
Greece
Denmark
Austria
Italy
Spain
Australia
Sweden
UK
New Zeland
Netherlands
Canada
France
Belgium
House price to income ratio (%)
Property and Alternatives Outlook
We believe the German residential market is in the midst of an extended capital growth path. The German
economy is much stronger than the Eurozone average. The ECB policies are appropriate for the Eurozone but
risk creating much higher property prices in Germany. Deutsche Annington has recently agreed to take over
rival Gagfah creating Europe’s second largest property company. We expect this will see Deutsche Annington
become a member of the Dax index in 2015. Residential property yields 4-5% in German centres, and with
borrowing costs for large companies effectively below 2% we expect higher property prices in the coming
years. Almost half of German government bonds are at negative yields and 60% of German pension fund
assets in bonds (according to the OECD). We expect there will be a shift into other fixed income proxies, such
as REITs. Even in Munich the high-end apartments are selling for 20% of Prime London prices.
10
2015 Outlook
Source: Bloomberg, BNP, PIM
Source: Bloomberg, Goldman Sachs, PIM
EURO STOXX 50 dividends (Futures and Consensus)
13
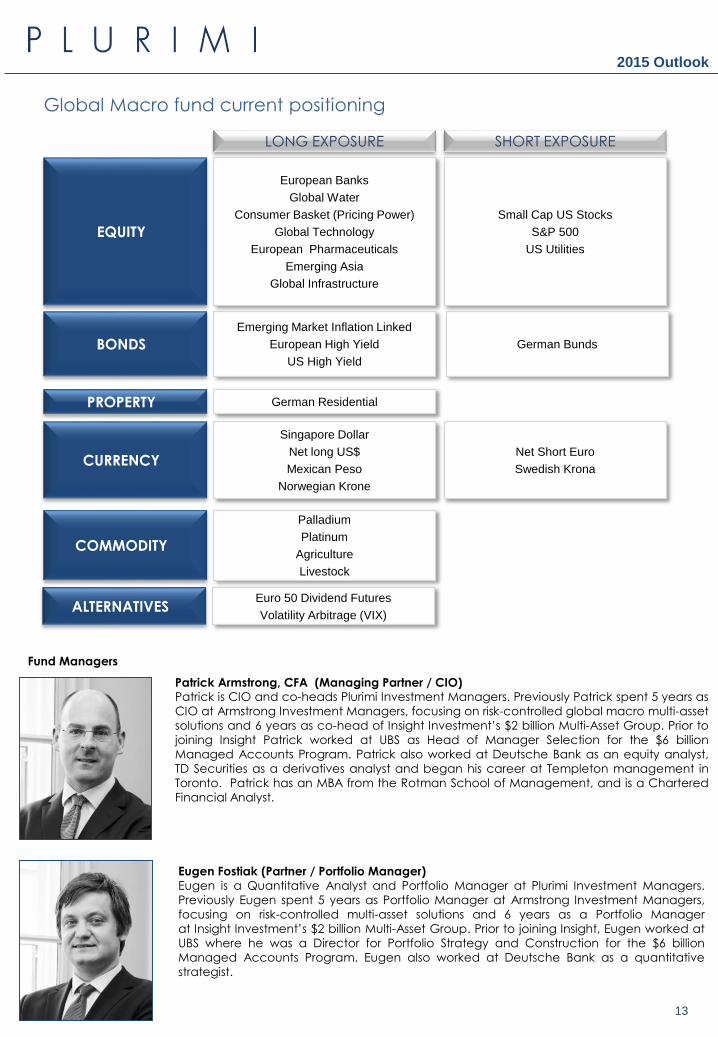
LONG EXPOSURE SHORT EXPOSURE
EQUITY
BONDS
ALTERNATIVES
PROPERTY
CURRENCY
COMMODITY
European Banks
Global Water
Consumer Basket (Pricing Power)
Global Technology
European Pharmaceuticals
Emerging Asia
Global Infrastructure
Small Cap US Stocks
S&P 500
US Utilities
Emerging Market Inflation Linked
European High Yield
US High Yield
Euro 50 Dividend Futures
Volatility Arbitrage (VIX)
German Residential
Singapore Dollar
Net long US$
Mexican Peso
Norwegian Krone
Net Short Euro
Swedish Krona
Palladium
Platinum
Agriculture
Livestock
Global Macro fund current positioning
2015 Outlook
German Bunds
Fund Managers
Patrick Armstrong, CFA (Managing Partner / CIO)Patrick is CIO and co-heads Plurimi Investment Managers. Previously Patrick spent 5 years as
CIO at Armstrong Investment Managers, focusing on risk-controlled global macro multi-asset
solutions and 6 years as co-head of Insight Investment’s $2 billion Multi-Asset Group. Prior to
joining Insight Patrick worked at UBS as Head of Manager Selection for the $6 billion
Managed Accounts Program. Patrick also worked at Deutsche Bank as an equity analyst,
TD Securities as a derivatives analyst and began his career at Templeton management in
Toronto. Patrick has an MBA from the Rotman School of Management, and is a Chartered
Financial Analyst.
Eugen Fostiak (Partner / Portfolio Manager)
Eugen is a Quantitative Analyst and Portfolio Manager at Plurimi Investment Managers.
Previously Eugen spent 5 years as Portfolio Manager at Armstrong Investment Managers,
focusing on risk-controlled multi-asset solutions and 6 years as a Portfolio Manager
at Insight Investment’s $2 billion Multi-Asset Group. Prior to joining Insight, Eugen worked at
UBS where he was a Director for Portfolio Strategy and Construction for the $6 billion
Managed Accounts Program. Eugen also worked at Deutsche Bank as a quantitative
strategist.

Utilities
Tech
MaterialsIndustrial
Staples
Discretionary
Energy
Health
Financial
0
0.1
0.2
0.3
0.4
0.5
0.6
0.7
0 2 4 6 8 10 12 14 16 18 20
US Equity Valuations by Sector
Excess Profitability (RoE - CoE)
log (
P/B
V)
11
2015 Outlook
APPENDIX
Source: Bloomberg, PIM
The US market has moved from 8 out of 9 sectors trading
below fair value in 2008 to 3 out of 9 in 2014.
Within the US we are long technology which has seen higher
profitability match higher valuations, while utilities have
seen valuations increase while excess profit has fallen
slightly.

NOTES
13

Issued by Plurimi Investment Managers (“PIM”), a trading name of Plurimi Wealth LLP
which is authorized and regulated by the Financial Conduct Authority with FCA number
466728. This presentation is aimed at "Investment Professionals" as described in Article
19 of the Financial Services and Markets Act 2000 (Financial Promotion) Order 2001 (as
amended). It is aimed mainly at "authorised" and "exempt" persons as defined in The
Financial Services and Markets Act 2000. Any other recipients of this presentation
should disregard its contents and should not rely on it. The information contained in this
presentation is given without any liability whatsoever to PIM or any of its related entities
or their respective members or officers, and is not intended to constitute legal, tax or
accounting advice or opinion. No representation or warranty, expressed or implied, is
made as to the accuracy, completeness or thoroughness of the content of the
information. The recipient should consult with its own legal, tax or accounting advisers as
to the accuracy and application of the information contained herein and should conduct
its own due diligence and other enquiries in relation to such information. The information
in this presentation has not been independently verified by PIM. PIM disclaims any
responsibility for any errors or omissions in such information, including the financial
calculations, projections and forecasts set forth herein. No representation or warranty is
made by or on behalf of PIM that any projection, forecast, calculation, forward-looking
statement, assumption or estimate contained in this presentation should or will be
achieved. This presentation does not carry any right of publication. This presentation is
incomplete without reference to, and should be viewed solely in conjunction with, the oral
briefing provided by PIM. Neither this presentation nor any of its contents may be
reproduced or used for any other purpose without the prior written consent of PIM.
Disclaimer
This fact sheet is aimed at authorised and expert persons only under the Financial Services and Markets Act 2000 and members of the public should disregard its contents. Clients
should be informed of the risks of investing. The value of your investment may fall as well as rise and is not guaranteed. Past performance is not an indicator of future performance. Full
details of the risks can be found in the Fund Prospectus which can be obtained from PIM. Nothing in this document should be construed as investment advice. Issued by Plurimi
Investment Managers (“PIM”), a trading name of Plurimi Wealth LLP which is authorized and regulated by the Financial Conduct Authority with FCA number 466728.
11 Waterloo Place, London, SW1Y 4AU United Kingdom +44 (0) 207 484 3340 [email protected] www.plurimi.com