2015 Economic Outlook Briefing
48
Welcome to the 2015 Economic Outlook Briefing Presented by Town of Chapel Hill Economic Development #EOB15 @CarolinaChamber @CHEconDev
-
Upload
chapel-hill-carrboro-chamber-of-commerce -
Category
Economy & Finance
-
view
214 -
download
1
Transcript of 2015 Economic Outlook Briefing

Welcome to the 2015 Economic Outlook Briefing Presented by Town of Chapel Hill
Economic Development
#EOB15
@CarolinaChamber
@CHEconDev

Pam Herndon, State FarmChair, Economic Development & Public Policy Committee
Economic Outlook Briefing Greening Sponsor

Our Presenting Sponsor

Our Keynote Sponsor

Our Breakfast Sponsor

Q&A Sponsor

Greening Sponsor

Community Investors


And our newest Gold Sponsor…

Dwight BassettEconomic Development Officer, Town of Chapel Hill

Chandler BurnsSenior Vice President, Commercial Banking
Chapel Hill City President

Gregory MillerSunTrust Bank
Chief Economist
Economic Outlook1Q 2015
Gregory Miller
Chief Economist
Economic Outlook
OIL Bust!

Monetary Policy: Transmission Back to “Short-end”
Fed funds increases in June.
o Fed officials quotes saying Fed drops “patience” at March
FOMC and installs first rate rise at June FOMC.
o Market response to rumor mild so far.
Fed: Rates back to neutral.
o As FF rate moves up, other rates rise but less.
o Typical Fed tightening:
• Fed funds rises 325 BP
• UST 2-year rises 300 BP
• UST 10-year rises 150 BP
• Yield curve “flattens” 150 BP

Monetary Policy: Transmission Shift is Material
Bond purchase shut down last fall; now shifts liquidity
transmission from long-end to short-end of yield curve.
o Bond purchases were transmitted to large investors.
o Small business and households borrow through banks.
Rising Rates not the same as High Rates.
Bank lending accelerates during initial phase.

Oil: In Economics, All Roads Lead Back to Price
The drop in oil prices is a profound positive for US economic growth, but,
as with so many economic phenomena, there are winners and losers
Price fells $63, almost 2/3’s, in 200 days.
$50 oil implies US gas price at $2.25.
o $40 oil implies gasoline price at $2.00
40
50
60
70
80
90
100
110
120
2.00
2.20
2.40
2.60
2.80
3.00
3.20
3.40
3.60
3.80
4.00
Feb
20
10
Jun
20
10
Oct
20
10
Feb
20
11
Jun
20
11
Oct
20
11
Feb
20
12
Jun
20
12
Oct
20
12
Feb
20
13
Jun
20
13
Oct
20
13
Feb
20
14
Jun
20
14
Oct
20
14
Feb
20
15
USD
pe
r B
arre
l, N
SA
USD
pe
r ga
l, N
SA
Crude Oil
Motor gasoline prices:Unleaded gasoline
West TexasIntermediate

Oil: A Mitigated Good
Winners
US Consumer and US Business – an “after-tax, tax cut”
o Implied per driver saving: $1,200 per year.
o Vs. $234 average nominal wage gain since the expansion began.
US Auto industry. It’s all about the adverse mix
o In the post-OPEC period from 1977 to 2000 light trucks were 32% of vehicle sales.
o Since oil prices plummeted, light trucks are 52% of vehicle sales.
o Gross margins on light trucks 3- to 4-times higher than margins on small economy cars.

Oil: There are always losers
Losers
US Fracking and small producers. Need oil at $75 to pump.
o Technology & infrastructure spending boom: $640 billion to $1.8 trillion over the
next 2 decades – triple the amount spent over the prior 2-decade.
o 3,200 high-paid net jobs lost, to date.
Russia: In recession; Ukraine sanctions cost half of GDP growth.
o Oil industry is 50% of domestic economy.
o Ruble crushed.
Venezuela: Socialist government depends on crude oil to pacify population.
o Budget deficit 12% of GDP.
o Cuba’s partner in Florida Straits deep water oil exploration.
Iran: Nuclear program sanctions expensive.
o Sanction generate 8.6% GDP loss since 2006.

Inflation? Deflation? Horns of a Dilemma
Deflation is still a low risk/high impact event.
The Fed’s measure is Core-PCE.
Hyper-inflation risk is lower and farther out on the horizon.
Contemporary US inflation is driven by capacity.
o Services sector prices are rising about 2.0%.
o Goods sector is deflating -1.1%.
o Wages have only begun to rise.
Falling oil is not deflationary, immediately.
o Oil lag to Core-PCE is 1.5 to 2 years.
o The Globe is deflationary. The dollar is the linkage.

US$: Pits Exporters against Consumers
Strong dollar reduces US exports;
o export producers unable to shift to domestic sales, production slows,
jobs suffer.
Weak bilateral currencies drop $-prices to sustain trade;
o US consumers benefit.
Unstable global currencies risk collapse.
60
70
80
90
100
110
120
130
2010 2011 2012 2013 2014 2015
Currencies: US Trade Weighted Dollar Index, Euro, Yen (Indexed to 100 = March 2009)
United States Dollar Index Euro Yen

Back to the fundamentals: US Returns to Normal
The US economy is in acceleration mode
o 2015 GDP should grow 3.5%+.
o Slowdown by mid-2016 as production and labor market hit capacity
constraints.
o However, significant risks persist.
Acceleration Drivers.
o The Fed buries QE3 and begins grooming successor: Bank Lending.
o Business spending re-accelerates.
o Housing adds sales to production.
o Government contributes.
o Energy supports low business and household cost.
o Global malaise boosts US.

Four Significant Risks
Cycle risk is high. There is a recession out there somewhere.
o The expansion has been running for five years.
o Normal cycle dynamics have been running for six years.
Credit transmission.
o Bank Lending to replace QE.
o Mortgage finance hinders home sales; housing needs easier access to mortgages.
The most likely risk of failure: Government continues in recession.
The most dangerous risk: Consumer Spending.
o Resources stretched thin.
o Wages no longer include pay for productivity.
o Business assigns 102% of productivity gains to profit.
o Management’s wage bargain: “If you’ll work at 102% of capacity we won’t fire
you first.”

Job gains late but now formidable
-1000
-800
-600
-400
-200
0
200
400
600
Feb2000
Feb2002
Feb2004
Feb2006
Feb2008
Feb2010
Feb2012
Feb2014
Jobs Accelerating but...
Employment: JobGrowth, (Ths., SA)
Jobs returned. But labor market remains nettlesome.
o Skill dearth and Inexperience.
o Wages no longer stagnant, but gains are weak, and…
o Gains are dominant in only a few skills or industries.
o Labor force faces demographic and economic inflection.

Most Dangerous Risk: Consumer Spending
Media tells us: “Consumers are OK,” i.e., “growing at a modest pace.”
We suggest: 2% consumer is not healthy. Consumer should grow 4%.
o Non-durables and services are particularly weak.
o Were it not for autos, durable goods spending would also be weak.
• And a 17 million run rate for unit auto sales is unsustainable.
% y/y
Personal
Consumption
Durable
Goods
Non-durable
Goods Services Autos
Typical 1974 to 2007 3.8 7.1 2.9 3.6 6.6
Current Expansion 3Q09 to 3Q14 1.8 5.8 1.4 1.4 12.1Source: BEA; STIEcon
Consumer Spending: Growing "Half" as Well as We Should Expect

Home Sales: Positive but multifaceted underperformance
Home sales increasing 0.7% five years into expansion.
o 1990 - 2005, home sale grew an average 4.6%.
Affordability is high. Production is slowing with inventories up.
Home Ownership hasn’t been so low since the mid-1990s…
o … When mortgage rate averaged 9.5%!
Young Fall Hard Millennials Alienated
75
85
95
105
115
125
135
198
2
198
3
198
4
198
5
198
6
198
7
198
8
198
9
199
0
199
1
199
2
199
3
199
4
199
5
199
6
199
7
199
8
199
9
200
0
200
1
200
2
200
3
200
4
200
5
200
6
200
7
200
8
200
9
201
0
201
1
201
2
201
3
Ind
ex:
1982 =
100
Young Homeownership Falls Hardest
<25 years 1st time 35 years 1st move up
45 to 54 years Prime move up > 65 years move down

Brief digression on US Global Status
US global economic status unrivaled.
It’s not even close -- Really
o Population % of globe: 5%
o Largest global producer: 25%
o Largest global consumer: 35%
o Largest global wealth holder: 40%
o Deepest global capital markets.
o Strongest global productivity.
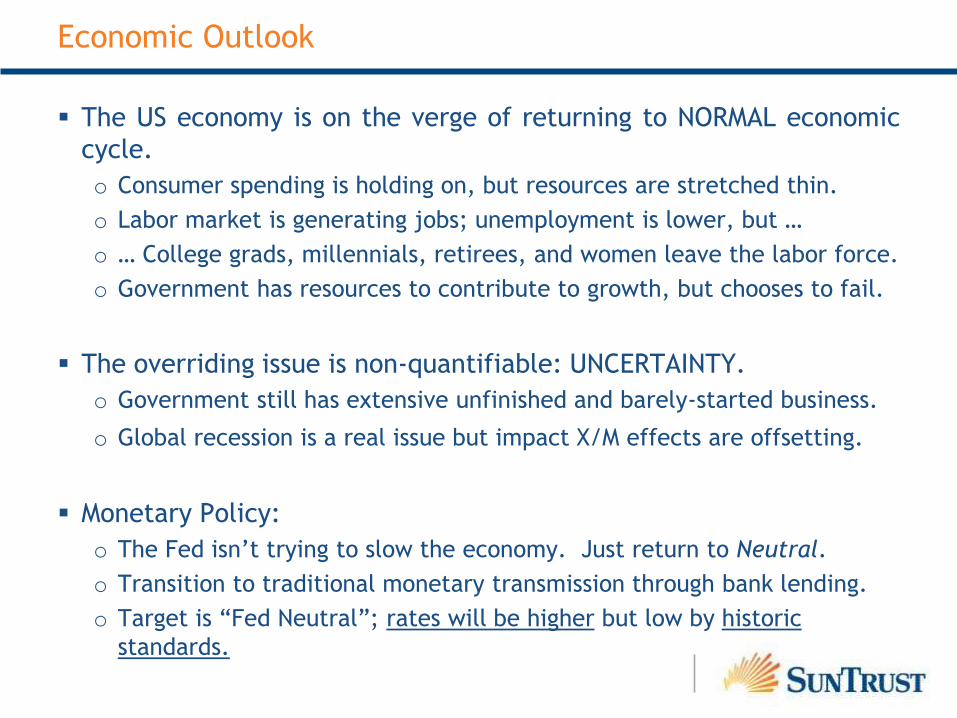
Economic Outlook
The US economy is on the verge of returning to NORMAL economic
cycle.
o Consumer spending is holding on, but resources are stretched thin.
o Labor market is generating jobs; unemployment is lower, but …
o … College grads, millennials, retirees, and women leave the labor force.
o Government has resources to contribute to growth, but chooses to fail.
The overriding issue is non-quantifiable: UNCERTAINTY.
o Government still has extensive unfinished and barely-started business.
o Global recession is a real issue but impact X/M effects are offsetting.
Monetary Policy:
o The Fed isn’t trying to slow the economy. Just return to Neutral.
o Transition to traditional monetary transmission through bank lending.
o Target is “Fed Neutral”; rates will be higher but low by historic
standards.
Economic Outlook1Q2015
Prepared by Chief Economist Gregory Miller. Material we present here is based upon information available on
the date of publication. We believe our data is reliable. However, we do not represent that it is accurate or
complete. We solicit no action based upon this material. Opinions we express are our judgment as of this date
and may change.
Economic Outlook
OIL Bust !

Aaron NelsonPresident & CEO
Chapel Hill-Carrboro Chamber of Commerce

How Has the Current State of the Economy Effected Your Organization
43.6%
22.4%
50.4% 49.9%
6.1%
27.6%
0.0%
10.0%
20.0%
30.0%
40.0%
50.0%
60.0%
Q4 2008 Q2 2009 Q1 2012 Q1 2013 Q1 2014 Q1 2015
Negatively Not Much Positively

21.1%
61.4%
15.8%
1.7%
Good Growth
Moderate Growth
Remain Flat
Decline
Given the state of the local economy, how do you expect your organization to
perform over the next 12 months

80.7%
17.6%
1.7%0.0%
10.0%
20.0%
30.0%
40.0%
50.0%
60.0%
70.0%
80.0%
90.0%
Increase No Change Decrease
How do you expect your organiation's sales to change during the next 12 months
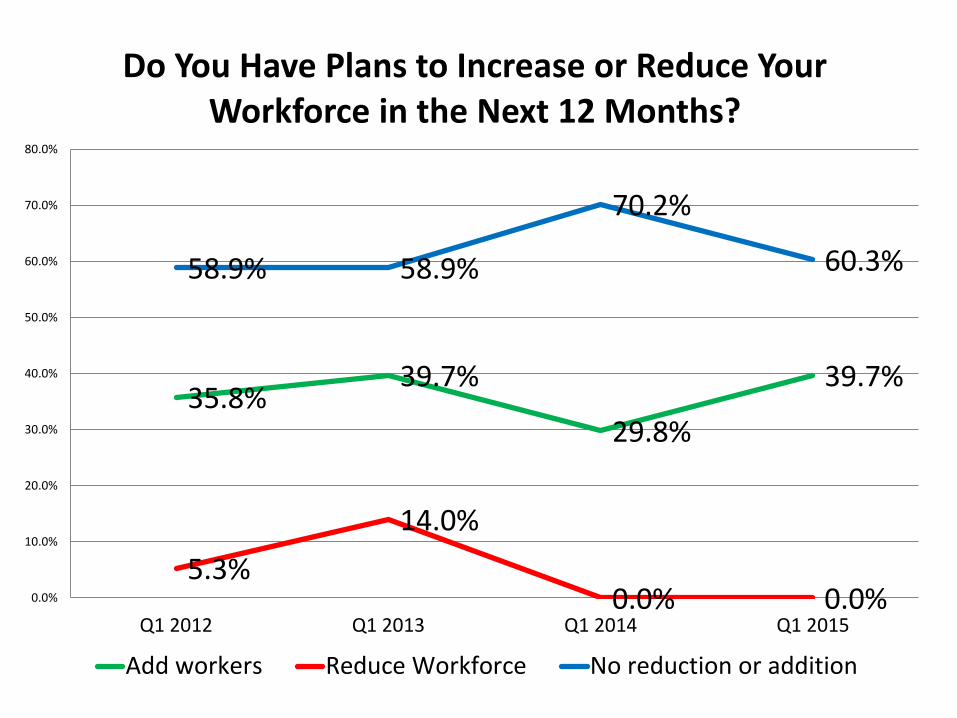
35.8%39.7%
29.8%
39.7%
5.3%
14.0%
0.0% 0.0%
58.9% 58.9%
70.2%
60.3%
0.0%
10.0%
20.0%
30.0%
40.0%
50.0%
60.0%
70.0%
80.0%
Q1 2012 Q1 2013 Q1 2014 Q1 2015
Do You Have Plans to Increase or Reduce Your Workforce in the Next 12 Months?
Add workers Reduce Workforce No reduction or addition

13.8%
50.0%
17.2%
15.5%
3.5%
0.0% 10.0% 20.0% 30.0% 40.0% 50.0% 60.0%
Very Pro-Business
Somewhat Pro-Business
Neutral on Business
Somewhat Anti-Business
Very Anti-Business
Thinking About the Local Business Climate, Would You Say the Local Government Here is

94.2%
1.9% 1.9% 1.9%0.0%
10.0%
20.0%
30.0%
40.0%
50.0%
60.0%
70.0%
80.0%
90.0%
100.0%
100% 90% 50% 25%
What Percentage of Your Employees Earn More the Minimum Wage

56.0%2.0%
4.0%6.0%
4.0%2.0%
10.0%6.0%
8.0%2.0%
0.0%
0.0% 10.0% 20.0% 30.0% 40.0% 50.0% 60.0%
100%
90-99%
80-89%
70-79%
60-69%
50-59%
40-49%
30-39%
20-29%
10-19%
0-9%
What Percent of Your Employees Earn More than $12.76 Per Hour Worked
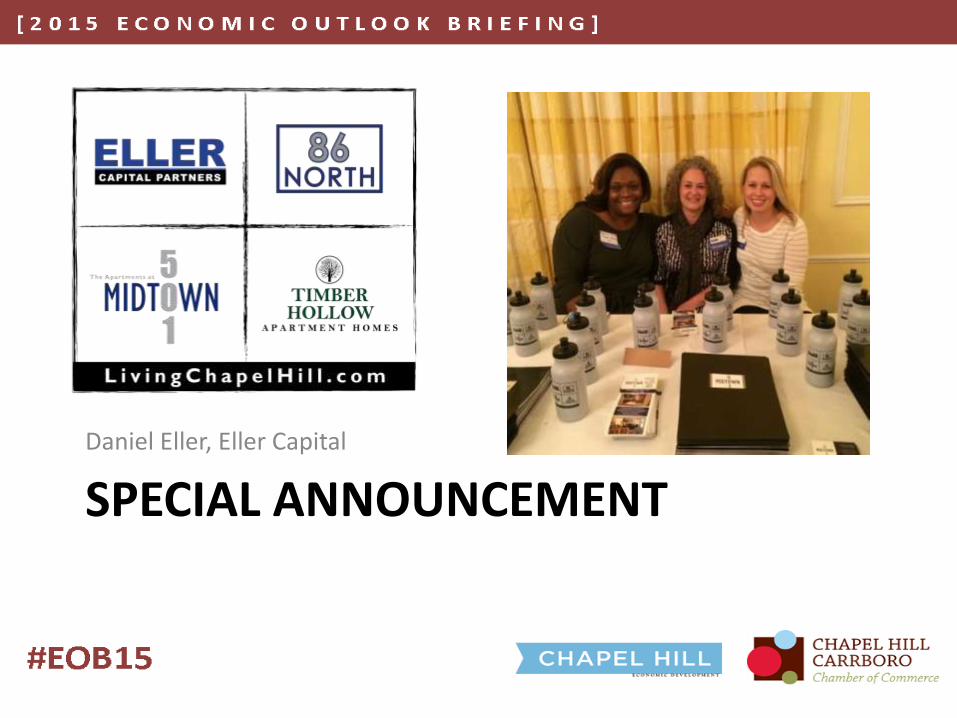
SPECIAL ANNOUNCEMENT
Daniel Eller, Eller Capital

We’re headed to Cuba, You’re Invited!
Learn more at
carolinachamber.org/cuba
Photo Credit: Bud Elison

Save the DateEggs with Elected Officials presented by Google
8:00-10:00 a.m., Monday, April 20
At Top of the Hill’s Great Room

Our Presenting Sponsor

Our Keynote Sponsor

Our Breakfast Sponsor

Q&A Sponsor

Greening Sponsor

Thank you for attending the 2015 Economic Outlook Briefing Presented by Town of Chapel Hill
Economic Development
#EOB15
@CarolinaChamber
@CHEconDev