2015 Dry Bean Grower Survey (E1802) - ag.ndsu.edu · PDF file1 • E1802 2015 Dry Bean...
36
1 • E1802 2015 Dry Bean Grower Survey E1802 DRY BEAN J.J. Knodel, P.B. Beauzay, G.J. Endres, D.W. Franzen, H.J. Kandel, S.G. Markell, J.M. Osorno, J.S. Pasche and R.K. Zollinger North Dakota State University In cooperation with the Northarvest Bean Growers Association of Production, Pest Problems and Pesticide Use in Minnesota and North Dakota Grower Survey 2015 March 2016
Transcript of 2015 Dry Bean Grower Survey (E1802) - ag.ndsu.edu · PDF file1 • E1802 2015 Dry Bean...

1 • E1802 2015 Dry Bean Grower Survey
E1802
DRY BEAN
J.J. Knodel, P.B. Beauzay, G.J. Endres, D.W. Franzen, H.J. Kandel, S.G. Markell, J.M. Osorno, J.S. Pasche and R.K. Zollinger
North Dakota State University
In cooperation with the Northarvest Bean Growers Association
of Production, Pest Problems and Pesticide Use
in Minnesota and North Dakota
Grower Survey
2015
March 2016

2 • E1802 2015 Dry Bean Grower Survey
Table of ContentsIntroduction ................................................................................................................................................................................................4
Acknowledgments .....................................................................................................................................................................................4
Production ..................................................................................................................................................................................................5
Table 1. Number of Northarvest dry bean growers responding, acres planted by respondents and total state acres in 2015. .......5
Table 2. Dry bean production by county in 2015. .............................................................................................................................5
Table 3. Dry bean acres harvested, irrigated, on tile-drained ground, and damaged by hail, frost and water in 2015.....................6
Table 4. Dry bean market classes grown in 2015. ...........................................................................................................................6
Table 5. Dry bean varieties grown in 2015. ......................................................................................................................................7
Table 6. Dry bean production problems reported in 2015 ................................................................................................................8
Table 7. Purchased seed size problems that affected acreage planting intentions in 2015. ............................................................9
Table 8. Row spacing by dry bean market class in 2015 ...............................................................................................................10
Table 9. Seeding rate by dry bean market class in 2015 ...............................................................................................................10
Table 10. Difference between seeding rate and established plant stand for dry bean market classes grown in 2015. ....................11
Table 11. Percent of total dry bean acres harvested by direct combining in 2015. ..........................................................................11
Table 12. Estimated yield loss in harvested dry beans in 2015. .......................................................................................................12
Table 13. Dry bean field tillage practices in 2015. ............................................................................................................................12
Agronomy .................................................................................................................................................................................................13
Table 14. Ground rolling on dry bean fields in 2015. ........................................................................................................................13
Table 15. Use of fertilizers on dry bean fields in 2015 .....................................................................................................................13
Table 16. Use of soil test prior to fertilization of dry bean fields in 2015. .........................................................................................14
Table 17. Use of Rhizobium inoculants on dry bean fields in 2015. .................................................................................................14
Table 18. Use of site-specific nutrient management (SSNM) on dry bean fields in 2015. ...............................................................14
Table 19. Desiccants used on dry beans in 2015 ............................................................................................................................15
Table 20. Frequency of crops in dry bean crop rotation program, 2011-2014. .................................................................................16
Table 21. Number of years dry beans are grown in dry bean crop rotation program. ......................................................................16
Insect Pests and Insecticide Use ............................................................................................................................................................17
Table 22. Worst insect problem in dry beans in 2015 ......................................................................................................................17
Table 23. Insects ranked as one of the three worst in dry beans in 2015 ........................................................................................18
Table 24. Foliar insecticide use in dry beans in 2015 ......................................................................................................................19
Table 25. Soil insecticide and seed treatment use in dry beans in 2015 .........................................................................................20
Plant Diseases and Fungicide Use .........................................................................................................................................................21
Table 26. Worst disease problem in dry beans in 2015 ...................................................................................................................21
Table 27. Diseases ranked as one of the three worst in dry beans in 2015 .....................................................................................22
Table 28. Foliar and banded fungicide use in dry beans in 2015 .....................................................................................................23
Table 29. In-furrow fungicide use in dry beans in 2015. ...................................................................................................................24
Table 30. Fungicide seed treatment use in dry beans in 2015.........................................................................................................25
Weeds and Herbicide Use .......................................................................................................................................................................26
Table 31. Worst weed problem in dry beans in 2015 .......................................................................................................................26
Table 32. Weeds ranked as one of the three worst in dry beans in 2015. ........................................................................................27
Table 33. Weed control practices used in dry beans in 2015 ...........................................................................................................28
Table 34. Weed control practices used by dry bean market class in 2015 ......................................................................................29
Scouting and Threshold Practices .........................................................................................................................................................30
Table 35. Scouting practices in dry beans in 2015 ...........................................................................................................................30
Table 36. Use of economic thresholds for insects in dry beans in 2015. .........................................................................................30
References ................................................................................................................................................................................................31
APPENDIX I. ..............................................................................................................................................................................................32

3 • E1802 2015 Dry Bean Grower Survey
List of FiguresFigure 1. Northarvest dry bean acres planted by state in 2015 ................................................................................... 5
Figure 2. Northarvest dry bean production by county in 2015 ..................................................................................... 5
Figure 3. Northarvest respondents’ reported acres from Table 3 ................................................................................ 6
Figure 4. Northarvest dry bean market classes grown in 2015 ................................................................................... 6
Figure 5. Northarvest respondents’ reported acres for dry bean production problems in 2015 .................................. 8
Figure 6. Northarvest percent of dry bean acres harvested by direct combining in 2015 ......................................... 11
Figure 7. Northarvest estimated yield loss in harvested dry beans in 2015 .............................................................. 12
Figure 8. Northarvest dry bean field tillage practices in 2015 ................................................................................... 12
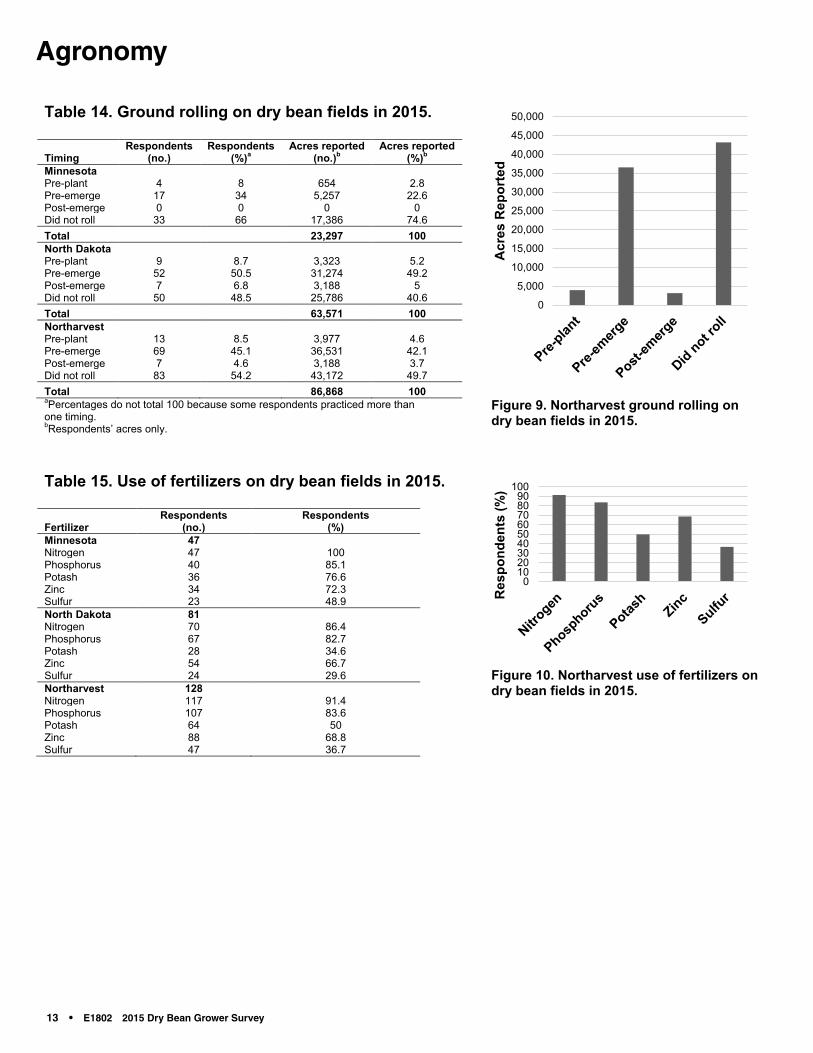
Figure 9. Northarvest ground rolling on dry bean fields in 2015................................................................................ 13
Figure 10. Northarvest use of fertilizers on dry bean fields in 2015 ............................................................................ 13
Figure 11. Northarvest use of soil test in 2015 ............................................................................................................ 14
Figure 12. Northarvest use of inoculant in 2015 .......................................................................................................... 14
Figure 13. Northarvest use of site-specific nutrient management in 2015 .................................................................. 14
Figure 14. Northarvest desiccants used on dry beans in 2015 ................................................................................... 15
Figure 15. Northarvest frequency of major crops in dry bean crop rotation program, 2011-2014 ............................... 16
Figure 16. Northarvest number of years dry beans are grown in dry bean crop rotation program .............................. 16
Figure 17. Northarvest worst insect problem in dry beans in 2015 ............................................................................. 17
Figure 18. Northarvest insects ranked as one of the three worst in dry beans in 2015 .............................................. 18
Figure 19. Northarvest foliar insecticide use in dry beans in 2015 .............................................................................. 19
Figure 20. Northarvest insecticide seed treatment use in dry beans in 2015 ............................................................. 20
Figure 21. Northarvest worst disease problem in dry beans in 2015 .......................................................................... 21
Figure 22. Northarvest diseases ranked as one of the three worst in dry beans in 2015 ........................................... 22
Figure 23. Northarvest foliar and banded fungicide use in dry beans in 2015 ............................................................ 24
Figure 24. Northarvest fungicide application method in dry beans in 2015 ................................................................ 24
Figure 25. Northarvest in-furrow fungicide use in dry beans in 2015 .......................................................................... 24
Figure 26. Northarvest fungicide seed treatment use in dry beans in 2015 ................................................................ 25
Figure 27. Northarvest worst weed problem in dry beans in 2015 .............................................................................. 26
Figure 28. Northarvest weeds ranked as one of the three worst in dry beans in 2015 ............................................... 27
Figure 29. Northarvest weed control practices used in dry beans in 2015 .................................................................. 28

4 • E1802 2015 Dry Bean Grower Survey
Introduction
The 2015 dry bean grower survey is the 26th annual survey of varieties grown,
pest problems, pesticide use and grower practices of the Northarvest Bean
Growers Association, an association of dry edible bean growers in Minnesota
and North Dakota. Research and Extension faculty at North Dakota State
University and the directors of the Northarvest Bean Growers Association
developed the survey form (Appendix I). The survey was mailed to all
Northarvest bean growers. All participants in the survey were anonymous.
Results of previous surveys dated 1987-1992, 1994-2000, 2002 and
2004-2014 have been published (see References). No surveys were
conducted in 1993 and 2001. In 2003, the survey was completed by
dry bean producers who attended the Northarvest Bean Day in Fargo
during the winter. However, the lack of responses made processing
and analyses of results unreliable, so no report was compiled.
Data reported in the figures represent totals for the entire Northarvest
survey unless otherwise noted. Data reported in the tables are broken
down by state and also are totaled for the entire Northarvest survey.
Percent values in tables and figures are rounded to one decimal for
clear presentation. Consequently, percent values in some tables and
figures may not total exactly 100 (for example, 99.9 or 100.1 percent)
when the presented values are added. Other instances where percent
values do not total 100 percent are explained in footnotes to the tables.
Throughout this report, trade names of chemicals often are presented
as an aid for clearer communication. Mention of trade names does not
constitute endorsement or recommendation by North Dakota State
University or the Northarvest Bean Growers Association.
AcknowledgmentsA grant from the Northarvest Bean Growers Association funded the survey.
Cover photos by P.B. Beauzay, S.G. Markell and H.J. Kandel.

5 • E1802 2015 Dry Bean Grower Survey
ProductionProduction
Table 1. Number of Northarvest dry bean growersresponding, acres planted by respondents andtotal state acres in 2015.
GrowersNo. of
respondentsRespondents’
acresTotal
acresaAcres surveyed
(% of total)Minnesota 51 23,651 190,000 12.4North Dakota 103 68,711 655,000 10.5Northarvest 154 92,362 845,000 10.9aTotal of dry bean acres planted for Minnesota and North Dakota (source: USDANational Agricultural Statistics Service).
Table 2. Dry bean production by county in 2015.
Minnesota
No. ofrespon-dentsa Acresb North Dakota
No. ofrespon-dentsa Acresb
Polk 9 5,098 Grand Forks 21 10,894Otter Tail 6 3,770 Walsh 20 9,299Mahnomen 5 2,283 Pembina 12 8,685Marshall 5 2,203 Wells 6 5,501Norman 1 2,200 McLean 5 4,691Swift 2 1,286 Nelson 8 4,374Kandiyohi 4 1,215 Traill 7 4,180Wadena 3 1,118 Steele 9 3,962McLeod 2 695 Benson 6 3,855Renville 4 623 Ramsey 4 2,930Crow Wing 1 410 LaMoure 2 2,600Kittson 1 400 Dickey 4 1,398Sherburne 1 300 Barnes 3 1,120Wilkin 1 300 Towner 2 925Grant 1 290 Cavalier 3 810Clay 1 250 Ransom 2 730Morrison 2 250 Griggs 2 640Beltrami 1 230 Stutsman 1 522Traverse 1 210 Burleigh 1 400Lac qui Parle 1 150 Cass 1 400Benton 1 140 Eddy 3 351Stevens 1 130 Oliver 1 310Todd 1 100 Pierce 1 100
Richland 1 34Total 55 23,651 Total 125 68,711aSome respondents had dry bean acreage in more than one county.bRespondents’ acres only.
Figure 1. Northarvest dry bean acres planted by state in 2015 (respondents’ acres only).
Figure 2. Northarvest dry bean production by county in 2015 (respondents’ acres only).
010,00020,00030,00040,00050,00060,00070,00080,000
Minnesota North Dakota

6 • E1802 2015 Dry Bean Grower Survey
2015 Northarvest Dry Bean Grower Survey, Page 3 of 4
Table 3. Dry bean acres harvested, irrigated, on tile-drained ground, and damaged by hail,frost and water in 2015.
Acres reported(no.)a
Acres reported(%)a
MinnesotaHarvested 23,045 97.4Irrigated 7,103 30Tile-drained 5,559 23.5Water-damaged 6,297 26.6Hail-damaged 2,429 10.3Frost-damaged 0 0North DakotaHarvested 65,182 94.9Irrigated 2,374 3.5Tile-drained 1,995 2.9Water-damaged 21,550 31.4Hail-damaged 9,134 13.3Frost-damaged 1,100 1.6NortharvestHarvested 88,227 95.5Irrigated 9,477 10.3Tile-drained 7,554 8.2Water-damaged 27,847 30.1Hail-damaged 11,563 12.5Frost-damaged 1,100 1.2aRespondents’ acres only.
Table 4. Dry bean market classesgrown in 2015.
Acres reported Acres reportedMarket class (no.)a (%)a
MinnesotaKidney 10,336 43.7Navy 8,267 35Black 4,196 17.7Pinto 482 2Pink 370 1.6Cranberry 0 0Great Northern 0 0Small Red 0 0Total 23,651 100North DakotaPinto 39,215 57.1Black 15,854 23.1Navy 9,640 14Small Red 1,953 2.8Pink 783 1.1Kidney 555 0.8Great Northern 400 0.6Cranberry 311 0.5Total 68,711 100NortharvestPinto 39,697 43Black 20,050 21.7Navy 17,907 19.4Kidney 10,891 11.8Small Red 1,953 2.1Pink 1,153 1.2Great Northern 400 0.4Cranberry 311 0.3Total 92,362 100aRespondents’ acres only.
Figure 4. Northarvest dry bean market classes grown in 2015.
Figure 3. Northarvest respondents’reported acres from Table 3.
010,00020,00030,00040,00050,00060,00070,00080,00090,000
100,000
Ace
s R
epor
ted
Pinto[VALUE]%
Black[VALUE]%
Navy[VALUE]%
Kidney[VALUE]%
Red[VALUE]%
Pink[VALUE]%
GN[VALUE]%
Cranberry[VALUE]%
Northarvest
Kid-ney
[VALUE]%
Navy[VALUE]%
Black[VALUE]%
Pinto[VALUE]%
Pink[VALUE]%
Minnesota
Pinto[VALUE]%
Black[VALUE]%
Navy[VALUE]%
Red[VALUE]%
Pink[VALUE]%
Kid-ney
[VALUE]%
GN[VALUE]%
Cran-berry[VALUE]%
North Dakota
Table 4. Dry bean market classes grown in 2015.
Acres reported Acres reportedMarket class (no.)a (%)a
MinnesotaKidney 10,336 43.7Navy 8,267 35Black 4,196 17.7Pinto 482 2Pink 370 1.6Cranberry 0 0Great Northern 0 0Small Red 0 0Total 23,651 100North DakotaPinto 39,215 57.1Black 15,854 23.1Navy 9,640 14Small Red 1,953 2.8Pink 783 1.1Kidney 555 0.8Great Northern 400 0.6Cranberry 311 0.5Total 68,711 100NortharvestPinto 39,697 43Black 20,050 21.7Navy 17,907 19.4Kidney 10,891 11.8Small Red 1,953 2.1Pink 1,153 1.2Great Northern 400 0.4Cranberry 311 0.3Total 92,362 100
aRespondents’ acres only.
Figure 4. Northarvest dry bean market classes grown in 2015.
Pinto43.0%
Black21.7%
Navy19.4%
Kidney11.8%
Red2.1%
Pink1.2%
GN0.4%
Cranberry0.3%
Northarvest
Kid-ney
43.7%
Navy35.0%
Black17.7%
Pinto2.0%
Pink1.6%
Minnesota
Pinto57.1%
Black23.1%
Navy14.0%
Red2.8%
Pink1.1%
Kid-ney0.8%
GN0.6%
Cran-berry0.5%
North Dakota

7 • E1802 2015 Dry Bean Grower Survey
2015 Northarvest Dry Bean Grower Survey, Page 5 of 4
Table 5. Dry bean varieties grown in 2015.
Acres planteda
Variety Class Minnesota %bNorth
Dakota %b Northarvest %b
Eclipse Black 2,278 9.6 13,904 20.2 16,182 17.5Zorro Black 1,488 6.3 1,490 2.2 2,978 3.2Black Cat Black 430 1.8 460 0.7 890 1Total Black Black 4,196 17.7 15,854 23.1 20,050 21.7Etna Cranberry 0 0 311 0.5 311 0.3Total Cranberry Cranberry 0 0 311 0.5 311 0.3Orion GN 0 0 150 0.2 150 0.2Taurus GN 0 0 150 0.2 150 0.2Aries GN 0 0 100 0.1 100 0.1Total GNc GNc 0 0 400 0.6 400 0.4Montcalm Kidney 4,123 17.4 215 0.3 4,338 4.7Red Hawk Kidney 2,449 10.4 230 0.3 2,679 2.9Pink Panther Kidney 1,050 4.4 0 0 1,050 1.1Not specified Kidney 858 3.6 0 0 858 0.9Cabernet Kidney 523 2.2 110 0.2 633 0.7Clouseau Kidney 430 1.8 0 0 430 0.5Red Rover Kidney 375 1.6 0 0 375 0.4Majesty Kidney 303 1.3 0 0 303 0.3Beluga Kidney 125 0.5 0 0 125 0.1Big Red Kidney 100 0.4 0 0 100 0.1Total Kidney Kidney 10,336 43.7 555 0.8 10,891 11.8HMS Medalist Navy 2,795 11.8 6,920 10.1 9,715 10.5T9905 Navy 3,839 16.2 1,022 1.5 4,861 5.3Vigilant Navy 556 2.4 0 0 556 0.6Teton Navy 0 0 385 0.6 385 0.4OB1723-06 Navy 0 0 375 0.5 375 0.4Vista Navy 365 1.5 0 0 365 0.4Indi Navy 0 0 313 0.5 313 0.3Ensign Navy 128 0.5 182 0.3 310 0.3Not specified Navy 290 1.2 0 0 290 0.3T9903 Navy 0 0 287 0.4 287 0.3Avalanche Navy 200 0.8 0 0 200 0.2Navigator Navy 0 0 156 0.2 156 0.2Norstar Navy 50 0.2 0 0 50 0.1Cascade Navy 44 0.2 0 0 44 0Total Navy Navy 8,267 35 9,640 14 17,907 19.4Floyd Pink 0 0 748 1.1 748 0.8ISB473 Pink 230 1 0 0 230 0.2Sedona Pink 140 0.6 0 0 140 0.2Not specified Pink 0 0 35 0.1 35 0Total Pink Pink 370 1.6 783 1.1 1,153 1.2Windbreaker Pinto 317 1.3 12,120 17.6 12,437 13.5La Paz Pinto 0 0 9,502 13.8 9,502 10.3Monterrey Pinto 0 0 4,595 6.7 4,595 5Sinaloa Pinto 0 0 3,282 4.8 3,282 3.6Lariat Pinto 0 0 2,852 4.2 2,852 3.1Not specified Pinto 0 0 1,220 1.8 1,220 1.3ND307 Pinto 0 0 1,200 1.7 1,200 1.3Stampede Pinto 0 0 1,100 1.6 1,100 1.2Vibrant Pinto 0 0 882 1.3 882 1Santa Cruz Pinto 0 0 720 1 720 0.8Maverick Pinto 0 0 520 0.8 520 0.6Othello Pinto 0 0 500 0.7 500 0.5Buster Pinto 165 0.7 300 0.4 465 0.5Torreon Pinto 0 0 250 0.4 250 0.3Medicine Hat Pinto 0 0 100 0.1 100 0.1AS8257 Pinto 0 0 72 0.1 72 0.1Total Pinto Pinto 482 2 39,215 57.1 39,697 43Rio Rojo Small Red 0 0 835 1.2 835 0.9Ruby Small Red 0 0 786 1.1 786 0.9Merlot Small Red 0 0 332 0.5 332 0.4Total Red Red 0 0 1,953 2.8 1,953 2.1GrandTotal
AllClasses 23,651 100 68,711 100 92,362 100
aRespondents’ acres only.bPercent of respondents’ total dry bean acreage.cGN = Great Northern.

8 • E1802 2015 Dry Bean Grower Survey
Table 6. Dry bean production problems reported in 2015.
Worst production problemRespondents
(no.)Respondents
(%)Acres
reported (no.)aAcres
reported (%)a
MinnesotaExcess water 23 45.1 6,297 26.6Diseases 18 35.3 4,367 18.5Drought 8 15.7 3,019 12.8Hail 15 29.4 2,429 10.3Weeds 18 35.3 2,327 9.8None reported 4 7.8 1,048 4.4Emergence/stand 10 19.6 1,018 4.3Applied herbicide injury 8 15.7 906 3.8Harvest 2 3.9 580 2.5Insects 2 3.9 340 1.4Delayed planting 2 3.9 181 0.8Micronutrient deficiency 2 3.9 180 0.8Soil salinity 2 3.9 115 0.5Herbicide drift 3 5.9 19 0.1North DakotaExcess water 70 68 21,550 31.4Drought 29 28.2 11,852 17.2Diseases 16 15.5 11,223 16.3Weeds 25 24.3 9,384 13.7Hail 33 32 9,134 13.3Wind 12 11.7 7,400 10.8Emergence/stand 20 19.4 7,220 10.5None reported 12 11.7 4,706 6.8Soil salinity 29 28.2 2,213 3.2Harvest 6 5.8 2,170 3.2Applied herbicide injury 3 2.9 1,740 2.5Delayed planting 9 8.7 1,697 2.5Frost 1 1 1,100 1.6Insects 5 4.9 869 1.3Micronutrient deficiency 3 2.9 360 0.5NortharvestExcess water 93 60.4 27,847 30.1Diseases 34 22.1 15,590 16.9Drought 37 24 14,871 16.1Weeds 43 27.9 11,711 12.7Hail 48 31.2 11,563 12.5Emergence/stand 30 19.5 8,238 8.9Wind 12 7.8 7,400 8None reported 16 10.4 5,754 6.2Harvest 8 5.2 2,750 3Applied herbicide injury 11 7.1 2,646 2.9Soil salinity 31 20.1 2,328 2.5Delayed planting 11 7.1 1,878 2Insects 7 4.5 1,209 1.3Frost 1 0.6 1,100 1.2Micronutrient deficiency 5 3.2 540 0.6Herbicide drift 5 3.2 44 0
aRespondents’ acres only.
Figure 5. Northarvest respondents’ reported acres for dry bean productionproblems in 2015.
05,000
10,00015,00020,00025,00030,000
Acr
es R
epor
ted

9 • E1802 2015 Dry Bean Grower Survey
2015 Northarvest Dry Bean Grower Survey, Page 7 of 4
Table 7. Purchased seed size problems that affected acreage planting intentions in 2015.
Not enough seed Too much seed
Variety ClassRespondents
(no.)Acres
reportedaRespondents
(no.)Acres
affecteda %Respondents
(no.)Acres
affecteda %MNEclipse Black 7 1,802 1 50 2.8 1 15 0.8Zorro Black 6 1,453 1 30 2.1 0 0 0Clouseau Kidney 2 430 1 10 2.3 0 0 0Montcalm Kidney 14 4,123 1 75 1.8 0 0 0Pink Panther Kidney 3 1,050 1 40 3.8 0 0 0Medalist Navy 15 2,795 0 0 0 0 0 0T9905 Navy 12 3,839 0 0 0 1 10 0.3Windbreaker Pinto 2 317 1 16 5 0 0 0NDEclipse Black 18 12,829 3 1,880 14.7 1 40 0.3Zorro Black 3 1,490 1 150 10.1 0 0 0Montcalm Kidney 2 215 0 0 0 0 0 0Medalist Navy 22 6,920 2 30 0.4 1 20 0.3T9905 Navy 9 1,022 2 60 5.9 0 0 0Teton Navy 1 385 0 0 0 1 80 20.8La Paz Pinto 26 9,502 2 70 0.7 0 0 0Lariat Pinto 8 2,852 1 45 1.6 0 0 0Santa Cruz Pinto 5 720 1 15 2.1 0 0 0Windbreaker Pinto 27 12,120 1 50 0.4 0 0 0NortharvestEclipse Black 25 14,631 4 1,930 13.2 2 55 0.4Zorro Black 9 2,943 2 180 6.1 0 0 0Clouseau Kidney 2 430 1 10 2.3 0 0 0Montcalm Kidney 16 4,338 1 75 1.7 0 0 0Pink Panther Kidney 3 1,050 1 40 3.8 0 0 0Medalist Navy 37 9,715 2 30 0.3 1 20 0.2T9905 Navy 21 4,861 2 60 1.2 1 10 0.2Teton Navy 1 385 0 0 0 1 80 20.8La Paz Pinto 26 9,502 2 70 0.7 0 0 0Lariat Pinto 8 2,852 1 45 1.6 0 0 0Santa Cruz Pinto 5 720 1 15 2.1 0 0 0Windbreaker Pinto 29 12,437 2 66 0.5 0 0 0aRespondents’ acres only.

10 • E1802 2015 Dry Bean Grower Survey
Table 8. Row spacing by dry bean market class in 2015.
Blacka Cranberry GNb Kidney Navya Pink Pintoa RedRow spacing No. % No. % No. % No. % No. % No. % No. % No. %Minnesota< 11 inches 0 0 0 0 0 0 0 0 0 0 0 0 0 0 0 011 to 15 inches 3 23.1 0 0 0 0 0 0 2 7.4 0 0 0 0 0 016 to 20 inches 0 0 0 0 0 0 0 0 2 7.4 0 0 0 0 0 021 to 25 inches 8 61.5 0 0 0 0 6 37.5 21 77.8 1 50 1 50 0 026 to 30 inches 2 15.4 0 0 0 0 10 62.5 2 7.4 1 50 1 50 0 0> 30 inches 0 0 0 0 0 0 0 0 0 0 0 0 0 0 0 0Total 13 100 0 0 0 0 16 100 27 100 2 100 2 100 0 0North Dakota< 11 inches 1 4.5 0 0 0 0 0 0 0 0 0 0 1 1.6 0 011 to 15 inches 4 18.2 0 0 0 0 0 0 1 3.8 0 0 3 4.7 0 016 to 20 inches 2 9.1 0 0 0 0 0 0 2 7.7 0 0 2 3.1 0 021 to 25 inches 9 40.9 1 100 1 100 2 50 16 61.5 2 66.7 19 29.7 2 33.326 to 30 inches 6 27.3 0 0 0 0 2 50 7 26.9 1 33.3 38 59.4 4 66.7> 30 inches 0 0 0 0 0 0 0 0 0 0 0 0 1 1.6 0 0Total 22 100 1 100 1 100 4 100 26 100 3 100 64 100 6 100Northarvest< 11 inches 1 2.9 0 0 0 0 0 0 0 0 0 0 1 1.5 0 011 to 15 inches 7 20 0 0 0 0 0 0 3 5.7 0 0 3 4.5 0 016 to 20 inches 2 5.7 0 0 0 0 0 0 4 7.5 0 0 2 3 0 021 to 25 inches 17 48.6 1 100 1 100 8 40 37 69.8 3 60 20 30.3 2 33.326 to 30 inches 8 22.9 0 0 0 0 12 60 9 17 2 40 39 59.1 4 66.7> 30 inches 0 0 0 0 0 0 0 0 0 0 0 0 1 1.5 0 0Total 35 100 1 100 1 100 20 100 53 100 5 100 66 100 6 100
aBlack, navy and pinto varieties are typically Type II (upright) varieties.bGN = Great Northern.
Table 9. Seeding rate by dry bean market class in 2015.
Blackb Cranberry GNc Kidney Navyb Pink Pintob RedSeeding ratea No. % No. % No. % No. % No. % No. % No. % No. %Minnesota< 70,000 0 0 0 0 0 0 0 0 0 0 0 0 0 0 0 070 to 79,000 0 0 0 0 0 0 5 33.3 0 0 0 0 1 50 0 080 to 89,000 0 0 0 0 0 0 8 53.3 0 0 1 50 1 50 0 090 to 99,000 1 9.1 0 0 0 0 2 13.3 1 4.2 1 50 0 0 0 0100 to 109,000 3 27.3 0 0 0 0 0 0 6 25 0 0 0 0 0 0110 to 119,000 4 36.4 0 0 0 0 0 0 9 37.5 0 0 0 0 0 0120 to 129,000 3 27.3 0 0 0 0 0 0 3 12.5 0 0 0 0 0 0> 129,000 0 0 0 0 0 0 0 0 5 20.8 0 0 0 0 0 0Total 11 100 0 0 0 0 15 100 24 100 2 100 2 100 0 0North Dakota< 70,000 0 0 0 0 0 0 0 0 0 0 0 0 5 8.5 0 070 to 79,000 1 5 0 0 0 0 1 25 1 4 2 66.7 33 55.9 0 080 to 89,000 0 0 0 0 1 100 2 50 2 8 1 33.3 16 27.1 4 66.790 to 99,000 9 45 1 100 0 0 0 0 6 24 0 0 2 3.4 0 0100 to 109,000 4 20 0 0 0 0 0 0 4 16 0 0 2 3.4 0 0110 to 119,000 3 15 0 0 0 0 1 25 10 40 0 0 1 1.7 2 33.3120 to 129,000 1 5 0 0 0 0 0 0 2 8 0 0 0 0 0 0> 129,000 2 10 0 0 0 0 0 0 0 0 0 0 0 0 0 0Total 20 100 1 100 1 100 4 100 25 100 3 100 59 100 6 100Northarvest< 70,000 0 0 0 0 0 0 0 0 0 0 0 0 5 8.2 0 070 to 79,000 1 3.2 0 0 0 0 6 31.6 1 2 2 40 34 55.7 0 080 to 89,000 0 0 0 0 1 100 10 52.6 2 4.1 2 40 17 27.9 4 66.790 to 99,000 10 32.3 1 100 0 0 2 10.5 7 14.3 1 20 2 3.3 0 0100 to 109,000 7 22.6 0 0 0 0 0 0 10 20.4 0 0 2 3.3 0 0110 to 119,000 7 22.6 0 0 0 0 1 5.3 19 38.8 0 0 1 1.6 2 33.3120 to 129,000 4 12.9 0 0 0 0 0 0 5 10.2 0 0 0 0 0 0> 129,000 2 6.5 0 0 0 0 0 0 5 10.2 0 0 0 0 0 0Total 31 100 1 100 1 100 19 100 49 100 5 100 61 100 6 100
aLive seeds per acre.bBlack, navy and pinto varieties are typically Type II (upright) varieties.cGN = Great Northern

11 • E1802 2015 Dry Bean Grower Survey
2015 Northarvest Dry Bean Grower Survey, Page 9 of 4
Table 10. Difference between seeding rate and establishedplant stand for dry bean market classes grown in 2015.
Blackb Cranberry GNc Kidney Navyb Pink Pintob RedDifferencea No. % No. % No. % No. % No. % No. % No. % No. %Minnesota< 10,000 2 18.2 0 0 0 0 3 21.4 6 30 0 0 1 50 0 010 to 19,000 5 45.5 0 0 0 0 11 78.6 8 40 0 0 1 50 0 020 to 29,000 3 27.3 0 0 0 0 0 0 6 30 1 100 0 0 0 030 to 39,000 0 0 0 0 0 0 0 0 0 0 0 0 0 0 0 040 to 49,000 1 9.1 0 0 0 0 0 0 0 0 0 0 0 0 0 0Total 11 100 0 0 0 0 14 100 20 100 1 100 2 100 0 0North Dakota< 10,000 5 41.7 0 0 0 0 2 50 3 18.8 2 100 19 44.2 3 6010 to 19,000 4 33.3 0 0 1 100 2 50 10 62.5 0 0 24 55.8 0 020 to 29,000 2 16.7 0 0 0 0 0 0 1 6.3 0 0 0 0 2 4030 to 39,000 1 8.3 0 0 0 0 0 0 1 6.3 0 0 0 0 0 040 to 49,000 0 0 0 0 0 0 0 0 1 6.3 0 0 0 0 0 0Total 12 100 0 0 1 100 4 100 16 100 2 100 43 100 5 100Northarvest< 10,000 7 30.4 0 0 0 0 5 27.8 9 25 2 66.7 20 44.4 3 6010 to 19,000 9 39.1 0 0 1 100 13 72.2 18 50 0 0 25 55.6 0 020 to 29,000 5 21.7 0 0 0 0 0 0 7 19.4 1 33.3 0 0 2 4030 to 39,000 1 4.3 0 0 0 0 0 0 1 2.8 0 0 0 0 0 040 to 49,000 1 4.3 0 0 0 0 0 0 1 2.8 0 0 0 0 0 0Total 23 100 0 0 1 100 18 100 36 100 3 100 45 100 5 100
aPlants per acre.bBlack, navy and pinto varieties are typically Type II (upright) varieties.cGN = Great Northern
Table 11. Percent of total dry bean acresharvested by direct combining in 2015.
Percent directcombined
Respondents(no.)
Respondents(%)
Acresreporteda
Acresreporteda (%)
Minnesota1 to 25% 2 4.1 550 2.526 to 50% 1 2 523 2.451 to 75% 0 0 0 076 to 99% 5 10.2 2,097 9.5100% 17 34.7 4,202 19No direct harvest 24 49 14,723 66.6Total 49 100 22,095 100North Dakota1 to 25% 8 7.8 7,208 11.126 to 50% 3 2.9 5,857 9.151 to 75% 2 2 730 1.176 to 99% 19 18.6 9,356 14.5100% 42 41.2 25,324 39.1No direct harvest 28 27.5 16,227 25.1Total 102 100 64,702 100Northarvest1 to 25% 10 6.6 7,758 8.926 to 50% 4 2.6 6,380 7.451 to 75% 2 1.3 730 0.876 to 99% 24 15.9 11,453 13.2100% 59 39.1 29,526 34No direct harvest 52 34.4 30,950 35.7Total 151 100 86,797 100aRespondents’ harvested acres only.
Figure 6. Northarvest percent of dry bean acres harvested by direct combining in 2015.
05,000
10,00015,00020,00025,00030,00035,000
Acr
es R
epor
ted

12 • E1802 2015 Dry Bean Grower Survey
Table 12. Estimated yield loss in harvested dry beansin 2015.
Direct Harvest Conventional HarvestEstimatedyield loss
Respondents(no.)
Respondents(%)
Respondents(no.)
Respondents(%)
Minnesota0% 0 0 0 01-5% 9 36 7 24.16-10% 13 52 14 48.311-15% 2 8 8 27.616-20% 1 4 0 0Total 25 100 29 100North Dakota0% 2 2.7 2 3.41-5% 29 39.2 37 63.86-10% 25 33.8 14 24.111-15% 15 20.3 4 6.916-20% 3 4.1 1 1.7Total 74 100 58 100Northarvest0% 11 8.9 9 7.81-5% 42 33.9 51 446-10% 27 21.8 22 1911-15% 16 12.9 4 3.416-20% 28 22.6 30 25.9Total 124 100 116 100
Table 13. Dry bean field tillage practices in 2015.
Tillage Acres reported Acres reportedpractice (no.)a (%)a
MinnesotaConventional 18,952 84.6Minimum 3,249 14.5Strip-tillage 200 0.9No-till 0 0Total 22,401 100North DakotaConventional 51,805 75.3Minimum 13,469 19.6No-till 2,047 3Strip-tillage 1,450 2.1Total 68,771 100NortharvestConventional 70,757 77.6Minimum 16,718 18.3Strip-tillage 2,247 2.5No-till 1,450 1.6Total 91,172 100aRespondents’ acres only. Figure 8. Northarvest dry bean field
tillage practices in 2015.
Figure 7. Northarvest estimated yield loss in harvested dry beans in 2015.
0
10,000
20,000
30,000
40,000
50,000
60,000
70,000
80,000
Acr
es R
epor
ted
020406080
100
0% 1 to 5% 6 to10%
11 to15%
16 to20%R
espo
nden
ts (%
)
Percent Yield Loss
Direct Harvest Conventional Harvest
13 • E1802 2015 Dry Bean Grower Survey
Agronomy
2015 Northarvest Dry Bean Grower Survey, Page 11 of 4
Agronomy
Table 14. Ground rolling on dry bean fields in 2015.
TimingRespondents
(no.)Respondents
(%)aAcres reported
(no.)bAcres reported
(%)b
MinnesotaPre-plant 4 8 654 2.8Pre-emerge 17 34 5,257 22.6Post-emerge 0 0 0 0Did not roll 33 66 17,386 74.6Total 23,297 100North DakotaPre-plant 9 8.7 3,323 5.2Pre-emerge 52 50.5 31,274 49.2Post-emerge 7 6.8 3,188 5Did not roll 50 48.5 25,786 40.6Total 63,571 100NortharvestPre-plant 13 8.5 3,977 4.6Pre-emerge 69 45.1 36,531 42.1Post-emerge 7 4.6 3,188 3.7Did not roll 83 54.2 43,172 49.7Total 86,868 100aPercentages do not total 100 because some respondents practiced more thanone timing.bRespondents’ acres only.
Table 15. Use of fertilizers on dry bean fields in 2015.
FertilizerRespondents
(no.)Respondents
(%)Minnesota 47Nitrogen 47 100Phosphorus 40 85.1Potash 36 76.6Zinc 34 72.3Sulfur 23 48.9North Dakota 81Nitrogen 70 86.4Phosphorus 67 82.7Potash 28 34.6Zinc 54 66.7Sulfur 24 29.6Northarvest 128Nitrogen 117 91.4Phosphorus 107 83.6Potash 64 50Zinc 88 68.8Sulfur 47 36.7
Figure 10. Northarvest use of fertilizers on dry bean fields in 2015.
0102030405060708090
100R
espo
nden
ts (%
)
0
5,000
10,000
15,000
20,000
25,000
30,000
35,000
40,000
45,000
50,000
Acr
es R
epor
ted
Figure 9. Northarvest ground rolling on dry bean fields in 2015.

14 • E1802 2015 Dry Bean Grower Survey
Table 16. Use of soil test prior to fertilization ofdry bean fields in 2015.
Soil testRespondents
(no.)Respondents
(%)MinnesotaSoil test used 40 81.6Soil test not used 9 18.4Total 49 100North DakotaSoil test used 86 84.3Soil test not used 16 15.7Total 102 100NortharvestSoil test used 126 83.4Soil test not used 25 16.6Total 151 100
Table 17. Use of Rhizobium inoculants on dry beanfields in 2015.
Rhizobium useRespondents
(no.)Respondents
(%)MinnesotaInoculant used 11 22.9Inoculant not used 37 77.1Total 48 100North DakotaInoculant used 19 19.6Inoculant not used 78 80.4Total 97 100NortharvestInoculant used 30 20.7Inoculant not used 115 79.3Total 145 100
Table 18. Use of site-specific nutrient management(SSNM) on dry bean fields in 2015.
Soil test Respondents (no.) Respondents (%)MinnesotaSSNM used 13 26SSNM not used 37 74Total 50 100North DakotaSSNM used 33 32.7SSNM not used 68 67.3Total 101 100NortharvestSSNM used 46 30.5SSNM not used 105 69.5Total 151 100
Figure 12. Northarvest use of inoculant in 2015.
Figure 11. Northarvest use of soil test in 2015.
Figure 13. Northarvest use of site-specificnutrient management in 2015.
0102030405060708090
100
Soil test used Soil test notused
Res
pond
ents
(%)
0102030405060708090
100
SSNM used SSNM not used
Res
pond
ents
(%)
0102030405060708090
100
Inoculant used Inoculant notused
Res
pond
ents
(%)

15 • E1802 2015 Dry Bean Grower Survey
2015 Northarvest Dry Bean Grower Survey, Page 13 of 4
Table 19. Desiccants used on dry beans in 2015.
Respon-dents
Respon-dents
Acresreported
Acresreported
Desiccant (no.) (%) (no.)a (%)a
MinnesotaSharpen 21 41.2 8,032 34No desiccant used 13 25.5 6,767 28.6Valor 16 31.4 3,475 14.7Sodium chlorate 7 13.7 2,330 9.9Paraquat 8 15.7 2,273 9.6Glyphosate 10 19.6 1,542 6.5North DakotaGlyphosate 47 46.5 31,388 46.7Sharpen 53 52.5 28,764 42.8Valor 17 16.8 9,277 13.8No desiccant used 19 18.8 8,097 12Paraquat 9 8.9 2,176 3.2Sodium chlorate 1 1 265 0.4NortharvestSharpen 74 48.7 36,796 40.5Glyphosate 57 37.5 32,930 36.2No desiccant used 32 21.1 14,864 16.4Valor 33 21.7 12,752 14Paraquat 17 11.2 4,449 4.9Sodium chlorate 8 5.3 2,595 2.9aRespondents’ acres only.
Figure 14. Northarvest desiccants usedon dry beans in 2015.
0
5,000
10,000
15,000
20,000
25,000
30,000
35,000
40,000
Res
pond
ents
' Acr
es

16 • E1802 2015 Dry Bean Grower Survey
Table 20. Frequency of crops in dry bean croprotation program, 2011-2014.
2014 2013 2012 2011 4-yearaverage
Crop
Respon-dents
(%)
Respon-dents
(%)
Respon-dents
(%)
Respon-dents
(%)
Respon-dents
(%)MinnesotaAlfalfa 2 4.2 4.3 2.5 3.2Barley 2 0 0 2.5 1.1Corn 50 37.5 42.6 42.5 43.1Dry bean 14 20.8 34 42.5 27.8Hay/grass 0 2.1 2.1 2.5 1.7No crop 6 4.2 4.3 5 4.9Oats 2 0 0 2.5 1.1Potato 12 6.3 0 10 7.1Soybean 10 45.8 29.8 20 26.4Sugar beet 18 12.5 8.5 12.5 12.9Wheat 34 22.9 27.7 20 26.1North DakotaBarley 6.4 2.2 3.4 1.3 3.3Canola 1.1 2.2 1.1 2.5 1.7Corn 28.7 15.2 28.4 18.8 22.8Dry bean 19.1 38 37.5 48.8 35.9Field pea 1.1 0 0 0 0.3No crop 3.2 1.1 0 2.5 1.7Potato 2.1 4.3 2.3 3.8 3.1Soybean 11.7 32.6 26.1 21.3 22.9Sugar beet 14.9 8.7 8 5 9.1Sunflower 0 1.1 2.3 0 0.8Wheat 63.8 48.9 46.6 58.8 54.5NortharvestAlfalfa 0.7 1.4 1.5 0.8 1.1Barley 4.9 1.4 2.2 1.7 2.5Canola 0.7 1.4 0.7 1.7 1.1Corn 36.1 22.9 33.3 26.7 29.7Dry bean 17.4 32.1 36.3 46.7 33.1Field pea 0.7 0 0 0 0.2Hay/grass 0 0.7 0.7 0.8 0.6No crop 4.2 2.1 1.5 3.3 2.8Oats 0.7 0 0 0.8 0.4Potato 5.6 5 1.5 5.8 4.5Soybean 11.1 37.1 27.4 20.8 24.1Sugar beet 16 10 8.1 7.5 10.4Sunflower 0 0.7 1.5 0 0.5Wheat 53.5 40 40 45.8 44.8
Table 21. Number of years dry beans aregrown in dry bean crop rotation program.
Number of yearsRespondents
(no.)Respondents
(%)Minnesota1 of past 5 years 19 382 of past 5 years 20 403 of past 5 years 6 124 of past 5 years 2 45 of past 5 years 3 6Total 50 100North Dakota1 of past 5 years 17 18.12 of past 5 years 36 38.33 of past 5 years 35 37.24 of past 5 years 5 5.35 of past 5 years 1 1.1Total 94 100Northarvest1 of past 5 years 36 252 of past 5 years 56 38.93 of past 5 years 41 28.54 of past 5 years 7 4.95 of past 5 years 4 2.8Total 144 100
Figure 16. Northarvest number of years dry beansare grown in dry bean crop rotation program.
Figure 15. Northarvest frequency of major crops in dry bean crop rotation program, 2011-2014.
0.0
20.0
40.0
60.0
80.0
100.0
120.0
140.0
160.0
2014 2013 2012 2011 Avg
Freq
uenc
y (%
)
Wheat Corn Dry BeanSugarbeet Soybean
0
5
10
15
20
25
30
35
40
45
1 ofpast 5years
2 ofpast 5years
3 ofpast 5years
4 ofpast 5years
5 ofpast 5years
Res
pond
ents
(%)

17 • E1802 2015 Dry Bean Grower Survey
Insect Pests and Insecticide Use
2015 Northarvest Dry Bean Grower Survey, Page 15 of 4
Insect Pests and Insecticide Use
Table 22. Worst insect problem in dry beans in 2015.
InsectaRespondents
(no.)Respondents
(%)Acres reported
(no.)b,cAcres reported
(%)b,c
MinnesotaNone 24 51.1 8,700 41.4Leafhoppers 14 29.8 5,368 25.5Foliage caterpillars 2 4.3 4,236 20.2Aphids 4 8.5 1,643 7.8Seed corn maggot 2 4.3 940 4.5Spider mites 1 2.1 130 0.6Total 47 100 21,017 100North DakotaNone 70 70.7 45,045 69.9Leafhoppers 7 7.1 6,777 10.5Aphids 6 6.1 3,373 5.2Grasshoppers 7 7.1 3,143 4.9Wireworms 4 4 3,016 4.7Seed corn maggot 1 1 1,500 2.3Cutworms 1 1 700 1.1Spider mites 1 1 450 0.7Bean leaf beetle 1 1 410 0.6Armyworms 1 1 47 0.1Total 99 100 64,461 100NortharvestNone 94 64.4 53,745 62.9Leafhoppers 21 14.4 12,145 14.2Aphids 10 6.8 5,016 5.9Foliage caterpillars 2 1.4 4,236 5Grasshoppers 7 4.8 3,143 3.7Wireworms 4 2.7 3,016 3.5Seed corn maggot 3 2.1 2,440 2.9Cutworms 1 0.7 700 0.8Spider mites 2 1.4 580 0.7Bean leaf beetle 1 0.7 410 0.5Armyworms 1 0.7 47 0.1Total 146 100 85,478 100
aRanked as No. 1 insect problem by respondents.bRespondents’ acres only.cInsect problem may not have been present across all reported acres.
Figure 17. Northarvest worst insect problem in dry beans in 2015.
0
10,000
20,000
30,000
40,000
50,000
60,000
Acr
es R
epor
ted

18 • E1802 2015 Dry Bean Grower Survey
Table 23. Insects ranked as one of the three worst in dry beans in 2015.
InsectaRespondents
(no.)Respondents
(%)Acres reported
(no.)b,cAcres reported
(%)b,c
MinnesotaLeafhoppers 17 36.2 9,099 43.3None 24 51.1 8,700 41.4Foliage caterpillars 5 10.6 5,244 25Cutworms 3 6.4 3,750 17.8Grasshoppers 9 19.1 3,738 17.8Aphids 6 12.8 2,973 14.1Bean leaf beetle 4 8.5 1,690 8Spider mites 5 10.6 1,445 6.9Seed corn maggot 2 4.3 940 4.5Wireworms 1 2.1 140 0.7North DakotaNone 70 70.7 45,045 69.9Leafhoppers 13 13.1 10,049 15.6Wireworms 10 10.1 9,484 14.7Cutworms 12 12.1 9,392 14.6Grasshoppers 11 11.1 5,643 8.8Seed corn maggot 4 4 4,337 6.7Aphids 8 8.1 3,913 6.1Spider mites 4 4 3,408 5.3Armyworms 4 4 2,017 3.1Bean leaf beetle 3 3 938 1.5NortharvestNone 94 64.4 53,745 62.9Leafhoppers 30 20.5 19,148 22.4Cutworms 15 10.3 13,142 15.4Wireworms 11 7.5 9,624 11.3Grasshoppers 20 13.7 9,381 11Aphids 14 9.6 6,886 8.1Seed corn maggot 6 4.1 5,277 6.2Foliage caterpillars 5 3.4 5,244 6.1Spider mites 9 6.2 4,853 5.7Bean leaf beetle 7 4.8 2,628 3.1Armyworms 4 2.7 2,017 2.4
aRanked as No. 1, 2 or 3 insect problem by respondents.bRespondents’ acres only.cInsect problem may not have been present across all reported acres.
Figure 18. Northarvest insects ranked as one of the three worst in dry beans in 2015.
0
10,000
20,000
30,000
40,000
50,000
60,000
Acr
es R
epor
ted

19 • E1802 2015 Dry Bean Grower Survey
2015 Northarvest Dry Bean Grower Survey, Page 17 of 4
Table 24. Foliar insecticide use in dry beans in 2015.
InsecticideRespondents
(no.)Respondents
(%)Acres reported
(no.)a,bAcres reported
(%)a,b
MinnesotaNone 35 70 17,463 75Tombstone 2 4 3,150 13.5Warrior 5 10 3,094 13.3Asana 6 12 1,679 7.2Mustang 1 2 200 0.9Brigade 1 2 130 0.6Insecticide Total 8,253 35.4North DakotaNone 89 87.3 55,596 81.5Warrior 10 9.8 9,952 14.6Asana 3 2.9 5,375 7.9Mustang 1 1 1,000 1.5Tombstone 1 1 554 0.8Insecticide Total 16,881 24.7NortharvestNone 124 81.6 73,059 79.8Warrior 15 9.9 13,046 14.3Asana 9 5.9 7,054 7.7Tombstone 3 2 3,704 4Mustang 2 1.3 1,200 1.3Brigade 1 0.7 130 0.1Insecticide Total 25,134 27.5
aRespondents’ acres only. Multiple applications count as multiple acres.bPercentages do not total 100 because some respondents treated morethan once with the same product and/or treated the same acreage with more thanone product.
Figure 19. Northarvest foliar insecticide use in dry beans in 2015.
0
10,000
20,000
30,000
40,000
50,000
60,000
70,000
80,000
Acr
es R
epor
ted

20 • E1802 2015 Dry Bean Grower Survey
Table 25. Soil insecticide and seed treatment use in dry beans in 2015.
Seed TreatmentRespondents
(no.)Respondents
(%)Acres reported
(no.)a,bAcres reported
(%)a,b
MinnesotaCruiser Maxx 23 51.1 10,397 48.4None 11 24.4 5,351 24.9Lorsban 9 20 5,195 24.2Don't know 7 15.6 2,210 10.3Dyna-Shield Imidacloprid 1 2.2 800 3.7Capture LFR* 2 4.4 710 3.3Cruiser 5FS 1 2.2 155 0.7Insecticide Total 19,467 90.7North DakotaCruiser Maxx 23 23.5 18,531 29None 32 32.7 18,407 28.8Don't know 28 28.6 16,834 26.3Lorsban 9 9.2 7,009 11Capture LFR* 5 5.1 3,620 5.7Gaucho 3 3.1 2,315 3.6Dyna-Shield Imidacloprid 2 2 1,055 1.6Cruiser 5FS 1 1 115 0.2Insecticide Total 49,479 77.4NortharvestCruiser Maxx 46 32.2 28,928 33.9None 43 30.1 23,758 27.8Don't know 35 24.5 19,044 22.3Lorsban 18 12.6 12,204 14.3Capture LFR* 7 4.9 4,330 5.1Gaucho 3 2.1 2,315 2.7Dyna-Shield Imidacloprid 3 2.1 1,855 2.2Cruiser 5FS 2 1.4 270 0.3Insecticide Total 68,946 80.7
aRespondents’ acres only.bPercentages do not total 100 because some respondents treated morethan once with the same product and/or treated the same acreage with more thanone product.*Soil-applied insecticide.
Figure 20. Northarvest insecticide seed treatment and soil insecticide use in dry beans in 2015.
0
5,000
10,000
15,000
20,000
25,000
30,000
35,000
Acr
es R
epor
ted

21 • E1802 2015 Dry Bean Grower Survey
Plant Diseases and Fungicide Use
2015 Northarvest Dry Bean Grower Survey, Page 19 of 4
Plant Diseases and Fungicide Use
Table 26. Worst disease problem in dry beans in 2015.
Respondents Respondents Acres reported Acres reportedDiseasea (no.) (%) (no.)b,c (%)b,c
MinnesotaWhite mold 30 60 11,497 49.3Common bacterial blight 9 18 7,795 33.5None 5 10 1,920 8.2Root rot 4 8 1,035 4.4Bean common mosaic virus 1 2 680 2.9Bacterial brown spot 1 2 370 1.6Total 50 100 23,297 100North DakotaWhite mold 51 51.5 35,638 53.1Common bacterial blight 18 18.2 14,131 21None 14 14.1 8,908 13.3Root rot 8 8.1 3,075 4.6Viruses (general) 1 1 2,500 3.7Rust 4 4 1,879 2.8Bacterial brown spot 2 2 921 1.4Anthracnose 1 1 120 0.2Total 99 100 67,172 100NortharvestWhite mold 81 54.4 47,135 52.1Common bacterial blight 27 18.1 21,926 24.2None 19 12.8 10,828 12Root rot 12 8.1 4,110 4.5Viruses (general) 1 0.7 2,500 2.8Rust 4 2.7 1,879 2.1Bacterial brown spot 3 2 1,291 1.4Bean common mosaic virus 1 0.7 680 0.8Anthracnose 1 0.7 120 0.1Total 149 100 90,469 100
aRanked as No. 1 disease problem by respondents.bRespondents’ acres only.cDisease problem may not have been present across all reported acres.
Figure 21. Northarvest worst disease problem in dry beans in 2015.
0
10,000
20,000
30,000
40,000
50,000
Acr
es R
epor
ted

22 • E1802 2015 Dry Bean Grower Survey
Table 27. Diseases ranked as one of the three worst in dry beans in 2015.
Respondents Respondents Acres reported Acres reportedDiseasea (no.) (%) (no.)b,c (%)b,c
MinnesotaWhite mold 41 82 19,637 84.3Common bacterial blight 23 46 13,717 58.9Root rot 18 36 9,765 41.9Rust 8 16 4,146 17.8Bacterial brown spot 6 12 3,414 14.7None 5 10 1,920 8.2Halo blight 4 8 1,484 6.4Bean common mosaic virus 1 2 680 2.9Bacterial wilt 1 2 130 0.6Anthracnose 3 6 55 0.2North DakotaWhite mold 67 67.7 45,612 67.9Common bacterial blight 36 36.4 29,613 44.1Rust 29 29.3 18,274 27.2Root rot 22 22.2 17,801 26.5None 14 14.1 8,908 13.3Anthracnose 8 8.1 8,742 13Bacterial brown spot 13 13.1 7,585 11.3Viruses (general) 6 6.1 5,752 8.6Halo blight 8 8.1 5,085 7.6Bacterial wilt 4 4 1,000 1.5Bean common mosaic virus 2 2 570 0.8NortharvestWhite mold 108 72.5 65,249 72.1Common bacterial blight 59 39.6 43,330 47.9Root rot 40 26.8 27,566 30.5Rust 37 24.8 22,420 24.8Bacterial brown spot 19 12.8 10,999 12.2None 19 12.8 10,828 12Anthracnose 11 7.4 8,797 9.7Halo blight 12 8.1 6,569 7.3Viruses (general) 6 4 5,752 6.4Bean common mosaic virus 3 2 1,250 1.4Bacterial wilt 5 3.4 1,130 1.2
aRanked as No. 1, 2 or 3 disease problem by respondents.bRespondents’ acres only.cDisease problem may not have been present across all reported acres.
Figure 22. Northarvest diseases ranked as one of the three worst in dry beans in 2015.
0
10,000
20,000
30,000
40,000
50,000
60,000
70,000
Acr
es R
epor
ted

23 • E1802 2015 Dry Bean Grower Survey
2015 Northarvest Dry Bean Grower Survey, Page 21 of 4
Table 28. Foliar and banded fungicide use in dry beans in 2015.
FungicideResp.(no.)
Resp.(%)b
Total acres
treated(no.)a
Total acres
treated(%)a,b
Acres treated by
ground(no.)a
Acres treated by
ground(%)a
Acres treated by
air(no.)a
Acres treated by
air(%)a
MinnesotaTopsin broadcast 27 54 11,174 48 6,998 18.8 4,176 11.2Endura 18 36 9,263 39.8 7,448 20 1,815 4.9Headline 4 8 4,650 20 4,650 12.5 0 0Incognito 5 10 3,264 14 3,264 8.8 0 0Proline broadcast 8 16 3,154 13.5 2,140 5.7 1,014 2.7Priaxor 4 8 2,500 10.7 2,440 6.5 60 0.2Topsin banded 1 2 1,100 4.7 1,100 3 0 0Folicur 1 2 929 4 0 0 929 2.5Omega 2 4 700 3 700 1.9 0 0Quadris Amstar 1 2 370 1.6 370 1 0 0Proline banded 1 2 130 0.6 130 0.3 0 0Contans 1 2 25 0.1 0 0 25 0.1None 6 12 2,038 8.7Fungicide Total 37,259 29,240 78.5 8,019 21.5North DakotaTopsin broadcast 42 41.2 34,162 50.1 31,802 33.1 2,360 2.5Endura 43 42.2 30,831 45.2 26,401 27.5 4,430 4.6Headline 4 3.9 6,617 9.7 6,617 6.9 0 0Priaxor 9 8.8 5,359 7.9 5,044 5.2 315 0.3Quadris Amstar 1 1 4,455 6.5 4,455 4.6 0 0Topsin banded 7 6.9 3,588 5.3 3,588 3.7 0 0Incognito 8 7.8 3,284 4.8 3,284 3.4 0 0Tebuconazole 6 5.9 2,720 4 2,570 2.7 150 0.2Proline broadcast 2 2 2,175 3.2 2,110 2.2 65 0.1Omega 1 1 1,250 1.8 1,250 1.3 0 0Quadris Opti 2 2 606 0.9 606 0.6 0 0ProPulse 2 2 510 0.7 510 0.5 0 0Microthiol 1 1 320 0.5 320 0.3 0 0Aproach 1 1 290 0.4 290 0.3 0 0None 22 21.6 10,027 14.7Fungicide Total 96,167 88,847 92.4 7,320 7.6NortharvestTopsin broadcast 69 45.4 45,336 49.5 38,800 29.1 6,536 4.9Endura 61 40.1 40,094 43.8 33,849 25.4 6,245 4.7Headline 8 5.3 11,267 12.3 11,267 8.4 0 0Priaxor 13 8.6 7,859 8.6 7,484 5.6 375 0.3Incognito 13 8.6 6,548 7.2 6,548 4.9 0 0Proline broadcast 10 6.6 5,329 5.8 4,250 3.2 1,079 0.8Quadris Amstar 2 1.3 4,825 5.3 4,825 3.6 0 0Topsin banded 8 5.3 4,688 5.1 4,688 3.5 0 0Tebuconazole 6 3.9 2,720 3 2,570 1.9 150 0.1Omega 3 2 1,950 2.1 1,950 1.5 0 0Folicur 1 0.7 929 1 0 0 929 0.7Quadris Opti 2 1.3 606 0.7 606 0.5 0 0ProPulse 2 1.3 510 0.6 510 0.4 0 0Microthiol 1 0.7 320 0.3 320 0.2 0 0Aproach 1 0.7 290 0.3 290 0.2 0 0Proline banded 1 0.7 130 0.1 130 0.1 0 0Contans 1 0.7 25 0 0 0 25 0None 28 18.4 12,065 13.2Fungicide Total 133,426 118,087 88.5 15,339 11.5
aRespondents’ acres only. Includes acreage treated more than once with the same product.bPercentages do not total 100 because some respondents treated more than once with the same product and/or treated the sameacreage with more than one product.

24 • E1802 2015 Dry Bean Grower Survey
Table 29. In-furrow fungicide use in dry beans in 2015.
Seed treatmentRespondents
(no.)Respondents
(%)Total acres
treated (no.)aTotal acres
treated (%)a,b
MinnesotaHeadline 4 8.5 1,460 6.6Priaxor 1 2.1 100 0.5None 42 89.4 19,533 88.5Fungicide Total 1,560North DakotaEndura 3 3.1 5,155 7.9Serenade 1 1 80 0.1None 94 95.9 57,071 88Fungicide Total 5,235NortharvestEndura 3 2.1 5,155 5.9Headline 4 2.8 1,460 1.7Priaxor 1 0.7 100 0.1Serenade 1 0.7 80 0.1None 136 93.8 76,604 88.1Fungicide Total 6,795
aRespondents’ acres only.
05,000
10,00015,00020,00025,00030,00035,00040,00045,00050,000
Acr
es R
epor
ted
Figure 23. Northarvest foliar and banded fungicide use in dry beans in 2015.
Figure 24. Northarvest fungicide application method in dry beans in 2015.
0
20,000
40,000
60,000
80,000
100,000
120,000
140,000
Ground Air
Acr
es R
epor
ted
Figure 25. Northarvest in-furrow fungicide use in dry beans in 2015.
0
10,000
20,000
30,000
40,000
50,000
60,000
70,000
80,000
90,000
Endura Headline Priaxor Serenade None
Acr
es R
epor
ted

25 • E1802 2015 Dry Bean Grower Survey
2015 Northarvest Dry Bean Grower Survey, Page 23 of 4
Table 30. Fungicide seed treatment use in dry beans in 2015.
Seed treatmentRespondents
(no.)Respondents
(%)bTotal acres
treated (no.)aTotal acres
treated (%)a,b
MinnesotaApron Maxx 24 52.2 10,325 55.3Dynasty 11 23.9 5,581 29.9Rancona 7 15.2 3,831 20.5Apron/Apron XL 9 19.6 3,453 18.5Maxim 8 17.4 3,151 16.9Vibrance 3 6.5 1,577 8.4Don't know 4 8.7 1,029 5.5Stamina 1 2.2 800 4.3Captan 1 2.2 430 2.3Headline 1 2.2 400 2.1None 7 15.2 1,995 10.7Seed Treatment Total 30,577North DakotaApron Maxx 35 36.1 28,844 45.4Dynasty 17 17.5 14,118 22.2Apron/Apron XL 18 18.6 12,790 20.1Maxim 14 14.4 12,619 19.8Rancona 9 9.3 6,693 10.5Don't know 9 9.3 6,230 9.8Captan 7 7.2 4,715 7.4Headline 1 1 4,455 7Stamina 3 3.1 2,857 4.5Metalaxyl 1 1 897 1.4Thiram 1 1 897 1.4Streptomycin 1 1 745 1.2Rancona Summit 1 1 315 0.5Vibrance 1 1 230 0.4None 31 32 13,533 21.3Seed Treatment Total 96,405NortharvestApron Maxx 59 41.3 39,169 47.6Dynasty 28 19.6 19,699 23.9Apron/Apron XL 27 18.9 16,243 19.7Maxim 22 15.4 15,770 19.2Rancona 16 11.2 10,524 12.8Don't know 13 9.1 7,259 8.8Captan 8 5.6 5,145 6.3Headline 2 1.4 4,855 5.9Stamina 4 2.8 3,657 4.4Vibrance 4 2.8 1,807 2.2Metalaxyl 1 0.7 897 1.1Thiram 1 0.7 897 1.1Streptomycin 1 0.7 745 0.9Rancona Summit 1 0.7 315 0.4None 38 26.6 15,528 18.9Seed Treatment Total 126,982
aRespondents’ acres only. Includes acreage treated with more than one product.bPercentages do not total 100 because some respondents treated the same acreage with more than one product.
Figure 26. Northarvest fungicide seed treatment use in dry beans in 2015.
05,000
10,00015,00020,00025,00030,00035,00040,00045,000
Acr
es R
epor
ted

26 • E1802 2015 Dry Bean Grower Survey
Weeds and Herbicide Use
2015 Northarvest Dry Bean Grower Survey, Page 25 of 4
Weeds and Herbicide Use
Table 31. Worst weed problem in dry beans in 2015.
WeedaRespon-
dents (no.)Respon-dents (%)
Acresreported (no.)b,c
Acresreported (%)b,c
MinnesotaLambsquarters 20 39.2 10,661 45.1Waterhemp 10 19.6 3,766 15.9Ragweed 7 13.7 2,777 11.7Nightshade 4 7.8 2,369 10Redroot pigweed 3 5.9 1,703 7.2Wild mustard 2 3.9 900 3.8Biennial wormwood 1 2 600 2.5Kochia 2 3.9 515 2.2None 1 2 230 1Canada thistle 1 2 130 0.5Total 51 100 23,651 100North DakotaKochia 24 23.8 12,974 19.1Lambsquarters 16 15.8 11,861 17.4Redroot pigweed 9 8.9 9,867 14.5Ragweed 14 13.9 7,890 11.6Wild mustard 9 8.9 5,818 8.5Biennial wormwood 4 4 3,435 5Foxtail 3 3 3,249 4.8Nightshade 3 3 3,147 4.6Canada thistle 4 4 2,916 4.3Volunteer grain 7 6.9 2,738 4Wild buckwheat 4 4 1,695 2.5Cocklebur 1 1 1,200 1.8Sunflower 1 1 1,033 1.5Waterhemp 2 2 264 0.4Total 101 100 68,087 100NorthharvestLambsquarters 36 23.7 22,522 24.6Kochia 26 17.1 13,489 14.7Redroot pigweed 12 7.9 11,570 12.6Ragweed 21 13.8 10,667 11.6Wild mustard 11 7.2 6,718 7.3Nightshade 7 4.6 5,516 6Biennial wormwood 5 3.3 4,035 4.4Waterhemp 12 7.9 4,030 4.4Foxtail 3 2 3,249 3.5Canada thistle 5 3.3 3,046 3.3Volunteer grain 7 4.6 2,738 3Wild buckwheat 4 2.6 1,695 1.8Cocklebur 1 0.7 1,200 1.3Sunflower 1 0.7 1,033 1.1None 1 0.7 230 0.3Total 152 100 91,738 100aRanked as No. 1 weed problem by respondents.bRespondents’ acres only.cWeed problem may not have been present across all reported acres.
Figure 27. Northarvest w
orst weed problem
in dry beansin 2015.

27 • E1802 2015 Dry Bean Grower Survey
Table 32. Weeds ranked as one of the three worst in dry beans in 2015.
Weeda
Respon-dents (no.)
Respon-dents
(%)
Acresreported
(no.)b
Acresreported
(%)b Weeda
Respon-dents (no.)
Respon-dents
(%)
Acresreported
(no.)b
Acresreported
(%)b
Minnesota NortharvestLambsquarters 38 74.5 17,854 75.5 Lambsquarters 75 49.3 46,519 50.7Ragweed 28 54.9 15,727 66.5 Kochia 52 34.2 35,635 38.8Redroot pigweed 17 33.3 8,822 37.3 Redroot pigweed 50 32.9 33,654 36.7Waterhemp 17 33.3 6,799 28.7 Ragweed 54 35.5 32,979 35.9Nightshade 11 21.6 4,572 19.3 Nightshade 29 19.1 18,182 19.8Biennial wormwood 5 9.8 2,307 9.8 Volunteer grain 26 17.1 15,725 17.1
Wild buckwheat 6 11.8 2,268 9.6Biennial wormwood 22 14.5 14,743 16.1
Cocklebur 4 7.8 1,611 6.8 Wild mustard 24 15.8 12,739 13.9Wild oat 3 5.9 1,320 5.6 Canada thistle 20 13.2 10,743 11.7Canada thistle 4 7.8 1,290 5.5 Cocklebur 14 9.2 9,058 9.9Volunteer grain 2 3.9 1,179 5 Waterhemp 23 15.1 8,558 9.3Kochia 3 5.9 1,115 4.7 Wild buckwheat 19 12.5 8,176 8.9Wild mustard 3 5.9 1,100 4.7 Foxtail 13 8.6 6,685 7.3Foxtail 3 5.9 910 3.8 Smartweed 5 3.3 2,893 3.2Black medic 1 2 339 1.4 Wild oat 6 3.9 2,621 2.9Smartweed 1 2 180 0.8 Sunflower 3 2 1,785 1.9North Dakota False chamomile 2 1.3 1,400 1.5Kochia 49 48.5 34,520 50.7 Volunteer canola 1 0.7 1,250 1.4Lambsquarters 37 36.6 28,665 42.1 Venice mallow 2 1.3 951 1Redroot pigweed 33 32.7 24,832 36.5 Milkweed 1 0.7 620 0.7Ragweed 26 25.7 17,252 25.3 Black medic 1 0.7 339 0.4Volunteer grain 24 23.8 14,546 21.4 Marestail 1 0.7 111 0.1Nightshade 18 17.8 13,610 20 aRanked as No. 1, 2 or 3 weed by respondents.
bRespondents’ acres only.cWeed problem may not have been present across all reported acres.
Biennial wormwood 17 16.8 12,436 18.3Wild mustard 21 20.8 11,639 17.1Canada thistle 16 15.8 9,453 13.9Cocklebur 10 9.9 7,447 10.9Wild buckwheat 13 12.9 5,908 8.7Foxtail 10 9.9 5,775 8.5Smartweed 4 4 2,713 4Sunflower 3 3 1,785 2.6Waterhemp 6 5.9 1,759 2.6False chamomile 2 2 1,400 2.1Wild oat 3 3 1,301 1.9Volunteer canola 1 1 1,250 1.8Venice mallow 2 2 951 1.4Milkweed 1 1 620 0.9Marestail 1 1 111 0.2
Figure 28. Northarvest weeds ranked as one of worst three in dry beans in 2015.
0
10,000
20,000
30,000
40,000
50,000
Acr
es R
epor
ted

28 • E1802 2015 Dry Bean Grower Survey
2015 Northarvest Dry Bean Grower Survey, Page 27 of 4
Table 33. Weed control practices used in dry beans in 2015.
Herbicide orother practice
Acresreported (no.)a
Acresreported (%)b
Herbicide orother practice
Acresreported (no.)a
Acresreported (%)b
Minnesota NortharvestRaptor 20,726 87.6 Raptor 81,406 88.1Reflex 15,476 65.4 Basagran 55,055 59.6Basagran 13,420 56.7 Reflex 48,629 52.7Select 9,837 41.6 Rezult 38,486 41.7Rezult 7,510 31.8 Select 33,763 36.6Prowl 6,938 29.3 Sonalan 26,179 28.3Sonalan 6,093 25.8 Prowl 20,077 21.7Dual 5,288 22.4 Spartan Charge 13,854 15.0Eptam 4,003 16.9 Glyphosate (preplant) 13,675 14.8Permit 3,795 16.0 Pursuit 10,147 11.0Outlook 2,357 10.0 Assure 9,545 10.3Trifluralin 1,879 7.9 Trifluralin 8,817 9.5Assure 1,101 4.7 Permit 8,329 9.0Glyphosate (preplant) 874 3.7 Dual 5,288 5.7Poast 868 3.7 Eptam 4,920 5.3Pursuit 380 1.6 BroadAxe 4,848 5.2Spartan Charge 350 1.5 Outlook 4,121 4.5Fusilade 210 0.9 Glyphosate (postharvest) 2,110 2.3Cultivation 10,241 43.3 Spartan Elite 1,735 1.9Rotary hoe 954 4.0 Poast 1,288 1.4Manual labor 1,645 7.0 Fusilade 210 0.2Herbicide Total 101,105 Cultivation 39,180 42.4North Dakota Rotary hoe 3,915 4.2Raptor 60,680 88.3 Manual labor 1,652 1.8Basagran 41,635 60.6 Herbicide Total 392,482Reflex 33,153 48.2 aRespondents’ acres only. Includes acreage treated more
than once with the same product.bPercentages do not total 100 because some respondents treated more than once with the same product and/or treated the same acreage with more than one product.cHerbicide total does not include cultivation, rotary hoe or manual labor acres.
Rezult 30,976 45.1Select 23,926 34.8Sonalan 20,086 29.2Spartan Charge 13,504 19.7Prowl 13,139 19.1Glyphosate (preplant) 12,801 18.6Pursuit 9,767 14.2Assure 8,444 12.3Trifluralin 6,938 10.1BroadAxe 4,848 7.1Permit 4,534 6.6Glyphosate (postharvest) 2,110 3.1Outlook 1,764 2.6Spartan Elite 1,735 2.5Eptam 917 1.3Poast 420 0.6Cultivation 28,939 42.1Rotary hoe 2,961 4.3Manual labor 7 0.0Herbicide Total 291,377
Figure 29. Northarvest weed control practices used in dry beans in 2015.

29 • E1802 2015 Dry Bean Grower Survey
Table 34. Weed control practices used by dry bean market class in 2015.
Herbicide or other practice Black Cranberry
GreatNorthern Kidney Navy Pink Pinto Red
% Acres Treateda,b
MinnesotaAssure 3.6 0 0 0 11.5 0 0 0Basagran 67.5 0 0 60.4 47.9 62.2 33.2 0Dual 41.2 0 0 20 18 0 0 0Eptam 10.7 0 0 12.1 26.1 37.8 0 0Fusilade 0 0 0 0 2.5 0 0 0Glyphosate (preplant) 7.1 0 0 0 6.9 0 0 0Outlook 3.1 0 0 16.4 6.4 0 0 0Permit 7.1 0 0 26.2 9.6 0 0 0Poast 20.7 0 0 0 0 0 0 0Prowl 37.6 0 0 39.1 13.2 62.2 0 0Pursuit 0 0 0 0 1.8 62.2 0 0Raptor 81.6 0 0 86.3 91 100 100.2 0Reflex 77.2 0 0 69.9 55 37.8 67 0Rezult 19 0 0 28.6 43 37.8 12.4 0Select 46.7 0 0 45.7 32.3 0 100.2 0Sonalan 8.4 0 0 11.2 49.6 0 100.2 0Spartan Charge 3.3 0 0 0 2.5 0 0 0Trifluralin 0 0 0 6.6 12.8 37.8 0 0Cultivation 10.7 0 0 57.2 38.3 62.2 100.2 0Rotary hoe 4.8 0 0 0 3.3 0 100.2 0Manual labor 6 0 0 12 1.8 0 0 0North DakotaAssure 18.2 0 100 0 2.3 0 11.7 19.2Basagran 33.3 0 12.5 78.4 87.3 0 66.2 76.2BroadAxe 0 0 0 0 3.9 0 10.4 19.5Eptam 0 0 0 0 1.7 0 1.9 0Glyphosate (preplant) 14.6 0 0 0 7.3 0 23 38.7Glyphosate (postharvest) 9.5 0 0 36 0 0 0 20.5Outlook 0 0 0 0 0 0 4.5 0Permit 7.9 0 100 38.7 3.6 0 4 37.9Poast 0 0 0 0 1.9 0 0.6 0Prowl 36.1 100 0 60.4 6 0 13.9 39.2Pursuit 18.2 0 0 36 10.6 0 13.4 20.5Raptor 96.8 100 25 114.4 89.4 157.2 83 96.7Reflex 61.7 0 75 114.4 51.3 114.4 36.5 115.9Rezult 67.9 100 0 25.2 41.8 42.8 39.3 0Select 11.4 0 0 78.4 48.5 0 40.7 53.5Sonalan 11.4 0 0 0 43.9 100 33.1 14.5Spartan Elite 9.1 0 0 0 0 0 0.8 0Spartan Charge 19.8 0 100 14.4 6.5 0 22.3 26.9Trifluralin 5.7 0 0 25.2 26.8 0 8.4 0Cultivation 9 100 50 64.9 59.6 191.1 48.7 14.5Rotary hoe 7.9 100 0 0 5.9 0 2.1 0NortharvestAssure 15.1 0 100 0 6.5 0 11.5 19.2Basagran 40.5 0 12.5 61.3 69.1 19.9 65.8 76.2BroadAxe 0 0 0 0 2.1 0 10.3 19.5Dual 8.6 0 0 19 8.3 0 0 0Eptam 2.2 0 0 11.5 13 12.1 1.9 0Fusilade 0 0 0 0 1.2 0 0 0Glyphosate (preplant) 13 0 0 0 7.1 0 22.7 38.7Glyphosate (postharvest) 7.5 0 0 1.8 0 0 0 20.5Outlook 0.6 0 0 15.6 3 0 4.4 0Permit 7.8 0 100 26.8 6.4 0 4 37.9Poast 4.3 0 0 0 1 0 0.6 0Prowl 36.4 100 0 40.2 9.3 19.9 13.7 39.2Pursuit 14.4 0 0 1.8 6.6 19.9 13.2 20.5Raptor 93.7 100 25 87.7 90.2 138.9 83.2 96.7Reflex 65 0 75 72.2 53 89.9 36.9 115.9Rezult 57.6 100 0 28.4 42.3 41.2 39 0Select 18.8 0 0 47.4 41 0 41.5 53.5Sonalan 10.7 0 0 10.6 46.6 67.9 33.9 14.5Spartan Elite 7.2 0 0 0 0 0 0.8 0Spartan Charge 16.3 0 100 0.7 4.7 0 22 26.9Trifluralin 4.5 0 0 7.5 20.3 12.1 8.3 0Cultivation 9.4 100 50 57.6 49.8 149.7 49.4 14.5Rotary hoe 7.3 100 0 0 4.7 0 3.3 0Manual labor 1.3 0 0 11.4 0.8 0 0 0
aRespondents’ acres only. Includes acreage treated more than once with the same product.
2015 Northarvest Dry Bean Grower Survey, Page 29 of 4
bPercentages do not total 100 because some respondents treated more than once with the same product and/or treated the same acreage with more than one product.
Scouting and Threshold Practices
Table 35. Scouting practices in dry beans in 2015.
Insects Diseases Weeds
MinnesotaRespon-
dents (no.)Respon-dents (%)
Respon-dents (no.)
Respon-dents (%)
Respon-dents (no.)
Respon-dents (%)
Grower 18 35.3 17 33.3 18 35.3Crop consultant 25 49 25 49 24 47.1Both 8 15.7 8 15.7 9 17.6Don’t scout 0 0 1 2 0 0Total 51 100 51 100 51 100North DakotaGrower 44 42.7 44 43.1 49 48Crop consultant 41 39.8 45 44.1 42 41.2Both 9 8.7 11 10.8 11 10.8Don’t scout 9 8.7 2 2 0 0Total 103 100 102 100 102 100NortharvestGrower 62 40.3 61 39.9 67 43.8Crop consultant 66 42.9 70 45.8 66 43.1Both 17 11 19 12.4 20 13.1Don’t scout 9 5.8 3 2 0 0Total 154 100 153 100 153 100
Table 36. Use of economic thresholds for insects in dry beans in 2015.
Respondents(no.)
Respondents(%)
MinnesotaEconomic thresholds used 49 98Economic thresholds not used 1 2Total 50 100North DakotaEconomic thresholds used 92 90.2Economic thresholds not used 10 9.8Total 102 100NortharvestEconomic thresholds used 141 92.8Economic thresholds not used 11 7.2Total 152 100

30 • E1802 2015 Dry Bean Grower Survey
Scouting and Threshold Practices
2015 Northarvest Dry Bean Grower Survey, Page 29 of 4
bPercentages do not total 100 because some respondents treated more than once with the same product and/or treated the same acreage with more than one product.
Scouting and Threshold Practices
Table 35. Scouting practices in dry beans in 2015.
Insects Diseases Weeds
MinnesotaRespon-
dents (no.)Respon-dents (%)
Respon-dents (no.)
Respon-dents (%)
Respon-dents (no.)
Respon-dents (%)
Grower 18 35.3 17 33.3 18 35.3Crop consultant 25 49 25 49 24 47.1Both 8 15.7 8 15.7 9 17.6Don’t scout 0 0 1 2 0 0Total 51 100 51 100 51 100North DakotaGrower 44 42.7 44 43.1 49 48Crop consultant 41 39.8 45 44.1 42 41.2Both 9 8.7 11 10.8 11 10.8Don’t scout 9 8.7 2 2 0 0Total 103 100 102 100 102 100NortharvestGrower 62 40.3 61 39.9 67 43.8Crop consultant 66 42.9 70 45.8 66 43.1Both 17 11 19 12.4 20 13.1Don’t scout 9 5.8 3 2 0 0Total 154 100 153 100 153 100
Table 36. Use of economic thresholds for insects in dry beans in 2015.
Respondents(no.)
Respondents(%)
MinnesotaEconomic thresholds used 49 98Economic thresholds not used 1 2Total 50 100North DakotaEconomic thresholds used 92 90.2Economic thresholds not used 10 9.8Total 102 100NortharvestEconomic thresholds used 141 92.8Economic thresholds not used 11 7.2Total 152 100

31 • E1802 2015 Dry Bean Grower Survey
References
Bradley, C.A., and Luecke, J.L. 2004. 2002 Dry Bean Grower Survey of Pest Problems and Pesticide Use in Minnesota and North Dakota. NDSU Extension Rpt. PP-1265.
Knodel, J.J., Beauzay, P.B., Franzen, D.W., Kandel, H.J., Markell, S.G., Osorno, J.M., Pasche, J.S., and Zollinger, R.K. 2015. 2014 Dry Bean Grower Survey of Production, Pest Problems and Pesticide Use in Minnesota and North Dakota. NDSU Extension Rpt. E-1750.
Knodel, J.J., Beauzay, P.B., Franzen, D.W., Kandel, H.J., Markell, S.G., Osorno, J.M., Pasche, J.S., and Zollinger, R.K. 2014. 2013 Dry Bean Grower Survey of Production, Pest Problems and Pesticide Use in Minnesota and North Dakota. NDSU Extension Rpt. E-1710.
Knodel, J.J., Beauzay, P.B., Franzen, D.W., Kandel, H.J., Markell, S.G., Osorno, J.M., and Zollinger, R.K. 2013. 2012 Dry Bean Grower Survey of Pest Problems and Pesticide Use in Minnesota and North Dakota. NDSU Extension Rpt. E-1640.
Knodel, J.J., Beauzay, P.B., Franzen, D.W., Kandel, H.J., Markell, S.G., Osorno, J.M., and Zollinger, R.K. 2012. 2011 Dry Bean Grower Survey of Pest Problems and Pesticide Use in Minnesota and North Dakota. NDSU Extension Rpt. E-1602.
Knodel, J.J., Luecke, J.L., Beauzay, P.B., Franzen, D.W., Kandel, H.J., Markell, S.G., Osorno, J.M., and Zollinger, R.K. 2011. 2010 Dry Bean Grower Survey of Pest Problems and Pesticide Use in Minnesota and North Dakota. NDSU Extension Rpt. E-1522 (revised).
Knodel, J.J., Luecke, J.L., Beauzay, P.B., Franzen, D.W., Kandel, H.J., Markell, S.G., Osorno, J.M., and Zollinger, R.K. 2010. 2009 Dry Bean Grower Survey of Pest Problems and Pesticide Use in Minnesota and North Dakota. NDSU Extension Rpt. E-1421 (revised).
Knodel, J.J., Luecke, J.L., Beauzay, P.B., Franzen, D.W., Kandel, H.J., Markell, S.G., Osorno, J.M., and Zollinger, R.K. 2009. 2008 Dry Bean Grower Survey of Pest Problems and Pesticide Use in Minnesota and North Dakota. NDSU Extension Rpt. E-1421 (revised).
Knodel, J.J., Luecke, J.L., Beauzay, P.B., Franzen, D.W., Kandel, H.J., Markell, S.G., Osorno, J.M., and Zollinger, R.K. 2008. 2007 Dry Bean Grower Survey of Pest Problems and Pesticide Use in Minnesota and North Dakota. NDSU Extension Rpt. PP-1392.
Knodel, J.J., Luecke, J.L., Beauzay, P.B., Franzen, D.W., Kandel, H.J., Markell, S.G., Osorno, J.M., and Zollinger, R.K. 2008. 2006 Dry Bean Grower Survey of Pest Problems and Pesticide Use in Minnesota and North Dakota. NDSU Extension Rpt. PP-1265 (revised).
Knodel, J.J., Bradley, C.A., Luecke, J.L., and Mars, G.A. 2008. 2004 and 2005 Dry Bean Grower Survey of Pest Problems and Pesticide Use in Minnesota and North Dakota. NDSU Extension Rpt. PP-1265 (revised).
Lamey, H.A., Berglund, D.R., McMullen, M.P., Luecke, J.L., Venette, J.R., McBride, D.K., Zollinger, R.K., and Grafton, K.F. 1993.
1991 Dry Bean Grower Survey of Pest Problems and Pesticide Use in Minnesota and North Dakota. NDSU Extension Rpt. 13.
Lamey, H.A., Berglund, D.R., McMullen, M.P., Luecke, J.L., Zollinger, R.K., Glogoza, P.A., Venette, J.R., McBride, D.K., and Grafton, K.F. 1994. 1992 Dry Bean Grower Survey of Pest Problems and Pesticide Use in Minnesota and North Dakota. NDSU Extension Rpt. 19.
Lamey, H.A., Berglund, D.R., McMullen, M.P., Zollinger, R.K., Venette, J.R., McBride, D.K., Venette, S.J., and Venette, R.C. 1992. 1990 Dry Bean Grower Survey of Pest Problems and Pesticide Use in Minnesota and North Dakota. NDSU Extension Rpt. 10.
Lamey, H.A., Dexter, A.G., McBride, D.K., Venette, R.C., and Venette, J.R. 1990. Problems and Practices of Northarvest Dry Bean Growers in 1988. N.D. Farm Res. 48(20):6-11, 14.
Lamey, H.A., McMullen, M.P., Glogoza, P.A., Zollinger, R.K., Luecke, J.L., Berglund, D.R., Venette, J.R., and Grafton, K.F. 1998. 1996 Dry Bean Grower Survey of Pest Problems and Pesticide Use in Minnesota and North Dakota. NDSU Extension Rpt. 44.
Lamey, H.A., Zollinger, R.K., Luecke, J.L., Berglund, D.R., Glogoza, P.A., and Grafton, K.F. 2001. 2000 Dry Bean Grower Survey of Pest Problems and Pesticide Use in Minnesota and North Dakota. NDSU Extension Rpt. 72.
Lamey, H.A., Zollinger, R.K., McBride, D.K., Venette, R.C., and Venette, J.R. 1991. Production Problems and Practices of Northarvest Dry Bean Growers in 1989. N.D. Farm Res. 29(2):17-24.
Lamey, H.A., Zollinger, R.K., McMullen, M.P., Luecke, J.L., Grafton, K.F., Berglund, D.R., Venette, J.R., and Glogoza, P.A. 1996. 1994 Dry Bean Grower Survey of Pest Problems and Pesticide Use in Minnesota and North Dakota. NDSU Extension Rpt. 28.
Lamey, H.A., Zollinger, R.K., Venette, J.R., Berglund, D.R., Luecke, J.L., Grafton, K.F., and Glogoza, P.A. 1997. 1995 Dry Bean Grower Survey of Pest Problems and Pesticide Use in Minnesota and North Dakota. NDSU Extension Rpt. 33.
Lamey, H.A., Zollinger, R.K., Venette, J.R., McMullen, M.P., Luecke, J.L., Glogoza, P.A., Grafton, K.F., and Berglund, D.R. 1999. 1997 Dry Bean Grower Survey of Pest Problems and Pesticide Use in Minnesota and North Dakota. NDSU Extension Rpt. 47.
Lamey, H.A., Zollinger, R.K., McMullen, M.P., Luecke, J.L., Venette, J.R., Berglund, D.R., Grafton, K.F., and Glogoza, P.A. 1999. 1998 Dry Bean Grower Survey of Pest Problems and Pesticide Use in Minnesota and North Dakota. NDSU Extension Rpt. 58.
Lamey, H.A., Zollinger, R.K., McMullen, M.P., Luecke, J.L., Venette, J.R., Berglund, D.R., Grafton, K.F., and Glogoza, P.A. 2000. 1999 Dry Bean Grower Survey of Pest Problems and Pesticide Use in Minnesota and North Dakota. NDSU Extension Rpt. 64.
Venette, J.R., Lamey, H.A., Peterson, D.E., and Venette, R.C. 1989. Problems and Practices of Dry Edible Bean Production in North Dakota and Minnesota, 1987. N.D. Farm Res. 46(5):25-31.
32 • E1802 2015 Dry Bean Grower Survey
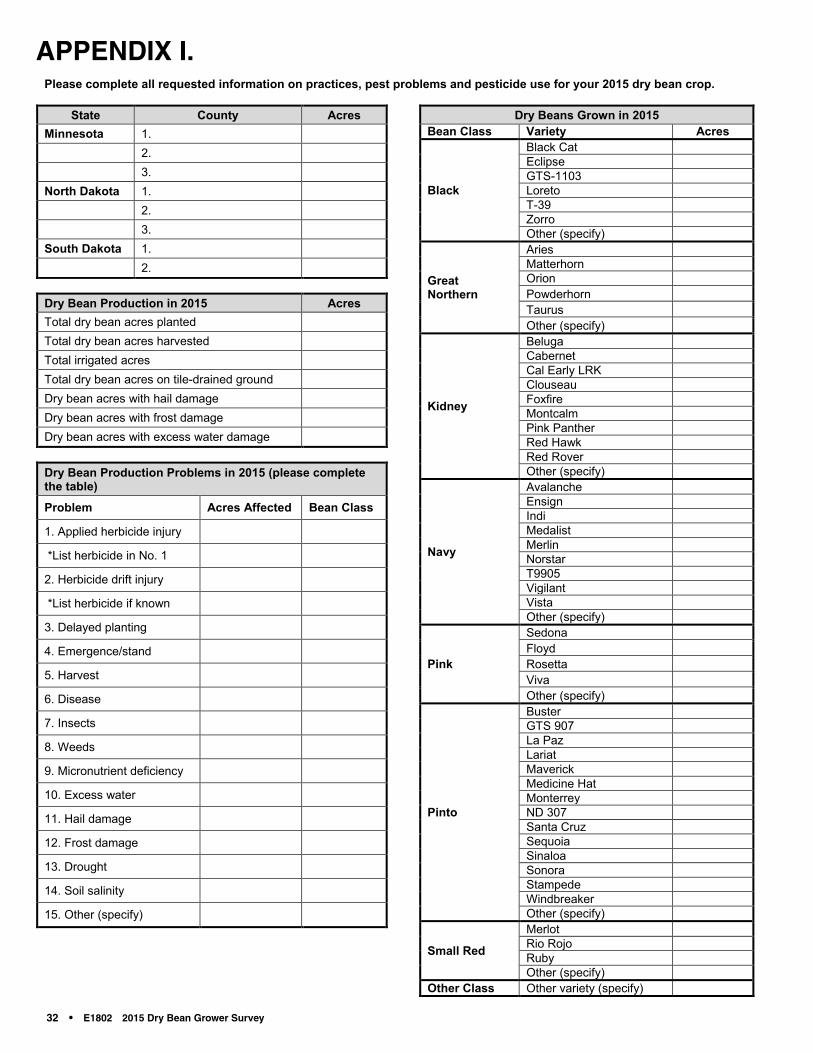
APPENDIX I.APPENDIX I.Please complete all requested information on practices, pest problems and pesticide use for your 2015 dry bean crop.
State County AcresMinnesota 1.
2.3.
North Dakota 1.2.3.
South Dakota 1.2.
Dry Bean Production in 2015 AcresTotal dry bean acres plantedTotal dry bean acres harvestedTotal irrigated acresTotal dry bean acres on tile-drained groundDry bean acres with hail damageDry bean acres with frost damageDry bean acres with excess water damage
Dry Bean Production Problems in 2015 (please complete the table)
Problem Acres Affected Bean Class
1. Applied herbicide injury
*List herbicide in No. 1
2. Herbicide drift injury
*List herbicide if known
3. Delayed planting
4. Emergence/stand
5. Harvest
6. Disease
7. Insects
8. Weeds
9. Micronutrient deficiency
10. Excess water
11. Hail damage
12. Frost damage
13. Drought
14. Soil salinity
15. Other (specify)
Dry Beans Grown in 2015Bean Class Variety Acres
Black
Black CatEclipseGTS-1103LoretoT-39ZorroOther (specify)
Great Northern
AriesMatterhornOrionPowderhornTaurusOther (specify)
Kidney
BelugaCabernetCal Early LRKClouseauFoxfireMontcalmPink PantherRed HawkRed RoverOther (specify)
Navy
AvalancheEnsignIndiMedalistMerlinNorstarT9905VigilantVistaOther (specify)
Pink
SedonaFloydRosettaVivaOther (specify)
Pinto
BusterGTS 907La PazLariatMaverickMedicine HatMonterreyND 307Santa CruzSequoiaSinaloaSonoraStampedeWindbreakerOther (specify)
Small Red
MerlotRio RojoRubyOther (specify)
Other Class Other variety (specify)

33 • E1802 2015 Dry Bean Grower Survey2 • E1750 2015 Dry Bean Survey
Agronomy
Please list row spacing and plants per acre for each bean class that you planted in 2015.
ClassRow
Spacing (inches)
Live Seeds Planted Per
Acre OR Pounds Per
Acre
EstablishedStand (Plants
Per Acre)
Did the size of your purchased seed affect your ability to plant your intended acreage in 2015?
Problem Variety(ies)Number of
Acres (short or long)
Not enough seed Too much seedNo problem
Please list the crops in your dry bean crop rotation program for up to three fields planted to dry bean in 2015.
Year Field 1 Field 2 Field 3
2013
2012
2011
2010
Please list acreage for each tillage type listed below for your dry bean fields in 2015.
Tillage Type Acreage
Conventional
Minimum
Strip-till
No-till
Did you use a ground roller on your dry bean ground in 2015?
Timing Bean class Acres rolledPreplant Pre-emergePost-emergeDidn’t roll
Fertilizer Program for Dry Beans in 2015. Please indicate pounds per acre for fertilizer components and answer the questions.
Nitrogen Phosphate Potash Zinc Sulfur
Did you inoculate with Rhizobium? Yes No
Did you soil test prior to fertilizer application? Yes No
Did you use site-specific nutrient management for any fertilizers? Yes No
Harvest. Please circle one answer for each question.
What percentage of your dry bean crop was harvested using direct combining in 2015?
0% 1-25% 26-50% 51-75% 76-100%
Your estimated yield loss using direct combining?
0% 1-5% 6-10% 11-15% 16-20% N/A
Your estimated yield loss using conventional combining?
0% 1-5% 6-10% 11-15% 16-20% N/A
Insecticides and Insect Pests
Foliar Insecticides Used on Dry Beans in 2015. If you did not use a foliar insecticide, please write “0” for acres treated.
Foliar Insecticide(write in name or number from the list below)
AcresTreated
No. ofApplications
Application Method (circle one
for each application)
air ground
air ground
air ground
Foliar Insecticide Products
1. Asana XL 6. Mustang Maxx
2. Baythroid XL 7. Tombstone
3. Brigade/generics 8. Warrior / generics
4. Dimethoate 9. None used
5. Hero 10. Other (specify)

34 • E1802 2015 Dry Bean Grower Survey
2015 Northarvest Dry Bean Grower Survey, Page 3 of 4
Seed Treatment Insecticides Used on Dry Beans in 2015. If you did not use a seed treatment insecticide, please write “0” for acres treated.Seed Treatment Insecticide(write in name or number from the list below)
AcresTreated
Seed Treatment Insecticide Products1. Attendant 600 FS / 600 7. Gaucho 600
2. Capture LFR 8. Lorsban
3. Cruiser 5FS 9. None used
4. Cruiser Maxx 10. Other (please specify)
5. Dyna-Shield Imidacloprid 5 11. Don’t know
6. Enhance AW
Worst Insect/Mite Problem in 2015. Please rank 1-3, with1 = worst. Please mark ONLY three.Insect/Mite Pest RankArmywormsAphidsCutwormsBean leaf beetleFoliage caterpillarsGrasshoppersLeafhoppersSeed corn maggotsSpider mitesWirewormsNone
Fungicides and Disease ProblemsFoliar Fungicides Used on Dry Beans in 2015. If you did not use a fungicide, please write “0” for acres treated.Foliar Fungicide(write in name or number from the list below)
AcresTreated
No. ofApplications
ApplicationMethod
(circle one)
air ground
air ground
air ground
Foliar Fungicide Products1. Aproach 10. Omega 19. Rorval
2. Cannonball 11. Priaxor 20. Serenade
3. Champion 12. Proline 21. Switch
4. Copper 13. Proline (band) 22. Tebuconazole / generics
5. Contans 14. Proline (broad) 23. Topsin (banded)
6. Endura 15. ProPulse 24. Topsin (broadcast)
7. Headline 16. Quadris / Amstar
25. Vertisan
8. Incognito 17. Quadris Opti 26. Other (please specify)
9. Microthiol 18. Quilt 27. None used
Seed Treatment Fungicides Used on Dry Beans in 2015. If you did not use a seed treatment fungicide, please write “0” for acres treated.Seed Treatment Fungicide(write in name or number from the list below)
AcresTreated
Seed Treatment Fungicide Products1. Apron 11. Rancona Summit
2. ApronMaxx 12. Stamina
3. Captan 13. Spirato
4. Dynasty 14. Thiram
5. EverGol Energy 15. Trilex 2000
6. Headline 16. Trilex Summit
7. Maxim 17. Vibrance
8. Metalaxyl 18. None used
9. Prevail 19. Other (please specify)
10. Rancona
In-furrow Fungicide Applications Made on Dry Beans in 2015. If you did not make an in-furrow fungicide application, please write “0” for acres treated.In-furrow Fungicide(write in name or number from Foliar Fungicide Products List)
AcresTreated
Worst Disease Problem in 2015. Please rank 1-3, with1 = worst. Please mark ONLY three.Disease RankAnthracnoseBacterial brown spotBacterial wiltCommon bacterial blightHalo blightBean common mosaic virusOther viruses (general)Root rotRustWhite moldNone

35 • E1802 2015 Dry Bean Grower Survey4 • E1750 2015 Dry Bean Survey
Herbicides and Weed Problems
Weed Control Practices Used on Dry Beans in 2015.Count double herbicide applications, double cultivation, etc., as double acres.Weed Control Used(write in name or number from the list below)
BeanClass
AcresTreated
Weed Control Products and Practices1. Assure 11. Permit 21. Spartan Elite
2. Basagran/generics 12. Poast 22. Trifluralin
3. BroadAxe 13. Prowl 23. Cultivation
4. Dual/generics 14. Pursuit 24. Rotary hoe
5. Eptam 15. Raptor 25. Manual labor
6. Fusilade DX 16. Reflex 26. Other
7. Glyphosate (preplant) 17. Rezult 27. None used
8. Glyphosate (preharvest) 18. Select/generics
9. Glyphosate (postharvest) 19. Sonalan
10. Outlook 20. Spartan/Charge
Worst Weed Problem. Please rank 1-3, with 1 = worst.Please mark ONLY three.Weed Rank Weed RankBiennial wormwood SmartweedBlack medic SunflowerCanada thistle Venice mallowCocklebur Volunteer canolaFoxtail Volunteer grainKochia WaterhempLambsquarters Wild buckwheatLanceleaf sage Wild mustardNightshade Wild oatRagweed OtherRedroot pigweed None
Desiccants Used on Dry Beans in 2015.Count double applications as double acres.
Desiccant Used(write in name or number from the list below)
BeanClass
AcresTreated
Desiccant Products1. Glyphosate
2. Paraquat
3. Sharpen
4. Sodium chlorate (Leafex, Defol)
5. Valor
Field Scouting
Field Scouting in Dry Beans in 2015. For each question, please circle the best answer that applies to your operation.
How do you scout your dry bean fields for insects?
I do it Crop consultant Don’t scout
How do you scout your dry bean fields for diseases?
I do it Crop consultant Don’t scout
How do you scout your dry bean fields for weeds?
I do it Crop consultant Don’t scout
Do you follow recommended economic thresholds when making insect control decisions?
Yes No
Thank you for completing the 2015Dry Bean Grower Survey!

36 • E1802 2015 Dry Bean Grower Survey
For more information on this and other topics, see www.ag.ndsu.eduNDSU encourages you to use and share this content, but please do so under the conditions of our Creative Commons license. You may copy, distribute, transmit and adapt this work as long
as you give full attribution, don’t use the work for commercial purposes and share your resulting work similarly. For more information, visit www.ag.ndsu.edu/agcomm/creative-commons.North Dakota State University does not discriminate on the basis of age, color, disability, gender expression/identity, genetic information, marital status, national origin, public assistance status, race, religion,
sex, sexual orientation, or status as a U.S. veteran. Direct inquiries to: Vice Provost for Faculty and Equity, 201 Old Main, (701) 231-7708 or Title IX/ADA Coordinator, 102 Old Main, (701) 231-6409.
County Commissions, NDSU and U.S. Department of Agriculture Cooperating. This publication will be made available in alternative formats for people with disabilities upon request, (701) 231-7881.
1M-2-08; 600-12-08; 600-6-09; 400-4-10; 400-2-11; 300-2-12; 400-2-13; 300-3-14; 400-3-15; 400-3-16