
2015 Credit Slides Final - Ford – New Cars, Trucks, SUVs, … · 2018-07-18 · economic cycles...
67
CREDIT UNIVERSITY March 13, 2015
Transcript of 2015 Credit Slides Final - Ford – New Cars, Trucks, SUVs, … · 2018-07-18 · economic cycles...

CREDIT UNIVERSITY
March 13, 2015
SLIDE 1
CREDIT UNIVERSITY
Outline
• Ford Credit Strategic Value, Virtuous Circle and Value Proposition
• Scope of Operations
• Ford Credit Business Model and the Drivers of the Business– Originate: Buy it Right– Service: Operate Efficiently, Collect Effectively– Fund: Fund Efficiently, Manage Risk
• Ford Credit Profit Reporting

Anything else is just credit.

Ford Credit Strategic Value, Virtuous Circle and Value Proposition
SLIDE 3

SLIDE 4
FORD CREDIT STRATEGIC VALUE
• Profitably support Ford, its dealers and customers through economic cycles
• Strategic value delivered through:– More than 55 years of automotive financing experience– Consistent vehicle inventory financing, supporting automotive
production plans and dealer inventory requirements– Exclusive Ford and Lincoln retail and lease consumer
financing products; integrated marketing strategies

SLIDE 5
FORD CREDIT STRATEGIC VALUE
• Ford Credit is integrally tied to Ford Motor Company
• Our profitability is based on competitive leverage and return targets
• We have a relentless focus on driving value based on:– A competitive funding structure– A world-class operating cost structure– A world-class risk management organization
• Our comprehensive customer relationship management process enhances the sales and service experience, and drives repeat business for Ford and Lincoln
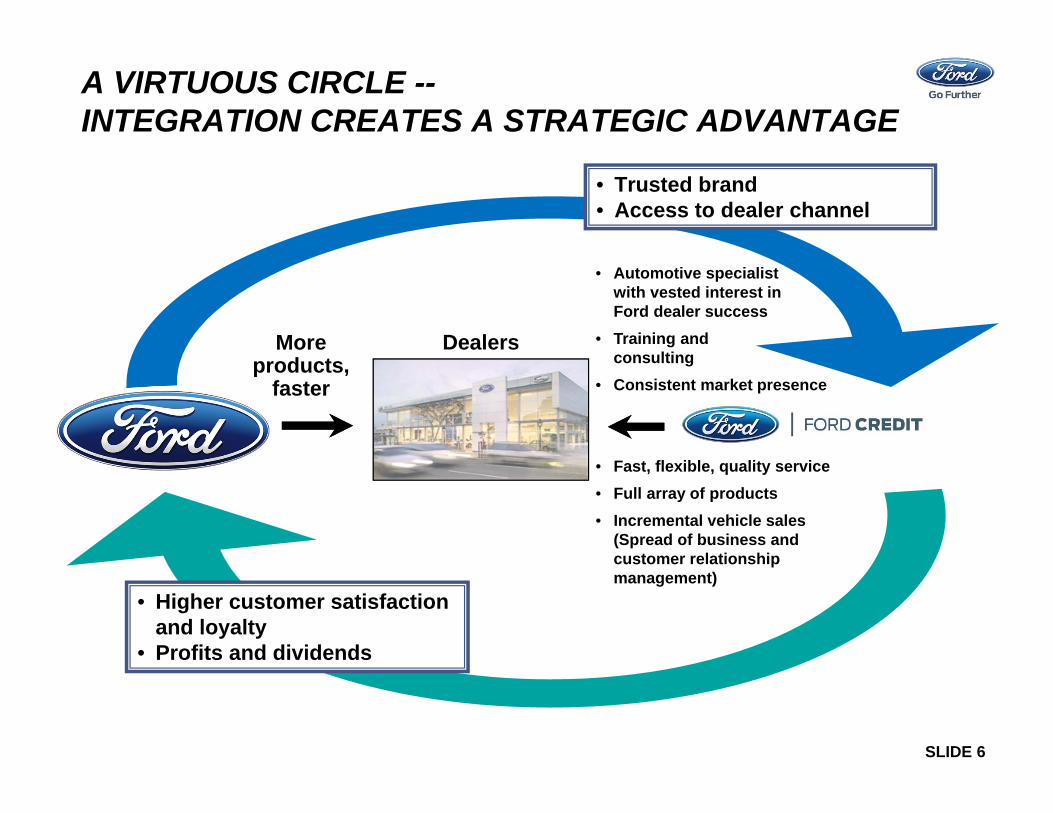
• Ford Credit’s processes and focus create the “Virtuous Circle”
SLIDE 6
A VIRTUOUS CIRCLE --INTEGRATION CREATES A STRATEGIC ADVANTAGE
• Automotive specialist with vested interest in Ford dealer success
• Training and consulting
• Consistent market presence
• Fast, flexible, quality service• Full array of products• Incremental vehicle sales
(Spread of business and customer relationship management)
More products,
faster
• Higher customer satisfaction and loyalty
• Profits and dividends
• Trusted brand• Access to dealer channel
Dealers

SLIDE 7
FORD CREDIT VALUE PROPOSITION --CUSTOMER LOYALTY TO FORD
Customers Who Finance With Ford Credit Are More Loyal To Ford Compared With Customers Who Finance With Other Lenders
25%
35%
45%
55%
65%
75%
2010 2011 2012 2013 2014
U.S. ‐ % Loyal to Ford & Lincoln
Ford Credit Dealer Arranged Customer Arranged
25%
35%
45%
55%
65%
75%
2009 2010 2011 2012 2013
Europe (Big 5 Markets) ‐ % Loyal to Ford*
Ford Credit Dealer Arranged Customer Arranged
Source: Maritz New Vehicle Customer Survey 2010-2014 Source: Internal* 2014 European Data will be available in 2Q 2015
17 ppts.
27 ppts.

SLIDE 8
FORD CREDIT VALUE PROPOSITION --U.S. CUSTOMER SATISFACTION WITH DEALER-ARRANGED FINANCING
40%
90%
Customers Are More Satisfied With Ford Credit Than Other Dealer-Arranged Financing
Ford Credit FinancingOther Dealer-Arranged Financing
6 ppts.
Source: Maritz New Vehicle Customer Survey 2010–2014
2010 2011 2012 2013 2014
SLIDE 9
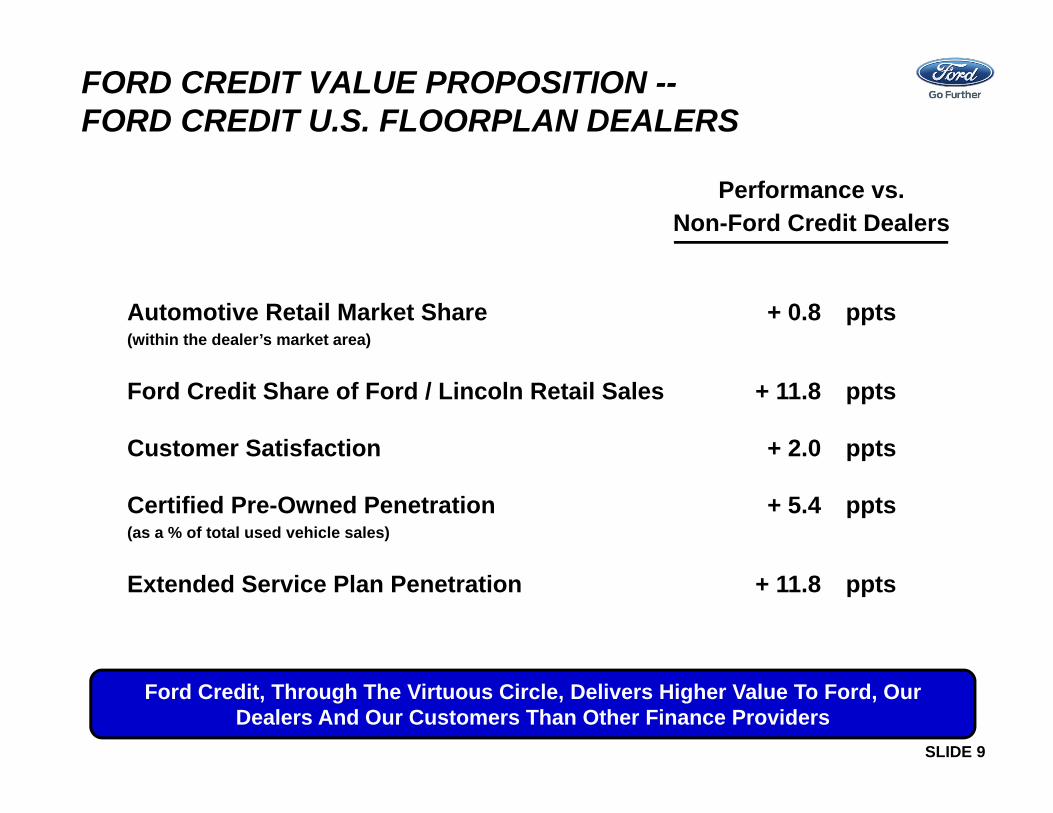
Automotive Retail Market Share + 0.8 ppts(within the dealer’s market area)
Ford Credit Share of Ford / Lincoln Retail Sales + 11.8 ppts
Customer Satisfaction + 2.0 ppts
Certified Pre-Owned Penetration + 5.4 ppts(as a % of total used vehicle sales)
Extended Service Plan Penetration + 11.8 ppts
FORD CREDIT VALUE PROPOSITION --FORD CREDIT U.S. FLOORPLAN DEALERS
Performance vs. Non-Ford Credit Dealers
Ford Credit, Through The Virtuous Circle, Delivers Higher Value To Ford, Our Dealers And Our Customers Than Other Finance Providers
SLIDE 10
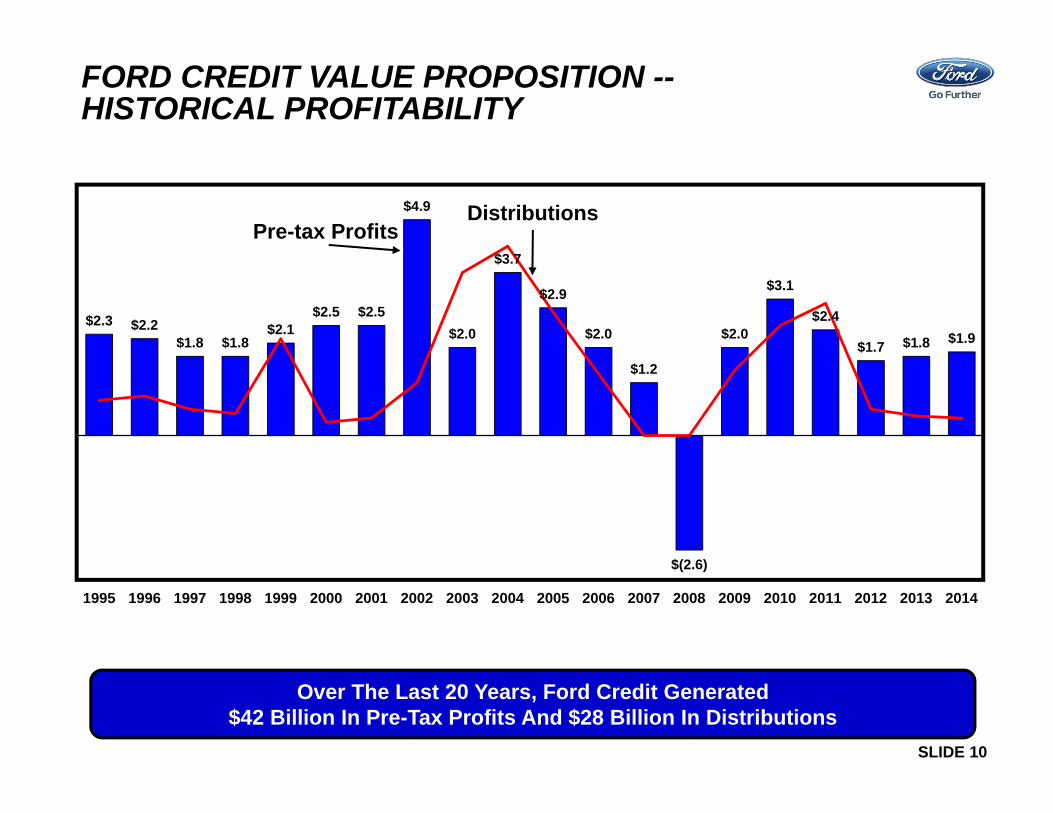
Pre-tax Profits
FORD CREDIT VALUE PROPOSITION --HISTORICAL PROFITABILITY
Over The Last 20 Years, Ford Credit Generated $42 Billion In Pre-Tax Profits And $28 Billion In Distributions
$2.3 $2.2 $1.8 $1.8
$2.1 $2.5 $2.5
$4.9
$2.0
$3.7
$2.9
$2.0
$1.2
$(2.6)
$2.0
$3.1
$2.4
$1.7 $1.8 $1.9
1995 1996 1997 1998 1999 2000 2001 2002 2003 2004 2005 2006 2007 2008 2009 2010 2011 2012 2013 2014
Distributions

Scope of Operations
SLIDE 12
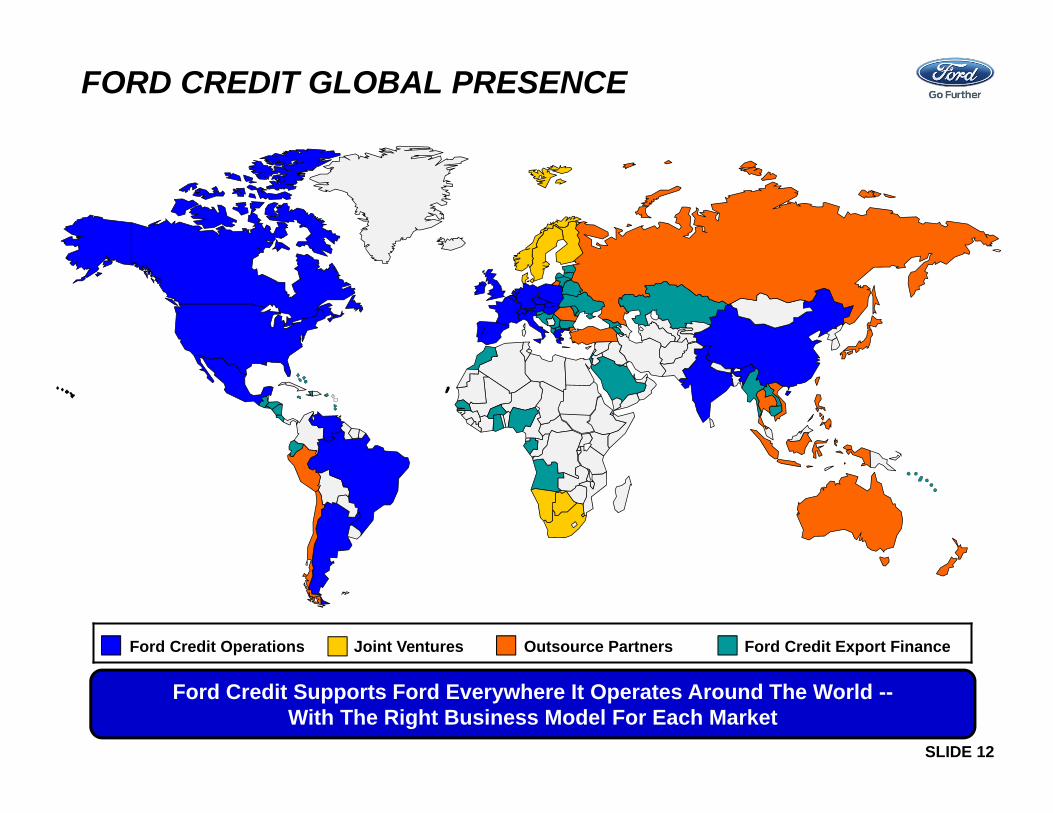
FORD CREDIT GLOBAL PRESENCE
Ford Credit Supports Ford Everywhere It Operates Around The World --With The Right Business Model For Each Market
Ford Credit Operations Joint Ventures Outsource Partners Ford Credit Export Finance
SLIDE 13
SIZE AND SCOPE OF OPERATIONS
• Ford indirectly owns 100% of Ford Credit
• Ford Credit offers a wide variety of automotive financing products to and through automotive dealers around the world
• Ford Credit has about 6,500 full-time employees and provides financing in approximately 100 countries
• As of year-end 2014, Ford Credit was financing worldwide:– About 5,200 Ford and Lincoln dealers– About 4.2 million customer contracts
• Ford Credit generates about 100 million customer touch points every year through websites, calls, e-mails, preapprovals, and invoices
SLIDE 14
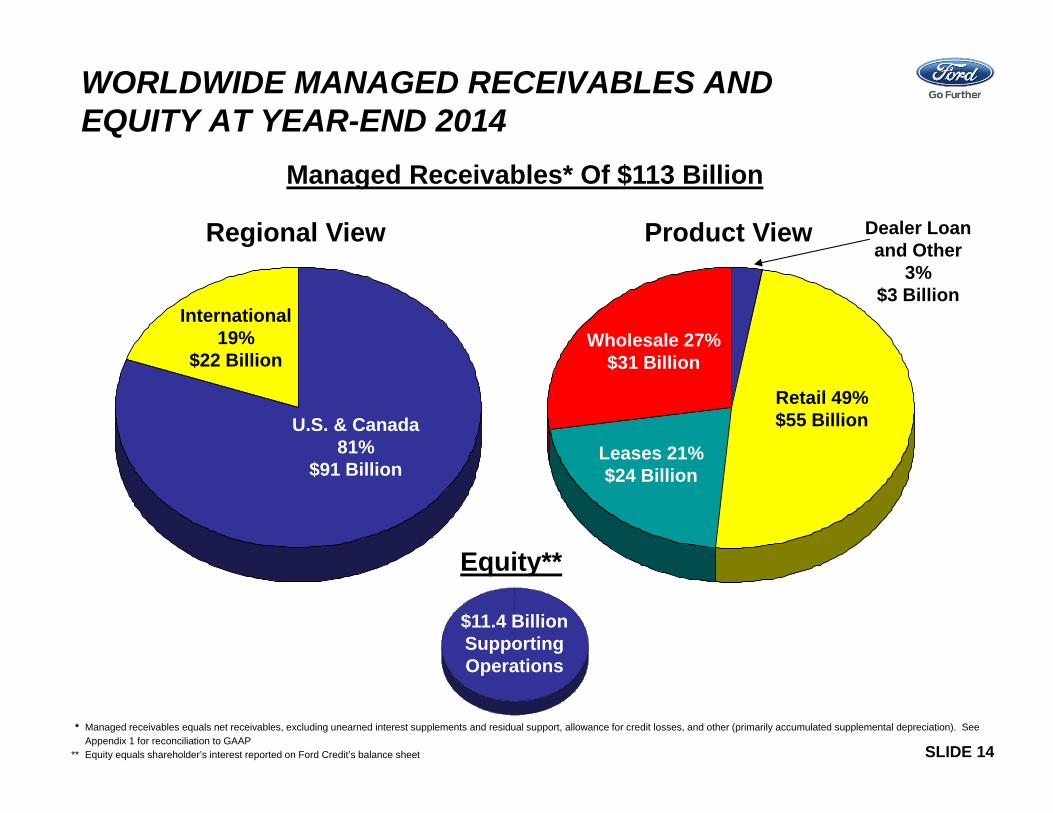
WORLDWIDE MANAGED RECEIVABLES AND EQUITY AT YEAR-END 2014
* Managed receivables equals net receivables, excluding unearned interest supplements and residual support, allowance for credit losses, and other (primarily accumulated supplemental depreciation). See Appendix 1 for reconciliation to GAAP
** Equity equals shareholder’s interest reported on Ford Credit’s balance sheet
U.S. & Canada 81%
$91 Billion
International 19%
$22 Billion
Regional View
Retail 49% $55 Billion
Wholesale 27%$31 Billion
Leases 21% $24 Billion
Product View Dealer Loan and Other
3% $3 Billion
$11.4 BillionSupporting Operations
Equity**
Managed Receivables* Of $113 Billion

SLIDE 15
RELATIONSHIP AGREEMENT WITH FORD
• Any extension of credit to Ford will be on arm’s-length terms and will be enforced in a commercially reasonable manner
• Ford Credit will not guarantee more than $500 million of indebtedness of, or make equity investments in any of, Ford or its automotive affiliates
• Ford Credit can require Ford to make a capital contribution if Ford Credit’s managed leverage is greater than 11.5 to 1
• Ford Credit will not be required to accept credit or residual risk beyond what it would be willing to accept acting in a prudent and commercially reasonable manner
• Ford and Ford Credit are separate, legally distinct companies and will continue to maintain separate books, accounts, assets and liabilities
• Up to $2 billion of borrowing capacity under Ford’s revolving credit facility allocated to Ford Credit

Ford Credit Business Model and the Drivers of the Business
SLIDE 17
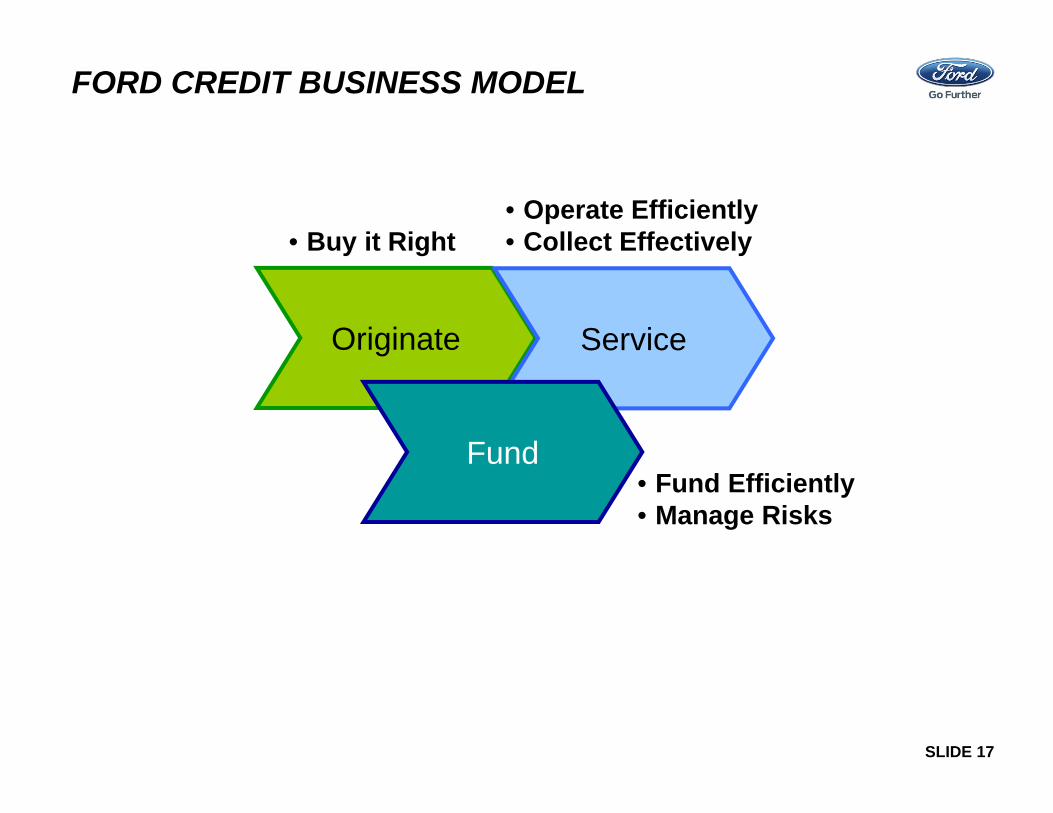
• Buy it Right• Operate Efficiently• Collect Effectively
• Fund Efficiently• Manage Risks
Originate
FORD CREDIT BUSINESS MODEL
Service
Fund

SLIDE 18
ORIGINATIONS STRATEGY
• Support Ford Motor Company brands• Build strong relationships with dealers• Segment credit applications and price appropriately for risk• Use robust credit evaluation and verification process• Ensure efficient use of capital
• Buy it Right• Operate Efficiently• Collect Effectively
• Fund Efficiently• Manage Risks
ServiceOriginate
Fund
Technology And Judgment Combine To Buy It Right
SLIDE 19
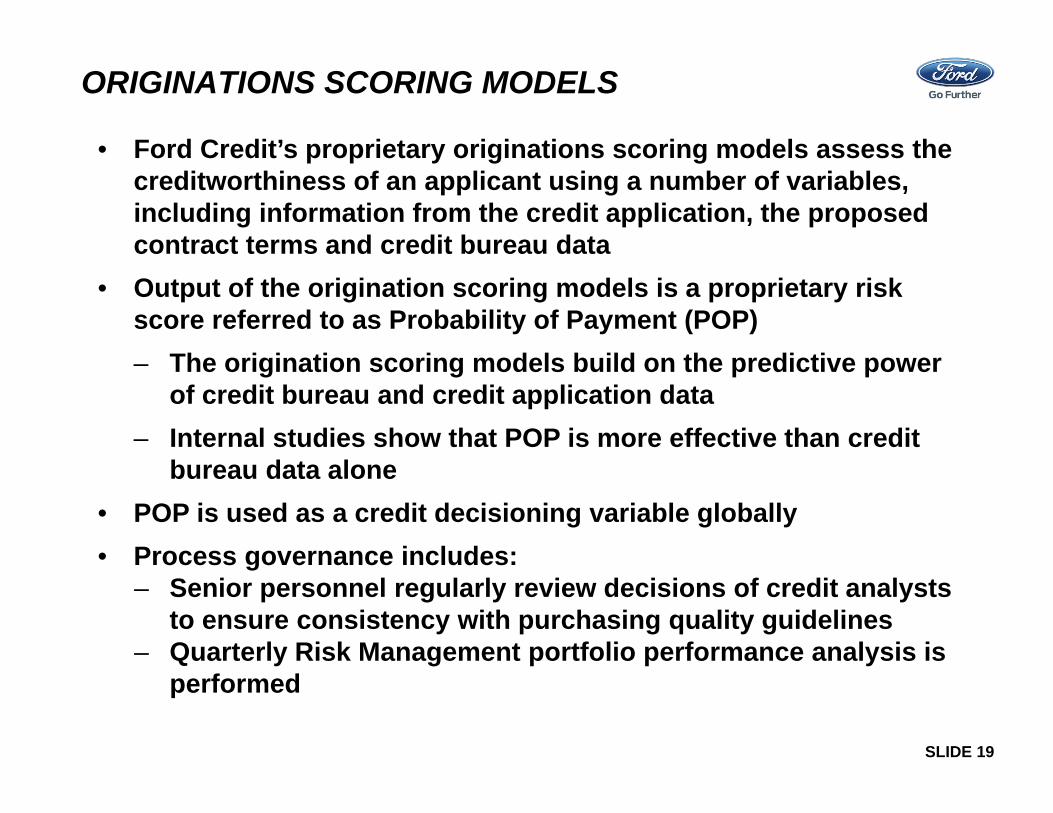
• Ford Credit’s proprietary originations scoring models assess the creditworthiness of an applicant using a number of variables, including information from the credit application, the proposed contract terms and credit bureau data
• Output of the origination scoring models is a proprietary risk score referred to as Probability of Payment (POP) – The origination scoring models build on the predictive power
of credit bureau and credit application data – Internal studies show that POP is more effective than credit
bureau data alone• POP is used as a credit decisioning variable globally • Process governance includes:
– Senior personnel regularly review decisions of credit analysts to ensure consistency with purchasing quality guidelines
– Quarterly Risk Management portfolio performance analysis is performed
ORIGINATIONS SCORING MODELS
SLIDE 20
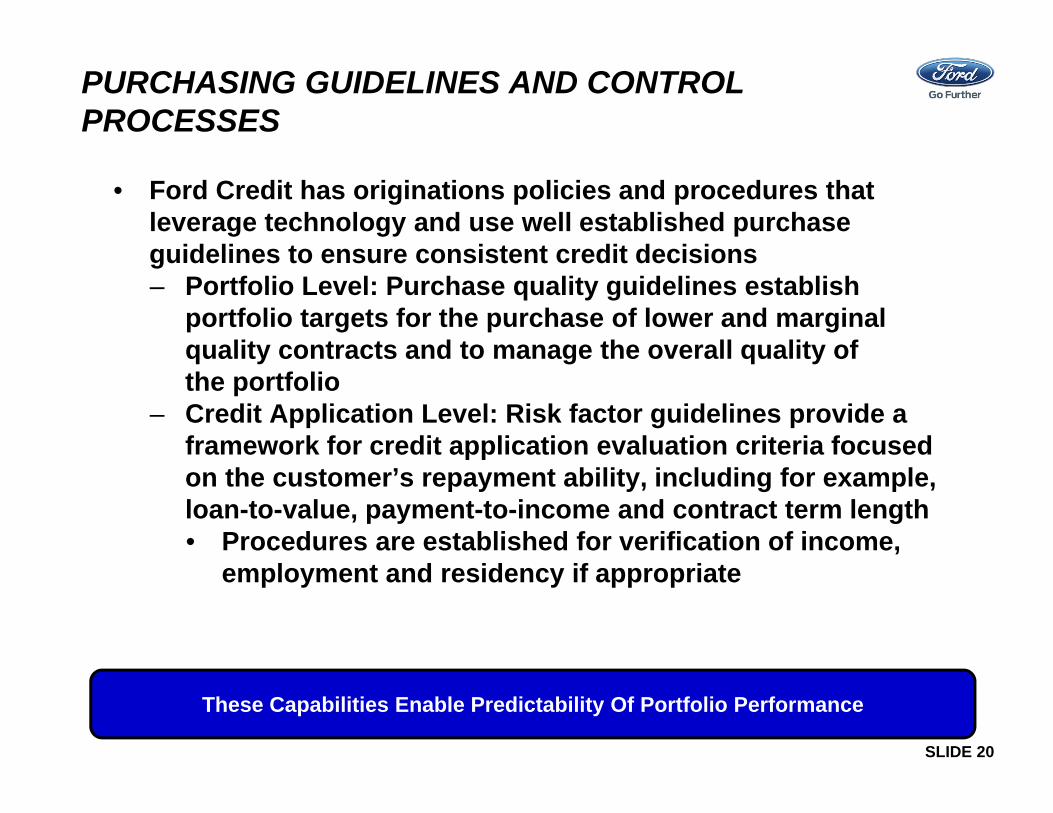
PURCHASING GUIDELINES AND CONTROL PROCESSES
• Ford Credit has originations policies and procedures that leverage technology and use well established purchase guidelines to ensure consistent credit decisions – Portfolio Level: Purchase quality guidelines establish
portfolio targets for the purchase of lower and marginal quality contracts and to manage the overall quality of the portfolio
– Credit Application Level: Risk factor guidelines provide a framework for credit application evaluation criteria focused on the customer’s repayment ability, including for example, loan-to-value, payment-to-income and contract term length• Procedures are established for verification of income,
employment and residency if appropriate
These Capabilities Enable Predictability Of Portfolio Performance
SLIDE 21
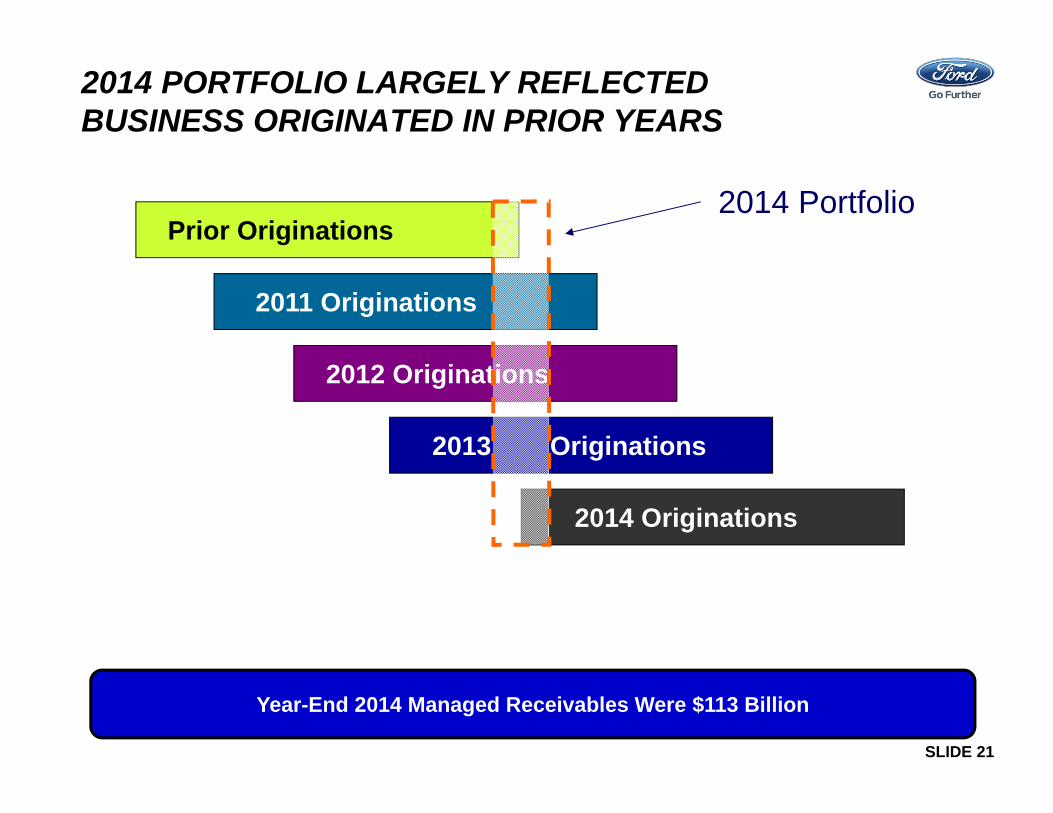
Prior Originations
2011 Originations
2012 Originations
2013 Originations
2014 Originations
2014 Portfolio
2014 PORTFOLIO LARGELY REFLECTEDBUSINESS ORIGINATED IN PRIOR YEARS
Year-End 2014 Managed Receivables Were $113 Billion
SLIDE 22
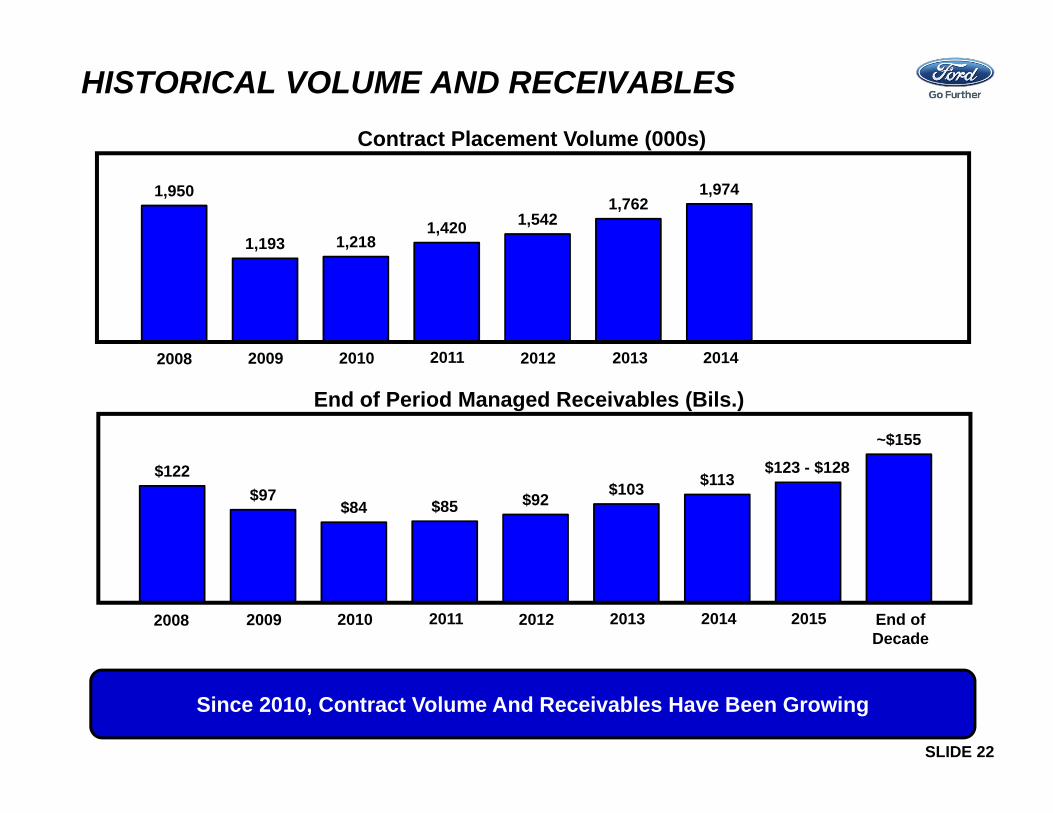
End of Period Managed Receivables (Bils.)
Contract Placement Volume (000s)
$122 $97
$84 $85 $92 $103 $113 $126
~$155
2008 2009 2010 2011 2012 2013 2015
HISTORICAL VOLUME AND RECEIVABLES
1,950
1,193 1,218 1,420 1,542
1,762 1,974
2008 2009 2010 2011 2012 2013
2014
Since 2010, Contract Volume And Receivables Have Been Growing
2014
$123 - $128
End of Decade

SLIDE 23
SERVICING STRATEGY
• Buy it Right• Operate Efficiently• Collect Effectively
• Fund Efficiently• Manage Risks
ServiceOriginate
Fund
• Ford Credit has a world-class servicing organization• Credit losses are an expected part of the business• The objective is to collect within the portfolio loss expectation while
managing costs • Customer and dealer satisfaction is critical
Technology And Judgment Combine To Minimize Credit Losses
SLIDE 24
SERVICING STRATEGY
• Ford Credit’s proprietary behavioral scoring models assess the risk of a customer default using a number of variables, including origination characteristics, customer history, payment patterns and updated credit bureau data
• Output of the behavioral scoring models is a proprietary risk score referred to as Probability of Default (POD) – Contracts are scored monthly on their due date to get an
updated POD – Ford Credit’s behavioral scoring models differ based on
contract characteristics and performance • Ford Credit regularly monitors the behavioral scoring models
to ensure the predictability of the variables and confirm the continued business significance
Behavioral Scoring Models Support The Timely Resolution Of Payment Issues
SLIDE 25
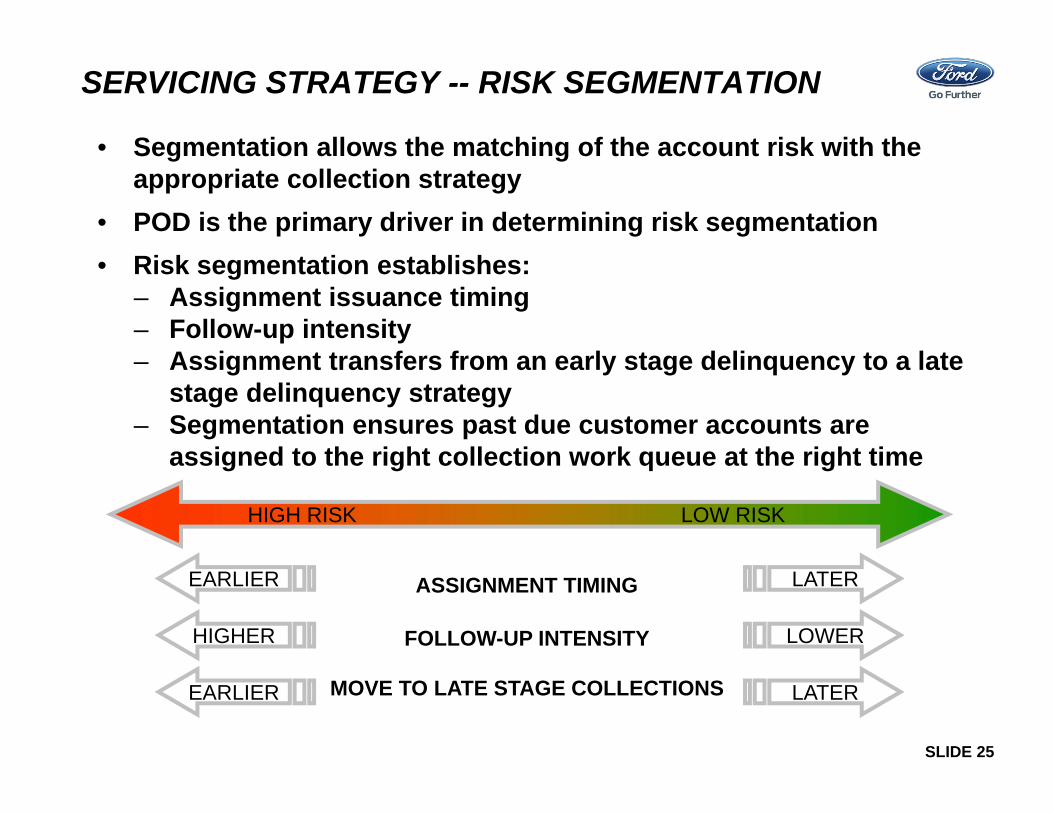
SERVICING STRATEGY -- RISK SEGMENTATION
• Segmentation allows the matching of the account risk with the appropriate collection strategy
• POD is the primary driver in determining risk segmentation• Risk segmentation establishes:
– Assignment issuance timing– Follow-up intensity– Assignment transfers from an early stage delinquency to a late
stage delinquency strategy– Segmentation ensures past due customer accounts are
assigned to the right collection work queue at the right time
HIGH RISK LOW RISK
ASSIGNMENT TIMING
FOLLOW-UP INTENSITY
MOVE TO LATE STAGE COLLECTIONS
LATER
LOWER
LATER
EARLIER
HIGHER
EARLIER
SLIDE 26
CREDIT LOSS KEY DRIVERS
• Purchase Practices– Broad spread of business (credit quality mix)– New and used product mix– Term and loan-to-value ratio
• Collections Practices– Proprietary risk score – Assignment timing / Follow-up intensity– Specialized departments based on delinquency stage
• Economy– Unemployment– Growth– Bankruptcy rates– Used vehicle auction values
SLIDE 27
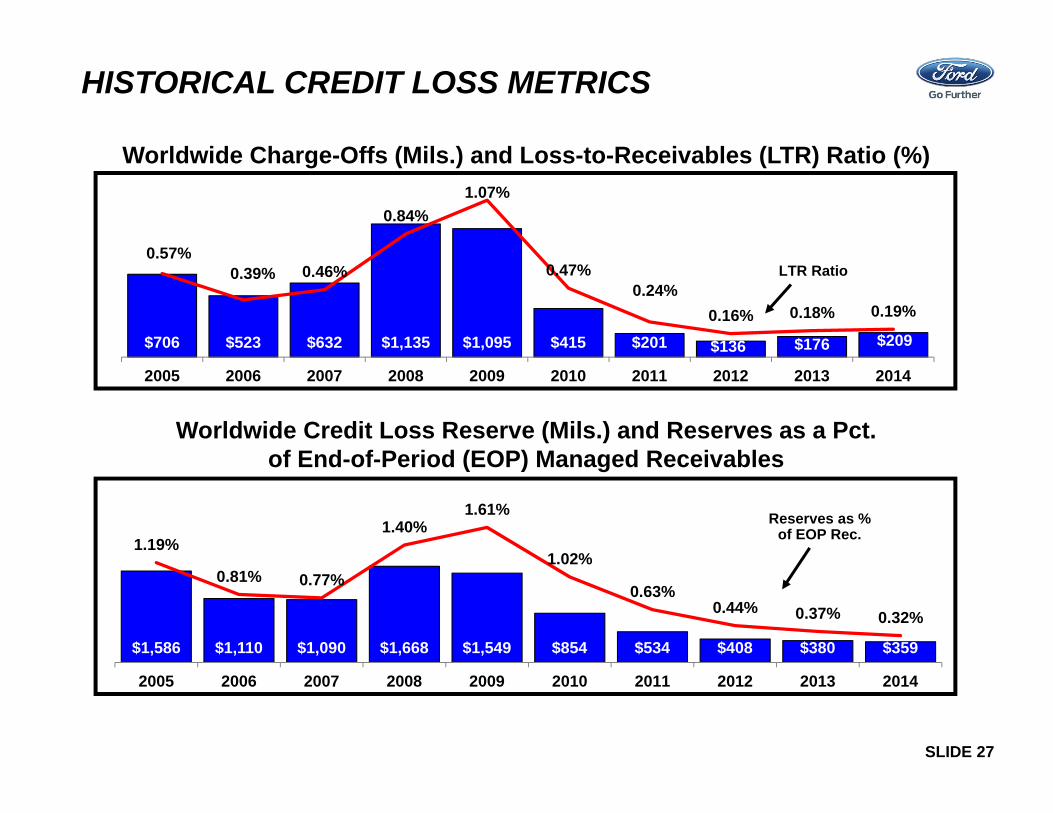
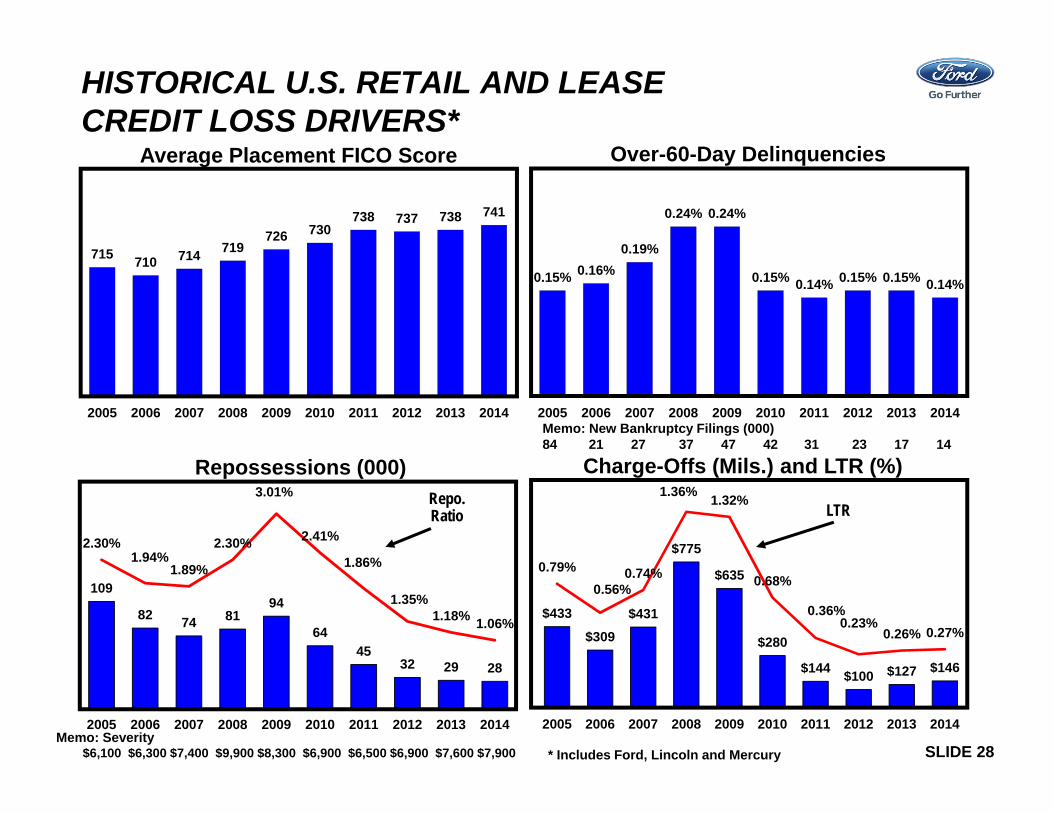
HISTORICAL CREDIT LOSS METRICS
$706 $523 $632 $1,135 $1,095 $415 $201 $136 $176 $209
0.57%0.39% 0.46%
0.84%1.07%
0.47%0.24%
0.16% 0.18% 0.19%
2005 2006 2007 2008 2009 2010 2011 2012 2013 2014
Worldwide Charge-Offs (Mils.) and Loss-to-Receivables (LTR) Ratio (%)
LTR Ratio
$1,586 $1,110 $1,090 $1,668 $1,549 $854 $534 $408 $380 $359
1.19%
0.81% 0.77%
1.40%1.61%
1.02%
0.63%0.44% 0.37% 0.32%
2005 2006 2007 2008 2009 2010 2011 2012 2013 2014
Reserves as % of EOP Rec.
Worldwide Credit Loss Reserve (Mils.) and Reserves as a Pct. of End-of-Period (EOP) Managed Receivables
SLIDE 28
109
82 74 8194
6445
32 29 28
2.30%1.94%
1.89%
2.30%
3.01%
2.41%
1.86%
1.35%1.18% 1.06%
2005 2006 2007 2008 2009 2010 2011 2012 2013 2014
0.15% 0.16%0.19%
0.24% 0.24%
0.15% 0.14% 0.15% 0.15% 0.14%
2005 2006 2007 2008 2009 2010 2011 2012 2013 2014
715 710 714 719726 730
738 737 738 741
2005 2006 2007 2008 2009 2010 2011 2012 2013 2014
Average Placement FICO Score
Repossessions (000)Repo. Ratio
Charge-Offs (Mils.) and LTR (%)
Over-60-Day Delinquencies
HISTORICAL U.S. RETAIL AND LEASE CREDIT LOSS DRIVERS*
* Includes Ford, Lincoln and Mercury
Memo: New Bankruptcy Filings (000)84 21 27 37 47 42 31 23 17 14
Memo: Severity$6,100 $6,300 $7,400 $9,900 $8,300 $6,900 $6,500 $6,900 $7,600 $7,900
$433
$309$431
$775
$635
$280
$144 $100 $127 $146
0.79%0.56%
0.74%
1.36% 1.32%
0.68%
0.36%0.23%
0.26% 0.27%
2005 2006 2007 2008 2009 2010 2011 2012 2013 2014
LTR
SLIDE 29
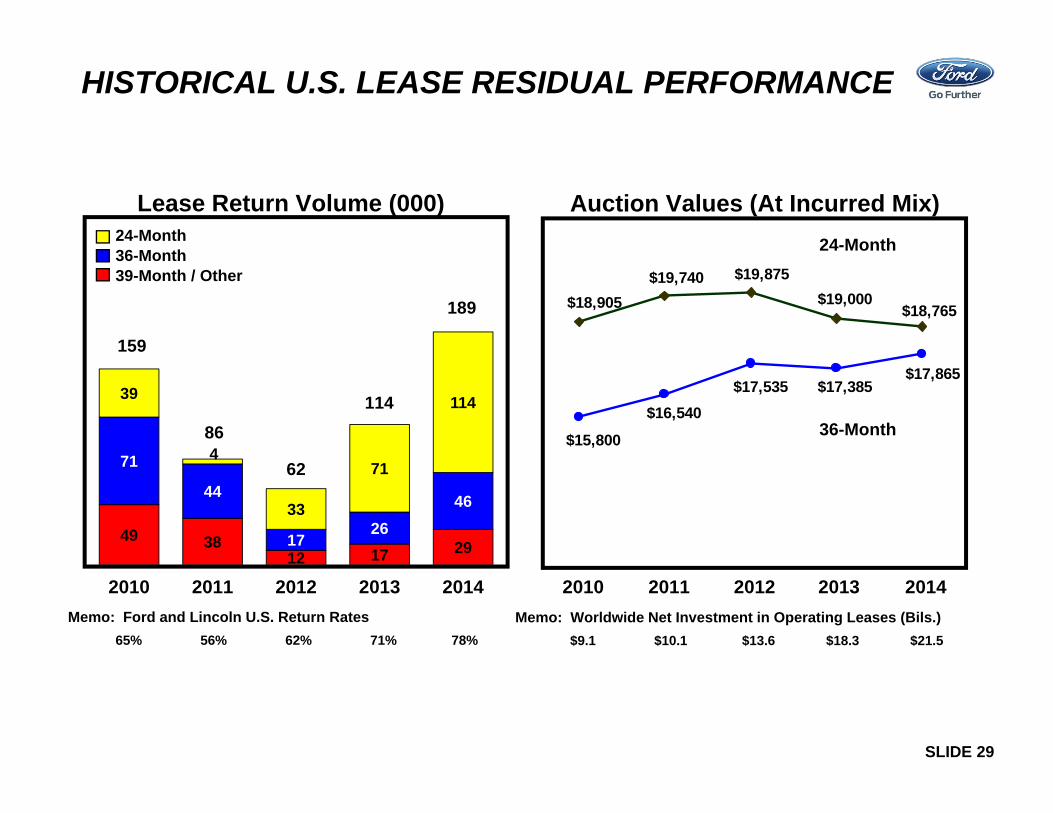
HISTORICAL U.S. LEASE RESIDUAL PERFORMANCE
Memo: Ford and Lincoln U.S. Return Rates 65% 56% 62% 71% 78%
49 3812 17 29
71
44
1726
46
39
4
33
71
114
2010 2011 2012 2013 2014
Lease Return Volume (000)
Memo: Worldwide Net Investment in Operating Leases (Bils.) $9.1 $10.1 $13.6 $18.3 $21.5
24-Month36-Month39-Month / Other
159
62
86
189 $18,765$19,000
$19,875
$18,905$19,740
$17,865$17,385$17,535
$16,540
$15,800
Auction Values (At Incurred Mix)
114
2013 20142010 2011 2012
24-Month
36-Month
SLIDE 30
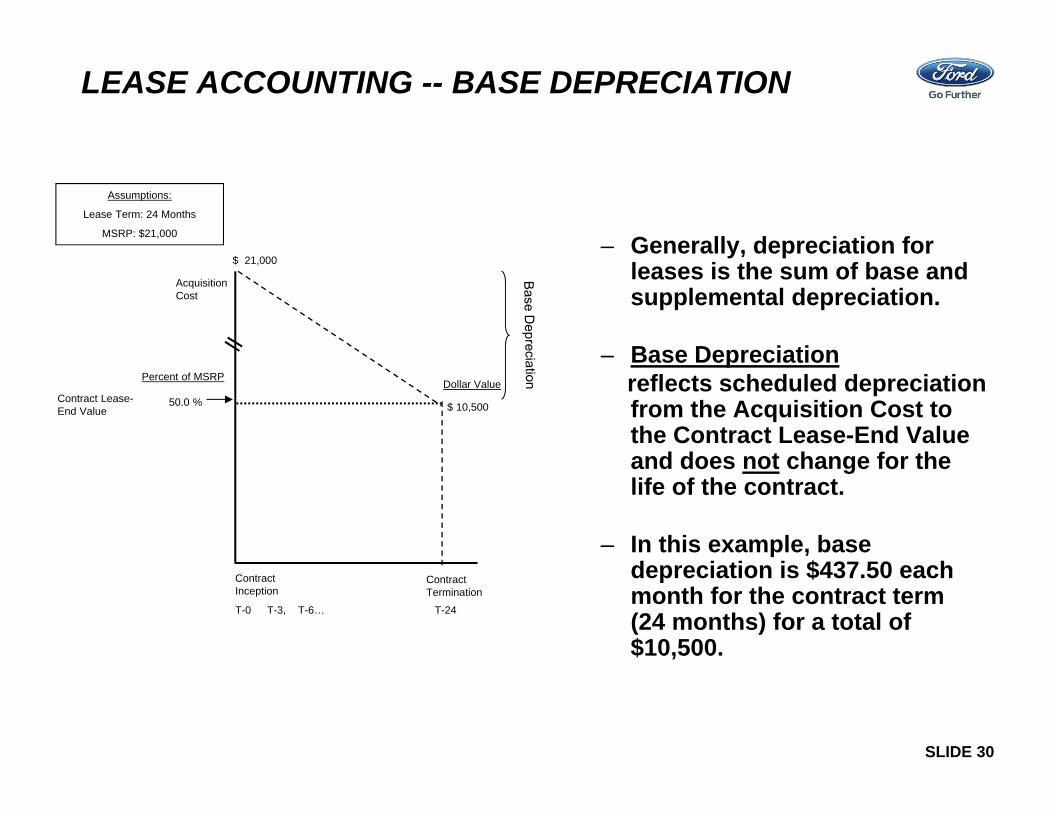
LEASE ACCOUNTING -- BASE DEPRECIATION
– Generally, depreciation for leases is the sum of base and supplemental depreciation.
– Base Depreciationreflects scheduled depreciation from the Acquisition Cost to the Contract Lease-End Value and does not change for the life of the contract.
– In this example, base depreciation is $437.50 each month for the contract term (24 months) for a total of $10,500.
Assumptions:
Lease Term: 24 Months
MSRP: $21,000
Acquisition Cost
Contract Lease-End Value
Percent of MSRP
50.0 %
ContractTermination
Dollar Value
$ 10,500
$ 21,000
ContractInception
T-0 T-3, T-6… T-24

SLIDE 31
LEASE ACCOUNTING --SUPPLEMENTAL DEPRECIATION
– Supplemental Depreciationreflects additional depreciation to achieve expected actual residual (i.e., auction) values for the leased vehicles.
– Supplemental depreciation can change based on expectations and it is assessed quarterly.
– It can be negative, however, it can never “un-depreciate” above base depreciation.
– In this example, supplemental depreciation is $40 each month for remaining term (21 months) for a total of $840.
Book Value
Contract Lease-End Value
Expected Actual Residual (i.e., Auction) Value at Lease ContractTermination
Percent of MSRP
50.0 %
46.0 %
ContractTermination
Dollar Value
$ 10,500
Additional Credit Co.SupplementalDepreciationExpense
$ 9,660
$ 19,687.50
ContractInception
T-0 T-3, T-6… T-24
Acquisition Cost $ 21,000
Assumptions:
Lease Term: 24 Months
MSRP: $21,000
SLIDE 32
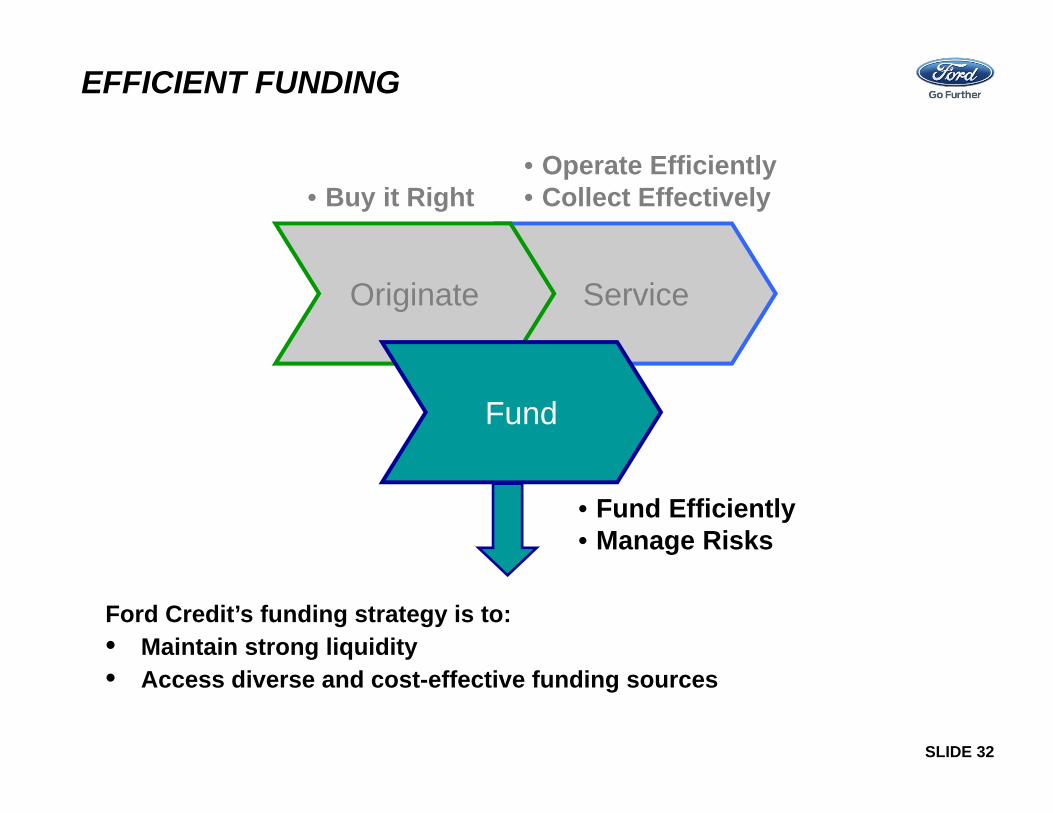
EFFICIENT FUNDING
• Buy it Right• Operate Efficiently• Collect Effectively
• Fund Efficiently• Manage Risks
ServiceOriginate
Fund
Ford Credit’s funding strategy is to:• Maintain strong liquidity• Access diverse and cost-effective funding sources
SLIDE 33
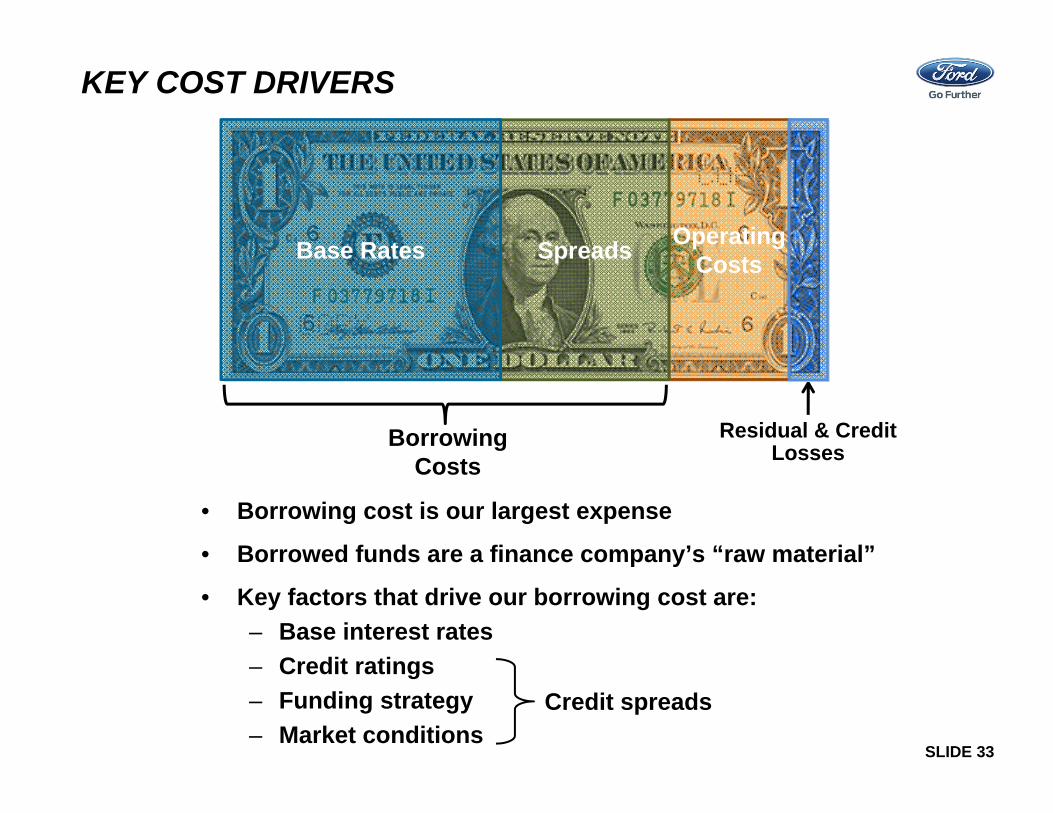
KEY COST DRIVERS
• Borrowing cost is our largest expense
• Borrowed funds are a finance company’s “raw material”
• Key factors that drive our borrowing cost are:– Base interest rates– Credit ratings– Funding strategy– Market conditions
Credit spreads
OperatingCostsSpreadsBase Rates
Residual & Credit LossesBorrowing
Costs
SLIDE 34
250
500
1000
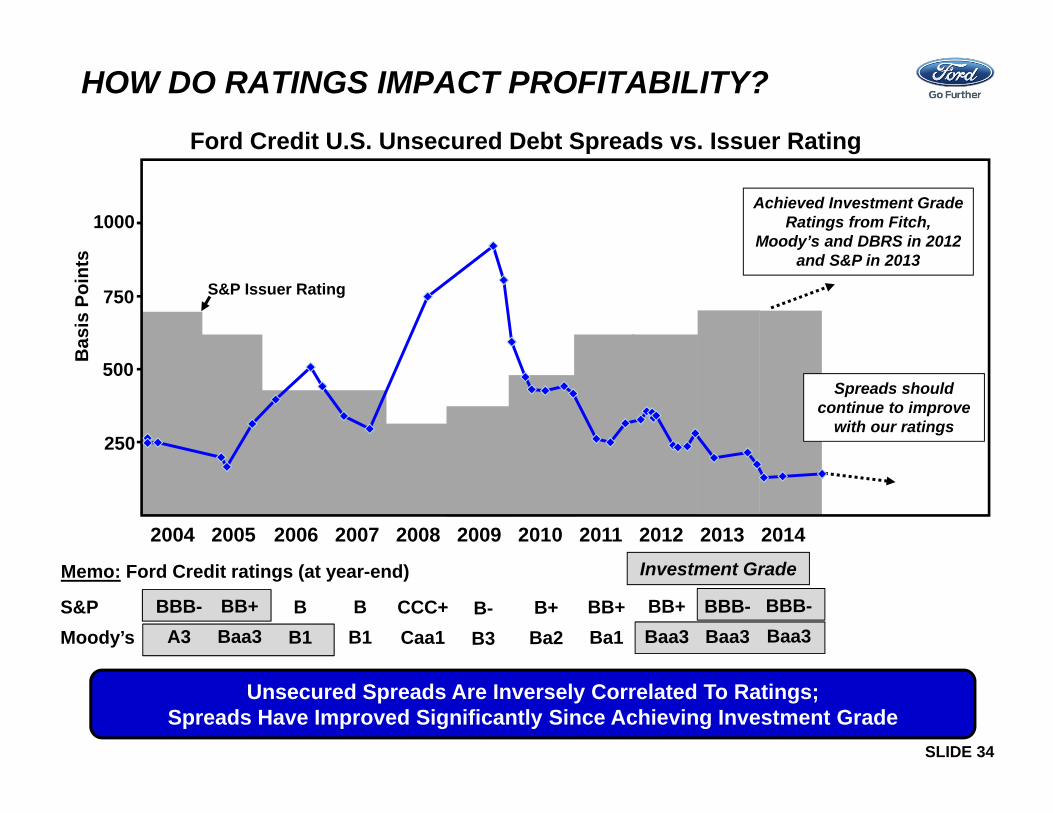
HOW DO RATINGS IMPACT PROFITABILITY?
2004 2005 2006 2007 2008 2009 2010 2011 2012 2013 2014
750
Ford Credit U.S. Unsecured Debt Spreads vs. Issuer Rating
S&P Issuer Rating
Bas
is P
oint
s
Achieved Investment Grade Ratings from Fitch,
Moody’s and DBRS in 2012 and S&P in 2013
Memo: Ford Credit ratings (at year-end)
BB+Ba1
B+Ba2
B-B3
CCC+Caa1
BB1
BB1
BB+Baa3
BBB-A3
BB+Baa3
S&PMoody’s
BBB-Baa3
Spreads should continue to improve
with our ratings
Investment Grade
Unsecured Spreads Are Inversely Correlated To Ratings; Spreads Have Improved Significantly Since Achieving Investment Grade
BBB-Baa3
SLIDE 35
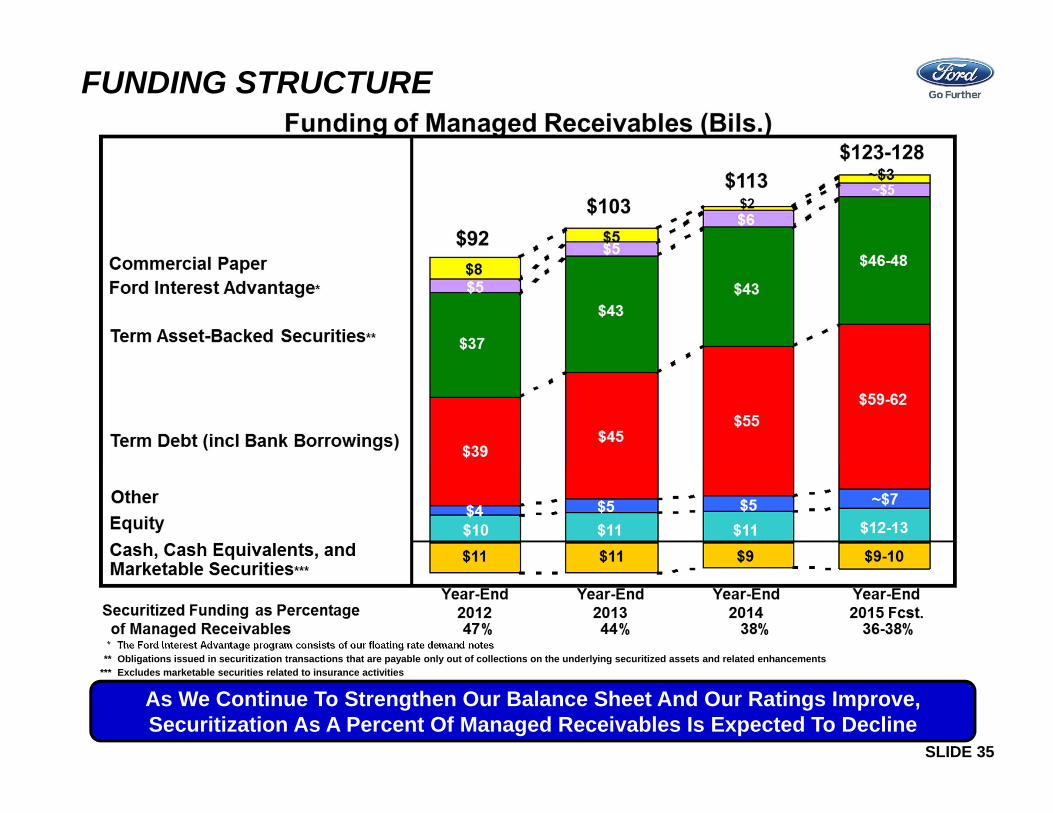
FUNDING STRUCTURE
* The Ford Interest Advantage program consists of our floating rate demand notes** Obligations issued in securitization transactions that are payable only out of collections on the underlying securitized assets and related enhancements
*** Excludes marketable securities related to insurance activities
As We Continue To Strengthen Our Balance Sheet And Our Ratings Improve, Securitization As A Percent Of Managed Receivables Is Expected To Decline

SLIDE 36
PUBLIC TERM FUNDING PLAN
Unsecured $ 9 $ 11 $ 13 $ 12 – 15
Securitizations* 14 14 15 13 – 16
Total $ 23 $ 25 $ 28 $ 25 – 31
2012 Actual(Bils.)
2013 Actual(Bils.)
2014Actual(Bils.)
2015Forecast
(Bils.)
* Includes Rule 144A offerings
Projected 2015 Public Issuance Largely Consistent With 2014; Continue To Maintain A Significant Presence In Both Unsecured And Securitization Markets

SLIDE 37
2014 LIQUIDITY PROGRAMS
Committed Capacity$37.3 billion
Available Liquidity Remains Strong At $26.5 Billion
* Cash, cash equivalents, and marketable securities (excludes marketable securities related to insurance activities)** Committed ABS lines are subject to availability of sufficient assets and ability to obtain derivatives to manage interest rate risk
*** Used only to support on-balance sheet securitization transactions**** Adjustments include other committed ABS lines in excess of eligible receivables and certain cash within FordREV available through future sales of receivables
SLIDE 38
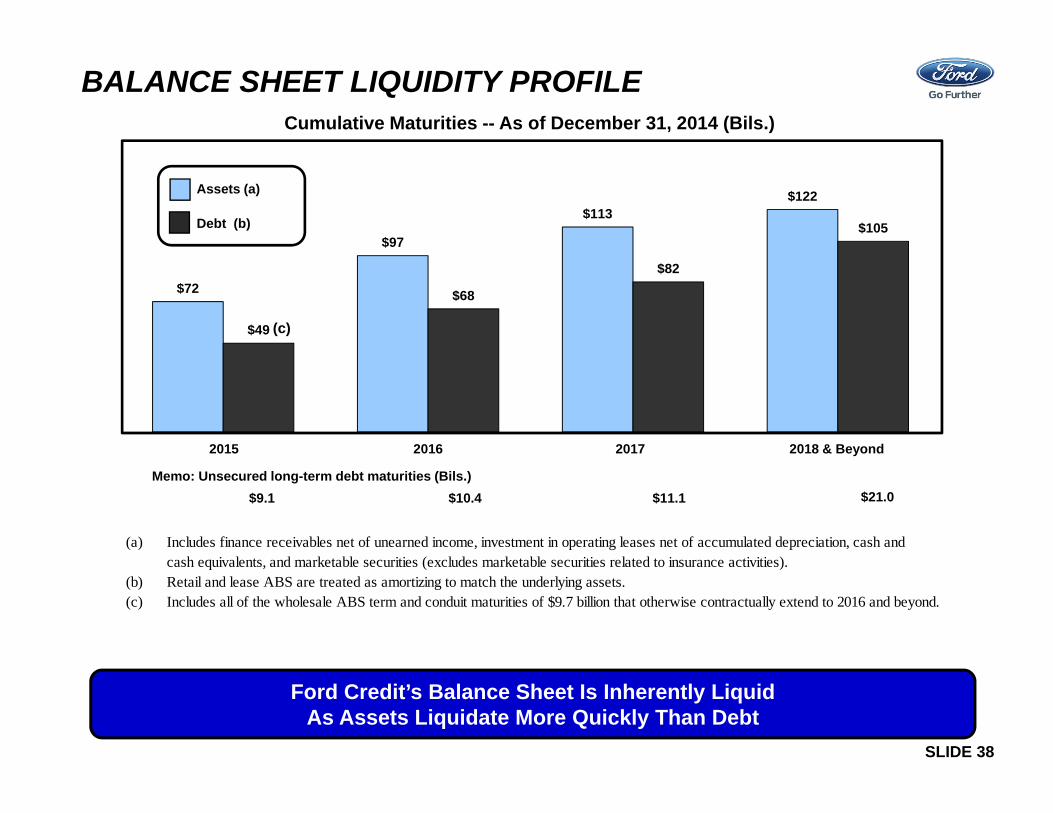
BALANCE SHEET LIQUIDITY PROFILECumulative Maturities -- As of December 31, 2014 (Bils.)
Ford Credit’s Balance Sheet Is Inherently Liquid As Assets Liquidate More Quickly Than Debt
(a) Includes finance receivables net of unearned income, investment in operating leases net of accumulated depreciation, cash andcash equivalents, and marketable securities (excludes marketable securities related to insurance activities).
(b) Retail and lease ABS are treated as amortizing to match the underlying assets.(c) Includes all of the wholesale ABS term and conduit maturities of $9.7 billion that otherwise contractually extend to 2016 and beyond.
$72
$97
$113$122
$49
$68
$82
$105
Assets (a)
Debt (b)
(c)
Memo: Unsecured long-term debt maturities (Bils.)
2015 2016 2017 2018 & Beyond
$9.1 $10.4 $11.1 $21.0
SLIDE 39
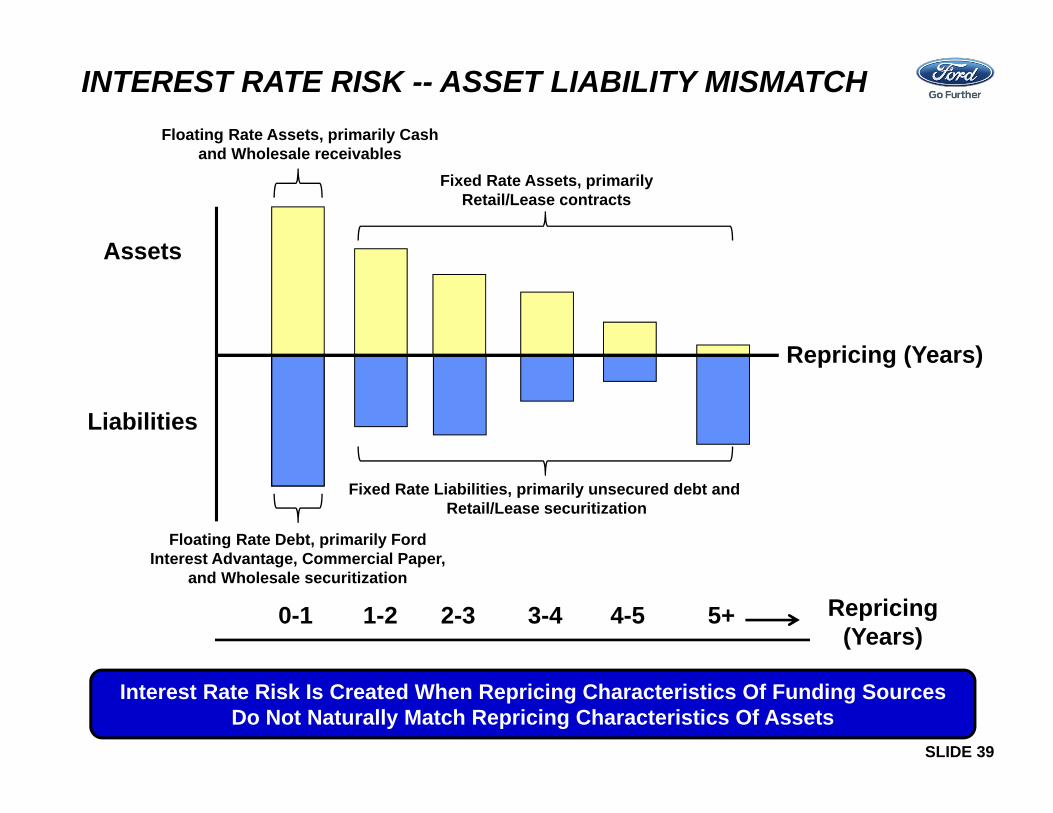
INTEREST RATE RISK -- ASSET LIABILITY MISMATCH
0-1 1-2 2-3 3-4 4-5 5+
Assets
Liabilities
Repricing (Years)
Repricing (Years)
Floating Rate Assets, primarily Cash and Wholesale receivables
Fixed Rate Assets, primarily Retail/Lease contracts
Floating Rate Debt, primarily Ford Interest Advantage, Commercial Paper,
and Wholesale securitization
Fixed Rate Liabilities, primarily unsecured debt and Retail/Lease securitization
Interest Rate Risk Is Created When Repricing Characteristics Of Funding Sources Do Not Naturally Match Repricing Characteristics Of Assets

SLIDE 40
Step 1:Excess long-term fixed rate debt is swapped to floating rate debt
Assets
Liabilities, Derivatives
& Equity
0-1 1-2 2-3 3-4 4-5 5+ Repricing (Years)
Step 2:Excess floating rate debt is swapped to fixed rate debt to match asset repricing profile in line with risk tolerance
0-1 1-2 2-3 3-4 4-5 5+ Repricing (Years)
Assets
INTEREST RATE RISK -- ASSET LIABILITY MISMATCH
Liabilities, Derivatives
& Equity
Swaps Are Used To Manage Our Interest Rate Exposure In Line With Risk Management Strategy And Tolerances

SLIDE 41
FORD CREDIT DERIVATIVE NOTIONAL
Despite The Significant Derivative Notional Balance, Ford Credit’s Derivatives Had A Minimal Impact On Total Profit
2013 2014(Bils.) (Bils.)
Interest Rate DerivativesPay-fix swaps 17$ 15$ Pay-float swaps 30 36 Securitization swaps 42 29
Subtotal interest rate derivatives $ 89 $ 80
Other DerivativesCross-currency swaps 3 2 Foreign currency forwards 2 2
Total derivative notional 94$ 84$
Memo:Non-designated derivative notional (Bils.) 75$ 61$ Income/(loss) from Unallocated Risk Management (Mils.) (53)$ (6)$ Income/(Loss) as a % of non-designated notional (Pct.) (0.07) % (0.01) %

SLIDE 42
FUNDING A STRONG FORD CREDIT BALANCE SHEET• Expanding and diversifying our funding programs globally
– Increasing mix of term debt, reducing annual financing requirements– Developing innovative funding platforms in mature and growth markets
• Maintaining strong liquidity to protect against funding disruptions– Targeting total liquidity of $25 billion +
• Delivering around 10% return on equity with sustainable distributions– Maintaining leverage between 8 and 9 to 1
• Targeting single-A credit rating profile
Strong Funding and Liquidity Profile Supports Growth in Receivables

Ford Credit Profit Reporting
SLIDE 44
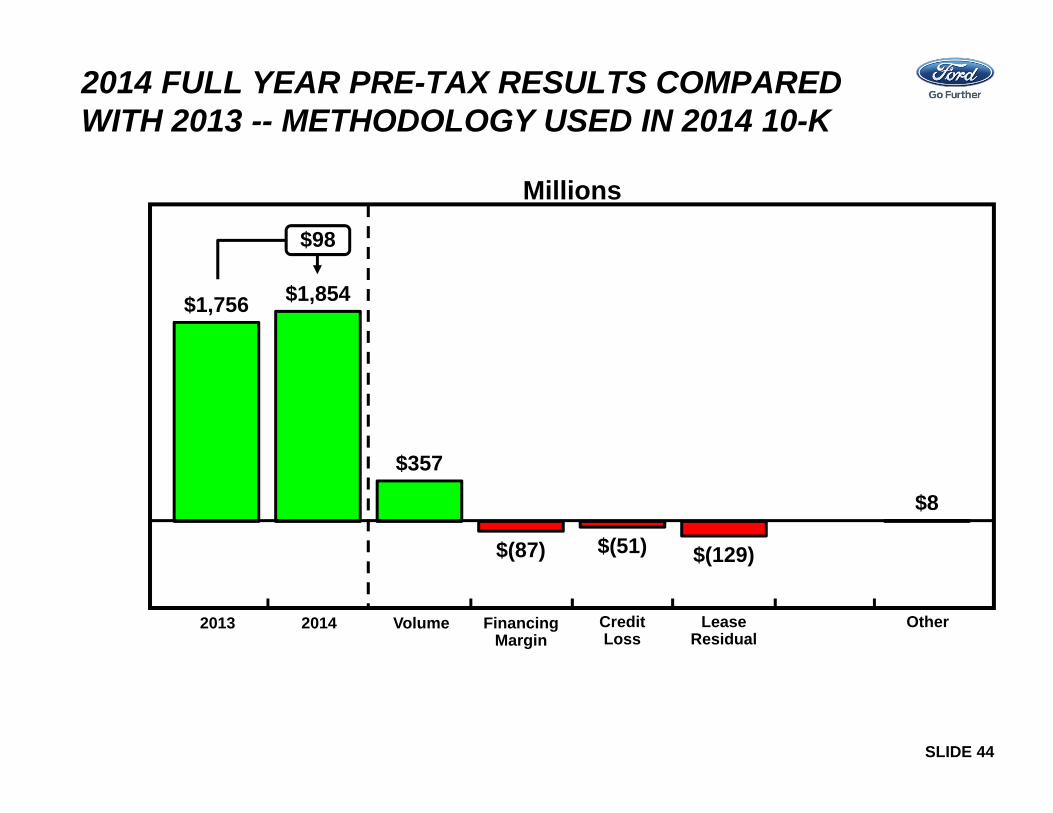
$1,756 $1,854
$357
$(87) $(51) $(129)
$8
Millions
$98
LeaseResidual
Volume20142013 CreditLoss
FinancingMargin
Other
2014 FULL YEAR PRE-TAX RESULTS COMPARED WITH 2013 -- METHODOLOGY USED IN 2014 10-K

SLIDE 45
2014 FULL YEAR PRE-TAX RESULTS COMPARED WITH 2013 -- REVISED METHODOLOGY
$1,756 $1,854
$429
$(135) $(55) $(128) $(49)
$36
Millions
$98
LeaseResidual
Volume / Mix
20142013 CreditLoss
FinancingMargin
OtherExchange
• New variance category to isolate changes in pre-tax profit driven by changes in exchange rates
• Previously, pre-tax profit effect of changes in exchange rates was reflected in each causal factor
• Added Mix to the Volume category
• Previously, Mix (by default) was included in Financing Margin

SLIDE 46
2014 FULL YEAR PRE-TAX RESULTS COMPARED WITH 2013 -- VOLUME (REVISED METHODOLOGY)
$1,756 $1,854
$429
$(135) $(55) $(128) $(49)
$36
Millions
$98
LeaseResidual
20142013 CreditLoss
FinancingMargin
OtherExchange
• Volume represents the change in average receivables multiplied by the prior period financing margin yield at prior period exchange rates
• Mix represents changes in net financing margin driven by changes in the composition of our average managed receivables by product and by country or region
Volume / Mix

SLIDE 47
$92 $103
$113 $103
$113
VOLUME AND MIX PROFIT VARIANCES
Memo: Average Receivables at Incurred Exchange Rates
$96.4 $108.4 ~$119
Average Receivables at Prior Year Exchange Rates$108.9 ~$122
Managed Receivables (Bils.)Beginning of PeriodEnd of Period
2014 20152013
Volume and Mix Variances
$123-128
2014 Compared with 2013Volume
2014 Average Receivables at 2013 Exchange Rates (Bils.) 108.9$ 2013 Average Receivables 96.4 Increase / (Decrease) in Receivables 12.5$
Average 2013 Financing Margin ~ 2.80 %
Volume Variance (Mils.) ~ 350$
Mix (Primarily Higher Leases and China Receivables) ~ 79 Total Volume and Mix 429$
Directional 2015 Compared with 2014Volume
2015 Average Receivables at 2014 Exchange Rates (Bils.) ~ 122.0$ 2014 Average Receivables 108.4 Increase / (Decrease) in Receivables ~ 13.6$
Average 2014 Financing Margin (similar to 2014) ~ 2.80 %
Volume Variance (Mils.) ~ 380$
Mix (similar to 2014) ~ 80 Total Volume and Mix ~ 460$
SLIDE 48
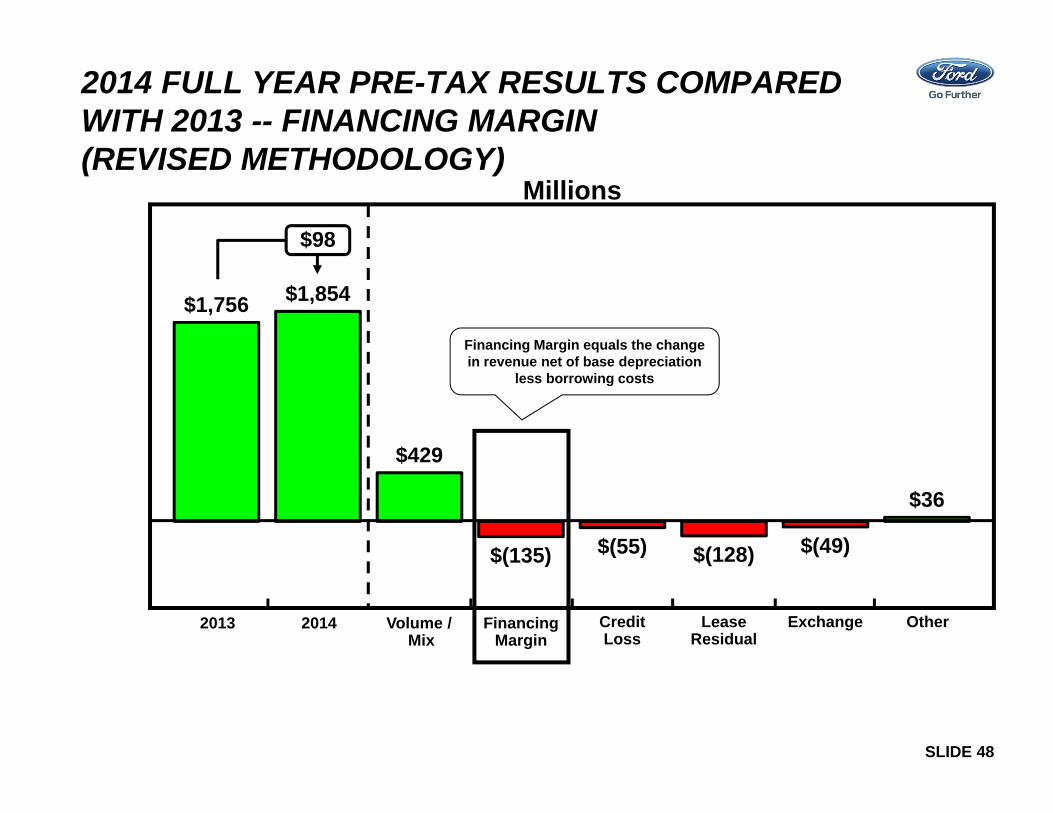
2014 FULL YEAR PRE-TAX RESULTS COMPARED WITH 2013 -- FINANCING MARGIN (REVISED METHODOLOGY)
$1,756 $1,854
$429
$(135) $(55) $(128) $(49)
$36
Millions
$98
LeaseResidual
20142013 CreditLoss
FinancingMargin
OtherExchangeVolume / Mix
Financing Margin equals the change in revenue net of base depreciation
less borrowing costs
SLIDE 49
FINANCING MARGIN FUNCTION OF FINANCING REVENUE AND BORROWING COST
Financing Margin – Financing margin is primarily reflected within Net financing margin on the income statement.• Financing margin variance is the period-to-period change in financing
margin yield multiplied by the present period average receivables at prior period exchange rates. Financing margin yield equals revenue, less interest expense and base depreciation for the period, divided by average receivables for the same period.
• Financing margin changes are driven by changes in revenue and interest expense. Changes in revenue are primarily driven by the level of market interest rates, cost assumptions in pricing, mix of business, and competitive environment. Changes in interest expense are primarily driven by the level of market interest rates, borrowing spreads, and asset-liability management.
2014 Versus 2013 Unfavorable Financing Margin Variance Of $135 Million Primarily Reflects Lower Portfolio Pricing In North America And A One-Time Reserve In Europe

SLIDE 50
2014 FULL YEAR PRE-TAX RESULTS COMPARED WITH 2013 -- CREDIT LOSSES (REVISED METHODOLOGY)
$1,756 $1,854
$429
$(135) $(55) $(128) $(49)
$36
Millions
$98
LeaseResidual
20142013 CreditLoss
FinancingMargin
OtherExchangeVolume / Mix
Credit Loss equals the change in:• Charge-offs, plus• Changes in the Allowance for Credit
LossesAt prior period exchange rates
SLIDE 51
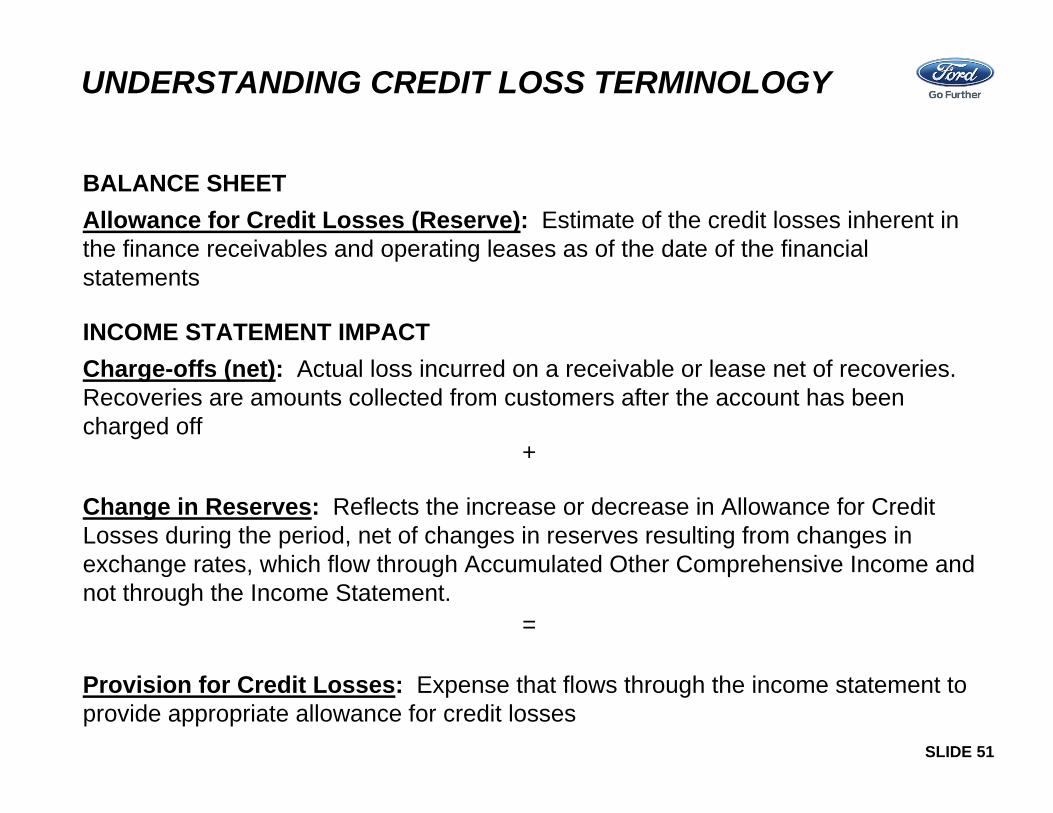
UNDERSTANDING CREDIT LOSS TERMINOLOGY
BALANCE SHEETAllowance for Credit Losses (Reserve): Estimate of the credit losses inherent in the finance receivables and operating leases as of the date of the financial statements
INCOME STATEMENT IMPACTCharge-offs (net): Actual loss incurred on a receivable or lease net of recoveries. Recoveries are amounts collected from customers after the account has been charged off
+
Change in Reserves: Reflects the increase or decrease in Allowance for Credit Losses during the period, net of changes in reserves resulting from changes in exchange rates, which flow through Accumulated Other Comprehensive Income and not through the Income Statement.
=
Provision for Credit Losses: Expense that flows through the income statement to provide appropriate allowance for credit losses

SLIDE 52
$136 $176 $209
$408 $380 $359
Worldwide On-Balance Sheet Charge-Offs and Allowance for Credit Losses (Bils.)
$28 $21
$(33)
$(7)
2014 FULL YEAR CREDIT LOSS VARIANCE EXPLANATION (REVISED METHODOLOGY)
Charge-Offs
20132012 2014
Reserves
MEMO: LTR (%) 0.16% 0.18% 0.19%
Profit Impact 2014 (Mils.)
Change in Reserves $ (7)Exchange Rate Impact on Reserves* (11)
Change in Reserves Variance $ (18)
Charge-Offs (33) Exchange Rate Impact on Losses (4)
Total Credit Loss Variance $ (55)
* In the absence of a stronger dollar, Reserves would have been about $370 million -- $11 million higher.
SLIDE 53
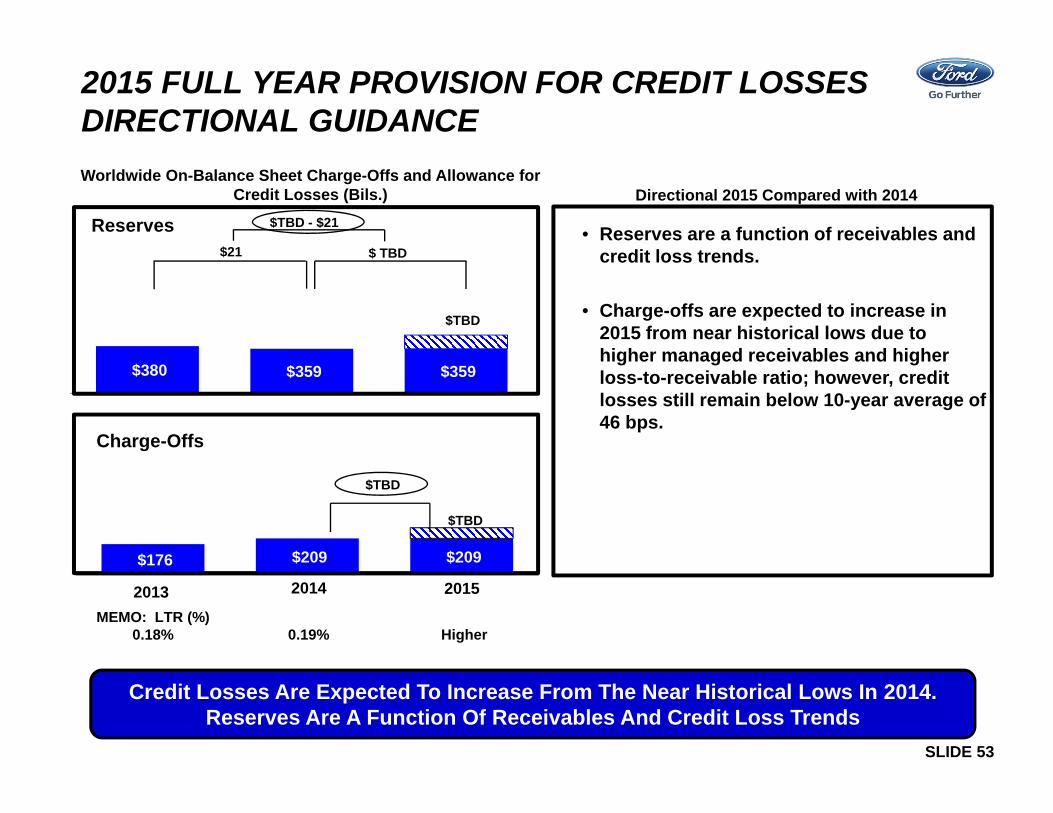
$380 $359 $359
$176 $209 $209
Worldwide On-Balance Sheet Charge-Offs and Allowance for Credit Losses (Bils.)
2015 FULL YEAR PROVISION FOR CREDIT LOSSES DIRECTIONAL GUIDANCE
• Reserves are a function of receivables and credit loss trends.
• Charge-offs are expected to increase in 2015 from near historical lows due to higher managed receivables and higher loss-to-receivable ratio; however, credit losses still remain below 10-year average of 46 bps.
Directional 2015 Compared with 2014
$21
$TBD - $21
$ TBD
$TBD
Charge-Offs
20142013 2015
Reserves
$TBD
MEMO: LTR (%) 0.18% 0.19% Higher
$TBD
Credit Losses Are Expected To Increase From The Near Historical Lows In 2014. Reserves Are A Function Of Receivables And Credit Loss Trends
SLIDE 54
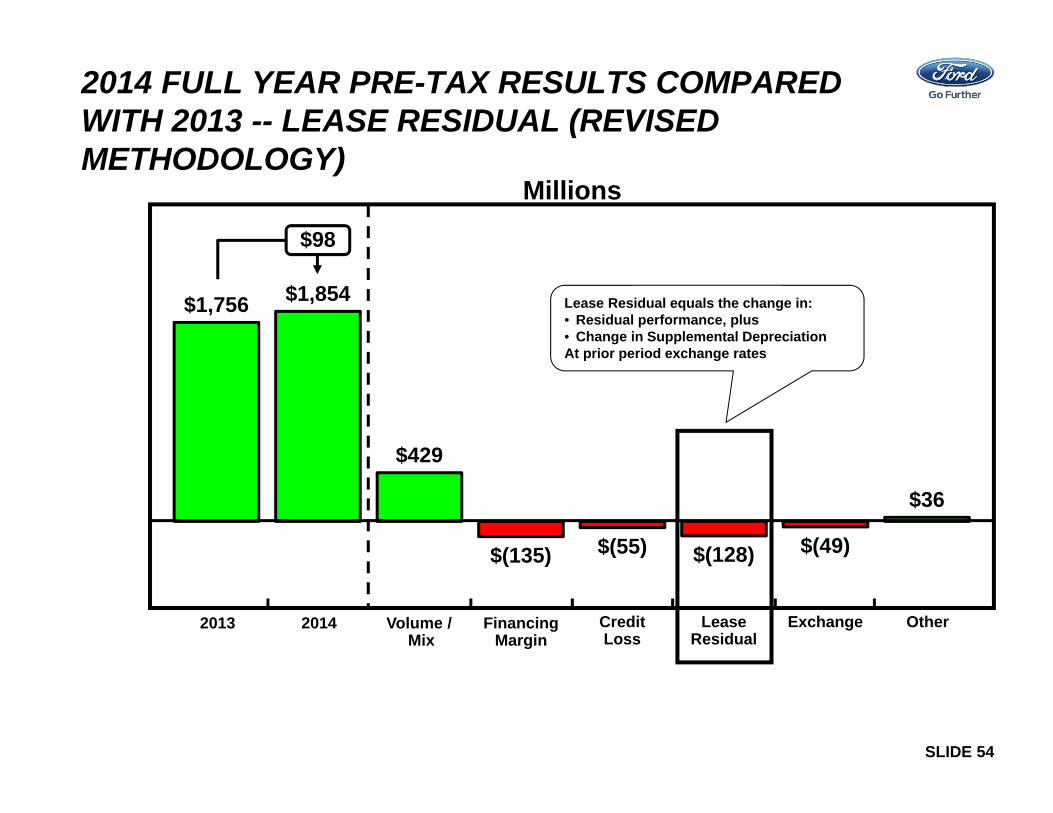
2014 FULL YEAR PRE-TAX RESULTS COMPARED WITH 2013 -- LEASE RESIDUAL (REVISED METHODOLOGY)
$1,756 $1,854
$429
$(135) $(55) $(128) $(49)
$36
Millions
$98
LeaseResidual
20142013 CreditLoss
FinancingMargin
OtherExchangeVolume / Mix
Lease Residual equals the change in:• Residual performance, plus• Change in Supplemental DepreciationAt prior period exchange rates

SLIDE 55
UNDERSTANDING LEASE RESIDUAL TERMINOLOGY -- INCOME STATEMENTRESIDUAL PERFORMANCE IN THE FINANCIAL STATEMENTSLease residual performance is included in depreciation in our financial statements, which is part of Net Financing Margin. For analytical purposes, we move the residual performance portion of depreciation from Net Financing Margin into its own category
RESIDUAL PERFORMANCESupplemental Depreciation: Reflects the increase or decrease in depreciation as a result of changes in the projected residual values beyond base depreciation at prior period exchange rates
+Residual Gains / Losses: Reflects the difference between the auction value and the depreciated value (base + supplemental depreciation) at prior period exchange rates
+Impairment (Rarely Used): Reflects a decrease in the book value of a lease due to significant decline in the value of the vehicles
=Lease Residual: The sum of the change in supplemental depreciation, residual gains or losses, and impairment for the period
SLIDE 56
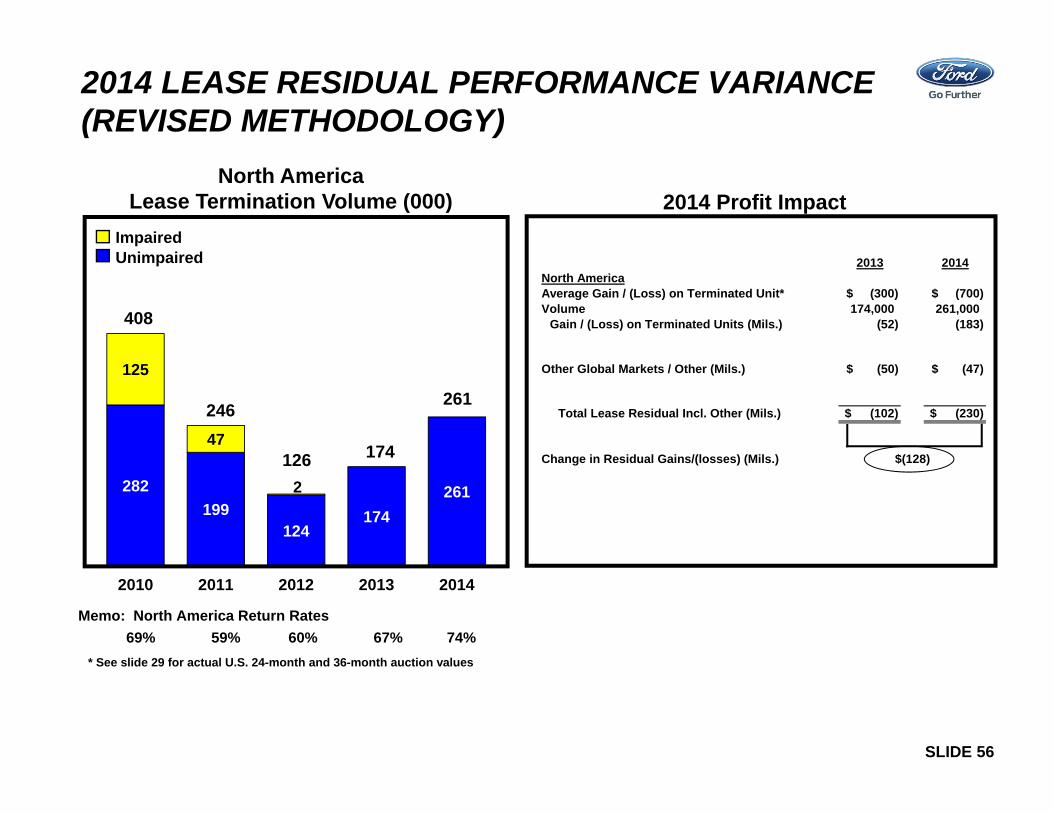
2014 LEASE RESIDUAL PERFORMANCE VARIANCE (REVISED METHODOLOGY)
282199
124174
261
125
47
2
2010 2011 2012 2013 2014
North America Lease Termination Volume (000)
ImpairedUnimpaired
246
126
408
2014 Profit Impact
* See slide 29 for actual U.S. 24-month and 36-month auction values
Memo: North America Return Rates 69% 59% 60% 67% 74%
174
261
2013 2014North AmericaAverage Gain / (Loss) on Terminated Unit* (300)$ (700)$ Volume 174,000 261,000
Gain / (Loss) on Terminated Units (Mils.) (52) (183)
Other Global Markets / Other (Mils.) (50)$ (47)$
Total Lease Residual Incl. Other (Mils.) (102)$ (230)$
Change in Residual Gains/(losses) (Mils.) $(128)
SLIDE 57
199
124174
261
47
2
2011 2012 2013 2014 2015
246
126
174
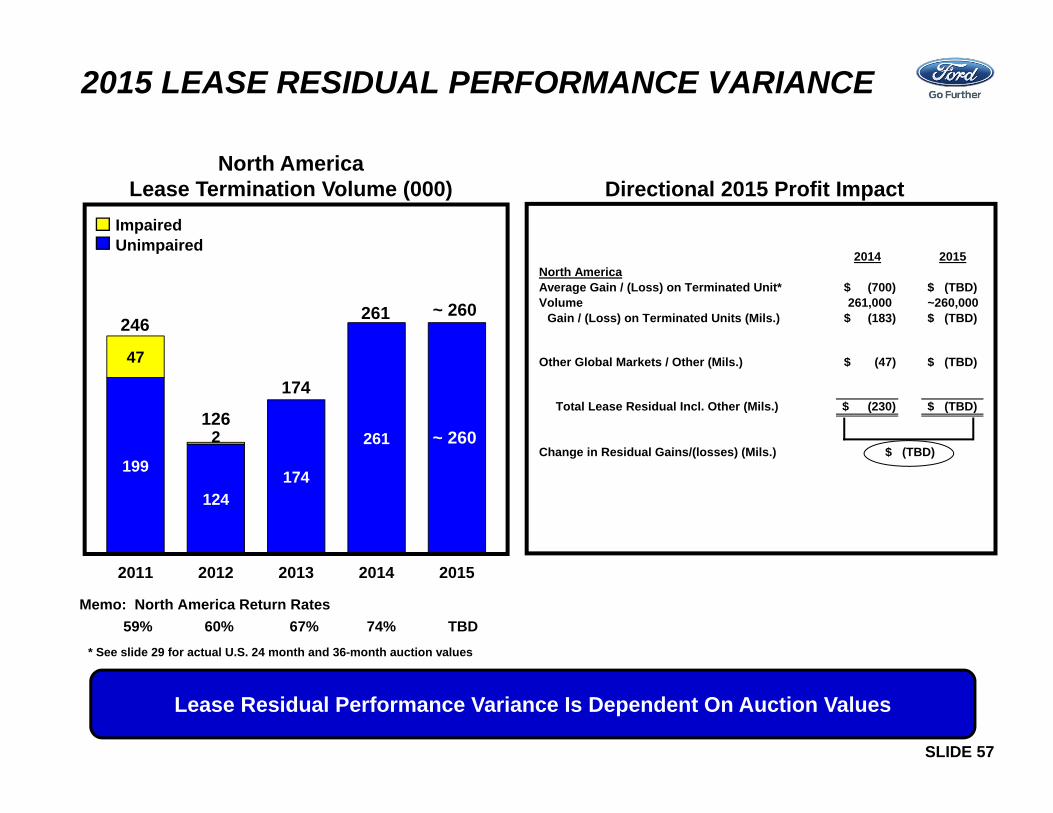
2015 LEASE RESIDUAL PERFORMANCE VARIANCE
ImpairedUnimpaired
Directional 2015 Profit Impact
Memo: North America Return Rates 59% 60% 67% 74% TBD
* See slide 29 for actual U.S. 24 month and 36-month auction values
Lease Residual Performance Variance Is Dependent On Auction Values
261 ~ 260
~ 260
North America Lease Termination Volume (000)
2014 2015North AmericaAverage Gain / (Loss) on Terminated Unit* (700)$ $ (TBD)Volume 261,000 ~260,000
Gain / (Loss) on Terminated Units (Mils.) (183)$ $ (TBD)
Other Global Markets / Other (Mils.) (47)$ $ (TBD)
Total Lease Residual Incl. Other (Mils.) (230)$ $ (TBD)
Change in Residual Gains/(losses) (Mils.) $ (TBD)
SLIDE 58
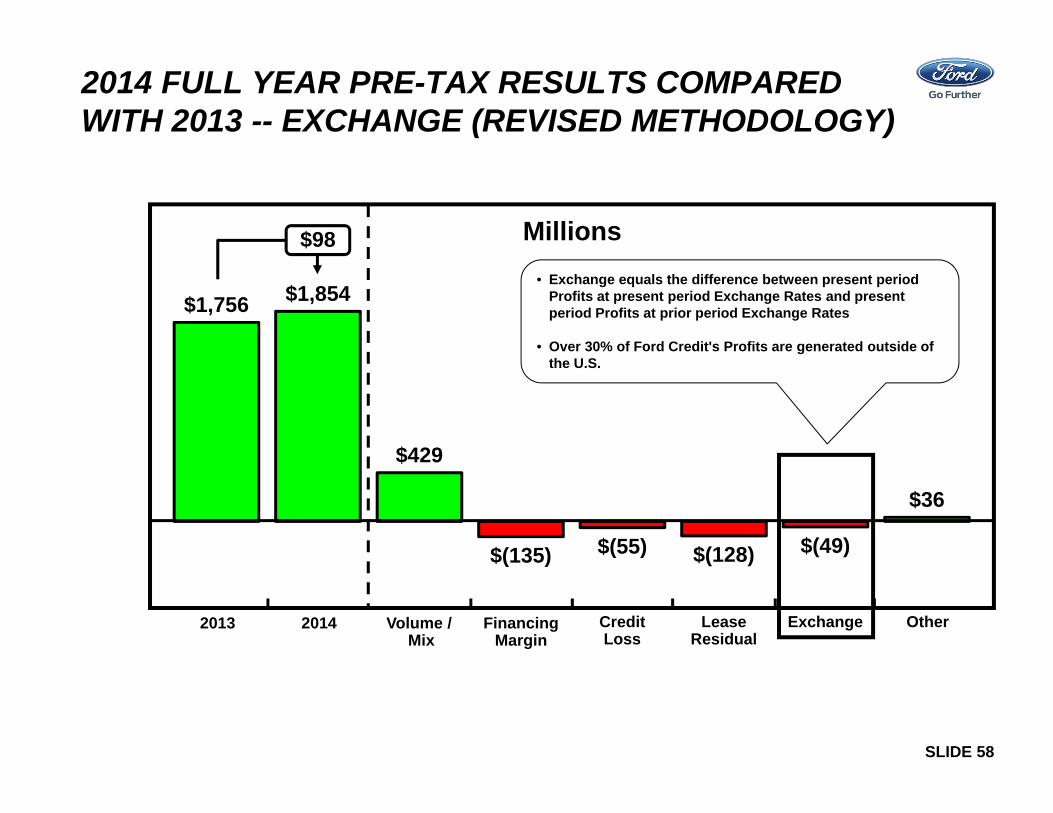
2014 FULL YEAR PRE-TAX RESULTS COMPARED WITH 2013 -- EXCHANGE (REVISED METHODOLOGY)
$1,756 $1,854
$429
$(135) $(55) $(128) $(49)
$36
Millions$98
LeaseResidual
20142013 CreditLoss
FinancingMargin
OtherExchangeVolume / Mix
• Exchange equals the difference between present period Profits at present period Exchange Rates and present period Profits at prior period Exchange Rates
• Over 30% of Ford Credit's Profits are generated outside of the U.S.
SLIDE 59
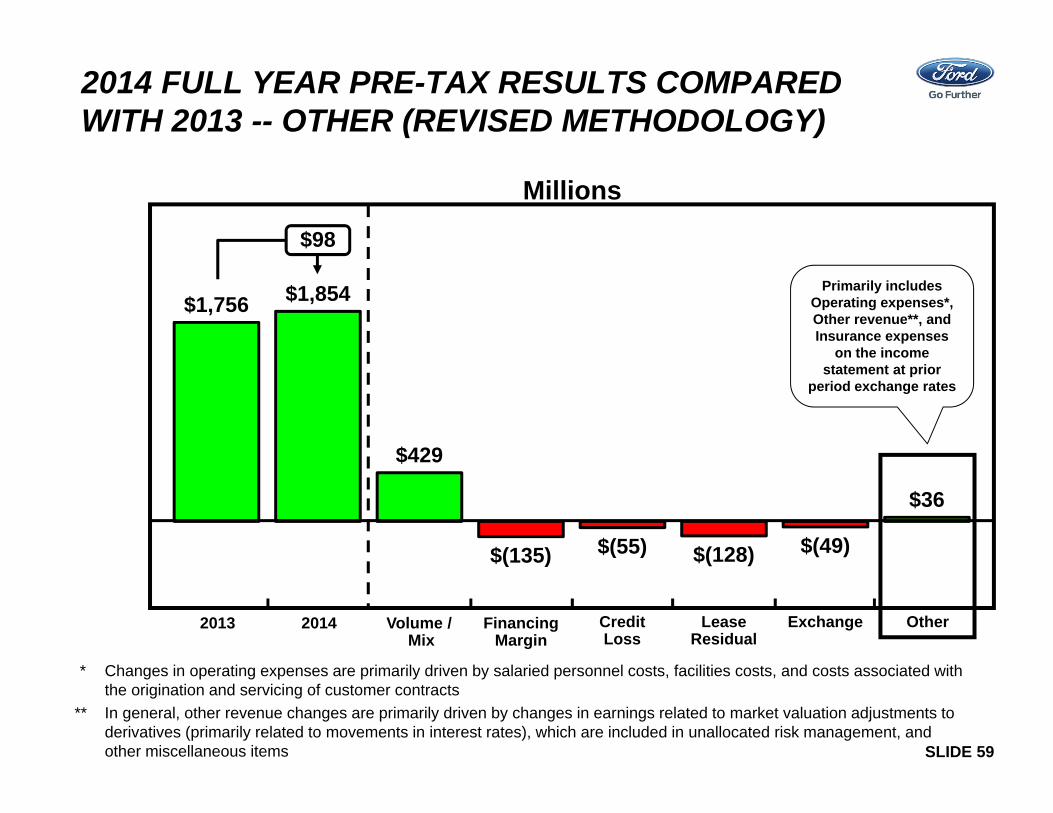
2014 FULL YEAR PRE-TAX RESULTS COMPARED WITH 2013 -- OTHER (REVISED METHODOLOGY)
$1,756 $1,854
$429
$(135) $(55) $(128) $(49)
$36
Millions
$98
LeaseResidual
20142013 CreditLoss
FinancingMargin
OtherExchangeVolume / Mix
Primarily includes Operating expenses*, Other revenue**, and Insurance expenses
on the income statement at prior
period exchange rates
* Changes in operating expenses are primarily driven by salaried personnel costs, facilities costs, and costs associated with the origination and servicing of customer contracts
** In general, other revenue changes are primarily driven by changes in earnings related to market valuation adjustments to derivatives (primarily related to movements in interest rates), which are included in unallocated risk management, and other miscellaneous items
SLIDE 60
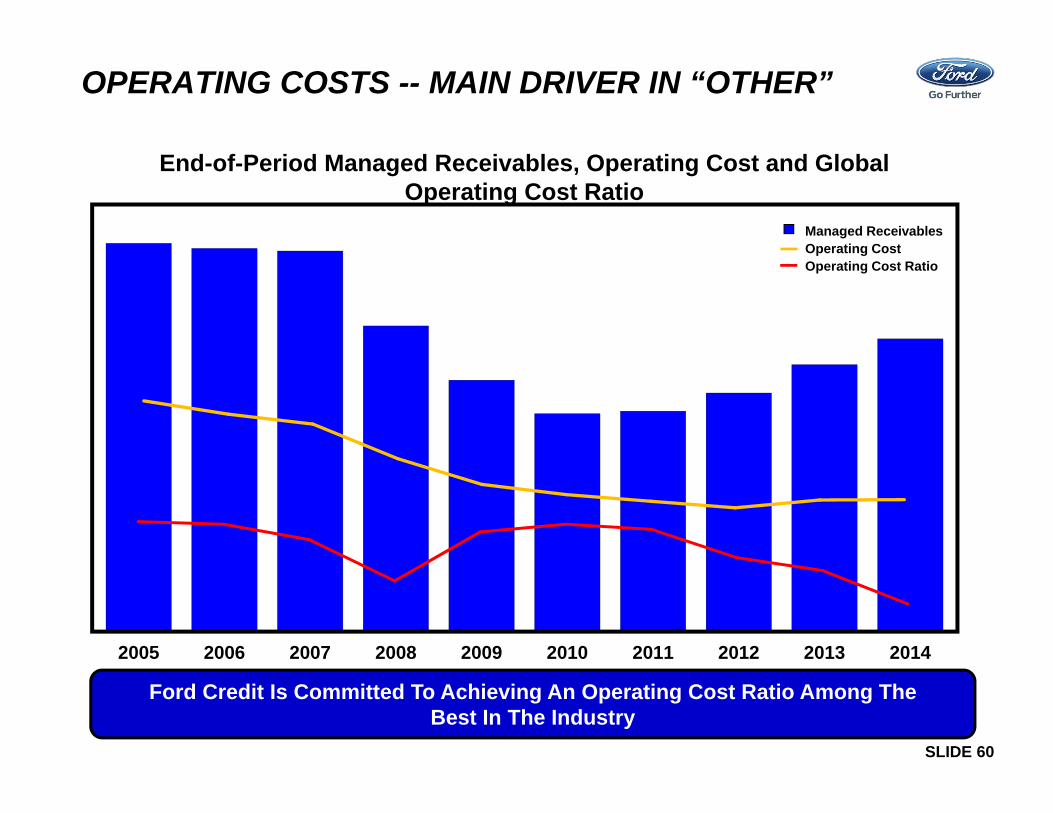
2005 2006 2007 2008 2009 2010 2011 2012 2013 2014
OPERATING COSTS -- MAIN DRIVER IN “OTHER”
End-of-Period Managed Receivables, Operating Cost and Global Operating Cost Ratio
Ford Credit Is Committed To Achieving An Operating Cost Ratio Among The Best In The Industry
Managed ReceivablesOperating CostOperating Cost Ratio

SLIDE 61
• Decline in industry sales volume, particularly in the United States, Europe, or China, due to financial crisis, recession, geopolitical events, or other factors;• Decline in Ford’s market share or failure to achieve growth;• Lower-than-anticipated market acceptance of Ford’s new or existing products;• Market shift away from sales of larger, more profitable vehicles beyond Ford’s current planning assumption, particularly in the United States;• An increase in or continued volatility of fuel prices, or reduced availability of fuel;• Continued or increased price competition resulting from industry excess capacity, currency fluctuations, or other factors;• Fluctuations in foreign currency exchange rates, commodity prices, and interest rates;• Adverse effects resulting from economic, geopolitical, or other events;• Economic distress of suppliers that may require Ford to provide substantial financial support or take other measures to ensure supplies of components or materials and
could increase costs, affect liquidity, or cause production constraints or disruptions;• Work stoppages at Ford or supplier facilities or other limitations on production (whether as a result of labor disputes, natural or man-made disasters, tight credit markets or
other financial distress, production constraints or difficulties, or other factors);• Single-source supply of components or materials;• Labor or other constraints on Ford’s ability to maintain competitive cost structure;• Substantial pension and postretirement health care and life insurance liabilities impairing liquidity or financial condition;• Worse-than-assumed economic and demographic experience for postretirement benefit plans (e.g., discount rates or investment returns);• Restriction on use of tax attributes from tax law “ownership change;”• The discovery of defects in vehicles resulting in delays in new model launches, recall campaigns, or increased warranty costs;• Increased safety, emissions, fuel economy, or other regulations resulting in higher costs, cash expenditures, and/or sales restrictions; • Unusual or significant litigation, governmental investigations, or adverse publicity arising out of alleged defects in products, perceived environmental impacts, or otherwise; • A change in requirements under long-term supply arrangements committing Ford to purchase minimum or fixed quantities of certain parts, or to pay a minimum amount to
the seller (“take-or-pay” contracts); • Adverse effects on results from a decrease in or cessation or clawback of government incentives related to investments; • Inherent limitations of internal controls impacting financial statements and safeguarding of assets; • Cybersecurity risks to operational systems, security systems, or infrastructure owned by Ford, Ford Credit, or a third-party vendor or supplier;• Failure of financial institutions to fulfill commitments under committed credit and liquidity facilities; • Inability of Ford Credit to access debt, securitization, or derivative markets around the world at competitive rates or in sufficient amounts, due to credit rating downgrades,
market volatility, market disruption, regulatory requirements, or other factors; • Higher-than-expected credit losses, lower-than-anticipated residual values, or higher-than-expected return volumes for leased vehicles; • Increased competition from banks, financial institutions, or other third parties seeking to increase their share of financing Ford vehicles; and • New or increased credit, consumer, or data protection or other regulations resulting in higher costs and/or additional financing restrictions.
Statements included or incorporated by reference herein may constitute “forward-looking statements” within the meaning of the Private Securities Litigation Reform Act of 1995. Forward-looking statements are based on expectations, forecasts, and assumptions by our management and involve a number of risks, uncertainties, and other factors that could cause actual results to differ materially from those stated, including, without limitation:
We cannot be certain that any expectation, forecast, or assumption made in preparing forward-looking statements will prove accurate, or that any projection will be realized. It is to be expected that there may be differences between projected and actual results. Our forward-looking statements speak only as of the date of their initial issuance, and we do not undertake any obligation to update or revise publicly any forward-looking statement, whether as a result of new information, future events, or otherwise. For additional discussion, see "Item 1A. Risk Factors" in our Annual Report on Form 10-K for the year ended December 31, 2014, as updated by our subsequent Quarterly Reports on Form 10-Q and Current Reports on Form 8-K.
RISK FACTORS

APPENDIX
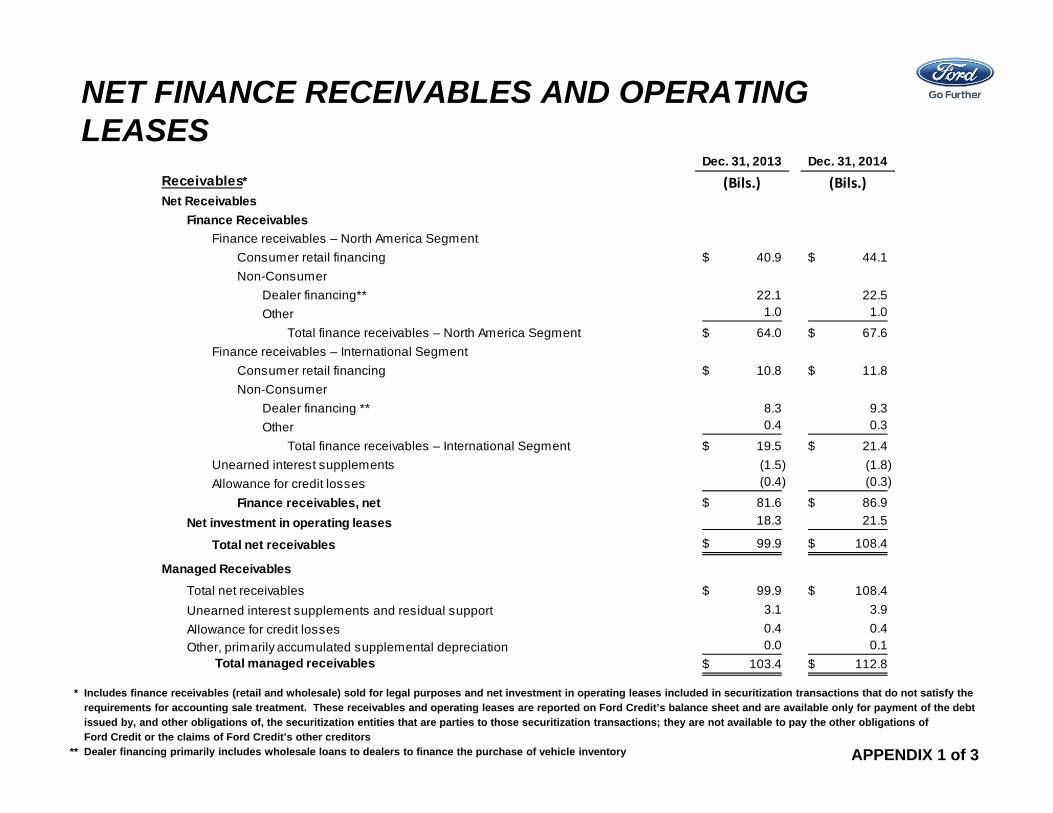
NET FINANCE RECEIVABLES AND OPERATING LEASES
APPENDIX 1 of 3
Dec. 31, 2013 Dec. 31, 2014Receivables* (Bils.) (Bils.)Net Receivables
Finance ReceivablesFinance receivables – North America Segment
Consumer retail financing 40.9$ 44.1$ Non-Consumer
Dealer financing** 22.1 22.5 Other 1.0 1.0
Total finance receivables – North America Segment 64.0$ 67.6$ Finance receivables – International Segment
Consumer retail financing 10.8$ 11.8$ Non-Consumer
Dealer financing ** 8.3 9.3 Other 0.4 0.3
Total finance receivables – International Segment 19.5$ 21.4$ Unearned interest supplements (1.5) (1.8) Allowance for credit losses (0.4) (0.3)
Finance receivables, net 81.6$ 86.9$ Net investment in operating leases 18.3 21.5
Total net receivables 99.9$ 108.4$
Managed ReceivablesTotal net receivables 99.9$ 108.4$ Unearned interest supplements and residual support 3.1 3.9 Allowance for credit losses 0.4 0.4 Other, primarily accumulated supplemental depreciation 0.0 0.1
Total managed receivables 103.4$ 112.8$
* Includes finance receivables (retail and wholesale) sold for legal purposes and net investment in operating leases included in securitization transactions that do not satisfy the requirements for accounting sale treatment. These receivables and operating leases are reported on Ford Credit’s balance sheet and are available only for payment of the debt issued by, and other obligations of, the securitization entities that are parties to those securitization transactions; they are not available to pay the other obligations of Ford Credit or the claims of Ford Credit’s other creditors
** Dealer financing primarily includes wholesale loans to dealers to finance the purchase of vehicle inventory

RECONCILIATION OF MANAGED LEVERAGE TO FINANCIAL STATEMENT LEVERAGE
APPENDIX 2 of 3
2013 2014Dec. 31 Dec. 31(Bils.) (Bils.)
Leverage Calculation Total Debt* $ 98.7 $ 105.0 Adjustments for Cash, Cash Equivalents, and Marketable Securities** (10.8) (8.9)Adjustments for Derivative Accounting*** (0.2) (0.4)
Total Adjusted Debt $ 87.7 $ 95.7
Equity**** $ 10.6 $ 11.4 Adjustments for Derivative Accounting*** (0.3) (0.4)
Total Adjusted Equity $ 10.3 $ 11.0
Financial Statement Leverage (to 1) 9.3 9.2 Managed Leverage (to 1)***** 8.5 8.7
* Includes debt reported on Ford Credit's balance sheet that is issued in securitization transactions and payable only out of collections on the underlying securitized assets and related enhancements. Ford Credit holds the right to receive the excess cash flows not needed to pay the debt issued by, and other obligations of, the securitization entities that are parties to those securitization transactions
** Excludes marketable securities related to insurance activities*** Primarily related to market valuation adjustments to derivatives due to movements in interest rates. Adjustments to debt are related to designated fair value hedges
and adjustments to equity are related to retained earnings**** Shareholder's interest reported on Ford Credit's balance sheet
***** Equals total adjusted debt over total adjusted equity

IMPACT OF ON-BALANCE SHEET SECURITIZATION
Impact of On-Balance Sheet Securitization – receivables include finance receivables (retail and wholesale) sold for legal purposes and net investment in operating leases included in securitization transactions that do not satisfy the requirements for accounting sale treatment. These receivables and operating leases are reported on Ford Credit’s balance sheet and are available only for payment of the debt issued by, and other obligations of, the securitization entities that are parties to those securitization transactions; they are not available to pay the other obligations of Ford Credit or the claims of Ford Credit’s other creditors. Total debt includes debt reported on Ford Credit’s balance sheet that is issued in securitization transactions and payable only out of collections on the underlying securitized assets and related enhancements. Ford Credit holds the right to receive the excess cash flows not needed to pay the debt issued by, and other obligations of, the securitization entities that are parties to those securitization transactions.
APPENDIX 3 of 3
SLIDE 66
FURTHER INFORMATION
Ford Investor Relations Contacts:Fixed Income Investors:
Stephen Dahle (U.S.-based)[email protected]
Information on Ford:• www.shareholder.ford.com• 10-K Annual Reports• 10-Q Quarterly Reports• 8-K Current Reports• Ford University• 2013/2014 Sustainability Report
– www.corporate.ford.com/microsites/sustainability-report-2013-14/default.html
Information on Ford Motor Credit Company:• www.fordcredit.com/investor-center• 10-K Annual Reports• 10-Q Quarterly Reports• 8-K Current Reports• Ford Credit University


