2015 Community Engagement Project - ipart.nsw.gov.au · 2015 Community Engagement Project...
27
To inform future decision making, the community are invited to share their expectations on the level of services and supporting facilities that Port Macquarie-Hastings Council provide Engagement Tools 2015 Community Engagement Project Identifies gap between expectations and current service delivery Creates a framework for informed conversation linking expectation and funding Clarifies what service levels the community are happy to accept and at what cost (based on options presented) Tests willingness of the community to pay more for higher service levels or reduce service levels Data to inform service levels for asset management plans and =Service Review project Data to input into ongoing corporate planning Data to inform FFF action plan delivery Online service ranking survey – “what services do you use in a week and how important are they?” Workshop voting tools Resource kit used at external meetings Case studies and videos of different user groups Outcomes Stage 1: Late Aug Stage 2: Oct Identify services / facilities our community values and expects Planning: Apr-Jul Define acceptable service levels/ facilities and confirm cost Define objectives and develop plans, collateral and engagement tools What will the results inform; Asset Management Plans Service Review Project FFF Action plan / SRV Application Process Budget objectives / OP Development Detailed focus groups for services with identified gap Targeted workshops based on evaluation of service delivery options Online questionaire CRG workshop Stage 3: Mid Nov Stage 4: Feb 2016 Report back to the community and propose funding models Present case to community for minimum retention of service levels Confirm position to retain SRV of 4.43% or further engagement required for additional SRV Budget Allocator (online and hard copy) assessing level of trade-off Survey online specifically asking on rates impact of SRV Workshop CRG Review data and finalise reference reports Finalise internal project reporting and engagement reference compendium Develop ongoing internal messaging Review project impact on corporate reporting objectives and expectations
-
Upload
nguyenkien -
Category
Documents
-
view
217 -
download
0
Transcript of 2015 Community Engagement Project - ipart.nsw.gov.au · 2015 Community Engagement Project...

To inform future decision making, the community are invited to share their expectations on the level of services and supporting facilities that Port Macquarie-Hastings Council provide
Enga
gem
ent
Tool
s
2015 Community Engagement Project
Identifies gap between expectations and current service delivery
Creates a framework for informed conversation linking expectation and funding
Clarifies what service levels the community are happy to accept and at what cost (based on options presented)
Tests willingness of the community to pay more for higher service levels or reduce service levels
Data to inform service levels for asset management plans and =Service Review project
Data to input into ongoing corporate planning
Data to inform FFF action plan delivery
Online service ranking survey – “what services do you use in a week and how important are they?”
Workshop voting tools Resource kit used at
external meetings Case studies and
videos of different user groups
Out
com
es
Stage 1: Late Aug Stage 2: Oct
Identify services / facilities
our community values and
expects
Planning: Apr-Jul
Define acceptable
service levels/ facilities and confirm cost
Define objectives and develop plans, collateral and engagement tools
What will the results inform; Asset Management Plans Service Review Project FFF Action plan / SRV Application Process Budget objectives / OP Development
Detailed focus groups for services with identified gap
Targeted workshops based on evaluation of service delivery options
Online questionaire CRG workshop
Stage 3: Mid Nov Stage 4: Feb 2016
Report back to the community and propose
funding models
Present case to community for minimum retention of service levels
Confirm position to retain SRV of 4.43% or further engagement required for additional SRV
Budget Allocator (online and hard copy) assessing level of trade-off
Survey online specifically asking on rates impact of SRV
Workshop CRG
Review data and finalise reference reports
Finalise internal project reporting and engagement reference compendium Develop ongoing internal messaging Review project impact on corporate reporting objectives and expectations

Port Macquarie-Hastings Council
Prepared by: Micromex Research
Date: February 2015
Presentation of Key Findings
Port Macquarie-Hastings Council
2015 Community Survey

Background &
MethodologyMethodology

Background & Methodology
Port Macquarie-Hastings Council sought to examine community attitudes and perceptions towardscurrent and future services and facilities provided by Council. Key objectives of the research included:
o Assessing and establishing the community’s priorities and satisfaction in relation to Council activities,services, and facilities
o Identifying the community’s overall level of satisfaction with Council’s performance
o Identifying the community’s level of satisfaction with regards to contact they have had with Councilstaff
o Identifying trends and benchmark results against the research conducted previously
To facilitate this, Micromex Research was contracted to develop a survey template that enabled Councilto effectively analyse attitudes and trends within the community.
Questionnaire
Micromex Research, together with Port Macquarie-Hastings Council, developed the questionnaire.
The survey was conducted by telephone with n=600 households.
For the survey under discussion the greatest margin of error is 4.0%. This means, for example that the
answer “satisfied” (43%) to the overall satisfaction question could vary from 39% to 47%.
Data collection
The survey was conducted during the period 15th – 21st January 2015 from 4:30pm to 8:30pm Monday to
Friday, and from 10am to 4pm Saturday.
Who responded?
The respondent demographics accurately reflected your community.
Confidence level of +/- 4.0%

How To Interpret Rating Scores
Ratings questions
The Unipolar Scale of 1 to 5 was used in all rating questions, where 1 was the lowestimportance or satisfaction and 5 the highest importance or satisfaction.
This scale allowed for a mid range position for those who had a divided or neutralopinion.
1.99 or lower ‘Very low’2.00 – 2.49 ‘Low’2.00 – 2.49 ‘Low’2.50 – 2.99 ‘Moderately low’3.00 – 3.59 ‘Moderate’3.60 – 3.89 ‘Moderately high’3.90 – 4.19 ‘High’4.20 – 4.49 ‘Very high’4.50 + ‘Extremely high’
Only respondents who rated services/facilities a 4 or 5 in importance were
asked to rate their satisfaction with that service/facility
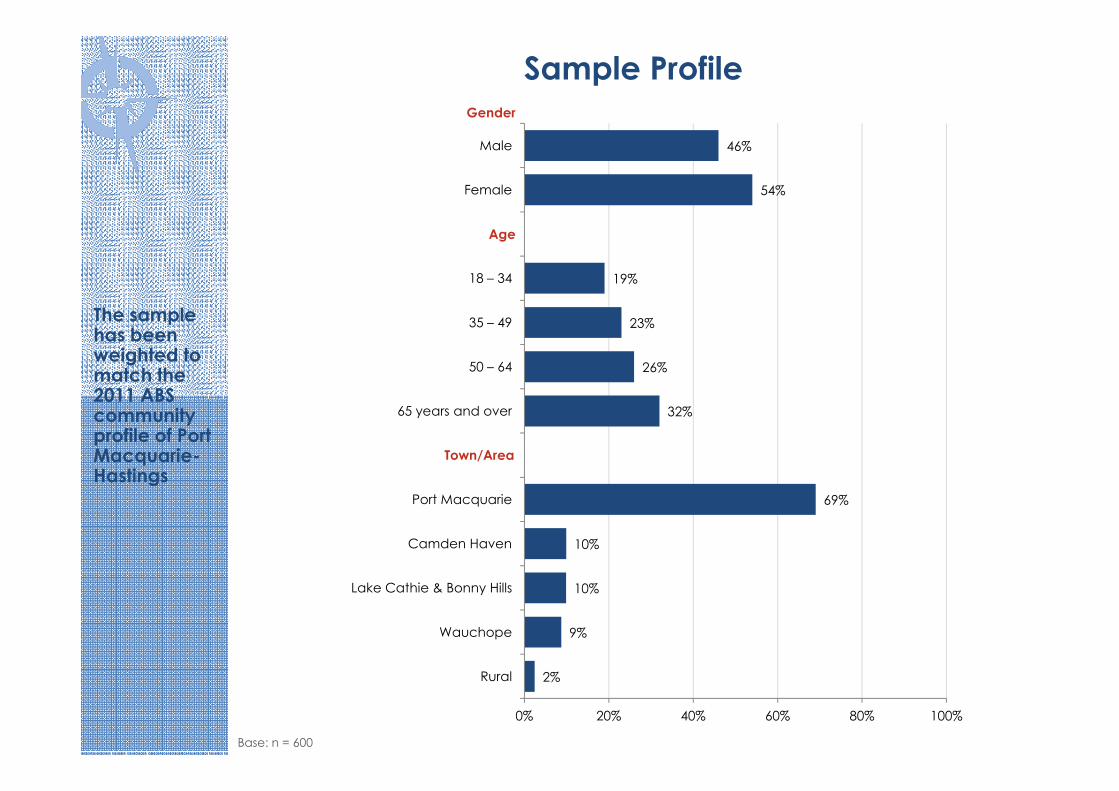
Sample Profile
The sample has been weighted to match the 2011 ABS
26%
23%
19%
54%
46%
50 – 64
35 – 49
18 – 34
Female
Male
Age
Gender
2011 ABS community profile of Port Macquarie-Hastings
Base: n = 600
2%
9%
10%
10%
69%
32%
0% 20% 40% 60% 80% 100%
Rural
Wauchope
Lake Cathie & Bonny Hills
Camden Haven
Port Macquarie
65 years and over
Town/Area

We Explored Resident Response To35 Service Areas
Ensuring Good Governance
Residents’ involvement in Council’s decision-making
Informing residents about Council activities
Providing strong community leadership
Long-term planning and vision Planning & Providing Our Infrastructure
Providing value for the ratepayers’ dollars Maintenance of sealed roads
Maintenance of unsealed roads
Looking After Our Environment Regulating traffic flow
Managing residential development Creating and monitoring parking
Managing commercial development Creating and maintaining footpaths and cycleways
Environmental monitoring and biodiversity protection Water supply services
Ensuring compliance with development and environmental regulations Sewerage services
Creating town centres and public spaces An adequate stormwater drainage system
Waste collection and disposal
Recycling Helping Our Community ProsperRecycling Helping Our Community Prosper
Promotion of the area through sport and other events
Looking After Our People Encouraging industry and business growth
Providing leadership in community activities Encouraging education and training opportunities
Providing grant money to community and cultural groups Encouraging tourism growth
Creating a sense of place and community involvement Port Macquarie Airport
Lobbying for services for specific groups such as older people, younger people,
the Aboriginal community, and people with disabilities
Library services
Arts and cultural activities
Parks, playgrounds, and recreation facilities
Sporting facilities
Pools
Maintenance of community halls

Overview of Results
Resident satisfaction with the overall performance of Council has significantly increased since 2012 and is a very
encouraging result, with 90% at least ‘somewhat satisfied’. This outcome is also significantly higher than our‘regional’ and ‘overall’ LGA Brand Scores, and are above all Brand Scores.
Satisfaction for 27 of the 35 services/facilities provided by Council have improved on 2012, however, there are still
opportunities to strengthen the community’s satisfaction with Council. To maintain resident satisfaction, Council
should continue to focus and improve on these services and facilities: ‘parks, playgrounds, and recreationfacilities’, ‘encouraging tourism growth’, and ‘arts and cultural activities’.
Residents’ most mentioned valued trait about living in the Port Macquarie-Hastings area was the central locality
of the area and its proximity to nature, scenery, and beaches. Further to this, residents also appreciate theclimate/weather, community, environment, and services and facilities provided by Council.
The community’s most prevalent concerns about the area was the roads/traffic congestion. To address this issue,
Council should look to explore the matter of population growth and take it into consideration duringdevelopment and infrastructure decisions and prior to implementation.development and infrastructure decisions and prior to implementation.
Leadership issues, specifically the areas that fall under the ‘Ensuring Good Governance’ pillar, are the key drivers
toward overall satisfaction with Council’s performance. This is not indicative that the other services/facilities are
less important, but rather some of the components of this pillar are integral to the community’s satisfaction withCouncil.
In relation to residents’ perception of Council’s priorities in the Port Macquarie-Hastings area and their level of
investment, there is a strong correlation, across all areas, between what residents consider a priority and the level
of investment they feel should be allocated to those areas. However, Council should largely focus on ‘roads,
bridges, and transport’; secondary to this, Council should look to investigate improvement to ‘water supply
services’, ‘waste management’, ‘airport’, ‘parks, beaches, sports, and recreational facilities’, stormwater anddrainage’, ‘economic development’, and ‘natural resource management’.

Key Findings

Overall Satisfaction with the Performance of Council over the Past 12 Months
Overall
2015
Overall
201218-34 35-49 50-64 65+ Male Female
Satisfaction mean ratings 3.51▲ 3.13▼ 3.40 3.43 3.46 3.67▲ 3.48 3.53
Port
Macquarie
Camden
Haven
Lake Cathie
& Bonny HillsWauchope Rural/Other
Satisfaction mean ratings 3.60▲ 3.27 3.47 3.01▼ 3.84
NSW LGA BRAND SCORES Metro Regional All of NSW
Port Macquarie-
Hastings Council
2015
Mean ratings 3.45 3.22▼ 3.31▼ 3.51▲
10%Very satisfied
Scale: 1 = not at all satisfied, 5 = very satisfied
▼▲= significantly lower/higher than the overall
90% of residents were at least ‘somewhat satisfied’ with the performance of Council
Base: n = 600
Q7a. Over the last 12 months, how satisfied are you with the performance of Council, not just on one or two
issues, but across all responsibility areas?
2%
8%
37%
43%
0% 25% 50%
Not at all satisfied
Not very satisfied
Somewhat satisfied
Satisfied
Mean: 3.51Mean: 3.51

Council’s Level of Communication with the CommunityOverall
2015
Overall
201218-34 35-49 50-64 65+ Male Female
Satisfaction mean ratings 3.48▲ 3.21▼ 3.38 3.29▼ 3.52 3.63▲ 3.43 3.51
Port
Macquarie
Camden
Haven
Lake Cathie
& Bonny HillsWauchope Rural/Other
Satisfaction mean ratings 3.58▲ 3.31 3.51 2.90▼ 3.17
42%
10%
Satisfied
Very satisfied
Scale: 1 = not at all satisfied, 5 = very satisfied
▼▲= significantly lower/higher than the overall
89% of residents were at least ‘somewhat satisfied’ with the level of communication Council currently has with the community
Base: n = 600
Q5a. How satisfied are you with the level of communication Council currently has with the community?
2%
9%
37%
0% 25% 50%
Not at all satisfied
Not very satisfied
Somewhat satisfied
Mean: 3.48Mean: 3.48

Most Valued Aspects about Living in the Port Macquarie-Hastings area
Word Frequency Tagging
Verbatim responses for this question were collated and entered into analytical software. This analysis ‘counts’ the number of times a particular word or phrase
appears and, based on the frequency of that word or phrase, a font size is generated. The larger the font, the more frequently the word or sentiment is
mentioned.
18%
21%
Climate/Weather
Central location/Proximity -
beaches, nature, scenery
Base: n = 600
Residents most value the central location and proximity of the Port Macquarie-Hastings area, specifically in relation to beaches, nature, and scenery
Q1. What do you value most about living in the Port Macquarie-Hastings area?
10%
13%
14%
0% 15% 30%
Services/Facilities
Environment - peaceful, quiet,
relaxed
Community - friendly, family,
people

Local Concerns about the Port Macquarie-Hastings area
Word Frequency Tagging
Verbatim responses for this question were collated and entered into analytical software. This analysis ‘counts’ the number of times a particular word or phrase
appears and, based on the frequency of that word or phrase, a font size is generated. The larger the font, the more frequently the word or sentiment is
mentioned.
21%
28%
Maintenance and management of
services/facilities
Roads/Traffic congestion
Base: n = 600
Q2. What concerns you most with regards to living in the Port Macquarie-Hastings area?
9%
11%
14%
0% 15% 30%
Employment - opportunities, youth,
increase
Development - upgrading,
infrastructure, high-rise, buildings
Population growth - community,
residents, town
Residents were primarily concerned with the ‘roads/traffic congestion’ in the area, followed by ‘maintenance and management of services/facilities’

LGA Benchmarks
Service/Facility
Port Macquarie-Hastings Council
Satisfaction Scores
Satisfaction Benchmark
Above the Benchmark
Library services 4.3 4.1
Overall satisfaction with the way contact was handled - In person 4.2 4.0
Recycling 4.1 3.9
Overall satisfaction with the way contact was handled 4.0 3.9Overall satisfaction with the way contact was handled 4.0 3.9
An adequate stormwater drainage system 3.6 3.3
Environmental monitoring and biodiversity protection 3.5 3.4
Informing residents about Council activities 3.4 3.3
Creating town centres and public spaces 3.4 3.3
Encouraging industry and business growth 3.3 3.2
Residents' involvement in Council's decision-making 3.1 3.0
Port Macquarie-Hastings Council residents are more satisfied than the LGA Benchmark score for 10 of the 22 comparable measures

LGA Benchmarks
Service/Facility
Port Macquarie-Hastings Council
Satisfaction Scores
Satisfaction Benchmark
Equal to the Benchmark
Overall satisfaction with the way contact was handled - Phone 3.9 3.9
Sporting facilities 3.7 3.7
Overall satisfaction with the level of communication Council has with the community 3.5 3.5
Ensuring compliance with development and environmental regulations 3.4 3.4
Long-term planning and vision 3.1 3.1
Below the BenchmarkBelow the Benchmark
Arts and cultural activities 3.7 3.8
Waste collection and disposal 3.7 4.1
Maintenance of community halls 3.5 3.6
Creating and maintaining footpaths and cycleways 2.9 3.2
Creating and monitoring parking 2.9 3.0
Maintenance of unsealed roads 2.4 2.8
Maintenance of sealed roads 2.3 2.8
5 of the comparable measures are equal to the Benchmark, whilst the remaining 7 fall below

Summary of Performance Gap Analysis (PGA)
Ranking Service/ FacilityImportance
MeanSatisfaction
MeanPerformance
Gap
1 Maintenance of sealed roads 4.78 2.30 2.48
2 Maintenance of unsealed roads 4.29 2.43 1.86
3 Providing value for the ratepayers’ dollars 4.52 2.88 1.64
4 Creating and maintaining footpaths and cycleways 4.48 2.92 1.56
5 Creating and monitoring parking 4.41 2.86 1.55
6 Long-term planning and vision 4.60 3.12 1.48
7 Regulating traffic flow 4.52 3.11 1.41Regulating traffic flow 4.52 3.11 1.41
8 Encouraging industry and business growth 4.49 3.31 1.18
9 Encouraging education and training opportunities 4.74 3.62 1.12
10 Managing residential development 4.27 3.21 1.06
11 Creating town centres and public spaces 4.42 3.37 1.05
12 Managing commercial development 4.14 3.10 1.04
13Lobbying for services for specific groups such as older people, younger
people, the Aboriginal community, and people with disabilities4.42 3.39 1.03

Quadrant Analysis – Importance v Satisfaction
ImproveHigher importance, lower satisfaction
MaintainHigher importance, higher satisfaction
Imp
ort
an
ce
Sewerage services(4.66, 4.17)
Recycling(4.74, 4.11)
Providing value for the
ratepayers’ dollars
Long-term planning
and vision
Creating town centres and
public spaces
Waste collection
and disposal
Environmental monitoring and
biodiversity protection
Lobbying for services for specific
groups such as older people,
younger people, the Aboriginal
community, and people with
disabilities Parks, playgrounds, and
recreation facilities
Water supply services
An adequate stormwater
drainage system
Regulating
traffic flow
Creating and maintaining
footpaths and cycleways
Creating and monitoring
parking
Encouraging education
and training opportunities
Port Macquarie
Airport
Encouraging industry and
business growth
Encouraging tourism growth4.5
4.6
4.7
4.8Maintenance of
sealed roads(4.78, 2.30)
Imp
ort
an
ce
NicheLower importance, lower satisfaction
SatisfactionCommunity
Lower importance, higher satisfaction
Maintenance of unsealed roads
(4.29, 2.43)
Library services(4.21, 4.25)
Arts and cultural activities
(3.78, 3.73)
Residents' involvement in
Council's decision-making
Informing residents about
Council activities
Providing strong community
leadership
Managing residential
development
Managing commercial
development
Ensuring compliance with
development and
environmental regulations
Providing leadership in
community activities
Pools
Creating a sense of place and
community involvement
Sporting facilities
Providing grant money to
community and cultural groups
Maintenance of community
halls
parking
Promotion of the area through
sport and other events
4.0
4.1
4.2
4.3
4.4
2.8 2.9 3.0 3.1 3.2 3.3 3.4 3.5 3.6 3.7 3.8 3.9 4.0

Shapley Value Regression
This model was developed by conducting specialised analysis from over
30,000 LGA interviews conducted since 2008.
The outcomes proved that increasing resident satisfaction by actioning the
priorities that they stated as being important does not necessarily positively
impact on overall satisfaction with the Council.
In 2014, we revised the Shapley regression analysis to identify the directional
contribution of key services and facilities with regard to satisfaction/
dissatisfaction with Council’s overall performance.
Over 50 unique LGAs since 2010, 70+ community surveys
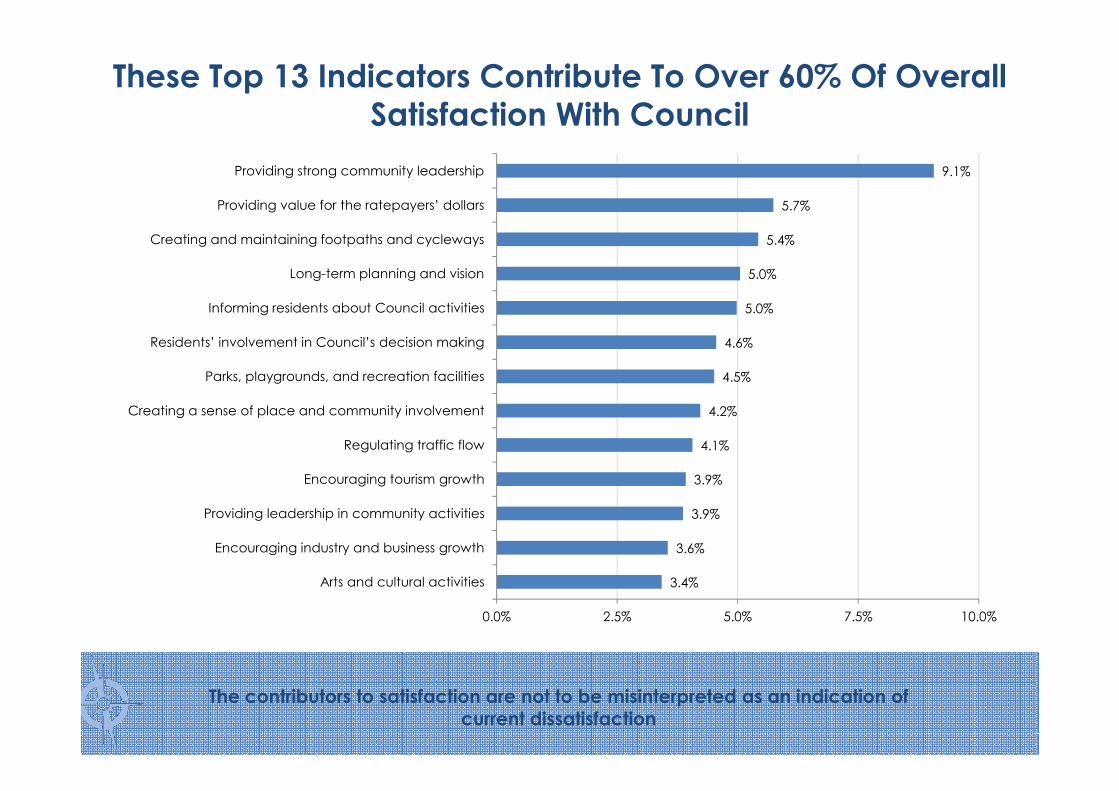
These Top 13 Indicators Contribute To Over 60% Of Overall Satisfaction With Council
4.5%
4.6%
5.0%
5.0%
5.4%
5.7%
9.1%
Parks, playgrounds, and recreation facilities
Residents’ involvement in Council’s decision making
Informing residents about Council activities
Long-term planning and vision
Creating and maintaining footpaths and cycleways
Providing value for the ratepayers’ dollars
Providing strong community leadership
The contributors to satisfaction are not to be misinterpreted as an indication ofcurrent dissatisfaction
3.4%
3.6%
3.9%
3.9%
4.1%
4.2%
0.0% 2.5% 5.0% 7.5% 10.0%
Arts and cultural activities
Encouraging industry and business growth
Providing leadership in community activities
Encouraging tourism growth
Regulating traffic flow
Creating a sense of place and community involvement

The key driver
of overall
community
satisfaction
with Council
Mapping Stated Satisfaction and Derived Importance Identifies the Community
Priority Areas
Sta
ted
Sa
tisf
ac
tio
n
Moderately High
Satisfaction 3.60 – 3.89
Moderate Satisfaction 3.00 – 3.59
Informing residents
about Council
activities
Parks, playgrounds,
and recreation
facilities
Creating a sense of
place and community
involvement
Encouraging tourism
growth
Providing leadership in
community activities
Arts and
cultural activities
3.4
3.6
3.8
with Council
revolves
around ‘long-
term planning
and vision’
Sta
ted
Sa
tisf
ac
tio
n
Derived Importance
Low Satisfaction
≤ 2.99
Providing value for the
ratepayers’ dollars
Creating and
maintaining footpaths
and cycleways
Long-term planning
and vision
Residents’ involvement
in Council’s decision-
making
Regulating traffic flow
Encouraging industry
and business growth
2.8
3.0
3.2
3.4% 4.4% 5.4% 6.4%

Key Contributors to Barriers/Optimisers
-5.35%
-4.26%
-5.04%
-3.94%
-3.43%
-4.16%
-1.63%
3.72%
1.49%
0.39%
1.11%
1.56%
0.40%
2.88%
-8.0% -6.0% -4.0% -2.0% 0.0% 2.0% 4.0% 6.0% 8.0%
Providing strong community leadership
Providing value for the ratepayers’ dollars
Creating and maintaining footpaths and cycleways
Long-term planning and vision
Informing residents about Council activities
Residents’ involvement in Council’s decision-making
Parks, playgrounds, and recreation facilities
Optimisers(22%)
Different levers address the different levels of satisfaction across the community
-3.50%
-2.86%
-0.69%
-2.29%
-2.59%
-0.97%
0.73%
1.21%
3.24%
1.58%
0.96%
2.45%
Creating a sense of place and community involvement
Regulating traffic flow
Encouraging tourism growth
Providing leadership in community activities
Encouraging industry and business growth
Arts and cultural activities
Barriers(41%)

Community’s Perception of Priorities in the Local Area
82%
83%
83%
84%
85%
88%
88%
88%
91%
98%
Compliance
Natural resource management
Sewerage services
Economic development
Stormwater and drainage
Waste management
Airport
Parks, beaches, sports, and recreational …
Water supply services
Roads, bridges, and transport
53%
59%
62%
65%
71%
73%
80%
0% 25% 50% 75% 100%
Cultural development
Crematorium and cemeteries
Library services
Place Making / Community Place
Development assessment
Customer interactions
Strategic land use planning
Base: n = 600
Residents believe the highest priority for Council in the local area is ‘roads, bridges, and transport’ (98%), followed by ‘water supply services’ (91%)

Council’s Level of Investment into the Local Area
Roads, bridges, and transport
Airport
Parks, beaches, sports, and recreational facilities
Water supply services
Economic development
Stormwater and drainage
Strategic land use planning
Natural resource management
Waste management
Compliance
Customer interactions -5%
-5%
-2%
-5%
-4%
-2%
-5%
-1%
-1%
-3%
0%
36%
37%
37%
44%
47%
47%
52%
54%
56%
60%
86%
Mean ratings
0.86
0.57
0.55
0.53
0.47
0.46
0.44
0.40
0.35
0.32
0.31Customer interactions
Sewerage services
Place Making / Community Place
Development assessment
Library services
Crematorium and cemeteries
Cultural development -17%
-8%
-6%
-6%
-9%
-1%
-5%
25%
21%
21%
33%
37%
32%
36%
-25% 0% 25% 50% 75% 100%
Less More
Base: n = 599
0.31
0.30
0.28
0.27
0.14
0.13
0.08
Residents primarily believe Council should invest more toward ‘roads, bridges, and transport’ (86%)

Quadrant Analysis – Priority v Investment
NicheLow priority / Higher Investment
IncreaseHigh priority / Higher investment
Inve
stm
en
t
Roads, bridges & transport
Water supply servicesWaste management
Airport
Parks, beaches, sports &
recreational facilities
Stormwater
And drainage0.5
0.6
0.7
0.8
0.9
Inve
stm
en
t
ReduceLow priority / Lower Investment
PriorityReview
High priority
recreational facilitiesAnd drainage
Economic development
Natural resource management
Compliance
Sewerage services
Strategic land use planning
Customer interactions
Development assessmentPlace Making / Community Place
Library services
Crematorium
& cemeteries
Cultural development
0.0
0.1
0.2
0.3
0.4
50% 60% 70% 80% 90% 100%

Recommendations

Recommendations & Next Steps
Based on the outcomes of this research, we recommend that Port Macquarie-Hastings Council consider the
following:
1. Explore and clarify residents’ expectations in the financial decision process to lift satisfaction scores and ensure
the community has an understanding of Council’s role (i.e. ‘providing value for the ratepayers’ dollars’)
2. Communicate to residents the development/management projects in the area, pertaining to the creation and
maintenance of ‘roads, bridges, and transport’, ‘footpaths and cycleways’, and ‘regulating traffic flow’
3. Seize opportunities to involve the community in the decision-making process to understand the concerns and3. Seize opportunities to involve the community in the decision-making process to understand the concerns and
opinions of residents, and to encourage a sense of place and community involvement. Explore innovation in
this area to maximise the positive impact of Council consultations
4. Contextualise expectations of residents with regard to Council’s role in relation to ‘long-term planning and
vision’ and ‘encouraging industry and business growth’

Telephone: (02) 4352 2388Fax: (02) 4352 2117Web: www.micromex.com.au Email: [email protected]