2015 Calgary Real Estate Board (CREB) Forecast Report
28
2015 economic outlook & regional housing forecast
-
Upload
jerry-charlton -
Category
Real Estate
-
view
743 -
download
3
Transcript of 2015 Calgary Real Estate Board (CREB) Forecast Report

2015economic outlook &
regional housing forecast

©2015 CREB®. All rights reserved.
The forecasts included in this document are based on information available as of December 2014.Prepared by Ann-Marie Lurie, CREB® chief economist.
300 Manning Road NECalgary, AlbertaT2E 8K4, Canada
Phone: 403-263-0530Fax: 403-218-3688Email: [email protected]
creb.comcrebforecast.comcrebnow.com

CONTENTS
CALGARY REGION RESALE HOUSING MARKET SUMMARY . . . . . . . . . . . .4
GLOBAL AND NATIONAL ECONOMY AT A GLANCE . . . . . . . . . . . . . . . . . . . 5
CALGARY / ALBERTA ECONOMIC FACTORS . . . . . . . . . . . . . . . . . . . . . . . . . .6 Energy . . . . . . . . . . . . . . . . . . . . . . . . . . . . . . . . . . . . . . . . . . . . . . . . . . . . . . . . . 6 Economic Growth / Employment / Wages . . . . . . . . . . . . . . . . . . . . . . . . . 8 Population Growth . . . . . . . . . . . . . . . . . . . . . . . . . . . . . . . . . . . . . . . . . . . . . .11 New Home Sector . . . . . . . . . . . . . . . . . . . . . . . . . . . . . . . . . . . . . . . . . . . . . . 12 Rental Market . . . . . . . . . . . . . . . . . . . . . . . . . . . . . . . . . . . . . . . . . . . . . . . . . . 13 Interest Rates . . . . . . . . . . . . . . . . . . . . . . . . . . . . . . . . . . . . . . . . . . . . . . . . . . 14 Economic Risk . . . . . . . . . . . . . . . . . . . . . . . . . . . . . . . . . . . . . . . . . . . . . . . . . 14
HOUSING MARKET . . . . . . . . . . . . . . . . . . . . . . . . . . . . . . . . . . . . . . . . . . . . . . . . 15 City of Calgary, Total Market . . . . . . . . . . . . . . . . . . . . . . . . . . . . . . . . . . . . 15 City of Calgary, Detached . . . . . . . . . . . . . . . . . . . . . . . . . . . . . . . . . . . . . . . 17 City of Calgary, Apartment . . . . . . . . . . . . . . . . . . . . . . . . . . . . . . . . . . . . . . 19 City of Calgary, Attached . . . . . . . . . . . . . . . . . . . . . . . . . . . . . . . . . . . . . . . 21
CITY OF CALGARY DISTRICT STATS . . . . . . . . . . . . . . . . . . . . . . . . . . . . . . . . .22
REGIONAL ACTIVITY . . . . . . . . . . . . . . . . . . . . . . . . . . . . . . . . . . . . . . . . . . . . . .24 City of Airdrie . . . . . . . . . . . . . . . . . . . . . . . . . . . . . . . . . . . . . . . . . . . . . . . . . .24 Region of Foothills . . . . . . . . . . . . . . . . . . . . . . . . . . . . . . . . . . . . . . . . . . . . .24 Region of Rockyview . . . . . . . . . . . . . . . . . . . . . . . . . . . . . . . . . . . . . . . . . . .25
HOUSING RISK . . . . . . . . . . . . . . . . . . . . . . . . . . . . . . . . . . . . . . . . . . . . . . . . . . .26
FORECAST TABLE . . . . . . . . . . . . . . . . . . . . . . . . . . . . . . . . . . . . . . . . . . . . . . . . .26
CREB® 2015 ECONOMIC OUTLOOK & REGIONAL MARKET FORECAST 3

>> Calgary’s regional housing market in 2014 benefi ted from strong demand due to positive economic fundamentals. In 2015, however, several factors are pointing toward a pullback. While overall employment levels are forecasted to remain steady, a drop in net migration, coupled with expected lending rate increases and energy sector uncertainty will impact housing demand. While, supply levels are expected to rise. Given previously tight market conditions, rising supply will simply push the market toward more balanced conditions, supporting price stability.
CALGARY REGION RESALE HOUSING MARKET SUMMARY
Calgary 81.4%
Rockyview 6.2%
Other active areas 2.3%
Airdrie 5.4%
Foothills region 4.7%
2014 Share of Total Sales
StrathmoreStrathmore
VulcanVulcan
DidsburyDidsbury
CarstairsCarstairs
BlackieBlackie
OkotoksOkotoks
HighHighRiverRiver
HeritageHeritageHeritageHeritageHeritageHeritagePointePointePointe
CayleyCayley
BlackBlackDiamondDiamond
TurnerTurnerTurnerTurnerValleyValleyValleyValley
BeisekerBeiseker
ChestermereChestermereChestermereChestermereChestermereChestermereChestermereChestermere
LangdonLangdonLangdonLangdonLangdonLangdonLangdonLangdon
IrricanaIrricana
CochraneCochrane
Bragg CreekBragg CreekBragg CreekBragg CreekBragg CreekBragg CreekBragg CreekBragg Creek
RedwoodRedwoodMeadowsMeadows
CremonaCremona
MOUNTAIN VIEWMOUNTAIN VIEW
ROCKYROCKYVIEWVIEW
FOOTHILLSFOOTHILLS
CALGARYCALGARY
AIRDRIEAIRDRIEAIRDRIE
WHEATLANDWHEATLAND
VULCANVULCAN
NOTE: CREB®’s economic region, which is defi ned by members’ activity, consists of Calgary, Airdrie, Rocky View County, M.D of Foothills and “Other,” which includes Strathmore, Vulcan, Carstairs, Didsbury and Cremona. The following distribution chart indicates the share of total sales activity by region.
CREB® 2015 ECONOMIC OUTLOOK & REGIONAL MARKET FORECAST4

• The global economy underperformed in 2014, mostly due to weaker than expected growth in the United States, Europe and China. It’s expected to improve in 2015 due to the accelerated pace of growth in the U.S. economy.
• Europe’s fragile economy continues to be at risk due to lingering issues with labour markets, persistently low infl ation and elevated risk. Modest growth is expected in 2015 based on the combined e� ects of rising world demand, policy changes and structural reforms within the region.
• According to the Bank of Canada, emerging market growth varies signifi cantly by location. Areas such as India and Indonesia are benefi ting from successful political transitions, while structural reforms in Mexico are fostering growth. Brazil, Russia and Turkey, however, are experiencing weaker growth as a result of political or geopolitical tensions. While market divergence will persist, economic growth in the U.S. will strengthen emerging markets through to 2016.
• China’s economy stumbled out of the gates in 2014, but recorded gains over the next three quarters following improvements to net exports. The Bank of Canada expects growth to ease from 7.4 per cent in 2014 to seven per cent in 2015.
NOTE: U.S. ECONOMYDespite a weak start to 2014, the U.S. economy gained speed throughout the remainder of the year. Strong employment gains supported rising demand and, ultimately, business investment growth. Positive momentum in the labour market is expected to support eventual income gains and stronger growth in both consumer spending and housing demand. Many economists anticipate the country’s GDP will grow by more than three per cent in 2015, supporting a stronger global economy.
NOTE: CANADIAN ECONOMYFor many economists, Canada’s economy fell short of expectations in 2014 as the business sector hesitated to increase investments, governments were in fi scal-restraint mode and weak labour income growth eroded households’ purchasing power. Moving forward, stronger U.S. economic growth, coupled with a weaker Canadian dollar, is expected to boost Canadian exports, making it the primary driver of growth in 2015. This should help motivate business investment and support growth in both full-time employment and wages. However, lower crude oil prices are expected to change the dynamic of growth in the country. The outlook has improved for most non-resource based economies, yet declined for resource-rich provinces.
GLOBAL AND NATIONAL ECONOMY AT A GLANCE
Real Annual GDP Growth
2.5%
2.3%
1.7%
2.4%
2.6%
2.1%
1.9%
2.3%
3.0%
1.4%
2.3%
2.3%
3.8%
1.2%
1.7%
2.3%
1.8%
9.0%
1.6%
2.0%
1.5%
2.4%
British Columbia
Alberta
Saskatchewan
Manitoba
Ontario
Quebec
New Brunswick
Nova Scotia
Newfoundland and Labrador
Price Edward Island
Canada
Source: Provincial Economic Forecast, TD Economics December, 2014
2014 (F)
2015 (F)
CREB® 2015 ECONOMIC OUTLOOK & REGIONAL MARKET FORECAST 5

ENERGY>> The energy sector continues to be a key driver of Alberta’s economy. Investment spending and economic activity in the industry have generated employment growth both in and out of the oil patch, as well as encouraged healthy net migration gains in the province.
In the later portion of 2014, however, global crude oil prices fell by more than 40 per cent, raising concerns of potential fallout for Alberta’s economy. Slower economic growth in countries such as China and the U.S. weakened global oil demand that, when coupled with increased supply from Libya and U.S. shale oil products, contributed to a surplus of oil and placed downward pressure on prices.
The price decline was precipitated by OPEC’s announcement that it would not be cutting production. While some analysts indicated most OPEC members preferred to keep energy prices above current levels, they were also willing to allow prices to fall in order to retain OPEC’s market share in the U.S. by curtailing expansion plans by shale oil producers.
In Alberta, the impact of global crude oil price volatility was somewhat cushioned by both a weak Canadian dollar and a narrower di� erential between industry benchmark West Texas Intermediate (WTI) and Western Canadian Select (WCS). The narrowing was a result of strong heavy oil refi nery demand, pipeline expansions and increased rail-delivered export capacity. This placed Alberta oil producers in a favorable situation prior to price declines.
Moving forward, the fall in prices will encourage some producers to reduce costs and delay expansion plans. While oil production will moderate
as a result, some analysts indicate production will likely remain positive as operating costs remain above current prices.
CALGARY / ALBERTA ECONOMIC FACTORS
20
40
60
80
100
120
140
US $ / BBL
Brent Crude Oil Price WTI Crude Oil Price Western Canadian Select
Source: Alberta Oil Sands BVM, PEMEX, Statistics Canada
Crude Oil Price
Jan‘05
Jan‘06
Jan‘07
Jan‘08
Jan‘09
Jan‘10
Jan‘11
Jan‘12
Jan‘13
Jan‘14
0
Crude Oil Price Spread WTI to WCS
WCS/WTI spread Annual average spread Source:Alberta Oil Sands BVM, PEMEX
US $ / BBL
5
10
15
20
25
30
35
40
45
Jan‘05
Jan‘06
Jan‘07
Jan‘08
Jan‘09
Jan‘10
Jan‘11
Jan‘12
Jan‘13
Jan‘14
CREB® 2015 ECONOMIC OUTLOOK & REGIONAL MARKET FORECAST6

Investment Spending Alberta
40
50
60
70
80
90
100
110
120
Source: Alberta Government, adapted from Statistics Canada Cansim Table 029-005
$ Billions
‘04 ‘05 ‘06 ‘07 ‘08 ‘09 ‘10 ‘11 ‘12 ‘13 ‘14(E)
ENERGY (CONT.)Given the perceived excess world supply, WTI oil prices are expected to average $62 US per barrel in 2015. As world economies improve, demand will increase, helping to reduce excess supply levels by the end of 2015. Some analysts anticipate medium-term prices to average $75 to $80 per barrel.
Energy price volatility and subsequent swings in the economy are common. Despite historic price fl uctuations, Alberta continues to be one of Canada’s most prosperous provinces. Only a prolonged period of lower price levels would impact future investment and, in turn, a� ect job growth and net migration.
Oil’s impact on the housing market over the next two years will depend on the degree of pullback within the energy sector. To compare, energy investment in 2009 slowed substantially after the fi nancial crisis, slower global growth and the U.S. recession. An estimated 16,318 full-time jobs were lost in the Calgary Census Metropolitan Area (CMA) in 2009 and another 4,281 in 2010.
The fi nancial crisis had a signifi cant impact on both housing sales activity and pricing in Calgary. However, the impact following the energy sector pullback was less severe. While sales activity dropped to 10-year lows in 2010 following two consecutive years of jobs losses, listings also fell, which prevented any further price weakening.
The scenario in 2015 is far di� erent. The U.S. economy is far stronger following years of deleveraging, as both consumers
and businesses have been repairing their balance sheets. With consumer spending gaining traction and business investment improving, economic growth is expected to pick up in the U.S. to growth levels not recorded since 2005. That growth, when combined with a depreciating Canadian dollar, should help support the export sector. Furthermore, rising U.S. demand will also help support demand growth for oil.
Nonetheless, Alberta’s energy sector will likely face a challenging year, which will impact the housing market. Lower energy prices will slow the province’s economic growth. Analysts expect a reduction in investment spending, government revenues, corporate profi ts and, ultimately, household income. While forecasts point to some pullback in energy related employment, gains in the services and construction sector are expected to o� set the losses, resulting in
stable employment levels in the Calgary CMA.
Concerns regarding the energy sector, along with slowing migration levels and employment growth, are expected to cause a pullback in housing demand in 2015, but not to the levels seen in 2010. Meanwhile, despite a decline in sales, prices are expected to remain relatively stable as supply levels in the housing market are lower than levels seen during the previous energy sector pullback.
The biggest risk to Alberta’s energy sector over the medium to long term will be market access. The province will need to be able to enter non-traditional markets in order to reduce business risk and support further investment growth. Further delays for pipeline development will ultimately weigh on long-term economic growth, both in the province and the country.
CALGARY / ALBERTA ECONOMIC FACTORS
CREB® 2015 ECONOMIC OUTLOOK & REGIONAL MARKET FORECAST 7
ECONOMIC GROWTH / EMPLOYMENT / WAGES
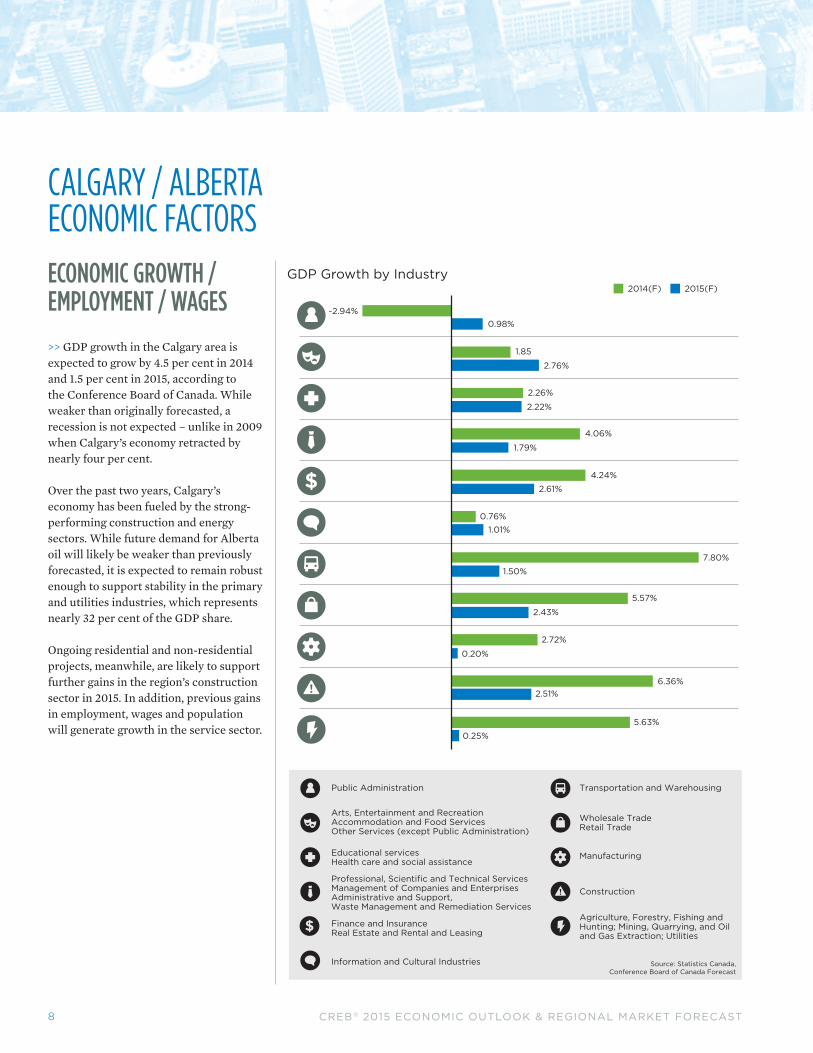
>> GDP growth in the Calgary area is expected to grow by 4.5 per cent in 2014 and 1.5 per cent in 2015, according to the Conference Board of Canada. While weaker than originally forecasted, a recession is not expected – unlike in 2009 when Calgary’s economy retracted by nearly four per cent.
Over the past two years, Calgary’s economy has been fueled by the strong-performing construction and energy sectors. While future demand for Alberta oil will likely be weaker than previously forecasted, it is expected to remain robust enough to support stability in the primary and utilities industries, which represents nearly 32 per cent of the GDP share.
Ongoing residential and non-residential projects, meanwhile, are likely to support further gains in the region’s construction sector in 2015. In addition, previous gains in employment, wages and population will generate growth in the service sector.
CALGARY / ALBERTA ECONOMIC FACTORS
GDP Growth by Industry
Source: Statistics Canada,Conference Board of Canada Forecast
2014(F) 2015(F)
Public Administration
Arts, Entertainment and RecreationAccommodation and Food ServicesOther Services (except Public Administration)
Professional, Scientific and Technical ServicesManagement of Companies and EnterprisesAdministrative and Support,Waste Management and Remediation Services
Finance and InsuranceReal Estate and Rental and Leasing
Information and Cultural Industries
Educational servicesHealth care and social assistance
Transportation and Warehousing
Wholesale TradeRetail Trade
Construction
Agriculture, Forestry, Fishing andHunting; Mining, Quarrying, and Oiland Gas Extraction; Utilities
Manufacturing
-2.94%0.98%
1.85
2.76%
2.26%
2.22%
4.06%
1.79%
4.24%
2.61%
0.76%1.01%
7.80%
1.50%
5.57%
2.43%
2.72%
0.20%
6.36%2.51%
5.63%
0.25%
CREB® 2015 ECONOMIC OUTLOOK & REGIONAL MARKET FORECAST8

2014(F)
Share of Total GDP by Industry
31.65%
8.98%
5.79% 7.88%
4.55% 2.92%
15.23%
9.61% 6.95%
3.78% 2.65%
0%
5%
10%
15%
20%
25%
30%
35%
Source: Statistics Canada, Conference Board of Canada Forecast
ECONOMIC GROWTH / EMPLOYMENT / WAGES (CONT.)
An estimated 21,300 jobs were created in the Calgary CMA in 2014, of which nearly 60 per cent of the positions were full-time. While the pace of full-time job growth has eased since 2012, more than 60,000 positions have been created over the past three years, helping to support housing sector activity.
New and ongoing commercial and residential projects in the Calgary CMA, supported healthy employment gains in the construction and wholesale/retail trade industries in 2014.
Earnings in the province have also been improving, as nearly every industry recorded gains in 2014. Overall wage gains helped o� set rising home prices in 2014, keeping housing in Calgary relatively a� ordable.
CALGARY / ALBERTA ECONOMIC FACTORS
Employment Growth by Industry Annual
8,7303,577
9,402
4,620
-1,319
-1,562
1,474
-1,233-1,854
5,033
3,985536
1,250
1,143
1,645265
-3,9234,323
-1,455-319
-389
-2,496
Source: Statistics Canada, Conference Board of Canada Forecast
2014(F) 2015(F)
CREB® 2015 ECONOMIC OUTLOOK & REGIONAL MARKET FORECAST 9

ECONOMIC GROWTH / EMPLOYMENT / WAGES (CONT.)
Moving into 2015, employment levels are expected to increase by 0.90 per cent. Job losses are expected in the primary and utilities sector, which includes the mining, quarry and oil and gas extraction (highest earnings sector). Meanwhile, the personal and non-commercial services industries are expected to see the largest growths in employment.
Population gains in the Calgary CMA will generate new job opportunities in areas such as accommodation, food services, recreation, education and health services. However, some of these positions represent the lower ranges of the provincial weekly earnings.
Overall, Calgary wages will improve, says the Conference Board of Canada. However, the pace of growth will ease, which, when combined with slower employment growth, will not only dampen housing demand, but also infl uence migration decisions. With less high-paying jobs being created and economic conditions improving in other parts of the country, local companies will have a more diª cult time attracting migrants to the area.
Alberta Average Weekly Earnings by Industry
-5%
0%
5%
10%
15%
20%
25%
$0
$500
$1,000
$1,500
$2,000
$2,500
Ind
ustr
ial a
gg
reg
ate
excl
udin
g u
ncla
ssifi
ed
Go
od
s p
rod
ucin
g in
dus
trie
s
Fo
rest
ry, l
og
gin
g a
nd s
upp
ort
Min
ing
, qua
rryi
ng, a
nd o
il an
d g
as e
xtra
ctio
n
Uti
litie
s
Co
nstr
ucti
on
Man
ufac
turi
ng
Ser
vice
pro
duc
ing
ind
ustr
ies
Tra
de
Tra
nsp
ort
atio
n an
d w
areh
ous
ing
Info
rmat
ion
and
cul
tura
l ind
ustr
ies
Fin
ance
and
insu
ranc
e
Rea
l est
ate
and
ren
tal a
nd le
asin
g
Pro
fess
iona
l, sc
ient
ific
and
tec
hnic
al s
ervi
ces
Man
agem
ent
of
com
pan
ies
and
ent
erp
rise
s
Ad
min
istr
ativ
e an
d s
upp
ort
, was
te m
anag
emen
t
Ed
ucat
iona
l ser
vice
s
Hea
lth
care
and
so
cial
ass
ista
nce
Art
s, e
nter
tain
men
t an
d r
ecre
atio
n
Acc
om
mo
dat
ion
and
fo
od
ser
vice
s
Oth
er s
ervi
ces
(exc
ept
pub
lic a
dm
inis
trat
ion)
Pub
lic a
dm
inis
trat
ion
Oct. 2014
y/y % gain
Source: Statistics Canada, CANSIM table 281-0063, last modified: 2014-12-22
Calgary CMA Employment GrowthY/Y % Change Average Annual Employed
Source: Seasonally adjusted data, Statistics Canada,Conference Board of Canada Forecast
% change (y/y) Total employment
FORECAST
‘03‘02‘01 ‘04 ‘05 ‘06 ‘07 ‘08 ‘09 ‘10 ‘11 ‘12 ‘13 ‘14 ‘15 ‘16
2.97%
3.72%
2.90% 2.75%
0.90%
1.90%
500,000
550,000
600,000
650,000
700,000
750,000
800,000
850,000
900,000
-2%
0%
2%
4%
6%
8%
10%
CALGARY / ALBERTA ECONOMIC FACTORS
CREB® 2015 ECONOMIC OUTLOOK & REGIONAL MARKET FORECAST10

POPULATION GROWTH>> Calgary’s housing market benefi ted from a second consecutive year of record net migration levels in 2013 thanks to strong employment gains and favorable economic conditions in the region relative to other parts of the country. The Calgary CMA’s population grew by 4.36 per cent in 2013, compared with three per cent provincewide, according to the Conference Board of Canada. An estimated 45,000 migrants moved into the Calgary CMA in 2013.
NOTE: Migrants tend to be younger. Compared to the rest of Canada, Alberta has the largest share of working-age population and the lowest share of seniors. In Calgary, 35 per cent of the population is 25 to 44 years old, according to the latest civic census. This age cohort represents a demographic that is most likely in the homebuying phase of their life.
Net migration growth has served as a catalyst to the housing sector – both for new, resale and rental accommodations. Strong net migration resulted in housing demand growth that far exceeded expectations over the past two years.
Calgary migration levels are forecasted to ease over the next several years as weaker economic conditions inside
the province limit opportunities and incentives for people to move here. Overall levels, however, are generally expected to remain above 22,000 in 2014 dropping to just over 15,000 in 2015. While the pullback seems signifi cant following record numbers, migration levels should continue to support housing demand, albeit at lower levels, which are more consistent with long-term averages.
FORECAST
Calgary CMA Net Migration
‘00 ‘01 ‘02 ‘03 ‘04 ‘05 ‘06 ‘07 ‘08 ‘09 ‘10 ‘11 ‘12 ‘13 ‘14 ‘15 ‘165,000
10,000
15,000
20,000
25,000
30,000
35,000
40,000
45,000
50,000
Source: Statistics Canada, Conference Board of Canada adjustment,Conference Board of Canada Forecast
CALGARY / ALBERTA ECONOMIC FACTORS
CREB® 2015 ECONOMIC OUTLOOK & REGIONAL MARKET FORECAST 11

NEW HOME SECTOR>> Calgary CMA housing starts are estimated to increase by 39 per cent to 17,533 units in 2014, relative to the previous year. Over the fi rst 11 months of 2014, single-detached sales increased by 1.3 per cent to 6,067 units. Meanwhile, multi-family starts nearly doubled, reaching 10,224 units. The overall rise in starts increased the amount of product under construction. Yet, two consecutive record years of net migration – combined with positive employment opportunities and low mortgage rates – depleted inventory levels in both the resale and new home sectors.
The new and resale housing markets have a close relationship. During the last economic downturn, housing supply increased, resale market conditions favoured the buyer and starts activity fell. As the economy improved, housing demand rebounded, resale stock was depleted and housing starts activity rose.
FORECAST
Calgary CMA Housing Starts
0
2,000
4,000
6,000
8,000
10,000
12,000
Source: CMHC, Conference Board of Canada Forecast
‘01 ‘02 ‘03 ‘04 ‘05 ‘06 ‘07 ‘08 ‘09 ‘10 ‘11 ‘12 ‘13 ‘14 ‘15
Single-family Multi-family
Calgary CMA Newly Completed and Unoccupied
Source: CMHC
Jan‘05
Jan‘04
Jan‘03
Jan‘02
Jan‘01
Jan‘06
Jan‘07
Jan‘08
Jan‘09
Jan‘10
Jan‘11
Jan‘12
Jan‘13
Jan‘14
Single-family Multi-family
0
200
400
600
800
1,000
1,200
1,400
1,600
1,800
Calgary CMA Under Construction
Source: CMHC
Jan‘05
Jan‘04
Jan‘03
Jan‘02
Jan‘01
Jan‘06
Jan‘07
Jan‘08
Jan‘09
Jan‘10
Jan‘11
Jan‘12
Jan‘13
Jan‘14
Single-family Multi-family
0
2,000
4,000
6,000
8,000
10,000
12,000
14,000
16,000
18,000
CALGARY / ALBERTA ECONOMIC FACTORS
CREB® 2015 ECONOMIC OUTLOOK & REGIONAL MARKET FORECAST12

Calgary CMA Rental Market
0
200
400
600
800
1,000
1,200
1,400
1,600
0%
1%
2%
3%
4%
5%
6%
Vacancy rates, row and apartment 3 units and over - Calgary
Calgary average rent apartment 3 units and over - 2 bedroom Source: CMHC, CMHC Forecast
FORECAST
‘01 ‘02 ‘03 ‘04 ‘05 ‘06 ‘07 ‘08 ‘09 ‘10 ‘11 ‘12 ‘13 ‘14 ‘15 ‘16
NEW HOME SECTOR (CONT.) Heading into 2015, overall new home inventory continues to remain below historical norms – even with an increase in starts activity and product under construction. Within the sector, single-family product under construction remains well below historical norms, while multi-family product is near all-time highs. As most of the product is pre-sold, absorption rates should remain strong. While a pullback in demand could push up inventory levels – particularly in the multi-family market – a large amount of product would need to be unabsorbed to substantially add to the non-existent inventory. That said, a greater-than-expected increase in multi-family inventories would moderate any price appreciation for resale condominium apartments.
Despite some sector risk, overall household formation fi gures indicate there is minimal risk of oversupply. Prior to the economic downturn in 2009, starts activity in the Calgary area were occurring at a rate that exceeded estimates of household formation. When the recession occurred, falling demand, combined with overbuilding, resulted in excess supply in the entire housing market and price corrections. Starts levels slowed to help balance the market.
While construction levels have recently increased, fi gures are more in line with household formations, indicating a di� erent risk profi le today relative to pre-recessionary fi gures. Furthermore, overall starts levels are expected to slow in 2015 due to a pullback in the multi-family sector.
RENTAL MARKET>> Tight rental market conditions supported increased demand for housing in the city in 2014. Lack of rental options, rising rents and low lending rates encouraged both fi rst-time homebuyers and investors to enter the market, notably in the condominium apartment sector. According to Calgary Mortgage Housing Corporation’s (CMHC) October 2014 rental survey, Calgary’s condominium apartment rental sector increased to 52,981 units from the 49,204 recorded in 2013. Meanwhile, the secondary rental
market for condominium apartments recorded just a 1.1 per cent vacancy rate, with monthly rents for a two-bedroom unit increasing to $1,511 from $1,400 in 2014.
Moving forward, increased supply from both purpose-built and the secondary condominium apartment rentals, combined with an expected drop in migration, should help increase vacancy rates, which are still expected to stay below two per cent in 2015.
CALGARY / ALBERTA ECONOMIC FACTORS
CREB® 2015 ECONOMIC OUTLOOK & REGIONAL MARKET FORECAST 13

CALGARY / ALBERTA ECONOMIC FACTORSINTEREST RATES>> With the labour market improving and infl ation expected to reach target levels, the Bank of Canada is expected to begin raising interest rates in the later portion of 2015. While the increases are expected to be gradual and modest, this should place some downward pressure on the relatively strong levels of price growth.
NOTE: WHAT IS A NORMAL INTEREST RATE? The Bank of Canada has set rates well below their estimated neutral level. A neutral or normal level is considered a long-run rate consistent with economic growth that corresponds with full employment and stable infl ation, assuming no shocks to the system. The decision to keep rates lower than the neutral level (or stimulative monetary policy) was intended to encourage consumption. While forecasters are expecting rates to increase over the next fi ve years beginning in 2015, the question is what will the new normal level be? While estimates vary regarding where the long-term neutral level will end up, most analysts anticipate the new levels will remain below the levels recorded prior to the economic downturn in 2009.
ECONOMIC RISK• Alberta’s economy is closely tied to
the energy sector. Further declines in oil prices will push companies to look for cost savings which can include not only a pull back in investment, but job losses. If prices do not show signs of improvement by the end of the year then the impact can be greater than expected.
• Concerns in the energy sector can signifi cantly weaken consumer confi dence which could cause a pull back in spending, trickling into other sectors.
• Much of Canada’s economic growth expectations are based on what happens in the U.S. economy. If economic conditions are stronger than expected, Canada’s export sector will benefi t, boosting the overall economy; if weaker, export growth and business investment will be limited.
• Longer-term risk continues to exist regarding energy market access. Future investment in the energy sector and subsequent growth throughout the province will largely depend on pipeline approvals and Alberta’s ability to access growing emerging markets.
Lending Rates and Price Growth
0%
1%
2%
3%
4%
5%
6%
7%
8%
9%
-20%
-10%
0%
10%
20%
30%
40%
50%
60%
Median price growth City of Calgary Average 5-year lending rate
Source: CREB®,Conference Board of Canada
Jan‘05
Jan‘04
Jan‘03
Jan‘02
Jan‘01
Jan‘00
Jan‘06
Jan‘07
Jan‘08
Jan‘09
Jan‘10
Jan‘11
Jan‘12
Jan‘13
Jan‘14
CREB® 2015 ECONOMIC OUTLOOK & REGIONAL MARKET FORECAST14

Calgary Inventory and Sales to New Listings Ratio
0
0.1
0.2
0.3
0.4
0.5
0.6
0.7
0.8
0.9
1
0
1,000
2,000
3,000
4,000
5,000
6,000
7,000
8,000
9,000
Inventory trend Sales to new listings ratio trend Source: CREB®12 month moving average
Jan‘05
Jan‘04
Jan‘03
Jan‘02
Jan‘01
Jan‘00
Jan‘06
Jan‘07
Jan‘08
Jan‘09
Jan‘10
Jan‘11
Jan‘12
Jan‘13
Jan‘14
Calgary Sales and Listings Growth
-60%
-40%
-20%
0%
20%
40%
60%
80%
New listings growth y/y trend Sales growth y/y trend Source: CREB®
12 month moving average
Jan‘05
Jan‘04
Jan‘03
Jan‘02
Jan‘01
Jan‘06
Jan‘07
Jan‘08
Jan‘09
Jan‘10
Jan‘11
Jan‘12
Jan‘13
Jan‘14
HOUSINGMARKETCITY OF CALGARYTOTAL MARKET
>> Calgary’s resale housing market enjoyed a robust year in 2014. Housing demand growth was fueled by several factors, including employment and net migration growth, low lending rates and tight rental markets. All of these factors cumulated into 9.4 per cent growth in sales activity to 25,545 units relative to the previous year, and nearly 15 per cent above the 10-year average for the city.
While economic fundamentals supported sales growth, the dynamics of the market varied as the year progressed. First-quarter sales growth compared to the same period in 2013 far exceeded the pace of growth in new listings, causing further declines in inventory levels and creating strong market conditions for sellers. This resulted in steep unadjusted price gains that encouraged new listings. However, it was not until end of the second quarter that listings grew at a rate fast enough to result in inventory gains.
CREB® 2015 ECONOMIC OUTLOOK & REGIONAL MARKET FORECAST 15
HOUSINGMARKETCITY OF CALGARYTOTAL MARKET (CONT.)
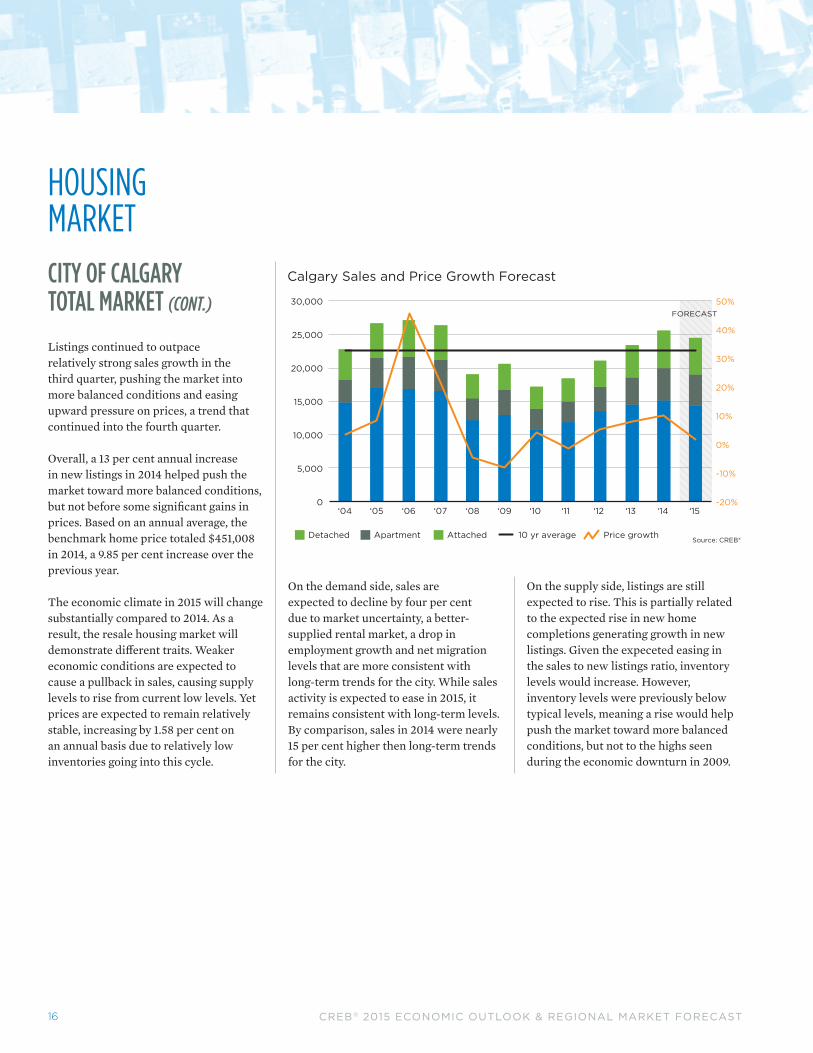
Listings continued to outpace relatively strong sales growth in the third quarter, pushing the market into more balanced conditions and easing upward pressure on prices, a trend that continued into the fourth quarter.
Overall, a 13 per cent annual increase in new listings in 2014 helped push the market toward more balanced conditions, but not before some signifi cant gains in prices. Based on an annual average, the benchmark home price totaled $451,008 in 2014, a 9.85 per cent increase over the previous year.
The economic climate in 2015 will change substantially compared to 2014. As a result, the resale housing market will demonstrate di� erent traits. Weaker economic conditions are expected to cause a pullback in sales, causing supply levels to rise from current low levels. Yet prices are expected to remain relatively stable, increasing by 1.58 per cent on an annual basis due to relatively low inventories going into this cycle.
On the demand side, sales are expected to decline by four per cent due to market uncertainty, a better-supplied rental market, a drop in employment growth and net migration levels that are more consistent with long-term trends for the city. While sales activity is expected to ease in 2015, it remains consistent with long-term levels. By comparison, sales in 2014 were nearly 15 per cent higher then long-term trends for the city.
On the supply side, listings are still expected to rise. This is partially related to the expected rise in new home completions generating growth in new listings. Given the expeceted easing in the sales to new listings ratio, inventory levels would increase. However, inventory levels were previously below typical levels, meaning a rise would help push the market toward more balanced conditions, but not to the highs seen during the economic downturn in 2009.
Calgary Sales and Price Growth Forecast
Source: CREB®
-20%
-10%
0%
10%
20%
30%
40%
50%
0
5,000
10,000
15,000
20,000
25,000
30,000
Detached Price growth10 yr averageApartment Attached
‘04 ‘05 ‘06 ‘07 ‘08 ‘09 ‘10 ‘11 ‘12 ‘13 ‘14 ‘15
FORECAST
CREB® 2015 ECONOMIC OUTLOOK & REGIONAL MARKET FORECAST16

Calgary Annual New Listings Share by Price Range, Detached
Source: CREB®
<$200,000 $200,000– $299,999
$300,000– $399,999
$400,000– $499,999
$500,000– $599,999
$600,000– $699,999
$700,000– $999,999
$1,000,000+
2011 2012 2013 2014
0%
5%
10%
15%
20%
25%
30%
35%
Calgary Share of Sales, Detached
50%
55%
60%
65%
70%
75%
Jan‘05
Jan‘04
Jan‘03
Jan‘02
Jan‘01
Jan‘06
Jan‘07
Jan‘08
Jan‘09
Jan‘10
Jan‘11
Jan‘12
Jan‘13
Jan‘14
Detached TrendSource: CREB®
12 month moving average
HOUSINGMARKETCITY OF CALGARYDETACHED
>> While detached sales represent the majority of resale housing transactions in Calgary at 59 per cent – and have surpassed long-term sales trends – it continues to lose market share to the more a� ordable apartment and attached sectors, which posted record sales levels in 2014.
The detached sector also continues to undergo a notable shift in activity by price range. In 2014, less than 20 per cent of detached new listings were priced below $400,000, compared to 40 per cent in 2011. While infl ationary pressures typically result in the general shift of activity in the price ranges, it is the speed of adjustment that is noteworthy.
Unless market conditions signifi cantly change, or there is a surge of new product available in lower price ranges, Calgary will continue to see less detached product available in the lower price ranges. For buyers, this will limit their options and possibly push them to consider alternative product types and locations.
CREB® 2015 ECONOMIC OUTLOOK & REGIONAL MARKET FORECAST 17

Calgary Annual Sales and Price Growth Forecast, Detached
Source: CREB® Detached Price growth10 yr average
-10%
0%
10%
20%
30%
40%
50%
0
2,000
4,000
6,000
8,000
10,000
12,000
14,000
16,000
18,000
‘04 ‘05 ‘06 ‘07 ‘08 ‘09 ‘10 ‘11 ‘12 ‘13 ‘14 ‘15
FORECAST
Calgary Months of Supply and Price Changes, Detached
0.00
1.00
2.00
3.00
4.00
5.00
6.00
-20%
-10%
0%
10%
20%
30%
40%
50%
60%
70%
Jan‘05
Jan‘04
Jan‘03
Jan‘02
Jan‘01
Jan‘00
Jan‘06
Jan‘07
Jan‘08
Jan‘09
Jan‘10
Jan‘11
Jan‘12
Jan‘13
Jan‘14
Benchmark y/y price change Months of supply trendSource: CREB®
12 month moving average
HOUSINGMARKETCITY OF CALGARYDETACHED (CONT.)
Meanwhile, unadjusted average annual benchmark prices in Calgary’s detached sector, which had previously recorded three consecutive years of strong gains, increased by 10 per cent to $508,233 in 2014. Strong price gains subsequently encouraged a 5.9 per cent increase in listings, which outpaced sales growth (4.6 per cent) for the fi rst time in four years.
As economic conditions weaken and uncertainty can cause consumers to delay plans to move up, demand for detached products will decline at a greater rate than the attached and apartment sectors and inventories will increase. Yet, given relatively tight inventory levels heading into 2015, this will help move the sector toward more balanced conditions and still support price stability.
CREB® 2015 ECONOMIC OUTLOOK & REGIONAL MARKET FORECAST18

HOUSINGMARKETCITY OF CALGARYAPARTMENT
>> Calgary’s resale apartment sector is coming o� a record year, with sales increasing by 18.4 per cent to 4,801 units.
This product, which represents nearly 19 per cent of all citywide sales, is often a more a� ordable choice for potential homeowners looking to stay within the city limits. Of the 7,387 new listings available in this sector in 2014, more than 3,875 (52 per cent) were priced below $300,000.
While low mortgage rates and overall a� ordability supported demand for apartments, it was also Calgary’s tight rental market supported ownership growth. Limited vacancies and high rents prompted many fi rst-time buyers and investors to enter the apartment sector.
Calgary Sales Forecast, Apartment
Apartment 10 yr averageSource: CREB®
FORECAST
‘04 ‘05 ‘06 ‘07 ‘08 ‘09 ‘10 ‘11 ‘12 ‘13 ‘14 ‘150
1,000
2,000
3,000
4,000
5,000
6,000
Calgary Quarterly Share of New Listings by Price, Apartment
Source: CREB®
<$200,000 $200,000– $299,999
$300,000– $399,999
$400,000– $499,999
$500,000– $599,999
$600,000– $699,999
$700,000– $999,999
$1,000,000+
2011 2012 2013 2014
0%
5%
10%
15%
20%
25%
30%
35%
40%
45%
50%
CREB® 2015 ECONOMIC OUTLOOK & REGIONAL MARKET FORECAST 19

HOUSINGMARKETCITY OF CALGARYAPARTMENT (CONT.)
Like other segments within Calgary, the apartment sector went from a sellers’ market early in the year to a more balanced one by the end. Apartments were the fi rst to move into more balanced conditions, due to a signifi cant increase in new listings. While price increases levelled o� , the unadjusted benchmark price had already matched the previous monthly record high from August 2007 by June 2014.
In 2015, price gains are expected to slow to one per cent due to increased competition from the new home sector, and as demand tapers slightly due to expected gains in lending rates and economic concerns. In addition, the sector will be challenged by an increasingly accessible rental market.
Calgary Price Forecast, Apartment
0
50,000
100,000
150,000
200,000
250,000
300,000
350,000
-20%
-10%
0%
10%
20%
30%
40%
50%
60%
Source: CREB®
‘04 ‘05 ‘06 ‘07 ‘08 ‘09 ‘10 ‘11 ‘12 ‘13 ‘14 ‘15
Price growth Benchmark price
FORECAST
CREB® 2015 ECONOMIC OUTLOOK & REGIONAL MARKET FORECAST20

HOUSINGMARKETCITY OF CALGARYATTACHED
>> Attached sales increased by 16 per cent to 5,647 units in 2014 relative to 4,869 units the year prior. The attached sector represents 22 per cent of all the sales within the city. While sales growth has surpassed listings growth for most of the past three years, the spread narrowed in 2014, causing some improvements in supply.
The distribution of attached product varied across price ranges. While the amount of sales occurring under $300,000 was less than the apartment sector, it still represented nearly 25 per cent of all attached listings in 2014. Meanwhile, 38 per cent of sales occurred in the $300,000-to-$400,000 range, while more than 11 per cent were priced above $700,000. What this says is that while demand was high for a� ordable attached product, consumers were also willing to purchase higher-priced product – likely due to location given more than 85 per cent of the those $700,000-plus sales occurred in the city centre.
Attached benchmark prices increased by 9.6 per cent to $348,483 in 2014. Price gains in the sector followed a similar trend to that in the detached sector, with stronger gains throughout the second quarter and a leveling o� by the end of 2014.
Moving forward, sales activity in the attached sector will likely mimic apartments, with demand moderating slightly due to expected gains in lending rates and short-term economic
concerns, as well as a more accessible rental pool. However, price growth is expected to be slightly higher than anticipated due to the changing composition of attached product.
Attached Sales Share by Price Range
Source: CREB®
0%
5%
10%
15%
20%
25%
30%
35%
40%
45%
<$200,000 $200,000– $299,999
$300,000– $399,999
$400,000– $499,999
$500,000– $599,999
$600,000– $699,999
$700,000– $999,999
$1,000,000+
2011 2012 2013 2014
Calgary Prices, Attached
Source: CREB®
Jan‘05
Jan‘04
Jan‘06
Jan‘07
Jan‘08
Jan‘09
Jan‘10
Jan‘11
Jan‘12
Jan‘13
Jan‘14
Average price Benchmark priceMedian price
200,000
150,000
100,000
50,000
0
250,000
300,000
350,000
400,000
450,000
CREB® 2015 ECONOMIC OUTLOOK & REGIONAL MARKET FORECAST 21

CITY OF CALGARY DISTRICT STATS>> Prices and market activity vary signifi cantly depending on a property’s location. The City of Calgary planning division has mapped out various areas of the city, representing eight di� erent districts. The central and west areas of the city are the highest-priced districts across all product types. The most a� ordable are the east and northeast.
Overall sales improved in all areas, with strongest growth in the northeast and southeast due to strong new listings growth – the two areas accounted for nearly 25 per cent of citywide sales activity. The central area remained the largest district in terms of sales activity due to robust attached and detached activity near downtown.
NOTE: District sales represent approximately 99.5 per cent of citywide sales. Citywide sales data also includes activity in areas that are often not categorized into a specifi c community.
NNE
E
SES
CW
NW
CREB® 2015 ECONOMIC OUTLOOK & REGIONAL MARKET FORECAST22

CITY OF CALGARY DISTRICT STATS
2014 C NE N NW W S SE E Total City
Detached
Median Price 679,750 371,550 460,000 540,000 682,250 475,725 460,000 335,000 487,500Y/Y % Change 12.36% 10.91% 9.52% 10.09% 10.13% 8.12% 8.24% 13.56% 7.85%Sales 1,638 2,022 2,116 2,158 1,432 2,923 2,341 461 15,097 Sales growth -5.92% 16.95% 3.88% 1.17% -10.16% 2.06% 22.37% 9.76% 4.60%New Listings 2,727 2,872 2,755 2,915 2,227 3,872 3,055 620 21,068 New listings growth -2.47% 20.72% 4.71% 0.69% -6.82% 4.00% 19.52% 23.02% 5.93%Sales to new listings ratio 60.07% 70.40% 76.81% 74.03% 64.30% 75.49% 76.63% 74.35% 71.66%Share of district sales 31.62% 71.30% 70.07% 65.63% 53.73% 64.74% 71.85% 59.41% 59.10%Share of city wide sales 10.85% 13.39% 14.02% 14.29% 9.49% 19.36% 15.51% 3.05%
Attached
Median Price 678,250 265,000 330,000 357,500 418,000 320,000 340,000 245,000 349,900Y/Y % Change 10.61% 11.46% 8.46% 8.91% 12.06% 10.34% 9.15% 20.99% 7.66%Sales 1,198 660 633 668 705 928 675 180 5,647 Sales growth 5.46% 39.24% 16.36% 16.17% 16.53% 9.82% 30.56% 4.65% 15.98%New Listings 2,101 911 804 847 911 1,103 792 248 7,717 New listings growth 10.87% 46.46% 29.26% 22.22% 20.34% 9.97% 33.56% 0.81% 19.98%Sales to new listings ratio 57.02% 72.45% 78.73% 78.87% 77.39% 84.13% 85.23% 72.58% 73.18%Share of district sales 23.13% 23.27% 20.96% 20.32% 26.45% 20.55% 20.72% 23.20% 22.11%Share of city wide sales 21.21% 11.69% 11.21% 11.83% 12.48% 16.43% 11.95% 3.19%
Apartment
Median Price 343,000 225,000 262,000 272,250 305,400 245,000 265,000 204,000 285,000Y/Y % Change 9.76% 12.92% 9.17% 12.97% 9.07% 7.69% 12.05% 16.64% 9.20%Sales 2,344 154 271 462 528 664 242 135 4,801 Sales growth 18.38% 31.62% 19.91% 23.86% 14.29% 12.54% 30.81% 9.76% 18.37%New Listings 3,837 282 399 638 769 940 338 183 7,387 New listings growth 29.76% 49.21% 36.18% 31.01% 19.22% 31.84% 57.21% 6.40% 30.26%Sales to new listings ratio 61.09% 54.61% 67.92% 72.41% 68.66% 70.64% 71.60% 73.77% 64.99%Share of district sales 45.25% 5.43% 8.97% 14.05% 19.81% 14.71% 7.43% 17.40% 18.79%Share of city wide sales 48.82% 3.21% 5.64% 9.62% 11.00% 13.83% 5.04% 2.81%
Total
Median Price 498,000 347,000 425,000 484,900 552,500 425,000 425,000 303,050 425,600Y/Y % Change 4.84% 10.16% 8.97% 8.24% 5.44% 7.19% 8.97% 13.93% 6.40%Sales 5,180 2,836 3,020 3,288 2,665 4,515 3,258 776 25,545 Sales growth 6.65% 22.24% 7.59% 6.72% 0.15% 5.02% 24.59% 8.53% 9.36%New Listings 8,665 4,065 3,958 4,400 3,907 5,915 4,185 1,051 36,172 New listings growth 13.30% 27.43% 11.62% 7.98% 3.03% 8.75% 24.41% 13.99% 13.07%Sales to new listings ratio 59.78% 69.77% 76.30% 74.73% 68.21% 76.33% 77.85% 73.83% 70.62%Share of city wide sales 20.28% 11.10% 11.82% 12.87% 10.43% 17.67% 12.75% 3.04%
CREB® 2015 ECONOMIC OUTLOOK & REGIONAL MARKET FORECAST 23

REGIONALACTIVITYCITY OF AIRDRIE>> Airdrie posted record sales activity in 2014, increasing annually by nearly 28 per cent to 1,695 units. While new listings grew by 32 per cent during the same period, overall market conditions were tighter in Airdrie than in Calgary. By year end, rising supply helped ease some market tension, yet conditions continued to favour sellers.
When considering all product types, benchmark prices rose at an average annual rate of nearly 10 per cent in 2014. While tight market conditions may translate into further gains in 2015, an increase in listings in both Calgary and Airdrie should help ease some of the price pressure.
In addition to lifestyle choices, consumer demand for detached homes in Airdrie will continue to be fueled by the sector’s relative a� ordability and selection – particularly in lower price ranges. Relative to its total market size, Airdrie had a larger share of detached properties in residential resale housing market last year than Calgary, representing 67 per cent of new listings.
In addition, the aggregate annual average benchmark price of a detached home in Airdrie was 19 per cent lower than in Calgary.
Airdrie Annual Sales
Source: CREB® Detached Apartment Attached
0
200
400
600
800
1,000
1,200
1,400
1,600
1,800
‘00 ‘01 ‘02 ‘03 ‘04 ‘05 ‘06 ‘07 ‘08 ‘09 ‘10 ‘11 ‘12 ‘13 ‘14
REGION OF FOOTHILLS
>> The Foothills Region is comprised of a wide range of towns and rural areas. Okotoks accounted for 52 per cent of the total sales in the district in 2014, followed by High River and other rural areas at 16 per cent each.
Sales activity in the Foothills Region increased annually by 10.3 per cent in 2014 to 1,468 units, reaching new record levels. The district benefi ted from its close proximity to Calgary and
the diversity in product available to consumers in all price ranges.
The aggregate benchmark price for all residential properties in the region increased by 8.66 per cent in 2014, a faster pace than the previous year due to tighter market conditions in Okotoks. The average annual benchmark price for all residential properties in Okotoks increased annually by 10 per cent.
CREB® 2015 ECONOMIC OUTLOOK & REGIONAL MARKET FORECAST24

REGIONALACTIVITY
ROCKYVIEW REGIONNOTE: Due to the diverse nature of
the properties within Rocky View Country, trends in the residential resale housing market can signifi cantly vary from the regional context. The region borders Calgary on the west, north and east, and includes municipalities such as Cochrane, Chestermere, Irricana and Crossfi eld, as well as rural properties in undefi ned areas such as Springbank and Bearspaw.
>> Sales activity in the Rockyview Region reached record levels in 2014, increasing by 28 per cent to 1,951 units. New listings growth just kept pace with sales during the year, however, throughout most of the year sales outpaced new listings causing inventory to decline and market conditions to tighten.
Cochrane’s residential resale housing market accounted for the largest share of sales activity in the Rockyview Region in 2014, representing 39 per cent share of total sales, followed by the rural area and Chestermere.
On aggregate, tight market conditions supported further pricing gains. Yet, due to the municipal district’s geographic diversity, those gains and prices varied throughout the region. Cochrane and Chestermere recorded respective total residential benchmark price gains of 9.5 and 10.8 per cent in 2014 over the previous year, compared with 8.5 per cent in the rural portion of the region.
Aggregate prices in both Cochrane and Chestermere continued to be higher than other surrounding areas, such as Airdrie, as well as certain communities within Calgary. However, on aggregate, detached homes in these two centres tended to feature more square footage, larger lot sizes and were newer than properties within Calgary.
Overall, the Rockyview area benefi ts from its close proximity to Calgary. In addition to lifestyle preferences, many of the surrounding towns within the district continue to o� er relatively more a� ordable options when compared with the City of Calgary.
Rockyview Inventory and Sales to New Listings Ratio
0
0.1
0.2
0.3
0.4
0.5
0.6
0.7
0.8
0.9
1
0
100
200
300
400
500
600
700
800
900
1000
Jan‘05
Jan‘04
Jan‘03
Jan‘02
Jan‘01
Jan‘00
Jan‘06
Jan‘07
Jan‘08
Jan‘09
Jan‘10
Jan‘11
Jan‘12
Jan‘13
Jan‘14
Inventory trend Sales to new listings ratio Source: CREB®12 month moving average
Share of 2014 Sales
Cochrane39%
23%Chestermere
Other15%
RuralRockyview
23%
CREB® 2015 ECONOMIC OUTLOOK & REGIONAL MARKET FORECAST 25

FORECASTTABLE
Economic Indicators 2012 2013 2014 (F)
2015 (F) Forecaster
Calgary CMA GDP Growth 3.79% 3.74% 4.47% 1.46% Conference Board of Canada
Calgary CMA Net Migration 31,996 45,168 22,945 15,280 City of Calgary
Calgary CMA Employment Growth 3.72% 2.90% 2.75% 0.90% Conference Board
of Canada
Average Aptidential Mortgage Lending Rate 5 year 4.24% 4.17% 4.08% 4.43% Conference Board
of Canada
Housing Starts: Single Family CMA 5,961 6,402 6,642 6,489 Conference Board
of Canada
Housing Starts: Multiple Family CMA 6,880 6,182 10,892 7,396 Conference Board
of Canada
Apartment Rental Rates**, Calgary CMA 1,150 1,224 1,322 1,330 CMHC
Apartment Vacancy Rates**, Calgary CMA 1.30% 1.00% 1.40% 1.60% CMHC
WTI Price 94.12 97.91 93.82 62.75 U.S. Energy Information Administration
Henry Hub Price 2.75 3.73 4.44 3.83 U.S. Energy Information Administration
MLS® Resale Market 2012 2013 2014 (F)
2015 (F) Forecaster
City of Calgary
Sales 21,099 23,358 25,545 24,503 CREB®
Price Growth 5.13% 7.95% 9.85% 1.58% CREB®
New Listings 31,656 31,992 36,172 37,370 CREB®
City of Calgary Detached
Sales 13,523 14,433 15,097 14,372 CREB®
Price Growth 5.17% 7.53% 10.07% 1.80% CREB®
City of Calgary Attached
Sales 4,025 4,869 5,647 5,435 CREB®
Price Growth 1.08% 6.68% 9.61% 1.50% CREB®
City of Calgary Apartment
Sales 3,551 4,056 4,801 4,695 CREB®
Price Growth 2.16% 8.72% 10.57% 1.00% CREB®
• The risk lies with employment levels. If overall employment falls and job prospects worsen, this can result in higher-than-expected gains in inventories relative to sales. In this scenario, inventories would rise, amid weaker demand, placing downward pressure on prices.
• Concerns over the energy sector could impact consumer confi dence in the market. If energy prices stay low throughout the year, this can further dampen confi dence and cause consumers to delay any unnecessary changes regarding housing. However, if energy prices improve sooner than expected, this could change the outlook in terms of employment, migration, and ultimately housing.
• A greater than expected increase in new multi-family inventory could result in increased supply in the resale market, placing downward pressure on apartment and attached prices.
HOUSINGRISK
CREB® 2015 ECONOMIC OUTLOOK & REGIONAL MARKET FORECAST26

NOTE: DATA CHANGES
CREB® continues to strive to improve data integrity. As a result, the organization has decided to alter reporting categories, in addition to making further improvements to sales and listings inclusions in its data.
The key di� erence is with regard to property types. In the past, CREB® has reported on single-family, condominium apartment and condominium townhouse properties. Single-family product included all properties that were freehold titled, as well as both attached and detached product. Detached product accounted for 88 per cent of the single-family activity. Meanwhile, condominium townhouses included properties that were condominium titled, excluding apartment high-rise or low-rise product. This categorization of the data, however,
did not necessarily represent the most homogeneous property type.
Current categories have been revised to refl ect detached, attached and apartment-style product. A detached home will be as it states any property that is not attached to any other property. An attached property, meanwhile, will consist of any property type that is attached to another in any form without internal hallways. Apartment product will be classifi ed as those that are attached to another property via internal hallways.
In addition to category changes, CREB® will be making changes to the regions it reports on. CREB® will continue to cover Calgary, but will also include fi gures for Calgary CMA, Airdrie, Rocky View County and the M.D. of Foothills.
CREB® has also identifi ed various areas
outside of these boundaries that are active areas within the region. Previously, “CREB® Total” included all data from the membership regardless of location. Yet, this failed to take into account transactions that either occurred outside of the region, or in communities where CREB® members do not represent the majority of the market transactions. The new CREB® Economic Region will consist of all member transactions in Calgary, Airdrie, Rocky View County (includes all rural, town, hamlet, village activity), M.D. of Foothills and other active areas. (The active areas include Strathmore, Vulcan, Carstairs, Didsbury, Cremona). CREB® will also include a measure for Calgary CMA, which will enable a comparison to data from Statistics Canada. The Calgary CMA includes Calgary, Rocky View Country and Airdrie.
All data has been revised historically.
CREB® 2015 ECONOMIC OUTLOOK & REGIONAL MARKET FORECAST 27

CREB® is a professional body of more than 5,000 licensed brokers and registered associates, representing 290 member offices. CREB® is dedicated to enhancing the value, integrity and expertise of its REALTOR® members.
We are committed to equipping our members with the right tools, services and education to achieve professional excellence — and, in turn, enabling REALTORS® to offer the best possible service to their clients.
Our REALTORS® are committed to a high standard of professional conduct, ongoing education, and a strict Code of Ethics and standards of business practice. Using the services of a professional REALTOR® can help consumers take full advantage of real estate opportunities, while reducing their risks when buying or selling real estate.
CREB® operates and maintains the Multiple Listing Service (MLS®) System for Calgary and the surrounding area. Through the MLS® System, members and, in turn, their clients have immediate access to the latest information on properties listed for sale. Through the MLS® System, REALTORS® can provide the buying and selling public with the broadest possible market exposure and the most complete and up-to-date market information.
Copyright ©2015 CREB®. All rights reserved. CREB® grants reasonable rights of use of this publication’s content solely for personal, corporate or public policy research, and educational purposes. This permission consists of the right to use the content for general reference purposes in written analyses and in the reporting of results, conclusions and forecasts, including the citation of limited amounts of supporting data extracted from this publication. Reasonable and limited rights of use are also permitted in commercial publications subject to the above criteria, and CREB®’s right to request that such use be discontinued for any reason.
Any use of the publication’s content must include the source of the information, including statistical data, acknowledged as follows: CREB® 2015 Economic Outlook and Calgary Regional Housing Market Forecast.
300 Manning Road NECalgary, AlbertaT2E 8K4, Canada
Phone: 403-263-0530Fax: 403-218-3688Email: [email protected]
creb.comcrebforecast.comcrebnow.com