
2015 Annual Report - Boyd Group
90
BOYD GROUP INCOME FUND 2015 Annual Report
Transcript of 2015 Annual Report - Boyd Group

BOYD GROUP INCOME FUND
2015 Annual Report

BOYD GROUP INCOME FUND
2015 Annual Report
Table of Contents Report to Unitholders……..…………………………………………….……..…. 3
Chairman’s Message………………..………………………………….……..…. 5
Management’s Discussion and Analysis……………………………..………… 6-41
Certification of Annual Filings …………..……………………………..………… 42-45
Consolidated Financial Statements
Management’s Responsibility for Financial Reporting………………… 47
Independent Auditor’s Report……………………………………………. 48
Consolidated Statements of Financial Position…………………………. 49
Consolidated Statements of Changes in Equity…………...…………… 50
Consolidated Statements of Loss..…………………………………..…… 51
Consolidated Statements of Comprehensive Earnings………....……… 51
Consolidated Statements of Cash Flows……………………………….. 52
Notes to the Consolidated Financial Statements………………………. 53-87
Board of Trustees…………………………………………………………………. 88
Corporate Directory……………………………………………………….………. 89
Unitholder Information……………………………………………………………. 90
2

BOYD GROUP INCOME FUND
2015 REPORT TO UNITHOLDERS
To Our Unitholders,
In 2015, Boyd Group Income Fund was able to achieve a number of significant milestones, including exceeding $1 billion in revenues, surpassing $1 billion in market capitalization, being added to the TSX Composite Index, increasing our location count in the United States to over 300 and expanding our U.S. footprint to cover 19 states. Achievement of these milestones is a testament to our unwavering focus on disciplined growth, prudent financial management and operational excellence.
We reached our 300th U.S. location in October with the acquisition of a repair center in Gresham, Oregon, our first in the state. Earlier, in July, we established a foothold in Utah with the purchase of four locations. At December 31, 2015, Boyd had grown to 304 centers in 19 U.S. states and 38 in five Canadian provinces for a total of 342 locations. We continue to be positioned as one of the largest non-franchised operators of collision repair centers in North America in a consolidating industry.
Our active pursuit of accretive growth is aided by our strong financial position. During 2015, this was further improved by expanding our credit facility from US$100 million to US$150 million with enhanced terms and pricing. This facility also has an accordion feature which can expand the facility to US$250 million. At year-end Boyd had more than $400 million in cash and available credit, which we can deploy to achieve continued growth.
During 2015, we also announced the early redemption and conversion of our Convertible Unsecured Subordinated Debentures due December 31, 2017. We announced the redemption plan in November and, by this past January, we had converted and redeemed $24 million principal amount of debentures into 1,029,152 units of the Fund.
As noted above, we crossed $1 billion in annual sales, recording total sales of $1.2 billion in 2015, a 39.1 percent increase over $844 million in 2014. Acquisitions and new location growth, as well as a stronger U.S. dollar, contributed significantly to this sales growth while same-store sales increases, up 5.6 percent over 2014, were also an important factor. It is noteworthy that this 5.6 percent same-store sales growth was achieved against a very tough comparable in 2014, when same-store sales grew by 7.2 percent.
Adjusted EBITDA1 was also strong and increased by 47.4 percent over 2014 to $101.7 million or 8.7 percent of sales from $69.0 million, or 8.2 percent of sales. This was primarily due to contributions from new locations, same-store sales increases and foreign exchange rate increases.
Adjusted net earnings1 increased 35.0 percent to $40.5 million in 2015 from $30.0 million the year before. This translates into adjusted net earnings of $2.46 per unit, compared to $1.96 in 2014. Fair value adjustments related to financial instruments again had a significant impact on net earnings. These adjustments, which are non-cash expenses that relate primarily to the increase in the Fund’s unit price during the year, totalled $59.0 million in 2015, resulting in a reported net loss for 2015 of $22.0 million, compared to $15.3 million in 2014.
Our cash flow for the year was very strong. The Fund generated adjusted distributable cash1 of $69.7 million in 2015 and declared distributions and dividends of $8.2 million, resulting in a payout ratio based on adjusted distributable cash of 11.8 percent. This compares with adjusted distributable cash of $46.4 million and a payout ratio of 16.2 percent a year ago. Maintaining a conservative payout ratio provides us with the needed financial flexibility to execute on our growth strategy and thereby supports our long-term success. We have, however, consistently increased distributions to unitholders, including in November 2015 when we increased distributions by 2.4 percent to $0.504 annualized.
1 EBITDA, Adjusted EBITDA, distributable cash, adjusted distributable cash and adjusted net earnings are not recognized measures under InternationalFinancial Reporting Standards (“IFRS”). Management believes that in addition to sales, net earnings and cash flows, the supplemental measures of distributable cash, adjusted distributable cash, adjusted net earnings, EBITDA and Adjusted EBITDA are useful as they provide investors with an indication of earnings from operations and cash available for distribution, both before and after debt management, productive capacity maintenance and non-recurring and other adjustments. Investors should be cautioned, however, that EBITDA, Adjusted EBITDA, distributable cash, adjusted distributable cash and adjusted net earnings should not be construed as an alternative to net earnings determined in accordance with IFRS as an indicator of the Fund's performance. Boyd's method of calculating these measures may differ from other public issuers and, accordingly, may not be comparable to similar measures used by other issuers. For a detailed explanation of how the Fund’s non-GAAP measures are calculated, please refer to the Fund’s MD&A filing for the period ended December 31, 2015, which can be accessed via the SEDAR Web site (www.sedar.com).
3

We remain very conservatively leveraged with a strong balance sheet and lots of “dry powder” for growth. At December 31, 2015, the Fund had total debt, net of cash, of $81.8 million compared to $89.6 million at September 30, 2015 and $89.5 million at December 31, 2014. Debt, net of cash decreased as a result of conversions of convertible debentures to units during the year. Adjusting for the convertible debentures that were converted and redeemed through issuance of units in January 2016, net debt reduced from $81.8 million to $57.6 million. Excluding all convertible debentures, which the Fund can redeem in units, net debt reduced from $81.8 million to $6.6 million as at December 31, 2015. Our financial strength is complemented by our programs to establish and drive operational excellence. In 2015, we transitioned from using external consultants engaged to enhance processes and operational performance to an internal team with the responsibility for supporting the rollout, initial certification and sustainability of our operating process improvement initiative, called the Wow Operating Way. To date, over 75 percent of our network has been trained and certified in the program. We are pleased with our progress to date in implementing certification. We continue to work to certify further locations, while at the same time, continuing to work with certified locations to ensure operating improvements are locked in. Looking forward to 2016 and beyond, we will continue to pursue accretive growth. We intend to double the size of our business over the next five years, implying an average annual growth rate of 15 percent. The achievement of this growth will include same-store sales growth, acquisition of both single stores and multi location acquisitions, and new store development. On behalf of all Boyd Group employees, I would like to thank you for your support. Sincerely, (signed) Brock Bulbuck President & Chief Executive Officer
4

BOYD GROUP INCOME FUND
2015 CHAIRMAN’S MESSAGE To Our Unitholders, Boyd Group Income Fund once again delivered impressive results in 2015. Notably, revenues surpassed the $1 billion level and the unit price increased 38.9%, which drove market capitalization in excess of $1 billion. These accomplishments were the result of the dedication of our management team and their disciplined approach to growth, financial management and operational excellence. During 2015, the Fund’s unit price increase continued the upward trend established over the past five years. During this five-year period, the Boyd Group Income Fund has delivered total shareholder return, defined as unit price increase along with reinvestment of distributions, of 906 percent, with the unit price increasing from $7.37 to $66.10, or 888 percent. In fact, over the past decade BYD.UN has been the best performing stock on the Toronto Stock Exchange, delivering a total return of 4,655 percent. In September, the Fund was added to the S&P/TSX Composite Index. This has increased the visibility of the units on the Toronto Stock Exchange and further diversified the unitholder base. Management has maintained a disciplined approach to profitable growth for the past five years. The Board regularly meets with management to assess the progress of the growth strategy and has worked with them to adjust and evolve it to address changes in the market. We recorded $1.2 billion in revenues for 2015, reflecting a 31.8 percent compound annual growth rate over the past five years. On behalf of the Board I would like to thank the Boyd Group management for their achievements during 2015. In particular, I would like to acknowledge Dan Dott, who retired at the end of 2015. Dan was Boyd’s Chief Financial Officer from 2004 to 2014, after joining the management team in 1999. He was a valuable team member who played an integral part as operations grew and expanded into the United States. After announcing his retirement, Mr. Dott stayed with Boyd during 2015 to assist in the transition to his successor, Mr. Pat Pathipati, who was appointed Chief Financial Officer in January 2015. Pat brings over 30 years’ experience in finance, strategy, corporate development and operations and we look forward to his participation in driving Boyd’s continued success. To fulfill its role of providing guidance and strategic support to management, the Board strives to ensure that its strengths are aligned with the needs of the Fund. Largely this is achieved through the composition of the Board. Last year we welcomed Sally Savoia to the Board. Ms. Savoia brings 32 years’ of experience with a large multinational organization and is able to provide additional skilled counsel to help guide the Fund as it continues to grow in both Canada and the United States. On behalf of the Trustees of the Boyd Group Income Fund, I would like to congratulate the management team and all employees for a record year and thank them for their continued commitment and hard work. The Board looks forward to continuing to work with management to help maintain the Fund’s growth trajectory and to continue to deliver value for unitholders. In closing, I want to thank our unitholders for their continued support in 2015. We look forward to another successful year in 2016. Sincerely, (signed) Allan Davis Independent Chair
5

Management’s Discussion & Analysis OVERVIEW Boyd Group Income Fund (the “Fund”), through its operating company, The Boyd Group Inc. and its subsidiaries (“Boyd” or the “Company”), is one of the largest operators of non-franchised collision repair centers in North America in terms of number of locations and sales. The Company currently operates locations in five Canadian provinces under the trade name Boyd Autobody & Glass, as well as in 19 U.S. states under the trade name Gerber Collision & Glass. The Company is also a major retail auto glass operator in the U.S. with locations across 31 U.S. states under the trade names Gerber Collision & Glass, Glass America, Auto Glass Service, Auto Glass Authority and Autoglassonly.com. The Company also operates a third party administrator Gerber National Claims Services (“GNCS”) that offers first notice of loss, glass and related services. GNCS has approximately 5,500 affiliated glass provider locations and 4,600 affiliated emergency roadside services providers throughout the U.S. The following is a geographic breakdown of the collision repair locations and trade names.
40 311centers centers
Manitoba 14 Illinois 54 Ohio 12
Alberta 12 Florida 52 Maryland 10
British Columbia 11 Michigan 40 Louisiana 7
Saskatchewan 2 North Carolina 26 Oregon 6
Ontario 1 Washington 19 Pennsylvania 5
Georgia 19 Nevada 4
Arizona 17 Utah 4
Colorado 16 Oklahoma 3
Indiana 15 Kansas 1
Idaho 1
Boyd provides collision repair services to insurance companies, individual vehicle owners, as well as fleet and lease customers, with a high percentage of the Company’s revenue being derived from insurance-paid collision repair services. In Canada, government-owned insurers operating in Manitoba, Saskatchewan and British Columbia, dominate the insurance-paid collision repair markets in which they operate. In the U.S. and Canadian markets other than Manitoba and Saskatchewan, private insurance carriers compete for consumer policyholders, and in many cases significantly influence the choice of collision repairer through Direct Repair Programs (“DRP’s”). The Fund’s units and convertible debentures trade on the Toronto Stock Exchange under the symbol TSX: BYD.UN and TSX: BYD.DB.A. The Fund’s consolidated financial statements as well as Annual Information Form have been filed on SEDAR at www.sedar.com. The following review of the Fund’s operating and financial results for the year ended December 31, 2015, including material transactions and events up to and including March 22, 2016, as well as management’s expectations for the year ahead should be read in conjunction with the annual audited consolidated financial statements of Boyd Group Income Fund for the year ended December 31, 2015 included on pages 46 to 87 of this report.
6

SIGNIFICANT EVENTS On January 2, 2015, the Company acquired the assets of Craftmaster Auto Body ("Craftmaster"), a multi-location collision repair company operating six locations in the Florida market. Craftmaster was established in 1981 and generated sales of approximately $13.6 million U.S for the trailing twelve months ended August 2014. On January 5, 2015, the Company announced the appointment of Narendra "Pat" Pathipati as Executive Vice President and Chief Financial Officer. Mr. Pathipati succeeded Dan Dott, who remained with Boyd as Senior Vice President Finance for a one year transition period. Following this transition period Mr. Dott retired on December 31, 2015. On April 6, 2015, the Company commenced operations in a new collision repair facility in Jacksonville, Florida using assets it had acquired from San Jose Ventures, LLC in 2014. On April 10, 2015, the Company acquired the collision repair assets of Liotus Collision Center, Inc., in Pittsburgh, Pennsylvania. On May 1, 2015, the Company acquired the collision repair assets of Fitz Auto Body, in Spokane, Washington. On June 12, 2015, the Company acquired the collision repair assets of Smead Auto Body, in Battle Creek, Michigan. On July 13, 2015, the Company acquired the collision repair assets of McDonald’s Auto Body, in Plainwell, Michigan. On July 17, 2015, the Company acquired the collision repair assets of Shine Auto Body, operating four locations in Utah. On July 23, 2015, the Company increased its revolving credit facility to US$150 million, with an accordion feature which can increase the facility to a maximum of US$250 million. On July 30, 2015, the Company acquired the collision repair assets of Red Mountain Collision, in Mesa, Arizona. On August 13, 2015, the Company acquired the collision repair assets of Don Massey Collision Center in Highland Ranch, Colorado. On August 20, 2015, the Company acquired the collision repair assets of Duval Collision Center, in Lake City, Florida. On September 9, 2015, the Company acquired the collision repair assets of Moore Collision Center, in Jacksonville, North Carolina. On September 18, 2015, the Fund was added to the S&P/TSX Composite Index. On September 22, 2015, the Company acquired the collision repair assets of Perri’s Collision, a two-location collision repair business in Grand Junction and Glenwood Springs, Colorado. On September 24, 2015, certain key executives provided irrevocable notice that the options issued January 11, 2006 would be exercised, which resulted in the issuance of 200,000 units at an exercise price of $1.91 on January 11, 2016. On October 6, 2015, the Company acquired the collision repair assets of Wayside Body Shop, a two-location collision repair business in Dayton, Ohio. On October 16, 2015, the Company acquired the collision repair assets of Deacon’s Collision Center, in Mayfield Heights, Ohio. On October 26, 2015, as part of a new start-up, the Company commenced operations in a new collision repair facility in Lakewood, Washington. On October 27, 2015, the Company acquired the collision repair assets of Custom Touch Collision Care, in Gresham, Oregon. On October 30, 2015, the Company acquired the collision repair assets of Clifford’s Auto Body, in Bremerton, Washington.
7

On November 3, 2015, the Company acquired the collision repair assets of John’s CARSTAR Collision Center, in Schererville, Indiana. On November 3, 2015, as part of a new start-up, the Company commenced operations in a new collision repair facility in Estero, Florida. On November 6, 2015, the Fund provided notice that it would be redeeming the 5.75% Convertible Unsecured Subordinated Debentures due December 31, 2017 on January 5, 2016. Debentures not converted at the strike price prior to December 5, 2015 were redeemed in accordance with the provisions of the trust indenture dated as of December 19, 2012. On December 18, 2015, the Company acquired the collision repair assets of Coffey’s Body Shop, in Charlotte, North Carolina. On January 4, 2016, the Company acquired the collision repair assets of Twin City Collision, a two-location collision repair business in Lafayette, Indiana. On January 5, 2016, the Fund completed the early redemption of its 5.75% Convertible Unsecured Subordinated Debentures due December 31, 2017. Subsequent to the initial announcement of the early redemption, $24,012,000 principal amount of the Debentures were converted into 1,026,152 units of the Fund using a rate of 42.7350 Trust Units for each $1,000 principal amount of Debentures and a conversion price of $23.40 per Trust Unit as stated in the Trust Indenture dated as of December 19, 2012. The remaining $192,000 in Debentures were redeemed through the issuance of 3,000 units of the Fund. On January 11, 2016 the Fund completed the settlement of the unit options issued on January 11, 2006. As a result of the settlement 200,000 units were issued at an exercise price of $1.91. On January 15, 2016, the Company acquired the collision repair assets of Hi-Tech Collision, a two-location collision repair business in Sidney and Keating, British Columbia. On February 10, 2016, as part of a new start-up, the Company commenced operations in a new collision repair facility in Conyers, Georgia. On February 29, 2016, as part of a new start-up, the Company commenced operations in a new collision repair facility in Punta Gorda, Florida. On March 18, 2016, the Company, through its Glass America subsidiary, acquired the glass repair assets of Ryan’s Auto Glass (“Ryan’s”) in Cincinnati, Ohio. Ryan’s generated sales of approximately $2 million U.S. for the trailing twelve months ended January 2016. On March 21, 2016, the Company signed a definitive agreement and concurrently completed the acquisition of J&M Auto Import Rebuilding Inc., Portand J&M Automotive, Inc. and Canby J&M Automotive, Inc. (“J&M”), which collectively own and operate five locations in Oregon. J&M generated sales of approximately $9 million U.S. for the trailing twelve months ended October 2015. OUTLOOK Boyd continues to execute on its growth strategy and an abundance of opportunities continue to be available for accretive growth. During 2015 the Company added 29 locations, while at the same time achieving organic growth through same-store sales increases of 5.6%. Looking forward, the Company will continue to pursue accretive growth through a combination of organic growth (same-store sales growth) as well as acquisitions and new store development. Acquisitions will include both single location acquisitions as well as multi location acquisitions. Combined, this strategy is expected to double the size of the business and revenues (on a constant currency basis) over the next 5 years, implying an average annual growth rate of 15%. With prudent financial management and its strong balance sheet, Boyd is further well-positioned to take advantage of large acquisition opportunities, should they arise, which could accelerate the time frame to double its size. It is expected that this growth can be achieved while continuing to be disciplined and selective in the identification and assessment of all acquisition opportunities.
8

As performance based DRP programs with insurance companies continue to develop and evolve it is becoming increasingly important that top performing collision repairers, including Boyd, continue to drive towards higher levels of operating performance as measured primarily by customer satisfaction ratings, repair cycle times and average cost of repair. To this end, Boyd will continue to make investments to enhance its processes and operational performance, including maintaining a team of internal resources, which it transitioned to in 2015, as a replacement to external consulting services. Management remains confident in its business model and its ability to increase market share by expanding its presence in North America through strategic acquisitions alongside organic growth from Boyd’s existing operations. Accretive growth remains the Company’s focus whether it is through organic growth or acquisitions. The North American collision repair industry remains highly fragmented and offers attractive opportunities for industry leaders to build value through focused consolidation and economies of scale. As a growth company, Boyd’s objective continues to be to maintain a conservative distribution policy that will provide the financial flexibility necessary to support growth initiatives while gradually increasing distributions over time. The Company remains confident in its management team, systems and experience. This, along with a strong statement of financial position and financing options, positions Boyd well for success into the future. BUSINESS ENVIRONMENT & STRATEGY
The collision repair industry in North America is estimated by Boyd to represent approximately $30 to $40 billion U.S. in annual revenue. The industry is highly fragmented, consisting primarily of small independent family owned businesses operating in local markets. It is estimated that car dealerships have approximately 23% of the total market. It is believed that multi-unit collision repair operators with greater than $20 million in annual revenues (including multi-unit car dealerships), now have approximately 19% of the total market. Customer relationship dynamics in the Company’s principal markets differ from region to region. In three of the Canadian provinces where Boyd operates, government-owned insurance companies have, by legislation, either exclusive or semi-exclusive rights to provide insurance to automobile owners. Although Boyd’s services in these markets are predominantly paid for by government-owned insurance companies, these insurers do not typically refer insured automobile owners to specific collision repair centers. In these markets Boyd focuses its marketing to attract business from individual vehicle owners primarily through consumer based advertising. Boyd manages relationships in the government-owned insurance markets through active participation in industry associations.
In Alberta, British Columbia, Ontario and in the United States, where private insurers operate, a greater emphasis is placed on establishing and maintaining DRP’s and other referral arrangements with insurance, fleet and lease companies. DRP’s are established between insurance companies and collision repair shops to better manage automobile repair claims and increase levels of customer satisfaction. Insurance, fleet and lease companies select collision repair operators to participate in their programs based on integrity, convenience and physical appearance of the facility, quality of work, customer service, cost of repair, cycle time and other key performance metrics. There is a continuing trend among major insurers in both the public and private insurance markets towards using performance-based criteria for selecting collision repair partners and for referring work to them. Local and regional DRP’s, and more recently national and self-managed DRP relationships, represent an opportunity for Boyd to increase its business. Insurers have also moved to consolidate DRP repair volumes with a fewer number of repair shops. There is some preference among some insurance carriers to do business with multi-location collision repairers in order to reduce the number and complexity of contacts necessary to manage their networks of collision repair providers and to achieve a higher level of consistent performance. Boyd continues to develop and strengthen its DRP relationships with insurance carriers in both Canada and the United States and believes it is well positioned to take advantage of these trends.
In addition, Boyd has used consumer based advertising in some of its markets to complement and supplement its DRP growth strategies. The Company believes this strategy is effective in increasing its brand awareness and overall sales. Boyd plans to continue this strategy and may expand it into other Canadian and U.S. markets, as it achieves sufficient critical mass in these other markets to do so.
Boyd has continued to diversify and broaden its product offerings through growth in the automobile glass repair and replacement business and the auto glass third-party administrator network business. In order to accelerate growth in the glass business, in May 2013, the Fund committed to an amended agreement with a senior member of its U.S. management team and an agreement with the owners of Glass America to acquire a controlling interest in the retail auto glass business of Glass America, Inc. In May 2014, Boyd acquired Netcost to add to its existing third-party administrator business. The Netcost business has been integrated with Gerber National Glass Services and renamed Gerber National Claim Services or “GNCS” with approximately 5,500 affiliated glass provider locations and 4,600 affiliated emergency roadside services providers throughout the U.S. As part of its referral business, GNCS also owns and operates its own call center.
9

As described further under “Business Risks and Uncertainties”, operating results are expected to be subject to fluctuations due to a variety of factors including changes in customer purchasing patterns, pricing by insurance companies, general operating effectiveness, automobile technologies, general and regional economic downturns, unemployment rates and weather conditions. A negative economic climate has the potential to affect results negatively. The Fund has worked to mitigate this risk by continuing to focus on meeting insurance companies’ performance requirements, and in doing so, grow market share. Boyd’s primary strategy is to continue to focus on maximizing its opportunities through a commitment to:
• Use of best practices, economies of scale and infrastructure and systems to enhance profitability and achieve operational excellence;
• Expense management through a focus on cost containment and efficiency improvements; • Optimizing returns from existing operations by achieving same-store sales growth; and • Growing the business through single location and multi-location acquisitions, along with new location
development. Through these strategies, Boyd expects to generate growth sufficient to double the size of its business over the next five years, implying an average annual growth rate of 15 percent. BUSINESS STRATEGY
Operational excellence
Expense management
Unitholder Value
Same-store sales growth and optimize returns from existing operations
New location and acquisition growth
Operational Excellence Operational excellence has been a key component of Boyd’s past success and has contributed to the Company being viewed as an industry leading service provider. Delivering on our customers’ expectations related to cost of repair, time to repair, quality and customer service are critical to being successful and being rewarded with same-store sales growth. The Company’s commitment to operational excellence is embodied in its mission and goal, which is condensed into a top of mind cheer for its employees which is ‘Wow every customer, be the best’. In 2015, Boyd rolled out and implemented its Wow Operating Way process improvement initiative which is now in place at over 260 locations. The Wow Operating Way is a repair planning and execution methodology that drives excellence in customer satisfaction, repair cycle times and operational metrics.
10

Boyd also conducts extensive customer satisfaction polling at all operating locations to assist in keeping customer satisfaction at the forefront of its mandate. Boyd will also continue to invest in its infrastructure, process improvement initiatives and IT systems to contribute to high quality service to its customers and improved operational performance. Expense Management Boyd continues to manage its operating expenses as a percentage of sales. By working continuously to identify cost savings and to achieve same-store sales growth, Boyd will continue to manage this expense ratio. Operating expenses have a high fixed component and therefore same-store sales growth contributes to a lower percentage of operating expenses to sales. Same-Store Sales / Optimize Returns Increasing same-store sales and running shops at or near capacity has a positive impact on financial performance. Boyd also continues to seek opportunities to broaden its product and service offerings in all markets to help grow same-store sales. During the last few years, the Company has focused energy and resources on increasing its share of the automobile glass repair and replacement business. New Location and Acquisition Growth In line with stated growth strategies, Boyd was successful in opening 23 new single locations in 2015 and 16 locations in 2014. Boyd will continue to pursue accretive growth through a combination of organic growth (same-store sales growth) as well as acquisitions and new store development. Acquisitions will include both single-location acquisitions as well as multi-location acquisitions. Combined, Boyd expects this strategy to generate growth sufficient to double the size of its business over the next five years, implying an average annual growth rate of 15 percent. CAUTION CONCERNING FORWARD-LOOKING STATEMENTS Statements made in this annual report, other than those concerning historical financial information, may be forward-looking and therefore subject to various risks and uncertainties. Some forward-looking statements may be identified by words like “may”, “will”, “anticipate”, “estimate”, “expect”, “intend”, or “continue” or the negative thereof or similar variations. Readers are cautioned not to place undue reliance on such statements, as actual results may differ materially from those expressed or implied in such statements. The following table outlines forward-looking information included in this MD&A:
Forward-looking Information Key Assumptions Most Relevant Risk Factors The stated objective of generating growth sufficient to double the size of the business over the next five years
Opportunities continue to be available and are at attractive prices Financing options continue to be available at reasonable rates and on acceptable terms and conditions New and existing customer relationships are expected to provide acceptable levels of revenue opportunities Anticipated operating results would be accretive to overall Company results Growth is defined as revenue on a constant currency basis
Acquisition market conditions change and repair shop owner demographic trends change Credit and refinancing conditions prevent or restrict the ability of the Company to continue growth strategies Changes in market conditions and operating environment Significant declines in the number of insurance claims Integration of new stores is not accomplished as planned Increased competition which prevents achievement of acquisition and revenue goals
11

Boyd remains confident in its business model to increase market share by expanding its presence in both the U.S. and Canada through strategic and accretive acquisitions alongside organic growth from Boyd’s existing operations
Continued stability in economic conditions and employment rates Pricing in the industry remains stable The Company‘s customer and supplier relationships provide it with competitive advantages to increase sales over time Market share growth will more than offset systemic changes in the industry and environment Anticipated operating results would be accretive to overall Company results
Economic conditions deteriorate Loss of one or more key customers or loss of significant volume from any customer Decline in the number of insurance claims Inability of the Company to pass cost increases to customers over time Increased competition which may prevent achievement of revenue goals Changes in market conditions and operating environment Changes in weather conditions
Stated objective to gradually increase distributions over time
Growing profitability of the Company and its subsidiaries The continued and increasing ability of the Company to generate cash available for distribution Balance sheet strength & flexibility is maintained and the distribution level is manageable taking into consideration bank covenants, growth requirements and maintaining a distribution level that is supportable over time No change in the Fund’s structure
The Fund is dependent upon the operating results of the Company and its ability to pay interest and dividends to the Fund Economic conditions deteriorate Changes in weather conditions Decline in the number of insurance claims Loss of one or more key customers or loss of significant volume from any customer Changes in government regulation
We caution that the foregoing table contains what the Fund believes are the material forward-looking statements and is not exhaustive. Therefore when relying on forward-looking statements, investors and others should refer to the “Risk Factors” section of the Fund’s Annual Information Form, the “Business Risks and Uncertainties” and other sections of our Management’s Discussion and Analysis and our other periodic filings with Canadian securities regulatory authorities. All forward-looking statements presented herein should be considered in conjunction with such filings. SELECTED ANNUAL INFORMATION The following table summarizes selected financial information for the Fund over the prior three years: For the year ended December 31,(thousands of Canadian dollars, except per unit amounts) 2015 2014 2013
Sales 1,174,077$ 844,104$ 578,260$
Net loss (21,962)$ (15,311)$ (11,595)$
Adjusted earnings 40,483$ 29,990$ 18,457$
Basic loss per unit (1.333)$ (0.999)$ (0.891)$ Diluted loss per unit (1.333)$ (0.999)$ (0.891)$
Cash distributions per unit declared:Trust unit distributions 0.494$ 0.482$ 0.470$
As at December 31,(thousands of Canadian dollars) 2015 2014 2013
Total assets 638,922$ 487,813$ 282,271$
Total long-term financial liabilities 283,897$ 232,674$ 117,674$
12

Acquisitions and new single location growth had the largest impact on growing sales from 2013 to present. In 2013, the Company added Glass America which expanded the Company’s retail glass business in 23 U.S. states as well as 25 Hansen Collision locations and 17 new single locations. In 2014 there were 48 locations added through the multi-shop acquisitions of Collision Revision, Inc. (“Collision Revision”), Collex Collision Experts Inc. (“Collex”) and Champ’s Holding Company, LLC ("Champ’s"). As well, the Company added Netcost Claims Services (“Netcost”) along with 16 new single locations. In 2015, the Company continued to grow through acquisitions with the addition of six Craftmaster locations and 23 new single locations. The strengthening of the US Dollar in relation to the Canadian Dollar has also increased sales during this period. The net losses reported were due to fair value adjustments related to financial instruments that mainly arise as the Fund’s unit price increases. Excluding these adjustments, net earnings would have increased each year as a result of the increase in sales and gross profit, offset by higher finance costs and higher taxes. The change in total assets and total long-term financial liabilities was significantly impacted by the multi-shop acquisitions, as well as the 2013 acquisition of Glass America. In addition to these changes, fluctuations in total assets have primarily related to increases in property, plant and equipment as a result of new location growth, as well as capital expansion from convertible debenture and equity offerings. Long-term financial liabilities have increased primarily due to financing of acquisitions as well as the 2014 convertible debenture offering. Additional growth in finance leases and the recognition of Class A exchangeable shares, unit options, convertible debenture conversion feature and the non-controlling interest put liability as financial liabilities under IFRS has also contributed to the growth in long-term financial liabilities. During 2014 and 2015, the translation of assets and liabilities at higher exchange rates also contributed to the overall increase in these values. Since the end of 2007, the Fund has increased monthly distributions to unitholders and Boyd Group Holdings Inc. has increased dividends to its Class A shareholders annually such that as of March 22, 2016 the distribution/dividend rate is $0.042 per month or $0.504 on an annualized basis. BOYD GROUP INCOME FUND Boyd Group Income Fund (the “Fund”), is an unincorporated, open-ended mutual fund trust. The Fund owns 100% of the Class I common shares and subordinated notes issued by a U.S. subsidiary of the Company, The Boyd Group (U.S.) Inc. (the “Notes”). In January 2016, 5% of the Notes issued by The Boyd Group (U.S.) Inc. were assigned to the Company by the Fund, bringing the Fund’s ownership percentage of Notes issued by The Boyd Group (U.S.) Inc. to 95%. Distributions to unitholders, when paid by the Fund, were funded from a combination of interest income earned on the Notes and from dividends on the Class I common share investment or as a return of capital on Notes. There was no return of capital in 2014 and 2015. The Class I common shares held by the Fund currently, through March 22, 2016, represent 89.7% of the total common shares of the Company. Boyd Group Holdings Inc. (“BGHI”) owns 100% of the Class II common shares issued by the Company. The Class II common shares currently, through March 22, 2016, represent 10.3% of the common shares of the Company. The share structure of BGHI at March 22, 2016, consists of 100 million Voting shares, 250,499 Class A common shares and 1,812,364 Class B common shares. The Fund, through the ownership of 70 million or 70% of the Voting shares, has voting control of BGHI. The remaining 30% is held directly or indirectly by a senior officer of the Fund. Of the 250,499 Class A common shares, 107,329 are also held directly or indirectly by a senior officer of the Fund with the remaining shares being held by external third parties. The Class B common shares are all held by Boyd and are issued only upon exchange of Class A common shares for units of the Fund. Although the Fund has voting control it did not and continues not to have any significant economic interest in the activities of BGHI. All dividends received by BGHI from Boyd on the Class II common shares are passed on as dividends to Class A and B common shareholders of BGHI. The Fund also holds 78,730 Class IV non-voting, redeemable, retractable preferred shares of the Company issued as a result of an internal restructuring in 2007, the bought deal public equity offerings completed in 2014, 2013 and 2011, the convertible debenture offering completed in 2012 and the subsequent conversion and redemption of 2012 convertible debentures into units. The consolidated financial statements of the Fund, BGHI and their subsidiaries have been prepared in accordance with International Financial Reporting Standards and contain the consolidated financial position, results of operations and cash flows of the Fund, BGHI and the Company and the Company’s subsidiary companies for the period ended December 31, 2015.
13

NON-GAAP FINANCIAL MEASURES EBITDA AND ADJUSTED EBITDA Earnings before interest, taxes, depreciation and amortization (“EBITDA”) is not a calculation defined in International Financial Reporting Standards (“IFRS”). EBITDA should not be considered an alternative to net earnings in measuring the performance of the Fund, nor should it be used as an exclusive measure of cash flow. The Fund reports EBITDA and Adjusted EBITDA because it is a key measure that management uses to evaluate performance of the business and to reward its employees. EBITDA is also a concept utilized in measuring compliance with debt covenants. EBITDA and Adjusted EBITDA are measures commonly reported and widely used by investors and lending institutions as an indicator of a company’s operating performance and ability to incur and service debt, and as a valuation metric. While EBITDA is used to assist in evaluating the operating performance and debt servicing ability of the Fund, investors are cautioned that EBITDA and Adjusted EBITDA as reported by the Fund may not be comparable in all instances to EBITDA as reported by other companies. The CPA’s Canadian Performance Reporting Board defined standardized EBITDA to foster comparability of the measure between entities. Standardized EBITDA represents an indication of an entity’s capacity to generate income from operations before taking into account management’s financing decisions and costs of consuming tangible and intangible capital assets, which vary according to their vintage, technological age and management’s estimate of their useful life. Accordingly, standardized EBITDA comprises sales less operating expenses before finance costs, capital asset amortization and impairment charges, and income taxes. Adjusted EBITDA is calculated to exclude items of an unusual nature that do not reflect normal or ongoing operations of the Fund and which should not be considered in a valuation metric or should not be included in assessment of ability to service or incur debt. Included in this category of adjustments are the fair value adjustments to exchangeable Class A common shares, the fair value adjustments to unit based payment obligations, the fair value adjustments to convertible debenture conversion features and the fair value adjustments to the non-controlling interest put option. These items are adjustments that did not have any cash impact on the Fund. Also included as an adjustment to EBITDA are acquisition, transaction and process improvement costs which do not relate to the current operating performance of the business units but are typically costs incurred to expand operations. In 2015, the Company settled an outstanding working capital adjustment related to an acquisition that was beyond the one year measurement period. The timing resulted in this adjustment impacting earnings instead of goodwill which is not typical of our acquisition accounting. This adjustment has been included in acquisition, transaction and process improvement costs. From time to time, the Fund may make other adjustments to its Adjusted EBITDA for items that are not expected to recur. The following is a reconciliation of the Fund’s net loss to EBITDA and Adjusted EBITDA:
(thousands of Canadian dollars) 2015 2014 2015 2014
Net loss (2,704)$ (10,806)$ (21,962)$ (15,311)$ Add:
Finance costs (net of Finance income) 4,611 2,836 14,254 8,317 Income tax expense 5,532 2,995 20,328 11,737 Depreciation of property, plant and equipment 5,192 3,732 18,022 13,405 Amortization of intangible assets 2,854 2,652 10,072 7,139
Standardized EBITDA 15,485$ 1,409$ 40,714$ 25,287$
Add:Fair value adjustments 12,813 16,122 58,950 37,360 Acquisition, transaction and process improvement costs 254 1,466 2,003 6,325
Adjusted EBITDA 28,552$ 18,997$ 101,667$ 68,972$
For the three months ended December 31,
For the year ended December 31,
14
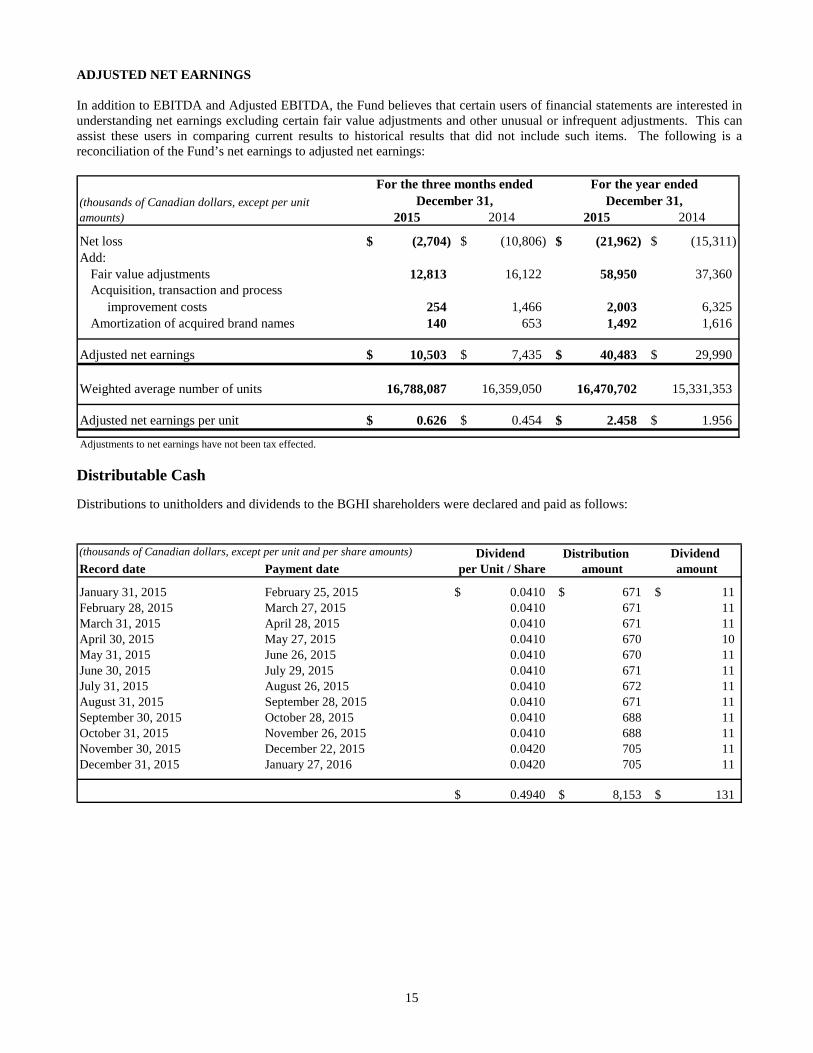
ADJUSTED NET EARNINGS In addition to EBITDA and Adjusted EBITDA, the Fund believes that certain users of financial statements are interested in understanding net earnings excluding certain fair value adjustments and other unusual or infrequent adjustments. This can assist these users in comparing current results to historical results that did not include such items. The following is a reconciliation of the Fund’s net earnings to adjusted net earnings:
2015 2014 2015 2014
Net loss (2,704)$ (10,806)$ (21,962)$ (15,311)$ Add:
Fair value adjustments 12,813 16,122 58,950 37,360 Acquisition, transaction and process improvement costs 254 1,466 2,003 6,325 Amortization of acquired brand names 140 653 1,492 1,616
Adjusted net earnings 10,503$ 7,435$ 40,483$ 29,990$
Weighted average number of units 16,788,087 16,359,050 16,470,702 15,331,353
Adjusted net earnings per unit 0.626$ 0.454$ 2.458$ 1.956$
(thousands of Canadian dollars, except per unit amounts)
For the three months ended December 31,
For the year ended December 31,
Adjustments to net earnings have not been tax effected.
Distributable Cash
Distributions to unitholders and dividends to the BGHI shareholders were declared and paid as follows: (thousands of Canadian dollars, except per unit and per share amounts) Dividend Distribution Dividend Record date Payment date per Unit / Share amount amount
January 31, 2015 February 25, 2015 0.0410$ 671$ 11$ February 28, 2015 March 27, 2015 0.0410 671 11 March 31, 2015 April 28, 2015 0.0410 671 11 April 30, 2015 May 27, 2015 0.0410 670 10 May 31, 2015 June 26, 2015 0.0410 670 11 June 30, 2015 July 29, 2015 0.0410 671 11 July 31, 2015 August 26, 2015 0.0410 672 11 August 31, 2015 September 28, 2015 0.0410 671 11 September 30, 2015 October 28, 2015 0.0410 688 11 October 31, 2015 November 26, 2015 0.0410 688 11 November 30, 2015 December 22, 2015 0.0420 705 11 December 31, 2015 January 27, 2016 0.0420 705 11
0.4940$ 8,153$ 131$
15

(thousands of Canadian dollars, except per unit and per share amounts) Dividend Distribution Dividend Record date Payment date per Unit / Share amount amount
January 31, 2014 February 26, 2014 0.0400$ 597$ 15$ February 28, 2014 March 27, 2014 0.0400 597 15 March 31, 2014 April 28, 2014 0.0400 598 15 April 30, 2014 May 28, 2014 0.0400 597 15 May 31, 2014 June 26, 2014 0.0400 598 15 June 30, 2014 July 29, 2014 0.0400 598 15 July 31, 2014 August 27, 2014 0.0400 602 10 August 31, 2014 September 26, 2014 0.0400 602 11 September 30, 2014 October 29, 2014 0.0400 654 11 October 31, 2014 November 26, 2014 0.0400 654 10 November 30, 2014 December 22, 2014 0.0410 671 11 December 31, 2014 January 28, 2015 0.0410 671 11
0.4820$ 7,439$ 154$ Maintaining Productive Capacity Productive capacity is defined by Boyd as the maintenance of the Company’s facilities, equipment, signage, courtesy cars, systems, brand names and infrastructure. Although most of Boyd’s repair facilities are leased, funds are required to ensure facilities are properly repaired and maintained to ensure the Company’s physical appearance communicates Boyd’s standard of professional service and quality. The Company’s need to maintain its facilities and upgrade or replace equipment, signage, systems and courtesy car fleets forms part of the annual cash requirements of the business. The Company manages these expenditures by annually reviewing and determining its capital budget needs and then authorizing major expenditures throughout the year based upon individual business cases. The Company manages its cash maintenance capital expenditures up to approximately 0.8% of sales. Although maintenance capital expenditures may remain within budget on an annual basis, the timing of these expenditures often varies significantly from quarter to quarter. In addition to normal maintenance capital expenditures, the Company has invested in specialized aluminum repair equipment. This equipment will allow the Company to support an anticipated market need as more vehicle components are produced using aluminum. To date the Company has invested, through finance leases, $3.0 million for equipment required to repair vehicles with aluminum components. Additional investments in the future may also be required as the prevalence of aluminum and other specialty materials in the North American fleet increases. In many circumstances, large equipment expenditures including automobiles, shop equipment and computers can be financed using either operating or finance leases. Cash spent on maintenance capital expenditures plus the repayment of operating and finance leases, including the interest thereon, form part of the distributable cash calculations. Non-recurring and Other Adjustments Non-recurring and other adjustments may include, but are not limited to, post closure environmental liabilities, restructuring costs, acquisition, transaction and process improvement costs. Management is not currently aware of any environmental remediation requirements. Acquisition, transaction and process improvement costs are added back to distributable cash as they occur. Debt Management In addition to finance lease obligations arranged to finance growth and maintenance expenditures on property and equipment, the Company has historically utilized long-term debt to finance the expansion of its business, usually through the acquisition and start-up of collision and glass repair and replacement businesses. Repayments of this debt do not form part of distributable cash calculations. Boyd’s bank facilities include restrictive covenants, which could limit the Fund’s ability to distribute cash. These covenants, based upon current financial results, would not prevent the Fund from paying future distributions at conservative and sustainable levels. These covenants will continue to be monitored in conjunction with any future anticipated distributions.
16

The following is a standardized and adjusted distributable cash calculation for 2015 and 2014.
Standardized and Adjusted Distributable Cash (1)
2015 2014 2015 2014
Cash flow from operating activities before changes in non-cash working capital items 24,046$ 15,116$ 75,311$ 48,977$ Changes in non-cash working capital items 5,798 (5,710) 7,141 2,242 Cash flows from operating activities 29,844 9,406 82,452 51,219 Less adjustment for:
Sustaining expenditures on plant, software
and equipment (2)(2,871) (2,260) (9,560) (6,266)
Standardized distributable cash 26,973$ 7,146$ 72,892$ 44,953$
Standardized distributable cash per average unit and Class A common share
Per average unit and Class A common share 1.582$ 0.430$ 4.356$ 2.872$ Per diluted unit and Class A common share (5)
1.582$ 0.430$ 4.356$ 2.872$
Standardized distributable cash from above 26,973$ 7,146$ 72,892$ 44,953$ Add (deduct) adjustments for:
Acquisition, transaction and process
improvement costs (3)986 1,466 2,735 6,325
Proceeds on sale of equipment and software 111 31 352 202
Principal repayments of finance leases (4) (1,336) (930) (5,228) (3,971) Payment to non-controlling interest (6)
(316) (1,066) (1,086) (1,066) Adjusted distributable cash 26,418$ 6,647$ 69,665$ 46,443$
Adjusted distributable cash per average unit and Class A common share
Per average unit and Class A common share 1.550$ 0.400$ 4.163$ 2.967$ Per diluted unit and Class A common share (5)
1.550$ 0.400$ 4.163$ 2.967$
Distributions and dividends paid Unitholders 2,081$ 1,980$ 8,119$ 7,366$ Class A common shareholders 32$ 33$ 130$ 159$ Total distributions and dividends paid 2,113$ 2,013$ 8,249$ 7,525$
Distributions and dividends paid Per unit 0.124$ 0.121$ 0.493$ 0.481$ Per Class A common share 0.124$ 0.121$ 0.493$ 0.481$
Payout ratio based on standardized distributable cash 7.8% 28.2% 11.3% 16.7%
Payout ratio based on adjusted distributable cash 8.0% 30.3% 11.8% 16.2%
(thousands of Canadian dollars, except per unit and per share amounts)
For the three months ended December 31,
For the years ended December 31,
(1) As defined in the non-GAAP financial measures section of the MD&A.
(2) Includes sustaining expenditures on plant and equipment, information technology hardware and computer software but excludes capital expenditures
associated with acquisition and development activities including rebranding of acquired locations. In addition to the maintenance capital expenditures paid with cash, during 2015 the Company acquired a further $8.0 million (2014 - $2.6 million) in capital assets which were financed through finance leases and did not affect cash flows in the current period.
17

(3) The Company has added back to distributable cash the costs related to acquisitions and 2014 process improvement initiatives excluding non-cash other
gains.
(4) Repayments of these leases represent additional cash requirements to support the productive capacity of the Company and therefore have been deducted when calculating adjusted distributed cash.
(5) Per diluted unit and Class A common share amounts have been calculated in accordance with definitions of dilution and anitdilution contained in IAS
33, Earnings per Share. Diluted distributable cash amounts will differ from average distributable cash amounts on a per unit basis if earnings per unit calculations show a dilutive impact.
(6) The transfer of cash during the period to the external partners of Glass America, associated with the taxable income and tax liabilities being allocated to
them.
Distributions The Fund and BGHI make monthly distributions, in accordance with their distribution policies, to unitholders of the Fund and dividends to Class A common shareholders of BGHI of record on the last day of each month, payable on or about the last business day of the following month. The amount of cash distributed by the Fund is equal to the pro rata share of interest or principal repayments received on the Notes and distributions received on or in respect of the Class I common shares of the Company held by the Fund, after deducting expenses of the Fund and any cash redemptions of the Fund during the period. The amount of cash distributed by BGHI is equal to the pro rata share of dividends received on or in respect of the Class II common shares of the Company held by BGHI, after deducting expenses of BGHI. All dividends paid or allocated to unitholders of the Fund or Class A shareholders of BGHI are considered to be eligible dividends for Canadian income tax purposes. During 2015, the Fund paid distributions totaling $8.1 million (2014 - $7.4 million) while BGHI paid dividends to Class A common shareholders during this same period of $130 thousand (2014 - $159 thousand). Distributable cash is a non-GAAP measure that provides an indication of the Fund’s ability to sustain distributions while maintaining productive capacity. Distributable cash can be compared to cash flow provided by operating activities, which is its nearest GAAP measure. In addition, a comparison can also be made to earnings.
The Fund’s distribution level is currently well below cash flow provided by operating activities and adjusted distributable cash. Excess funds have been retained to grow the business and strengthen the statement of financial position. A continuation of this trend would permit the Fund to continue to increase distributions over time while maintaining a strong statement of financial position and executing its growth strategy.
18

RESULTS OF OPERATIONS Results of Operations
(thousands of Canadian dollars, except per unit amounts) 2015 % change 2014 2015 % change 2014
Sales - Total 312,505 30.4 239,560 1,174,077 39.1 844,104 Same-store sales - Total (excluding foreign exchange) 251,313 6.0 237,079 748,616 5.6 709,117
Gross margin % 45.3 (0.9) 45.7 45.7 (1.1) 46.2Operating expense % 36.1 (4.5) 37.8 37.1 (2.4) 38.0
Adjusted EBITDA (1) 28,552 50.3 18,997 101,667 47.4 68,972 Acquisition, transaction and process improvement costs 254 (82.7) 1,466 2,003 (68.3) 6,325 Depreciation and amortization 8,046 26.0 6,384 28,094 36.8 20,544 Fair value adjustments 12,813 (20.5) 16,122 58,950 57.8 37,360 Finance costs 4,611 62.6 2,836 14,254 71.4 8,317 Income tax expense 5,532 84.7 2,995 20,328 73.2 11,737
Adjusted net earnings (1) 10,503 41.3 7,435 40,483 35.0 29,990 Adjusted net earnings per unit (1) 0.626 37.9 0.454 2.458 25.7 1.956
Net loss (2,704) N/A (10,806) (21,962) N/A (15,311) Basic loss per unit (0.161) N/A (0.661) (1.333) N/A (0.999) Diluted loss per unit (0.161) N/A (0.661) (1.333) N/A (0.999)
Standardized distributable cash 26,973 277.5 7,146 72,892 62.2 44,953 Adjusted distributable cash (1) 26,418 297.4 6,647 69,665 50.0 46,443
Distributions and dividends paid 2,113 5.0 2,013 8,249 9.6 7,525
(1) As defined in the non-GAAP financial measures section of the MD&A.
For the three months ended December 31,
For the years ended December 31,
Sales Sales totaled $1.174 billion for the year ended December 31, 2015, an increase of $330.0 million or 39.1% when compared to 2014. The increase in sales was the result of the following:
• $190.6 million of incremental sales were generated from 39 new single locations as well as 25 Collision Revision locations, 16 Collex locations, seven Champ’s locations, six Craftmaster locations as well as incremental glass network and other network sales from the acquisition of Netcost.
• Same-store sales excluding foreign exchange increased $39.5 million or 5.6%, and increased a further $105.0 million due to the translation of same-store sales at a higher U.S. dollar exchange rate.
• Sales were affected by the closure of under-performing facilities which decreased sales by $5.1 million. Same-store sales are calculated by including sales for stores that have been in operation for the full comparative period. Gross Profit Gross Profit was $536.9 million or 45.7% of sales for the year ended December 31, 2015 compared to $389.6 million or 46.2% of sales for the same period in 2014. Gross profit increased primarily as a result of higher sales due to acquisition growth and same-store sales growth compared to the prior period. The gross margin percentage decreased when compared with the prior period due primarily to a higher mix of lower margin glass network and other network sales.
19
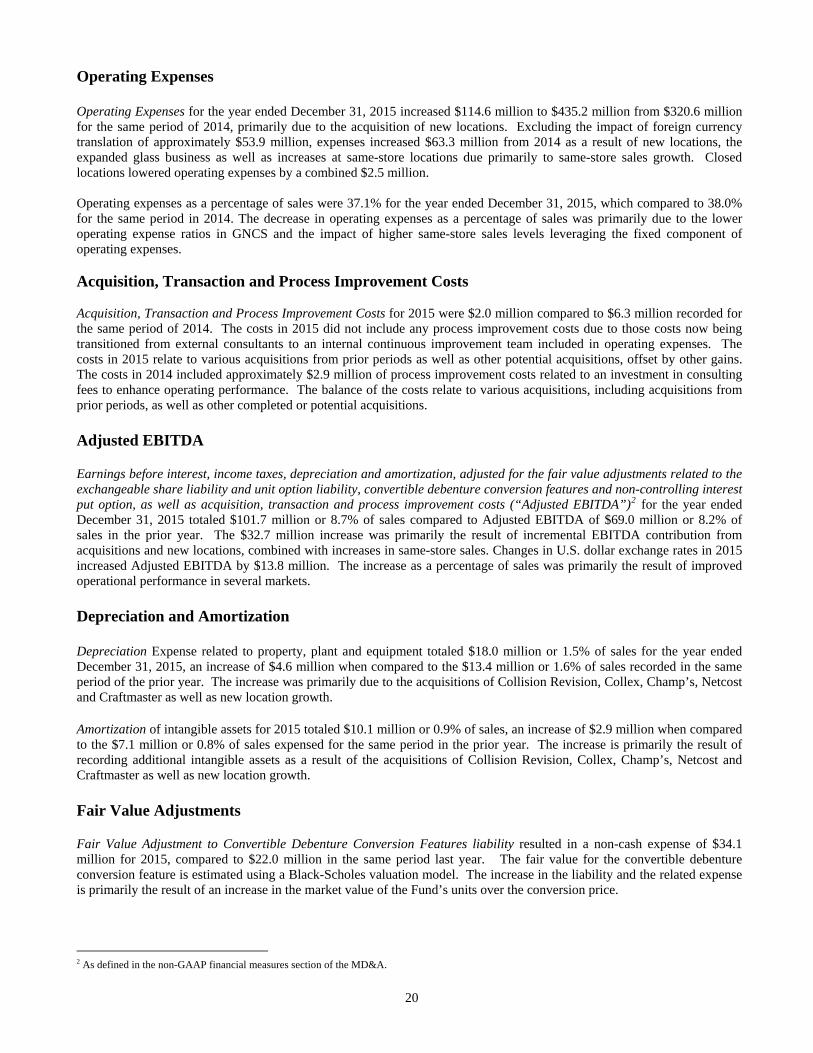
Operating Expenses Operating Expenses for the year ended December 31, 2015 increased $114.6 million to $435.2 million from $320.6 million for the same period of 2014, primarily due to the acquisition of new locations. Excluding the impact of foreign currency translation of approximately $53.9 million, expenses increased $63.3 million from 2014 as a result of new locations, the expanded glass business as well as increases at same-store locations due primarily to same-store sales growth. Closed locations lowered operating expenses by a combined $2.5 million. Operating expenses as a percentage of sales were 37.1% for the year ended December 31, 2015, which compared to 38.0% for the same period in 2014. The decrease in operating expenses as a percentage of sales was primarily due to the lower operating expense ratios in GNCS and the impact of higher same-store sales levels leveraging the fixed component of operating expenses. Acquisition, Transaction and Process Improvement Costs Acquisition, Transaction and Process Improvement Costs for 2015 were $2.0 million compared to $6.3 million recorded for the same period of 2014. The costs in 2015 did not include any process improvement costs due to those costs now being transitioned from external consultants to an internal continuous improvement team included in operating expenses. The costs in 2015 relate to various acquisitions from prior periods as well as other potential acquisitions, offset by other gains. The costs in 2014 included approximately $2.9 million of process improvement costs related to an investment in consulting fees to enhance operating performance. The balance of the costs relate to various acquisitions, including acquisitions from prior periods, as well as other completed or potential acquisitions. Adjusted EBITDA Earnings before interest, income taxes, depreciation and amortization, adjusted for the fair value adjustments related to the exchangeable share liability and unit option liability, convertible debenture conversion features and non-controlling interest put option, as well as acquisition, transaction and process improvement costs (“Adjusted EBITDA”)2 for the year ended December 31, 2015 totaled $101.7 million or 8.7% of sales compared to Adjusted EBITDA of $69.0 million or 8.2% of sales in the prior year. The $32.7 million increase was primarily the result of incremental EBITDA contribution from acquisitions and new locations, combined with increases in same-store sales. Changes in U.S. dollar exchange rates in 2015 increased Adjusted EBITDA by $13.8 million. The increase as a percentage of sales was primarily the result of improved operational performance in several markets. Depreciation and Amortization Depreciation Expense related to property, plant and equipment totaled $18.0 million or 1.5% of sales for the year ended December 31, 2015, an increase of $4.6 million when compared to the $13.4 million or 1.6% of sales recorded in the same period of the prior year. The increase was primarily due to the acquisitions of Collision Revision, Collex, Champ’s, Netcost and Craftmaster as well as new location growth. Amortization of intangible assets for 2015 totaled $10.1 million or 0.9% of sales, an increase of $2.9 million when compared to the $7.1 million or 0.8% of sales expensed for the same period in the prior year. The increase is primarily the result of recording additional intangible assets as a result of the acquisitions of Collision Revision, Collex, Champ’s, Netcost and Craftmaster as well as new location growth. Fair Value Adjustments Fair Value Adjustment to Convertible Debenture Conversion Features liability resulted in a non-cash expense of $34.1 million for 2015, compared to $22.0 million in the same period last year. The fair value for the convertible debenture conversion feature is estimated using a Black-Scholes valuation model. The increase in the liability and the related expense is primarily the result of an increase in the market value of the Fund’s units over the conversion price.
2 As defined in the non-GAAP financial measures section of the MD&A.
20

Fair Value Adjustment to Exchangeable Class A Common Shares liability resulted in a non-cash expense of $4.4 million during 2015 compared to $4.5 million in the prior year. The Class A exchangeable shares of BGHI are exchangeable into units of the Fund. This exchangeable feature results in the shares being presented as financial liabilities of the Fund. The liability represents the value of the Fund attributable to these shareholders. Exchangeable Class A shares are measured at the market price of the units of the Fund as of the statement of financial position date. The increase in the liability and the related expense for both years is the result of increases in the value of the Fund’s units. Fair Value Adjustment to Unit Based Payment Obligation liability was a non-cash expense of $12.9 million for 2015 compared to $8.9 million in the prior year. Similar to the exchangeable share liability, the unit option liability is impacted by changes in the value of the Fund’s units. The cost of cash-settled unit-based transactions is measured at fair value using a Black-Scholes model and expensed over the vesting period with the recognition of a corresponding liability. The increase in the liability and the related expense is primarily the result of an increase in the value of the Fund’s units. Fair Value Adjustment to Non-controlling Interest Put Options liability resulted in a non-cash expense of $7.6 million for 2015 compared to a $1.9 million charge to expense in the same period of the prior year. The expense relates to agreements the Fund entered into on May 31, 2013, in connection with the acquisition of Glass America, which provide the non-controlling interest partners with the right to require the Company to purchase their retained interest according to a valuation formula defined in the agreements. The value of the put options is determined by discounting the estimated future payment obligations at each statement of financial position date.
Finance Costs
Finance Costs of $14.3 million or 1.2% of sales for 2015 increased from $8.3 million or 1.0% of sales for the prior year. The increase in finance costs resulted from the accelerated accretion related to the 2012 convertible debentures which were redeemed in early 2016, the expensing of finance fees associated with replacing the bank facility in July of 2015, increases in long-term debt as a result of the acquisitions of Collision Revision, Collex, Champ’s and Netcost in 2014 as well as the issuance of the convertible debentures in September of 2014. Income Taxes Current and Deferred Income Tax Expense of $20.3 million in 2015 compares to an expense of $11.7 million in 2014. Income tax expense is impacted by permanent differences such as mark-to-market adjustments which impacts the tax computed on accounting income. At the end of 2015, the Fund reported remaining loss carryforward amounts in Canada of $8.6 million and in the U.S. of $nil. Net Loss and Loss Per Unit
Net Loss for the year ended December 31, 2015 was $22.0 million or 1.9% of sales compared to $15.3 million or 1.8% of sales last year. The loss in 2015 primarily resulted from the fair value adjustments to financial instruments of $59.0 million, acquisition, transaction and process improvement costs of $2.0 million and accelerated amortization of acquired brands of $1.5 million. Excluding the impact of these adjustments, net earnings would have increased to $40.5 million or 3.4% of sales. This compares to adjusted earnings of $30.0 million or 3.6% of sales for the same period in 2014 if the same items were adjusted. The increase in the adjusted net earnings for the year is the result of the contribution of new acquisitions and new location growth as well as increases in same-store sales. Basic and Diluted Loss Per Unit was a loss of $1.333 per unit for the year ended December 31, 2015 compared to $0.999 per unit in the same period in 2014. The increase in the basic and diluted loss per unit amounts is primarily attributed to the larger impact of the fair value adjustments during 2015 compared to 2014.
21

Summary of Quarterly Results(in thousands of Canadian dollars, except per unit amounts) 2015 Q4 2015 Q3 2015 Q2 2015 Q1 2014 Q4 2014 Q3 2014 Q2 2014 Q1
Sales 312,505$ 301,076$ 278,726$ 281,770$ 239,560$ 218,087$ 202,815$ 183,642$
Adjusted EBITDA (1) 28,552$ 26,425$ 25,505$ 21,185$ 18,997$ 16,868$ 18,065$ 15,042$
Net (loss) earnings (2,704)$ (19,479)$ 8,657$ (8,436)$ (10,806)$ 8,361$ (11,191)$ (1,675)$ Basic (loss) earnings per unit (0.161)$ (1.189)$ 0.529$ (0.516)$ (0.661)$ 0.555$ (0.749)$ (0.112)$ Diluted (loss) earnings per unit (0.161)$ (1.189)$ 0.394$ (0.516)$ (0.661)$ 0.220$ (0.749)$ (0.112)$
Adjusted net earnings (1) 10,503$ 10,326$ 11,358$ 8,296$ 7,435$ 6,833$ 8,466$ 7,256$
Adjusted net earnings per unit (1) 0.626$ 0.631$ 0.694$ 0.507$ 0.454$ 0.453$ 0.567$ 0.486$
(1) As defined in the non-GAAP financial measures section of the MD&A. Sales and adjusted EBITDA have increased in recent quarters due to the acquisitions of Collision Revision, Collex, Champ’s, Netcost, Craftmaster and other new locations as well as same-store sales increases and the impact of foreign currency. The loss in certain quarters is primarily due to the fair value adjustments for exchangeable Class A common shares, unit options, convertible debenture conversion features and non-controlling interest put options, which reduced net earnings, as well as due to expensing acquisition, transaction and process improvement costs. STATUS AS A SPECIFIED INVESTMENT FLOW-THROUGH AND TAXATION Under the previous taxation regime for income trusts, the Fund had been exempt from tax on its income to the extent that its income was distributed to unitholders. This exemption did not apply to the Company or its subsidiaries, which are corporations that are subject to income tax. Under the tax regime effective for 2010 and years thereafter for trusts, certain distributions from a “specified investment flow-through” trust or partnership (“SIFT”) are no longer deductible in computing a SIFT’s taxable income, and a SIFT is subject to tax on such distributions at a rate that is substantially equivalent to the general tax rate applicable to a Canadian corporation. Foreign investment income from non-portfolio investments is not subject to the SIFT tax. In 2009, the Fund investigated and evaluated its structuring alternatives in connection with the SIFT rules with a view of preserving and maximizing unitholder value. Based upon its investigation, analysis and due diligence and given its size and circumstances, the Fund determined at that time, and continues to believe today, that a change to a share corporation structure would not be advantageous to the Fund or its unitholders. This determination is based on several reasons. First, the Fund does not believe it will achieve any net tax savings by converting. Second, the Fund believes that the cost of conversion is not a prudent use of cash and is not justified by any perceived benefits from conversion for a fund of Boyd’s size. Third, to the extent that the Fund pays SIFT tax, it believes that its taxable unitholders will benefit from the lower tax rate on distributions received, as it expects to be able to maintain distributions, despite any trust tax that the Fund will incur. Lastly, the Fund’s current distribution level to unitholders is being funded almost entirely by its U.S. operations and since distributions that are sourced from U.S. business earnings are not subject to the SIFT tax, the Fund benefits from a tax deduction at the U.S. corporate entity level for interest paid to the Fund which is distributed to unitholders. The Fund is required to record income tax expense at its effective tax rate. The Fund’s effective tax rate varies due to the fixed level of interest that is deducted from the U.S. operations and paid to the trust unitholders as distributions. This amount of interest was approximately $8.2 million for the year ended December 31, 2015 (2014 - $7.4 million). The Fund estimates that its basic Canadian provincial and federal tax rate is approximately 26% and its U.S. federal and state tax rate is approximately 39%. In forecasting future tax obligations, the Fund deducts the interest amount above from the U.S. taxable income to estimate the U.S. tax expense. As a result of the fixed nature of the interest deduction and the potential for change in the U.S. – Canada mix of income, it is not possible to provide a reliable estimate of the future effective tax rate for the Fund.
22

The following illustration demonstrates the differences in the effective tax rate depending on the level of net income and a fixed interest deduction in the U.S. Effective tax rate (illustration only)
Net income level (1) 25,000$ 50,000$ 75,000$ U.S. interest deduction re: distribution (5,000) (5,000) (5,000)
20,000$ 45,000$ 70,000$
Example blended tax rate (U.S. and Canada) 35.00% 35.00% 35.00%
7,000$ 15,750$ 24,500$
Effective tax rate - % of total 28.00% 31.50% 32.67%
(1) Net income level is before tax and excludes other non-taxable adjustments such as fair value and put option adjustments. While the Fund intends on remaining in its current structure for the foreseeable future, it will continue to evaluate this decision in the context of changing circumstances. LIQUIDITY AND CAPITAL RESOURCES Cash flow from operations, together with cash on hand and unutilized credit available on existing credit facilities are expected to be sufficient to meet operating requirements, capital expenditures and distributions. At December 31, 2015, the Fund had cash, net of outstanding deposits and cheques, held on deposit in bank accounts totaling $72.9 million (December 31, 2014 - $57.5 million). The net working capital ratio (current assets divided by current liabilities) was 1.17:1 at December 31, 2015 (December 31, 2014 – 1.28:1). At December 31, 2015, the Fund had total debt outstanding, net of cash, of $81.8 million compared to $89.6 million at September 30, 2015, $88.3 million at June 30, 2015, $86.1 million at March 31, 2015 and $89.5 million at December 31, 2014. Debt, net of cash decreased as a result of conversions of convertible debentures to units during the year. Cash increases during 2015 were offset with increases to seller notes and finance leases. Cash, seller notes and finance leases were each affected by foreign currency translation during 2015. Total debt, net of cash
(thousands of Canadian dollars)December 31,
2015September 30,
2015June 30,
2015March 31,
2015December 31,
2014
Convertible debentures 75,120$ 73,004$ 82,392$ 82,061$ 81,664$
Seller notes (1) 66,547 64,790 60,394 61,504 56,598
Obligations under finance leases 13,023 12,903 11,613 9,433 8,775
Total debt 154,690$ 150,697$ 154,399$ 152,998$ 147,037$
Cash 72,926 61,097 66,061 66,904 57,510
Total debt, net of cash 81,764$ 89,600$ 88,338$ 86,094$ 89,527$
(1) Seller notes are loans granted to the Company by the sellers of businesses related to the acquisition of those businesses.
23

The following table summarizes the contractual obligations at December 31, 2015 and required payments over the next five years: Contractual Obligations
(thousands of Canadian dollars) TotalWithin 1
year1 to 2 years
2 to 3 years
3 to 4 years
4 to 5 years
After 5 years
Bank indebtedness - $ - $ - $ - $ - $ - $ - $ Accounts payable and accrued liabilities 134,431 134,431 - - - - - Long-term debt 66,547 9,802 10,172 9,310 7,884 5,876 23,503 Obligations under finance leases 13,023 4,547 3,346 2,783 2,087 169 91
Convertible debentures (1) 81,704 24,204 - - - - 57,500 Operating lease obligation 346,561 61,205 53,994 46,505 39,179 32,200 113,478
Purchase obligations (2) - unknown unknown unknown unknown unknown unknown
642,266$ 234,189$ 67,512$ 58,598$ 49,150$ 38,245$ 194,572$
(1) The Fund has the right, at its option, to settle at maturity the convertible debenture obligations either by issuing additional trust units or by payment of cash. On January 5, 2016 the Fund redeemed all of the outstanding 2012 convertible debentures that were due December 31, 2017 by issuing units.
(2) Subject to fulfilling certain conditions such as meeting contractual purchase obligations and no change in control the repayment amount would be nil. Operating Activities
Cash flow generated from operations, before considering working capital changes, was $75.3 million for 2015 compared to $49.0 million in 2014. The increase was due to increased adjusted EBITDA in 2015, resulting from same-store sales growth, as well as from the acquisitions of Collision Revision, Collex, Champ’s, Netcost and Craftmaster and lower acquisition, transaction and process improvement costs offset by higher financing costs and current income tax expense.
In 2015, changes in working capital items provided net cash of $7.1 million compared with providing net cash of $2.2 million in 2014. The higher cash flow from working capital this year was due primarily to higher payroll accruals at the end of 2015. Increases and decreases in accounts receivable, inventory, prepaid expenses, income taxes, accounts payable and accrued liabilities are significantly influenced by timing of collections and expenditures. Financing Activities Cash used in financing activities totalled $23.8 million for the year ended December 31, 2015 compared to cash provided by financing activities of $91.0 million for the prior year. During 2015, cash was used to repay long-term debt on seller notes in the amount of $8.9 million, to repay finance leases in the amount of $5.2 million and to pay distributions to unitholders and dividends to Class A common shareholders totaling $8.2 million. During 2014, cash was provided by draws of long-term debt in the amount of $6.0 million to fund the remaining purchase price associated with Hansen, $13.2 million to fund part of the purchase price associated with Collision Revision, a further $43.1 million to fund the majority of the purchase price of Collex and then $23.1 million to fund the majority of the purchase price of Champ’s. In September 2014, the Fund completed a bought deal equity and convertible debenture offering that also provided net proceeds of $107.7 million. Cash also increased from $2.2 million in proceeds from a sale-leaseback transaction of owned real estate for a facility located in Ontario, Canada. Cash was used to repay the revolving credit facility in the amount of $85.9 million and long-term debt on seller notes in the amount of $5.9 million, to repay finance leases in the amount of $4.0 million and to pay distributions to unitholders and dividends to Class A common shareholders totaling $7.5 million.
24

Debt Financing On July 23, 2015, the Company amended its revolving credit facility, increasing the facility to $150 million U.S. with an accordion feature which can increase the facility to a maximum of $250 million U.S. The facility is with a syndicate of Canadian and U.S. banks and is secured by the shares and assets of the Company as well as by guarantees of the Fund and BGHI. The interest rate is based on a pricing grid of the Fund’s ratio of total funded debt to EBITDA as determined under the credit agreement. The Company can draw the facility in either the U.S or in Canada, in either U.S or Canadian dollars and can be drawn in tranches as required. Tranches bear interest only and are not repayable until the maturity date but can be voluntarily repaid at any time. The Company has the ability to choose the base interest rate between Prime, Bankers Acceptances (“BA”) or London Inter Bank Offer Rate (“LIBOR”). The total syndicated facility includes a swing line up to a maximum of $3.0 million in Canada and $12.0 million in the U.S.
Under the revolving facility Boyd is subject to certain financial covenants which must be maintained to avoid acceleration of the termination of the credit agreement. The financial covenants require the Fund to maintain a total debt to EBITDA ratio of less than 4.25; a senior debt to EBITDA ratio of less than 3.5 up to December 31, 2016 and less than 3.25 thereafter; and a fixed charge coverage ratio of greater than 1.03. For three quarters following a material acquisition, the total debt to EBITDA ratio may be increased to less than 4.75, the senior debt to EBITDA ratio may be increased to less than 4.0 up to December 31, 2016 and increased to less than 3.75 thereafter. The debt calculations exclude the convertible debentures. The Company supplements its debt financing by negotiating with sellers in certain acquisitions to provide financing to the Company in the form of term notes. The notes payable to sellers are typically at favourable interest rates and for terms of five to 15 years. This source of financing is another means of supporting the Fund’s growth, at a relatively low cost. During 2015, the Company entered into one new seller note in the amount of $1.6 million related to the acquisition of Craftmaster. In addition, the Company entered into seller notes totaling $6.4 million related to the acquisition of single shops. During 2014, the Company drew $19.2 million in new seller note debt in association with the acquisition of Collision Revision, $2.2 million related to Netcost, $4.9 million in association with Collex and $4.0 million related to the acquisition of Champ’s. A further $1.2 million of seller notes were issued throughout the year related to single-store acquisitions. The Company repaid seller loans in 2015 totaling approximately $8.9 million (2014 - $5.9 million). The Fund has traditionally used capital leases to finance a portion of both its maintenance and expansion capital expenditures. The Fund expects to continue to use this source of financing where available at competitive interest rates and terms, although this financing also impacts the total leverage capacity covenants under its debt facility. During 2015, $8.0 million (2014 - $2.6 million) of new equipment, technology infrastructure and courtesy cars was financed through capital leases. A significant portion of the increase in 2015 was due to an increase of approximately $3.0 million due to the purchase of specialized aluminum welding equipment. On September 29, 2014, the Fund issued $50.0 million aggregate principal amount of convertible unsecured subordinated debentures due October 31, 2021 with a conversion price of $61.40. Concurrent with the closing, as allowed under provisions of the agreement to issue the Debentures, the Underwriters purchased an additional $7.5 million aggregate principal amount of Debentures increasing the aggregate gross proceeds of the debenture offering to $57.5 million. The Debentures bear interest at an annual rate of 5.25% payable semi-annually, and are convertible at the option of the holder, into units of the Fund at any time prior to the maturity date and may be redeemed by the Fund on or after October 31, 2017 provided that certain thresholds are met for the weighted average market price of the units at that time. On redemption or maturity, the Debentures may, at the option of the Fund, be repaid in cash or subject to regulatory approval, units of the Fund. Upon issuance, the Debentures were bifurcated with $5.1 million related to the conversion feature treated as a financial liability measured at fair value, due to the units of the Fund being redeemable for cash. Transactions costs of $2.8 million were incurred in relation to issuance of the Debentures, which included the underwriter’s fee and other expenses of the offering. On January 5, 2016, the Fund completed the early redemption and cancellation of its 5.75% Convertible Unsecured Subordinated Debentures due December 31, 2017. Subsequent to the initial announcement of the early redemption, $24,012,000 principal amount of the Debentures were converted into 1,026,152 units of the Fund. The remaining $192,000 in Debentures were redeemed and cancelled by issuing 3,000 units.
25

Unitholders’ Capital During 2015, the Fund issued 424,227 units related to the conversion of convertible debentures. This compares to 2,519 units issued in 2014. On August 29, 2014, the Fund issued 4,297 units ($0.2 million U.S.) out of treasury related to the acquisition of a single location in Atlanta, Georgia. On September 29, 2014, the Fund completed a bought deal public offering where it sold to an underwriting syndicate 1,181,000 trust units issued out of treasury at $42.35 per unit for proceeds of $50.0 million before issue costs. Concurrent with the closing, the Underwriters exercised an over-allotment option and purchased an additional 125,000 trust units at the offering price for total gross proceeds of $55.3 million. A portion of the proceeds from this offering and the convertible debenture offering were used to refresh the syndicated debt facility that been drawn to complete the acquisitions during the year. A unitholder is entitled to request the redemption of units at any time, and the Fund is obligated to redeem those units, subject to a cash redemption maximum of $25,000 for any one month. The redemption price is determined as the lower of 90% of the market price during the 10 trading day period commencing immediately after the date of the redemption or 100% of the closing market price on the date of redemption. No amounts were redeemed in either 2015 or 2014. A Class A common shareholder of BGHI can exchange Class A common shares for units of the Fund upon request. The retraction of Class A common shares is achieved by BGHI issuing Class B common shares to the Fund in exchange for units of the Fund, and the units so received being delivered to the Class A shareholder requesting the retraction. For the year ended December 31, 2015, BGHI received requests and retracted 4,875 (2014 – 112,164) Class A common shares, issued 4,875 (2014 – 112,164) Class B common shares to the Fund and received 4,875 (2014 – 112,164) units of the Fund as consideration, which were delivered to the Class A shareholders in respect of the retraction. The Fund sells the Class B shares to the Company in exchange for Notes and Class I shares to fund future distributions on the Trust units. The exchange value is equivalent to the unit value provided to the Class A common shareholder. The Fund anticipates that it will continue to sell any Class B shares of BGHI that it receives as a result of these retractions, to the Company. The holders of the Class A common shares receive cash dividends on a monthly basis at a rate equivalent to the monthly cash distribution paid to unitholders of the Fund.
26

The following chart discloses outstanding unit data of the Fund, including information on all outstanding securities of the Fund and its subsidiaries that are convertible or exchangeable for units of the Fund as of March 22, 2016. Convertible or exchangeable units of the FundAs of March 22, 2016
Units outstanding 18,027,329 18,027,329 18,027,329
Class A common shares of BGHI (1) 225,068 225,068 225,068
Unit options:Date Granted - November 8, 2007 (2) 450,000 450,000 450,000
Convertible debentures (3) 57,500,000$ 936,482 Unknown
19,638,879 Unknown
Maximum # of units to be issued
# or $ amount of securities outstanding
# of units to be issued in conversion or exchange by holder
(1) The Fund is obligated to issue units to BGHI, in exchange for Class B shares of BGHI, upon a request for retraction by the holders of the Class A shares of
BGHI on a 1:1 basis. (2) On November 8, 2007, the Fund granted options to certain key employees allowing them to exercise the right to purchase, in the aggregate, up to 450,000
units of the Fund, such options to purchase up to 150,000 units issued on each of January 2, 2008, 2009 and 2010. The options may be exercised at any time after 9 years and 255 days after the dates on which the options were granted up to and including 9 years and 345 days after such dates. The units shall be purchased, to the extent validly exercised on the 10th anniversary of the respective issue dates. The purchase price per unit under the options issued on each issue date is the greater of the closing price for units on the Toronto Stock Exchange on the option grant date (being $2.70 per unit) and the weighted average trading price of the units on the Toronto Stock Exchange for the first 15 trading days in the month of January of the year in which each issue date falls, being $2.70, $3.14 and $5.41, respectively. The cost of the options is being recognized over the term between the date when unitholder approval is obtained and the date the options become exercisable.
(3) The 2014 convertible debentures are convertible, at the option of the holder, to units of the Fund at any time, at a fixed conversion price of $61.40 per unit. On
and after October 31, 2017, the Fund, through the Company, has the right to settle the principal amount of the debentures at maturity through the issue of units, at then market prices provided that certain thresholds are met surrounding the weighted average market price of the units at that time.
On January 11, 2016, the Fund completed the settlement of the unit options issued on January 11, 2006. As a result of the settlement, 200,000 units were issued at an exercise price of $1.91. The fair value of the unit options at settlement was $12,050. Investing Activities
Cash used in investing activities totaled $52.2 million for the year ended December 31, 2015, compared to $107.0 million used in the prior year. The large investing activity in both years relate primarily to the acquisitions and new location growth that occurred during these periods. Acquisitions and Development of Businesses On January 2, 2015, the Company acquired the assets of Craftmaster, a multi-location collision repair company that operated six locations in the Florida market. Craftmaster was established in 1981 and generated sales of approximately $13.6 million U.S for the trailing twelve months ended August 2014. Total consideration for the transaction of approximately $8.7 million ($7.4 million U.S.) was funded with a combination of cash and seller notes. The Company also completed the acquisition or start-up of 23 other locations during 2015 related to its stated objective of growing by 6 to 10% through acquisition or development of single locations. Subsequent to the end of the quarter, the Company added a further eleven locations and acquired the glass repair assets of Ryan’s Auto Glass in Cincinnati, Ohio. On April 14, 2014, the Company signed a definitive agreement and concurrently completed the acquisition of Dora Holdings, Inc. and Collision Revision 13081 Inc., which collectively owned and operated 25 collision repair centers in Illinois, Indiana and Florida under the trade name "Collision Revision". Total consideration for the transaction of approximately $26.3 million was funded with a combination of cash and a seller take-back note.
27

On May 30, 2014, the Company signed a definitive agreement and concurrently completed the acquisition of Netcost 866netglass LLC, which operated as Netcost Claims Services. Netcost was a third party administrator that offered first notice of loss, glass and related services. Total consideration for the transaction of approximately $3.3 million was funded with a combination of cash and a seller take-back note. On June 6, 2014, the Company signed a definitive agreement and concurrently completed, effective June 2, 2014, the acquisition of Collex Collision Experts Inc. and Collex Collision Experts of Florida Inc. ("Collex"), which owned and operated 16 collision repair centers in Michigan and Florida. Total consideration for the transaction of approximately $49.5 million was funded with a combination of cash and a seller take-back note. On September 12, 2014, the Company signed a definitive agreement and concurrently completed the acquisition of Champ’s, which owned and operated seven collision repair centers in Louisiana. Total consideration for the transaction of approximately $38.5 million was funded with a combination of cash and a seller take-back note. The Fund also completed the acquisition or start-up of 16 other locations during 2014 using a combination of cash and seller notes related to its stated objective of growing by 6 to 10% through acquisition or development of single locations. Start-ups In 2015, the Company commenced operations in 2 new start-up collision repair facilities. The total combined investment in leaseholds and equipment for these facilities was approximately $2.6 million, financed through a combination of cash and finance leases. The Company commenced operations in 5 new start-up collision repair facilities in 2014 with a combined investment of approximately $2.4 million. The Company anticipates it will use similar start-up strategies as part of its continued growth in the future. Capital Expenditures Although most of Boyd’s repair facilities are leased, funds are required to ensure facilities are properly repaired and maintained to ensure the Company’s physical appearance communicates Boyd’s standard of professional service and quality. The Company’s need to maintain its facilities and upgrade or replace equipment, signage, computers, software and courtesy car fleets forms part of the annual cash requirements of the business. The Company manages these expenditures by annually reviewing and determining its capital budget needs and then authorizing major expenditures throughout the year based upon individual business cases. Excluding expenditures related to acquisition and development and those funded through finance leases, the Company spent approximately $9.6 million or 0.8% of sales on sustaining capital expenditures during 2015, compared to $6.3 million or 0.7% of sales during 2014. LEGAL PROCEEDINGS Following the completion of the Collision Revision acquisition, an issue arose with respect to the seller’s arrangements with a third party supplier to the acquired business. During 2015, the matter was settled. As a result of settlement, the working capital accounts receivable balance was written off and an intangible asset was recognized. The settlement did not have a material adverse effect on the Fund’s business. Amounts related to the settlement of this matter are recorded in acquisition, transaction and process improvement costs.
28

RELATED PARTY TRANSACTIONS To broaden and deepen management ownership in the Fund, the Company established the Senior Managers Unit Loan Program (“Unit Loan Program”) in December 2012, which facilitated the one-time purchase of 121,607 of trust units held by Brock Bulbuck, President and Chief Executive Officer, and Tim O’Day, President and Chief Operating Officer US Operations, by existing Boyd trustees and senior managers. Only senior managers were eligible to receive loan support, and only up to 75% of each senior manager’s purchase. The loans bear interest at a fixed rate of 3% per annum with interest payable monthly. Each year, 2% of the original loan amount will be forgiven and applied as a reduction of the loan principal for the first five years of the loan. This forgiveness is conditional on the employee being employed by the Company and the employee not being in default of the loan. Participants are required to make monthly payments equal to .25% of the original principal amount. Beginning March 31, 2013 participants are required to make additional minimum repayments of principal equal to the lesser of 12.5% of their annual pre-tax bonus or 12.5% of the original loan amount. Participants are required to repay the loan in full on the earlier of termination of employment, the sale of the units, or ten years from the date of loan issuance. The loan can be repaid at any time without penalty; however, the 2% future annual forgiveness would be forfeited. Units purchased are held by the Company as security for repayment of the loan. Pursuant to the conditions of the senior manager unit loan program, loan repayments by senior managers amounted to $0.2 million for 2015 (2014 - $0.2 million). At December 31, 2015, the carrying value of loans made under the Unit Loan Program included in Note receivable was $0.5 million (2014 - $0.7 million). In certain circumstances the Company has entered into property lease arrangements where an employee of the Company is the landlord. The property leases for these locations do not contain any significant non-standard terms and conditions that would not normally exist in an arm’s length relationship, and the Fund has determined that the terms and conditions of the leases are representative of fair market rent values. The following are the lease expense amounts for facilities currently under lease with related parties:
Lease December 31, December 31,Landlord Affiliated Person(s) Location Expires 2015 2014
3577997 Manitoba Inc. Brock Bulbuck Selkirk, MB 2027 $ 0.1 million $ 0.1 million
Gerber Building No. 1 Ptnrp Eddie Cheskis & Tim O'Day
South Elgin, IL 2018 $ 0.1 million $ 0.1 million
The Fund’s subsidiary, The Boyd Group Inc., has declared dividends totaling $53 thousand (2014 - $76 thousand), through BGHI to 4612094 Manitoba Inc., an entity controlled by a senior officer of the Fund. At December 31, 2015, 4612094 Manitoba Inc. owned 107,329 Class A common shares and 30,000,000 voting common shares of BGHI, representing approximately 30% of the total voting shares of BGHI. During 2014, 4612094 Manitoba Inc. retracted 100,000 Class A exchangeable shares of BGHI and received 100,000 units of the Fund. On January 11, 2016, the Fund completed the settlement of the unit options issued on January 11, 2006. As a result of the settlement 200,000 units were issued at an exercise price of $1.91. The fair value of the unit options at settlement was approximately $12 million. FOURTH QUARTER Sales for the three months ended December 31, 2015 totaled $312.5 million, an increase of $72.9 million or 30.4% compared to the same period in 2014. Overall same-store sales excluding foreign exchange increased $14.2 million, or 6.0% in the fourth quarter of 2015 when compared to the fourth quarter of 2014 and increased $40.4 million due to the translation of same-store sales at a higher U.S. dollar exchange rate. Sales growth of $19.4 million was attributable to the acquisitions of Craftmaster as well as 28 new single collision repair centers. The closure of under-performing facilities accounted for a decrease in sales of $1.1 million. Gross Margin for the fourth quarter decreased to 45.3% from 45.7% last year. The gross margin percentage decreased when compared with the prior period due mainly to the impact of a higher mix of parts sales in relation to labour sales.
29

Adjusted EBITDA for the fourth quarter of 2015 totaled $28.6 million or 9.1% of sales compared to Adjusted EBITDA of $19.0 million or 7.9% of sales in the same period of the prior year. Adjusted EBITDA for 2015 benefited from same-store sales increases as well as the addition of new locations and the translation of U.S. results to Canadian dollars. The increase as a percentage of sales was primarily the result of higher same-store sales leveraging the fixed component of operating expenses, combined with the benefit of some expense accrual reductions as certain expense estimates changed or were firmed up at amounts that were lower than previously estimated and accrued. These expense reductions included workers compensation expenses, advertising expenses and telecommunication costs. Current and Deferred Income Tax Expense of $5.5 million in 2015 compared to an expense of $3.0 million in 2014. Net Loss for the fourth quarter, was a loss of $2.7 million or $0.16 per fully diluted unit compared to a loss of $10.8 million or $0.66 per fully diluted unit for the same period in the prior year. The losses for both 2015 and 2014 were primarily the result of recording fair value adjustments for exchangeable shares, unit options, convertible debenture conversion features, non-controlling interest put option adjustment as well as the recording of acquisition, transaction and process improvement costs and the amortization of acquired brand names. Excluding these impacts, adjusted net earnings for the fourth quarter was $10.5 million or $0.63 per unit compared to adjusted net earnings of $7.4 million or $0.45 per unit for the same period in the prior year. The increase in adjusted net earnings of $3.1 million is the result of higher Adjusted EBITDA partly offset by higher depreciation, amortization, finance costs and income taxes. Standardized Distributable Cash for the fourth quarter increased to $27.0 million from $7.1 million for the same period in 2014. Adjusted distributable cash for the fourth quarter increased to $26.4 million from $6.6 million for the same period a year ago, representing a payout ratio of 8.0% for 2015 compared to 30.3% for the same period last year. The increase in distributable cash is primarily the result of higher Adjusted EBITDA levels as well as cash provided by working capital items in the fourth quarter of 2015 when compared to the fourth quarter of 2014. FINANCIAL INSTRUMENTS In order to limit the variability of earnings due to the foreign exchange translation exposure on the income and expenses of the U.S. operations, the Company will at times enter into foreign exchange contracts. These contracts are marked to market monthly with unrealized gains and losses included in earnings. The Company did not have any such contract in place during 2015 or 2014. Transactional foreign currency risk also exists in limited circumstances where U.S. denominated cash is received in Canada. The Company monitors U.S. denominated cash flows to be received in Canada and evaluates whether to use forward foreign exchange contracts. No such foreign exchange contracts were used during 2015 or 2014.
30

CRITICAL ACCOUNTING ESTIMATES The preparation of financial statements that present fairly the financial position, financial condition and results of operations requires that the Fund make estimates and assumptions that affect the reported amounts of assets and liabilities, the disclosure of contingent assets and liabilities at the balance sheet date and reported amounts of revenues and expenses during the reporting period. Actual results could differ materially from these estimates. The following is a summary of critical accounting estimates and assumptions that the Fund believes could materially impact its financial position, financial condition or results of operations: Impairment of Non-Financial Assets When testing goodwill and intangibles for impairment, the Fund uses the recorded historical cash flows of the cash generating unit (“CGU”) for the most recent two years, and an estimate or forecast of cash flows for the next year to establish an estimate of the Fund’s future cash flows. An estimate of the recoverable amount is then calculated as the higher of an asset’s fair value less costs to sell and value in use (being the present value of the expected future cash flows of the relevant asset or CGU). An impairment loss is recognized for the amount by which the asset’s carrying amount exceeds its recoverable amount. The methods used to value intangible assets and goodwill require critical estimates to be made regarding the future cash flows and useful lives of the intangible assets. Goodwill and intangible asset write downs, when recognized, are recorded as a separate charge to earnings (loss), and could materially impact the operating results of the Fund for any particular accounting period. Impairment of Other Long-lived Assets The Fund periodically assesses the recoverability of values assigned to long-lived assets, other than goodwill and intangibles, after considering the potential impairment indicated by such factors as business and market trends, the Fund’s ability to transfer the assets, future prospects, current market value and other economic factors. In performing its review of recoverability, management estimates the future cash flows expected to result from the use of the assets and their potential disposition. If the discounted sum of the expected future cash flows is less than the carrying value of the assets generating those cash flows, an impairment loss would be recognized based on the excess of the carrying amounts of the assets over their estimated recoverable value. The underlying estimates for cash flows include estimates for future sales, gross margin rates and operating expenses. Changes which may impact these estimates include, but are not limited to, business risks and uncertainties and economic conditions. To the extent that management’s estimates are not realized, future assessments could result in impairment charges that may have a material impact on the Fund’s consolidated financial statements. Fair Value of Financial Instruments The Fund has applied discounted cash flow methods to establish the fair value and carrying values of certain financial liabilities recorded on the statement of financial position, as well as disclosed in the notes to the financial statements. The Fund also establishes mark-to-market valuations for derivative instruments, which are assumed to represent the current fair value of these instruments. These valuations rely on assumptions regarding future interest and exchange rates as well as other economic indicators, which at the time of establishing the fair value for disclosure, have a high degree of uncertainty. Unrealized gains or losses on these derivative financial instruments may not be realized as markets change. Income Taxes The Fund is subject to income tax in several jurisdictions and significant estimates are used to determine the provision for income taxes. During the ordinary course of business, there are transactions and calculations for which the ultimate tax determination is uncertain. The company believes that its accruals for tax liabilities are adequate for all open audit years based on its assessment of many factors including past experience and interpretations of tax law. To the extent that the final tax outcome is different than the amounts recorded, such differences will impact income tax expense in the period in which such determination is made.
31

FUTURE ACCOUNTING STANDARDS The following is an overview of accounting standard changes that the Fund will be required to adopt in future years: IFRS 15, Revenue from Contracts with Customers, was issued by the International Accounting Standards Board (“IASB”) on May 28, 2014 and will replace current guidance found in IAS 11, Construction Contracts and IAS 18, Revenue. IFRS 15 outlines a single comprehensive model to use in accounting for revenue arising from contracts with customers. On July 22, 2015, the IASB announced a deferral in the effective date for this standard. The standard is effective for reporting periods beginning on or after January 1, 2018 with early application permitted. A choice of retrospective application or a modified transition approach is provided. The Fund is currently evaluating the impact of adopting IFRS 15 on its financial statements. IFRS 9, Financial Instruments, was issued by the IASB on July 24, 2014 and will replace current guidance found in IAS 39, Financial Instruments: Recognition and Measurement. IFRS 9 includes a logical model for classification and measurement, a single, forward-looking ‘expected loss’ impairment model and a substantially-reformed approach to hedge accounting. The new standard will come into effect on January 1, 2018 with early application permitted. The Fund is currently evaluating the impact of adopting IFRS 9 on its financial statements. IFRS 16, Leases, was issued by the IASB on January 13, 2016 and will replace the current guidance found in IAS 17, Leases and related interpretations. The new standard will bring most leases on-balance sheet through recognition of related assets and liabilities. IFRS 16 establishes principles for recognition, measurement, presentation and disclosure of leases. The new standard will come into effect on January 1, 2019 with early application permitted if IFRS 15, Revenue from Contracts with Customers has also been applied. The Fund is currently evaluating the impact of adopting IFRS 16 on its financial statements. CERTIFICATION OF DISCLOSURE CONTROLS Management’s responsibility for financial information contained in this Annual Report is described on page 47. In addition, the Fund’s Audit Committee of the Board of Trustees has reviewed this Annual Report, and the Board of Trustees has reviewed and approved this Annual Report prior to its release. The Fund is committed to providing timely, accurate and balanced disclosure of all material information about the Fund and to providing fair and equal access to such information. As of December 31, 2015, the Fund’s management evaluated the effectiveness of the design and operation of its disclosure controls and procedures, as defined under the rules adopted by the Canadian securities regulatory authorities. Disclosure controls are procedures designed to ensure that information required to be disclosed in reports filed with securities regulatory authorities is recorded, processed, summarized and reported on a timely basis, and is accumulated and communicated to the Fund’s management, including the CEO and the CFO, as appropriate, to allow timely decisions regarding required disclosure. The Fund’s management, including the CEO and the CFO, does not expect that the Fund’s disclosure controls will prevent or detect all misstatements due to error or fraud. Because of the inherent limitations in all control systems, an evaluation of controls can provide only reasonable, not absolute assurance, that all control issues and instances of fraud or error, if any, within the Fund have been detected. The Fund is continually evolving and enhancing its systems of controls and procedures. Based on the evaluation of disclosure controls, the CEO and the CFO have concluded that, subject to the inherent limitations noted above, the Fund’s disclosure controls are effective in ensuring that material information relating to the Fund is made known to management on a timely basis, and is fairly presented in all material respects in this Annual Report.
32

CERTIFICATION ON INTERNAL CONTROL OVER FINANCIAL REPORTING Management is responsible for the design and effectiveness of internal control over financial reporting in order to provide reasonable assurance regarding the reliability of financial reporting and the preparation of financial statements for external purposes in accordance with Canadian generally accepted accounting principles which incorporates International Financial Reporting Standards for publicly accountable enterprises. The Fund’s management, including the CEO and the CFO, does not expect that the Fund’s internal control over financial reporting will prevent or detect all misstatements due to error or fraud. Because of the inherent limitations in all control systems, an evaluation of controls can provide only reasonable, not absolute assurance, that all control issues and instances of fraud or error, if any, within the Fund have been detected. The Fund is continually evolving and enhancing its systems of internal controls over financial reporting. The CEO and CFO of the Fund have evaluated the design and effectiveness of the Fund’s internal control over financial reporting as at the end of the period covered by the annual filings and have concluded that, subject to the inherent limitations noted above, the controls are sufficient to provide reasonable assurance. In addition, during the fourth quarter of 2015, there have been no changes in the Fund’s internal control over financial reporting that have materially affected, or are reasonably likely to materially affect, the Fund’s internal control over financial reporting. BUSINESS RISKS AND UNCERTAINTIES The following information is a summary of certain risk factors relating to the business of the Fund and Boyd, and is qualified in its entirety by reference to, and must be read in conjunction with, the detailed information appearing elsewhere in this Annual Report and the documents incorporated by reference herein. The Fund and the Company are subject to certain risks inherent in the operation of the business. The Fund manages risk and risk exposures through a combination of management oversight, insurance, its system of internal controls and disclosures and sound operating policies and practices. The Board of Trustees has the responsibility to identify the principal risks of the Fund’s business and ensure that appropriate systems are in place to manage these risks. The Audit Committee has the responsibility to discuss with management the Fund's major financial risk exposures and the steps management has taken to monitor and control such exposures, including the Fund's risk assessment and risk management policies. In order to support these responsibilities, management has a risk management committee which meets on an ongoing basis to evaluate and assess the Fund’s risks. The process being followed by the management risk committee is a systematic one which includes identifying risks; analyzing the likelihood and consequence of risks; and then evaluating risks as to risk tolerance and control effectiveness. This approach stratifies risks into four risk categories as follows: Extreme Risks: Immediate/ongoing action is required – involvement of senior management is required. Avoidance of
the item may be necessary if risk reduction techniques are insufficient to address the risk. High Risks: Risk item is significant and management responsibility should be specified and appropriate action
taken. Moderate Risks: Managed by specific monitoring or response procedures. Additional risk mitigation techniques could
be considered if benefits exceed the cost. Low Risks: Managed by routine procedures. No further action is required at this time. Risks can be reduced by limiting the likelihood or the consequence of a particular risk. This can be achieved by adjusting the Company’s activities, implementing additional control/monitoring processes, or insuring/ hedging against certain outcomes. Residual risk remains after mitigation and control techniques are applied to an identified risk. Awareness of the residual risk that the Fund ultimately accepts is a key benefit of the risk management process. The following describes the risks that are most material to the Fund’s business; however, this is not a complete list of the potential risks the Fund faces. There may be other risks that the Fund is not aware of, or risks that are not material today that could become material in the future.
33

Dependence on The Boyd Group Inc. and its Subsidiaries The Fund is an unincorporated open-ended, limited purpose mutual fund trust which is entirely dependent upon the operations and assets of the Company through the Fund’s ownership of the Notes, Class I and Class IV shares of the Company. Accordingly, the Fund’s ability to make cash distributions to the unitholders will be dependent upon the ability of the Company and its subsidiaries to pay its interest and principle obligations under the Notes and to declare dividends, return capital, or make other distributions. Operational Performance In order to compete in the market place, the Company must consistently meet the operational performance metrics expected by its insurance company clients and its customers. Failing to deliver on metrics such as cycle time, quality of repair, customer satisfaction and cost of repair can, over time, result in reductions to pricing, repair volumes, or both. The Company has implemented processes as well as measuring and monitoring systems to assist it in delivering on these key metrics. However, there can be no assurance that the Company will be able to continue to deliver on these metrics or that the metrics themselves will not change in the future. Acquisition Risk The Company plans to continue to increase revenues and earnings through the acquisition of additional collision repair facilities and other businesses. The Company follows a detailed process of due diligence and approvals to limit the possibility of acquiring a non-performing location or business. However, there can be no assurance that the Company will be able to find suitable acquisition targets at acceptable pricing levels or that the locations acquired will achieve sales and profitability levels to justify the Company’s investment. Boyd views the United States and Canada as having significant potential for further expansion of its business. There can be no assurance that any market for the Company’s services and products will develop either at the local, regional or national level. Economic instability, laws and regulations, increasing acquisition valuations and the presence of competition in all or certain jurisdictions may limit the Company’s ability to successfully expand operations. The Company has grown rapidly since 2009, through multi-location acquisitions as well as single location growth opportunities. Rapid growth can put a strain on managerial, operational, financial, human and other resources. Risks related to rapid growth include administrative and operational challenges such as the management of an expanded number of locations, the assimilation of financial reporting systems, technology and other systems of acquired companies, increased pressure on senior management and increased demand on systems and internal controls. The ability of the Company to manage its operations and expansion effectively depends on the continued development and implementation of plans, systems and controls that meet its operational, financial and management needs. If Boyd is unable to continue to develop and implement these plans, systems or controls or otherwise manage its operations and growth effectively, the Company will be unable to maintain or increase margins or achieve sustained profitability, and the business could be harmed. A key element of the Company’s strategy is to successfully integrate acquired businesses in order to sustain and enhance profitability. There can be no assurance that the Company will be able to profitably integrate and manage additional repair facilities. Successful integration can depend upon a number of factors, including the ability to maintain and grow DRP relationships, the ability to retain and motivate certain key management and staff, retaining and leveraging client and supplier relationships and implementing standardized procedures and best practices. In the event that any significant acquisition cannot be successfully integrated into Boyd’s operations or performs below expectations, the business could be materially and adversely affected. To the extent that the prior owners of businesses acquired by Boyd failed to comply with or otherwise violated applicable laws, the Company, as the successor owner, may be financially responsible for these violations and any associated undisclosed liability. The Company seeks, through systematic investigation and due diligence, and through indemnification by former owners, to minimize the risk of material undisclosed liabilities associated with acquisitions. The discovery of any material liabilities, including but not limited to tax, legal and environmental liabilities, could have a material adverse effect on the Company’s business, financial condition and future prospects.
34

Employee Relations and Staffing Boyd currently employs approximately 5,922 people, of which 538 are in Canada and 5,384 are in the U.S. The current work force is not unionized, except for approximately 38 employees located in the U.S. who are subject to collective bargaining agreements. The automobile collision repair industry typically experiences high employee turnover rates. A shortage of qualified employees can impact the volume and pace at which collision repair shops can fix damaged vehicles. Although the Company believes that it is on good terms with its employees, there are no assurances that a disruption in service would not occur as a result of employee unrest or employee turnover. There is no guarantee that a significant work disruption or the inability to maintain, replace or grow staff levels would not have a material effect on the Company. Foreign Currency Risk In the past, the Company has financed acquisitions of U.S. businesses in part by making U.S. denominated loans available under its credit facilities that could then be serviced and repaid from anticipated future U.S. earnings streams. Although this natural hedging strategy is partially effective in mitigating future foreign currency risks, a substantial portion of Boyd’s revenue and cash flow are now, and are expected to continue to be, generated in U.S. dollars. Fluctuations in exchange rates between the Canadian dollar and the U.S. currency may have a material adverse effect on the Company’s reported earnings and cash flows and its ability to make future Canadian dollar cash distributions. Fluctuations in the exchange rates between the Canadian dollar and the U.S. currency may also have a material adverse effect on the Fund’s unit price. There can be no assurance that fluctuations in the U.S dollar relative to the Canadian dollar can be hedged effectively for long periods of time and there can be no assurances given that any currency hedges or partial hedges in place would remain effective in the future. Loss of Key Customers A high percentage of the Company’s revenues are derived from insurance companies. Over the past 25+ years, many private insurance companies have implemented DRP’s with collision repair operators who have been recognized as consistent high quality, performance based repairers in the industry. The Company’s ability to continue to grow its business, as well as maintain existing business volume and pricing, is largely reliant on its ability to maintain these DRP relationships. The Company continues to develop and monitor these relationships through ongoing measurement of the success factors considered critical by insurance clients. The loss of any existing material DRP relationship could have a material adverse effect on Boyd’s operations and business prospects. Of the top five non-government owned insurance companies that the Company deals with, which in aggregate account for approximately 49% (2014 – 47%) of total sales, one insurance company represents approximately 15% (2014 – 16%) of the Company’s total sales, while a second insurance company represents approximately 14% (2014 – 15%). DRP relationships are governed by agreements that are usually cancellable upon short notice. These relationships can change quickly, both in terms of pricing and volumes, depending upon collision repair shop performance, cycle time, cost of repair, customer satisfaction, competition, insurance company management, program changes and general economic activity. To mitigate this risk, management fosters close working relationships with its insurance company clients and customers and the Company continually seeks to diversify and grow its client base both in Canada and the U.S. There can be no assurance given that relationships with insurance company clients will not change in the future, which could impair Boyd’s revenues and result in a material adverse effect on the Company’s business. Decline in Number of Insurance Claims The automobile collision repair industry is dependent on the number of accidents which occur and, for the most part, become repairable insurance claims. The volume of accidents and related insurance claims can be significantly impacted by changes in technology such as collision avoidance systems, driverless vehicles and other safety improvements made to vehicles. Other changes which have and can continue to affect insurance claim volumes include, but are not limited to, general economic conditions, unemployment rates, changing demographics, vehicle miles driven, new vehicle production, insurance policy deductibles, auto insurance premiums, photo radar and graduated licensing. In addition, repairable claims volumes have been and can continue to be impacted by an increased number of non-repairable claims or “write-offs”. There can be no assurance that a significant decline in insurance claims will not occur, which could impair Boyd’s revenues and result in a material adverse affect on the Company’s business.
35

Brand Management and Reputation The Company’s success is impacted by its ability to protect, maintain and enhance the value of its brands and reputation. Brand value and reputation can be damaged by isolated incidents, particularly if the incident receives considerable publicity or if it draws litigation. Incidents may occur from events beyond the Company’s control or may be isolated to actions that occur in one particular location. Demand for the Company’s services could diminish significantly if an incident or other matter damages its brand or erodes the confidence of its insurance company clients or directly with the vehicle owners themselves. With the advent of the Internet and the evolution of social media there is an increased ability for individuals to adversely affect the brand and reputation of the Company. There can be no assurance that past or future incidents will not negatively affect the Company’s brand or reputation. Margin Pressure The Company’s costs to repair vehicles, including the cost of parts, materials and labour are market driven and can fluctuate either suddenly or over time. Increasing vehicle complexity due to advances in technology may also increase the cost associated with vehicle repair. The Company is not always able to pass these cost increases on to end users in the form of higher selling prices to its customers and/or its insurance company clients. As a result, there can be no assurance that increases in the costs to repair vehicles will ultimately be recoverable from its insurance company clients and customers. While negotiations with insurance companies and other influencing factors over time can result in selling price increases, the timing and extent of such increases is not determinable. As a result, there can be no assurance that increases in the costs to repair vehicles will ultimately be recoverable from the Company’s clients or customers. The Company’s margin is impacted by the mix of collision repair, retail glass and glass network sales as well as the mix of parts, labour and materials within each business area. There can be no assurance that changes to sales mix will not occur that could negatively impact the financial performance of the Company. Market Environment Change The collision repair industry is subject to continual change in terms of regulations, technology, repair processes and changes in the strategic direction of clients, suppliers and competitors. The Company endeavors to stay abreast of developments in the industry and make strategic decisions to manage through these changes. In certain situations, the Company is involved in leading change by anticipating or developing new methods to address changing market needs. The Company however, may not be able to correctly anticipate the need for change or may not effectively implement changes to maintain or improve its relative position with competitors. There can be no assurance that market environment changes will not occur that could negatively affect the financial performance of the Company. Reliance on Technology As is the case with most businesses in today’s environment, there is a risk associated with Boyd’s reliance on computerized operational and reporting systems. Boyd makes reasonable efforts to ensure that back-up systems and redundancies are in place and functioning appropriately. Boyd has disaster recovery programs to protect against significant system failures. Although a computer system failure would not be expected to critically damage the Company in the long term, there can be no assurance that a computer system crash or like event would not have a material impact on its financial results. Reliance on technology in order to gain or maintain competitive advantage is becoming more significant and therefore the Company is faced with determining the appropriate level of investment in new technology in order to be competitive. There can be no assurance that the Company will correctly identify or successfully implement the appropriate technologies for its operations. Weather Conditions The effect of weather conditions on collision repair volume represents an element of risk to the Company’s ability to maintain sales. Historically, extremely mild winters and dry weather conditions have had a negative impact on collision repair sales volumes. Even with market share gains, this type of weather related decline in market size can result in sales declines which could have a material impact on the Company’s business.
36

Low Capture Rates Sales growth can be enhanced if the Company is effective at booking repair orders for all sales opportunities that are identified. The Company is exposed to missed jobs to the extent employees are ineffective at capturing all sales opportunities. Measurement of capture rates, management support and training are methods that are employed to enhance capture rates. However, it is possible that the Company may not be able to capture sales effectively enough to maximize sales. Competition The collision repair industry in North America, estimated at approximately $30 to $40 billion U.S. is very competitive. The main competitive factors are price, service, quality, customer satisfaction and adherence to various insurance company processes and performance requirements. There can be no assurance that Boyd’s competitors will not achieve greater market acceptance due to pricing or other factors. Although competition exists mainly on a regional basis, Boyd competes with a small number of other multi-location collision repair operators in multiple markets in which it operates. Given these industry characteristics, existing or new competitors may become significantly larger and have greater financial and marketing resources than Boyd. These competitors may compete with Boyd in rendering services in the markets in which Boyd currently operates and also in seeking existing facilities to acquire, or new locations to open, in markets in which Boyd desires to expand. There can be no assurance that the Company will be able to maintain or achieve its desired market share. Access to Capital The Company grows, in part, through future acquisitions or start-up of collision and glass repair and replacement businesses. There can be no assurance that Boyd will have sufficient capital resources available to implement its growth strategy. Inability to raise new capital, in the form of debt or equity, could limit Boyd’s future growth through acquisition or start-up. The Company will endeavour, through a variety of strategies, to ensure in advance that it has sufficient capital for growth. Potential sources of capital that the Company has been successful at accessing in the past include public and private equity placements, convertible debt offerings, using equity securities to directly pay for a portion of acquisitions, capital available through strategic alliances with trading partners, capital lease financing, seller financing and both senior and subordinate debt facilities or by deferring possible future purchase price payments using contingent consideration and call or put options. There can be no assurance that the Company will be successful in accessing these or other sources of capital in the future. The Company and its subsidiaries use financial leverage through the use of debt, which have debt service obligations. The Company’s ability to refinance or to make scheduled payments of interest or principal on its indebtedness will depend on its future operating performance and cash flow, which are subject to prevailing economic conditions, prevailing interest rates, and financial, competitive, business and other factors, many of which are beyond its control. The Company’s revolving credit facilities contain restrictive covenants that limit the discretion of the Company’s management and the ability of the Company to incur additional indebtedness, to make acquisitions of collision repair businesses, to create liens or other encumbrances, to pay dividends and fund distributions, to redeem any equity or debt, or to make investments, capital expenditures, loans or guarantees and to sell or otherwise dispose of assets and merge or consolidate with another entity. In addition, the revolving credit facilities contain a number of financial covenants that require the Fund and its subsidiaries to meet certain financial ratios and financial condition tests. A failure to comply with the obligations under these credit facilities could result in an event of default, which, if not cured or waived, could permit acceleration of the relevant indebtedness. If the indebtedness were to be accelerated, there can be no assurance that the assets of the Company and its subsidiaries would be sufficient to repay the indebtedness in full. There can also be no assurance that the Company will be able to refinance the credit facilities as and when they mature. The revolving credit facility is secured by the assets of the Company.
37

Dependence on Key Personnel The success of the Company is dependent on the services of a number of members of management. The experience and talent of these individuals is a significant factor in Boyd’s continued success and growth. The loss of one or more of these individuals could have a material adverse effect on the Company’s business operations and prospects. The Company has entered into management agreements with key members of management in order to mitigate this risk. Tax Position Risk The Fund and its subsidiaries account for income tax positions in accordance with accounting standards for income taxes, which require that that the Company recognize in the financial statements, the impact of a tax position, if that position is more likely than not of being sustained on examination by taxation authorities, based on the technical merits of the position.
Inherent risks and uncertainties can arise over tax positions taken, or expected to be taken, with respect to matters including but not limited to acquisitions, transfer pricing, inter-company charges and allocations, financing charges, fees, related party transactions, tax credits, tax based incentives and stock based transactions. Management uses tax experts to assist the Fund in correctly applying and accounting for the tax rules, however there can be no assurance that a position taken will not be challenged by the taxation authorities that could result in an unexpected material financial obligation. Expenses incurred by the Fund are only deductible to the extent they are reasonable. There can be no assurance that the taxation authorities will not challenge the reasonableness of certain expenses. If such a challenge were successful against the Fund, it may materially and adversely affect the distributable cash flow of the Fund. Management of the Fund believes the expenses inherent in the structure of the Fund are supportable and reasonable in the circumstances. The Units will cease to be qualified investments for a Registered Plan under the Tax Act unless the Units are listed on a “designated stock exchange” (as defined in the Tax Act) or the Company qualifies as a “mutual fund trust” (as defined in the Tax Act). Securities received from the Company as a result of a redemption of Units may not be qualified investments for a Registered Plan, which may result in adverse tax consequences for the Registered Plan and the annuitant under, or the holder of, the Registered Plan. There can be no assurance that additional changes to the taxation of income trust or corporations or changes to other government laws, rules and regulations, either in Canada or the U.S., will not be undertaken which could have a material adverse effect on the Fund’s unit price and business. There can be no assurance the Fund will benefit from these rules, that the rules will not change in the future or that the Fund will avail itself of them. Quality of Corporate Governance Securities law imposes statutory civil liability for misrepresentations in continuous disclosure documents including failure to make timely disclosure. Investors have a right of action if they are harmed by a misrepresentation in an issuer’s disclosure document or in a public oral statement relating to an issuer, or the failure of an issuer to make timely disclosure of a material change. Potentially liable parties include the issuer, each officer or Trustee of the issuer who authorizes, permits or acquiesces in the release of the document containing a misrepresentation, the making of the public statement containing a misrepresentation or in the failure to make a timely disclosure. Under the Ontario Securities Act, section 138.4(6), a due diligence defense is available. The due diligence defense requires the following items to be addressed: • the issuer must have a system designed to ensure the issuer is meeting its disclosure obligations; • the defendant must have conducted a reasonable investigation to support reliance on the system; and • defendants must have no reasonable grounds to believe that the document or a public oral statement contained a
misrepresentation or that the failure to make the required disclosure would occur. The Fund is keenly aware of the significance of these laws and the interrelationships between civil liability, disclosure controls and good governance. The Fund has adopted policies, practices and processes to reduce the risk of a governance or control breakdown. A statement of the Fund’s governance practices is included in the Fund’s most recent information circular which can be found at www.sedar.com. Although the Fund believes it follows good corporate governance practices, there can be no assurance that these practices will eliminate or mitigate the impact of a material lawsuit in this area.
38

Economic Downturn Historically the auto collision repair industry has proven to be resilient to economic downturns along with the accompanying unemployment, and while the Company works to mitigate the effect of economic downturn on its operations, economic conditions, which are beyond the Company’s control, could lead to a decrease in accident repair claims volumes due to fewer miles driven or due to vehicle owners being less inclined to have their vehicles repaired. It is difficult to predict the severity and the duration of any decrease in claims volumes resulting from an economic downturn and the accompanying unemployment and what affect it may have on the auto collision repair industry, in general, and the financial performance of the Company in particular. There can be no assurance that an economic downturn would not negatively affect the financial performance of the Company. Increased Government Regulation and Tax Risk The Fund, the Company and its subsidiaries are subject to various federal, provincial, state and local laws, regulations and taxation authorities. Various federal, provincial, state and local agencies as well as other governmental departments administer such laws, regulations and their related rules and policies. New laws governing the Fund or its business could be enacted or changes or amendments to existing laws and regulations could be enacted which could have a significant impact on Boyd. The Fund utilizes the services of professional advisors in the areas of taxation, environmental, health and safety, labour and general business law to mitigate the risk of non-compliance. Failure by the Fund to comply with the applicable laws, regulations or tax changes may subject it to civil or regulatory proceedings and no assurance can be given that this will not have a material impact on the Fund or its financial results. Canada, Maryland, Delaware and urban centers in Utah and California have regulations to limit emissions pollutants used in a number of consumer and commercial products including automotive paint and coatings. As a result, the automobile collision repair industry in those regions has adapted their refinish processes and equipment to waterborne basecoat technology. The Company also converts all new U.S. operations to waterborne basecoat technology and has converted all new locations since August 2009. Although to date, there have been no negative consequences to this conversion there can be no assurance that conversion to this new technology or compliance with legislation will not have a material adverse affect on the Fund’s business or financial results. The Fund has investigated and evaluated its structuring alternatives in connection with the Specified Investment Flow-through (“SIFT”) rules with a view of preserving and maximizing unitholder value. Based upon its investigation, analysis and due diligence to date, and given its current size and circumstances, the Fund has determined that a change to a share corporation structure would not be advantageous to the Fund or its unitholders. This determination has been made based on several reasons. First, the Fund does not believe it will achieve any net tax savings by converting. Second, the Fund believes that the cost of conversion, which it estimates to be between $500,000 and $1 million, is not a prudent use of cash and is not justified by any perceived benefits from conversion for a fund of its size. Third, to the extent that the Fund pays SIFT tax it believes that its taxable unitholders will benefit from the lower tax rate on distributions received, as it expects to be able to maintain distributions, despite any trust tax that the Fund would incur. On December 15, 2010 the Trustees of the Fund approved an internal capital restructuring plan that better reflects its significant U.S. base of business and its expected source of future growth. A consequence of this restructuring is that distributions to unitholders are funded almost entirely by its U.S. operations. Fund distributions that are sourced from U.S. business earnings are not subject to the SIFT tax. There can be no assurance that additional changes to the taxation of income trusts or corporations or changes to other government laws, rules and regulations, either in Canada or the U.S., will not be undertaken which could have a material adverse effect on the Fund’s unit price and business. There can be no assurance that the Fund will benefit from these rules, that the rules will not change in the future or that the Fund will avail itself of them. Interest Rates The Company occasionally fixes the interest rate on its debt using interest rate swap contracts or other provisions available in its debt facilities. There can be no guarantee that interest rate swaps or other contract terms that effectively turn variable rate debt into fixed rates will be an effective hedge against long term interest rate fluctuations. The Company has not fixed interest rates within its revolving credit facility. There can be no assurance that interest rates either in Canada or the U.S. will not increase in the future, which could result in a material adverse effect on the Company’s business.
39

Environmental, Health and Safety Risk The nature of the collision repair business means that hazardous substances must be used, which could cause damage to the environment or individuals if not handled properly. The Company’s environmental protection policy requires environmental site assessments to be performed on all business locations prior to acquisition, start-up or relocation so that any existing or potential environmental situations can be remedied or otherwise appropriately addressed. It is also Boyd’s practice to secure environmental indemnification from landlords and former owners of acquired collision repair businesses, where such indemnification is available. Boyd also engages a private environmental consulting firm to perform regular compliance reviews to ensure that the Company’s environmental and health and safety policies are followed. To date, the Company has not encountered any environmental protection requirements or issues which would be expected to have a material financial or operational effect on its current business and it is not aware of any material environmental issues that could have a material impact on future results or prospects. No assurance can be given, however, that the prior activities of Boyd, or its predecessors, or the activities of a prior owner or lessee, have not created a material environmental problem or that future uses will not result in the imposition of material environmental, health or safety liability upon Boyd. Fluctuations in Operating Results and Seasonality The Company’s operating results have been and are expected to continue to be subject to quarterly fluctuations due to a variety of factors including changes in customer purchasing patterns, pricing paid to insurance companies, general operating effectiveness, automobile technologies, general and regional economic downturns, unemployment rates and weather conditions. These factors can affect Boyd’s ability to fund ongoing operations and finance future activities. U.S. Health Care Costs and Workers Compensation Claims The Fund accrues for the estimated amount of U.S. health care claims and workers compensation claims that may have occurred but were not reported at the end of the reporting period under its health care and workers compensation plans. The accruals are based upon the Company’s knowledge of current claims as well as third party estimates derived from past experience. Significant claim occurrences which remain unreported for a number of months could materially impact this accrual. In addition, as U.S health care costs increase, there can be no assurance given that the Company can continue to offer health care insurance to its employees at a reasonable cost. Energy Costs The Company is exposed to fluctuations in the price of energy. These costs not only impact the costs associated with occupying and operating collision repair facilities but may also affect costs of parts and materials used in the repair process as well as miles driven by automobile owners. There can be no assurance that escalating costs which cannot be offset by energy conservation practices, price increases to clients and customers or productivity gains, would not result in materially lower operating margins. As well, there can be no assurance that escalating energy costs will not materially reduce automobile miles driven and in turn reduce the number of collisions. Risk of Litigation The Fund and its subsidiaries could become involved in various legal actions in the ordinary course of business. Litigation loss accruals may be established if it becomes probable that the Fund will incur an expense and the amount can be reasonably estimated. The Fund’s management and internal and external experts are involved in assessing the probability and in estimating any amounts involved. Changes in these assessments may lead to changes in recorded loss accruals. Claims are reviewed on a case by case basis, taking into consideration all information available to the Fund. The actual costs of resolving claims could be substantially higher or lower than the amounts accrued. In certain cases, legal claims may be covered under the Fund’s various insurance policies. Execution on New Strategies New initiatives are introduced from time to time in order to grow Boyd’s business. Initiatives such as entering new markets or introducing and improving related products and services have the potential to be accretive to the Company’s business when the opportunity is accurately identified and executed. There can be no assurance that the Company identifies new strategies that are accretive to the business or that it is successful in implementing such initiatives.
40

Operating Hazards The Company’s revenues are dependent upon the continued operation of its facilities, which can experience a failure or substandard performance of equipment, natural disasters, suspension of operations, the effect of new regulatory requirements regarding the operations of such facilities and claims of injury by employees or members of the public among other risks. There can be no assurances that the Company will be able to continue to operate its facilities free of impact from these risks. Insurance Risk The Fund insures its property, plant and equipment, including vehicles through insurance policies with insurance carriers located in Canada and the U.S. Included within these policies is insurance protection against property loss and general liability. The Fund also insures its directors and officers against liabilities arising from errors, omissions and wrongful acts. Management uses its knowledge, as well as the knowledge of experienced brokers, to ensure that insurable risks are insured appropriately under terms and conditions that would protect the Fund and its subsidiaries from losses. There can be no assurance that all perils would be fully covered or that a material loss would be recoverable under such insurance policies. Cash Distributions Not Guaranteed The Fund and BGHI receive cash in the form of interest payments on the Notes and dividends from the Company or its subsidiaries. The Fund and BGHI distribute the cash they receive, net of expenses and amounts reserved, to unitholders and Class A common shareholders respectively. The actual amount of cash received and ultimately distributed by the Fund and BGHI in the future will depend upon numerous factors, including profitability, fluctuations in working capital, sustainability of margins, required capital expenditures, the need to maintain productive capacity, required funding of long-term contractual obligations, repurchases of units, restrictions on distributions arising from compliance with financial debt covenants, taxation on income or on distributions and debt repayments expected to be funded by cash flows generated from operations. There can be no assurance regarding the amount of distributable cash generated by the Company or its subsidiaries, and therefore no assurance as to the amount of cash which may be distributed by the Fund or BGHI in the future. Unitholder Limited Liability is Subject to Contractual and Statutory Assurances That May Have Some Enforcement Risks The Declaration of Trust provides that no Unitholder will be subject to any liability in connection with the Fund or its obligations and affairs and, in the event that a court determines Unitholders are subject to any such liabilities, the liabilities will be enforceable only against, and will be satisfied only out of, the Fund’s assets. However, there remains a risk, which is considered by the Fund to be remote in the circumstances, that a Unitholder could be held personally liable, despite such statement in the Declaration of Trust, for the obligations of the Fund to the extent that claims are not satisfied out of the assets of the Fund.
41
FORM 52-109F1
CERTIFICATION OF ANNUAL FILINGS FULL CERTIFICATE
I, Brock Bulbuck, Chief Executive Officer, Boyd Group Income Fund, certify the following:
1. Review: I have reviewed the AIF, if any, annual financial statements and annual MD&A, including, for greater certainty, all documents and information that are incorporated by reference in the AIF (together, the “annual filings”) of Boyd Group Income Fund (the “issuer”) for the financial year ended December 31, 2015.
2. No misrepresentations: Based on my knowledge, having exercised reasonable diligence, the annual filings do not contain any untrue statement of a material fact or omit to state a material fact required to be stated or that is necessary to make a statement not misleading in light of the circumstances under which it was made, for the period covered by the annual filings.
3. Fair presentation: Based on my knowledge, having exercised reasonable diligence, the annual financial statements together with the other financial information included in the annual filings fairly present in all material respects the financial condition, financial performance and cash flows of the issuer, as of the date of and for the periods presented in the annual filings.
4. Responsibility: The issuer’s other certifying officer(s) and I are responsible for establishing and maintaining disclosure controls and procedures (DC&P) and internal control over financial reporting (ICFR), as those terms are defined in National Instrument 52-109 Certification of Disclosure in Issuers’ Annual and Interim Filings, for the issuer.
5. Design: Subject to the limitations, if any, described in paragraphs 5.2 and 5.3, the issuer’s other certifying officer(s) and I have, as at the financial year end
(a) designed DC&P, or caused it to be designed under our supervision, to provide reasonable assurance that
(i) material information relating to the issuer is made known to us by others, particularly during the period in which the annual filings are being prepared; and
(ii) information required to be disclosed by the issuer in its annual filings, interim filings or other reports filed or submitted by it under securities legislation is recorded, processed, summarized and reported within the time periods specified in securities legislation; and
(b) designed ICFR, or caused it to be designed under our supervision, to provide reasonable assurance regarding the reliability of financial reporting and the preparation of financial statements for external purposes in accordance with the issuer’s GAAP.
5.1 Control framework: The control framework the issuer’s other certifying officer(s) and I used to design the issuer’s ICFR is the Internal Control – Integrated Framework (COSO 2013 Framework), published by The Committee of Sponsoring Organizations of the Treadway Commission.
5.2 ICFR – material weakness relating to design: N/A
5.3 Limitation on scope of design: N/A
6. Evaluation: The issuer’s other certifying officer(s) and I have
(a) evaluated, or caused to be evaluated under our supervision, the effectiveness of the issuer’s DC&P at the financial year end and the issuer has disclosed in its annual MD&A our conclusions about the effectiveness of DC&P at the financial year end based on that evaluation; and
(b) evaluated, or caused to be evaluated under our supervision, the effectiveness of the issuer’s ICFR at the
financial year end and the issuer has disclosed in its annual MD&A
(i) our conclusions about the effectiveness of ICFR at the financial year end based on that evaluation; and
(ii) N/A
42

7. Reporting changes in ICFR: The issuer has disclosed in its annual MD&A any change in the issuer’s ICFR that occurred during the period beginning on October 1, 2015 and ended on December 31, 2015 that has materially affected, or is reasonably likely to materially affect, the issuer’s ICFR.
8. Reporting to the issuer’s auditors and board of directors or audit committee: The issuer’s other certifying officer(s) and I have disclosed, based on our most recent evaluation of ICFR, to the issuer’s auditors, and the board of directors or the audit committee of the board of directors any fraud that involves management or other employees who have a significant role in the issuer’s ICFR.
Date: March 23, 2016 (signed) Brock Bulbuck President & Chief Executive Officer
43

FORM 52-109F1
CERTIFICATION OF ANNUAL FILINGS FULL CERTIFICATE
I, Narendra Pathipati, Chief Financial Officer, Boyd Group Income Fund, certify the following:
1. Review: I have reviewed the AIF, if any, annual financial statements and annual MD&A, including, for greater certainty, all documents and information that are incorporated by reference in the AIF (together, the “annual filings”) of Boyd Group Income Fund (the “issuer”) for the financial year ended December 31, 2015.
2. No misrepresentations: Based on my knowledge, having exercised reasonable diligence, the annual filings do not contain any untrue statement of a material fact or omit to state a material fact required to be stated or that is necessary to make a statement not misleading in light of the circumstances under which it was made, for the period covered by the annual filings.
3. Fair presentation: Based on my knowledge, having exercised reasonable diligence, the annual financial statements together with the other financial information included in the annual filings fairly present in all material respects the financial condition, financial performance and cash flows of the issuer, as of the date of and for the periods presented in the annual filings.
4. Responsibility: The issuer’s other certifying officer(s) and I are responsible for establishing and maintaining disclosure controls and procedures (DC&P) and internal control over financial reporting (ICFR), as those terms are defined in National Instrument 52-109 Certification of Disclosure in Issuers’ Annual and Interim Filings, for the issuer.
5. Design: Subject to the limitations, if any, described in paragraphs 5.2 and 5.3, the issuer’s other certifying officer(s) and I have, as at the financial year end
(a) designed DC&P, or caused it to be designed under our supervision, to provide reasonable assurance that
(i) material information relating to the issuer is made known to us by others, particularly during the period in which the annual filings are being prepared; and
(ii) information required to be disclosed by the issuer in its annual filings, interim filings or other reports filed or submitted by it under securities legislation is recorded, processed, summarized and reported within the time periods specified in securities legislation; and
(b) designed ICFR, or caused it to be designed under our supervision, to provide reasonable assurance regarding the reliability of financial reporting and the preparation of financial statements for external purposes in accordance with the issuer’s GAAP.
5.1 Control framework: The control framework the issuer’s other certifying officer(s) and I used to design the issuer’s ICFR is the Internal Control – Integrated Framework (COSO 2013 Framework), published by The Committee of Sponsoring Organizations of the Treadway Commission.
5.2 ICFR – material weakness relating to design: N/A
5.3 Limitation on scope of design: N/A
6. Evaluation: The issuer’s other certifying officer(s) and I have
(a) evaluated, or caused to be evaluated under our supervision, the effectiveness of the issuer’s DC&P at the financial year end and the issuer has disclosed in its annual MD&A our conclusions about the effectiveness of DC&P at the financial year end based on that evaluation; and
(b) evaluated, or caused to be evaluated under our supervision, the effectiveness of the issuer’s ICFR at the
financial year end and the issuer has disclosed in its annual MD&A
(i) our conclusions about the effectiveness of ICFR at the financial year end based on that evaluation; and
(ii) N/A
44

7. Reporting changes in ICFR: The issuer has disclosed in its annual MD&A any change in the issuer’s ICFR that occurred during the period beginning on October 1, 2015 and ended on December 31, 2015 that has materially affected, or is reasonably likely to materially affect, the issuer’s ICFR.
8. Reporting to the issuer’s auditors and board of directors or audit committee: The issuer’s other certifying officer(s) and I have disclosed, based on our most recent evaluation of ICFR, to the issuer’s auditors, and the board of directors or the audit committee of the board of directors any fraud that involves management or other employees who have a significant role in the issuer’s ICFR.
Date: March 23, 2016 (signed) Narendra Pathipati Executive Vice President & Chief Financial Officer
45

BOYD GROUP INCOME FUND
CONSOLIDATED FINANCIAL STATEMENTS
Year Ended December 31, 2015
46
MANAGEMENT’S RESPONSIBILITY FOR FINANCIAL REPORTING These consolidated financial statements have been prepared by management in accordance with Canadian generally accepted accounting principles. Management is responsible for their integrity, objectivity and reliability, and for the maintenance of financial and operating systems, which include effective controls, to provide reasonable assurance that the Fund’s assets are safeguarded and that reliable financial information is produced. The Board of Trustees is responsible for ensuring that management fulfills its responsibilities for financial reporting, disclosure control and internal control. The Board exercises these responsibilities through its Audit Committee, all members of which are not involved in the daily activities of the Fund. The Audit Committee meets with management and, as necessary, with the independent auditors, Deloitte LLP, to satisfy itself that management’s responsibilities are properly discharged and to review and report to the Board on the consolidated financial statements. In accordance with Canadian generally accepted auditing standards, the independent auditors conduct an examination each year in order to express a professional opinion on the consolidated financial statements. (signed) (signed) Brock Bulbuck Narendra Pathipati President & Chief Executive Officer Executive Vice President & Chief Financial Officer Winnipeg, Manitoba March 22, 2016
47

48
INDEPENDENT AUDITOR’S REPORT To the Unitholders of Boyd Group Income Fund We have audited the accompanying consolidated financial statements of Boyd Group Income Fund, which comprise the consolidated statements of financial position as at December 31, 2015 and December 31, 2014, and the consolidated statements of loss, consolidated statements of comprehensive earnings, consolidated statements of changes in equity and consolidated statements of cash flows for the years then ended, and a summary of significant accounting policies and other explanatory information. Management's Responsibility for the Consolidated Financial Statements Management is responsible for the preparation and fair presentation of these consolidated financial statements in accordance with International Financial Reporting Standards, and for such internal control as management determines is necessary to enable the preparation of consolidated financial statements that are free from material misstatement, whether due to fraud or error. Auditor's Responsibility Our responsibility is to express an opinion on these consolidated financial statements based on our audits. We conducted our audits in accordance with Canadian generally accepted auditing standards. Those standards require that we comply with ethical requirements and plan and perform the audit to obtain reasonable assurance about whether the consolidated financial statements are free from material misstatement. An audit involves performing procedures to obtain audit evidence about the amounts and disclosures in the consolidated financial statements. The procedures selected depend on the auditor's judgment, including the assessment of the risks of material misstatement of the consolidated financial statements, whether due to fraud or error. In making those risk assessments, the auditor considers internal control relevant to the entity's preparation and fair presentation of the consolidated financial statements in order to design audit procedures that are appropriate in the circumstances, but not for the purpose of expressing an opinion on the effectiveness of the entity's internal control. An audit also includes evaluating the appropriateness of accounting policies used and the reasonableness of accounting estimates made by management, as well as evaluating the overall presentation of the consolidated financial statements. We believe that the audit evidence we have obtained in our audits is sufficient and appropriate to provide a basis for our audit opinion. Opinion In our opinion, the consolidated financial statements present fairly, in all material respects, the financial position of Boyd Group Income Fund as at December 31, 2015 and December 31, 2014, and its financial performance and its cash flows for the years then ended in accordance with International Financial Reporting Standards.
Chartered Accountants March 22, 2016 Winnipeg, Manitoba

49
BOYD
GROUP INCOME FUNDCONSOLIDATED STATEMENTS OF FINANCIAL POSITIONAs at December 31,(thousands of Canadian dollars)
2015 2014Note
AssetsCurrent assets:
Cash 72,926$ 57,510$ Accounts receivable 16 64,798 55,462 Income taxes recoverable 3,115 884 Inventory 6 20,977 15,809 Prepaid expenses 13,140 9,579
174,956 139,244
Note receivable 25 678 893 Property, plant and equipment 7 133,043 89,264 Deferred income tax asset 8 2,622 2,755 Deferred financing costs 12 321 849 Intangible assets 9 143,679 112,053 Goodwill 10 183,623 142,755
638,922$ 487,813$
Liabilities and EquityCurrent liabilities:
Accounts payable and accrued liabilities 134,431$ 96,691$ Distributions payable 11 705 671 Dividends payable 11 11 11 Current portion of long-term debt 12 9,802 7,645 Current portion of obligations under finance leases 14 4,547 3,436
149,496 108,454
Long-term debt 12 56,745 48,953 Obligations under finance leases 14 8,476 5,339 Convertible debentures 13, 16 75,120 81,664 Convertible debenture conversion features 16 60,164 41,875 Deferred income tax liability 8 20,602 10,702 Exchangeable Class A common shares 16 15,536 11,420 Unit based payment obligation 17 33,118 20,193 Non-controlling interest put options 16 34,738 23,230
453,995 351,830 EquityAccumulated other comprehensive earnings 20 75,111 21,977 Deficit (116,517) (86,402) Unitholders' capital 21 222,331 196,406 Contributed surplus 22 4,002 4,002
184,927 135,983 638,922$ 487,813$
The accompanying notes are an integral part of these consolidated financial statements
Approved by the Board:
BROCK BULBUCK ALLAN DAVISTrustee Trustee

BOYD GROUP INCOME FUNDCONSOLIDATED STATEMENTS OF CHANGES IN EQUITY(thousands of Canadian dollars, except unit amounts)
Accumulated Other
Units AmountContributed
SurplusComprehensive
Earnings Deficit Total EquityNote
Balances - January 1, 2014 14,934,127 137,939$ 4,002$ 5,685$ (63,652)$ 83,974$
Issue costs Units issued through public offering (net of tax of $661) 21 (1,850) (1,850) Other (net of tax of $nil) 21 (27) (27) Units issued from treasury Units issued through public offering 21 1,306,000 55,309 55,309 Units issued in connection with acquisitions 5 4,297 190 190 Retractions 16 112,164 4,786 4,786 Conversion of convertible debentures 13 2,519 59 59
Other comprehensive earnings 20 16,292 16,292 Net loss (15,311) (15,311)
Comprehensive earnings 16,292 (15,311) 981
Distributions to unitholders 11 (7,439) (7,439)
Balances - December 31, 2014 16,359,107 196,406$ 4,002$ 21,977$ (86,402)$ 135,983$
Issue costs (net of tax of $nil) 21 (29) (29) Retractions 16 4,875 259 259 Conversion of convertible debentures 13 424,227 25,695 25,695
Other comprehensive earnings 20 53,134 53,134 Net loss (21,962) (21,962)
Comprehensive earnings 53,134 (21,962) 31,172
Distributions to unitholders 11 (8,153) (8,153)
Balances - December 31, 2015 16,788,209 222,331$ 4,002$ 75,111$ (116,517)$ 184,927$
The accompanying notes are an integral part of these consolidated financial statements
Unitholders' Capital
50

51
BOYD GROUP INCOME FUNDCONSOLIDATED STATEMENTS OF LOSS For the years ended December 31,(thousands of Canadian dollars, except unit and per unit amounts)
2015 2014Note
Sales 26 1,174,077$ 844,104$ Cost of sales 637,212 454,550
Gross profit 536,865 389,554
Operating expenses 435,198 320,582 Acquisition, transaction and process improvement costs 5 2,003 6,325 Depreciation of property, plant and equipment 7 18,022 13,405 Amortization of intangible assets 9 10,072 7,139 Fair value adjustments 15 58,950 37,360 Finance costs 14,254 8,317
538,499 393,128 Loss before income taxes (1,634) (3,574)
Income tax expenseCurrent 8 13,551 5,744 Deferred 8 6,777 5,993
20,328 11,737
Net loss (21,962)$ (15,311)$
The accompanying notes are an integral part of these consolidated financial statements
Basic and diluted loss per unit 30 (1.333)$ (0.999)$
Basic and diluted weighted average number of units outstanding 30 16,470,702 15,331,353
BOYD GROUP INCOME FUNDCONSOLIDATED STATEMENTS OF COMPREHENSIVE EARNINGSFor the years ended December 31,(thousands of Canadian dollars)
2015 2014
Net loss (21,962)$ (15,311)$ Other comprehensive earnings
Items that may be reclassified subsequently to Consolidated Statements of Loss
Change in unrealized earnings on translating financial statements of foreign operations 20 53,134 16,292
Other comprehensive earnings 53,134 16,292 Comprehensive earnings 31,172$ 981$
The accompanying notes are an integral part of these consolidated financial statements

52
BOYD GROUP INCOME FUNDCONSOLIDATED STATEMENTS OF CASH FLOWSFor the years ended December 31,(thousands of Canadian dollars)
2015 2014Note
Cash flows from operating activitiesNet loss (21,962)$ (15,311)$ Items not affecting cash
Fair value adjustments 58,950 37,360 Deferred income taxes 6,777 5,993 Amortization of discount on convertible debt 3,383 907 Amortization of deferred finance costs 885 212 Amortization of intangible assets 10,072 7,139 Depreciation of property, plant and equipment 18,022 13,405 Gain on disposal of equipment and software (214) (62) Interest accrued on Exchangeable Class A common shares 130 154 Other gains 5 (732) -
Payment of accrued settlement obligation - (820)
75,311 48,977
Changes in non-cash working capital items 31 7,141 2,242
82,452 51,219
Cash flows (used in) provided by financing activitiesFund units issued from treasury - 55,309 Issue costs (29) (2,538) Increase in obligations under long-term debt - 85,395 Repayment of long-term debt (8,926) (91,748) Repayment of obligations under finance leases (5,228) (3,971) Proceeds on sale-leaseback agreement - 2,235 Net proceeds on issue of convertible debentures - 54,969 Dividends paid on Exchangeable Class A common shares (130) (159) Distributions paid to unitholders (8,119) (7,366) Payment to non-controlling interests (1,086) (1,066) Payment of financing costs (356) (52) Collection of notes receivable 59 22
(23,815) 91,030
Cash flows used in investing activitiesProceeds on sale of equipment and software 352 202 Equipment purchases and facility improvements (9,183) (5,941) Acquisition and development of businesses (net of cash acquired) (43,214) (101,175) Software purchases and licensing (377) (325) Senior managers unit loan program 181 196
(52,241) (107,043)
Effect of foreign exchange rate changes on cash 9,020 3,000 Net increase in cash position 15,416 38,206 Cash, beginning of year 57,510 19,304
Cash, end of year 72,926$ 57,510$
Income taxes paid 15,762$ 5,044$ Interest paid 11,174$ 8,080$ The accompanying notes are an integral part of these consolidated financial statements

BOYD GROUP INCOME FUND NOTES TO CONSOLIDATED FINANCIAL STATEMENTS For the years ended December 31, 2015 and 2014 (thousands of Canadian dollars, except unit, share and per unit/share amounts)
53
1. GENERAL INFORMATION
Boyd Group Income Fund (the “Fund” or “BGIF”) is an unincorporated, open-ended mutual fund trust established under the laws of the Province of Manitoba, Canada on December 16, 2002. It was established for the purposes of acquiring and holding a majority interest in The Boyd Group Inc. (the “Company”). The Company is partially owned by Boyd Group Holdings Inc. (“BGHI”), which is controlled by the Fund. These financial statements reflect the activities of the Fund, the Company and all its subsidiaries including BGHI. The Company’s business consists of the ownership and operation of autobody/autoglass repair facilities and related services. At the reporting date, the Company operated locations in five Canadian provinces under the trade name Boyd Autobody & Glass, as well as in 19 U.S. states under the trade name Gerber Collision & Glass. The Company is a major retail auto glass operator in the U.S. with locations across 30 U.S. states under the trade names Gerber Collision & Glass, Glass America, Auto Glass Service, Auto Glass Authority and Autoglassonly.com. The Company also operates Gerber National Claim Services (“GNCS”), an auto glass repair and replacement referral business with approximately 5,500 glass provider locations and 4,600 Emergency Roadside Services provider locations throughout the U.S. The units and convertible debentures of the Fund are listed on the Toronto Stock Exchange and trade under the symbols “BYD.UN”, “BYD.DB” and “BYD.DB.A”. The head office and principal address of the Fund are located at 3570 Portage Avenue, Winnipeg, Manitoba, Canada, R3K 0Z8. The consolidated financial statements for the year ended December 31, 2015 (including comparatives) were approved and authorized for issue by the Board of Trustees on March 22, 2016.
2. SIGNIFICANT ACCOUNTING POLICIES a) Basis of presentation
The consolidated financial statements of the Fund have been prepared in accordance with International Financial Reporting Standards (“IFRS”) as issued by the International Accounting Standards Board (“IASB”). These consolidated financial statements are presented in thousands of Canadian dollars, except unit, share and per unit/share amounts.
b) Revenue recognition The Fund recognizes revenue to the extent that it is probable that the economic benefits will flow to the Fund, the sales price is fixed or determinable and collectability is reasonably assured. Revenue is measured at the fair value of the consideration received. Revenue is recognized when the profitability of the repair or service can be measured reliably. As the majority of repairs and services are of short duration, revenue is recognized when the repair or service is complete or substantially complete.
c) Inventory Inventory is valued at the lower of cost and net realizable value. Cost is determined on the first-in, first-out basis. Net realizable value is the estimated selling price in the ordinary course of business less any applicable selling expenses.
d) Property, plant and equipment
Property, plant and equipment assets are stated at cost less accumulated depreciation and accumulated impairment losses. The cost of an item of property, plant and equipment consists of the purchase price, any costs directly attributable to bringing the asset to the location and condition necessary for its intended use and an estimate of the costs of dismantling and removing the item and restoring the site on which it is located.

BOYD GROUP INCOME FUND NOTES TO CONSOLIDATED FINANCIAL STATEMENTS For the years ended December 31, 2015 and 2014 (thousands of Canadian dollars, except unit, share and per unit/share amounts)
54
Depreciation is calculated using the declining balance and straight line rates as disclosed in the property, plant and equipment note. Leasehold improvements are amortized on the straight line basis over the period of estimated benefit. An item of property, plant and equipment is reclassified as held for sale or derecognized upon disposal, or when no future economic benefits are expected to arise from the continued use of the asset. Any gain or loss arising on disposal of the asset, determined as the difference between the net disposal proceeds and the carrying amount of the asset, is recognized in the consolidated statement of earnings (loss). The Fund conducts an annual assessment of the residual balances, useful lives and depreciation methods being used for property, plant and equipment and any changes arising from the assessment are applied by the Fund prospectively.
e) Consolidation The financial statements of the Fund consolidate the accounts of the Fund and its subsidiaries. All intercompany transactions, balances and unrealized gains and losses from intercompany transactions are eliminated on consolidation. Subsidiaries are those entities which the Fund controls by having the power to govern the financial and operating policies. The existence and effect of potential voting rights that are currently exercisable or convertible are considered when assessing whether the Fund controls another entity. Subsidiaries are fully consolidated from the date on which control is obtained by the Fund and are de-consolidated from the date that control ceases.
f) Business combinations, goodwill and other intangible assets
Acquisitions of subsidiaries and businesses are accounted for using the acquisition method of accounting. The cost of the acquisition is measured at the aggregate of the fair values (at the acquisition date) of assets transferred, liabilities incurred or assumed, and equity instruments issued by the Fund in exchange for control of the acquired company. Acquisition costs are expensed as incurred. The acquired company’s identifiable assets (including previously unrecognized intangible assets), liabilities and contingent liabilities are recognized at their fair values at the acquisition date. Goodwill represents the excess of the cost of an acquisition over the fair value of the Fund’s share of the net identifiable assets of the acquired subsidiary at the date of acquisition. Goodwill is carried at cost less accumulated impairment losses. Intangible assets are recognized only when it is probable that the expected future economic benefits attributable to the assets will accrue to the Fund and the cost can be reliably measured. Intangible assets acquired in a business combination are recorded at fair value. Intangible assets that do not have indefinite lives are amortized over their useful lives using an amortization method which reflects the economic benefit of the intangible asset. Customer relationships are amortized on a straight-line basis over the expected period of benefit of 20 years. Contractual rights, which consist of non-compete agreements, zoned property rights and favourable lease agreements, are amortized on a straight-line basis over the term of the contract. Computer software is amortized on a straight-line basis over periods of three and five years. Brand names which the Company continues to use in the conduct of its business are considered indefinite life because their value is not expected to degrade over time. To the extent the Company decides to discontinue the use of a certain brand, an estimate of the remaining useful life is made and the intangible asset is amortized over the remaining period.
g) Impairment of non-financial assets
Property, plant and equipment and definite life intangible assets are tested for impairment when events or changes in circumstances indicate that the carrying amount may not be recoverable. For the purpose of measuring recoverable amounts, assets are grouped at the lowest levels for which there are separately identifiable cash inflows (cash-generating unit or “CGU”). The recoverable amount is the higher of an asset’s fair value less costs to sell and value in use (being the present value of the expected future cash flows of the relevant asset or CGU). An impairment loss is recognized for the amount by which the asset’s carrying amount exceeds its recoverable amount.

BOYD GROUP INCOME FUND NOTES TO CONSOLIDATED FINANCIAL STATEMENTS For the years ended December 31, 2015 and 2014 (thousands of Canadian dollars, except unit, share and per unit/share amounts)
55
Goodwill and indefinite lived intangible assets are reviewed for impairment annually or at any time if an indicator of impairment exists. As well, newly acquired goodwill is reviewed for impairment at the end of the year in which it was acquired. Goodwill acquired through a business combination is allocated to each CGU, or group of CGUs, that are expected to benefit from the related business combination. A group of CGUs represents the lowest level within the entity at which the goodwill is monitored for internal management purposes, which is not higher than an operating segment. Impairment losses on goodwill are not reversed. The Fund evaluates impairment losses, other than goodwill impairment, for potential reversals when events or circumstances warrant such consideration.
h) Cash and cash equivalents Cash and cash equivalents include cash on hand, deposits held with banks, and other short-term highly liquid investments with original maturities of three months or less.
i) Income taxes Income tax comprises current and deferred tax. Income tax is recognized in the statement of earnings (loss) except to the extent that it relates to items recognized directly in equity, in which case the income tax is recognized directly in equity. Current tax is the expected tax payable on the taxable income for the year, using tax rates enacted, or substantively enacted, at the end of the reporting period, and any adjustment to tax payable in respect of previous years. In general, deferred tax is recognized in respect of temporary differences arising between the tax bases of assets and liabilities and their carrying amounts in the consolidated financial statements. Deferred income tax is determined on a non-discounted basis using tax rates and laws that have been enacted or substantively enacted at the statement of financial position date and are expected to apply when the deferred tax asset or liability is settled. Deferred tax assets are recognized to the extent that it is probable that the assets can be recovered. Deferred income tax is provided on temporary differences arising on investments in subsidiaries except, in the case of subsidiaries, where the timing of the reversal of the temporary difference is controlled by the Fund and it is probable that the temporary difference will not reverse in the foreseeable future.
j) Unitholders’ capital
Under IAS 32, a financial instrument that gives the holder the right to put the instrument back to the issuer for cash or another financial asset (a ‘puttable instrument’) is a financial liability, except for those instruments that meet the exceptions to be classified as equity instruments. The trust units of the Fund meet the puttable equity exceptions and therefore are classified as equity. The Fund’s declaration of trust allows a unitholder to tender their units for cash redemption. This cash redemption right is restricted, at the Fund’s option, to an aggregate cash amount of $25. Historically, the Fund has not been asked to redeem units for cash.
k) Unit-Based Compensation
The Fund issues unit-based awards to certain employees in the form of unit options. The unit options are financial liabilities since the units are ultimately puttable back to the Fund in exchange for cash. The cost of cash-settled unit-based transactions are measured at fair value using a Black-Scholes model and expensed over the vesting period with the recognition of a corresponding liability. The liability is re-measured at each reporting date with changes in fair value recognized in earnings (loss).

BOYD GROUP INCOME FUND NOTES TO CONSOLIDATED FINANCIAL STATEMENTS For the years ended December 31, 2015 and 2014 (thousands of Canadian dollars, except unit, share and per unit/share amounts)
56
l) Earnings per unit
Basic earnings (loss) per unit (EPU) is calculated by dividing the net earnings (loss) for the period attributable to equity owners of the Fund by the weighted average number of units outstanding during the period. Diluted EPU is calculated by adjusting the weighted average number of units outstanding and corresponding earnings impact for dilutive instruments. The Fund’s dilutive instruments comprise unit options, exchangeable shares, convertible debentures and non-controlling interest put options. The number of shares included with respect to unit options is computed using the treasury stock method. The exchangeable Class A shares are evaluated as to whether or not they are dilutive based on the effect on earnings per unit of eliminating the liability adjustment for the period and increasing the weighted average number of units outstanding for the units that would be exchanged for the Class A shares. The dilutive impact of the convertible debentures and non-controlling interest put options is calculated using the “if converted” method.
m) Foreign currency translation Items included in the financial statements of each subsidiary are measured using the currency of the primary economic environment in which the entity operates (the “functional currency”). The consolidated financial statements are presented in Canadian dollars, which is the Fund’s functional currency. The financial statements of entities that have a functional currency different from that of the Fund are translated into Canadian dollars. Assets and liabilities are translated into Canadian dollars at the noon rate of exchange prevailing at the statement of financial position dates and income and expense items are translated at the average exchange rate during the period (as this is considered a reasonable approximation to actual rates). The adjustment arising from the translation of these accounts is recognized in other comprehensive earnings (loss) as cumulative translation adjustments. When an entity disposes of its entire interest in a foreign operation, or loses control, joint control, or significant influence over a foreign operation, the foreign currency gains or losses accumulated in other comprehensive earnings (loss) related to the foreign operation are recognized in earnings (loss). If an entity disposes of part of an interest in a foreign operation which remains a subsidiary, a proportionate amount of foreign currency gains or losses accumulated in other comprehensive earnings (loss) related to the subsidiary are reallocated between controlling and non-controlling interests. Foreign currency transactions are translated into the functional currency using the exchange rates prevailing at the dates of the transactions. Generally, foreign exchange gains and losses resulting from the settlement of foreign currency transactions and from the translation at year-end exchange rates of monetary assets and liabilities denominated in currencies other than an operation’s functional currency are recognized in earnings (loss).
n) Financial instruments Financial assets and liabilities are recognized when the Fund becomes a party to the contractual provisions of the instrument. Financial assets and liabilities are offset and the net amount reported in the statement of financial position when there is a legally enforceable right to offset the recognized amounts and there is an intention to settle on a net basis, or realize the asset and settle the liability simultaneously. At initial recognition, the Fund classifies its financial instruments in the following categories depending on the purpose for which the instruments were acquired: Cash is classified as “Financial Assets at Fair Value Through Profit or Loss” (FVTPL). This financial asset is measured at fair value at each period end.

BOYD GROUP INCOME FUND NOTES TO CONSOLIDATED FINANCIAL STATEMENTS For the years ended December 31, 2015 and 2014 (thousands of Canadian dollars, except unit, share and per unit/share amounts)
57
Derivative contracts including convertible debenture conversion features and non-controlling interest put options are classified as “Financial Assets or Financial Liabilities at Fair Value Through Profit or Loss” with mark-to-market adjustments being recorded to net earnings (loss) at each period end.
Accounts receivable and notes receivable are classified as “Loans and Receivables”. After their initial fair value measurement, they are measured at amortized cost using the effective interest method, as reduced by appropriate allowances for estimated unrecoverable amounts.
Accounts payable and accrued liabilities, dividends payable, distributions payable, the non-derivative component of convertible debentures, and long-term debt are classified as “Other Liabilities” and are net of any related financing fees or issue costs. After their initial fair value measurement, they are measured at amortized cost using the effective interest method.
As a result of the Fund’s units being redeemable for cash, the exchangeable Class A shares of the Fund’s subsidiary BGHI, are presented as financial liabilities and classified as “Financial Assets or Financial Liabilities at Fair Value Through Profit or Loss”. Exchangeable Class A shares are measured at the market price of the units of Fund as of the statement of financial position date.
For those financial instruments where fair value is recognized in the Statement of Financial Position the methods and assumptions used to develop fair value measurements have been classified into one of the three levels of the fair value hierarchy for financial instruments:
• Level 1 includes quoted prices (unadjusted) in active markets for identical assets or liabilities • Level 2 includes inputs that are observable other than quoted prices included in Level 1 • Level 3 includes inputs that are not based on observable market data
For net investment hedging relationships, foreign exchange gains and losses are recognized in other comprehensive earnings (loss). Amounts recorded in accumulated other comprehensive earnings (loss) are recognized in net earnings (loss) when there is a disposition of the foreign subsidiary.
o) Non-controlling interests
The Company accounts for transactions where a non-controlling interest exists, and where a put option has been granted to third parties under IFRS 10 whereby the non-controlling interest is initially recognized at fair value and then immediately derecognized upon the issuance and recognition of the put option. Differences between the put option liability recognized at fair value and the amount of any non-controlling interest derecognized is recognized directly in equity. When there is no allocation of profit or loss to non-controlling partners, no non-controlling interest is recognized in the Statement of Financial Position. Distributions to non-controlling partners are recognized as an expense when paid or payable based on the distribution formula of the agreement.
p) Pensions and other post-retirement benefits The Company contributes to defined contribution pension plans of employees. Contributions are recognized within operating expenses at an amount equal to contributions payable for the period. Any outstanding contributions are recognized as liabilities within accrued liabilities.
q) Provisions
Provisions are recognized when the Fund has a present legal or constructive obligation that has arisen as a result of a past event and it is probable that a future outflow of resources will be required to settle the obligation, provided that a reliable estimate can be made of the amount of the obligation.

BOYD GROUP INCOME FUND NOTES TO CONSOLIDATED FINANCIAL STATEMENTS For the years ended December 31, 2015 and 2014 (thousands of Canadian dollars, except unit, share and per unit/share amounts)
58
Provisions are measured at management’s best estimate of the expenditure required to settle the obligation at the end of the reporting period, and are discounted to present value where the effect is significant. The increase in the provision due to the passage of time is recognized as a finance cost.
r) Segment reporting The chief operating decision-maker is responsible for allocating resources and assessing performance of the operating segments and has been identified as the chief executive officer of the Fund. The Fund’s primary line of business is automotive collision and glass repair and related services, with the majority of revenues relating to this group of similar services. This line of business operates in Canada and the U.S. and both regions exhibit similar long-term economic characteristics. In this circumstance, IFRS requires the Company to provide specific geographical disclosure. For the years reported, the Company’s revenues were derived within Canada or the U.S. and all property, plant and equipment, goodwill and intangible assets are located within these two geographic areas.
3. CRITICAL ACCOUNTING ESTIMATES AND JUDGMENTS Estimates and judgments are continually evaluated and are based on historical experience and other factors, including expectations of future events that are believed to be reasonable under the circumstances. Critical accounting estimates The Fund makes estimates, including the assumptions applied therein, concerning the future. The resulting accounting estimates will, by definition, seldom equal the related actual results. The estimates and assumptions that have a significant risk of causing a material adjustment to the carrying amounts of assets and liabilities within the next financial year are addressed below. Impairment of Goodwill and Intangible Assets When testing goodwill and intangibles for impairment, the Fund uses the recorded historical cash flows of the CGU or group of CGUs to which the asset relate for the most recent two years, and an estimate or forecast of cash flows for the next year to establish an estimate of the Fund’s future cash flows. An estimate of the recoverable amount is then calculated as the higher of an asset’s fair value less costs to sell and value in use (being the present value of the expected future cash flows of the relevant asset or CGU). An impairment loss is recognized for the amount by which the asset’s carrying amount exceeds its recoverable amount. The methods used to value intangible assets and goodwill require critical estimates to be made regarding the future cash flows and useful lives of the intangible assets. Goodwill and intangible asset impairments, when recognized, are recorded as a separate charge to earnings (loss), and could materially impact the operating results of the Fund for any particular accounting period. Impairment of Other Long-lived Assets The Fund assesses the recoverability of its long-lived assets, other than goodwill and intangibles, after considering the potential impairment indicated by such factors as business and market trends, the Fund’s ability to transfer the assets, future prospects, current market value and other economic factors. In performing its review of recoverability, management estimates the future cash flows expected to result from the use of the assets and their potential disposition. If the discounted sum of the expected future cash flows is less than the carrying value of the assets generating those cash flows, an impairment loss would be recognized based on the excess of the carrying amounts of the assets over their estimated recoverable value. The underlying estimates for cash flows include estimates for future sales, gross margin rates and operating expenses. Changes which may impact these estimates include, but are not limited to, business risks and uncertainties and economic conditions. To the extent that management’s estimates are not realized, future assessments could result in impairment charges that may have a material impact on the Fund’s consolidated financial statements.

BOYD GROUP INCOME FUND NOTES TO CONSOLIDATED FINANCIAL STATEMENTS For the years ended December 31, 2015 and 2014 (thousands of Canadian dollars, except unit, share and per unit/share amounts)
59
Fair Value of Financial Instruments The Fund has applied discounted cash flow methods to establish the fair value of certain financial liabilities recorded on the Statement of Financial Position, as well as disclosed in the notes to the financial statements. The Fund also establishes mark-to-market valuations for derivative instruments, which are assumed to represent the current fair value of these instruments. These valuations rely on assumptions regarding interest and exchange rates as well as other economic indicators, which at the time of establishing the fair value for disclosure, have a high degree of uncertainty. Unrealized gains or losses on these derivative financial instruments may not be realized as markets change. Income Taxes The Fund is subject to income tax in several jurisdictions and estimates are used to determine the provision for income taxes. During the ordinary course of business, there are transactions and calculations for which the ultimate tax determination is uncertain. As a result, the Fund recognizes tax liabilities based on estimates of whether additional taxes and interest will be due. Uncertain tax liabilities may be recognized when, despite the Fund’s belief that its tax return positions are supportable, the Fund believes that certain positions are likely to be challenged and may not be fully sustained upon review by tax authorities. The Fund believes that its accruals for tax liabilities are adequate for all open audit years based on its assessment of many factors including past experience and interpretations of tax law. To the extent that the final tax outcome of these matters is different than the amounts recorded, such differences will impact income tax expense in the period in which such determination is made.
Critical judgments in applying the entity’s accounting policies Deferred Tax Assets The assessment of the probability of future taxable income in which deferred tax assets can be utilized is based on the Fund's latest forecasts which are adjusted for significant non-taxable income and expenses and specific limits to the use of any unused tax loss or credit. The tax rules in the numerous jurisdictions in which the Fund operates are also carefully taken into consideration. If a positive forecast of taxable income indicates the probable use of a deferred tax asset, that deferred tax asset is recognized in full. The recognition of deferred tax assets that are subject to certain legal or economic limits or uncertainties is assessed individually by management based on the specific facts and circumstances. The judgments inherent in these assessments are subject to uncertainty and if changed could materially affect the Fund’s assessment of its ability to realize the benefit of these tax assets. Leases In applying the classification of leases in IAS 17, management considers its premise leases as well as certain equipment and vehicle leases as operating lease arrangements. In some cases, the lease transaction is not conclusive, and management uses judgment in determining whether the lease is a finance lease arrangement that transfers substantially all the risks and rewards incidental to ownership or an operating lease where substantially all the risks and rewards incidental to ownership are not transferred.
4. NEW ACCOUNTING STANDARDS ADOPTED AND FUTURE STANDARDS NOT YET EFFECTIVE
The following amendments have been adopted effective January 1, 2015: Amendments to IAS 19, Employee Benefits were issued by the IASB on November 21, 2013 to provide clarification regarding attribution of contributions from employees or third parties to a defined benefit plan. The amendment is effective for annual periods beginning on or after July 1, 2014 with early application permitted. This change had no impact on the Fund’s reporting.

BOYD GROUP INCOME FUND NOTES TO CONSOLIDATED FINANCIAL STATEMENTS For the years ended December 31, 2015 and 2014 (thousands of Canadian dollars, except unit, share and per unit/share amounts)
60
On December 12, 2013, the IASB issued Annual Improvements, which amended nine standards as follows: • IFRS 1, First-time Adoption of International Financial Reporting Standards – providing a choice between
applying existing IFRS or early adopting a new IFRS standard • IFRS 2, Share-based Payment – providing definitions and guidance for awards issued with different vesting
conditions • IFRS 3, Business Combinations – providing guidance on accounting for contingent consideration in a business
combination and scope exceptions for joint ventures • IFRS 8, Operating Segments – requiring disclosures on the aggregation of operating segments and
reconciliation of the total of the reportable segments’ assets to the entity’s assets • IFRS 13, Fair Value Measurement – providing guidance on measurement of short-term receivables and
payables • IAS 16, Property, Plant and Equipment – providing clarification on how accumulated depreciation should be
calculated under the revaluation method • IAS 24, Related Party Disclosures – requiring disclosure of payments to entities providing management
services • IAS 38, Intangible Assets – providing clarification on how accumulated depreciation should be calculated
under the revaluation method • IAS 40, Investment Property – providing clarification on the classification of property as investment property
or owner-occupied property These amendments were adopted by the Fund on January 1, 2015 with no impact on its financial statements. The following is an overview of accounting standard changes that the Fund will be required to adopt in future years:
IFRS 15, Revenue from Contracts with Customers, was issued by the International Accounting Standards Board (“IASB”) on May 28, 2014 and will replace current guidance found in IAS 11, Construction Contracts and IAS 18, Revenue. IFRS 15 outlines a single comprehensive model to use in accounting for revenue arising from contracts with customers. On July 22, 2015, the IASB announced a deferral in the effective date for this standard. The standard is effective for reporting periods beginning on or after January 1, 2018 with early application permitted. A choice of retrospective application or a modified transition approach is provided. The Fund is currently evaluating the impact of adopting IFRS 15 on its financial statements. IFRS 9, Financial Instruments, was issued by the IASB on July 24, 2014 and will replace current guidance found in IAS 39, Financial Instruments: Recognition and Measurement. IFRS 9 includes a logical model for classification and measurement, a single, forward-looking ‘expected loss’ impairment model and a substantially-reformed approach to hedge accounting. The new standard will come into effect on January 1, 2018 with early application permitted. The Fund is currently evaluating the impact of adopting IFRS 9 on its financial statements. IFRS 16, Leases, was issued by the IASB on January 13, 2016 and will replace the current guidance found in IAS 17, Leases and related interpretations. The new standard will bring most leases on-balance sheet through recognition of related assets and liabilities. IFRS 16 establishes principles for recognition, measurement, presentation and disclosure of leases. The new standard will come into effect on January 1, 2019 with early application permitted if IFRS 15, Revenue from Contracts with Customers has also been applied. The Fund is currently evaluating the impact of adopting IFRS 16 on its financial statements.
5. ACQUISITIONS
Effective January 2, 2015, the Company completed a transaction acquiring the assets of Craftmaster Auto Body Group, Inc. (“Craftmaster”), which owned and operated six collision repair locations in Florida. Funding for the transaction was a combination of seller financing and cash.

BOYD GROUP INCOME FUND NOTES TO CONSOLIDATED FINANCIAL STATEMENTS For the years ended December 31, 2015 and 2014 (thousands of Canadian dollars, except unit, share and per unit/share amounts)
61
The Fund also completed 16 other acquisitions that added 21 locations during 2015 as follows: Acquisition Date Location
April 10, 2015 Pittsburgh, PennsylvaniaMay 1, 2015 Spokane Valley, WashingtonJune 12, 2015 Battle Creek, MichiganJuly 13, 2015 Plainwell, MichiganJuly 17, 2015 Salt Lake City, Utah (4 locations)July 30, 2015 Mesa, ArizonaAugust 13, 2015 Highland Ranch, ColoradoAugust 20, 2015 Lake City, FloridaSeptember 9, 2015 Jacksonville, North CarolinaSeptember 22, 2015 Glenwood Springs, Colorado and Grand Junction, Colorado October 6, 2015 Dayton, Ohio (2 locations)October 16, 2015 Mayfield Heights, OhioOctober 27, 2015 Gresham, OregonOctober 30, 2015 Bremerton, WashingtonNovember 3, 2015 Shereville, IndianaDecember 18, 2015 Charlotte, North Carolina
On April 14, 2014, the Company completed a transaction acquiring Dora Holdings, Inc., which owns and operates 24 collision repair centers in Illinois and Indiana, and Collision Revision 13081 Inc., which owns and operates one collision repair center in Florida, both operating under the trade name “Collision Revision”. Funding for the transaction was a combination of seller financing and use of the revolving credit facility. On May 30, 2014, the Company completed a transaction acquiring Netcost 866netglass LLC, operating as Netcost Claims Services (“Netcost”). Netcost expanded the Company’s existing third party administration business, Gerber National Glass Services, that offered first notice of loss, auto glass and related services through its network of auto glass providers across the U.S. Netcost also offered roadside assistance services and owned and operated its own call center. Funding for the transaction was a combination of cash and seller financing plus additional consideration if performance over the ensuing 3 years exceeds certain thresholds. The fair value of the contingent consideration has been evaluated based on a formula defined in the purchase and sale agreement. The formula is based on earnings in years one, two and three of operations in excess of the threshold. At December 31, 2015, it is estimated that no further contingent purchase price is payable (2014 - $nil). Effective June 2, 2014, the Company completed a transaction acquiring Collex Collision Experts Inc. and Collex Collision Experts of Florida Inc. (“Collex”), which own and operate 16 collision repair centers in Michigan and Florida. Funding for the transaction was a combination of seller financing and use of the revolving credit facility. On September 12, 2014, the Company completed a transaction acquiring Champ’s Holding Company LLC, which owns and operates seven collision repair centers in Louisiana under the trade name Champ’s Collision Centers (“Champ’s”). Funding for the transaction was a combination of seller financing and use of the revolving credit facility.

BOYD GROUP INCOME FUND NOTES TO CONSOLIDATED FINANCIAL STATEMENTS For the years ended December 31, 2015 and 2014 (thousands of Canadian dollars, except unit, share and per unit/share amounts)
62
The Fund also completed 10 other acquisitions that added 11 locations during 2014 as follows: Acquisition Date Location
January 31, 2014 Phoenix, Arizona (2 locations)May 1, 2014 Mundelein, IllinoisJune 30, 2014 Chicago, IllinoisAugust 12, 2014 Commerce Township, MichiganAugust 29, 2014 Atlanta, GeorgiaOctober 15, 2014 Brunswick, GeorgiaOctober 31, 2014 Coeur d'Alene, IdahoOctober 31, 2014 Jacksonville, FloridaNovember 7, 2014 Seattle, WashingtonNovember 24, 2014 Woodstock, Georgia
Funding for the Atlanta transaction was a combination of cash and a $190 issuance of 4,297 units to the sellers at a unit price of $44.22. The Fund has accounted for the acquisitions using the acquisition method as follows: Acquisitions in 2015
CraftmasterOther
acquisitions Total
Identifiable net assets acquired at fair value:
Cash 5$ - $ 5$ Other currents assets 259 460 719 Property, plant and equipment 1,727 12,650 14,377 Identified intangible assets Customer relationships 2,287 7,096 9,383 Brand name 235 126 361 Non-compete agreements 469 517 986 Liabilities assumed (131) (29) (160)
Identifiable net assets acquired 4,851$ 20,820$ 25,671$ Goodwill 3,828 7,737 11,565
Total purchase consideration 8,679$ 28,557$ 37,236$
Consideration provided
Cash paid or payable 7,037$ 22,228$ 29,265$ Sellers notes 1,642 6,329 7,971
Total consideration provided 8,679$ 28,557$ 37,236$

BOYD GROUP INCOME FUND NOTES TO CONSOLIDATED FINANCIAL STATEMENTS For the years ended December 31, 2015 and 2014 (thousands of Canadian dollars, except unit, share and per unit/share amounts)
63
The following table summarizes the preliminary purchase consideration and preliminary purchase price allocation as eported in the Fund’s 2014 year-end financial statements: r
Acquisitions in 2014 Collision
Revision Netcost Collex Champ'sOther
acquisitions Total
Identifiable net assets acquired at fair value:
Cash 1,237$ 740$ 649$ 2,557$ - $ 5,183$ Other currents assets 4,187 2,159 2,762 1,605 28 10,741 Property, plant and equipment 4,050 237 4,010 3,303 6,630 18,230 Identified intangible assets Customer relationships 9,544 2,608 18,303 16,171 - 46,626 Brand name 658 435 545 443 - 2,081 Non-compete agreements 878 217 545 775 - 2,415 Liabilities assumed (7,849) (4,404) (3,598) (4,398) - (20,249) Deferrred income tax liability (4,321) - - - - (4,321)
Identifiable net assets acquired 8,384$ 1,992$ 23,216$ 20,456$ 6,658$ 60,706$ Goodwill 17,916 1,268 26,236 18,086 - 63,506
Total purchase consideration 26,300$ 3,260$ 49,452$ 38,542$ 6,658$ 124,212$
Consideration provided
Cash paid or payable 7,102$ 1,087$ 44,549$ 34,555$ 5,283$ 92,576$ Units issued - - - - 190 190 Sellers notes 19,198 2,173 4,903 3,987 1,185 31,446
Total consideration provided 26,300$ 3,260$ 49,452$ 38,542$ 6,658$ 124,212$
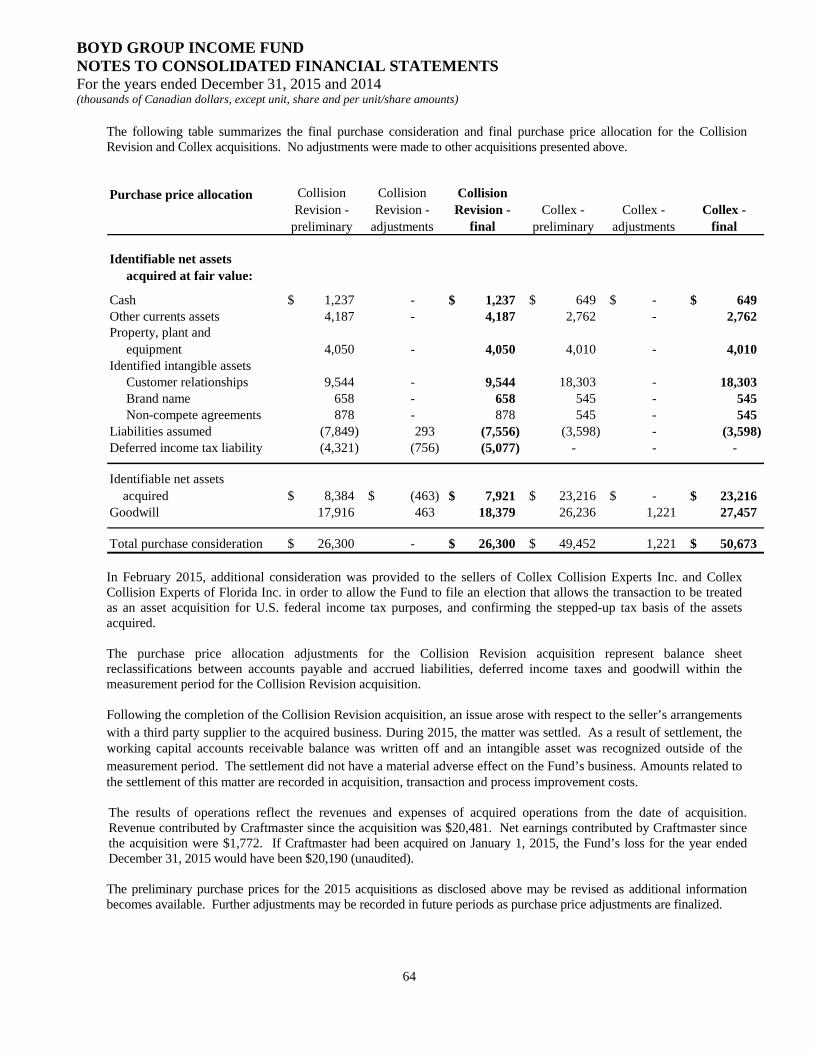
BOYD GROUP INCOME FUND NOTES TO CONSOLIDATED FINANCIAL STATEMENTS For the years ended December 31, 2015 and 2014 (thousands of Canadian dollars, except unit, share and per unit/share amounts)
64
The following table summarizes the final purchase consideration and final purchase price allocation for the Collision Revision and Collex acquisitions. No adjustments were made to other acquisitions presented above. Purchase price allocation Collision
Revision - preliminary
Collision Revision -
adjustments
Collision Revision -
finalCollex -
preliminaryCollex -
adjustmentsCollex -
final
Identifiable net assets acquired at fair value:
Cash 1,237$ - 1,237$ 649$ - $ 649$ Other currents assets 4,187 - 4,187 2,762 - 2,762 Property, plant and equipment 4,050 - 4,050 4,010 - 4,010 Identified intangible assets Customer relationships 9,544 - 9,544 18,303 - 18,303 Brand name 658 - 658 545 - 545 Non-compete agreements 878 - 878 545 - 545 Liabilities assumed (7,849) 293 (7,556) (3,598) - (3,598) Deferred income tax liability (4,321) (756) (5,077) - - -
Identifiable net assets acquired 8,384$ (463)$ 7,921$ 23,216$ - $ 23,216$ Goodwill 17,916 463 18,379 26,236 1,221 27,457
Total purchase consideration 26,300$ - 26,300$ 49,452$ 1,221 50,673$ In February 2015, additional consideration was provided to the sellers of Collex Collision Experts Inc. and Collex Collision Experts of Florida Inc. in order to allow the Fund to file an election that allows the transaction to be treated as an asset acquisition for U.S. federal income tax purposes, and confirming the stepped-up tax basis of the assets acquired. The purchase price allocation adjustments for the Collision Revision acquisition represent balance sheet reclassifications between accounts payable and accrued liabilities, deferred income taxes and goodwill within the measurement period for the Collision Revision acquisition. Following the completion of the Collision Revision acquisition, an issue arose with respect to the seller’s arrangements with a third party supplier to the acquired business. During 2015, the matter was settled. As a result of settlement, the working capital accounts receivable balance was written off and an intangible asset was recognized outside of the measurement period. The settlement did not have a material adverse effect on the Fund’s business. Amounts related to the settlement of this matter are recorded in acquisition, transaction and process improvement costs. The results of operations reflect the revenues and expenses of acquired operations from the date of acquisition. Revenue contributed by Craftmaster since the acquisition was $20,481. Net earnings contributed by Craftmaster since the acquisition were $1,772. If Craftmaster had been acquired on January 1, 2015, the Fund’s loss for the year ended December 31, 2015 would have been $20,190 (unaudited). The preliminary purchase prices for the 2015 acquisitions as disclosed above may be revised as additional information becomes available. Further adjustments may be recorded in future periods as purchase price adjustments are finalized.

BOYD GROUP INCOME FUND NOTES TO CONSOLIDATED FINANCIAL STATEMENTS For the years ended December 31, 2015 and 2014 (thousands of Canadian dollars, except unit, share and per unit/share amounts)
65
U.S. acquisition transactions are initially recognized in Canadian dollars at the rates of exchange in effect on the transaction dates. Subsequently, the assets and liabilities are translated at the rate in effect at the Statement of Financial Position date.
A significant part of the goodwill added in 2014 and 2015 can be attributed to the assembled workforce and the operating know-how of key personnel. However, no intangible asset qualified for separate recognition in this respect. Goodwill recognized during 2015 is expected to be deductible for tax purposes. Goodwill recognized during 2014 on Netcost, Collex and Champ’s acquisitions is expected to be deductible for tax purposes. The portion of goodwill related to the acquisition of Collision Revision 13081 Inc. is expected to be deductible for tax purposes. Costs associated with acquisition and development activities are expensed as incurred. Included in acquisition, transaction and process improvement costs of $2,003 (2014 - $6,325) are process improvement costs of $nil (2014 - $2,875).
6. INVENTORY
As at December 31, December 31,
2015 2014
Parts and materials 9,634$ 7,460$ Work in process 11,343 8,349
20,977$ 15,809$ Included in cost of sales for the year ended December 31, 2015 are parts and material costs of $357,851 (2014 – $260,024) and labour costs of $193,382 (2014 – $140,043) with the balance of cost of sales primarily made up of sublet charges.

BOYD GROUP INCOME FUND NOTES TO CONSOLIDATED FINANCIAL STATEMENTS For the years ended December 31, 2015 and 2014 (thousands of Canadian dollars, except unit, share and per unit/share amounts)
66
7. PROPERTY, PLANT AND EQUIPMENT
Land BuildingsShop
EquipmentOffice
EquipmentComputer Hardware Signage Vehicles
Leasehold Improvements Total
Depreciation rates 5% 15% 20% 30% 15% 30%
10 to 25 years straight line
As at January 1, 2014
Cost 1,545$ 1,831$ 51,817$ 4,724$ 6,393$ 4,488$ 9,792$ 30,582$ 111,172$ Accumulated depreciation - (219) (22,681) (2,046) (3,606) (1,469) (5,328) (11,898) (47,247)
Net book value 1,545$ 1,612$ 29,136$ 2,678$ 2,787$ 3,019$ 4,464$ 18,684$ 63,925$
For the year ended December 31, 2014
Additions - 1,208 15,152 1,235 1,064 1,063 2,021 13,341 35,084 Proceeds on disposal (1,410) (825) (10) - - - (192) - (2,437) Gain (loss) on disposal 2 - (13) - - - 73 - 62
Depreciation - (96) (5,597) (673) (963) (539) (2,094) (3,443) (13,405)
Foreign exchange 9 116 2,947 207 213 285 232 2,026 6,035
Net book value 146$ 2,015$ 41,615$ 3,447$ 3,101$ 3,828$ 4,504$ 30,608$ 89,264$
As at December 31, 2014
Cost 146$ 2,330$ 69,893$ 6,166$ 7,670$ 5,836$ 11,926$ 45,949$ 149,916$ Accumulated depreciation - (315) (28,278) (2,719) (4,569) (2,008) (7,422) (15,341) (60,652)
Net book value 146$ 2,015$ 41,615$ 3,447$ 3,101$ 3,828$ 4,504$ 30,608$ 89,264$
For the year ended December 31, 2015
Additions 2,619 3,305 14,930 1,439 1,201 1,621 4,244 14,810 44,169 Proceeds on disposal - - (68) - - - (284) - (352) Gain (loss) on disposal - - (1) (1) - - 217 - 215
Depreciation - (164) (7,750) (839) (1,105) (770) (2,082) (5,312) (18,022)
Foreign exchange 243 630 8,061 568 499 774 735 6,259 17,769
Net book value 3,008$ 5,786$ 56,787$ 4,614$ 3,696$ 5,453$ 7,334$ 46,365$ 133,043$
As at December 31, 2015
Cost 3,008$ 6,317$ 99,430$ 8,693$ 10,334$ 8,657$ 17,338$ 71,029$ 224,806$ Accumulated depreciation - (531) (42,643) (4,079) (6,638) (3,204) (10,004) (24,664) (91,763)
Net book value 3,008$ 5,786$ 56,787$ 4,614$ 3,696$ 5,453$ 7,334$ 46,365$ 133,043$

BOYD GROUP INCOME FUND NOTES TO CONSOLIDATED FINANCIAL STATEMENTS For the years ended December 31, 2015 and 2014 (thousands of Canadian dollars, except unit, share and per unit/share amounts)
67
8. INCOME TAXES The Fund is a “specified investment flow-through” (“SIFT”) and until December 31, 2010 was exempt from tax on its income to the extent that its income was distributed to unitholders. This exemption did not apply to the Company or its subsidiaries, which are corporations that are subject to income tax. On December 15, 2010 the Trustees of the Fund approved an internal capital restructuring plan that better reflects its significant U.S. base of business and its expected source of future growth. A consequence of this restructuring is that its current distribution level to unitholders are funded almost entirely by its U.S. operations. Fund distributions that are sourced from U.S. business earnings are not subject to the SIFT tax. The Fund accounts for deferred income tax assets and liabilities in respect of accounting and tax basis differences. Deferred income tax assets and liabilities which relate to the same jurisdiction are netted on the statement of financial position.
a) The reconciliation between income tax expense and the accounting earnings (loss) multiplied by the combined
basic Canadian and U.S. federal, provincial and state tax rates is as follows:
2015 2014
Loss before income taxes (1,634)$ (3,574)$ Earnings subject to tax in the hands of unitholders not the Fund (8,153) (7,439)
Loss subject to income taxes (9,787)$ (11,013)$
Combined basic Canadian and U.S. federal, provincial and state tax rates 35.68% 31.74%
Income tax expense at combined statutory tax rates (3,492)$ (3,496)$
Adjustments for the tax effect of:Non-deductible depreciation 512 408 Other non-deductible expenses 326 308 Amortization of permanent goodwill deductions (96) (82) Allocation to non-controlling interest (1,403) (914)
(79) - Dividends treated as interest 605 476 Non-deductible fair value adjustments 19,788 9,902 Effective rate adjustment 3,628 5,088 Items affecting equity - issue costs 506 131 Other 33 (84)
Income tax expense 20,328$ 11,737$
Changes in deferred tax assets and liabilities resulting from changes in substantively enacted tax rates
For the years ended December 31,
The structure of the Fund is such that a portion of the Fund’s earnings continue to be subject to tax in the hands of the unitholders, not the Fund. This permits the Company to reduce its tax obligation. As a result during the year, the Company benefitted from an interest deduction in the amount of $11,583 (2014 - $8,920). This amount was received by the Fund who then is permitted to reduce its taxable income for the distributions declared in the year.

BOYD GROUP INCOME FUND NOTES TO CONSOLIDATED FINANCIAL STATEMENTS For the years ended December 31, 2015 and 2014 (thousands of Canadian dollars, except unit, share and per unit/share amounts)
68
b) Deferred income taxes consist of the following:
As at December 31, December 31,
2015 2014
Intangible assets (316)$ (286)$ Non-capital losses carried forward 2,306 2,249 Property, plant and equipment (271) (212) Issue costs 826 1,225 Other 77 (221)
Deferred income tax asset 2,622$ 2,755$
As at December 31, December 31,2015 2014
Intangible assets (18,353)$ (11,635)$ Accrued liabilities 6,809 5,682 Property, plant and equipment (12,095) (7,004) Acquisition costs 3,037 2,255
Deferred income tax liability (20,602)$ (10,702)$
c) The movement in deferred income tax assets and liabilities during the year is as follows: As at December 31, December 31,
2015 2014
Balance, beginning of year 2,755$ 2,389$ Issue costs - 661 Deferred income tax expense (133) (295)
Balance, end of year 2,622$ 2,755$ As at December 31, December 31,
2015 2014
Balance, beginning of year (10,702)$ (4,874)$ Acquired through business combination (915) (4,209) Recognition of deferred tax on set up of intangible assets - 4,809 Deferred income tax expense (6,644) (5,698) Foreign exchange (2,341) (730)
Balance, end of year (20,602)$ (10,702)$

BOYD GROUP INCOME FUND NOTES TO CONSOLIDATED FINANCIAL STATEMENTS For the years ended December 31, 2015 and 2014 (thousands of Canadian dollars, except unit, share and per unit/share amounts)
69
d) Deferred income tax assets are recognized to the extent it is probable that sufficient future taxable income will be available to allow a deferred income tax asset to be realized. At December 31, 2015, the Fund has recognized all of its deferred income tax assets with the exception of $7,510 (2014 - $7,512) in capital losses available in Canada. At December 31, 2015, the Fund has non-capital losses in Canada of $8,607 (2014 - $8,636) and net operating losses in the U.S. of $nil (2014 - $nil).
The losses expire as follows:
Year of expiry
2026 1,542 2030 1,226 2033 4,618 2034 1,221

BOYD GROUP INCOME FUND NOTES TO CONSOLIDATED FINANCIAL STATEMENTS For the years ended December 31, 2015 and 2014 (thousands of Canadian dollars, except unit, share and per unit/share amounts)
70
9. INTANGIBLE ASSETS
Customer Relationships Brand Name
Computer Software
Non-compete Agreements
Zoned Property Rights
Favourable Lease Agreements Total
As at January 1, 2014
Cost 61,142$ 10,382$ 2,350$ 3,342$ 53,921$ - $ 131,137$
Accumulated amortization (10,380) (2,449) (1,697) (1,934) (53,921) - (70,381)
Net book value 50,762$ 7,933$ 653$ 1,408$ - $ - $ 60,756$
For the year ended December 31, 2014
Acquired through business combinations 46,626 2,081 - 2,415 - - 51,122
Purchase price allocation adjustments (620) (414) - - - - (1,034)
Additions - - 325 - - - 325
Amortization (4,351) (1,616) (318) (854) - - (7,139)
Foreign exchange 7,015 722 59 227 - - 8,023
Net book value 99,432$ 8,706$ 719$ 3,196$ - $ - $ 112,053$
As at December 31, 2014
Cost 115,298$ 13,064$ 2,734$ 6,197$ 53,921$ - $ 191,214$
Accumulated amortization (15,866) (4,358) (2,015) (3,001) (53,921) - (79,161)
Net book value 99,432$ 8,706$ 719$ 3,196$ - $ - $ 112,053$
For the year ended December 31, 2015
Acquired through business combinations 9,383 361 - 986 - - 10,730$
Additions - - 377 - - 8,725 9,102
Amortization (6,566) (1,492) (466) (1,548) - - (10,072)
Foreign exchange 19,530 1,612 110 614 - - 21,866
Net book value 121,779$ 9,187$ 740$ 3,248$ - $ 8,725$ 143,679$
As at December 31, 2015
Cost 147,814$ 16,000$ 3,221$ 8,505$ 53,921$ 8,725$ 238,186$
Accumulated amortization (26,035) (6,813) (2,481) (5,257) (53,921) - (94,507)
Net book value 121,779$ 9,187$ 740$ 3,248$ - $ 8,725$ 143,679$

BOYD GROUP INCOME FUND NOTES TO CONSOLIDATED FINANCIAL STATEMENTS For the years ended December 31, 2015 and 2014 (thousands of Canadian dollars, except unit, share and per unit/share amounts)
71
10. GOODWILL As at December 31, December 31,
2015 2014
Balance, beginning of year 142,755$ 73,561$ Acquired through business combination 11,565 63,506 Deferred tax liability (asset) on purchase price allocation adjustment 756 (4,495) Purchase price allocation adjustments within the measurement period (293) 1,011 Additional consideration provided 1,221 - Foreign exchange 27,619 9,172
Balance, end of year 183,623$ 142,755$ The Fund has used the value in use method to evaluate the carrying amount of goodwill. The key assumptions used in the assessment include an estimate of current cash flow, taxes, and a growth rate of 2% and capital maintenance expenditures. These assumptions are based on past experience. A discount rate of 11.5% has been applied to the expected cash flow, after adjusting the cash flow for an estimate of the taxes and capital maintenance expenditures. The amount of carrying value of goodwill which has been evaluated using this method was $183,623 (2014 - $136,140).
In February 2015, additional consideration was provided to the sellers of Collex Collision Experts Inc. and Collex Collision Experts of Florida Inc. in order to allow the Fund to file an election that allows the transaction to be treated as an asset acquisition for U.S. federal income tax purposes, resulting in a stepped-up tax basis of the assets acquired. The purchase price allocation adjustments for the Collision Revision acquisition represent balance sheet reclassifications between accounts payable and accrued liabilities, deferred income taxes and goodwill within the measurement period for the Collision Revision acquisition.
11. DISTRIBUTIONS AND DIVIDENDS The Fund’s Trustees have discretion in declaring distributions. The Fund’s distribution policy is to make distributions of its available cash from operations taking into account current and future performance, amounts necessary for principal and interest payments on debt obligations, amounts required for maintenance capital expenditures and amounts allocated to reserves. Distributions to unitholders and dividends on the exchangeable Class A shares, which are recorded as finance costs, were declared and paid as follows:

BOYD GROUP INCOME FUND NOTES TO CONSOLIDATED FINANCIAL STATEMENTS For the years ended December 31, 2015 and 2014 (thousands of Canadian dollars, except unit, share and per unit/share amounts)
72
Record date Payment dateDistribution per Unit /
Dividend per Share Distribution amount Dividend amount
January 31, 2015 February 25, 2015 0.0410$ 671$ 11$ February 28, 2015 March 27, 2015 0.0410 671 11 March 31, 2015 April 28, 2015 0.0410 671 11 April 30, 2015 May 27, 2015 0.0410 670 10 May 31, 2015 June 26, 2015 0.0410 670 11 June 30, 2015 July 29, 2015 0.0410 671 11 July 31, 2015 August 26, 2015 0.0410 672 11 August 31, 2015 September 28, 2015 0.0410 671 11 September 30, 2015 October 28, 2015 0.0410 688 11 October 31, 2015 November 26, 2015 0.0410 688 11 November 30, 2015 December 22, 2015 0.0420 705 11 December 31, 2015 January 27, 2016 0.0420 705 11
0.4940$ 8,153$ 131$
Record date Payment dateDistribution per Unit /
Dividend per Share Distribution amount Dividend amount
January 31, 2014 February 26, 2014 0.0400$ 597$ 15$ February 28, 2014 March 27, 2014 0.0400 597 15 March 31, 2014 April 28, 2014 0.0400 598 15 April 30, 2014 May 28, 2014 0.0400 597 15 May 31, 2014 June 26, 2014 0.0400 598 15 June 30, 2014 July 29, 2014 0.0400 598 15 July 31, 2014 August 27, 2014 0.0400 602 10 August 31, 2014 September 26, 2014 0.0400 602 11 September 30, 2014 October 29, 2014 0.0400 654 11 October 31, 2014 November 26, 2014 0.0400 654 10 November 30, 2014 December 22, 2014 0.0410 671 11 December 31, 2014 January 28, 2015 0.0410 671 11
0.4820$ 7,439$ 154$ During 2015, an expense in the amount of $4,375 (2014 - $4,516) was recorded against earnings (loss) related to these exchangeable Class A shares. Further distributions and dividends were declared for the months of January, February and March 2016 in the monthly amounts of $0.042 per unit/share. The total amount of distributions and dividends declared after the reporting date was $2,271 and $32, respectively.

BOYD GROUP INCOME FUND NOTES TO CONSOLIDATED FINANCIAL STATEMENTS For the years ended December 31, 2015 and 2014 (thousands of Canadian dollars, except unit, share and per unit/share amounts)
73
12. LONG-TERM DEBT
On December 20, 2013, the Company entered into a five year $100,000 U.S. revolving credit facility, with an accordion feature which could increase the facility to a maximum of $135,000 U.S. The facility was with a syndicate of Canadian and U.S. banks and was secured by the shares and assets of the Company as well as guarantees by BGIF and BGHI. The interest rate was based on a pricing grid of the Fund’s ratio of total funded debt to EBITDA as determined under the credit agreement. The Company could draw the facility in either the U.S or in Canada, in either U.S. or Canadian dollars and could be drawn in tranches as required. Tranches bore interest only and were not repayable until the maturity date but could be voluntarily repaid at any time. The Company had the ability to choose the base interest rate between Prime, Bankers Acceptances (“BA”) or London Inter Bank Offer Rate (“LIBOR”). The total syndicated facility included a swing line up to a maximum of $3,000 in Canada and $7,000 in the U.S. Under the revolving facility the Company was subject to certain financial covenants which had to be maintained to avoid acceleration of the termination of the credit agreement. The financial covenants required the Fund to maintain a total debt to EBITDA ratio of less than 4.0, a senior debt to EBITDA ratio of less than 3.5 up to December 31, 2016 and less than 3.25 thereafter; and a fixed charge coverage ratio of greater than 1.03. The debt calculations excluded the convertible debentures. On July 23, 2015, the Company entered into an amended and restated credit agreement for a term of five years, increasing the revolving credit facility to $150,000 U.S., with an accordion feature which can increase the facility to a maximum of $250,000 U.S. The facility is with a syndicate of Canadian and U.S. banks and is secured by the shares and assets of the Company as well as guarantees by BGIF and BGHI. The interest rate is based on a pricing grid of the Fund’s ratio of total funded debt to EBITDA as determined under the credit agreement. The Company can draw the facility in either the U.S. or in Canada, in either U.S. or Canadian dollars and can be drawn in tranches as required. Tranches bear interest only and are not repayable until the maturity date but can be voluntarily repaid at any time. The Company has the ability to choose the base interest rate between Prime, Bankers Acceptances (“BA”) or London Inter Bank Offer Rate (“LIBOR”). The total syndicated facility includes a swing line up to a maximum of $3,000 in Canada and $12,000 in the U.S. Under the revolving facility the Company is subject to certain financial covenants which must be maintained to avoid acceleration of the termination of the credit agreement. The financial covenants require the Fund to maintain a total debt to EBITDA ratio of less than 4.25; a senior debt to EBITDA ratio of less than 3.5 up to December 31, 2016 and less than 3.25 thereafter; and a fixed charge coverage ratio of greater than 1.03. For three quarters following a material acquisition, the total debt to EBITDA ratio may be increased to less than 4.75, the senior debt to EBITDA ratio may be increased to less than 4.0 up to December 31, 2016 and increased to less than 3.75 thereafter. The debt calculations exclude the convertible debentures. As at December 31, 2015, the Fund did not have any draws outstanding against this facility and was in compliance with all financial covenants.
Deferred financing costs of $1,010 were incurred in 2013 to complete the facility and had been recorded as a deferred cost until the debt was drawn. These costs were amortized to finance costs on a straight-line basis until July 23, 2015 when the amended and restated credit agreement was signed. At that time, the unamortized deferred financing costs of $726 were recorded as finance costs. Financing costs of $356 incurred to complete the amended and restated credit agreement have been deferred. These deferred financing costs will be netted against the debt, when drawn. These fees are amortized to finance costs on a straight line basis over the five year term of the amended and restated credit agreement. Seller notes payable of $48,083 U.S. on the financing of certain acquisitions are unsecured, at interest rates ranging from 1% to 8%. The notes are repayable from January 2016 to January 2027 in the same currency as the related note.

BOYD GROUP INCOME FUND NOTES TO CONSOLIDATED FINANCIAL STATEMENTS For the years ended December 31, 2015 and 2014 (thousands of Canadian dollars, except unit, share and per unit/share amounts)
74
Long-term debt is comprised of the following: As at December 31, December 31,
2015 2014
Seller notes 66,547$ 56,598$ Current portion 9,802 7,645
56,745$ 48,953$ The following is the continuity of long-term debt for the year ended December 31, 2015: As at December 31, December 31,
2015 2014
Balance, beginning of year 56,598$ 27,129$ Consideration on acquisition 7,971 31,446 Net draw - 85,395 Repayment (8,926) (91,748) Foreign exchange 10,904 4,376
Balance, end of year 66,547$ 56,598$ The following table summarizes the repayment schedule of the long-term debt:
December 31, December 31,Principal Payments 2015 2014
Less than 1 year 9,802$ 7,645$ 1 to 5 years 33,242 25,761 Greater than 5 years 23,503 23,192
66,547$ 56,598$ Included in finance costs is interest on long-term debt of $3,542 (2014 - $3,426).
13. CONVERTIBLE DEBENTURES
On December 19, 2012, the Fund issued $30,000 aggregate principal amount of convertible unsecured subordinated debentures due December 31, 2017 (the “Debentures”) with a conversion price of $23.40. On December 24, 2012, as allowed under the provisions of the agreement to issue the Debentures, the underwriters purchased an additional $4,200 aggregate principal amount of Debentures increasing the aggregate proceeds of the Debenture Offering to $34,200. The Debentures bear interest at an annual rate of 5.75% payable semi-annually, and are convertible at the option of the holder, into units of the Fund at any time prior to the maturity date and may be redeemed by the Fund on or after December 31, 2015 provided that certain thresholds are met surrounding the weighted average market price of the trust units at that time. On redemption or maturity, the Debentures may at the option of the Fund be repaid in cash or subject to regulatory approval, units of the Fund. On November 6, 2015, the Fund announced that on January 5, 2016 it would redeem in full all of the then outstanding 5.75% Convertible Unsecured Subordinated Debentures due December 31, 2017 in accordance with the provisions of the trust indenture dated as of December 19, 2012. See note 32.

BOYD GROUP INCOME FUND NOTES TO CONSOLIDATED FINANCIAL STATEMENTS For the years ended December 31, 2015 and 2014 (thousands of Canadian dollars, except unit, share and per unit/share amounts)
75
Upon issuance, the Debentures were bifurcated with $2,009 related to the conversion feature treated as a financial liability measured at fair value due to the units of the Fund being redeemable for cash. Transactions costs of $2,003 were incurred in relation to issuance of the Debentures, which included the underwriter’s fee and other expenses of the offering. Details of the Debentures carrying value are as follows: As at December 31, December 31,
2015 2014
Balance, beginning of year 31,617$ 30,971$ Adjusted for:
Accretion charges 2,514 705 Conversion to Fund units (9,927) (59)
Balance, end of year 24,204$ 31,617$ On September 29, 2014, the Fund issued $50,000 aggregate principal amount of convertible unsecured subordinated debentures due October 31, 2021 (the “2014 Debentures”) with a conversion price of $61.40. On September 29, 2014, as allowed under the provisions of the agreement to issue the 2014 Debentures, the underwriters purchased an additional $7,500 aggregate principal amount of 2014 Debentures increasing the aggregate proceeds of the 2014 Debenture offering to $57,500. The 2014 Debentures bear interest at an annual rate of 5.25% payable semi-annually, and are convertible at the option of the holder into units of the Fund at any time prior to the maturity date and may be redeemed by the Fund on or after October 31, 2017 provided that certain thresholds are met surrounding the weighted average market price of the trust units at that time. On redemption or maturity, the 2014 Debentures may, at the option of the Fund, be repaid in cash or, subject to regulatory approval, units of the Fund. Upon issuance, the 2014 Debentures were bifurcated with $5,124 related to the conversion feature treated as a financial liability measured at fair value due to the units of the Fund being redeemable for cash. Transaction costs of $2,774 were incurred in relation to issuance of the 2014 Debentures, which included the underwriter’s fee and other expenses of the offering. Details of the 2014 Debentures carrying value are as follows:
As at December 31, December 31, 2015 2014
Balance, beginning of year 50,047$ - $ Proceeds of offering - 57,500 Adjusted for:
Transaction costs - (2,774) Expensed transaction costs attributable to conversion feature - 243
Net proceeds on offering 50,047$ 54,969$ Adjusted for:
Fair value of conversion feature - (5,124) Accretion charges 869 202
Balance, end of year 50,916$ 50,047$
During 2015, an expense in the amount of $34,057 (December 31, 2014 – $21,966) was recorded to earnings (loss) related to convertible debentures.

BOYD GROUP INCOME FUND NOTES TO CONSOLIDATED FINANCIAL STATEMENTS For the years ended December 31, 2015 and 2014 (thousands of Canadian dollars, except unit, share and per unit/share amounts)
76
14. OBLIGATIONS UNDER FINANCE LEASES
As at December 31, December 31,
2015 2014
Equipment leases, at interest rates ranging from 3.58% to 14.66%, due January 2016 to June 2020 (2014 - January 2015 to March 2019), secured by equipment with a net book value of $7,892 (2014 - $4,122) 7,696$ 4,975$
Vehicle leases, at interest rates ranging from 5.40% to 12.81%, due January 2016 to January 2019 (2014 - January 2015 to July 2018), secured by vehicles with a net book value of $6,038 (2014 - $3,112) 6,792 4,850
14,488$ 9,825$
Amounts representing interest 1,465 1,050
13,023$ 8,775$ Current portion 4,547 3,436
8,476$ 5,339$ Included in finance costs is interest related to finance leases of $1,249 (2014 - $895). Minimum lease payments required as at December 31, 2015 are as follows:
Principal and Interest Payments
Amounts RepresentingInterest Principal Payments
Less than 1 year 5,209 $ 662$ 4,547$ 1 to 5 years 9,187 802 8,385$ Greater than 5 years 92 1 91$
14,488 $ 1,465$ 13,023$ 15. FAIR VALUE ADJUSTMENTS
2015 2014
Convertible debenture conversion features 34,057$ 21,966$ Exchangeable Class A common shares 4,375 4,516 Unit based payment obligation 12,925 8,938 Non-controlling interest put options 7,593 1,940
Total fair value adjustments 58,950$ 37,360$
For the years ended December 31,

BOYD GROUP INCOME FUND NOTES TO CONSOLIDATED FINANCIAL STATEMENTS For the years ended December 31, 2015 and 2014 (thousands of Canadian dollars, except unit, share and per unit/share amounts)
77
16. FINANCIAL INSTRUMENTS Carrying value and estimated fair value of financial instruments
ClassificationFair value hierarchy
Carrying amount
Fair value
Carrying amount
Fair value
Financial assetsCash FVTPL (1) 1 72,926 72,926 57,510 57,510
Accounts receivable Loans and receivables
n/a 64,798 64,798 55,462 55,462
Note receivable Loans and receivables
n/a 678 678 893 893
Financial liabilitiesAccounts payable and accrued liabilities
Other financial liabilities
n/a 134,430 134,430 96,691 96,691
Distributions payable Other financial liabilities
n/a 705 705 671 671
Dividends payable Other financial liabilities
n/a 11 11 11 11
Long-term debt Other financial liabilities
n/a 66,547 66,547 56,598 56,598
2012 convertible debenture Other financial liabilities
2 24,204 70,918 31,617 69,969
2012 convertible debenture conversion feature
FVTPL (1) 2 43,945 43,945 33,920 33,920
2014 convertible debenture Other financial liabilities
2 50,916 70,725 50,047 50,047
2014 convertible debenture conversion feature
FVTPL (1) 2 16,219 16,219 7,955 7,955
Exchangeable Class A common shares
FVTPL (1) 1 15,536 15,536 11,420 11,420
Non-controlling interest put options
FVTPL (1) 3 34,738 34,738 23,230 23,230
December 31, 2015 December 31, 2014
(1) Fair Value Through Profit or Loss
For the Fund’s current financial assets and liabilities, which are short term in nature and subject to normal trade terms, the carrying values approximate their fair value. As there is no ready secondary market for the Fund’s long-term debt, the fair value has been estimated using the discounted cash flow method. The fair value using the discounted cash flow method is approximately equal to carrying value. The fair value for the non-controlling interest put option is based on the estimated cash payment or receipt necessary to settle the contract at the Statement of Financial Position date. Cash payments or receipts are based on discounted cash flows using current market rates and prices and adjusted for credit risk. The fair value of the exchangeable Class A shares is estimated using the market price of the units of Fund as of the statement of financial position date. The fair value for the 2014 convertible debenture conversion feature is estimated using a Black-

BOYD GROUP INCOME FUND NOTES TO CONSOLIDATED FINANCIAL STATEMENTS For the years ended December 31, 2015 and 2014 (thousands of Canadian dollars, except unit, share and per unit/share amounts)
78
Scholes valuation model with the following assumptions used: stock price $66.10, dividend yield 1.05%, expected volatility 26.66%, risk free interest rate of 0.96%, term of six years. The fair value for the Fund’s debentures will change based on the movement in bond rates and changes in the Fund’s credit rating. Collateral
The Company’s syndicated loan facility is collateralized by a General Security Agreement. The carrying amount of the financial assets pledged as collateral for this facility at December 31, 2015 was approximately $137,724 (2014 - $113,800). Interest rate risk
The Company’s operating line and syndicated loan facility are exposed to interest rate fluctuations and the Company does not hold any financial instruments to mitigate this risk. Convertible debentures and seller notes are at fixed interest rates.
Foreign currency risk
The Company’s operations in the U.S. are more closely tied to its domestic currency. Accordingly, the U.S. operations are measured in U.S. dollars and the Company’s foreign exchange translation exposure relates to these operations. When the U.S. operation’s net asset values are converted to Canadian dollars, currency fluctuations result in period to period changes in those net asset values. The Fund’s equity position reflects these changes in net asset values as recorded in accumulated other comprehensive earnings (loss). The income and expenses of the U.S. operations are translated into Canadian dollars at the average rate for the period in order to include their financial results in the consolidated financial statements. Period to period changes in the average exchange rates cause translation effects that have an impact on net earnings (loss). Unlike the effect of exchange rate fluctuations on transaction exposure, the exchange rate translation risk does not affect local currency cash flows. Transactional foreign currency risk also exists in circumstances where U.S. denominated cash is received in Canada. The Company monitors U.S. denominated cash flows to be received in Canada and evaluates whether to use forward foreign exchange contracts. No forward foreign exchange contracts were used during 2015 or 2014. The Fund earns interest on promissory notes issued to The Boyd Group (U.S.) Inc., the parent of the Fund’s U.S. operations. As at December 31, 2015 and 2014, promissory notes denominated in Canadian dollars are as follows: Promissory notes December 31, December 31,As at 2015 2014
Promissory note at 3.3% due September 29, 2017 108,000$ 108,000$ Promissory note at 6.5% due January 1, 2020 41,800 41,800 Promissory note at 8.58% due January 1 2024 6,800 6,800 Promissory note at 8.58% due January 1, 2024 25,000 25,000 Promissory note at 8.58% due January 1, 2024 30,000 30,000
211,600$ 211,600$ Currently the Fund’s U.S. operations purchase Canadian dollars at market rates to fund the monthly interest payments. Credit risk
The carrying amount of financial assets represents the maximum credit exposure. Cash is in the form of deposits on demand with major financial institutions that have strong long-term credit ratings. The Fund is subject to risk of non-payment of accounts receivable; however, the Fund’s receivables are largely collected from the insurers of its customers. Accordingly, the Fund’s accounts receivable comprises mostly amounts due from national and international insurance companies or provincial crown corporations.

BOYD GROUP INCOME FUND NOTES TO CONSOLIDATED FINANCIAL STATEMENTS For the years ended December 31, 2015 and 2014 (thousands of Canadian dollars, except unit, share and per unit/share amounts)
79
Aging of accounts receivable December 31, December 31,As at 2015 2014
Neither impaired nor past due 62,894$ 53,372$ Past due:
Over 90 days 2,922 2,997
65,816$ 56,369$ Allowance for doubtful accounts (1,018) (907)
Accounts receivable 64,798$ 55,462$ The Fund uses an allowance account to record an estimate of potential impairment for accounts receivables based on aging and other factors. The Fund has not identified specific accounts it believes to be impaired. Allowance for doubtful accounts December 31, December 31,As at 2015 2014
Balance, beginning of year 907$ 746$ Increase in allowance (net of recoveries and amounts written off) 111 161
Balance, end of year 1,018$ 907$ Liquidity risk The following table details the Fund’s remaining contractual maturities for its financial liabilities.
TotalWithin 1
year1 to 2 years
2 to 3 years
3 to 4 years
4 to 5 years
After 5 years
Accounts payable and accrued liabilities 134,431$ 134,431$ - $ - $ - $ - $ - $ Long-term debt 66,547 9,802 10,172 9,310 7,884 5,876 23,503 Obligations under finance leases 13,023 4,547 3,346 2,783 2,087 169 91 Convertible debentures 75,120 24,204 - - - - 50,916 Operating lease obligation 346,561 61,205 53,994 46,505 39,179 32,200 113,478
635,682$ 234,189$ 67,512$ 58,598$ 49,150$ 38,245$ 187,988$ Obligations of the Fund are generally satisfied through future operating cash flows and the collection of accounts receivable. Market Risk and Sensitivity Analysis Market risk is the risk that the fair value or future cash flows of financial instruments will fluctuate because of changes in market prices. Components of market risk to which the Fund is exposed are interest rate risk and foreign exchange rate risk as discussed above.

BOYD GROUP INCOME FUND NOTES TO CONSOLIDATED FINANCIAL STATEMENTS For the years ended December 31, 2015 and 2014 (thousands of Canadian dollars, except unit, share and per unit/share amounts)
80
The Fund has used a sensitivity analysis technique that measures the estimated change to net earnings (loss) and equity of a 1% (100 basis points) difference in market interest rates. The sensitivity analysis assumes that changes in market interest rates only affect interest income or expense of variable financial instruments not covered by hedging instruments. For the year ended December 31, 2015 it is estimated that the impact of a 1% change to market rates would result in a $nil change (2014 – $263) to net earnings (loss) as well as comprehensive earnings (loss). The currency risk sensitivity analysis is based on a 5% strengthening or weakening of the Canadian Dollar against the U.S. Dollar and assumes that all other variables remain constant. Under this assumption, net earnings (loss) for the year ended December 31, 2015 as well as comprehensive earnings (loss) would have changed by $nil due to no foreign exchange contracts being in place at the end of 2015 and 2014. Exchangeable Class A Common Shares The Class A common shares of BGHI are exchangeable into units of the Fund. To facilitate the exchange, BGHI issues one Class B common share to the Fund for each Class A common share that has been retracted. The Fund in turn issues a trust unit to the Class A common shareholder. The exchangeable feature results in the Class A common shares of BGHI being presented as financial liabilities of the Fund. Exchangeable Class A shares are measured at the market price of the units of the Fund as at the statement of financial position date. Exchanges are recorded at carrying value. At December 31, 2015 there were 235,036 (2014 – 239,911) shares outstanding with a carrying value of $15,536 (2014 – $11,420). Total retractions for the year were 4,875 (2014 – 112,164) for $259 (2014 – $4,786). During the third quarter of 2014, Brock Bulbuck, President & Chief Executive Officer, retracted 100,000 Class A common shares. The retraction was recorded at a carrying value of $4,324. Non-controlling interest put option On May 31, 2013, the Fund entered into an agreement whereby Glass America contributed its auto-glass business to Gerber Glass in exchange for shares representing a 30% ownership interest in a new combined Glass America entity. The agreement contains a put option, which provides the non-controlling interest with the right to require the Fund to purchase their retained interest according to a valuation formula defined in the agreement. All changes in the estimated liability are recorded in earnings (loss). The put option was restricted until June 1, 2015. On May 31, 2013, in connection with the acquisition of Glass America, the Fund entered into an agreement that provides a member of its U.S. management team the opportunity to participate in the future growth of the Fund’s U.S. glass business. Within the agreement was a put option held by the non-controlling shareholder that provided the shareholder an option to put the business back to the Fund according to a valuation formula defined in the agreement. The put option is restricted until December 1, 2016 and is exercisable anytime thereafter by the glass-business operating partner. The put option may be exercised before December 1, 2016 upon the occurrence of certain unusual events such as a change of control or resignation of the operating partner. All fair value changes in the estimated liability are recorded in earnings (loss). The liability recognized in connection with both put options has been calculated using formulas defined in the agreements. The formula for the Glass America put is based on a multiple of EBITDA for the trailing twelve months. The formula for the Gerber Glass put is based on multiples of estimated future earnings of the combined Gerber Glass and Glass America business, and estimated future exercise dates. The estimated future payment obligation is then discounted to its present value at each statement of financial position date. The significant unobservable inputs include the put being exercised in one year at a probability weighted estimated EBITDA level of approximately $10,600 USD using a discount rate of 9%. An increase in the EBITDA level or a reduction in the discount rate would increase the put liability. During 2015, the Fund made $1,086 (2014 - $1,066) in payments to the Glass America non-controlling interest.

BOYD GROUP INCOME FUND NOTES TO CONSOLIDATED FINANCIAL STATEMENTS For the years ended December 31, 2015 and 2014 (thousands of Canadian dollars, except unit, share and per unit/share amounts)
81
The liability for non-controlling interest put options comprises the following: As at December 31, December 31,
2015 2014
Glass-business operating partner non-controlling interest put option 10,850$ 6,510$ Glass America non-controlling interest put option 23,888 16,720
34,738$ 23,230$ The change in the non-controlling interest put option liabilities is summarized as follows:
Glass-business operating partner
Glass America non-controlling
interest
Glass-business operating partner
Glass America non-controlling
interest
Balance, beginning of year 6,510$ 16,720$ 4,999$ 15,341$ Fair value adjustments 2,990 4,603 1,004 936 Payment to non-controlling interests - (1,086) - (1,066) Foreign exchange 1,350 3,651 507 1,509
Balance, end of year 10,850$ 23,888$ 6,510$ 16,720$
December 31, 2015 December 31, 2014
During 2015, an expense in the amount of $7,593 (December 31, 2014 – $1,940) was recorded to earnings (loss) related to these non-controlling interest put options.
17. UNIT BASED PAYMENT OBLIGATION
Pursuant to the Fund’s Option Agreement and Confirmation, the Fund has granted options to purchase units of the Fund to certain key executives. The following options are outstanding:
December 31, 2015 December 31, 2014Issue Date Number of Units Exercise Price Expiry Date Fair Value Fair Value
January 11, 2006 200,000 1.91$ January 11, 2016 12,803$ 8,061$ January 2, 2008 150,000 2.70$ January 2, 2018 7,599 4,590 January 2, 2009 150,000 3.14$ January 2, 2019 6,786 4,064 January 2, 2010 150,000 5.41$ January 2, 2020 5,930 3,478
33,118$ 20,193$ On January 11, 2006, the Fund granted options which permit the purchase of in the aggregate up to 200,000 units of the Fund at any time after the expiration of 9 years and 255 days after the date the options were granted up to and including the expiration of 9 years and 345 days after the date the options were granted. The units shall be purchased, to the extent validly exercised, on the 10th anniversary of the grant date subject to the condition that the option is not exercisable if the grantee is not an officer or employee of the Fund, the Company or a subsidiary on September 23, 2015. The exercise price, which was set at the time of granting, is the weighted average trading price on the Toronto Stock Exchange for the first 15 trading days in the month of January 2006, being $1.91 per unit. The fair value of each option is estimated using a Black-Scholes valuation model with the following assumptions used for the options granted:

BOYD GROUP INCOME FUND NOTES TO CONSOLIDATED FINANCIAL STATEMENTS For the years ended December 31, 2015 and 2014 (thousands of Canadian dollars, except unit, share and per unit/share amounts)
82
stock price $66.10, dividend yield 1.05%, expected volatility 26.66% (determined as a weighted standard deviation of the unit price over the past four years), risk free interest rate 0.00%, initial term 10 years, remaining term of 11 days. See note 32. On November 8, 2007, the Fund granted additional options to certain key employees allowing them to purchase in the aggregate up to 450,000 units of the Fund, such options to be issued to purchase up to 150,000 units on each of January 2, 2008, 2009 and 2010 exercisable on, but not before, the 10th anniversary of the respective issue date. The purchase price per Fund unit under the options issued on each issue date was determined as the greater of the closing price for Fund units on the Toronto Stock Exchange on the option grant date (being $2.70 per unit) and the weighted average trading price of the Fund units on the Toronto Stock Exchange for the first 15 trading days in the month of January in which each issue date falls. The fair value of each option is estimated using a Black-Scholes valuation model with the following assumptions used for the options granted: stock price $66.10, dividend yield 1.05%, expected volatility 26.66%, risk free interest rates of 0.50%, 0.55% and 0.66% respectively , initial terms of 10, 11 and 12 years respectively, remaining terms of 2, 3 and 4 years respectively. During 2015, an expense in the amount of $12,925 (December 31, 2014 – $8,938 was recorded to earnings (loss) related to these unit based payment obligations. On September 24, 2015, certain key executives provided irrevocable notice that the options issued January 11, 2006 would be exercised, which will result in the issuance of 200,000 units at an exercise price of $1.91 on January 11, 2016. See note 32.
18. LEASE COMMITMENTS
The Fund has various operating lease commitments, primarily in respect of leased premises. The aggregate amount of future minimum lease payments associated with these leases is $346,561 (2014 - $272,216). The minimum amounts payable over the next five years are as follows:
Less than 1 year 61,205$ 1 to 5 years 171,878 Greater than 5 years 113,478
346,561$ Included in operating expenses for the year ended December 31, 2015 are operating lease expenses, primarily in respect of leased premises of $62,035 (2014 – $47,055).
19. CONTINGENCIES
The Fund has two U.S. denominated letters of credit for $225 U.S. (2014 –$225 U.S.).
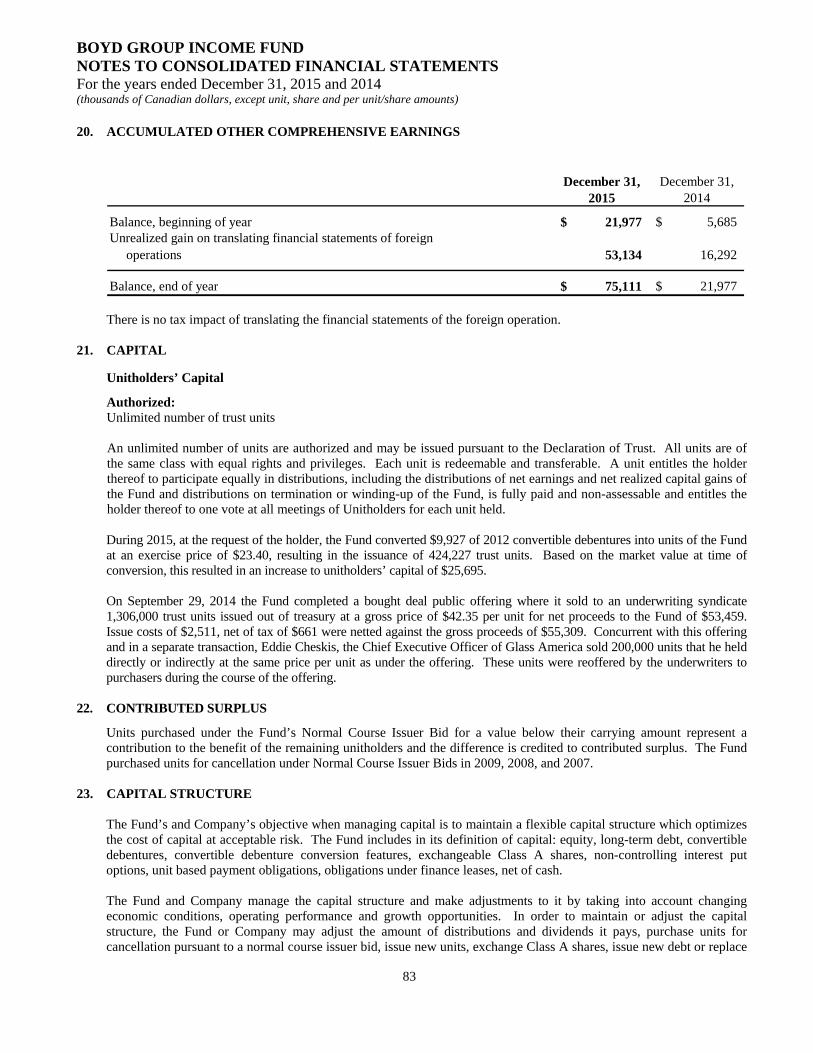
BOYD GROUP INCOME FUND NOTES TO CONSOLIDATED FINANCIAL STATEMENTS For the years ended December 31, 2015 and 2014 (thousands of Canadian dollars, except unit, share and per unit/share amounts)
83
20. ACCUMULATED OTHER COMPREHENSIVE EARNINGS
December 31, December 31,2015 2014
Balance, beginning of year 21,977$ 5,685$ Unrealized gain on translating financial statements of foreign operations 53,134 16,292
Balance, end of year 75,111$ 21,977$ There is no tax impact of translating the financial statements of the foreign operation.
21. CAPITAL
Unitholders’ Capital
Authorized: Unlimited number of trust units An unlimited number of units are authorized and may be issued pursuant to the Declaration of Trust. All units are of the same class with equal rights and privileges. Each unit is redeemable and transferable. A unit entitles the holder thereof to participate equally in distributions, including the distributions of net earnings and net realized capital gains of the Fund and distributions on termination or winding-up of the Fund, is fully paid and non-assessable and entitles the holder thereof to one vote at all meetings of Unitholders for each unit held. During 2015, at the request of the holder, the Fund converted $9,927 of 2012 convertible debentures into units of the Fund at an exercise price of $23.40, resulting in the issuance of 424,227 trust units. Based on the market value at time of conversion, this resulted in an increase to unitholders’ capital of $25,695. On September 29, 2014 the Fund completed a bought deal public offering where it sold to an underwriting syndicate 1,306,000 trust units issued out of treasury at a gross price of $42.35 per unit for net proceeds to the Fund of $53,459. Issue costs of $2,511, net of tax of $661 were netted against the gross proceeds of $55,309. Concurrent with this offering and in a separate transaction, Eddie Cheskis, the Chief Executive Officer of Glass America sold 200,000 units that he held directly or indirectly at the same price per unit as under the offering. These units were reoffered by the underwriters to purchasers during the course of the offering.
22. CONTRIBUTED SURPLUS
Units purchased under the Fund’s Normal Course Issuer Bid for a value below their carrying amount represent a contribution to the benefit of the remaining unitholders and the difference is credited to contributed surplus. The Fund purchased units for cancellation under Normal Course Issuer Bids in 2009, 2008, and 2007.
23. CAPITAL STRUCTURE The Fund’s and Company’s objective when managing capital is to maintain a flexible capital structure which optimizes the cost of capital at acceptable risk. The Fund includes in its definition of capital: equity, long-term debt, convertible debentures, convertible debenture conversion features, exchangeable Class A shares, non-controlling interest put options, unit based payment obligations, obligations under finance leases, net of cash. The Fund and Company manage the capital structure and make adjustments to it by taking into account changing economic conditions, operating performance and growth opportunities. In order to maintain or adjust the capital structure, the Fund or Company may adjust the amount of distributions and dividends it pays, purchase units for cancellation pursuant to a normal course issuer bid, issue new units, exchange Class A shares, issue new debt or replace

BOYD GROUP INCOME FUND NOTES TO CONSOLIDATED FINANCIAL STATEMENTS For the years ended December 31, 2015 and 2014 (thousands of Canadian dollars, except unit, share and per unit/share amounts)
84
existing debt with different characteristics, issue convertible debentures, issue unit options, expand the revolver, increase or decrease its obligations under finance lease, pursue alternative structuring of acquisitions, trigger call options on certain acquisition obligations, or settle certain acquisition obligations using a greater amount of cash or units. The Company monitors capital on a number of bases, including a fixed charge coverage ratio, total debt to Adjusted EBITDA ratios, return on invested capital, a debt to capital ratio, a current ratio, its adjusted distributable cash payout ratio, diluted earnings (loss) per unit and distributions per unit. The fixed charge coverage ratio is the ratio of Adjusted EBITDA, adding back rental expense, less unfunded capital expenditures, less income tax expense, less dividends and distributions to debt, rental expense and capital lease payments. Total debt to Adjusted EBITDA is calculated as the Company’s total debt and capital leases but excluding convertible debentures divided by Adjusted EBITDA. Return on invested capital is the ratio of Adjusted EBITDA to average invested capital. Adjusted EBITDA is a non-GAAP measure, whose nearest GAAP measure is Cash Flow from Operations. The distributable cash payout ratio is calculated by dividing the distributions paid during the period by adjusted distributable cash. Adjusted distributable cash is a non-GAAP measure, whose nearest GAAP measure is Cash Flow from Operations. The Fund’s strategy has been to maintain a strong statement of financial position and improve its cash position and financial flexibility while maintaining consistent distributions in order to capitalize on growth opportunities. In addition, the Fund believes that, from time to time, the market price of the units may not fully reflect the underlying value of the units and that at such times the purchase of units would be in the best interest of the Fund. Such purchases increase the proportionate ownership interest of all remaining unitholders.
The Company grows, in part, through the acquisition or start-up of collision and glass repair and replacement businesses, or other businesses. Sources of capital that the Company has been successful at accessing in the past include public and private equity placements, convertible debt offerings, the use of equity securities to directly pay for a portion of acquisitions, capital available through strategic alliances with trading partners, capital lease financing, seller financing and both senior and subordinate debt facilities or by deferring possible future purchase price payments using contingent consideration and call or put options.
24. SEASONALITY
The Fund’s financial results for any individual quarter are not necessarily indicative of results to be expected for the full year. Interim period revenues and earnings are typically sensitive to regional and local weather, market conditions, and in particular, to cyclical variations in economic activity.
25. RELATED PARTY TRANSACTIONS
To broaden and deepen management ownership in the Fund, the Company established the Senior Managers Unit Loan Program (“Unit Loan Program”) in December 2012, which facilitated the one-time purchase of 121,607 of trust units held by Brock Bulbuck, President and Chief Executive Officer, and Tim O’Day, President and Chief Operating Officer US Operations, to existing Boyd trustees and senior managers. Only senior managers were eligible to receive loan support, and only up to 75% of each senior manager’s unit purchase. The loans bear interest at a fixed rate of 3% per annum with interest payable monthly. Each year, 2% of the original loan amount will be forgiven and applied as a reduction of the loan principal for the first five years of the loan. This forgiveness is conditional on the employee being employed by the Company and the employee not being in default of the loan. Participants are required to make monthly payments equal to .25% of the original principal amount. Beginning March 31, 2013 participants are required to make additional minimum repayments of principal equal to the lesser of 12.5% of their annual pre-tax bonus or 12.5% of the original loan amount. Participants are required to repay the loan in full on the earlier of termination of employment, the sale of the units, or ten years from the date of loan issuance. The loan can be repaid at any time without penalty; however, the 2% future annual forgiveness would be forfeited. Units purchased are held by the Company as security for repayment of the loan. Pursuant to the conditions of the senior manager unit loan program, loan repayments by senior managers amounted to $181 for 2015 (2014 - $196). At December 31, 2015, the carrying value of loans made under the Unit Loan Program included in Note receivable was $548 (2014 - $728).

BOYD GROUP INCOME FUND NOTES TO CONSOLIDATED FINANCIAL STATEMENTS For the years ended December 31, 2015 and 2014 (thousands of Canadian dollars, except unit, share and per unit/share amounts)
85
In certain circumstances the Company has entered into property lease arrangements where an employee of the Company is the landlord. The property leases for these locations do not contain any significant non-standard terms and conditions that would not normally exist in an arm’s length relationship, and the Fund has determined that the terms and conditions of the leases are representative of fair market rent values. The following are the lease expense amounts for facilities currently under lease with related parties:
Lease December 31, December 31,Landlord Affiliated Person(s) Location Expires 2015 2014
3577997 Manitoba Inc. Brock Bulbuck Selkirk, MB 2027 61$ 61$
Gerber Building No. 1 Ptnrp Eddie Cheskis & Tim O'Day
South Elgin, IL 2018 113$ 96$
The Fund’s subsidiary, The Boyd Group Inc., has declared dividends totaling $53 (2014 - $76), through BGHI to 4612094 Manitoba Inc., an entity controlled by a senior officer of the Fund. At December 31, 2015, 4612094 Manitoba Inc. owned 107,329 Class A common shares and 30,000,000 voting common shares of BGHI, representing approximately 30% of the total voting shares of BGHI.
26. SEGMENTED REPORTING
The Fund has one reportable line of business, being automotive collision repair and related services, with all revenues relating to a group of similar services. In this circumstance, IFRS requires the Fund to provide geographical disclosure. For the years reported, all of the Fund’s revenues were derived within Canada or the United States of America. Reportable assets include property, plant and equipment, goodwill and intangible assets which are all located within these two geographic areas.
Revenues 2015 2014
Canada 82,874$ 81,019$ United States 1,091,203 763,085
1,174,077$ 844,104$
For the years ended December 31,
Reportable Assets December 31, December 31, As at 2015 2014
Canada 16,428$ 15,993$ United States 443,917 327,869
460,345$ 343,862$ The Fund’s revenues are largely derived from the insurers of its customers, who are generally automobile owners. In
three Canadian provinces where the Fund operates, government-owned insurance companies have, by legislation, either exclusive or semi-exclusive rights to provide insurance to the Fund’s customers. Sales generated in these three markets represent approximately 4% (2014 – 5%) of the Fund’s total sales. Although the Fund’s services in these markets are predominately paid for by these government-owned insurance companies, the Fund’s customers (automobile owners) have freedom of choice of repair provider. In markets where non-government owned insurance companies are predominant, formal relationships with insurance companies such as Direct Repair Programs (“DRPs”) play an

BOYD GROUP INCOME FUND NOTES TO CONSOLIDATED FINANCIAL STATEMENTS For the years ended December 31, 2015 and 2014 (thousands of Canadian dollars, except unit, share and per unit/share amounts)
86
important role in generating sales volumes for the Fund. Although automobile owners still have the freedom of choice of repair provider, that choice can be influenced by the insurance companies with DRPs. Of the top five non-government owned insurance companies that the Fund deals with, which in aggregate account for approximately 49% (2014 – 47%) of total sales, one insurance company represents approximately 15% (2014 – 16%) of the Fund’s total sales, while a second insurance company represents approximately 14% (2014 – 15%).
27. COMPENSATION OF KEY MANAGEMENT Compensation awarded to key management included:
2015 2014
Salaries and short-term employee benefits 4,961$ 4,312$ Post-employment benefits 83 79 Long-term incentive plan 858 - Unit options 12,925 8,938
18,827$ 13,329$
For the years ended December 31,
Key management includes the Fund’s Trustees as well the most senior officers of the Fund and Subsidiary Companies. Effective January 1, 2015, a new long-term incentive plan for certain executive officers was adopted. For the year ended December 31, 2015, Performance Cash Awards were granted under the plan. Performance Cash Awards represent the right to receive payments, conditional, in whole or in part, upon the achievement of one or more objective performance goals. A Performance Cash Award granted under the Plan is denominated and payable in cash and will vest and be paid out pro-rata over a three-year period, subject to the terms of the plan. The Performance Periods for the 2015 Award are (i) January 1, 2015 to December 31, 2015 for the 1/3 of the Target Award eligible to vest on January 1, 2016; (ii) January 1, 2015 to December 31, 2016 for the 1/3 of the Target Award eligible to vest on January 1, 2017; and (iii) January 1, 2015 to December 31, 2017 for the 1/3 of the Target Award eligible to vest on January 1, 2018. On January 1, 2016, the plan granted Performance Cash Units for the 2016 grant year in place of Performance Cash Awards. Performance Cash Units are tied to unit value from date of grant to date of payment and will vest and be paid out pro-rata over a three-year period, subject to the terms of the plan. On December 22, 2015, the Board of Trustees approved a Directors Deferred Share Unit Plan (“DSUP”), effective December 31, 2015. The plan is administered through BGHI and requires Trustees, who are also Directors of BGHI, to receive at least 60% of their compensation in the form of deferred shares, which are essentially notional shares of BGHI and are redeemable for cash on termination. Trustees may elect to receive up to 100% of their compensation in the form of deferred shares. The number of deferred share units to which a Trustee is entitled will be adjusted for the payment of dividends or other cash distributions on the Class A common shares of BGHI.
28. EMPLOYEE EXPENSES
2015 2014
Salaries and short-term employee benefits 441,295$ 320,655$ Post-employment benefits 83 79 Long-term incentive plan 858 - Unit options 12,925 8,938
455,161$ 329,672$
For the years ended December 31,

BOYD GROUP INCOME FUND NOTES TO CONSOLIDATED FINANCIAL STATEMENTS For the years ended December 31, 2015 and 2014 (thousands of Canadian dollars, except unit, share and per unit/share amounts)
87
29. DEFINED CONTRIBUTION PENSION PLANS
The Fund has defined contribution pension plans for certain employees. The Fund matches U.S. employee contributions at rates up to 6.0% of the employees’ salary. The expense and payments for the year were $1,071 (2014 - $677). The Fund has established Retirement Defined Contribution Arrangement Trust Agreements for the CEO and previous Executive Chairman which qualify as retirement compensation arrangements as defined in the Income Tax Act (Canada), RSC 1985, c.1 (5th Supplement), as amended. The agreements specify that quarterly contributions are to be made until the end of 2024. In the case of the previous Executive Chairman, payments were made until January, 2014, at which time the balance was paid to settle the remaining obligation. During 2015, $83 (2014 - $818) was paid related to these arrangements.
30. LOSS PER UNIT
2015 2014
Net loss (21,962)$ (15,311)$ Basic and diluted weighted average number of units 16,470,702 15,331,353
Basic and diluted loss per unit (1.333)$ (0.999)$
For the years ended December 31,
Exchangeable class A shares, unit options, convertible debentures and the non-controlling interest put options are instruments that could potentially dilute basic earnings (loss) per share in the future, but were not included in the calculation of diluted earnings (loss) per share because they are anti-dilutive for the periods presented.
31. CHANGES IN NON-CASH OPERATING WORKING CAPITAL ITEMS
2015 2014
Accounts receivable (8,233)$ 4,992$ Inventory (1,726) (1,395) Prepaid expenses (1,804) (2,445) Accounts payable 20,965 336 Income taxes, net (2,061) 754
7,141$ 2,242$
For the years ended December 31,
32. SUBSEQUENT EVENTS
On January 5, 2016, the Fund completed the early redemption and cancellation of its 5.75% Convertible Unsecured Subordinated Debentures due December 31, 2017. Subsequent to the initial announcement of the early redemption, $24,012,000 principal amount of the Debentures were converted into 1,026,152 units of the Fund. The remaining $192,000 in Debentures were redeemed and cancelled by issuing 3,000 units. As a result of redemption and cancellation, the convertible debentures listed on the Toronto Stock Exchange under the symbol “BYD.DB” were de-listed. On January 11, 2016, the Fund completed the settlement of the unit options issued on January 11, 2006. As a result of the settlement, 200,000 units were issued at an exercise price of $1.91. The fair value of the unit options at settlement was $12,050.

88
BOARD OF TRUSTEES The Boyd Group Income Fund Board of Trustees consists of seven members – two that are officers of the Fund and five that are independent Trustees. The Chairman of the Board is Allan Davis. The Boyd Group Income Fund Board of Trustees has established three standing committees: The Corporate Governance and Nomination Committee, The Audit Committee, and the Executive Compensation Committee. The Corporate Governance and Nomination Committee is chaired by Sally Savoia and includes all of the independent Trustees. The Audit Committee is chaired by Allan Davis and includes Dave Brown and Gene Dunn. The Executive Compensation Committee is chaired by Gene Dunn and includes David Brown, Robert Gross and Sally Savoia. David Brown is currently President and CEO of Richardson Capital and Managing Director of RBM Capital Limited. Previously, he was Corporate Secretary of James Richardson & Sons, Limited, and a partner in the independent law and accounting firm of Gray & Brown. In addition to serving on the Board of Trustees of the Fund, he also serves as a Director of GMP Capital, Inc., Plastic Moulders Limited, Trillium Health Care Products, and Richardson Financial Group. He graduated from the University of Manitoba law school, and is a Chartered Professional Accountant and member of the Manitoba Bar Association. Brock Bulbuck is the President and CEO of the Fund. Since joining Boyd in 1993, he has played a leading role in the development and growth of the business. He is a Chartered Professional Accountant and is responsible for the affairs of the Fund, including strategy, operations and performance In addition to serving on the Board of Trustees of the Fund, he is also Past Chair of the Winnipeg Football Club Board of Directors, a member of the Canadian Football League Board of Governors and a Director of the Pan Am Clinic Foundation. Allan Davis is the Independent Chairman of the Fund’s Board of Trustees. He is also President and Director of AFD Investments Inc., a Winnipeg based management consulting firm. In addition to serving on the Board of Trustees, he is also a member of the Exchange Income Corporation Board of Directors. Gene Dunn is the Chairman of Monarch Industries Ltd. of Winnipeg, a leading Canadian manufacturing company, where he previously served as President and CEO. In addition to serving on the Board of Trustees of the Fund, he is also a member of the Board of Cubresa Corporation, a medical imaging company. He is Past Chairman of the Board of Governors for Balmoral Hall School for Girls and Past Chairman of the Winnipeg Blue Bombers Football Club. Mr. Dunn is also the Past Chairman of the Board of Governors of the Canadian Football League. Robert Gross is the Executive Chairman of Monro Muffler Brake Inc., the largest chain of company-operated automotive undercar repair and tire service facilities in the United States. He served as CEO of Monro from 1999 until October 2012. Prior to his time at Monro, he served as Chairman and CEO at Tops Appliance City, Inc. and before that as President and COO at Eye Care Centers of America, Inc., a Sears, Roebuck & Co. company. Tim O’Day is Boyd’s President and COO, U.S. Operations. He joined Gerber Collision & Glass in February 1998. With Boyd Group’s acquisition of Gerber in 2004, he was appointed COO for Boyd’s U.S Operations. In 2008, he was appointed President and COO for U.S. Operations. Earlier in his career, he was with Midas International, where he was elevated to Vice President–Western Division, responsible for a territory that encompassed 500 Midas locations. Mr. O’Day also serves on the I-Car Board and served on the Board of the Collision Repair Education Foundation until March 2016 for a period of six years. Sally Savoia is a former Vice President and Chief Human Resource Officer for Praxair Inc. and since her retirement in 2014, has served as an independent corporate consultant. Ms. Savoia’s human resources experience includes executive compensation design and implementation, executive level succession planning, global talent management, leadership development, diversity and inclusion efforts and global benefits design.

89
CORPORATE DIRECTORY COMPANY OFFICERS & PRIMARY SUBSIDIARY COMPANY OFFICERS
Brock Bulbuck President &
Chief Executive Officer
Narendra (Pat) Pathipati Executive Vice President, Chief Financial Officer &
Secretary-Treasurer
Tim O’Day * President & Chief Operating
Officer US Operations
Eric Danberg President
Canadian Operations
Kevin Comrie Chief Marketing Officer
Stephen Boyd Vice President,
Corporate Development
Gary Bunce * Senior Vice President,
Marketing & Sales US Operations
Kevin Burnett * Vice President Operations,
Illinois, Oklahoma & Kansas
Tom Csekme *
Vice President Operations, Arizona, Nevada, Georgia
& Utah
Rex Dunn * President,
True2Form Collision Repair Centers
Vince Claudio * Vice President Operations,
Washington, Colorado, Idaho & Oregon
Jeff Murray Vice President,
Finance
Larry Jaskowiak * Vice President Operations,
Indiana, Florida
Paul J. Ruiter * Chief HR Officer
Assistant Secretary, True2Form Collision Repair Centers
Frank Alessia * Assistant Secretary,
Nevada
Herb Rabatin * Vice President Operations,
Maryland, Ohio, Pennsylvania
Jeremy Overweg * Vice President Operations,
Michigan
Rob Robbins * Vice President, Sales and
Marketing Glass America
Eddie Cheskis * Chief Executive Officer,
Glass America
Mark Flasch * Vice President,
Gerber National Claims Services
Rob Vaca * Senior Vice President,
Glass America
Mike Kellman * Vice President Glass America
* Officers of subsidiary companies only CORPORATE OFFICE 3570 Portage Avenue Telephone: (204) 895-1244 Winnipeg, Manitoba, Canada Fax: (204) 895-1283 R3K 0Z8 Website: www.boydgroup.com For location information, please visit us at www.boydgroup.com

90
UNITHOLDER INFORMATION BOYD GROUP INCOME FUND UNITS AND EXCHANGE LISTING Units of the Fund are listed on the Toronto Stock Exchange under the symbol BYD.UN The Fund’s convertible debentures are listed on the Toronto Stock Exchange under the symbol BYD.DB.A
Registrar, Transfer Agents and Distribution Agents
Legal Counsel
Auditors
Computershare Trust Company 8th Floor, 100 University Avenue Toronto, Ontario M5J 2Y1
Thompson Dorfman Sweatman 2200 – 201 Portage Avenue Winnipeg, Manitoba R3B 3L3
Deloitte LLP 2200 – 360 Main Street Winnipeg, Manitoba R3C 3Z3
Bank Syndicate Lead Member Toronto-Dominion Bank TD North Tower 77 King Street West, 25th Floor Toronto, Ontario M5K 1A2
Additional Bank Syndicate Members Bank of America N.A., Canada Branch The Bank of Nova Scotia National Bank of Canada
Annual General Meeting
Thursday, May 19, 2016 Victoria Inn Hotel and Convention Centre
1808 Wellington Avenue Winnipeg, Manitoba
R3H 0G3 5:00 p.m. (CDT)


