2015 AnnuAl RepoRt Annual Report contains forward-looking statements, and actual results could...
156
2015 ANNUAL REPORT
Transcript of 2015 AnnuAl RepoRt Annual Report contains forward-looking statements, and actual results could...

2015 AnnuAl RepoRt

(This page intentionally left blank)

Intel is evolving from a PC company to one that powers the infrastructure for an increasingly smart and connected world. While 2015 started with challenges in PC market demand as well as macroeconomic and currency conditions, we finished the year strong. Our financials demonstrate a strategy that’s working and provide a solid foundation for growth.
Intel reported full-year revenue of $55.4 billion, which was nearly flat versus 2014. Record revenue in the data center, Internet of Things, and memory businesses mostly offset the decline in PC demand. These businesses made up 40% of our revenue and delivered $2.2 billion in profitable revenue growth. This was the first year that these growth areas made up the majority of our operating profit. We also sharpened the focus of our Intel Security Group and exceeded our previously stated goal of improving mobile profitability by $800 million.
Intel’s business model is evolvingWhile the client computing business will continue to be a valuable source of cash flow and intellectual property (IP), our business model is evolving. The data center and Internet of Things businesses are the primary growth engines for Intel, and memory and field-programmable gate arrays (FPGAs) can accelerate these opportunities—forming and fueling a virtuous cycle of growth.
The ability to integrate and reuse IP across a broad portfolio of products also differentiates our strategy and allows us to evolve in new ways. We reuse IP from our client computing business, for example. We also plan to reuse the IP we gained with our acquisition of Altera to deliver a new class of integrated microprocessor and FPGA products for our data center and Internet of Things customers.
Expanding the boundaries of technologyIntel’s relentless pursuit of Moore’s Law is foundational to our strategy and another valuable differentiator. Our manufacturing leadership allows us to continuously push the limits of performance and functionality. As a result, we expand the boundaries of technology to make the most amazing experiences possible. I’m proud that in addition to delivering solid financials that demonstrate our evolution, we delivered innovation. We launched our best processor ever—the 14-nanometer 6th generation Intel® Core™ processor—and a new, low-power Intel® Curie™ processor for wearables and other Internet of Things devices. We also announced 3D XPoint™ technology, a revolutionary new class of memory, and kicked off an ambitious cloud computing initiative that is accelerating public, private, and hybrid cloud adoption.
Setting challenging goals to evolve how we do businessAt Intel, we also tackle significant societal challenges, setting transparent and ambitious goals to address corporate responsibility issues. In 2015, we launched our Diversity and Inclusion initiative, setting a bold hiring and retention goal to achieve full1 representation of women and underrepresented minorities in Intel’s U.S. workforce by 2020. I’m also incredibly proud that a thorough compensation analysis showed we’re at 100% gender pay parity for U.S. employees across job types and levels.2 In addition, we continued our efforts to establish a conflict-free3 supply chain for Intel products. Maintaining accountability in the supply chain will be an ongoing process for Intel.
A strong foundation for growthIn 2015, we delivered results that showed our strategy is working. As we move forward, we will continue to focus on flawless execution and making amazing experiences possible. We’ll also broaden our data center and Internet of Things product portfolios with the Altera acquisition. In summary, we’ll continue pivoting to power the infrastructure for the smart and connected world as we diversify beyond our PC business. We’ve built a strong foundation for long-term growth for the company, but there’s more work to do to continue Intel’s evolution.
Brian M. Krzanich, Chief Executive Officer
Letter From Your CEO
Past performance does not guarantee future results. This Annual Report contains forward-looking statements, and actual results could differ materially. Risk factors that could cause actual results to differ are set forth in the “Risk Factors” section and throughout our 2015 Form 10-K, which is included in this Annual Report. These risk factors are subject to update by our future filings and submissions with the U.S. Securities and Exchange Commission and earnings releases.
1 Full representation (or full workforce representation) is the point at which Intel’s workforce in the U.S. matches the supply of skilled talent available (market availability) for current roles at Intel.
2 Parity is the quality or state of being equal or equivalent. Data does not include subsidiaries.3 “Conflict free” as used here refers to supply chains whose sources of conflict minerals (tantalum, tin, tungsten and/or gold) do not, based on our due diligence, finance or benefit
armed groups in the Democratic Republic of the Congo or adjoining countries. Additional information about Intel’s conflict-free efforts is available at conflictfree.intel.com.

(This page intentionally left blank)

Intel is a technology company. We invent things. Our obligation to you, the owners, is to take those inventions and create business value to earn a return on our efforts.
Many of the Board’s strategic conversations in 2015 focused on how best to allocate resources for stockholder value. The company is investing more in growing and emerging businesses in the data center, Internet of Things, and memory. And it is spending less in mature, less profitable, or less strategic businesses.
In the data center, we have strengthened the core CPU franchise and also expanded it with investments in new capabilities, such as fabrics, silicon photonics, and customization. The data center is Intel’s most significant opportunity for potential growth.
The Internet of Things segment is achieving high growth rates as it builds on its traditional embedded processor business and finds new opportunities in the cloud with solutions and technologies from across the company. This also adds value to other businesses at Intel.
The memory segment continues to innovate and achieve high and profitable growth with NAND technology and solid-state drive (SSD) solutions. The introduction of 3D NAND and 3D XPoint technologies has the potential to help us deliver better solutions to customers in the data center and other businesses in the company.
The PC business continues to be a vital source of technology, production volume, and profits. We are maximizing the return in a difficult environment. Continuing product innovation and segmentation have helped protect pricing even as unit volume declines. Many of the strategic investments that have made this possible are also key to building other businesses at Intel.
The foundation for all of this is silicon technology. Moore’s Law has defined our past and will shape our business and company for years to come.
The Board made a large allocation of capital in 2015 to fund the acquisition of Altera, which closed in 2016. We expect Altera to augment efforts in the data center and Internet of Things. We have also increased capital commitments to new memory technologies that are enabling important opportunities for the non-volatile SSD and data center businesses. And we continue to invest in leading-edge manufacturing capabilities.
As part of its regular review of cash policy, the Board approved an eight-cent increase in the cash dividend to $1.04 on an annual basis, beginning in the first quarter of 2016. Intel repurchased $3.0 billion worth of Intel stock in 2015. The total cash returned to stockholders through dividends and repurchases in 2015 was $7.6 billion.
One of the highlights of the last year for me personally was the public dialogue around the 50th anniversary of Moore’s Law. It was encouraging to see the interest it generated, with thousands of stories reaching millions of people in 39 countries.
People often think that Moore’s Law is all about technology. In fact, Gordon’s original paper was about economics. As with each of our founders, Gordon made the successful transition from scientist to businessman. He understood the obligation to owners and the need to connect innovation to business.
That tradition is very much alive today at Intel. The mandates to innovate and to create business value remain important aspects of Intel culture. So does the emphasis on execution and results.
This is a time of significant change. There is more work to do, and we expect to report continuing progress.
Letter From Your Chairman Financial Results
Cash from OperationsDollars in billions
21.018.9
20.8 20.419.0
2011 2012 2013 2014 2015
25
20
15
10
5
35.438.3 37.6
35.1
43.6
54.0 53.3 52.755.9 55.4
06 07 08 09 10 11 12 13 14 15
Net RevenueDollars in billions
60
50
40
30
20
10
2.392.13
1.89
2.31 2.33
2011 2012 2013 2014 2015
Diluted Earnings Per ShareDollars
2.50
2.00
1.50
1.00
.50
0.780.87 0.90 0.90
0.96
2011 2012 2013 2014 2015
Dividends Per Share PaidDollars
1.00
0.80
0.60
0.40
0.20
Andy D. Bryant, Chairman of the Board

(This page intentionally left blank)
UNITED STATES SECURITIES AND EXCHANGE COMMISSIONWashington, D.C. 20549
FORM 10-K(Mark One)
È ANNUAL REPORT PURSUANT TO SECTION 13 OR 15(d) OF THE SECURITIESEXCHANGE ACT OF 1934For the fiscal year ended December 26, 2015.
or
‘ TRANSITION REPORT PURSUANT TO SECTION 13 OR 15(d) OF THE SECURITIESEXCHANGE ACT OF 1934For the transition period from to .
Commission File Number 000-06217
INTEL CORPORATION(Exact name of registrant as specified in its charter)
Delaware 94-1672743
State or other jurisdiction ofincorporation or organization
(I.R.S. EmployerIdentification No.)
2200 Mission College Boulevard, Santa Clara, California 95054-1549
(Address of principal executive offices) (Zip Code)
Registrant’s telephone number, including area code (408) 765-8080
Securities registered pursuant to Section 12(b) of the Act:Title of each class Name of each exchange on which registered
Common stock, $0.001 par value The NASDAQ Global Select Market*
Securities registered pursuant to Section 12(g) of the Act:None
Indicate by check mark if the registrant is a well-known seasoned issuer, as defined in Rule 405 of the Securities Act. Yes È No ‘
Indicate by check mark if the registrant is not required to file reports pursuant to Section 13 or Section 15(d) of the Act. Yes ‘ No È
Indicate by check mark whether the registrant (1) has filed all reports required to be filed by Section 13 or 15(d) of the Securities Exchange Actof 1934 during the preceding 12 months (or for such shorter period that the registrant was required to file such reports), and (2) has beensubject to such filing requirements for the past 90 days. Yes È No ‘
Indicate by check mark whether the registrant has submitted electronically and posted on its corporate website, if any, every interactive data filerequired to be submitted and posted pursuant to Rule 405 of Regulation S-T (§ 232.405 of this chapter) during the preceding 12 months (or forsuch shorter period that the registrant was required to submit and post such files). Yes È No ‘
Indicate by check mark if disclosure of delinquent filers pursuant to Item 405 of Regulation S-K (§229.405 of this chapter) is not containedherein, and will not be contained, to the best of registrant’s knowledge, in definitive proxy or information statements incorporated by reference inPart III of this Form 10-K or any amendment to this Form 10-K. ‘
Indicate by check mark whether the registrant is a large accelerated filer, an accelerated filer, a non-accelerated filer, or a smaller reportingcompany. See the definitions of “large accelerated filer,” “accelerated filer,” and “smaller reporting company” in Rule 12b-2 of the Exchange Act.
Large accelerated filer È Accelerated filer ‘ Non-accelerated filer ‘ Smaller reporting company ‘(Do not check if a smaller reporting company)
Indicate by check mark whether the registrant is a shell company (as defined in Rule 12b-2 of the Act). Yes ‘ No È
Aggregate market value of voting and non-voting common equity held by non-affiliates of the registrant as of June 26, 2015, based upon theclosing price of the common stock as reported by The NASDAQ Global Select Market on such date, was
$147.3 billion4,724 million shares of common stock outstanding as of February 5, 2016
DOCUMENTS INCORPORATED BY REFERENCE
Portions of the registrant’s proxy statement related to its 2016 Annual Stockholders’ Meeting to be filed subsequently are incorporated byreference into Part III of this Annual Report on Form 10-K. Except as expressly incorporated by reference, the registrant’s proxy statement shallnot be deemed to be part of this report.

(This page intentionally left blank)

INTEL CORPORATION
FORM 10-K
FOR THE FISCAL YEAR ENDED DECEMBER 26, 2015
INDEX
Page
PART I
Item 1. Business . . . . . . . . . . . . . . . . . . . . . . . . . . . . . . . . . . . . . . . . . . . . . . . . . . . . . . . . . . . . . . . . . . . . . . . . . . . . . . . 1
Item 1A. Risk Factors . . . . . . . . . . . . . . . . . . . . . . . . . . . . . . . . . . . . . . . . . . . . . . . . . . . . . . . . . . . . . . . . . . . . . . . . . . . . . 21
Item 1B. Unresolved Staff Comments . . . . . . . . . . . . . . . . . . . . . . . . . . . . . . . . . . . . . . . . . . . . . . . . . . . . . . . . . . . . . . . . 31
Item 2. Properties . . . . . . . . . . . . . . . . . . . . . . . . . . . . . . . . . . . . . . . . . . . . . . . . . . . . . . . . . . . . . . . . . . . . . . . . . . . . . . . 31
Item 3. Legal Proceedings . . . . . . . . . . . . . . . . . . . . . . . . . . . . . . . . . . . . . . . . . . . . . . . . . . . . . . . . . . . . . . . . . . . . . . . . 31
Item 4. Mine Safety Disclosures . . . . . . . . . . . . . . . . . . . . . . . . . . . . . . . . . . . . . . . . . . . . . . . . . . . . . . . . . . . . . . . . . . . 31
PART II
Item 5. Market for Registrant’s Common Equity, Related Stockholder Matters and Issuer Purchases of EquitySecurities . . . . . . . . . . . . . . . . . . . . . . . . . . . . . . . . . . . . . . . . . . . . . . . . . . . . . . . . . . . . . . . . . . . . . . . . . . . . . 32
Item 6. Selected Financial Data . . . . . . . . . . . . . . . . . . . . . . . . . . . . . . . . . . . . . . . . . . . . . . . . . . . . . . . . . . . . . . . . . . . . 34
Item 7. Management’s Discussion and Analysis of Financial Condition and Results of Operations . . . . . . . . . . . . . . . . 35
Item 7A. Quantitative and Qualitative Disclosures About Market Risk . . . . . . . . . . . . . . . . . . . . . . . . . . . . . . . . . . . . . . . . 60
Item 8. Financial Statements and Supplementary Data . . . . . . . . . . . . . . . . . . . . . . . . . . . . . . . . . . . . . . . . . . . . . . . . . . 62
Item 9. Changes in and Disagreements With Accountants on Accounting and Financial Disclosure . . . . . . . . . . . . . . . 132
Item 9A. Controls and Procedures . . . . . . . . . . . . . . . . . . . . . . . . . . . . . . . . . . . . . . . . . . . . . . . . . . . . . . . . . . . . . . . . . . . 132
Item 9B. Other Information . . . . . . . . . . . . . . . . . . . . . . . . . . . . . . . . . . . . . . . . . . . . . . . . . . . . . . . . . . . . . . . . . . . . . . . . . 133
PART III
Item 10. Directors, Executive Officers and Corporate Governance . . . . . . . . . . . . . . . . . . . . . . . . . . . . . . . . . . . . . . . . . . 134
Item 11. Executive Compensation . . . . . . . . . . . . . . . . . . . . . . . . . . . . . . . . . . . . . . . . . . . . . . . . . . . . . . . . . . . . . . . . . . . 134
Item 12. Security Ownership of Certain Beneficial Owners and Management and Related Stockholder Matters . . . . . . . 135
Item 13. Certain Relationships and Related Transactions, and Director Independence . . . . . . . . . . . . . . . . . . . . . . . . . . 135
Item 14. Principal Accounting Fees and Services . . . . . . . . . . . . . . . . . . . . . . . . . . . . . . . . . . . . . . . . . . . . . . . . . . . . . . . 135
PART IV
Item 15. Exhibits, Financial Statement Schedules . . . . . . . . . . . . . . . . . . . . . . . . . . . . . . . . . . . . . . . . . . . . . . . . . . . . . . . 136

(This page intentionally left blank)

PART I
ITEM 1. BUSINESS
Company Overview
We are a leader in the design and manufacturing of advanced integrated digital technology platforms. A platform consists of amicroprocessor and chipset, and may be enhanced by additional hardware, software, and services. We sell these platformsprimarily to original equipment manufacturers (OEMs), original design manufacturers (ODMs), and industrial and communicationsequipment manufacturers in the computing and communications industries. Our platforms are used across the computecontinuum, in notebooks (including Ultrabook™ devices), 2 in 1 systems, desktops, servers, tablets, phones, and the Internet ofThings (including wearables, retail devices, and manufacturing devices). We also develop and sell software and services primarilyfocused on security and technology integration. We were incorporated in California in 1968 and reincorporated in Delaware in1989.
Company Strategy
Our vision is if it is smart and connected, it is best with Intel®. As a result, our strategy is to offer complete and connected platformcomputing solutions, consisting of both hardware and software, and to continue to drive “Moore’s Law.” Through enhancedenergy-efficient performance, connectivity, and security, we enable platform solutions that span the compute continuum, fromhigh-performance computing systems running trillions of operations per second to embedded applications consuming milliwatts ofpower.
The boundaries of computing itself are expanding, with billions of devices connected to the Internet and to one another.Computing is becoming increasingly personal and enhancing nearly all aspects of life, an evolution that we refer to as the“personalization of compute.” As the personalization of compute continues, we believe the following three key assumptions arecritical to our strategy:• sensification of compute—as computing becomes increasingly personal, users will demand that it capture the human senses
such as sight, sound, and touch;• smart and connected—more and more devices will be able to process data and connect to the cloud, other devices, or
people; and• extension of you—increasingly personal digital devices and their many form factors will become even more ubiquitous in our
lives.
1

These assumptions drive us to develop complete and connected platform solutions and compelling user experiences. Theseassumptions also drive synergistic growth in our Data Center Group, Internet of Things Group, and Non-Volatile MemorySolutions Group operating segments.
As more devices become smart and connected, specifically inthe Internet of Things (IOT), there is greater demand for datacenters to not only connect these devices, but also to captureand analyze the data they create. In addition, improvementsin memory technology are enabling faster and more efficientmicroprocessors. We call the cycle of growth that occurs asthese three market segments feed each other the “VirtuousCycle of Growth.” As we execute to our strategy, thesemarket segments will continue to have greater impact on ourresults and our future as a company.
We expect that our acquisition of Altera Corporation (Altera),completed subsequent to fiscal year-end 2015, will benefitthis cycle of growth. The Altera acquisition is an example ofour efforts to expand our reach within the computecontinuum, as we believe that combining our leading-edgeproducts and manufacturing process with Altera’s leadingfield-programmable gate array (FPGA) technology will enablenew classes of platforms that meet customer needs in thedata center and Internet of Things market segments.
Virtuous Cycle of Growth
DATACENTER
MEMORY
IOT
To succeed in this changing computing environment, we have the following key objectives:• relentlessly pursue Moore’s Law to maximize and extend our manufacturing technology leadership;• strive to ensure that Intel® technology is the best choice across the compute continuum and across any operating system;• enable smart and connected devices through continued development of industry-leading communications and connectivity
technology;• expand platforms into adjacent market segments to bring compelling new platform solutions and user experiences to form
factors across the compute continuum;• increase the utilization of our investments in intellectual property and research and development (R&D) across all market
segments;• expand the data center, the Internet of Things, and next-generation memory;• scale our manufacturing capabilities into foundry; and• strive to increase the diversity and inclusion of our workforce, reduce the environmental footprint of our products and
operations, and be an asset to the communities where we conduct business.
2

We use our core assets to meet these objectives. We believe that applying our core assets to our key objectives provides us withthe scale, capacity, and global reach to establish new technologies and respond to customers’ needs quickly. Our core assetsand key objectives include the following:• Silicon and Manufacturing Technology Leadership. We have long been a leader in silicon process technology and
manufacturing, and we aim to continue our lead through investment and innovation in this critical area. Intel co-founderGordon Moore predicted, in what has become known as Moore’s Law, that transistor density on integrated circuits woulddouble about every two years. We continue executing to Moore’s Law by enabling new devices with higher functionality andcomplexity while controlling power, cost, and size. In keeping with Moore’s Law, we drive a regular and predictable upgradecycle—introducing the next generation of silicon process technology approximately every two to three years. Through thiscycle, we continue to push progress by designing and putting transistor innovations into high-volume production. We aim tohave the best process technology, and unlike many semiconductor companies, we primarily manufacture our products in ourown facilities. This in-house manufacturing capability enables us to optimize performance, shorten our time-to-market, andscale new products more rapidly. We believe this competitive advantage will be extended in the future as the costs to buildleading-edge fabrication facilities increase, and as fewer semiconductor companies will be able to leverage platform designand manufacturing.
• Architecture and Platforms. We believe that users want consistent computing experiences and interoperable devices, andthat users and developers value consistency of a standardized architecture. This standardized architecture provides acommon framework that results in shortened time-to-market, increased innovation, and the ability to leverage technologiesacross multiple form factors. We have an advantage over most competitors because we are able to share intellectualproperty across our platforms and operating segments, which reduces our costs and provides a higher return on capital inour growth market segments (e.g., the data center, Internet of Things, and memory). The combination of our sharedintellectual property portfolio and our interchangeable manufacturing and assembly and test assets allows us to seamlesslyshift our production capabilities to respond to market demand. We believe that we can meet the needs of users anddevelopers by offering complete solutions across the compute continuum through our partnership with the industry on open,standards-based platform innovation around Intel® architecture. We continue to invest in improving Intel architecture todeliver increased value to our customers and expand the capabilities of the architecture in adjacent market segments. Forexample, we focus on delivering improved energy-efficient performance, which involves balancing higher performance withthe lowest power. In addition, the personalization of compute continues to drive our strategy as we focus on technologiessuch as perceptual computing, which brings exciting experiences through devices that sense, perceive, and interact with theuser’s actions.
• Software and Services. We offer software and services that provide solutions through a combination of hardware andsoftware for consumer and corporate environments. Additionally, we seek to enable and advance the computing ecosystemby providing development tools and support to assist software developers in creating software applications that takeadvantage of our platforms. We seek to expedite growth in various market segments through our software offerings. Wecontinue to collaborate with companies to develop software platforms that are optimized for Intel® processors, and thatsupport multiple hardware architectures and operating systems.
• Security. Through our expertise in hardware and software, we are able to embed security into many facets of computing andbring unique hardware, software, and end-to-end security solutions to the market. We offer proactive solutions and servicesto help secure the world’s most critical systems and networks. Additionally, through our McAfee® security products, weprotect consumers and businesses of all sizes by helping detect and eliminate ever-evolving security threats.
3

• Customer Orientation. We focus on providing compelling user experiences by developing our next generation of productsbased on customer needs and expectations. In turn, our products help enable the design and development of new userexperiences, form factors, and usage models for businesses and consumers. For example, we enhance the computingexperience by providing Intel® RealSense™ technology, password elimination, and our next-generation Thunderbolt™ 3technology. Our latest Thunderbolt technology significantly increases the speed at which data and video can be transferredon a single cable, while simultaneously supplying power. We offer platforms that incorporate various components andcapabilities designed and configured to work together to provide an optimized solution that customers can easily integrateinto their products. Additionally, we have entered into strategic partnerships across multiple industries with a variety ofmanufacturers, including: Microsoft Corporation; Fossil Group, Inc.; LVMH Moët Hennessy Louis Vuitton SE; SMS Audio,LLC; Opening Ceremony, LLC; and others. Furthermore, we promote industry standards that we believe will yield innovationand improved technologies for users.
• Acquisitions and Strategic Investments. In Q1 2016, we completed the acquisition of Altera. Altera is a global semiconductorcompany that designs and sells programmable semiconductors and related products, including programmable logicdevices—which incorporate FPGAs and complex programmable logic devices—and highly integrated System-on-Chip (SoC)devices. As a result of the acquisition, we expect to integrate approximately 3,000 Altera employees. The acquisition of Alterareflects our strategy to drive Moore’s Law and fuel growth in the data center and Internet of Things market segments. As wedevelop future platforms, the integration of PLDs into our platform solutions will improve the overall performance and lowerthe cost of ownership for our customers. Additionally, we make investments in companies around the world that we believewill further our vision, mission, and strategic objectives; support our key business initiatives; and generate financial returns.Our investments—including those made through Intel Capital—generally focus on companies and initiatives that we believewill stimulate growth in the digital economy, create new business opportunities for Intel, and expand global markets for ourproducts. During 2015, we invested $966 million in Beijing UniSpreadtrum Technology Ltd. (UniSpreadtrum), a holdingcompany under Tsinghua Unigroup Ltd. (an operating subsidiary of Tsinghua Holdings Co. Ltd.), to, among other things,jointly develop Intel architecture-based and communications-based solutions for phones. Additionally, we plan to continue topurchase and license intellectual property to support our current and expanding business.
• Corporate Responsibility. Diversity and inclusion are integral parts of Intel’s competitive strategy and vision. In January2015, Intel announced the Diversity in Technology initiative, setting a goal to achieve higher representation of women andunderrepresented minorities in Intel’s U.S. workforce by 2020. We are also investing $300 million to help build the STEMpipeline, to support hiring and retaining more women and underrepresented minorities, and to fund programs to support morepositive representation within the technology and gaming industries. We are committed to empowering people and expandingeconomic opportunity through education and technology, driven by our corporate and Intel Foundation programs, policyleadership, and collaborative engagements. In addition, we strive to cultivate an inclusive work environment in whichengaged, energized employees can thrive in their jobs and in their communities. We work to develop energy-efficienttechnology solutions that can be used to address major global problems while reducing our environmental impact. We havealso led the industry on the “conflict minerals” issue and have worked extensively since 2008 to put in place processes andsystems to develop ethical sourcing of tin, tantalum, tungsten, and gold for Intel and to prevent profits from the sale of thoseminerals from funding conflict in the Democratic Republic of the Congo (DRC) and adjoining countries.
We strive to strengthen our competitive position as we enter and expand into adjacent market segments. These market segmentschange rapidly, and we need to adapt to new environments. A key characteristic of these adjacent market segments is low powerconsumption based on SoC products. We are making significant investments in this area with the accelerated development of ourSoC solutions based on the 64-bit Intel® Atom™ microarchitecture and Intel® Quark™ technology. We are also optimizing ourserver products for energy-efficient performance, as we believe that increased Internet traffic and the use of mobile devices, theInternet of Things, and data center applications have created the need for improved data center infrastructure and energyefficiency.
4

Business Organization
In Q1 2015, we made changes in our organizational structure to reflect our strategy to address all aspects of the client computingmarket segment and utilize our intellectual property to offer compelling customer solutions. As of December 26, 2015, we manageour business through the following operating segments:
All other
Software and services operating segments (SSG)
Data Center Group (DCG)
Internet of Things Group (IOTG)
Client Computing Group (CCG)
New Devices Group
Software and Services GroupIntel Security Group
Non-Volatile Memory Solutions Group (NSG)
For a description of our operating segments, see “Note 26: Operating Segments and Geographic Information” in Part II, Item 8 ofthis Form 10-K.
Products
Platforms
We offer platforms that incorporate various components and technologies, including a microprocessor and chipset, a stand-aloneSoC, or a multichip package. A platform may be enhanced by additional hardware, software, and services.
A microprocessor—the central processing unit (CPU) of a computer system—processes system data and controls other devicesin the system. We offer microprocessors with one or multiple processor cores. Multi-core microprocessors can enable improvedmultitasking and energy-efficient performance by distributing computing tasks across two or more cores. In addition, many of ourprocessor families integrate graphics functionality onto the processor die.
A chipset sends data between the microprocessor and input, display, and storage devices, such as the keyboard, mouse,monitor, hard drive or solid-state drive, and optical disc drives. Chipsets extend the audio, video, and other capabilities of manysystems and perform essential logic functions, such as balancing the performance of the system and removing bottlenecks.
We offer and continue to develop SoC products that integrate our CPUs with other system components, such as graphics, audio,imaging, communication and connectivity, and video, onto a single chip. SoC products are designed to reduce total cost ofownership, provide improved performance due to higher integration and the lowest power, and enable form factors such astablets, phones, Ultrabook devices, and 2 in 1 systems, as well as notebooks, desktops, data center products, and the Internet ofThings.
5

We offer a multichip package that integrates the chipset on one die, with the CPU and graphics on another die, connected via alower-power, on-package interface. Similar to an SoC, the multichip package can provide improved performance due to higherintegration coupled with the lowest power consumption, which enables smaller form factors. In 2015, we released our 6thgeneration Intel® Core™ processor, formerly code-named Skylake.
We also offer features designed to improve our platform capabilities, such as:• Intel vPro™ technology, a solution for manageability, security, and business user experiences in the notebook, desktop, and
2 in 1 systems and select Internet of Things market segments. Intel vPro technology is designed to provide businesses withincreased manageability, upgradeability, energy-efficient performance, and security while lowering the total cost ofownership;
• Intel RealSense technology, which—in conjunction with the latest Intel processors—enables a device to perceive depthsimilar to how a person does. This technology brings new opportunities for the personalization of compute to evolve; and
• True Key™ technology, which allows users to access devices through facial recognition and other biometric technologies,thereby eliminating the need for log-in passwords.
6

We offer a range of platforms based upon the following microprocessors:
Intel® Pentium® Processor Designed to deliver quality, reliability, and performance for work and play
Intel® Celeron® ProcessorDesigned to deliver quality, reliability, and performance for work and play
Intel® Core™ i ProcessorDesigned to deliver maximum performance and built-in security for themost demanding applications
Intel® Xeon® ProcessorDesigned to deliver advanced performance and energy efficiency for costeffective solutions that scale to address diverse compute, network, andstorage requirements
Intel® Xeon Phi™ ProcessorDesigned to deliver optimized performance for highly parallel workloads
Intel® Itanium® ProcessorDesigned to deliver mainframe reliability and enterprise performance on aplatform that shares common characteristics of the rest of the data center
Intel® Quark™ ProcessorDesigned with a level of integration for applications where lower power,size, and cost take priority including wearable technologies and the nextgeneration of intelligent, connected devices
Intel® Atom™ ProcessorDesigned to deliver performance and mobility in tablets, and 2 in 1 systems,and smartphones as well as power-efficiency in microservers
Intel® Core™ m ProcessorDesigned to deliver performance and mobility in thin, sleek, fanless devices
Intel Security Products
Through our McAfee products, we deliver innovative solutions that secure computers, mobile devices, and networks. Our securitysolutions follow the threat defense life cycle (protect, detect, correct) to defend consumers, small businesses, and enterprisesfrom malware and emerging online threats. In 2015, Intel launched McAfee® Endpoint Security 10.X, which enables customers totackle the threat defense life cycle with reduced complexity and better performance. McAfee Endpoint Security 10.X introduces anew platform built to enable real-time communication between threat defenses for more effective protection against emergingthreats.
7

Communication and Connectivity
Our communication and connectivity offerings for tablets, phones, and other connected devices include baseband processors,radio frequency transceivers, and power management integrated circuits. We also offer comprehensive tablet, phone, andInternet of Things solutions, which include multimode 4G LTE* modems, Bluetooth® technology and GPS receivers, softwaresolutions, customization, and essential interoperability tests.
Non-Volatile Memory Solutions
We offer NAND flash memory products primarily used in solid-state drives. Our NAND flash memory products are manufacturedby IM Flash Technologies, LLC (IMFT) and Micron Technology, Inc. (Micron). In 2015, Intel announced 3D XPoint™ technology,a non-volatile memory that has the potential to revolutionize devices, applications, or services that benefit from fast access tolarge sets of data. Jointly developed with Micron, 3D XPoint technology combines the performance, density, power, non-volatility,and cost advantages of existing NAND and conventional memories like DRAM.
Intel Custom Foundry
We offer manufacturing technologies and design services for our customers. Our foundry offerings include full custom silicon,packaging, and manufacturing test services. We also provide semi-custom services to tailor Intel architecture-based solutionswith customers’ intellectual property blocks. To enable our customers to use our custom foundry services, we offer industry-standard design kits, intellectual property blocks, and design services.
Products and Product Strategy by Operating Segment
Our Client Computing Group (CCG) operating segment is responsible for all aspects of the client computing continuum, whichincludes platforms that are incorporated in notebook (including Ultrabook devices), 2 in 1 systems, desktop computers forconsumers and businesses, tablets, and phones. In addition, CCG offers home gateway products and set-top box components,and focuses on a broad range of wireless connectivity options that combine Intel® WiFi technology with our 2G and 3Gtechnologies and accelerate industry adoption of 4G LTE. We have an array of innovative wired solutions such as Thunderbolttechnology and client Ethernet solutions.
In 2015, we released the 6th generation Intel Core processor family for use in notebooks and desktops. These processors use14-nanometer (nm) transistors and our Tri-Gate transistor technology. Our Tri-Gate transistor technology extends Moore’s Law byproviding improved performance and energy efficiency. In combination, these enhancements can provide significant powersavings and performance gains when compared to previous-generation processors.
In mobile communications, we expanded our product portfolio with the release of our Intel® Atom™ x5 and x7 processors,formerly code named Cherry Trail and designed for mainstream and premium tablet platforms. These processors may be pairedwith our second-generation 4G LTE solution, featuring CAT6 and carrier aggregation. We also released our Intel® Atom™ x3processor, formerly coded named SoFIA 3G, our first integrated baseband and SoC application processor designed for entry andvalue phone and tablet platforms.
Notebook
Our strategy for the notebook computing market segment is to offer notebook technologies designed to bring exciting new userexperiences to life and improve performance, battery life, wireless connectivity, manageability, and security. In addition, wedesign for innovative smaller, lighter, and thinner form factors. Our 6th generation Intel Core processor continues to deliver orenable increasing levels of performance, graphics, and energy efficiency, and will provide our customers and end users withmultiple choices in processor cores, graphic performance, and battery life.
8

We have worked to help our customers develop a new class of personal computing devices that includes Ultrabook devices and 2in 1 systems. These computers combine the energy-efficient performance and capabilities of today’s notebooks and tablets withenhanced graphics and improved user interfaces such as touch and voice in thin, light form factors that are highly responsive andsecure, and that can seamlessly connect to the Internet. We believe the renewed innovation in the PC industry that we fosteredwith Ultrabook devices and expanded to 2 in 1 systems will continue.
Desktop
Our strategy for the desktop computing market segment is to offer exciting new user experiences and products that provideincreased manageability, security, and energy-efficient performance. For example, in 2015 we introduced a new user experiencein the Intel® Compute Stick, a device that allows users to transform HDMI-capable monitors or TVs into complete computers toget the most out of their display devices. We also focus on lowering the total cost of ownership for businesses. The desktopcomputing market segment includes all-in-one products, which combine traditionally separate desktop components into one formfactor. Additionally, all-in-one computers have transformed into portable and flexible form factors that offer users increasedportability and new multi-user applications and uses. For desktop consumers, we also focus on the design of products for high-end enthusiast PCs and mainstream PCs with rapidly increasing audio and media capabilities.
Our Data Center Group (DCG) operating segment offers products designed to provide leading energy-efficient performance forall server, network, and storage platforms. In addition, DCG focuses on lowering the total cost of ownership and on other specificoptimizations for the enterprise, cloud, communications infrastructure, and technical computing segments. In 2015, we launchedthe Intel® Xeon® processor D family, our first Intel Xeon processor-based SoC product family, which extends our portfolio fornetwork, storage, and high-density servers. In addition, we launched the Intel Xeon processor E7 v3 family, targeted at platformsrequiring four or more CPUs; this processor family delivers performance advancements over previous generations, along withindustry-leading reliability, availability, and serviceability. We also released the Intel Xeon processor E3 v5 family on our 14nmprocess technology, targeted for entry-level servers and workstations. In 2016, we expect to release our next-generation IntelXeon E5 and E7 families on our 14nm process technology. Additionally, we expect to release in 2016 our next-generation Intel®
Xeon Phi™ product family, code-named “Knights Landing,” with up to 72 high-performance Intel processor cores, integratedmemory and fabric, and a common software programming model with Intel Xeon processors. Knights Landing is designed forhighly parallel compute- and memory bandwidth-intensive workloads. Intel Xeon Phi coprocessors are positioned to increase theperformance of supercomputers, enabling trillions of calculations per second, and to address emerging data analytics solutions.
Our Internet of Things Group (IOTG) operating segment offers platforms designed for retail, transportation, industrial, buildingsand home use, along with a broad range of other market segments. In addition, IOTG focuses on establishing an end-to-endmanageable architecture that captures actionable information for consumers. In 2015, we announced three new Intel Quarkprocessors, including the Intel® Quark™ SE SoC and the Intel Quark microcontrollers D1000 and D2000.
Our software and services operating segments seek to create differentiated user experiences on Intel®-based platforms. Wedifferentiate by combining Intel platform features with enhanced software and services, and partnering closely with the externalsoftware developer ecosystem. Our three primary initiatives are:• enabling platforms that can be used across multiple operating systems, applications, and services across all Intel products;• optimizing features and performance by enabling the software ecosystem to quickly take advantage of new platform features
and capabilities; and• protecting consumers, small businesses, and enterprises from malware and emerging online threats.
9

Revenue by Major Operating Segment
Net revenue for the Client Computing Group (CCG) operating segment, the Data Center Group (DCG) operating segment, theInternet of Things Group (IOTG) operating segment, and the aggregated software and services (SSG) operating segments ispresented as a percentage of our consolidated net revenue. SSG includes Intel Security Group and the Software and ServicesGroup operating segments. The “all other” category consists primarily of revenue from the Non-Volatile Memory Solutions Group(NSG) and the New Devices Group operating segments.
Percentage of Revenue by Major Operating Segment(Dollars in Millions)
66%CCG
4%All Other
23%DCG
Total: $52,708
2013
58%CCG
5%All Other
4%SSG
4%IOTG
29%DCG
Total: $55,355
2015
62%CCG
4%All Other
4%SSG
4%IOTG
26%DCG
Total: $55,870
2014
4%SSG
3%IOTG
Percentage of Revenue by Principal Product from Reportable Segments(Dollars in Millions)
Total: $55,355
2015
55%CCGPlatformRevenue
27%DCGPlatformRevenue
18%OtherRevenue
Total: $55,870
2014
59%CCGPlatformRevenue
24%DCGPlatformRevenue
17%OtherRevenue
Total: $52,708
2013
61%CCGPlatformRevenue
21%DCGPlatformRevenue
18%OtherRevenue
10
Competition
The computing industry continuously evolves with new and enhanced technologies and products from existing and new providers.The marketplace can change quickly in response to the introduction of such technologies and products and other factors such aschanges in customer and end-user requirements, expectations, and preferences. As technologies evolve and new marketsegments emerge, the boundaries between the market segments that we compete in are also subject to change.
Intel faces significant competition in the development and market acceptance of our products in this environment. Our platforms,based on Intel architecture, are positioned to compete across the compute continuum, from the lowest power and mobile devicesto the most powerful data center servers. Our platforms, which have integrated hardware and software, offer customers benefitssuch as ease of use, savings in total cost of ownership, and the ability to scale systems to accommodate increased usage.
Competitors
We compete against other companies that make and sell platforms, other silicon components, and software to businesses thatbuild and sell computing and communications devices to end users. Our competitors also include companies that sell goods andservices to businesses that use them for their internal and/or customer-facing processes (e.g., businesses running large datacenters). In addition, we face competition from OEMs, ODMs, and other industrial and communications equipment manufacturersthat, to some degree, choose to vertically integrate their own proprietary semiconductor and software assets. By doing so, thesecompetitors may be attempting to offer greater differentiation in their products and to increase their share of the profits for eachfinished product they sell. Continuing changes in industry participants through, for example, acquisitions or businesscollaborations could also have a significant impact on our competitive position.
In the PC market segment, we are a leading provider of platforms for traditional desktops and notebooks. We face existing andemerging competition in these product areas. Tablets, phones, and other mobile devices offered by numerous vendors aresignificant competitors to traditional PCs for many usages. We are relatively recent providers of platforms for tablets and phones,and face strong competition from vendors that use applications processors based on the ARM* architecture; feature low-power,long battery-life operation; and are built in SoC formats that integrate numerous functions on one chip.
In the data center market segment, we are a leading provider of data center platforms and face competition from companies usingARM architecture or other technologies. Internet cloud computing, storage, and networking are areas of significant targetedgrowth for us in the data center segment, and we face strong competition in these market segments.
In the Internet of Things market segment, we have a long-standing position as a supplier of components and software forembedded products. This marketplace continues to significantly expand with increasing types and numbers of smart andconnected devices for industrial, commercial, and consumer uses such as wearables. As this market segment evolves, we facenumerous large and small incumbent competitors as well as new entrants that use ARM architecture and other operating systemsand software.
Our security business operates in highly competitive, fragmented, and rapidly changing market segments. We are a majorprovider of cybersecurity products and services to both businesses and consumers. For businesses, we compete with companiesselling individual point security products and companies selling multiple security products. We offer to businesses a portfolio ofproducts that are integrated into a comprehensive security solution. For consumers, we primarily compete against other majorsecurity companies and providers of free security products. Our consumer offerings are designed to protect user data, identity,and devices across the compute continuum.
11

In the memory market segment, we compete against other providers of NAND flash memory products. We focus our effortsprimarily on incorporating NAND flash memory into solution products, such as solid-state drives supporting consumer andenterprise applications. We believe that our memory offerings, including innovative developments such as 3D XPoint technology,will complement our other product offerings in our other segments.
Our products primarily compete based on performance, energy efficiency, integration, innovative design, features, price, quality,reliability, brand recognition, technical support, and availability. The importance of these factors varies by the type of end systemfor the products. For example, performance might be among the most important factors for our products for data center servers,while price and integration might be among the most important factors for our products for tablets, phones, and other mobiledevices.
Competitive Advantages
Our key competitive advantages include:• Transitions to next-generation technologies. We have a market lead in transitioning to the next-generation process
technology and bringing products to market using such technology. Our products utilizing our 14nm process technology arein the market and we are continuing to work on the development of our next-generation 10nm process technology. Webelieve that these advancements will offer significant improvements in one or more of the following areas: performance, newfeatures, energy efficiency, and cost.
• Combination of our network of manufacturing and assembly and test facilities with our global architecture design teams. Wehave made significant capital and R&D investments into our integrated manufacturing network, which enables us to havemore direct control over our design, development, and manufacturing processes; quality control; product cost; productiontiming; performance; power consumption; and manufacturing yield. The increased cost of constructing new fabricationfacilities to support smaller transistor geometries and larger wafers has led to a reduced number of companies that can buildand equip leading-edge manufacturing facilities. Most of our competitors rely on third-party foundries and subcontractors formanufacturing and assembly and test needs. We provide foundry services as an alternative to such foundries.
• Products optimized to operate on multiple operating systems. Through our collaboration with our customers and other thirdparties, many of our products can operate on multiple operating systems in end-user products and platforms.
Manufacturing and Assembly and Test
As of December 26, 2015, 55% of our wafer fabrication, including microprocessors and chipsets, was conducted within the U.S.at our facilities in Arizona, Oregon, and New Mexico. Our Massachusetts fabrication facility was our last manufacturing facility on200 millimeter (mm) wafers and ceased production in Q1 2015. The remaining 45% of our wafer fabrication was conductedoutside the U.S. at our facilities in Ireland, Israel, and China. Our fabrication facility in Ireland has transitioned to our 14nmprocess technology, with manufacturing continuing to ramp in 2016. Wafer fabrication conducted within and outside the U.S. maybe impacted by the timing of a facility’s transition to a newer process technology, as well as a facility’s capacity utilization.
As of December 26, 2015, we manufactured our products in wafer fabrication facilities at the following locations:
Products Wafer Size Process Technology Locations
Microprocessors and other products . . . . . . . . . . . . . . . . . . . . . . . . 300mm 14nm Arizona, Oregon, IrelandMicroprocessors and other products . . . . . . . . . . . . . . . . . . . . . . . . 300mm 22nm Israel, Arizona, OregonMicroprocessors and chipsets . . . . . . . . . . . . . . . . . . . . . . . . . . . . . 300mm 32nm New MexicoMicroprocessors . . . . . . . . . . . . . . . . . . . . . . . . . . . . . . . . . . . . . . . 300mm 45nm New MexicoMicroprocessors and chipsets . . . . . . . . . . . . . . . . . . . . . . . . . . . . . 300mm 65nm China
12

As of December 26, 2015, our microprocessors were manufactured on 300mm wafers, with a substantial majority manufacturedusing our 14nm, 22nm, and 32nm process technologies. As we move to each succeeding generation of manufacturing processtechnology, we incur significant start-up costs to prepare each factory for manufacturing. However, continuing to advance ourprocess technology provides benefits that we believe justify these costs. The benefits of moving to each succeeding generation ofmanufacturing process technology can include using less space per transistor, reducing heat output from each transistor, andincreasing the number of integrated features on each chip. These advancements can enable us to introduce new devices withhigher functionality and complexity while controlling power, cost, and size. In addition, with each shift to a new processtechnology, we are able to produce more microprocessors per square foot of our wafer fabrication facilities. The costs to developnewer process technologies are significantly less than adding capacity by building additional wafer fabrication facilities using olderprocess technologies.
We use third-party foundries to manufacture wafers for certain components, including communications, connectivity, andnetworking products. For example, the Intel Atom x3 processor is fabricated by a third-party foundry. In addition, we primarily usesubcontractors to manufacture board-level products and systems. We purchase certain communications and connectivityproducts from external vendors primarily in the Asia-Pacific region.
Following the manufacturing process, the majority of our components are subject to assembly and test. We perform ourcomponents assembly and test at facilities in Malaysia, China, and Vietnam. To augment capacity, we use subcontractors toperform assembly and test of certain products, primarily chipsets and communications and connectivity products.
Our NAND flash memory products are manufactured by IMFT and Micron using 20nm or 25nm process technology, andassembly and test of these products is performed by Micron and other external subcontractors. For further information, see “Note5: Cash and Investments” in Part II, Item 8 of this Form 10-K. Additionally, in the second half of 2016, we will start using ourfacility in Dalian, China to help expand our manufacturing capacity in next-generation memory. The expansion is part of our multi-source supply strategy and will allow us to best serve our customers.
Our employment and operating practices are consistent with, and we expect our suppliers and subcontractors to abide by, localcountry law. Intel expects all suppliers to comply with our Code of Conduct and the Electronic Industry Citizenship Coalition(EICC) Code of Conduct, both of which set standards that address the rights of workers to safe and healthy working conditions,environmental responsibility, compliance with privacy and data security obligations, and compliance with applicable laws.
We have thousands of suppliers, including subcontractors, providing our various materials, equipment, and service needs. We setexpectations for supplier performance and reinforce those expectations with periodic assessments and audits. We communicatethose expectations to our suppliers regularly and work with them to implement improvements when necessary. Where possible,we seek to have several sources of supply for all of these materials and resources, but we may rely on a single or limited numberof suppliers, or upon suppliers in a single country. In those cases, we develop and implement plans and actions to reduce theexposure that would result from a disruption in supply. We have entered into long-term contracts with certain suppliers to helpensure a stable supply of silicon and semiconductor manufacturing tools.
Our products are typically manufactured at multiple Intel facilities around the world or by subcontractors. However, some productsare manufactured in only one Intel or subcontractor facility, and we seek to implement action plans to reduce the exposure thatwould result from a disruption at any such facility. See “Risk Factors” in Part I, Item 1A of this Form 10-K.
13

Research and Development
We are committed to investing in world-class technology development, particularly in the design and manufacture of integratedcircuits. R&D expenditures were $12.1 billion in 2015 ($11.5 billion in 2014 and $10.6 billion in 2013).
Our R&D activities are directed toward the delivery of solutions consisting of hardware and software platforms and supportingservices across a wide range of computing devices. We are focused on developing the technology innovations that we believe willdeliver our next generation of products, which will in turn enable new form factors and usage models for businesses andconsumers. We focus our R&D efforts on advanced computing technologies, developing new microarchitectures, advancing oursilicon manufacturing process technology, delivering the next generation of platforms, improving our platform initiatives,developing new solutions in emerging technologies (including memory and the Internet of Things), and developing softwaresolutions and tools. Our R&D efforts are intended to enable new levels of performance and address areas such as energyefficiency, system-level integration, security, scalability for multi-core architectures, system manageability, and ease of use.
As part of our R&D efforts, we plan to introduce a new Intel Core microarchitecture for desktops, notebooks (including Ultrabookdevices and 2 in 1 systems), and Intel Xeon processors on a regular cadence. We expect to lengthen the amount of time we willutilize our 14nm and our next-generation 10nm process technologies, further optimizing our products and process technologieswhile meeting the yearly market cadence for product introductions.
TICK(PROCESS)
TOCK(ARCHITECTURE)
PROCESS TECHNOLOGY
YESTERDAYPROCESS TECHNOLOGY
TODAY
PROCESS ARCHITECTURE OPTIMIZATION
Advances in our silicon technology have enabled us to continue making Moore’s Law a reality. In 2014, we began manufacturingour 5th generation Intel Core processor family using our 14nm process technology. In 2015, we released a new microarchitecture(our 6th generation Intel Core processor family), using our 14nm process technology. We also plan to introduce a third 14nmproduct, code-named “Kaby Lake.” This product will have key performance enhancements as compared to our 6th generationIntel Core processor family. We are also developing 10nm manufacturing process technology, our next-generation processtechnology.
We have continued expanding on the advances anticipated by Moore’s Law by bringing new capabilities into silicon andproducing new products optimized for a wider variety of applications. We expect these advances will result in a significantreduction in transistor leakage, lower active power, and an increase in transistor density to enable more smaller form factors,such as powerful, feature-rich phones and tablets with a longer battery life. For instance, we have accelerated the Intel Atomprocessor-based SoC roadmap for our mobile form factors (including tablets and phones), notebooks (including Ultrabookdevices and 2 in 1 systems), the Internet of Things, and data center applications, on our 32nm, 22nm, and 14nm processtechnologies. In addition, we offer the Intel Quark SoC, an ultra-low-power and low-cost architecture designed for the Internet ofThings such as industrial machines and wearable devices.
14

With our continued focus on silicon and manufacturing technology leadership, we entered into a series of agreements with ASMLHolding N.V. (ASML) in 2012, certain of which were amended in 2014 to further define the commercial terms between the parties.These amended agreements, in which Intel agreed to provide R&D funding over five years, are intended to accelerate thedevelopment of extreme ultraviolet (EUV) lithography projects and deep ultraviolet immersion lithography projects, includinggeneric developments applicable to both 300mm and 450mm.
Our R&D activities range from designing and developing new products and manufacturing processes to researching futuretechnologies and products. We continue to make significant R&D investments in the development of SoC devices to enablegrowth in mobile form factors. In addition, we continue to make significant investments in communications and connectivity fortablets, phones, and other connected devices, including multimode LTE modems. Our investment in Cloudera, Inc. (Cloudera),completed in 2014, is evidence of our drive to bring big data analytics to the mainstream market through the joining of Cloudera’ssoftware platform and our data center architecture based on Intel Xeon processors. We also continue to invest in leading-edgefoundry platforms and ecosystem partner development, graphics, high-performance computing, and communication andconnectivity.
Our R&D model is based on a global organization that emphasizes a collaborative approach to identifying and developing newtechnologies, leading standards initiatives, and influencing regulatory policies to accelerate the adoption of new technologies,including joint pathfinding conducted between researchers at Intel Labs and our business groups. We centrally manage keycross-business group product initiatives to align and prioritize our R&D activities across these groups. In addition, we mayaugment our R&D activities by investing in companies or entering into agreements with companies that have similar R&D focusareas, as well as directly purchasing or licensing technology applicable to our R&D initiatives. To drive innovation and gainefficiencies, we intend to utilize our investments in intellectual property and R&D across our market segments.
Employees
As of December 26, 2015, we had 107,300 employees worldwide, with approximately 51% of those employees located in the U.S.
Sales and Marketing
Customers
We sell our products primarily to OEMs and ODMs. ODMs provide design and manufacturing services to branded and unbrandedprivate-label resellers. In addition, we sell our products to other manufacturers, including makers of a wide range of industrial andcommunications equipment. Our customers also include those who buy PC components and our other products throughdistributor, reseller, retail, and OEM channels throughout the world.
Our worldwide reseller sales channel consists of thousands of indirect customers—systems builders that purchase Intel®
microprocessors and other products from our distributors. We have a program that allows distributors to sell our microprocessorsand other products in small quantities to customers of systems builders. Our microprocessors and other products are alsoavailable in direct retail outlets.
Hewlett-Packard Company, our largest customer in 2014, separated into HP Inc. and Hewlett Packard Enterprise Company onNovember 1, 2015. In 2015, these entities collectively accounted for 18% of our net revenue (18% in 2014 and 17% in 2013), DellInc. accounted for 15% of our net revenue (16% in 2014 and 15% in 2013), and Lenovo Group Limited accounted for 13% of ournet revenue (12% in 2014 and 12% in 2013). No other customer accounted for more than 10% of our net revenue during suchperiods. For information about net revenue and operating income by operating segment, and net revenue from unaffiliatedcustomers by country, see “Note 26: Operating Segments and Geographic Information” in Part II, Item 8 of this Form 10-K.
15

Sales Arrangements
Our products are sold through sales offices throughout the world. Sales of our products are frequently made via purchase orderacknowledgments that contain standard terms and conditions covering matters such as pricing, payment terms, and warranties,as well as indemnities for issues specific to our products, such as patent and copyright indemnities. From time to time, we mayenter into additional agreements with customers covering, for example, changes from our standard terms and conditions, newproduct development and marketing, private-label branding, and other matters. Our sales are routinely made using electronic andweb-based processes that allow the customer to review inventory availability and track the progress of specific goods ordered.Pricing on particular products may vary based on volumes ordered and other factors. We also offer discounts, rebates, and otherincentives to customers to increase acceptance of our products and technology.
Our products are generally shipped under terms that transfer title to the customer, even in arrangements for which the recognitionof revenue and related cost of sales is deferred. Our standard terms and conditions of sale typically provide that payment is dueat a later date, usually 30 days after shipment or delivery. We assess credit risk through quantitative and qualitative analysis.From this analysis, we establish shipping and credit limits, and determine whether we will seek to use one or more credit supportprotection devices, such as obtaining a parent guarantee, standby letter of credit, or credit insurance. Credit losses may still beincurred due to bankruptcy, fraud, or other failure of the customer to pay. For information about our allowance for doubtfulreceivables, see “Schedule II—Valuation and Qualifying Accounts” in Part IV of this Form 10-K.
Our sales to distributors are typically made under agreements allowing for price protection on unsold merchandise and a right ofreturn on stipulated quantities of unsold merchandise. Under the price protection program, we give distributors credits for thedifference between the original price paid and the current price that we offer. Our products typically have no contractual limit onthe amount of price protection, nor is there a limit on the time horizon under which price protection is granted. The right of returngranted generally consists of a stock rotation program in which distributors are able to exchange certain products based on thenumber of qualified purchases made by the distributor. We have the option to grant credit for, repair, or replace defectiveproducts, and there is no contractual limit on the amount of credit that may be granted to a distributor for defective products.
Distribution
Distributors typically handle a wide variety of products, including those that compete with our products, and fill orders for manycustomers. Customers may place orders directly with us or through distributors. We have several distribution warehouses that arelocated in proximity to key customers.
Backlog
Over time, our larger customers have generally moved to lean-inventory or just-in-time operations rather than maintaining largerinventories of our products. As our customers continue to lower their inventories, our processes to fulfill their orders have evolvedto meet their needs. As a result, our manufacturing production is based on estimates and advance non-binding commitments fromcustomers as to future purchases. Our order backlog as of any particular date is a mix of these commitments and specific firmorders that are primarily made pursuant to standard purchase orders for delivery of products. Only a small portion of our ordersare non-cancelable, and the dollar amount associated with the non-cancelable portion is not significant.
Seasonal Trends
Historically, our net revenue has typically been higher in the second half of the year than in the first half of the year, acceleratingin the third quarter and peaking in the fourth quarter.
16

Marketing
Our global marketing objectives are to build a strong, well-known Intel corporate brand that connects with businesses andconsumers, and to offer a limited number of meaningful and valuable brands in our portfolio to aid businesses and consumers inmaking informed choices about technology purchases. The Intel Core processor family and the Intel Quark, Intel Atom, Intel®
Celeron®, Intel® Pentium®, Intel Xeon, Intel Xeon Phi, and Intel® Itanium® trademarks make up our processor brands.
We promote brand awareness and preference, and generate demand through our own direct marketing as well as through co-marketing programs. Our direct marketing activities primarily include advertising through digital and social media and television,as well as consumer and trade events, industry and consumer communications, and press relations. We market to consumer andbusiness audiences, and focus on building awareness and generating demand for new form factors such as tablets, all-in-onedevices, and 2 in 1 systems powered by Intel. Our key messaging focuses on increased performance, improved energyefficiency, and other capabilities such as connectivity, communications, and security.
Purchases by customers often allow them to participate in cooperative advertising and marketing programs such as the IntelInside® program. This program broadens the reach of our brands beyond the scope of our own direct marketing. Through theIntel Inside program, certain customers are licensed to place Intel® logos on computing devices containing our microprocessorsand processor technologies, and to use our brands in their marketing activities. The program includes a market developmentcomponent that accrues funds based on purchases and partially reimburses customers for marketing activities for productsfeaturing Intel® brands, subject to customers meeting defined criteria. These marketing activities primarily include advertisingthrough digital and social media and television, as well as press relations. We have also entered into joint marketingarrangements with certain customers.
Intellectual Property Rights and Licensing
Intel owns significant intellectual property (IP) and related IP rights around the world that relate to our products, services, R&D,and other activities and assets. Our IP portfolio includes patents, copyrights, trade secrets, trademarks, trade dress rights, andmaskwork rights. We actively seek to protect our global IP rights and to deter unauthorized use of our IP and other assets. Suchefforts can be difficult, however, particularly in countries that provide less protection to IP rights and in the absence of harmonizedinternational IP standards. While our IP rights are important to our success, our business as a whole is not significantly dependenton any single patent, copyright, or other IP right. See “Risk Factors” in Part I, Item 1A, and “Note 25: Contingencies” in Part II,Item 8 of this Form 10-K.
We have obtained patents in the U.S. and other countries. Because of the fast pace of innovation and product development, andthe comparative pace of governments’ patenting processes, our products are often obsolete before the patents related to themexpire; in some cases, our products may be obsolete before the patents related to them are granted. As we expand our productsinto new industries, we also seek to extend our patent development efforts to patent such products. In addition to developingpatents based on our own R&D efforts, we purchase patents from third parties to supplement our patent portfolio. Establishedcompetitors in existing and new industries, as well as companies that purchase and enforce patents and other IP, may alreadyhave patents covering similar products. There is no assurance that we will be able to obtain patents covering our own products, orthat we will be able to obtain licenses from other companies on favorable terms or at all.
The software that we distribute, including software embedded in our component-level and platform products, is entitled tocopyright and other IP protection. To distinguish our products from our competitors’ products, we have obtained trademarks andtrade names for our products, and we maintain cooperative advertising programs with customers to promote our brands and toidentify products containing genuine Intel components. We also protect details about our processes, products, and strategies astrade secrets, keeping confidential the information that we believe provides us with a competitive advantage.
17

Compliance with Environmental, Health, and Safety Regulations
Our compliance efforts focus on monitoring regulatory and resource trends and setting company-wide performance targets for keyresources and emissions. These targets address several parameters, including product design; chemical, energy, and water use;waste recycling; the source of certain minerals used in our products; climate change; and emissions.
As a company, we focus on reducing natural resource use, the solid and chemical waste by-products of our manufacturingprocesses, and the environmental impact of our products. We currently use a variety of materials in our manufacturing processthat have the potential to adversely impact the environment and are subject to a variety of environmental, health, and safety(EHS) laws and regulations. Over the past several years, we have significantly reduced the use of lead and halogenated flameretardants in our products and manufacturing processes.
We work with non-governmental organizations (NGOs), OEMs, and retailers to help manage e-waste (including electronicproducts nearing the end of their useful lives) and to promote recycling. The European Union requires producers of certainelectrical and electronic equipment to develop programs that let consumers return products for recycling. Many U.S. states andcountries in Latin America and Asia also have or are developing similar e-waste take-back laws. Although these laws are typicallytargeted at the end electronic product and not components such as microprocessors, the inconsistency of many e-waste take-back laws, changes in our product offerings, and the lack of local e-waste management options in many areas pose a challengefor our compliance efforts.
We are an industry leader in our efforts to build ethical sourcing of minerals for our products, including “conflict minerals” from theDRC and adjoining countries. In 2013, we accomplished our goal to manufacture microprocessors that are DRC conflict-free fortantalum, tin, tungsten, and gold. We continue our work to establish DRC conflict-free supply chains for our company and ourindustry, and are moving beyond microprocessors to validate our broader product base as DRC conflict-free in 2016 for thesefour minerals.
We seek to reduce our global greenhouse gas emissions by investing in energy conservation projects in our factories and workingwith suppliers to improve energy efficiency. We take a holistic approach to power management, addressing the challenge at thesilicon, package, circuit, microarchitecture, macroarchitecture, platform, and software levels. We recognize that climate changemay cause general economic risk. For further information on the risks of climate change, see “Risk Factors” in Part I, Item 1A ofthis Form 10-K. We see a potential for higher energy costs driven by climate change regulations. This could include items appliedto utility companies that are passed along to customers, such as carbon taxes or costs associated with obtaining permits for ourmanufacturing operations, emission cap and trade programs, or renewable portfolio standards.
We are committed to sustainability and take a leadership position in promoting voluntary environmental initiatives and workingproactively with governments, environmental groups, and industry to promote global environmental sustainability. We believe thattechnology will be fundamental to finding solutions to the world’s environmental challenges, and we are joining forces withindustry, business, and governments to find and promote ways that technology can be used as a tool to combat climate change.
We have been purchasing renewable energy at some of our major sites for several years. We purchase renewable energycertificates under a multi-year contract. This purchase has placed Intel at the top of the U.S. Environmental Protection AgencyGreen Power Partnership rankings for the past eight years and is intended to help stimulate the market for green power, leadingto additional generating capacity and, ultimately, lower costs.
Distribution of Company Information
Our Internet address is www.intel.com. We publish voluntary reports on our website that outline our performance with respect tocorporate responsibility, including EHS compliance.
18

We use our Investor Relations website, www.intc.com, as a routine channel for distribution of important information, includingnews releases, analyst presentations, and financial information. We post filings on our website the same day they areelectronically filed with, or furnished to, the U.S. Securities and Exchange Commission (SEC), including our annual and quarterlyreports on Forms 10-K and 10-Q and current reports on Form 8-K; our proxy statements; and any amendments to those reportsor statements. We post our quarterly and annual earnings results at www.intc.com/results.cfm, and do not distribute our financialresults via a news wire service. All such postings and filings are available on our Investor Relations website free of charge. Inaddition, our Investor Relations website allows interested persons to sign up to automatically receive e-mail alerts when we postfinancial information. The SEC’s website, www.sec.gov, contains reports, proxy and information statements, and other informationregarding issuers that file electronically with the SEC. The content on any website referred to in this Form 10-K is not incorporatedby reference in this Form 10-K unless expressly noted.
19

Executive Officers of the Registrant
The following sets forth certain information with regard to our executive officers as of February 12, 2016 (ages are as ofDecember 26, 2015):
Andy D. Bryant, age 65• 2012 – present Chairman of the Board• 2011 – 2012 Vice Chairman of the Board, Executive
VP, Technology, Manufacturing andEnterprise Services; Chief AdministrativeOfficer
• 2009 – 2011 Executive VP, Technology, Manufacturing,and Enterprise Services; ChiefAdministrative Officer
• 2007 – 2009 Executive VP, Finance and EnterpriseServices; Chief Administrative Officer
• 2001 – 2007 Executive VP; Chief Financial andEnterprise Services Officer
• Member of Intel Corporation Board of Directors• Member of Columbia Sportswear Company Board ofDirectors
• Member of McKesson Corporation Board of Directors• Joined Intel in 1981
William M. Holt, age 63• 2013 – present Executive VP; General Manager,
Technology and Manufacturing Group• 2006 – 2013 Senior VP; General Manager, Technology
and Manufacturing Group• 2005 – 2006 VP; Co-General Manager, Technology
and Manufacturing Group• Joined Intel in 1974
Brian M. Krzanich, age 55• 2013 – present Chief Executive Officer• 2012 – 2013 Executive VP; Chief Operating Officer• 2010 – 2012 Senior VP; General Manager,
Manufacturing and Supply Chain• 2006 – 2010 VP; General Manager, Assembly and Test• Member of Deere & Company Board of Directors• Joined Intel in 1982
Gregory R. Pearson, age 55• 2014 – present Senior VP; General Manager, Sales and
Marketing Group• 2008 – 2013 General Manager, Worldwide Sales and
Operations Group• Joined Intel in 1983
Dr. Venkata S.M. “Murthy” Renduchintala, age 50• 2015 – present Executive VP; President, Client and
Internet of Things (IoT) Businesses andSystems Architecture Group
• Joined Intel in 2015
Stacy J. Smith, age 53• 2012 – present Executive VP; Chief Financial Officer• 2010 – 2012 Senior VP; Chief Financial Officer• 2007 – 2010 VP; Chief Financial Officer• 2006 – 2007 VP; Assistant Chief Financial Officer• 2004 – 2006 VP; Finance and Enterprise Services,
Chief Information Officer• Member of Autodesk, Inc. Board of Directors• Member of Virgin America, Inc. Board of Directors• Joined Intel in 1988
20

ITEM 1A. RISK FACTORS
The following risks could materially and adversely affect our business, financial condition, and results of operations, and thetrading price of our common stock could decline. These risk factors do not identify all risks that we face; our operations could alsobe affected by factors that are not presently known to us or that we currently consider to be immaterial to our operations. Due torisks and uncertainties, known and unknown, our past financial results may not be a reliable indicator of future performance, andhistorical trends should not be used to anticipate results or trends in future periods. You should also refer to the other informationset forth in this Annual Report on Form 10-K, including “Management’s Discussion and Analysis of Financial Condition andResults of Operations” and our financial statements and the related notes.
Changes in product demand can harm our results of operation and financial condition.
Demand for our products is variable and hard to predict. Changes in the demand for our products may reduce our revenue,increase our costs, lower our gross margin percentage, or require us to write down the value of our assets. Important factors thatcould lead to variation in the demand for our products include changes in:• business conditions, including downturns in the computing industry, or in the global or regional economies;• consumer confidence or income levels caused by changes in market conditions, including changes in government borrowing,
taxation, or spending policies; the credit market; or expected inflation, employment, and energy or other commodity prices;• the level of our customers’ inventories;• competitive and pricing pressures, including actions taken by competitors;• customer product needs;• market acceptance and industry support of our new and maturing products; and• the technology supply chain, including supply constraints caused by natural disasters or other events.
We face significant competition. The industry in which we operate is highly competitive and subject to rapid technological andmarket developments, changes in industry standards, changes in customer needs, and frequent product introductions andimprovements. If we do not anticipate and respond to these developments, our competitive position may weaken, and ourproducts or technologies might be uncompetitive or obsolete. In recent years, our business focus has expanded and now includesthe design and production of platforms for tablets, phones, and other devices across the compute continuum, including productsfor the Internet of Things, and related services. As a result, we face new sources of competition, including, in certain of thesemarket segments, from incumbent competitors with established customer bases and greater brand recognition. To be successful,we need to cultivate new industry relationships with customers and partners in these market segments. In addition, we mustcontinually improve the cost, integration, and energy efficiency of our products, as well as expand our software capabilities toprovide customers with comprehensive computing solutions. Despite our ongoing efforts, there is no guarantee that we willachieve or maintain consumer and market demand or acceptance for our products and services in these various marketsegments.
To compete successfully, we must maintain a successful R&D effort, develop new products and production processes, andimprove our existing products and processes ahead of competitors. For example, we invest substantially in our network ofmanufacturing and assembly and test facilities, including the construction of new fabrication facilities to support smaller transistorgeometries and larger wafers. Our R&D efforts are critical to our success and are aimed at solving complex problems, and we donot expect all of our projects to be successful. We may be unable to develop and market new products successfully, and theproducts we invest in and develop may not be well-received by customers. Our R&D investments may not generate significantoperating income or contribute to our future operating results for several years, and such contributions may not meet ourexpectations or even cover the costs of such investments. Additionally, the products and technologies offered by others mayaffect demand for, or pricing of, our products.
21

If we are not able to compete effectively, our financial results will be adversely affected, including increased costs and reducedrevenue and gross margin, and we may be required to accelerate the write-down of the value of certain assets.
Changes in the mix of products sold may harm our financial results. Prices differ widely among the platforms we offer in ourvarious market segments due to differences in features offered or manufacturing costs. For example, product offerings range fromlower-priced and entry-level platforms, such as those based on Intel Quark or Intel Atom processors, to higher-end platformsbased on Intel Xeon and Intel Itanium processors. If demand shifts from our higher-priced to lower-priced platforms in any of ourmarket segments, our gross margin and revenue would decrease. In addition, when products are introduced, they tend to havehigher costs because of initial development costs and lower production volumes relative to the previous product generation, whichcan impact gross margin.
We operate globally and are subject to significant risks in many jurisdictions.
Global or regional conditions may harm our financial results. We have manufacturing, assembly and test, R&D, sales, and otheroperations in many countries, and some of our business activities may be concentrated in one or more geographic areas.Moreover, sales outside the U.S. accounted for approximately 80% of our revenue for the fiscal year ended December 26, 2015.As a result, our operations and our financial results, including our ability to manufacture, assemble and test, design, develop, orsell products, may be adversely affected by a number of factors outside of our control, including:• global and local economic conditions;• geopolitical and security issues, such as armed conflict and civil or military unrest, crime, political instability, and terrorist
activity;• natural disasters, public health issues, and other catastrophic events;• inefficient infrastructure and other disruptions, such as supply chain interruptions and large-scale outages or unreliable
provision of services from utilities, transportation, data hosting, or telecommunications providers;• government restrictions on, or nationalization of our operations in any country, or restrictions on our ability to repatriate
earnings from a particular country;• differing employment practices and labor issues;• formal or informal imposition of new or revised export and/or import and doing-business regulations, which could be changed
without notice;• ineffective legal protection of our IP rights in certain countries; and• local business and cultural factors that differ from our normal standards and practices.
We are subject to laws and regulations worldwide, which may differ among jurisdictions, affecting our operations in areasincluding, but not limited to: IP ownership and infringement, tax, import and export requirements, anti-corruption, foreignexchange controls and cash repatriation restrictions, data privacy requirements, anti-competition, advertising, employment,environment, health, and safety. Compliance with such requirements may be onerous and expensive, and may otherwise impactour business operations negatively. Although we have policies, controls, and procedures designed to help ensure compliancewith applicable laws, there can be no assurance that our employees, contractors, suppliers, and/or agents will not violate suchlaws or our policies. Violations of these laws and regulations could result in fines; criminal sanctions against us, our officers, orour employees; prohibitions on the conduct of our business; and damage to our reputation.
We may be affected by fluctuations in currency exchange rates. We are potentially exposed to adverse as well as beneficialmovements in currency exchange rates. Although most of our sales occur in U.S. dollars, expenses may be paid in localcurrencies. An increase in the value of the dollar could increase the real cost to our customers of our products in those marketsoutside the U.S. where we sell in dollars, and a weakened dollar could increase the cost of expenses such as payroll, utilities, tax,and marketing expenses, as well as overseas capital expenditures. We also conduct certain investing and financing activities inlocal currencies. Our hedging programs reduce, but do not eliminate, the impact of currency exchange rate movements;therefore, changes in exchange rates could harm our results of operations and financial condition.
22

Catastrophic events or geopolitical conditions could have a material adverse effect on our operations and financial results. Ouroperations or systems could be disrupted by natural disasters; geopolitical conditions; terrorist activity; public health issues;cybersecurity incidents; interruptions of service from utilities, transportation or telecommunications providers; or other catastrophicevents. Such events could make it difficult or impossible to manufacture or deliver products to our customers, receive productionmaterials from our suppliers, or perform critical functions, which could adversely affect our revenue and require significantrecovery time and expenditures to resume operations. While we maintain business recovery plans that are intended to enable usto recover from natural disasters or other events that can be disruptive to our business, some of our systems are not fullyredundant and we cannot be sure that our plans will fully protect us from all such disruptions.
We maintain a program of insurance coverage for a variety of property, casualty, and other risks. The types and amounts ofinsurance we obtain vary depending on availability, cost, and decisions with respect to risk retention. Some of our policies havelarge deductibles and broad exclusions. In addition, one or more of our insurance providers may be unable or unwilling to pay aclaim. Losses not covered by insurance may be large, which could harm our results of operations and financial condition.
We operate our own fabrication facilities and, as a result, are vulnerable to manufacturing-related risks.
Due to the variability in demand for our products, we may be unable to timely respond to reduce costs when demand declines orto increase production when demand increases. Our operations have high costs that are either fixed or difficult to reduce in theshort term, including our costs related to manufacturing, such as facility construction and equipment, R&D, and the employmentand training of a highly skilled workforce. If product demand decreases or we fail to forecast demand accurately, we could berequired to write off inventory or record excess capacity charges, which would lower our gross margin. Our manufacturing orassembly and test capacity could be underutilized, and we may be required to write down our long-lived assets, which wouldincrease our expenses. Factory-planning decisions may shorten the useful lives of facilities and equipment and cause us toaccelerate depreciation.
Conversely, if product demand increases, we may be unable to add capacity fast enough to meet market demand. Our revenueand gross margin can also be affected by the timing of our product introductions and related expenses, including marketingexpenses.
We are subject to risks associated with the development and implementation of new manufacturing process technology. We maynot be successful or efficient in developing or implementing new production processes. Production of integrated circuits is acomplex process. We are continually engaged in the transition from our existing process to the next-generation processtechnology. This consistent innovation involves significant expense and carries inherent risks, including difficulties in designingand developing next-generation process technologies, development and production timing delays, lower than anticipatedmanufacturing yields, and product defects and errata. Disruptions in the production process can also result from errors, defects inmaterials, delays in obtaining or revising operating permits and licenses, interruption in our supply of materials or resources, anddisruptions at our fabrication and assembly and test facilities due to accidents, maintenance issues, or unsafe workingconditions—all of which could affect the timing of production ramps and yields. Production issues can lead to increased costs andmay affect our ability to meet product demand, which could adversely impact our business and the results from operations.
23

We face supply chain risks. Thousands of suppliers provide materials that we use in production and other aspects of ourbusiness. Where possible, we seek to have several sources of supply for all of those materials. However, for certain materials, wemay rely on a single or a limited number of suppliers, or upon suppliers in a single location. In addition, consolidation amongsuppliers could impact the nature, quality, availability, and pricing of the products and services available to us. The inability ofsuppliers to deliver adequate supplies of production materials or other supplies could disrupt our production processes or make itmore difficult for us to implement our business strategy. Production could be disrupted by the unavailability of resources used inproduction, such as water, silicon, electricity, gases, and other materials. The unavailability or reduced availability of materials orresources may require us to reduce production or incur additional costs, which could harm our business and results of operations.
We also rely on third-party providers to manufacture and assemble and test certain components or products, particularly thoserelated to networking, mobile and communications, and NAND flash memory. If any of these third parties are unable to performthese services on a timely basis, we may encounter supply delays or disruptions that could adversely affect our financial results.
In addition, there are regulatory and other requirements, restrictions, and requests from various constituencies regarding sourcingpractices and supplier conduct, with a trend toward expanding the scope of materials and locations where materials originate,regulating supplier behaviors, and increasing the required disclosures regarding such matters by public companies. Increasedregulation and public pressure in this area would cause our compliance costs to increase and could negatively affect ourreputation given that we use many materials in the manufacturing of our products and rely on many suppliers to provide thesematerials, but do not directly control their procurement or employment practices.
We are subject to the risks of product defects and errata. Product defects and errata (deviations from published specifications)may result from problems in our product design or our manufacturing and assembly and test processes. Components andproducts we purchase or license from third-party suppliers may also contain defects.
Costs from defects and errata could include:• writing off some or all of the value of inventory;• recalling products that have been shipped;• providing product replacements or modifications; and• defending against resulting litigation.
These costs could be large and may increase expenses and lower gross margin, and result in delay or loss of revenue. Anyproduct defects, errata, or other issues that we do not detect or fix could also damage our reputation, negatively affect productdemand, delay product releases, or result in legal liability. The announcement of product defects and errata could causecustomers to purchase products from competitors as a result of possible shortages of our components or for other reasons. Anyof these occurrences could harm our business and financial results.
We are subject to risks associated with environmental laws and regulations. The manufacturing and assembly and test of ourproducts require the use of hazardous materials that are subject to a broad array of EHS laws and regulations. Our failure tocomply with these laws or regulations could result in:• regulatory penalties, fines, and legal liabilities;• suspension of production;• alteration of our fabrication and assembly and test processes;• reputational challenges; and• restrictions on our operations or sales.
Our failure to manage the use, transportation, emissions, discharge, storage, recycling, or disposal of hazardous materials couldlead to increased costs or future liabilities. Our ability to expand or modify our manufacturing capability in the future may beimpeded by environmental regulations, such as air quality and wastewater requirements. Environmental laws and regulationscould also require us to acquire pollution abatement or remediation equipment, modify product designs, or incur other expenses.Many new materials that we are evaluating for use in our operations may be subject to regulation under environmental laws andregulations. These restrictions could harm our business and results of operations by increasing our expenses or requiring us toalter manufacturing and assembly and test processes.
24

Climate change may also pose regulatory and environmental risks that could harm our results of operations and affect the way weconduct business. For example, climate change regulation could result in increased manufacturing costs associated with airpollution control requirements, and increased or new monitoring, recordkeeping, and reporting of greenhouse gas emissions. Wealso see the potential for higher energy costs driven by climate change regulations if, for example, utility companies pass on theircosts to their customers. Furthermore, many of our operations are located in semi-arid regions that may become increasinglyvulnerable to prolonged droughts due to climate change. Our fabrication facilities require significant water use and, while werecycle and reuse a portion of the water used, we may have difficulties obtaining sufficient water to fulfill our operational needsdue the lack of available infrastructure.
We are subject to IP risks and risks associated with litigation and regulatory proceedings.
We may be unable to enforce or protect our IP rights. We regard our patents, copyrights, trade secrets, and other IP rights asimportant to the success of our business. We rely on IP law as well as confidentiality and licensing agreements with ourcustomers, employees, technology development partners, and others to protect our IP rights. Our ability to enforce these rights issubject to general litigation risks, as well as uncertainty as to the enforceability of our IP rights in various countries. When we seekto enforce our rights, we may be subject to claims that the IP rights are invalid, not enforceable, or licensed to the opposing party.Our assertion of IP rights may result in the other party seeking to assert claims against us, which could harm our business.Governments may adopt regulations—and governments or courts may render decisions—requiring compulsory licensing of IPrights, or governments may require products to meet standards that serve to favor local companies. Our inability to enforce our IPrights under any of these circumstances may harm our competitive position and business. In addition, the theft or unauthorizeduse or publication of our trade secrets and other confidential business information could harm our competitive position and reduceacceptance of our products; as a result, the value of our investment in R&D, product development, and marketing could bereduced.
Our licenses with other companies and participation in industry initiatives may allow competitors to use our patent rights.Companies in our industry often bilaterally license patents between each other to settle disputes or as part of businessagreements. Our competitors may have licenses to our patents, and under current case law, some of the licenses may exhaustour patent rights as to licensed product sales under some circumstances. Our participation in industry standards organizations orwith other industry initiatives may require us to license our patents to companies that adopt industry-standard specifications.Depending on the rules of the organization, we might have to grant these licenses to our patents for little or no cost, and as aresult, we may be unable to enforce certain patents against others, our costs of enforcing our licenses or protecting our patentsmay increase, and the value of our IP rights may be impaired.
Third parties may assert claims based on IP rights against us or our products, which could harm our business. We may faceclaims based on IP rights from individuals and companies, including those who have acquired patent portfolios to assert claimsagainst other companies. We are normally engaged in a number of litigation matters involving IP rights. Claims that our productsor processes infringe the IP rights of others, whether or not meritorious, could cause us to incur large costs to respond to, defend,and resolve, and they may divert the efforts and attention of management and technical personnel. In addition, we may faceclaims based on the theft or unauthorized use or disclosure of third-party trade secrets and other confidential businessinformation or end-user data that we obtain in conducting our business. Any such incidents and claims could severely disrupt ourbusiness, and we could suffer losses, including the cost of product recalls and returns, and reputational harm. Furthermore, wehave agreed to indemnify customers for certain IP rights claims against them. As a result of IP rights claims, we could:• pay monetary damages, including payments to satisfy indemnification obligations;• stop manufacturing, using, selling, offering to sell, or importing products or technology subject to claims;• develop other products or technology not subject to claims, which could be time-consuming or costly; and/or• enter into settlement and license agreements, which agreements may not be available on commercially reasonable terms.
These IP rights claims could harm our competitive position, result in expenses, or require us to impair our assets. If we alter orstop production of affected items, our revenue could be harmed.
25

We rely on access to third-party IP, which may not be available to us on commercially reasonable terms or at all. Many of ourproducts include third-party IP and/or implement industry standards, which may require licenses from third parties. Based on pastexperience and industry practice, we believe such licenses generally can be obtained on commercially reasonable terms.However, there is no assurance that the necessary licenses can be obtained on acceptable terms or at all. Failure to obtain theright to use third-party IP, or to use such IP on commercially reasonable terms, could preclude us from selling certain products orotherwise have a material adverse impact on our financial condition and operating results.
We are subject to the risks associated with litigation and regulatory proceedings. We may face legal claims or regulatory mattersinvolving stockholder, consumer, competition, and other issues on a global basis. As described in “Note 25: Contingencies” inPart II, Item 8 of this Form 10-K, we are engaged in a number of litigation and regulatory matters. Litigation and regulatoryproceedings are inherently uncertain, and adverse rulings could occur, including monetary damages, or an injunction stopping usfrom manufacturing or selling certain products, engaging in certain business practices, or requiring other remedies, such ascompulsory licensing of patents. An unfavorable outcome may result in a material adverse impact on our business, results ofoperations, financial position, and overall trends. In addition, regardless of the outcome, litigation can be costly, time-consuming,disruptive to our operations, and distracting to management.
We must attract, retain, and motivate key employees.
To be competitive, we must attract, retain, and motivate executives and other key employees. Hiring and retaining qualifiedexecutives, scientists, engineers, technical staff, and sales representatives are critical to our business, and competition forexperienced employees can be intense. To help attract, retain, and motivate qualified employees, we use share-based and otherperformance-based incentive awards such as restricted stock units (RSUs) and cash bonuses. If our share-based or othercompensation programs cease to be viewed as competitive and valuable benefits, our ability to attract, retain, and motivateemployees could be weakened, which could harm our results of operations.
26

We are subject to cybersecurity and privacy risks.
Third parties attempt to gain unauthorized access to our network, products, services, and infrastructure. We regularly faceattempts by others to gain unauthorized access through the Internet or to introduce malicious software to our informationtechnology (IT) systems. Additionally, malicious hackers may attempt to gain unauthorized access and corrupt the processes ofhardware and software products that we manufacture and services we provide. Due to the widespread use of our products andthe high profile of our commercial security products, we or our products and services are a frequent target of computer hackersand organizations that intend to sabotage, take control of, or otherwise corrupt our manufacturing or other processes, products,and services. We are also a target of malicious attackers who attempt to gain access to our network or data centers or those ofour customers or end users; steal proprietary information related to our business, products, employees, and customers; orinterrupt our systems and services or those of our customers or others. We believe such attempts are increasing in number and intechnical sophistication. From time to time, we encounter intrusions or unauthorized access to our network, products, services, orinfrastructure. To date, none have resulted in any material adverse impact to our business or operations. In some instances, we,our customers, and the users of our products and services might be unaware of an incident or its magnitude and effects. Whilewe seek to detect and investigate all unauthorized attempts and attacks against our network, products, and services, and toprevent their recurrence where practicable through changes to our internal processes and tools and/or changes or patches to ourproducts and services, we remain potentially vulnerable to additional known or unknown threats. Such incidents, whethersuccessful or unsuccessful, could result in our incurring significant costs related to, for example, rebuilding internal systems,reduced inventory value, providing modifications to our products and services, defending against litigation, responding toregulatory inquiries or actions, paying damages, or taking other remedial steps with respect to third parties. In addition, thesethreats are constantly evolving, thereby increasing the difficulty of successfully defending against them or implementing adequatepreventative measures. Publicity about vulnerabilities and attempted or successful incursions could damage our reputation withcustomers or users, and reduce demand for our products and services.
We may be subject to theft, loss, or misuse of personal data about our employees, customers, or other third parties, which couldincrease our expenses, damage our reputation, or result in legal or regulatory proceedings. The theft, loss, or misuse of personaldata collected, used, stored, or transferred by us to run our business could result in significantly increased security costs or costsrelated to defending legal claims. Global privacy legislation, enforcement, and policy activity in this area are rapidly expandingand creating a complex regulatory compliance environment. Costs to comply with and implement these privacy-related and dataprotection measures could be significant. In addition, even our inadvertent failure to comply with federal, state, or internationalprivacy-related or data protection laws and regulations could result in proceedings against us by governmental entities or others.
27

We are subject to risks associated with transactions.
We invest in companies for strategic reasons and may not realize a return on our investments. We make investments in publicand private companies around the world to further our strategic objectives and support key business initiatives. Many of theinstruments in which we invest are non-marketable at the time of our initial investment. Companies in which we invest range fromearly-stage companies still defining their strategic direction to mature companies with established revenue streams and businessmodels. The success of our investment in any company is typically dependent on the availability to the company of additionalfunding on favorable terms, or a liquidity event, such as a public offering or acquisition. If any of the companies in which we investfail, we could lose all or part of our investment. If we determine that an other-than-temporary decline in the fair value exists for aninvestment, we write down the investment to its fair value and recognize a loss.
Our acquisitions, divestitures, and other transactions could fail to achieve strategic objectives, disrupt our ongoing business, andharm our results of operations. In pursuing our business strategy, we routinely conduct discussions, evaluate opportunities, andenter into agreements for possible acquisitions, divestitures, and other transactions, such as joint ventures. Given that ourresources are limited, our decision to complete an acquisition has opportunity costs and we may need to forgo the prospect ofacquiring other companies or technologies that could help us achieve our strategic objectives. In addition to opportunity costs,these transactions involve large challenges and risks, including risks that:• the transaction may not advance our business strategy;• we may be unable to identify opportunities on terms acceptable to us;• we may not realize a satisfactory return;• we may experience disruption of our ongoing operations;• we may be unable to retain key personnel;• we may experience difficulty in integrating new employees, business systems, and technology;• acquired businesses may not have adequate controls, processes, and procedures to ensure compliance with laws and
regulations, and our due diligence process may not identify compliance issues or other liabilities;• we may have difficulty entering new market segments;• we may be unable to retain the customers and partners of acquired businesses; and/or• there may be unknown, underestimated, and/or undisclosed commitments or liabilities.
When we decide to sell assets or a business, we may have difficulty selling on acceptable terms in a timely manner, and theagreed-upon terms and financing arrangements could be renegotiated due to changes in business or market conditions. Thesecircumstances could delay the achievement of our strategic objectives or cause us to incur additional expense, or we may sell abusiness at a price or on terms that are less favorable than we had anticipated, resulting in a loss on the transaction.
If we do enter into agreements with respect to acquisitions, divestitures, or other transactions, we may fail to complete them dueto factors such as:• failure to obtain regulatory or other approvals;• IP disputes or other litigation; or• difficulties obtaining financing for the transaction.
28

We are subject to sales-related risks.
We face risks related to sales through distributors and other third parties. We sell a significant portion of our products throughthird parties such as distributors, value-added resellers, OEMs, ODMs, Internet service providers, and channel partners(collectively referred to as distributors). Using third parties for distribution exposes us to many risks, including competitivepressure, concentration, credit risk, and compliance risks. Distributors may sell products that compete with our products, and wemay need to provide financial and other incentives to focus distributors on the sale of our products. We may rely on one or morekey distributors for a product, and the loss of these distributors could reduce our revenue. Distributors may face financialdifficulties, including bankruptcy, which could harm our collection of accounts receivable and financial results. Violations of theForeign Corrupt Practices Act or similar laws by distributors or other third-party intermediaries could have a material impact onour business. Failure to manage risks related to our use of distributors may reduce sales, increase expenses, and weaken ourcompetitive position.
We face risks related to business transactions with U.S. government entities. We receive proceeds from services and productswe provide to the U.S. government. U.S. government demand and payment may be affected by public sector budgetary cyclesand funding authorizations. U.S. government contracts are subject to oversight, including special rules on accounting, IP rights,expenses, reviews, information handling, and security. Failure to comply with these rules could result in civil and criminalpenalties and sanctions, including termination of contracts, fines, and suspensions, or debarment from future U.S. governmentbusiness.
Our results of operations could vary as a result of the methods, estimates, and judgments that we use in applying
accounting policies.
The methods, estimates, and judgments that we use in applying accounting policies have a large impact on our results ofoperations. For more information, see “Critical Accounting Estimates” in Part II, Item 7 of this Form 10-K. These methods,estimates, and judgments are subject to large risks, uncertainties, and assumptions, and changes could affect our results ofoperations.
Changes in our effective tax rate may reduce our net income.
A number of factors may increase our effective tax rates, which could reduce our net income, including:• the jurisdictions in which profits are determined to be earned and taxed;• the resolution of issues arising from tax audits;• changes in the valuation of our deferred tax assets and liabilities, and in deferred tax valuation allowances;• adjustments to income taxes upon finalization of tax returns;• increases in expenses not deductible for tax purposes, including impairments of goodwill;• changes in available tax credits;• changes in tax laws or their interpretation, including changes in the U.S. to the taxation of manufacturing enterprises and of
non-U.S. income and expenses;• changes in U.S. generally accepted accounting principles; and• our decision to repatriate non-U.S. earnings for which we have not previously provided for U.S. taxes.
We may have fluctuations in the amount and frequency of our stock repurchases.
The amount, timing, and execution of our stock repurchase program may fluctuate based on our priorities for the use of cash forother purposes—such as investing in our business, including operational spending, capital spending, and acquisitions, andreturning cash to our stockholders as dividend payments—and because of changes in cash flows and changes in tax laws.
Workforce restructuring actions may be disruptive to our operations and adversely affect our financial results.
In response to the business environment and to accomplish our strategic objectives, from time to time we may restructure ouroperations or make other adjustments to our workforce. Such workforce changes can result in restructuring charges in addition tothose described in “Note 13: Restructuring and Asset Impairment Charges” in Part II, Item 8 of this Form 10-K. Such workforcechanges can also temporarily reduce workforce productivity, which could be disruptive to our business and adversely affect ourresults of operations. In addition, we may not achieve or sustain the expected cost savings or other benefits of our restructuringplans, or do so within the expected time frame.
29

There are inherent limitations on the effectiveness of our controls.
We do not expect that our disclosure controls or our internal control over financial reporting will prevent or detect all errors and allfraud. A control system, no matter how well-designed and operated, can provide only reasonable, not absolute, assurance thatthe control system’s objectives will be met. The design of a control system must reflect the fact that resource constraints exist,and the benefits of controls must be considered relative to their costs. Further, because of the inherent limitations in all controlsystems, no evaluation of controls can provide absolute assurance that misstatements due to error or fraud will not occur or thatall control issues and instances of fraud, if any, have been detected. The design of any system of controls is based in part oncertain assumptions about the likelihood of future events, and there can be no assurance that any design will succeed inachieving its stated goals under all potential future conditions. Projections of any evaluation of the effectiveness of controls tofuture periods are subject to risks. Over time, controls may become inadequate due to changes in conditions or deterioration inthe degree of compliance with policies or procedures. If our controls become inadequate, we could fail to meet our financialreporting obligations, our reputation may be adversely affected, our business and operating results could be harmed, and themarket price of our stock could decline.
30

ITEM 1B. UNRESOLVED STAFF COMMENTS
Not applicable.
ITEM 2. PROPERTIES
As of December 26, 2015, our major facilities consisted of:
(Square Feet in Millions)UnitedStates
OtherCountries Total
Owned facilities1 . . . . . . . . . . . . . . . . . . . . . . . . . . . . . . . . . . . . . . . . . . . . . . . . . . . . . . . . . . 30.7 17.2 47.9Leased facilities2 . . . . . . . . . . . . . . . . . . . . . . . . . . . . . . . . . . . . . . . . . . . . . . . . . . . . . . . . . . 2.1 6.0 8.1
Total facilities . . . . . . . . . . . . . . . . . . . . . . . . . . . . . . . . . . . . . . . . . . . . . . . . . . . . . . . . . . . . 32.8 23.2 56.0
1 Leases on portions of the land used for these facilities expire on varying dates through 2062.2 Leases expire on varying dates through 2030 and generally include renewals at our option.
Our principal executive offices are located in the U.S. and a majority of our wafer fabrication activities are also located in the U.S.We completed construction of development fabrication facilities in Oregon during 2014 that we expect will enable us to maintainour process technology lead. We also completed construction of a large-scale fabrication building in Arizona in 2013. A portion ofthe new Oregon and Arizona facilities are currently not in use and we are reserving the new buildings for additional capacity andfuture technologies. Incremental construction and equipment installation are required to ready the facilities for their intended use.Our Massachusetts fabrication facility was our last manufacturing facility on 200mm wafers and ceased production in Q1 2015.Outside the U.S., we have wafer fabrication facilities in Ireland, Israel, and China. Our fabrication facility in Ireland hastransitioned to our 14nm process technology, with manufacturing continuing to ramp in 2016. Additionally, in the second half of2016, we will start using our facility in Dalian, China to help expand our manufacturing capacity in next-generation memory. Ourassembly and test facilities are located in Malaysia, China, and Vietnam. In addition, we have sales and marketing officesworldwide that are generally located near major concentrations of customers.
We believe that the facilities described above are suitable and adequate for our present purposes and that the productivecapacity in our facilities is substantially being utilized or we have plans to utilize it.
We do not identify or allocate assets by operating segment. For information on net property, plant and equipment by country, see“Note 26: Operating Segments and Geographic Information” in Part II, Item 8 of this Form 10-K.
ITEM 3. LEGAL PROCEEDINGS
For a discussion of legal proceedings, see “Note 25: Contingencies” in Part II, Item 8 of this Form 10-K.
ITEM 4. MINE SAFETY DISCLOSURES
Not applicable.
31

PART II
ITEM 5. MARKET FOR REGISTRANT’S COMMON EQUITY, RELATED STOCKHOLDER MATTERS AND ISSUER
PURCHASES OF EQUITY SECURITIES
Information regarding the principal U.S. market in which Intel common stock is traded, including the market price range of Intelcommon stock and dividend information, can be found in “Financial Information by Quarter (Unaudited)” in Part II, Item 8 of thisForm 10-K.
As of February 5, 2016, there were approximately 130,000 registered holders of record of Intel’s common stock. A substantiallygreater number of holders of Intel common stock are “street name” or beneficial holders, whose shares of record are held bybanks, brokers, and other financial institutions.
Issuer Purchases of Equity Securities
We have an ongoing authorization, originally approved by our Board of Directors in 2005, and subsequently amended, torepurchase up to $65.0 billion in shares of our common stock in open market or negotiated transactions. As of December 26,2015, $9.4 billion remained available for repurchase under the existing repurchase authorization limit.
Common stock repurchase activity under our stock repurchase plan during each quarter of 2015 was as follows:
Period
Total Number ofShares Purchased
(In Millions)Average PricePaid Per Share
Dollar Value ofShares That May
Yet Be Purchased(In Millions)
December 28, 2014 – March 28, 2015 . . . . . . . . . . . . . . . . . . . . . . . 21.3 $ 35.14 $ 11,643
March 29, 2015 – June 27, 2015 . . . . . . . . . . . . . . . . . . . . . . . . . . . . 23.6 31.83 10,893
June 28, 2015 – September 26, 2015 . . . . . . . . . . . . . . . . . . . . . . . . 34.8 28.78 9,892
September 27, 2015 – December 26, 2015 . . . . . . . . . . . . . . . . . . . . 16.0 31.24 $ 9,391
Total . . . . . . . . . . . . . . . . . . . . . . . . . . . . . . . . . . . . . . . . . . . . . . . . . 95.7 $ 31.36
Common stock repurchase activity under our stock repurchase plan during Q4 2015 was as follows:
Period
Total Number ofShares Purchased
(In Millions)Average PricePaid Per Share
Dollar Value ofShares That May
Yet Be PurchasedUnder the Plans
(In Millions)
September 27, 2015 – October 24, 2015 . . . . . . . . . . . . . . . . . . . . . . 16.0 $ 31.24 $ 9,391
October 25, 2015 – November 21, 2015 . . . . . . . . . . . . . . . . . . . . . . — — 9,391
November 22, 2015 – December 26, 2015 . . . . . . . . . . . . . . . . . . . . — — $ 9,391
Total . . . . . . . . . . . . . . . . . . . . . . . . . . . . . . . . . . . . . . . . . . . . . . . . . 16.0 $ 31.24
In our consolidated financial statements, we treat shares of common stock withheld for tax purposes on behalf of our employeesin connection with the vesting of RSUs as common stock repurchases because they reduce the number of shares that wouldhave been issued upon vesting. These withheld shares of common stock are not considered common stock repurchases underour authorized common stock repurchase plan and accordingly are not included in the common stock repurchase totals in thepreceding table.
For further discussion, see “Note 19: Common Stock Repurchases” in Part II, Item 8 of this Form 10-K.
32

Stock Performance Graph
The line graph that follows compares the cumulative total stockholder return on our shares of common stock with the cumulativetotal return of the Dow Jones U.S. Technology Index* and the Standard & Poor’s S&P 500* Index for the five years endedDecember 26, 2015. The graph and table assume that $100 was invested on the last day of trading for the fiscal year 2010 ineach of our shares of common stock, the Dow Jones U.S. Technology Index, and the S&P 500 Index, and that all dividends werereinvested. Cumulative total stockholder returns for our shares of common stock, the Dow Jones U.S. Technology Index, and theS&P 500 Index are based on our fiscal year.
Comparison of Five-Year Cumulative Return for Intel,
the Dow Jones U.S. Technology Index*, and the S&P 500* Index
2010 2011 2012 2013 2014 2015
Intel Corporation
Dow Jones U.S. Technology Index
S&P 500 Index
$250
$200
$150
$100
$50
2010 2011 2012 2013 2014 2015
Intel Corporation . . . . . . . . . . . . . . . . . . . . . . . . . . . . . . . . . . . . . . . . $ 100 $ 122 $ 104 $ 137 $ 207 $ 199Dow Jones U.S. Technology Index . . . . . . . . . . . . . . . . . . . . . . . . . . $ 100 $ 100 $ 110 $ 141 $ 175 $ 179S&P 500 Index . . . . . . . . . . . . . . . . . . . . . . . . . . . . . . . . . . . . . . . . . . $ 100 $ 102 $ 116 $ 157 $ 157 $ 152
33

ITEM 6. SELECTED FINANCIAL DATA
Years Ended(Dollars in Millions, Except Per Share Amounts) Dec 26, 2015 Dec 27, 2014 Dec 28, 2013 Dec 29, 2012 Dec 31, 2011
Net revenue . . . . . . . . . . . . . . . . . . . . . . . . . . . . . . . . $ 55,355 $ 55,870 $ 52,708 $ 53,341 $ 53,999Gross margin . . . . . . . . . . . . . . . . . . . . . . . . . . . . . . . $ 34,679 $ 35,609 $ 31,521 $ 33,151 $ 33,757Gross margin percentage . . . . . . . . . . . . . . . . . . . . . 62.6% 63.7% 59.8% 62.1% 62.5%Research and development (R&D) . . . . . . . . . . . . . . $ 12,128 $ 11,537 $ 10,611 $ 10,148 $ 8,350Marketing, general and administrative (MG&A) . . . . . $ 7,930 $ 8,136 $ 8,088 $ 8,057 $ 7,670R&D and MG&A as percentage of revenue . . . . . . . . 36.2% 35.2% 35.5% 34.1% 29.7%Operating income . . . . . . . . . . . . . . . . . . . . . . . . . . . . $ 14,002 $ 15,347 $ 12,291 $ 14,638 $ 17,477Net income . . . . . . . . . . . . . . . . . . . . . . . . . . . . . . . . . $ 11,420 $ 11,704 $ 9,620 $ 11,005 $ 12,942Effective tax rate . . . . . . . . . . . . . . . . . . . . . . . . . . . . 19.6% 25.9% 23.7% 26.0% 27.2%Earnings per share of common stock
Basic . . . . . . . . . . . . . . . . . . . . . . . . . . . . . . . . . . . $ 2.41 $ 2.39 $ 1.94 $ 2.20 $ 2.46Diluted . . . . . . . . . . . . . . . . . . . . . . . . . . . . . . . . . . $ 2.33 $ 2.31 $ 1.89 $ 2.13 $ 2.39
Weighted average diluted shares of common stockoutstanding . . . . . . . . . . . . . . . . . . . . . . . . . . . . . . 4,894 5,056 5,097 5,160 5,411
Dividends per share of common stockDeclared . . . . . . . . . . . . . . . . . . . . . . . . . . . . . . . . . $ 0.96 $ 0.90 $ 0.90 $ 0.87 $ 0.7824Paid . . . . . . . . . . . . . . . . . . . . . . . . . . . . . . . . . . . . $ 0.96 $ 0.90 $ 0.90 $ 0.87 $ 0.7824
Net cash provided by operating activities . . . . . . . . . $ 19,017 $ 20,418 $ 20,776 $ 18,884 $ 20,963Additions to property, plant and equipment . . . . . . . . $ 7,326 $ 10,105 $ 10,711 $ 11,027 $ 10,764Repurchase of common stock . . . . . . . . . . . . . . . . . . $ 3,001 $ 10,792 $ 2,147 $ 4,765 $ 14,133Payment of dividends to stockholders . . . . . . . . . . . . $ 4,556 $ 4,409 $ 4,479 $ 4,350 $ 4,127
(Dollars in Millions) Dec 26, 2015 Dec 27, 2014 Dec 28, 2013 Dec 29, 2012 Dec 31, 2011
Property, plant and equipment, net . . . . . . . . . . . . . . $ 31,858 $ 33,238 $ 31,428 $ 27,983 $ 23,627Total assets . . . . . . . . . . . . . . . . . . . . . . . . . . . . . . . . $ 103,065 $ 91,900 $ 92,297 $ 84,285 $ 71,083Debt . . . . . . . . . . . . . . . . . . . . . . . . . . . . . . . . . . . . . . $ 22,670 $ 13,655 $ 13,385 $ 13,382 $ 7,295Temporary equity . . . . . . . . . . . . . . . . . . . . . . . . . . . . $ 897 $ 912 $ — $ — $ —Stockholders’ equity . . . . . . . . . . . . . . . . . . . . . . . . . . $ 61,085 $ 55,865 $ 58,256 $ 51,203 $ 45,911Employees (in thousands) . . . . . . . . . . . . . . . . . . . . . 107.3 106.7 107.6 105.0 100.1
During Q4 2015, the closing stock price conversion right condition of the 2009 debentures continues to be met and thedebentures will be convertible at the option of the holders during Q1 2016. The excess of the amount of cash payable if convertedover the carrying amount of the 2009 debentures was classified as temporary equity on our consolidated balance sheet. Forfurther information, see “Note 15: Borrowings” in Part II, Item 8 of this Form 10-K.
During 2013 and 2015, management approved several restructuring actions, including targeted workforce reductions as well asexit of certain businesses and facilities. For further information, see “Note 13: Restructuring and Asset Impairment Charges” inPart II, Item 8 of this Form 10-K.
34

ITEM 7. MANAGEMENT’S DISCUSSION AND ANALYSIS OF FINANCIAL CONDITION AND RESULTS OF OPERATIONS
Our Management’s Discussion and Analysis of Financial Condition and Results of Operations (MD&A) is provided in addition tothe accompanying consolidated financial statements and notes to assist readers in understanding our results of operations,financial condition, and cash flows. MD&A is organized as follows:• Overview. Discussion of our business and overall analysis of financial and other highlights affecting the company in order to
provide context for the remainder of MD&A.• Critical Accounting Estimates. Accounting estimates that we believe are most important to understanding the assumptions
and judgments incorporated in our reported financial results and forecasts.• Results of Operations. Analysis of our financial results comparing 2015 to 2014 and comparing 2014 to 2013.• Liquidity and Capital Resources. Analysis of changes in our balance sheets and cash flows, and discussion of our financial
condition and potential sources of liquidity.• Fair Value of Financial Instruments. Discussion of the methodologies used in the valuation of our financial instruments.• Contractual Obligations and Off-Balance-Sheet Arrangements. Overview of contractual obligations, contingent liabilities,
commitments, and off-balance-sheet arrangements outstanding as of December 26, 2015, including expected paymentschedule.
The various sections of this MD&A contain a number of forward-looking statements that involve a number of risks anduncertainties. Words such as “anticipates,” “expects,” “intends,” “goals,” “plans,” “believes,” “seeks,” “estimates,” “continues,”“may,” “will,” “should,” and variations of such words and similar expressions are intended to identify such forward-lookingstatements. In addition, any statements that refer to projections of our future financial performance, our anticipated growth andtrends in our businesses, uncertain events or assumptions, and other characterizations of future events or circumstances areforward-looking statements. Such statements are based on our current expectations and could be affected by the uncertaintiesand risk factors described throughout this filing and particularly in “Risk Factors” in Part I, Item 1A of this Form 10-K. Our actualresults may differ materially, and these forward-looking statements do not reflect the potential impact of any divestitures, mergers,acquisitions, or other business combinations that had not been completed as of February 12, 2016, except for our acquisition ofAltera completed on December 28, 2015 as discussed in “Note 8: Acquisitions” in Part II, Item 8 of this Form 10-K.
Overview
Our results of operations for each period were as follows:
Three Months Ended Twelve Months Ended
(Dollars in Millions, Except Per Share Amounts)Dec 26,
2015Dec 27,
2014 ChangeDec 26,
2015Dec 27,
2014 Change
Net revenue . . . . . . . . . . . . . . . . . . . . . . . . . . . . . . . . $ 14,914 $ 14,721 $ 193 $ 55,355 $ 55,870 $ (515)Gross margin . . . . . . . . . . . . . . . . . . . . . . . . . . . . . . . $ 9,590 $ 9,621 $ (31) $ 34,679 $ 35,609 $ (930)Gross margin percentage . . . . . . . . . . . . . . . . . . . . . 64.3% 65.4% (1.1) pts 62.6% 63.7% (1.1) ptsOperating income . . . . . . . . . . . . . . . . . . . . . . . . . . . . $ 4,299 $ 4,453 $ (154) $ 14,002 $ 15,347 $(1,345)Net income . . . . . . . . . . . . . . . . . . . . . . . . . . . . . . . . . $ 3,613 $ 3,661 $ (48) $ 11,420 $ 11,704 $ (284)Diluted earnings per share of common stock . . . . . . . $ 0.74 $ 0.74 $ — $ 2.33 $ 2.31 $ 0.02Effective tax rate . . . . . . . . . . . . . . . . . . . . . . . . . . . . 16.0% 21.4% (5.4) pts 19.6% 25.9% (6.3) pts
35

MANAGEMENT’S DISCUSSION AND ANALYSIS OF FINANCIAL CONDITION AND RESULTS OF OPERATIONS (Continued)
We achieved record net revenue for Q4 2015 of $14.9 billion, up 1% from Q4 2014. We continue to see our business evolve aswe execute on our strategy to leverage the “Virtuous Cycle of Growth” with higher DCG platform, NSG, and IOTG platformrevenue. These operating segments made up nearly 40% of our revenue and more than 60% of our operating profit for full year2015. DCG and IOTG both posted record net revenue for the quarter and was partially offset by lower CCG platform revenue. Wecontinue to believe that the worldwide PC supply chain is healthy, with appropriate levels of inventory.
Gross margin of 64% decreased by approximately one percentage point from Q4 2014, primarily due to higher platform unit coststhat resulted in part from a higher mix of 14nm platforms, and lower platform unit sales. These decreases were partially offset byhigher platform average selling prices and, to a lesser extent, lower factory start-up costs. Gross margin increased approximatelytwo percentage points compared to the midpoint of the Business Outlook in October 2015, primarily driven by lower platform unitcosts, lower factory start-up costs, and higher platform average selling prices.
For full year 2015, our net revenue of $55.4 billion was down 1% from 2014, operating income of $14.0 billion, was down 9% from2014, and diluted earnings per share of $2.33 were up 1% from 2014. CCG net revenue was down 8% as we continued to seeweakness in the macroeconomic environment and, in particular, the PC market as we were coming off of a strong growth rate inthe second half of 2014 with the Microsoft Windows* XP refresh. We continue to see growth in DCG, with net revenue up 11%and platform unit sales and average selling prices up 8% and 3%, respectively.
Gross margin of 63% was down approximately one point from 2014, driven by higher platform unit costs on 14nm and lowerplatform unit sales. These decreases were partially offset by higher platform average selling prices, primarily driven by a highermix of DCG platforms and higher average selling prices on a richer mix of platforms within the desktop and DCG platforms. To alesser extent, the decrease in gross margin was also partially offset by lower factory start-up costs on 14nm as well as lowerproduction costs on 14nm, which were treated as a period charge in 2014. Operating profit was $14.0 billion in 2015, a decreaseof $1.3 billion from 2014, driven by lower gross margin and increased investments in our growth market segments of the datacenter, Internet of Things, and memory. Our operating profit decrease was partially offset by lower investment in the PC marketsegment. Our effective tax rate for 2015 of 19.6% decreased 6.3 points from 2014, driven by one-time items and our decision toindefinitely reinvest certain prior years’ non-U.S. earnings.
The cash generation from our business remained strong, with cash from operations of $19.0 billion in 2015. During 2015, wepurchased $7.3 billion of capital assets, down $2.8 billion from 2014. This change was primarily driven by our new strategy onnext-generation process technology and manufacturing efficiencies, namely that we extended the length of time we plan to usethe 14nm process technology by introducing a third 14nm product, code-named “Kaby Lake.” This product will have keyperformance enhancements as compared to our 6th generation Intel Core processor family. We also returned cash tostockholders by both paying $4.6 billion in dividends and repurchasing $3.0 billion of common stock through our stock repurchaseprogram. We ended the year with an investment portfolio of $25.3 billion, up approximately $11.3 billion from a year ago. Thatinvestment portfolio consisted of cash and cash equivalents, short-term investments, and trading assets. We issuedapproximately $9.5 billion of long-term debt to finance our Altera acquisition. For further information, see “Note 15: Borrowings” inPart II, Item 8 of this Form 10-K. Effective in Q1 2016, our annual dividend increased $0.08 to $1.04 per share and our Board ofDirectors declared a cash dividend of $0.26 per share of common stock.
Early in Q1 2016, we completed the acquisition of Altera. The acquisition will couple Intel’s leading-edge products andmanufacturing process with Altera’s leading FPGA technology. The combination is expected to enable new classes of productsthat meet customer needs in the data center and Internet of Things market segments. We believe our product offerings andarchitectures will continue to enable innovation and growth in the data center and the Internet of Things market segments. Theimpact of the Altera acquisition has been reflected in our Business Outlook published in our January 2016 earnings release. Forfurther information, see “Note 8: Acquisitions” in Part II, Item 8 of this Form 10-K.
36

MANAGEMENT’S DISCUSSION AND ANALYSIS OF FINANCIAL CONDITION AND RESULTS OF OPERATIONS (Continued)
Our Business Outlook for Q1 2016 and full year 2016 includes, where applicable, our current expectations for revenue, grossmargin percentage, spending (R&D plus MG&A), and capital expenditures. We publish our Business Outlook in our quarterlyearnings release.
Our Business Outlook and any updates thereto are publicly available on our Investor Relations website, www.intc.com. ThisBusiness Outlook is not incorporated by reference in this Form 10-K. We expect that our corporate representatives will, from timeto time, meet publicly or privately with investors and others, and may reiterate the forward-looking statements contained in theBusiness Outlook or in this Form 10-K. The statements in the Business Outlook and forward-looking statements in this Form 10-Kare subject to revision during the course of the year in our quarterly earnings releases and SEC filings and at other times. Theforward-looking statements in the Business Outlook will be effective through the close of business on March 18, 2016, unlessupdated earlier. From the close of business on March 18, 2016 until our quarterly earnings release is published, currentlyscheduled for April 19, 2016, we will observe a “quiet period.” During the quiet period, the Business Outlook and other forward-looking statements first published in our Form 8-K filed on January 14, 2016, and other forward-looking statements disclosed inthe company’s news releases and filings with the SEC, as reiterated or updated as applicable in this Form 10-K, should beconsidered historical, speaking as of prior to the quiet period only and not subject to update. During the quiet period, ourrepresentatives will not comment on our Business Outlook or our financial results or expectations. The exact timing and durationof the routine quiet period, and any others that we utilize from time to time, may vary at our discretion.
Critical Accounting Estimates
The methods, estimates, and judgments that we use in applying our accounting policies have a significant impact on the resultsthat we report in our consolidated financial statements. Some of our accounting policies require us to make difficult and subjectivejudgments, often as a result of the need to make estimates regarding matters that are inherently uncertain. Our most criticalaccounting estimates include:• the valuation of non-marketable equity investments and the determination of other-than-temporary impairments, which impact
gains (losses) on equity investments, net when we record impairments;• the determination of useful lives for our property, plant and equipment and the related timing of when depreciation should
begin;• the valuation and allocation of assets acquired and liabilities assumed in connection with business combinations;• the valuation and recoverability of long-lived assets (property, plant and equipment; identified intangibles and goodwill),
which impact gross margin or operating expenses when we record asset impairments or accelerate their depreciation oramortization;
• the recognition and measurement of current and deferred income taxes (including the measurement of uncertain taxpositions), which impact our provision for taxes;
• the valuation of inventory, which impacts gross margin; and• the recognition and measurement of loss contingencies, which impact gross margin or operating expenses when we
recognize a loss contingency, revise the estimate for a loss contingency, or record an asset impairment.
In the following section, we discuss these policies further, as well as the estimates and judgments involved.
Non-Marketable Equity Investments
We regularly invest in non-marketable equity instruments of private companies, which range from early-stage companies that areoften still defining their strategic direction to more mature companies with established revenue streams and business models. Thecarrying value of our non-marketable equity investment portfolio, excluding equity derivatives, totaled $4.5 billion as ofDecember 26, 2015 ($3.2 billion as of December 27, 2014).
Our non-marketable equity investments are recorded using the cost method or the equity method of accounting, depending on thefacts and circumstances of each investment. Our non-marketable equity investments are classified within other long-term assetson the consolidated balance sheets.
37

MANAGEMENT’S DISCUSSION AND ANALYSIS OF FINANCIAL CONDITION AND RESULTS OF OPERATIONS (Continued)
Non-marketable equity investments are inherently risky, and their success depends on product development, market acceptance,operational efficiency, and other key business factors. The companies could fail or not be able to raise additional funds whenneeded, or they may receive lower valuations with less favorable investment terms than previous financings. These events couldcause our investments to become impaired. In addition, financial market volatility could negatively affect our ability to realize valuein our investments through liquidity events such as initial public offerings, mergers, and private sales. For further informationabout our investment portfolio risks, see “Risk Factors” in Part I, Item 1A of this Form 10-K.
We determine the fair value of our non-marketable equity investments portfolio quarterly for impairment and disclosure purposes;however, the investments are recorded at fair value only if an impairment is recognized. The measurement of fair value requiressignificant judgment and includes a qualitative and quantitative analysis of events or circumstances that impact the fair value ofthe investment. Qualitative analysis of our investments involves understanding each investee’s revenue and earnings trendsrelative to pre-defined milestones and overall business prospects; the technological feasibility of our investee’s products andtechnologies; the general market conditions in the investee’s industry or geographic area, including adverse regulatory oreconomic changes; and the management and governance structure of the investee. Quantitative assessments of the fair value ofour investments are developed using the market and income approaches. The market approach includes the use of financialmetrics and ratios of comparable public companies, such as revenue, earnings, comparable performance multiples, recentfinancing rounds, the terms of investees’ issued interests, and the level of marketability of the investments. The selection ofcomparable companies requires management judgment and is based on a number of factors, including comparable companies’sizes, growth rates, industries, and development stages. The income approach includes the use of a discounted cash flow model,which requires significant estimates regarding the investees’ revenue, costs, and discount rates based on the risk profile ofcomparable companies. Estimates of revenue and costs are developed using available market, historical, and forecast data.
If the fair value of an investment is below our carrying value, we determine whether the investment is other-than-temporarilyimpaired based on our quantitative and qualitative analysis, which includes assessing the severity and duration of the impairmentand the likelihood of recovery before disposal. If the investment is considered to be other-than-temporarily impaired, we recordthe investment at fair value by recognizing an impairment. Impairments of non-marketable equity investments were $166 million in2015 ($140 million in 2014 and $112 million in 2013).
Property, Plant and Equipment Depreciation
Management judgment is required in determining the estimated economic useful lives of our property, plant and equipment, whichcan materially impact our depreciation expense. Accordingly, at least annually, we evaluate the period over which we expect torecover the economic value of these assets. During the assessment performed in Q4 2015, we considered factors such as thelengthening of the process technology cadence resulting in longer node transitions on both 14nm and 10nm products. With thoselonger transitions, we added a third product to our 14nm roadmap. We have also increased re-use of machinery and tools acrosseach generation of process technology. As a result, we determined that the useful lives of machinery and equipment in our waferfabrication facilities should be increased from four to five years. We will account for this as a change in estimate that will beapplied prospectively, effective in Q1 2016. This change in depreciable life drives approximately $1.5 billion in lower depreciationexpense for 2016. Approximately half of this benefit will increase gross margin (impacting both unit cost and start-up costs),approximately one-fourth will decrease R&D expenses, and the remaining one-fourth will result in lower inventory costs andending inventory values.
As part of our long-range capacity planning, construction on certain facilities is on hold, and the facilities are not in use. Thesefacilities are being held in a safe state, and we have plans to place them into service at a future date. The time at which theseassets are placed into service depends on our existing manufacturing capacity, market demand for specific products, and wherewe are in the transition of products on our roadmap. Management is required to make judgments as to the timing of when thesefacilities will be readied for their intended use and placed into service for the manufacturing of our products, which is whendepreciation begins.
38

MANAGEMENT’S DISCUSSION AND ANALYSIS OF FINANCIAL CONDITION AND RESULTS OF OPERATIONS (Continued)
Business Combinations
Accounting for acquisitions requires our management to estimate the fair value of the assets and liabilities acquired, whichinvolves a number of judgments, assumptions, and estimates that could materially affect the timing or amounts recognized in ourfinancial statements. The items involving the most significant assumptions, estimates, and judgments include determining the fairvalue of the following:• Intangible assets, including valuation methodology, estimations of future cash flows, and discount rates, as well as the
estimated useful life of the intangible assets;• the acquired company’s brand, as well as assumptions about the period of time the acquired brand will continue to be used;• deferred tax assets and liabilities, uncertain tax positions, and tax-related valuation allowances, which are initially estimated
as of the acquisition date;• inventory; property, plant and equipment; pre-existing liabilities or legal claims; deferred revenue; and contingent
consideration, each as may be applicable, and• goodwill as measured as the excess of consideration transferred over the net of the acquisition date fair values of the assets
acquired and the liabilities assumed.
We allocate goodwill and intangible assets to the reporting unit(s) based on the reporting unit(s) that are expected to benefit fromthe business combination. Upon any reorganization of our operating segments, we reevaluate our reporting units and, ifnecessary, reassign goodwill using a relative fair value allocation approach.
Our assumptions and estimates are based upon comparable market data and information obtained from our management and themanagement of the acquired companies. While we use our best estimates and assumptions to accurately value assets acquiredand liabilities assumed at the acquisition date, our estimates are inherently uncertain and subject to refinement. As a result,during the measurement period, which may be up to one year following the acquisition date, we record adjustments to the assetsacquired and liabilities assumed with the corresponding offset to goodwill.
Long-Lived Asset Impairments
Property, Plant and Equipment
We assess property, plant and equipment for impairment when events or changes in circumstances indicate that the carryingvalue of the assets or the asset grouping may not be recoverable. Factors that we consider in deciding when to perform animpairment review include significant under-performance of a business or product line in relation to expectations, significantnegative industry or economic trends, and significant changes or planned changes in our use of the assets. We measure therecoverability of assets that we will continue to use in our operations by comparing the carrying value of the asset grouping to ourestimate of the related total future undiscounted net cash flows. If an asset grouping’s carrying value is not recoverable throughthe related undiscounted cash flows, the asset grouping is considered to be impaired. We measure the impairment by comparingthe difference between the asset grouping’s carrying value and its fair value. Property, plant and equipment is considered a non-financial asset and is recorded at fair value only if an impairment charge is recognized.
Impairments are determined for groups of assets related to the lowest level of identifiable independent cash flows. Due to ourasset usage model and the interchangeable nature of our semiconductor manufacturing capacity, we must make subjectivejudgments in determining the independent cash flows that can be related to specific asset groupings.
39

MANAGEMENT’S DISCUSSION AND ANALYSIS OF FINANCIAL CONDITION AND RESULTS OF OPERATIONS (Continued)
In addition, as we make manufacturing process conversions and other factory planning decisions, we must make subjectivejudgments regarding the remaining useful lives of assets, primarily process-specific semiconductor manufacturing tools andbuilding improvements. When we determine that the useful lives of assets are shorter than we had originally estimated, weaccelerate the rate of depreciation over the assets’ new, shorter useful lives. Based on our analysis, impairments and accelerateddepreciation of our property, plant and equipment totaled $151 million in 2015 ($115 million in 2014 and $172 million in 2013).
Identified Intangibles
We make judgments about the recoverability of purchased finite-lived intangible assets whenever events or changes incircumstances indicate that an impairment may exist. Recoverability of finite-lived intangible assets is measured by comparing thecarrying amount of the asset to the future undiscounted cash flows that the asset is expected to generate. We perform an annualimpairment assessment in the fourth quarter of each year for indefinite-lived intangible assets, or more frequently if indicators ofpotential impairment exist, to determine whether it is more likely than not that the carrying value of the assets may not berecoverable. Recoverability of indefinite-lived intangible assets is measured by comparing the carrying amount of the asset to thefuture discounted cash flows that the asset is expected to generate. If we determine that an individual asset is impaired, theamount of any impairment is measured as the difference between the carrying value and the fair value of the asset.
The assumptions and estimates used to determine future values and remaining useful lives of our intangible and other long-livedassets are complex and subjective. They can be affected by various factors, including external factors such as industry andeconomic trends, and internal factors such as changes in our business strategy and our forecasts for specific product lines.Based on our impairment assessment, we recognized impairment charges of $7 million in 2015 ($36 million in 2014 and $17million in 2013).
Goodwill
Goodwill is recorded when the purchase price of an acquisition exceeds the fair value of the net tangible and identified intangibleassets acquired. Goodwill is allocated to our reporting units based on the relative expected fair value provided by the acquisition.Reporting units may be operating segments as a whole or an operation one level below an operating segment, referred to as acomponent, and are consistent with the operating segments identified in “Note 26: Operating Segments and GeographicInformation” in Part II, Item 8 of this Form 10-K.
We perform an annual impairment assessment in the fourth quarter of each year, or more frequently if indicators of potentialimpairment exist, to determine whether it is more likely than not that the fair value of a reporting unit in which goodwill resides isless than its carrying value. For reporting units in which this assessment concludes that it is more likely than not that the fair valueis more than its carrying value, goodwill is not considered impaired and we are not required to perform the two-step goodwillimpairment test. Qualitative factors considered in this assessment include industry and market considerations, overall financialperformance, and other relevant events and factors affecting the reporting unit. Additionally, as part of this assessment, we mayperform a quantitative analysis to support the qualitative factors above by applying sensitivities to assumptions and inputs used inmeasuring a reporting unit’s fair value. For reporting units in which the impairment assessment concludes that it is more likelythan not that the fair value is less than its carrying value, we perform the first step of the goodwill impairment test, whichcompares the fair value of the reporting unit to its carrying value. If the fair value of the reporting unit exceeds the carrying valueof the net assets assigned to that reporting unit, goodwill is not considered impaired and we are not required to perform additionalanalysis. If the carrying value of the net assets assigned to the reporting unit exceeds the fair value of the reporting unit, then wemust perform the second step of the goodwill impairment test to determine the implied fair value of the reporting unit’s goodwill. Ifwe determine during the second step that the carrying value of a reporting unit’s goodwill exceeds its implied fair value, we recordan impairment loss equal to the difference.
40

MANAGEMENT’S DISCUSSION AND ANALYSIS OF FINANCIAL CONDITION AND RESULTS OF OPERATIONS (Continued)
Determining the fair value of a reporting unit involves the use of significant estimates and assumptions. Our goodwill impairmenttest uses a weighting of the income method and the market method to estimate a reporting unit’s fair value. The income method isbased on a discounted future cash flow approach that uses the following assumptions and inputs: revenue, based on assumedmarket segment growth rates and our assumed market segment share; estimated costs; and appropriate discount rates based ona reporting unit’s weighted average cost of capital as determined by considering the observable weighted average cost of capitalof comparable companies. Our estimates of market segment growth, our market segment share, and costs are based onhistorical data, various internal estimates, and a variety of external sources. These estimates are developed as part of our routinelong-range planning process. The same estimates are also used in planning for our long-term manufacturing and assembly andtest capacity needs as part of our capital budgeting process, and for long-term and short-term business planning and forecasting.We test the reasonableness of the inputs and outcomes of our discounted cash flow analysis against available comparablemarket data. The market method is based on financial multiples of comparable companies and applies a control premium. Areporting unit’s carrying value represents the assignment of various assets and liabilities, excluding certain corporate assets andliabilities, such as cash, investments, and debt.
For the annual impairment assessment in 2015, we determined that for each of our reporting units with significant amounts ofgoodwill, it was more likely than not that the fair value of the reporting units exceeded the carrying value. As a result, weconcluded that performing the first step of the goodwill impairment test was not necessary for those reporting units. During thefourth quarter of each of the prior three fiscal years, we completed our annual impairment assessments and concluded thatgoodwill was not impaired in any of these years.
Income Taxes
We must make estimates and judgments in determining the provision for taxes for financial statement purposes. These estimatesand judgments occur in the calculation of tax credits, benefits, and deductions, and in the calculation of certain tax assets andliabilities that arise from differences in the timing of recognition of revenue and expense for tax and financial statement purposes,as well as the interest and penalties related to uncertain tax positions. Significant changes in these estimates may result in anincrease or decrease to our tax provision in a subsequent period.
We must assess the likelihood that we will be able to recover our deferred tax assets. If recovery is not more likely than not, wemust increase our provision for taxes by recording a valuation allowance against the deferred tax assets that we estimate will notultimately be recoverable. We believe that we will ultimately recover the deferred tax assets recorded on our consolidated balancesheets. However, should a change occur in our ability to recover our deferred tax assets, our tax provision would increase in theperiod in which we determined that the recovery is not more likely than not. Recovery of a portion of our deferred tax assets isimpacted by management’s plans with respect to holding or disposing of certain investments; therefore, changes inmanagement’s plans with respect to holding or disposing of investments could affect our future provision for taxes.
We use a two-step process to recognize liabilities for uncertain tax positions. The first step is to evaluate the tax position forrecognition by determining whether the weight of available evidence indicates that it is more likely than not that the position will besustained on audit, including resolution of related appeals or litigation processes, if any. If we determine that a tax position willmore likely than not be sustained on audit, the second step requires us to estimate and measure the tax benefit as the largestamount that is more than 50% likely to be realized upon ultimate settlement. We consider many factors when evaluating andestimating our tax positions and tax benefits, which may require periodic adjustments and may not accurately forecast actualoutcomes. Determining whether an uncertain tax position is effectively settled requires judgment. Such a change in recognition ormeasurement would result in the recognition of a tax benefit or an additional charge to the tax provision.
41

MANAGEMENT’S DISCUSSION AND ANALYSIS OF FINANCIAL CONDITION AND RESULTS OF OPERATIONS (Continued)
We have not recognized U.S. deferred income taxes on certain undistributed non-U.S. earnings because we plan to indefinitelyreinvest such earnings outside the U.S. Remittances of non-U.S. earnings are based on estimates and judgments of projectedcash flow needs, as well as the working capital and investment requirements of our non-U.S. and U.S. operations. Materialchanges in our estimates of cash, working capital, and investment needs in various jurisdictions could require repatriation ofindefinitely reinvested non-U.S. earnings, which would be subject to U.S. income taxes and applicable non-U.S. income andwithholding taxes.
Inventory
Intel has a product development life cycle that corresponds with substantive engineering milestones. These engineeringmilestones are regularly and consistently applied in assessing the point at which our activities, and associated costs, change innature from R&D to cost of sales. In order for a product to be manufactured in high volumes and sold to our customers under ourstandard warranty, it must meet our rigorous technical quality specifications. This milestone is known as product releasequalification (PRQ). We have identified PRQ as the point at which the costs incurred to manufacture our products are included inthe valuation of inventory.
To determine which costs can be included in the valuation of inventory, we must determine normal capacity at our manufacturingand assembly and test facilities, based on historical loadings compared to total available capacity. If the factory loadings arebelow the established normal capacity level, a portion of our manufacturing overhead costs would not be included in the cost ofinventory; therefore, it would be recognized as cost of sales in that period, which would negatively impact our gross margin. Werefer to these costs as excess capacity charges. Excess capacity charges were insignificant in 2015 (insignificant in 2014 and$319 million in 2013).
Inventory is valued at the lower of cost or market, based upon assumptions about future demand and market conditions. Product-specific facts and circumstances reviewed in the inventory valuation process include a review of our customer base, the stage ofthe product life cycle of our products, consumer confidence, customer acceptance of our products, and an assessment of sellingprice in relation to product cost. If the estimated market value of the inventory is less than the carrying value, we write down theinventory and record the difference as a charge to cost of sales. Inventory reserves increased by approximately $185 million in2015 compared to 2014.
The valuation of inventory also requires us to estimate obsolete and excess inventory, as well as inventory that is not of saleablequality. The demand forecast is utilized in the development of our short-term manufacturing plans to enable consistency betweeninventory valuation and build decisions. The estimate of future demand is compared to work-in-process and finished goodsinventory levels to determine the amount, if any, of obsolete or excess inventory. If our demand forecast for specific products isgreater than actual demand and we fail to reduce manufacturing output accordingly, we could be required to write off inventory,which would negatively impact our gross margin.
Loss Contingencies
We are subject to loss contingencies, including various legal and regulatory proceedings and asserted and potential claims,accruals related to repair or replacement of parts in connection with product defects, as well as product warranties and potentialasset impairments that arise in the ordinary course of business. An estimated loss from such contingencies is recognized as acharge to income if it is probable that a liability has been incurred and the amount of the loss can be reasonably estimated.Disclosure of a loss contingency is required if there is at least a reasonable possibility that a material loss has been incurred. Theoutcomes of legal and administrative proceedings and claims, and the estimation of product warranties and asset impairments,are subject to significant uncertainty. Significant judgment is required in both the determination of probability and thedetermination as to whether a loss is reasonably estimable. At least quarterly, we review the status of each significant matter, andwe may revise our estimates. These revisions could have a material impact on our results of operations and financial position.
42

MANAGEMENT’S DISCUSSION AND ANALYSIS OF FINANCIAL CONDITION AND RESULTS OF OPERATIONS (Continued)
Results of Operations
Consolidated statements of income data as a percentage of net revenue for each period were as follows:
December 26, 2015 December 27, 2014 December 28, 2013
Years Ended(In Millions, Except Per Share Amounts) Dollars
% of NetRevenue Dollars
% of NetRevenue Dollars
% of NetRevenue
Net revenue . . . . . . . . . . . . . . . . . . . . . . . . . . . . . . . $ 55,355 100.0% $ 55,870 100.0% $ 52,708 100.0%
Cost of sales . . . . . . . . . . . . . . . . . . . . . . . . . . . . . . . 20,676 37.4% 20,261 36.3% 21,187 40.2%
Gross margin . . . . . . . . . . . . . . . . . . . . . . . . . . . . . . 34,679 62.6% 35,609 63.7% 31,521 59.8%
Research and development . . . . . . . . . . . . . . . . . . . . 12,128 21.9% 11,537 20.6% 10,611 20.1%Marketing, general and administrative . . . . . . . . . . . . 7,930 14.3% 8,136 14.6% 8,088 15.3%Restructuring and asset impairment charges . . . . . . 354 0.6% 295 0.5% 240 0.5%Amortization of acquisition-related intangibles . . . . . . 265 0.5% 294 0.5% 291 0.6%
Operating income . . . . . . . . . . . . . . . . . . . . . . . . . . 14,002 25.3% 15,347 27.5% 12,291 23.3%
Gains (losses) on equity investments, net . . . . . . . . . 315 0.6% 411 0.7% 471 0.9%Interest and other, net . . . . . . . . . . . . . . . . . . . . . . . . (105) (0.2)% 43 0.1% (151) (0.3)%
Income before taxes . . . . . . . . . . . . . . . . . . . . . . . . 14,212 25.7% 15,801 28.3% 12,611 23.9%
Provision for taxes . . . . . . . . . . . . . . . . . . . . . . . . . . . 2,792 5.1% 4,097 7.4% 2,991 5.6%
Net income . . . . . . . . . . . . . . . . . . . . . . . . . . . . . . . . $ 11,420 20.6% $ 11,704 20.9% $ 9,620 18.3%
Diluted earnings per share of common stock . . . . $ 2.33 $ 2.31 $ 1.89
Our net revenue in 2015 decreased by $515 million, or 1%, compared to 2014. Platform unit sales were down 9% due tochallenging macroeconomic conditions, particularly in the first half of the year, and higher PC demand in 2014 driven by theMicrosoft Windows XP refresh. The decrease in PC demand was partially offset by higher DCG and IOTG platform unit sales.The decrease in revenue was partially offset by higher platform average selling prices, which were up 8%, as we benefited from ahigher mix of DCG platform unit sales and higher average selling prices on desktop and DCG platforms. To a lesser extent, thedecrease in revenue was partially offset by higher NSG revenue.
Our overall gross margin percentage was 62.6% in 2015, down from 63.7% in 2014. The decrease in gross margin percentagewas primarily due to the gross margin decrease in the CCG operating segment. We derived a substantial majority of our overallgross margin dollars for 2015 and 2014 from the sale of platforms in the CCG and DCG operating segments. Our overall grossmargin dollars in 2015 decreased by $930 million, or 3%, compared to 2014. The following results drove the change in grossmargin in 2015 compared to 2014 by approximately the amounts indicated:
(In Millions) Gross Margin Reconciliation (2015 compared to 2014):
$ (1,965) Higher platform unit costs, primarily driven by the ramp of our 14nm process technology400 Lower factory start-up costs, primarily driven by the ramp of our 14nm process technology205 Lower production costs primarily on our 14nm products, which were treated as period charges in 2014, partially
offset by higher pre-qualification product costs on 14nm products430 Other
$ (930)
43

MANAGEMENT’S DISCUSSION AND ANALYSIS OF FINANCIAL CONDITION AND RESULTS OF OPERATIONS (Continued)
Our net revenue for 2014 was up $3.2 billion, or 6%, compared to 2013. Platform unit sales were up 19%, primarily driven by theramp of our tablet platform and strength in the traditional PC business. To a lesser extent, higher NSG revenue also contributedto the increase. These increases were partially offset by lower platform average selling prices, which were down 10% primarily onmix shift on significantly higher tablet and phone platform unit sales and cash consideration associated with integrating our tabletand phone platforms. To a lesser extent, lower CCG phone component unit sales partially offset the increase in revenue.
Our overall gross margin percentage was 63.7% in 2014, up from 59.8% in 2013. The increase in gross margin percentage wasprimarily due to the gross margin increase in the CCG and DCG operating segments. We derived most of our overall grossmargin dollars for 2014 and 2013 from the sale of platforms in the CCG and DCG operating segments. Our overall gross margindollars for 2014 increased by $4.1 billion, or 13%, compared to 2013. The following results drove the change in gross margin in2014 compared to 2013 by approximately the amounts indicated:
(In Millions) Gross Margin Reconciliation (2014 compared to 2013):
$ 2,575 Lower platform unit costs1,160 Higher gross margin from platform revenue1
860 Lower factory start-up costs, primarily driven by our 14nm process technology(507) Other
$ 4,088
1 Higher gross margin from platform revenue was driven by higher platform unit sales, which were partially offset by lowerplatform average selling prices. The decrease in platform average selling prices was due to a shift in market segment mix(higher tablet and phone platform unit sales with higher cash consideration to our customers associated with integration of ourplatform) and lower notebook platform average selling prices.
Client Computing Group
The revenue and operating income for the CCG operating segment for 2015 and 2014 were as follows:
Years Ended(In Millions)
Dec 26,2015
Dec 27,2014 Change % Change
Platform . . . . . . . . . . . . . . . . . . . . . . . . . . . . . . . . . . . . . . . . . . . . . . . . . . . . . . . $ 30,654 $ 33,210 $ (2,556) (8)%Other . . . . . . . . . . . . . . . . . . . . . . . . . . . . . . . . . . . . . . . . . . . . . . . . . . . . . . . . . 1,565 1,662 (97) (6)%
Net revenue . . . . . . . . . . . . . . . . . . . . . . . . . . . . . . . . . . . . . . . . . . . . . . . . . . . $ 32,219 $ 34,872 $ (2,653) (8)%
Operating income . . . . . . . . . . . . . . . . . . . . . . . . . . . . . . . . . . . . . . . . . . . . . . $ 8,165 $ 10,323 $ (2,158) (21)%
CCG platform unit sales . . . . . . . . . . . . . . . . . . . . . . . . . . . . . . . . . . . . . . . . . . . (11)%CCG platform average selling prices . . . . . . . . . . . . . . . . . . . . . . . . . . . . . . . . . 4%
Our CCG platform unit sales decreased in 2015 compared to 2014 due to challenging macroeconomic conditions, particularly inthe first half of the year, and higher PC demand in 2014 driven by the Microsoft Windows XP refresh. Our results, as compared tothe prior year, did benefit from a richer mix of high-performance platforms. Within the CCG operating segment, the followingresults drove the change in revenue in 2015 compared to 2014:
(In Millions) Revenue Reconciliation (2015 compared to 2014):
$ (2,304) Lower desktop platform unit sales, down 16%(1,695) Lower notebook platform unit sales, down 9%
760 Higher desktop platform average selling prices, up 6%300 Higher notebook platform average selling prices, up 2%272 Higher tablet platform average selling prices14 Other
$ (2,653)
44

MANAGEMENT’S DISCUSSION AND ANALYSIS OF FINANCIAL CONDITION AND RESULTS OF OPERATIONS (Continued)
The following results drove the change in CCG operating income in 2015 compared to 2014 by approximately the amountsindicated:
(In Millions) Operating Income Reconciliation (2015 compared to 2014):
$ (2,060) Higher CCG platform unit costs(1,565) Lower CCG platform revenue1
435 Lower factory start-up costs, primarily driven by the ramp of our 14nm process technology430 Lower production costs primarily on our 14nm products, which were treated as a period charges in 2014375 Lower operating expense227 Other
$ (2,158)
1 Lower gross margin from lower CCG platform revenue was driven by lower CCG platform unit sales, partially offset by higherCCG platform average selling prices. CCG platform average selling prices increased due to higher average selling prices ondesktop, notebook, and tablet platforms, partially offset by a market segment mix to phone platform from tablet and desktopplatforms.
The revenue and operating income for the CCG operating segment for 2014 and 2013 were as follows:
Years Ended(In Millions)
Dec 27,2014
Dec 28,2013 Change % Change
Platform . . . . . . . . . . . . . . . . . . . . . . . . . . . . . . . . . . . . . . . . . . . . . . . . . . . . . . . $ 33,210 $ 32,385 $ 825 3%Other . . . . . . . . . . . . . . . . . . . . . . . . . . . . . . . . . . . . . . . . . . . . . . . . . . . . . . . . . 1,662 2,260 (598) (26)%
Net revenue . . . . . . . . . . . . . . . . . . . . . . . . . . . . . . . . . . . . . . . . . . . . . . . . . . . $ 34,872 $ 34,645 $ 227 1%
Operating income . . . . . . . . . . . . . . . . . . . . . . . . . . . . . . . . . . . . . . . . . . . . . . $ 10,323 $ 8,708 $ 1,615 19%
CCG platform unit sales . . . . . . . . . . . . . . . . . . . . . . . . . . . . . . . . . . . . . . . . . . . 20%CCG platform average selling prices . . . . . . . . . . . . . . . . . . . . . . . . . . . . . . . . . (15)%
Our CCG operating segment results benefited from strength in the traditional PC business driven by the Microsoft Windows XPrefresh. Within the CCG operating segment, the following market segment results drove the change in revenue in 2014 comparedto 2013:
(In Millions) Revenue Reconciliation (2014 compared to 2013):
$ 2,101 Higher notebook platform unit sales, up 11%501 Higher desktop platform unit sales, up 3%305 Higher tablet platform unit sales
(1,514) Lower notebook platform average selling prices, down 7%(711) Lower tablet platform average selling prices, primarily driven by higher cash consideration to our customers
associated with integrating our platform(515) Lower phone component unit sales
60 Other$ 227
45

MANAGEMENT’S DISCUSSION AND ANALYSIS OF FINANCIAL CONDITION AND RESULTS OF OPERATIONS (Continued)
The following results drove the change in CCG operating income in 2014 compared to 2013 by approximately the amountsindicated:
(In Millions) Operating Income Reconciliation (2014 compared to 2013):
$ 2,160 Lower CCG platform unit costs915 Lower factory start-up costs, primarily driven by our 14nm process technology80 Lower operating expense
(990) Lower gross margin from CCG platform revenue1
(345) Lower phone component revenue(205) Other
$ 1,615
1 Lower gross margin from CCG platform revenue was driven by lower CCG platform average selling prices, partially offset byhigher CCG platform unit sales. Lower CCG platform average selling prices were due to a shift in market segment mix (highertablet and phone platform unit sales) and lower notebook and tablet platform average selling prices.
Data Center Group
The revenue and operating income for the DCG operating segment for 2015 and 2014 were as follows:
Years Ended(In Millions)
Dec 26,2015
Dec 27,2014 Change % Change
Platform . . . . . . . . . . . . . . . . . . . . . . . . . . . . . . . . . . . . . . . . . . . . . . . . . . . . . . . $ 14,882 $ 13,366 $ 1,516 11%Other . . . . . . . . . . . . . . . . . . . . . . . . . . . . . . . . . . . . . . . . . . . . . . . . . . . . . . . . . 1,095 1,021 74 7%
Net revenue . . . . . . . . . . . . . . . . . . . . . . . . . . . . . . . . . . . . . . . . . . . . . . . . . . . $ 15,977 $ 14,387 $ 1,590 11%
Operating income . . . . . . . . . . . . . . . . . . . . . . . . . . . . . . . . . . . . . . . . . . . . . . $ 7,844 $ 7,390 $ 454 6%
DCG platform unit sales . . . . . . . . . . . . . . . . . . . . . . . . . . . . . . . . . . . . . . . . . . . 8%DCG platform average selling prices . . . . . . . . . . . . . . . . . . . . . . . . . . . . . . . . . 3%
Our DCG platform revenue increased primarily due to growth in the Internet cloud computing market segment. To a lesser extent,growth in the communications infrastructure market segment also contributed to the increase. The following results drove thechange in DCG revenue in 2015 compared to 2014:
(In Millions) Revenue Reconciliation (2015 compared to 2014):
$ 1,023 Higher DCG platform unit sales493 Higher DCG platform average selling prices74 Other
$ 1,590
The following results drove the change in DCG operating income in 2015 compared to 2014 by approximately the amountsindicated:
(In Millions) Operating Income Reconciliation (2015 compared to 2014):
$ 1,415 Higher DCG platform revenue(725) Higher operating expense, primarily driven by higher shared product development costs(236) Other
$ 454
46

MANAGEMENT’S DISCUSSION AND ANALYSIS OF FINANCIAL CONDITION AND RESULTS OF OPERATIONS (Continued)
The revenue and operating income for the DCG operating segment for 2014 and 2013 were as follows:
Years Ended(In Millions)
Dec 27,2014
Dec 28,2013 Change % Change
Platform . . . . . . . . . . . . . . . . . . . . . . . . . . . . . . . . . . . . . . . . . . . . . . . . . . . . . . . $ 13,366 $ 11,219 $ 2,147 19%Other . . . . . . . . . . . . . . . . . . . . . . . . . . . . . . . . . . . . . . . . . . . . . . . . . . . . . . . . . 1,021 944 77 8%
Net revenue . . . . . . . . . . . . . . . . . . . . . . . . . . . . . . . . . . . . . . . . . . . . . . . . . . . $ 14,387 $ 12,163 $ 2,224 18%
Operating income . . . . . . . . . . . . . . . . . . . . . . . . . . . . . . . . . . . . . . . . . . . . . . $ 7,390 $ 5,456 $ 1,934 35%
DCG platform unit sales . . . . . . . . . . . . . . . . . . . . . . . . . . . . . . . . . . . . . . . . . . . 8%DCG platform average selling prices . . . . . . . . . . . . . . . . . . . . . . . . . . . . . . . . . 10%
Our DCG platform revenue continued to benefit from growth in the cloud and technical computing market segments, withcontinued strengthening of the enterprise market segment. The following results drove the change in DCG revenue in 2014compared to 2013:
(In Millions) Revenue Reconciliation (2014 compared to 2013):
$ 1,200 Higher DCG platform average selling prices947 Higher DCG platform unit sales77 Other
$ 2,224
The following results drove the change in DCG operating income in 2014 compared to 2013 by approximately the amountsindicated:
(In Millions) Operating Income Reconciliation (2014 compared to 2013):
$ 2,020 Higher DCG platform revenue220 Lower DCG platform unit costs
(465) Higher operating expense, primarily driven by higher direct and shared product development costs159 Other
$ 1,934
Internet of Things Group
The revenue and operating income for the IOTG operating segment for 2015 and 2014 were as follows:
Years Ended(In Millions)
Dec 26,2015
Dec 27,2014 Change % Change
Platform . . . . . . . . . . . . . . . . . . . . . . . . . . . . . . . . . . . . . . . . . . . . . . . . . . . . . . . $ 1,976 $ 1,814 $ 162 9%Other . . . . . . . . . . . . . . . . . . . . . . . . . . . . . . . . . . . . . . . . . . . . . . . . . . . . . . . . . 322 328 (6) (2)%
Net revenue . . . . . . . . . . . . . . . . . . . . . . . . . . . . . . . . . . . . . . . . . . . . . . . . . . . $ 2,298 $ 2,142 $ 156 7%
Operating income . . . . . . . . . . . . . . . . . . . . . . . . . . . . . . . . . . . . . . . . . . . . . . $ 515 $ 583 $ (68) (12)%
Net revenue for the IOTG operating segment increased in 2015 compared to 2014, primarily due to higher IOTG platform unitsales based on strength in the retail market segment. The increase was partially offset by lower IOTG platform average sellingprices.
Operating income for the IOTG operating segment decreased in 2015 compared to 2014, driven by continued investment inproduct development across our operating segments, including the Internet of Things market segment. This decrease waspartially offset by lower unit costs related to product transition and higher IOTG platform revenue.
47

MANAGEMENT’S DISCUSSION AND ANALYSIS OF FINANCIAL CONDITION AND RESULTS OF OPERATIONS (Continued)
The revenue and operating income for the IOTG operating segment for 2014 and 2013 were as follows:
Years Ended(In Millions)
Dec 27,2014
Dec 28,2013 Change % Change
Platform . . . . . . . . . . . . . . . . . . . . . . . . . . . . . . . . . . . . . . . . . . . . . . . . . . . . . . . $ 1,814 $ 1,485 $ 329 22%Other . . . . . . . . . . . . . . . . . . . . . . . . . . . . . . . . . . . . . . . . . . . . . . . . . . . . . . . . . 328 316 12 4%
Net revenue . . . . . . . . . . . . . . . . . . . . . . . . . . . . . . . . . . . . . . . . . . . . . . . . . . . $ 2,142 $ 1,801 $ 341 19%
Operating income . . . . . . . . . . . . . . . . . . . . . . . . . . . . . . . . . . . . . . . . . . . . . . $ 583 $ 532 $ 51 10%
Net revenue for the IOTG operating segment increased by $341 million, or 19%, in 2014 compared to 2013. The increase wasprimarily due to higher IOTG platform unit sales based on strength in the retail and industrial market segments.
Operating income for the IOTG operating segment increased by $51 million, or 10%, in 2014 compared to 2013. The increasewas primarily due to higher IOTG platform revenue, partially offset by higher IOTG platform operating expenses.
Software and Services Operating Segments
The revenue and operating income for the SSG operating segments, including the Intel Security Group and the Software andServices Group, for 2015 and 2014 were as follows:
Years Ended(In Millions)
Dec 26,2015
Dec 27,2014 Change % Change
Net revenue . . . . . . . . . . . . . . . . . . . . . . . . . . . . . . . . . . . . . . . . . . . . . . . . . . . $ 2,167 $ 2,216 $ (49) (2)%
Operating income . . . . . . . . . . . . . . . . . . . . . . . . . . . . . . . . . . . . . . . . . . . . . . $ 210 $ 81 $ 129 159%
Operating income for the SSG operating segments increased in 2015 compared to 2014, driven by $132 million of loweroperating expense.
The revenue and operating income for the SSG operating segments for 2014 and 2013 were as follows:
Years Ended(In Millions)
Dec 27,2014
Dec 28,2013 Change % Change
Net revenue . . . . . . . . . . . . . . . . . . . . . . . . . . . . . . . . . . . . . . . . . . . . . . . . . . . $ 2,216 $ 2,188 $ 28 1%
Operating income . . . . . . . . . . . . . . . . . . . . . . . . . . . . . . . . . . . . . . . . . . . . . . $ 81 $ 57 $ 24 42%
Operating Expenses
Operating expenses for each period were as follows:
Years Ended(In Millions)
Dec 26,2015
Dec 27,2014
Dec 28,2013
Research and development (R&D) . . . . . . . . . . . . . . . . . . . . . . . . . . . . . . . . . . . . . . . . . . . . $ 12,128 $ 11,537 $ 10,611Marketing, general and administrative (MG&A) . . . . . . . . . . . . . . . . . . . . . . . . . . . . . . . . . . . $ 7,930 $ 8,136 $ 8,088R&D and MG&A as percentage of net revenue . . . . . . . . . . . . . . . . . . . . . . . . . . . . . . . . . . . 36% 35% 35%Restructuring and asset impairment charges . . . . . . . . . . . . . . . . . . . . . . . . . . . . . . . . . . . . $ 354 $ 295 $ 240Amortization of acquisition-related intangibles . . . . . . . . . . . . . . . . . . . . . . . . . . . . . . . . . . . . $ 265 $ 294 $ 291
Research and Development
R&D spending increased by $591 million, or 5%, in 2015 compared to 2014. The increase was due to higher investment in ourproducts—primarily server, Internet of Things, and new devices—as well as expenses of newly acquired entities and higherprocess development costs for our 10nm process technology. This increase was partially offset by lower profit-dependentcompensation and savings from the implementation of efficiencies within our CCG operating segment.
48

MANAGEMENT’S DISCUSSION AND ANALYSIS OF FINANCIAL CONDITION AND RESULTS OF OPERATIONS (Continued)
R&D spending increased by $926 million, or 9%, in 2014 compared to 2013. The increase was due to higher processdevelopment costs for our 10nm process technology, higher compensation expenses for both profit-dependent compensation andannual salary increases, as well as higher investments in our products, primarily server and new devices. This increase waspartially offset by lower product investments in our phone, tablet, and Intel Media businesses.
Marketing, General and Administrative
MG&A expenses decreased by $206 million, or 3%, in 2015 compared to 2014. This decrease was due to lower profit-dependentcompensation as well as lower expenses from businesses that have been divested. MG&A expenses increased by $48 million in2014 compared to 2013.
Restructuring and Asset Impairment Charges
Restructuring and asset impairment charges by program for each period were as follows:
Years Ended(In Millions)
Dec 26,2015
Dec 27,2014
Dec 28,2013
2015 restructuring program . . . . . . . . . . . . . . . . . . . . . . . . . . . . . . . . . . . . . . . . . . . . . . . . . . $ 264 $ — $ —2013 restructuring program . . . . . . . . . . . . . . . . . . . . . . . . . . . . . . . . . . . . . . . . . . . . . . . . . . 90 295 240
Total restructuring and asset impairment charges . . . . . . . . . . . . . . . . . . . . . . . . . . . . . $ 354 $ 295 $ 240
2015 Restructuring Program. Beginning in Q2 2015, management approved and commenced implementation of restructuringactions, primarily targeted workforce reductions, as we adjusted resources from areas of disinvestment to areas of investment.This program was substantially complete by the end of 2015.
Restructuring and asset impairment charges for the 2015 restructuring program in 2015 were as follows:
Years Ended(In Millions)
Dec 26,2015
Employee severance and benefit arrangements . . . . . . . . . . . . . . . . . . . . . . . . . . . . . . . . . . . . . . . . . . . . . . . . . . . . . . $ 250Asset impairments and other restructuring charges . . . . . . . . . . . . . . . . . . . . . . . . . . . . . . . . . . . . . . . . . . . . . . . . . . . 14
Total restructuring and asset impairment charges . . . . . . . . . . . . . . . . . . . . . . . . . . . . . . . . . . . . . . . . . . . . . . . . . $ 264
Restructuring and asset impairment activities for the 2015 restructuring program in 2015 were as follows:
(In Millions)
EmployeeSeverance and
Benefits
AssetImpairments
and Other Total
Accrued restructuring balance as of December 27, 2014 . . . . . . . . . . . . . . . . . . . . . $ — $ — $ —
Additional accruals . . . . . . . . . . . . . . . . . . . . . . . . . . . . . . . . . . . . . . . . . . . . . . . . . . . . . . 292 14 306Adjustments . . . . . . . . . . . . . . . . . . . . . . . . . . . . . . . . . . . . . . . . . . . . . . . . . . . . . . . . . . . (42) — (42)Cash payments . . . . . . . . . . . . . . . . . . . . . . . . . . . . . . . . . . . . . . . . . . . . . . . . . . . . . . . . (225) (1) (226)Non-cash settlements . . . . . . . . . . . . . . . . . . . . . . . . . . . . . . . . . . . . . . . . . . . . . . . . . . . — (6) (6)
Accrued restructuring balance as of December 26, 2015 . . . . . . . . . . . . . . . . . . . . . $ 25 $ 7 $ 32
We recorded the additional accruals as restructuring and asset impairment charges in the consolidated statements of income andwithin the “all other” operating segments category. A substantial majority of the accrued restructuring balance as of December 26,2015 is expected to be paid within the next 12 months, and was recorded as a current liability within accrued compensation andbenefits on the consolidated balance sheets.
Restructuring actions related to this program that were approved in 2015 impacted approximately 4,000 employees. We estimatethat employee severance and benefit charges to date will result in gross annual savings of approximately $400 million, which willbe realized within R&D, cost of sales, and MG&A. We began to realize these savings in Q2 2015 and expect to fully realize thesesavings after the actions are complete.
49

MANAGEMENT’S DISCUSSION AND ANALYSIS OF FINANCIAL CONDITION AND RESULTS OF OPERATIONS (Continued)
2013 Restructuring Program. Beginning in Q3 2013, management approved and commenced implementation of severalrestructuring actions, including targeted workforce reductions and the exit of certain businesses and facilities. These actionsinclude the wind down of our 200mm wafer fabrication facility in Massachusetts, which ceased production in Q1 2015, and theclosure of our assembly and test facility in Costa Rica, which ceased production in Q4 2014. These targeted reductions willenable us to better align our resources in areas providing the greatest benefit in the current business environment. This programwas substantially complete by the end of 2015.
Restructuring and asset impairment charges for the 2013 restructuring program for each period were as follows:
Years Ended(In Millions)
Dec 26,2015
Dec 27,2014
Dec 28,2013
Employee severance and benefit arrangements . . . . . . . . . . . . . . . . . . . . . . . . . . . . . . . . . . $ 82 $ 265 $ 201Asset impairments and other restructuring charges . . . . . . . . . . . . . . . . . . . . . . . . . . . . . . . 8 30 39
Total restructuring and asset impairment charges . . . . . . . . . . . . . . . . . . . . . . . . . . . . . $ 90 $ 295 $ 240
Restructuring and asset impairment activities for the 2013 restructuring program for each period were as follows:
(In Millions)
EmployeeSeverance and
Benefits
AssetImpairments
and Other Total
Accrued restructuring balance as of December 28, 2013 . . . . . . . . . . . . . . . . . . . $ 183 $ — $ 183
Additional accruals . . . . . . . . . . . . . . . . . . . . . . . . . . . . . . . . . . . . . . . . . . . . . . . . . . . . 252 31 283Adjustments . . . . . . . . . . . . . . . . . . . . . . . . . . . . . . . . . . . . . . . . . . . . . . . . . . . . . . . . . 13 (1) 12Cash payments . . . . . . . . . . . . . . . . . . . . . . . . . . . . . . . . . . . . . . . . . . . . . . . . . . . . . . (327) (6) (333)Non-cash settlements . . . . . . . . . . . . . . . . . . . . . . . . . . . . . . . . . . . . . . . . . . . . . . . . . . — (13) (13)
Accrued restructuring balance as of December 27, 2014 . . . . . . . . . . . . . . . . . . . 121 11 132
Additional accruals . . . . . . . . . . . . . . . . . . . . . . . . . . . . . . . . . . . . . . . . . . . . . . . . . . . . 101 9 110Adjustments . . . . . . . . . . . . . . . . . . . . . . . . . . . . . . . . . . . . . . . . . . . . . . . . . . . . . . . . . (19) (1) (20)Cash payments . . . . . . . . . . . . . . . . . . . . . . . . . . . . . . . . . . . . . . . . . . . . . . . . . . . . . . (171) (10) (181)Non-cash settlements . . . . . . . . . . . . . . . . . . . . . . . . . . . . . . . . . . . . . . . . . . . . . . . . . . — (3) (3)
Accrued restructuring balance as of December 26, 2015 . . . . . . . . . . . . . . . . . . . $ 32 $ 6 $ 38
We recorded the additional accruals and adjustments as restructuring and asset impairment charges in the consolidatedstatements of income and within the “all other” operating segments category. Substantially all of the accrued restructuring balanceas of December 26, 2015 is expected to be paid within the next 12 months, and was recorded as a current liability within accruedcompensation and benefits on the consolidated balance sheets.
Restructuring actions related to this program that were approved in 2015 impacted approximately 940 employees. Since Q32013, we have incurred a total of $625 million in restructuring and asset impairment charges. These charges include $548 millionrelated to employee severance and benefit arrangements for approximately 8,500 employees, and $77 million in assetimpairment charges and other restructuring charges.
We estimate that employee severance and benefit charges to date will result in gross annual savings of approximately $600million, which will be realized within R&D, MG&A, and cost of sales. We began to realize these savings in Q4 2013 and expect tofully realize these savings after the actions are complete.
50

MANAGEMENT’S DISCUSSION AND ANALYSIS OF FINANCIAL CONDITION AND RESULTS OF OPERATIONS (Continued)
Share-Based Compensation
Share-based compensation totaled $1.3 billion in 2015 ($1.1 billion in 2014 and $1.1 billion in 2013). Share-based compensationwas included in cost of sales and operating expenses.
As of December 26, 2015, unrecognized share-based compensation costs and the weighted average periods over which thecosts are expected to be recognized were as follows:
(Dollars in Millions)
UnrecognizedShare-Based
CompensationCosts
WeightedAveragePeriod
Restricted stock units . . . . . . . . . . . . . . . . . . . . . . . . . . . . . . . . . . . . . . . . . . . . . . . . . . . . . . . . . . . . . . . $ 1,789 1.2 yearsStock options . . . . . . . . . . . . . . . . . . . . . . . . . . . . . . . . . . . . . . . . . . . . . . . . . . . . . . . . . . . . . . . . . . . . . $ 13 8 monthsStock Purchase Plan . . . . . . . . . . . . . . . . . . . . . . . . . . . . . . . . . . . . . . . . . . . . . . . . . . . . . . . . . . . . . . . $ 14 2 months
Gains (Losses) on Equity Investments and Interest and Other, Net
Gains (losses) on equity investments, net and interest and other, net for each period were as follows:
Years Ended(In Millions)
Dec 26,2015
Dec 27,2014
Dec 28,2013
Gains (losses) on equity investments, net . . . . . . . . . . . . . . . . . . . . . . . . . . . . . . . . . . . . . . . $ 315 $ 411 $ 471Interest and other, net . . . . . . . . . . . . . . . . . . . . . . . . . . . . . . . . . . . . . . . . . . . . . . . . . . . . . . $ (105) $ 43 $ (151)
We recognized lower net gains on equity investments in 2015 compared to 2014 due to lower gains on sales of equityinvestments, partially offset by higher gains on third-party merger transactions.
We recognized lower net gains on equity investments in 2014 compared to 2013 due to lower gains on sales of equityinvestments, partially offset by higher gains on third-party merger transactions. The majority of gains on sales, net for 2014resulted from gains on private equity sales. Net gains on equity investments for 2013 included gains of $439 million on the salesof our interest in Clearwire Communications, LLC and our shares in Clearwire Corporation in Q3 2013. For further information onthese transactions, see “Note 5: Cash and Investments” in Part II, Item 8 of this Form 10-K.
We recognized an interest and other net loss in 2015 compared to a net gain in 2014 primarily due to higher interest expense,which includes the 2015 issuances of our $9.5 billion aggregate principal amount of senior unsecured notes. For furtherinformation on these transactions, see “Note 15: Borrowings” in Part II, Item 8 of this Form 10-K.
We recognized an interest and other net gain in 2014 compared to a net loss in 2013 due to a gain recognized on the divestitureof our Intel Media assets in 2014.
Provision for Taxes
Our provision for taxes and effective tax rate for each period were as follows:
Years Ended(In Millions)
Dec 26,2015
Dec 27,2014
Dec 28,2013
Income before taxes . . . . . . . . . . . . . . . . . . . . . . . . . . . . . . . . . . . . . . . . . . . . . . . . . . . . . . . $ 14,212 $ 15,801 $ 12,611Provision for taxes . . . . . . . . . . . . . . . . . . . . . . . . . . . . . . . . . . . . . . . . . . . . . . . . . . . . . . . . . $ 2,792 $ 4,097 $ 2,991Effective tax rate . . . . . . . . . . . . . . . . . . . . . . . . . . . . . . . . . . . . . . . . . . . . . . . . . . . . . . . . . . 19.6% 25.9% 23.7%
Most of the decrease in our effective tax rate in 2015 compared to 2014 was driven by one-time items, a higher proportion of ourincome from lower tax jurisdictions, and our decision to indefinitely reinvest certain prior years’ non-U.S. earnings positivelyimpacted our effective income tax rate.
A substantial majority of the increase in our effective tax rate between 2014 and 2013 was driven by the reenacted U.S. R&D taxcredit in 2013 containing two years’ worth of R&D tax credits. The U.S. R&D tax credit was reenacted in Q4 2014 retroactive forthe full year. It was also reenacted in Q1 2013 retroactive to the beginning of 2012.
51

MANAGEMENT’S DISCUSSION AND ANALYSIS OF FINANCIAL CONDITION AND RESULTS OF OPERATIONS (Continued)
Liquidity and Capital Resources
(Dollars in Millions)Dec 26,
2015Dec 27,
2014
Cash and cash equivalents, short-term investments, and trading assets . . . . . . . . . . . . . . . . . . . . . . . . . $ 25,313 $ 14,054Other long-term investments . . . . . . . . . . . . . . . . . . . . . . . . . . . . . . . . . . . . . . . . . . . . . . . . . . . . . . . . . . . $ 1,891 $ 2,023Loans receivable and other . . . . . . . . . . . . . . . . . . . . . . . . . . . . . . . . . . . . . . . . . . . . . . . . . . . . . . . . . . . . $ 1,170 $ 1,335Reverse repurchase agreements with original maturities greater than approximately three months . . . . $ 1,000 $ 450Unsettled trade liabilities and other . . . . . . . . . . . . . . . . . . . . . . . . . . . . . . . . . . . . . . . . . . . . . . . . . . . . . . $ 99 $ 77Short-term and long-term debt . . . . . . . . . . . . . . . . . . . . . . . . . . . . . . . . . . . . . . . . . . . . . . . . . . . . . . . . . . $ 22,670 $ 13,655Temporary equity . . . . . . . . . . . . . . . . . . . . . . . . . . . . . . . . . . . . . . . . . . . . . . . . . . . . . . . . . . . . . . . . . . . . $ 897 $ 912Debt as percentage of permanent stockholders’ equity . . . . . . . . . . . . . . . . . . . . . . . . . . . . . . . . . . . . . . . 37.1% 24.4%
52

MANAGEMENT’S DISCUSSION AND ANALYSIS OF FINANCIAL CONDITION AND RESULTS OF OPERATIONS (Continued)
Sources and Uses of Cash(In Millions)
20142015
Sourcesof Cash
Uses ofCash
2013
Operating activities
$20,776
Sales of shares throughemployee equity incentive plans
$1,588
Other sources
$631
Capital expenditures
$10,711
Repurchase of common stock
$2,440
Dividends
$4,479
Trading assets, net
$3,041
Available-for-sale investments, net
$3,223
Other uses
$540
Acquisitions
$925Investments in non-marketableequity investments
$440
Sourcesof Cash
Uses ofCash
Operating activities
$20,418
Sales of shares throughemployee equity incentive plans
$1,660
Dividends
$4,409
Trading assets, net
$1,232Acquisitions
$934
Repurchase of common stock
$11,124
Capital expenditures
$10,105
Investments in non-marketableequity investments
$1,377
Other uses
$339
Available-for-sale investments, net
$3,164
Other sources
$1,165
Sourcesof Cash
Uses ofCash
Operating activities
$19,017
Sales of shares throughemployee equity incentive plans
$866
Dividends
$4,556
Acquisitions
$913
Repurchase of common stock
$3,443
Capital expenditures
$7,326
Investments in non-marketableequity investments
$2,011
Other uses
$1,249
Trading assets, net
$1,887
Issuance of long-term debt,net of issuance costs
$9,476
Other sources
$1,000
$1Available-for-sale investments, net
In summary, our cash flows for each period were as follows:
Years Ended(In Millions)
Dec 26,2015
Dec 27,2014
Dec 28,2013
Net cash provided by operating activities . . . . . . . . . . . . . . . . . . . . . . . . . . . . . . . . . . . . . . . $ 19,017 $ 20,418 $ 20,776Net cash used for investing activities . . . . . . . . . . . . . . . . . . . . . . . . . . . . . . . . . . . . . . . . . . . (8,183) (9,905) (18,073)Net cash provided by (used for) financing activities . . . . . . . . . . . . . . . . . . . . . . . . . . . . . . . . 1,912 (13,611) (5,498)Effect of exchange rate fluctuations on cash and cash equivalents . . . . . . . . . . . . . . . . . . . 1 (15) (9)
Net increase (decrease) in cash and cash equivalents . . . . . . . . . . . . . . . . . . . . . . . . . . $ 12,747 $ (3,113) $ (2,804)
53

MANAGEMENT’S DISCUSSION AND ANALYSIS OF FINANCIAL CONDITION AND RESULTS OF OPERATIONS (Continued)
Operating Activities
Cash provided by operating activities is net income adjusted for certain non-cash items and changes in assets and liabilities.
For 2015 compared to 2014, the $1.4 billion decrease in cash provided by operating activities was due to changes in workingcapital, adjustments for non-cash items, and lower net income. The adjustments for non-cash items were lower due primarily todeferred taxes, partially offset by higher depreciation. Income taxes paid, net of refunds, in 2015 compared to 2014 were $1.2billion lower due to lower income before taxes in 2015.
Changes in assets and liabilities as of December 26, 2015 compared to December 27, 2014 included a decrease in accruedcompensation and benefits. This decrease was due to higher profit-dependent compensation in 2014 that was paid out in 2015,and an increase in inventories due primarily to the ramp of our 6th generation Intel Core processor family of products, partiallyoffset by the timing of certain tax benefits that reduced our income taxes payable position in 2015.
Hewlett-Packard Company, our largest customer in 2014, separated into HP Inc. and Hewlett Packard Enterprise Company onNovember 1, 2015. In 2015, these entities collectively accounted for 18% of our net revenue (18% in 2014 and 17% in 2013), DellInc. accounted for 15% of our net revenue (16% in 2014 and 15% in 2013), and Lenovo Group Limited accounted for 13% of ournet revenue (12% in 2014 and 12% in 2013). Combined, these customers accounted for 46% of our net revenue (46% in 2014and 44% in 2013) and 49% of our accounts receivable as of December 26, 2015 (43% as of December 27, 2014).
For 2014 compared to 2013, the $358 million decrease in cash provided by operating activities was due to changes in workingcapital, partially offset by higher net income and adjustment for non-cash items.
Investing Activities
Investing cash flows consist primarily of capital expenditures; investment purchases, sales, maturities, and disposals; andproceeds from divestitures and cash used for acquisitions. Our capital expenditures were $7.3 billion in 2015 ($10.1 billion in2014 and $10.7 billion in 2013).
The decrease in cash used for investing activities in 2015 compared to 2014 was primarily due to net trading assets activity(which was a source of cash in 2015 compared to a use of cash in 2014) and lower capital expenditures. This activity waspartially offset by net available-for-sale activity (which was cash flow neutral in 2015 compared to a source of cash in 2014) andhigher investments in non-marketable equity investments.
The decrease in cash used for investing activities in 2014 compared to 2013 was primarily due to net available-for-sale activity(which was a source of cash in 2014 compared to a use of cash in 2013) and a decrease in cash used for net trading assetsactivity. This activity was partially offset by an increase in investments in non-marketable equity investments.
Financing Activities
Financing cash flows consist primarily of repurchases of common stock, payment of dividends to stockholders, issuance andrepayment of short-term and long-term debt, and proceeds from the sale of shares of common stock through employee equityincentive plans.
54

MANAGEMENT’S DISCUSSION AND ANALYSIS OF FINANCIAL CONDITION AND RESULTS OF OPERATIONS (Continued)
Cash was provided by financing activities in 2015 compared to cash used by financing activities in 2014, primarily due to theissuance of $9.5 billion of long-term debt and fewer repurchases of common stock under our authorized stock repurchaseprogram, partially offset by lower proceeds from the sales of common stock through employee equity incentive plans andrepayments of short-term debt compared to borrowings in 2014. We have an ongoing authorization, originally approved by ourBoard of Directors in 2005, and subsequently amended, to repurchase up to $65.0 billion in shares of our common stock in theopen market or negotiated transactions. During 2015, we repurchased $3.0 billion of common stock under our authorizedcommon stock repurchase program, compared to $10.8 billion in 2014. As of December 26, 2015, $9.4 billion remained availablefor repurchasing common stock under the existing repurchase authorization limit. We base our level of common stockrepurchases on internal cash management decisions, and this level may fluctuate. Proceeds from the sale of common stockthrough employee equity incentive plans totaled $866 million in 2015 compared to $1.7 billion in 2014. Our total dividendpayments were $4.6 billion in 2015 compared to $4.4 billion in 2014. We have paid a cash dividend in each of the past 93quarters. In January 2016, our Board of Directors declared a cash dividend of $0.26 per share of common stock for Q1 2016. Thedividend is payable on March 1, 2016 to stockholders of record on February 7, 2016.
The increase in cash used for financing activities in 2014 compared to 2013 was primarily due to an increase in repurchases ofcommon stock under our authorized stock repurchase program, partially offset by the issuance of short-term debt in 2014.
Liquidity
Cash generated by operations is our primary source of liquidity. We maintain a diverse investment portfolio that we continuallyanalyze based on issuer, industry, and country. As of December 26, 2015, cash and cash equivalents, short-term investments,and trading assets totaled $25.3 billion ($14.1 billion as of December 27, 2014). The increased balance compared toDecember 27, 2014 was primarily related to the accumulation of cash consideration required for our acquisition of Altera, whichclosed on December 28, 2015, subsequent to our fiscal 2015 year-end. In addition to the $25.3 billion, we have $1.9 billion ofother long-term investments, $1.2 billion of loans receivable and other, and $1.0 billion of reverse repurchase agreements withoriginal maturities greater than approximately three months that we include when assessing our sources of liquidity. Substantiallyall of our investments in debt instruments are in A/A2 or better rated issuances, and a substantial majority of the issuances arerated AA-/Aa3 or better.
Other potential sources of liquidity include our commercial paper program and our automatic shelf registration statement on filewith the SEC, pursuant to which we may offer an unspecified amount of debt, equity, and other securities. Under our commercialpaper program, we have an ongoing authorization from our Board of Directors to borrow up to $5.0 billion, which increased in2015 from $3.0 billion. Maximum borrowings under our commercial paper program were $900 million during 2015, and nocommercial paper remained outstanding as of December 26, 2015. Our commercial paper was rated A-1+ by Standard & Poor’sand P-1 by Moody’s as of December 26, 2015. On December 21, 2015, we entered into a short-term credit facility to borrow up to$5.0 billion to facilitate the settlement of our acquisition of Altera. No borrowings were outstanding under this credit facility as ofDecember 26, 2015 and it was closed in January 2016. In 2015, we issued $9.5 billion aggregate principal amount of seniorunsecured notes. These notes were issued primarily to fund a portion of the cash consideration for our pending acquisition ofAltera and for general corporate purposes, which may include the refinancing of existing indebtedness. For further information onthe terms of the notes, see “Note 15: Borrowings” in Part II, Item 8 of this Form 10-K.
55

MANAGEMENT’S DISCUSSION AND ANALYSIS OF FINANCIAL CONDITION AND RESULTS OF OPERATIONS (Continued)
As of December 26, 2015, $11.1 billion of our $25.3 billion of cash and cash equivalents, short-term investments, and tradingassets was held by our non-U.S. subsidiaries. Of the $11.1 billion held by our non-U.S. subsidiaries, approximately $2.6 billionwas available for use in the U.S. without incurring additional U.S. income taxes in excess of the amounts already accrued in ourfinancial statements as of December 26, 2015. The remaining amount of non-U.S. cash and cash equivalents, short-terminvestments, and trading assets has been indefinitely reinvested and, therefore, no U.S. current or deferred taxes have beenaccrued. This amount is earmarked for near-term investment in our operations outside the U.S. and future acquisitions of non-U.S. entities. We believe our U.S. sources of cash and liquidity are sufficient to meet our business needs in the U.S., and do notexpect that we will need to repatriate the funds we have designated as indefinitely reinvested outside the U.S. Under current taxlaws, should our plans change and we were to choose to repatriate some or all of the funds we have designated as indefinitelyreinvested outside the U.S., such amounts would be subject to U.S. income taxes and applicable non-U.S. income andwithholding taxes.
During 2015, we entered into a definitive agreement to acquire Altera in an all-cash transaction. The transaction closed onDecember 28, 2015, subsequent to our fiscal 2015 year-end. As of the date we entered into the agreement, the transaction hadan approximate value of $16.7 billion. We financed a portion of the acquisition by issuing $9.5 billion in long-term debt during2015 and borrowing $4.0 billion against our short-term credit facility in the first quarter of 2016. We funded the remainder of theacquisition with issuances of commercial paper and existing cash and investments. For information on our indebtedness, see“Note 15: Borrowings” in Part II, Item 8 of this Form 10-K.
We believe that we have sufficient financial resources to meet our business requirements in the next 12 months, including capitalexpenditures for worldwide manufacturing and assembly and test; working capital requirements; and potential dividends, commonstock repurchases, acquisitions, and strategic investments.
Fair Value of Financial Instruments
When determining fair value, we consider the principal or most advantageous market in which we would transact, and weconsider assumptions, such as an obligor’s credit risk, that market participants would use when pricing the asset or liability. Forfurther information, see “Fair Value” in “Note 2: Accounting Policies” and “Note 4: Fair Value” in Part II, Item 8 of this Form 10-K.
Marketable Debt Instruments
As of December 26, 2015, our assets measured and recorded at fair value on a recurring basis included $23.4 billion ofmarketable debt instruments. Of these instruments, $13.2 billion was classified as Level 1, $10.0 billion as Level 2, and $118million as Level 3.
Our marketable debt instruments that are measured and recorded at fair value on a recurring basis and classified as Level 1 wereclassified as such due to the use of observable market prices for identical instruments that are traded in active markets. Weevaluate instrument-specific market data when determining whether the market for a debt instrument is active.
Of the $10.0 billion of marketable debt instruments measured and recorded at fair value on a recurring basis and classified asLevel 2, approximately 50% was classified as Level 2 due to the use of a discounted cash flow model performed by us, andapproximately 50% was classified as such due to the use of non-binding market consensus prices that were corroborated withobservable market data.
Our marketable debt instruments that are measured and recorded at fair value on a recurring basis and classified as Level 3 areclassified as such because the fair values are generally derived from discounted cash flow models, performed either by us or ourpricing providers, using inputs that we are unable to corroborate with observable market data. We monitor and review the inputsand results of these valuation models to help ensure the fair value measurements are reasonable and consistent with marketexperience in similar asset classes.
56

MANAGEMENT’S DISCUSSION AND ANALYSIS OF FINANCIAL CONDITION AND RESULTS OF OPERATIONS (Continued)
Loans Receivable and Reverse Repurchase Agreements
As of December 26, 2015, our assets measured and recorded at fair value on a recurring basis included $479 million of loansreceivable and $2.4 billion of reverse repurchase agreements. All of these investments were classified as Level 2, as the fairvalue is determined using a discounted cash flow model with all significant inputs derived from or corroborated with observablemarket data.
Marketable Equity Securities
As of December 26, 2015, our assets measured and recorded at fair value on a recurring basis included $6.0 billion of marketableequity securities. Substantially all of these securities were classified as Level 1 because the valuations were based on quotedprices for identical securities in active markets. Our assessment of an active market for our marketable equity securities generallytakes into consideration the number of days that each individual equity security trades over a specified period.
Contractual Obligations
Significant contractual obligations as of December 26, 2015 were as follows:
Payments Due by Period
(In Millions) TotalLess Than
1 Year 1–3 Years 3–5 Years
MoreThan 5Years
Operating lease obligations . . . . . . . . . . . . . . . . . . . . . . . . . . . . . . $ 1,200 $ 234 $ 376 $ 264 $ 326Capital purchase obligations1 . . . . . . . . . . . . . . . . . . . . . . . . . . . . 5,746 4,250 1,496 — —Other purchase obligations and commitments2 . . . . . . . . . . . . . . . 3,966 1,784 1,986 196 —Long-term debt obligations3 . . . . . . . . . . . . . . . . . . . . . . . . . . . . . . 38,120 2,299 4,499 3,383 27,939Other long-term liabilities4, 5 . . . . . . . . . . . . . . . . . . . . . . . . . . . . . . 1,263 788 214 105 156
Total6 . . . . . . . . . . . . . . . . . . . . . . . . . . . . . . . . . . . . . . . . . . . . . . . $ 50,295 $ 9,355 $ 8,571 $ 3,948 $ 28,421
1 Capital purchase obligations represent commitments for the construction or purchase of property, plant and equipment. Theywere not recorded as liabilities on our consolidated balance sheets as of December 26, 2015, as we had not yet received therelated goods or taken title to the property.
2 Other purchase obligations and commitments include payments due under various types of licenses and agreements topurchase goods or services, as well as payments due under non-contingent funding obligations. Funding obligations includeagreements to fund various projects with other companies.
3 Amounts represent principal and interest cash payments over the life of the debt obligations, including anticipated interestpayments that are not recorded on our consolidated balance sheets. Debt obligations are classified based on their statedmaturity date, regardless of their classification on the consolidated balance sheets. Any future settlement of convertible debtwould impact our cash payments.
4 We are unable to reliably estimate the timing of future payments related to uncertain tax positions; therefore, $114 million oflong-term income taxes payable has been excluded from the preceding table. However, long-term income taxes payable,recorded on our consolidated balance sheets, included these uncertain tax positions, reduced by the associated federaldeduction for state taxes and U.S. tax credits arising from non-U.S. income taxes.
5 Amounts represent future cash payments to satisfy other long-term liabilities recorded on our consolidated balance sheets,including the short-term portion of these long-term liabilities. Expected required contributions to our U.S. and non-U.S. pensionplans and other postretirement benefit plans of $68 million to be made during 2016 are also included; however, fundingprojections beyond 2016 are not practicable to estimate.
6 Total excludes contractual obligations already recorded on our consolidated balance sheets as current liabilities, except for theshort-term portions of long-term debt obligations and other long-term liabilities.
57

MANAGEMENT’S DISCUSSION AND ANALYSIS OF FINANCIAL CONDITION AND RESULTS OF OPERATIONS (Continued)
The expected timing of payments of the obligations in the preceding table is estimated based on current information. Timing ofpayments and actual amounts paid may be different, depending on the time of receipt of goods or services, or changes to agreed-upon amounts for some obligations.
Contractual obligations for purchases of goods or services included in “Other purchase obligations and commitments” in thepreceding table include agreements that are enforceable and legally binding on Intel and that specify all significant terms,including fixed or minimum quantities to be purchased; fixed, minimum, or variable price provisions; and the approximate timing ofthe transaction. For obligations with cancellation provisions, the amounts included in the preceding table were limited to the non-cancelable portion of the agreement terms or the minimum cancellation fee.
We have entered into certain agreements for the purchase of raw materials that specify minimum prices and quantities based ona percentage of the total available market or based on a percentage of our future purchasing requirements. Due to the uncertaintyof the future market and our future purchasing requirements, as well as the non-binding nature of these agreements, obligationsunder these agreements have been excluded from the preceding table. Our purchase orders for other products are based on ourcurrent manufacturing needs and are fulfilled by our vendors within short time horizons. In addition, some of our purchase ordersrepresent authorizations to purchase rather than binding agreements.
58

MANAGEMENT’S DISCUSSION AND ANALYSIS OF FINANCIAL CONDITION AND RESULTS OF OPERATIONS (Continued)
Contractual obligations that are contingent upon the achievement of certain milestones have been excluded from the precedingtable. These obligations include milestone-based co-marketing agreements, contingent funding or payment obligations, andmilestone-based equity investment funding. These arrangements are not considered contractual obligations until the milestone ismet by the counterparty. As of December 26, 2015, assuming that all future milestones are met, excluding the ASML milestonesmentioned below, the additional required payments would be approximately $827 million. During 2012, we entered into a series ofagreements with ASML intended to accelerate the development of EUV lithography, certain of which were amended in 2014.Under the amended agreements, Intel agreed to provide R&D funding totaling €829 million over five years and committed toadvance purchase orders for a specified number of tools from ASML. Our remaining obligation, contingent upon ASML achievingcertain milestones, is approximately €367 million, or $403 million, as of December 26, 2015. As our obligation is contingent uponASML achieving certain milestones, we have excluded this obligation from the preceding table.
For the majority of RSUs granted, the number of shares of common stock issued on the date the RSUs vest is net of the minimumstatutory withholding requirements that we pay in cash to the appropriate taxing authorities on behalf of our employees. Theobligation to pay the relevant taxing authority is excluded from the preceding table, as the amount is contingent upon continuedemployment. In addition, the amount of the obligation is unknown, as it is based in part on the market price of our common stockwhen the awards vest.
During 2014, we entered into a series of agreements with Tsinghua Unigroup Ltd. (Tsinghua Unigroup), an operating subsidiaryof Tsinghua Holdings Co. Ltd., to, among other things, jointly develop Intel architecture- and communications-based solutions forphones. Subject to regulatory approvals and other closing conditions, we have also agreed to invest up to 9.0 billion Chineseyuan (approximately $1.5 billion as of the date of the agreement) for a minority stake of approximately 20% of UniSpreadtrum.During 2015, we invested $966 million to complete the first phase of the equity investment. The second phase of the investmentwill require additional funding of approximately $500 million; however, as our obligation is contingent upon regulatory approvalsand other closing conditions, it has been excluded from the preceding table.
Off-Balance-Sheet Arrangements
As of December 26, 2015, we did not have any significant off-balance-sheet arrangements, as defined in Item 303(a)(4)(ii) of SECRegulation S-K.
59

ITEM 7A. QUANTITATIVE AND QUALITATIVE DISCLOSURES ABOUT MARKET RISK
We are affected by changes in currency exchange rates, interest rates, and equity prices. All of the following potential changesare based on sensitivity analyses performed on our financial positions as of December 26, 2015, and December 27, 2014. Actualresults may differ materially.
Currency Exchange Rates
In general, we economically hedge currency risks of non-U.S.-dollar-denominated investments in debt instruments and loansreceivable with currency forward contracts or currency interest rate swaps. Gains and losses on these non-U.S.-currencyinvestments are generally offset by corresponding gains and losses on the related hedging instruments.
Substantially all of our revenue is transacted in U.S. dollars. However, a significant portion of our operating expenditures andcapital purchases are incurred in or exposed to other currencies, primarily the euro, the Chinese yuan, the Japanese yen, and theIsraeli shekel. We have established balance sheet and forecasted transaction currency risk management programs to protectagainst fluctuations in the fair value and the volatility of the functional currency equivalent of future cash flows caused by changesin exchange rates. We generally utilize currency forward contracts in these hedging programs. These programs reduce, but donot eliminate, the impact of currency exchange movements. For further information, see “Risk Factors” in Part I, Item 1A of thisForm 10-K. We considered the historical trends in currency exchange rates and determined that it was reasonably possible that aweighted average adverse change of 20% in currency exchange rates could be experienced in the near term. Such an adversechange, after taking into account balance sheet hedges only and offsetting recorded monetary asset and liability positions, wouldhave resulted in an adverse impact on income before taxes of less than $75 million as of December 26, 2015 (less than $50million as of December 27, 2014).
Interest Rates
We generally hedge interest rate risks of fixed-rate debt investments with interest rate swaps, and we may elect to hedge interestrate risks of our indebtedness. Gains and losses on these instruments are generally offset by corresponding losses and gains onthe related hedging instruments.
We are exposed to interest rate risk related to our investment portfolio and debt issuances. The primary objective of ourinvestments in debt instruments is to preserve principal while maximizing yields, which generally track the U.S. dollar three-monthLIBOR. A hypothetical decrease in benchmark interest rates of up to 1.0%, after taking into account investment hedges, wouldhave resulted in an increase in the fair value of our investment portfolio of approximately $15 million as of December 26, 2015 (anincrease of approximately $10 million as of December 27, 2014). After taking into account interest rate and currency swaps, ahypothetical decrease in interest rates of up to 1.0% would have resulted in an increase in the fair value of our indebtedness ofapproximately $1.6 billion as of December 26, 2015 (an increase of approximately $1.0 billion as of December 27, 2014). Theincrease from December 27, 2014 was primarily driven by the inclusion of $9.5 billion of senior unsecured notes issued in Q3 andQ4 2015. The fluctuations in fair value of our investment portfolio and indebtedness reflect only the direct impact of the change ininterest rates. Other economic variables, such as equity market fluctuations and changes in relative credit risk, could result in asignificantly higher decline in the fair value of our net investment position. For further information on how credit risk is factored intothe valuation of our investment portfolio and debt issuances, see “Note 4: Fair Value” in Part II, Item 8 of this Form 10-K.
Equity Prices
Our investments include marketable equity securities and equity derivative instruments. We typically do not attempt to reduce oreliminate our equity market exposure through hedging activities at the inception of our investments. Before we enter into hedgearrangements, we evaluate legal, market, and economic factors, as well as the expected timing of disposal, to determine whetherhedging is appropriate. Our equity market risk management program may include equity derivatives with or without hedgeaccounting designation that utilize warrants, equity options, or other equity derivatives.
We also utilize total return swaps to offset changes in liabilities related to the equity market risks of certain deferred compensationarrangements. Gains and losses from changes in fair value of these total return swaps are generally offset by the losses andgains on the related liabilities.
60

As of December 26, 2015, the fair value of our marketable equity investments and our equity derivative instruments, includinghedging positions, was $6.0 billion ($7.1 billion as of December 27, 2014). Substantially all of our marketable equity investmentsportfolio as of December 26, 2015 was concentrated in our investment in ASML of $5.7 billion ($6.9 billion as of December 27,2014). Our marketable equity method investments are excluded from our analysis, as the carrying value does not fluctuate basedon market price changes unless an other-than-temporary impairment is deemed necessary. To determine reasonably possibledecreases in the market value of our marketable equity investments, we have analyzed the historical market price sensitivity ofour marketable equity investment portfolio. Assuming a decline of 30% in market prices, and after reflecting the impact of hedgesand offsetting positions, the aggregate value of our marketable equity investments could decrease by approximately $1.8 billion,based on the value as of December 26, 2015 (a decrease in value of approximately $2.1 billion, based on the value as ofDecember 27, 2014 using an assumed decline of 30%).
Many of the same factors that could result in an adverse movement of equity market prices affect our non-marketable equityinvestments, although we cannot always quantify the impact directly. Financial markets are volatile, which could negatively affectthe prospects of the companies we invest in, their ability to raise additional capital, and the likelihood of our ability to realize valuein our investments through liquidity events such as initial public offerings, mergers, and private sales. These types of investmentsinvolve a great deal of risk, and there can be no assurance that any specific company will grow or become successful;consequently, we could lose all or part of our investment. Our non-marketable cost method equity investments had a carryingamount of $2.9 billion as of December 26, 2015 ($1.8 billion as of December 27, 2014) and included our investment inUniSpreadtrum (which was made in 2015) and Cloudera of $966 million and $454 million, respectively ($454 million for Clouderaas of December 27, 2014). The carrying amount of our non-marketable equity method investments was $1.6 billion as ofDecember 26, 2015 ($1.4 billion as of December 27, 2014). A majority of our non-marketable equity method investments balanceas of December 26, 2015 was concentrated in our IMFT and Cloudera investments of $872 million and $256 million, respectively($713 million and $280 million for IMFT and Cloudera, respectively, as of December 27, 2014).
Commodity Price Risk
Although we operate facilities that consume commodities, we are not directly affected by commodity price risk to a materialdegree. We have established forecasted transaction risk management programs to protect against fluctuations in the fair valueand the volatility of future cash flows caused by changes in commodity prices. In addition, we have sourcing plans in place for ourkey commodities that mitigate the risk of a potential supplier concentration. For further information on commodity price risk, see“Note 6: Derivative Financial Instruments” in Part II, Item 8 of this Form 10-K.
61

ITEM 8. FINANCIAL STATEMENTS AND SUPPLEMENTARY DATA
INDEX TO CONSOLIDATED FINANCIAL STATEMENTS
Page
Reports of Independent Registered Public Accounting Firm . . . . . . . . . . . . . . . . . . . . . . . . . . . . . . . . . . . . . . . . . . . . . . . . . 63
Consolidated Statements of Income . . . . . . . . . . . . . . . . . . . . . . . . . . . . . . . . . . . . . . . . . . . . . . . . . . . . . . . . . . . . . . . . . . . 65
Consolidated Statements of Comprehensive Income . . . . . . . . . . . . . . . . . . . . . . . . . . . . . . . . . . . . . . . . . . . . . . . . . . . . . . 66
Consolidated Balance Sheets . . . . . . . . . . . . . . . . . . . . . . . . . . . . . . . . . . . . . . . . . . . . . . . . . . . . . . . . . . . . . . . . . . . . . . . . 67
Consolidated Statements of Cash Flows . . . . . . . . . . . . . . . . . . . . . . . . . . . . . . . . . . . . . . . . . . . . . . . . . . . . . . . . . . . . . . . 68
Consolidated Statements of Stockholders’ Equity . . . . . . . . . . . . . . . . . . . . . . . . . . . . . . . . . . . . . . . . . . . . . . . . . . . . . . . . . 69
Notes to Consolidated Financial Statements . . . . . . . . . . . . . . . . . . . . . . . . . . . . . . . . . . . . . . . . . . . . . . . . . . . . . . . . . . . . 70
Supplemental Data: Financial Information by Quarter . . . . . . . . . . . . . . . . . . . . . . . . . . . . . . . . . . . . . . . . . . . . . . . . . . . . . 131
62

REPORT OF INDEPENDENT REGISTERED PUBLIC ACCOUNTING FIRM
The Board of Directors and Stockholders of Intel Corporation
We have audited the accompanying consolidated balance sheets of Intel Corporation as of December 26, 2015 andDecember 27, 2014, and the related consolidated statements of income, comprehensive income, stockholders’ equity, and cashflows for each of the three years in the period ended December 26, 2015. Our audits also included the financial statementschedule listed in the Index at Part IV, Item 15. These financial statements and schedule are the responsibility of the Company’smanagement. Our responsibility is to express an opinion on these financial statements and schedule based on our audits.
We conducted our audits in accordance with the standards of the Public Company Accounting Oversight Board (United States).Those standards require that we plan and perform the audit to obtain reasonable assurance about whether the financialstatements are free of material misstatement. An audit includes examining, on a test basis, evidence supporting the amounts anddisclosures in the financial statements. An audit also includes assessing the accounting principles used and significant estimatesmade by management, as well as evaluating the overall financial statement presentation. We believe that our audits provide areasonable basis for our opinion.
In our opinion, the financial statements referred to above present fairly, in all material respects, the consolidated financial positionof Intel Corporation at December 26, 2015 and December 27, 2014, and the consolidated results of its operations and its cashflows for each of the three years in the period ended December 26, 2015, in conformity with U.S. generally accepted accountingprinciples. Also, in our opinion, the related financial statement schedule, when considered in relation to the basic financialstatements taken as a whole, presents fairly in all material respects the information set forth therein.
We also have audited, in accordance with the standards of the Public Company Accounting Oversight Board (United States), IntelCorporation’s internal control over financial reporting as of December 26, 2015, based on criteria established in Internal Control—Integrated Framework issued by the Committee of Sponsoring Organizations of the Treadway Commission (2013 framework) andour report dated February 12, 2016 expressed an unqualified opinion thereon.
/s/ Ernst & Young LLP
San Jose, CaliforniaFebruary 12, 2016
63

REPORT OF INDEPENDENT REGISTERED PUBLIC ACCOUNTING FIRM
The Board of Directors and Stockholders of Intel Corporation
We have audited Intel Corporation’s internal control over financial reporting as of December 26, 2015, based on criteriaestablished in Internal Control—Integrated Framework issued by the Committee of Sponsoring Organizations of the TreadwayCommission (2013 framework) (the COSO criteria). Intel Corporation’s management is responsible for maintaining effectiveinternal control over financial reporting, and for its assessment of the effectiveness of internal control over financial reportingincluded in the accompanying Management Report on Internal Control Over Financial Reporting. Our responsibility is to expressan opinion on the company’s internal control over financial reporting based on our audit.
We conducted our audit in accordance with the standards of the Public Company Accounting Oversight Board (United States).Those standards require that we plan and perform the audit to obtain reasonable assurance about whether effective internalcontrol over financial reporting was maintained in all material respects. Our audit included obtaining an understanding of internalcontrol over financial reporting, assessing the risk that a material weakness exists, testing and evaluating the design andoperating effectiveness of internal control based on the assessed risk, and performing such other procedures as we considerednecessary in the circumstances. We believe that our audit provides a reasonable basis for our opinion.
A company’s internal control over financial reporting is a process designed to provide reasonable assurance regarding thereliability of financial reporting and the preparation of financial statements for external purposes in accordance with generallyaccepted accounting principles. A company’s internal control over financial reporting includes those policies and procedures that(1) pertain to the maintenance of records that, in reasonable detail, accurately and fairly reflect the transactions and dispositionsof the assets of the company; (2) provide reasonable assurance that transactions are recorded as necessary to permitpreparation of financial statements in accordance with generally accepted accounting principles, and that receipts andexpenditures of the company are being made only in accordance with authorizations of management and directors of thecompany; and (3) provide reasonable assurance regarding prevention or timely detection of unauthorized acquisition, use, ordisposition of the company’s assets that could have a material effect on the financial statements.
Because of its inherent limitations, internal control over financial reporting may not prevent or detect misstatements. Also,projections of any evaluation of effectiveness to future periods are subject to the risk that controls may become inadequatebecause of changes in conditions, or that the degree of compliance with the policies or procedures may deteriorate.
In our opinion, Intel Corporation maintained, in all material respects, effective internal control over financial reporting as ofDecember 26, 2015, based on the COSO criteria.
We also have audited, in accordance with the standards of the Public Company Accounting Oversight Board (United States), the2015 consolidated financial statements of Intel Corporation and our report dated February 12, 2016, expressed an unqualifiedopinion thereon.
/s/ Ernst & Young LLP
San Jose, CaliforniaFebruary 12, 2016
64

INTEL CORPORATION
CONSOLIDATED STATEMENTS OF INCOME
Years Ended(In Millions, Except Per Share Amounts)
Dec 26,2015
Dec 27,2014
Dec 28,2013
Net revenue . . . . . . . . . . . . . . . . . . . . . . . . . . . . . . . . . . . . . . . . . . . . . . . . . . . . . . . . . . . . . $ 55,355 $ 55,870 $ 52,708
Cost of sales . . . . . . . . . . . . . . . . . . . . . . . . . . . . . . . . . . . . . . . . . . . . . . . . . . . . . . . . . . . . . 20,676 20,261 21,187
Gross margin . . . . . . . . . . . . . . . . . . . . . . . . . . . . . . . . . . . . . . . . . . . . . . . . . . . . . . . . . . . . 34,679 35,609 31,521
Research and development . . . . . . . . . . . . . . . . . . . . . . . . . . . . . . . . . . . . . . . . . . . . . . . . . . 12,128 11,537 10,611Marketing, general and administrative . . . . . . . . . . . . . . . . . . . . . . . . . . . . . . . . . . . . . . . . . . 7,930 8,136 8,088Restructuring and asset impairment charges . . . . . . . . . . . . . . . . . . . . . . . . . . . . . . . . . . . . 354 295 240Amortization of acquisition-related intangibles . . . . . . . . . . . . . . . . . . . . . . . . . . . . . . . . . . . . 265 294 291
Operating expenses . . . . . . . . . . . . . . . . . . . . . . . . . . . . . . . . . . . . . . . . . . . . . . . . . . . . . . . 20,677 20,262 19,230
Operating income . . . . . . . . . . . . . . . . . . . . . . . . . . . . . . . . . . . . . . . . . . . . . . . . . . . . . . . . 14,002 15,347 12,291
Gains (losses) on equity investments, net . . . . . . . . . . . . . . . . . . . . . . . . . . . . . . . . . . . . . . . 315 411 471Interest and other, net . . . . . . . . . . . . . . . . . . . . . . . . . . . . . . . . . . . . . . . . . . . . . . . . . . . . . . (105) 43 (151)
Income before taxes . . . . . . . . . . . . . . . . . . . . . . . . . . . . . . . . . . . . . . . . . . . . . . . . . . . . . . 14,212 15,801 12,611
Provision for taxes . . . . . . . . . . . . . . . . . . . . . . . . . . . . . . . . . . . . . . . . . . . . . . . . . . . . . . . . . 2,792 4,097 2,991
Net income . . . . . . . . . . . . . . . . . . . . . . . . . . . . . . . . . . . . . . . . . . . . . . . . . . . . . . . . . . . . . . $ 11,420 $ 11,704 $ 9,620
Basic earnings per share of common stock . . . . . . . . . . . . . . . . . . . . . . . . . . . . . . . . . . . $ 2.41 $ 2.39 $ 1.94
Diluted earnings per share of common stock . . . . . . . . . . . . . . . . . . . . . . . . . . . . . . . . . . $ 2.33 $ 2.31 $ 1.89
Weighted average shares of common stock outstanding:Basic . . . . . . . . . . . . . . . . . . . . . . . . . . . . . . . . . . . . . . . . . . . . . . . . . . . . . . . . . . . . . . . . . 4,742 4,901 4,970
Diluted . . . . . . . . . . . . . . . . . . . . . . . . . . . . . . . . . . . . . . . . . . . . . . . . . . . . . . . . . . . . . . . . 4,894 5,056 5,097
See accompanying notes.
65

INTEL CORPORATION
CONSOLIDATED STATEMENTS OF COMPREHENSIVE INCOME
Years Ended(In Millions)
Dec 26,2015
Dec 27,2014
Dec 28,2013
Net income . . . . . . . . . . . . . . . . . . . . . . . . . . . . . . . . . . . . . . . . . . . . . . . . . . . . . . . . . . . . . . $ 11,420 $ 11,704 $ 9,620
Other comprehensive income (loss), net of tax:Change in net unrealized holding gains (losses) on available-for-sale investments . . . . . (710) 577 1,181Change in deferred tax asset valuation allowance . . . . . . . . . . . . . . . . . . . . . . . . . . . . . . (18) (41) (26)Change in net unrealized holding gains (losses) on derivatives . . . . . . . . . . . . . . . . . . . . 157 (427) (89)Change in net prior service (costs) credits . . . . . . . . . . . . . . . . . . . . . . . . . . . . . . . . . . . . . 7 (33) 18Change in actuarial valuation . . . . . . . . . . . . . . . . . . . . . . . . . . . . . . . . . . . . . . . . . . . . . . . 128 (402) 520Change in net foreign currency translation adjustment . . . . . . . . . . . . . . . . . . . . . . . . . . . (170) (251) 38
Other comprehensive income (loss) . . . . . . . . . . . . . . . . . . . . . . . . . . . . . . . . . . . . . . . . . (606) (577) 1,642
Total comprehensive income . . . . . . . . . . . . . . . . . . . . . . . . . . . . . . . . . . . . . . . . . . . . . . . $ 10,814 $ 11,127 $ 11,262
See accompanying notes.
66

INTEL CORPORATION
CONSOLIDATED BALANCE SHEETS
(In Millions, Except Par Value)Dec 26,
2015Dec 27,
2014
Assets
Current assets:Cash and cash equivalents . . . . . . . . . . . . . . . . . . . . . . . . . . . . . . . . . . . . . . . . . . . . . . . . . . . . . . . . . . $ 15,308 $ 2,561Short-term investments . . . . . . . . . . . . . . . . . . . . . . . . . . . . . . . . . . . . . . . . . . . . . . . . . . . . . . . . . . . . . 2,682 2,430Trading assets . . . . . . . . . . . . . . . . . . . . . . . . . . . . . . . . . . . . . . . . . . . . . . . . . . . . . . . . . . . . . . . . . . . . 7,323 9,063Accounts receivable, net of allowance for doubtful accounts of $40 ($38 in 2014) . . . . . . . . . . . . . . . . 4,787 4,427Inventories . . . . . . . . . . . . . . . . . . . . . . . . . . . . . . . . . . . . . . . . . . . . . . . . . . . . . . . . . . . . . . . . . . . . . . . 5,167 4,273Deferred tax assets . . . . . . . . . . . . . . . . . . . . . . . . . . . . . . . . . . . . . . . . . . . . . . . . . . . . . . . . . . . . . . . . 2,036 1,958Other current assets . . . . . . . . . . . . . . . . . . . . . . . . . . . . . . . . . . . . . . . . . . . . . . . . . . . . . . . . . . . . . . . 3,053 3,018
Total current assets . . . . . . . . . . . . . . . . . . . . . . . . . . . . . . . . . . . . . . . . . . . . . . . . . . . . . . . . . . . . . . . . . 40,356 27,730
Property, plant and equipment, net . . . . . . . . . . . . . . . . . . . . . . . . . . . . . . . . . . . . . . . . . . . . . . . . . . . . 31,858 33,238
Marketable equity securities . . . . . . . . . . . . . . . . . . . . . . . . . . . . . . . . . . . . . . . . . . . . . . . . . . . . . . . . . . 5,960 7,097
Other long-term investments . . . . . . . . . . . . . . . . . . . . . . . . . . . . . . . . . . . . . . . . . . . . . . . . . . . . . . . . . 1,891 2,023
Goodwill . . . . . . . . . . . . . . . . . . . . . . . . . . . . . . . . . . . . . . . . . . . . . . . . . . . . . . . . . . . . . . . . . . . . . . . . . . 11,332 10,861
Identified intangible assets, net . . . . . . . . . . . . . . . . . . . . . . . . . . . . . . . . . . . . . . . . . . . . . . . . . . . . . . . 3,933 4,446
Other long-term assets . . . . . . . . . . . . . . . . . . . . . . . . . . . . . . . . . . . . . . . . . . . . . . . . . . . . . . . . . . . . . . 7,735 6,505
Total assets . . . . . . . . . . . . . . . . . . . . . . . . . . . . . . . . . . . . . . . . . . . . . . . . . . . . . . . . . . . . . . . . . . . . . $ 103,065 $ 91,900
Liabilities, temporary equity, and stockholders’ equity
Current liabilities:Short-term debt . . . . . . . . . . . . . . . . . . . . . . . . . . . . . . . . . . . . . . . . . . . . . . . . . . . . . . . . . . . . . . . . . . . $ 2,634 $ 1,596Accounts payable . . . . . . . . . . . . . . . . . . . . . . . . . . . . . . . . . . . . . . . . . . . . . . . . . . . . . . . . . . . . . . . . . . 2,063 2,748Accrued compensation and benefits . . . . . . . . . . . . . . . . . . . . . . . . . . . . . . . . . . . . . . . . . . . . . . . . . . . 3,138 3,475Accrued advertising . . . . . . . . . . . . . . . . . . . . . . . . . . . . . . . . . . . . . . . . . . . . . . . . . . . . . . . . . . . . . . . . 960 1,092Deferred income . . . . . . . . . . . . . . . . . . . . . . . . . . . . . . . . . . . . . . . . . . . . . . . . . . . . . . . . . . . . . . . . . . 2,188 2,205Other accrued liabilities . . . . . . . . . . . . . . . . . . . . . . . . . . . . . . . . . . . . . . . . . . . . . . . . . . . . . . . . . . . . . 4,684 4,895
Total current liabilities . . . . . . . . . . . . . . . . . . . . . . . . . . . . . . . . . . . . . . . . . . . . . . . . . . . . . . . . . . . . . . . 15,667 16,011
Long-term debt . . . . . . . . . . . . . . . . . . . . . . . . . . . . . . . . . . . . . . . . . . . . . . . . . . . . . . . . . . . . . . . . . . . . . 20,036 12,059
Long-term deferred tax liabilities . . . . . . . . . . . . . . . . . . . . . . . . . . . . . . . . . . . . . . . . . . . . . . . . . . . . . . 2,539 3,775
Other long-term liabilities . . . . . . . . . . . . . . . . . . . . . . . . . . . . . . . . . . . . . . . . . . . . . . . . . . . . . . . . . . . . 2,841 3,278
Commitments and contingencies (Notes 17 and 25) . . . . . . . . . . . . . . . . . . . . . . . . . . . . . . . . . . . . . .Temporary equity . . . . . . . . . . . . . . . . . . . . . . . . . . . . . . . . . . . . . . . . . . . . . . . . . . . . . . . . . . . . . . . . . . . 897 912
Stockholders’ equity:Preferred stock, $0.001 par value, 50 shares authorized; none issued . . . . . . . . . . . . . . . . . . . . . . . . . — —Common stock, $0.001 par value, 10,000 shares authorized; 4,725 shares issued and outstanding
(4,752 issued and 4,748 outstanding in 2014) and capital in excess of par value . . . . . . . . . . . . . . . 23,411 21,781Accumulated other comprehensive income (loss) . . . . . . . . . . . . . . . . . . . . . . . . . . . . . . . . . . . . . . . . . 60 666Retained earnings . . . . . . . . . . . . . . . . . . . . . . . . . . . . . . . . . . . . . . . . . . . . . . . . . . . . . . . . . . . . . . . . . 37,614 33,418
Total stockholders’ equity . . . . . . . . . . . . . . . . . . . . . . . . . . . . . . . . . . . . . . . . . . . . . . . . . . . . . . . . . . . 61,085 55,865
Total liabilities, temporary equity, and stockholders’ equity . . . . . . . . . . . . . . . . . . . . . . . . . . . . . $ 103,065 $ 91,900
See accompanying notes.
67
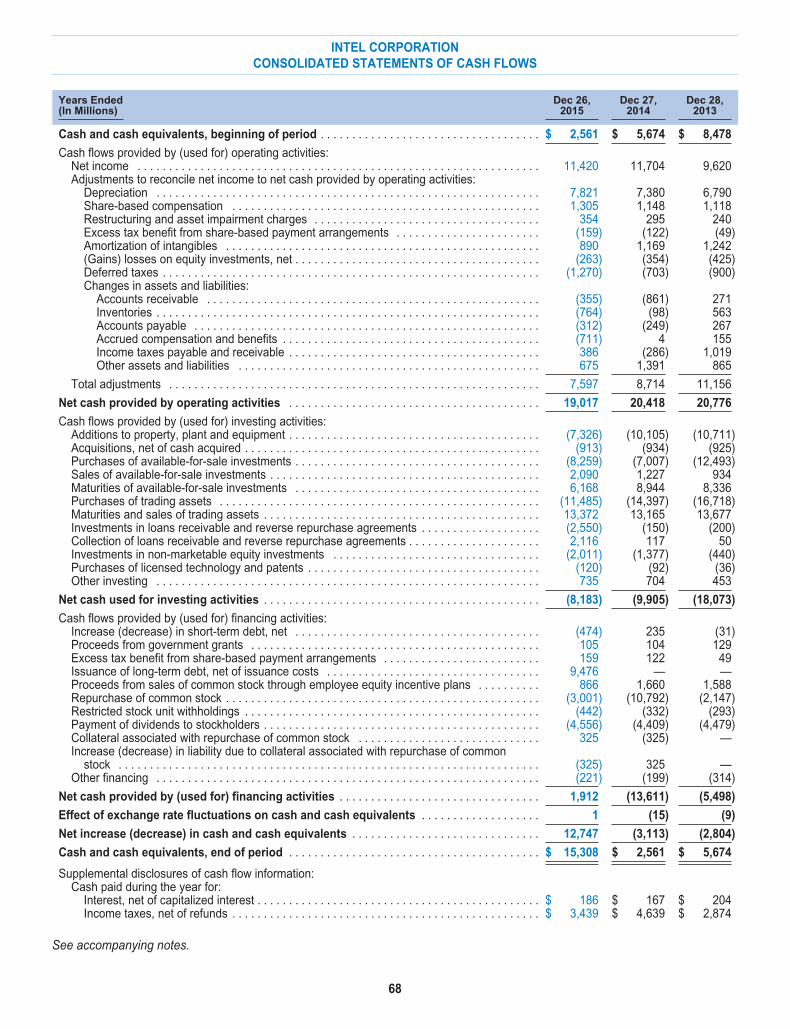
INTEL CORPORATION
CONSOLIDATED STATEMENTS OF CASH FLOWS
Years Ended(In Millions)
Dec 26,2015
Dec 27,2014
Dec 28,2013
Cash and cash equivalents, beginning of period . . . . . . . . . . . . . . . . . . . . . . . . . . . . . . . . . . . $ 2,561 $ 5,674 $ 8,478
Cash flows provided by (used for) operating activities:Net income . . . . . . . . . . . . . . . . . . . . . . . . . . . . . . . . . . . . . . . . . . . . . . . . . . . . . . . . . . . . . . . . 11,420 11,704 9,620Adjustments to reconcile net income to net cash provided by operating activities:
Depreciation . . . . . . . . . . . . . . . . . . . . . . . . . . . . . . . . . . . . . . . . . . . . . . . . . . . . . . . . . . . . . 7,821 7,380 6,790Share-based compensation . . . . . . . . . . . . . . . . . . . . . . . . . . . . . . . . . . . . . . . . . . . . . . . . . 1,305 1,148 1,118Restructuring and asset impairment charges . . . . . . . . . . . . . . . . . . . . . . . . . . . . . . . . . . . . 354 295 240Excess tax benefit from share-based payment arrangements . . . . . . . . . . . . . . . . . . . . . . . (159) (122) (49)Amortization of intangibles . . . . . . . . . . . . . . . . . . . . . . . . . . . . . . . . . . . . . . . . . . . . . . . . . . 890 1,169 1,242(Gains) losses on equity investments, net . . . . . . . . . . . . . . . . . . . . . . . . . . . . . . . . . . . . . . . (263) (354) (425)Deferred taxes . . . . . . . . . . . . . . . . . . . . . . . . . . . . . . . . . . . . . . . . . . . . . . . . . . . . . . . . . . . . (1,270) (703) (900)Changes in assets and liabilities:
Accounts receivable . . . . . . . . . . . . . . . . . . . . . . . . . . . . . . . . . . . . . . . . . . . . . . . . . . . . . (355) (861) 271Inventories . . . . . . . . . . . . . . . . . . . . . . . . . . . . . . . . . . . . . . . . . . . . . . . . . . . . . . . . . . . . . (764) (98) 563Accounts payable . . . . . . . . . . . . . . . . . . . . . . . . . . . . . . . . . . . . . . . . . . . . . . . . . . . . . . . (312) (249) 267Accrued compensation and benefits . . . . . . . . . . . . . . . . . . . . . . . . . . . . . . . . . . . . . . . . . (711) 4 155Income taxes payable and receivable . . . . . . . . . . . . . . . . . . . . . . . . . . . . . . . . . . . . . . . . 386 (286) 1,019Other assets and liabilities . . . . . . . . . . . . . . . . . . . . . . . . . . . . . . . . . . . . . . . . . . . . . . . . 675 1,391 865
Total adjustments . . . . . . . . . . . . . . . . . . . . . . . . . . . . . . . . . . . . . . . . . . . . . . . . . . . . . . . . . . . 7,597 8,714 11,156
Net cash provided by operating activities . . . . . . . . . . . . . . . . . . . . . . . . . . . . . . . . . . . . . . . . 19,017 20,418 20,776
Cash flows provided by (used for) investing activities:Additions to property, plant and equipment . . . . . . . . . . . . . . . . . . . . . . . . . . . . . . . . . . . . . . . . (7,326) (10,105) (10,711)Acquisitions, net of cash acquired . . . . . . . . . . . . . . . . . . . . . . . . . . . . . . . . . . . . . . . . . . . . . . . (913) (934) (925)Purchases of available-for-sale investments . . . . . . . . . . . . . . . . . . . . . . . . . . . . . . . . . . . . . . . (8,259) (7,007) (12,493)Sales of available-for-sale investments . . . . . . . . . . . . . . . . . . . . . . . . . . . . . . . . . . . . . . . . . . . 2,090 1,227 934Maturities of available-for-sale investments . . . . . . . . . . . . . . . . . . . . . . . . . . . . . . . . . . . . . . . 6,168 8,944 8,336Purchases of trading assets . . . . . . . . . . . . . . . . . . . . . . . . . . . . . . . . . . . . . . . . . . . . . . . . . . . (11,485) (14,397) (16,718)Maturities and sales of trading assets . . . . . . . . . . . . . . . . . . . . . . . . . . . . . . . . . . . . . . . . . . . . 13,372 13,165 13,677Investments in loans receivable and reverse repurchase agreements . . . . . . . . . . . . . . . . . . . (2,550) (150) (200)Collection of loans receivable and reverse repurchase agreements . . . . . . . . . . . . . . . . . . . . . 2,116 117 50Investments in non-marketable equity investments . . . . . . . . . . . . . . . . . . . . . . . . . . . . . . . . . (2,011) (1,377) (440)Purchases of licensed technology and patents . . . . . . . . . . . . . . . . . . . . . . . . . . . . . . . . . . . . . (120) (92) (36)Other investing . . . . . . . . . . . . . . . . . . . . . . . . . . . . . . . . . . . . . . . . . . . . . . . . . . . . . . . . . . . . . 735 704 453
Net cash used for investing activities . . . . . . . . . . . . . . . . . . . . . . . . . . . . . . . . . . . . . . . . . . . . (8,183) (9,905) (18,073)
Cash flows provided by (used for) financing activities:Increase (decrease) in short-term debt, net . . . . . . . . . . . . . . . . . . . . . . . . . . . . . . . . . . . . . . . (474) 235 (31)Proceeds from government grants . . . . . . . . . . . . . . . . . . . . . . . . . . . . . . . . . . . . . . . . . . . . . . 105 104 129Excess tax benefit from share-based payment arrangements . . . . . . . . . . . . . . . . . . . . . . . . . 159 122 49Issuance of long-term debt, net of issuance costs . . . . . . . . . . . . . . . . . . . . . . . . . . . . . . . . . . 9,476 — —Proceeds from sales of common stock through employee equity incentive plans . . . . . . . . . . 866 1,660 1,588Repurchase of common stock . . . . . . . . . . . . . . . . . . . . . . . . . . . . . . . . . . . . . . . . . . . . . . . . . . (3,001) (10,792) (2,147)Restricted stock unit withholdings . . . . . . . . . . . . . . . . . . . . . . . . . . . . . . . . . . . . . . . . . . . . . . . (442) (332) (293)Payment of dividends to stockholders . . . . . . . . . . . . . . . . . . . . . . . . . . . . . . . . . . . . . . . . . . . . (4,556) (4,409) (4,479)Collateral associated with repurchase of common stock . . . . . . . . . . . . . . . . . . . . . . . . . . . . . 325 (325) —Increase (decrease) in liability due to collateral associated with repurchase of common
stock . . . . . . . . . . . . . . . . . . . . . . . . . . . . . . . . . . . . . . . . . . . . . . . . . . . . . . . . . . . . . . . . . . . (325) 325 —Other financing . . . . . . . . . . . . . . . . . . . . . . . . . . . . . . . . . . . . . . . . . . . . . . . . . . . . . . . . . . . . . (221) (199) (314)
Net cash provided by (used for) financing activities . . . . . . . . . . . . . . . . . . . . . . . . . . . . . . . . 1,912 (13,611) (5,498)
Effect of exchange rate fluctuations on cash and cash equivalents . . . . . . . . . . . . . . . . . . . 1 (15) (9)
Net increase (decrease) in cash and cash equivalents . . . . . . . . . . . . . . . . . . . . . . . . . . . . . . 12,747 (3,113) (2,804)
Cash and cash equivalents, end of period . . . . . . . . . . . . . . . . . . . . . . . . . . . . . . . . . . . . . . . . $ 15,308 $ 2,561 $ 5,674
Supplemental disclosures of cash flow information:Cash paid during the year for:
Interest, net of capitalized interest . . . . . . . . . . . . . . . . . . . . . . . . . . . . . . . . . . . . . . . . . . . . . $ 186 $ 167 $ 204Income taxes, net of refunds . . . . . . . . . . . . . . . . . . . . . . . . . . . . . . . . . . . . . . . . . . . . . . . . . $ 3,439 $ 4,639 $ 2,874
See accompanying notes.
68

INTEL CORPORATION
CONSOLIDATED STATEMENTS OF STOCKHOLDERS’ EQUITY
Common Stock and Capitalin Excess of Par Value Accumulated
OtherComprehensiveIncome (Loss)
RetainedEarnings Total(In Millions, Except Per Share Amounts)
Number ofShares Amount
Balance as of December 29, 2012 . . . . . 4,944 $ 19,464 $ (399) $ 32,138 $ 51,203
Components of comprehensive income,net of tax:Net income . . . . . . . . . . . . . . . . . . . . . . — — — 9,620 9,620Other comprehensive income (loss) . . — — 1,642 — 1,642
Total comprehensive income . . . . . . 11,262
Proceeds from sales of common stockthrough employee equity incentiveplans, net tax deficiency, and other . . . 130 1,593 — — 1,593
Share-based compensation . . . . . . . . . . . — 1,117 — — 1,117Repurchase of common stock . . . . . . . . . (94) (345) — (1,802) (2,147)Restricted stock unit withholdings . . . . . . (13) (293) — — (293)Cash dividends declared ($0.90 per
share of common stock) . . . . . . . . . . . . — — — (4,479) (4,479)
Balance as of December 28, 2013 . . . . . 4,967 21,536 1,243 35,477 58,256
Components of comprehensive income,net of tax:Net income . . . . . . . . . . . . . . . . . . . . . . — — — 11,704 11,704Other comprehensive income (loss) . . — — (577) — (577)
Total comprehensive income . . . . . . 11,127
Proceeds from sales of common stockthrough employee equity incentiveplans, net excess tax benefit, andother . . . . . . . . . . . . . . . . . . . . . . . . . . . 125 1,787 — — 1,787
Share-based compensation . . . . . . . . . . . — 1,140 — — 1,140Temporary equity reclassification . . . . . . . — (912) — — (912)Repurchase of common stock . . . . . . . . . (332) (1,438) — (9,354) (10,792)Restricted stock unit withholdings . . . . . . (12) (332) — — (332)Cash dividends declared ($0.90 per
share of common stock) . . . . . . . . . . . . — — — (4,409) (4,409)
Balance as of December 27, 2014 . . . . . 4,748 21,781 666 33,418 55,865
Components of comprehensive income,net of tax:Net income . . . . . . . . . . . . . . . . . . . . . . — — — 11,420 11,420Other comprehensive income (loss) . . — — (606) — (606)
Total comprehensive income . . . . . . 10,814
Proceeds from sales of common stockthrough employee equity incentiveplans, net excess tax benefit, andother . . . . . . . . . . . . . . . . . . . . . . . . . . . 87 1,076 — — 1,076
Share-based compensation . . . . . . . . . . . — 1,314 — — 1,314Temporary equity reclassification . . . . . . . — 15 — — 15Repurchase of common stock . . . . . . . . . (96) (453) — (2,548) (3,001)Restricted stock unit withholdings . . . . . . (14) (322) — (120) (442)Cash dividends declared ($0.96 per
share of common stock) . . . . . . . . . . . . — — — (4,556) (4,556)
Balance as of December 26, 2015 . . . . . 4,725 $ 23,411 $ 60 $ 37,614 $ 61,085
See accompanying notes.
69

INTEL CORPORATION
NOTES TO CONSOLIDATED FINANCIAL STATEMENTS
Note 1: Basis of Presentation
We have a 52- or 53-week fiscal year that ends on the last Saturday in December. Fiscal years 2015, 2014, and 2013 were 52-week years. Fiscal year 2016 is a 53-week fiscal year, and the first quarter of 2016 will be a 14-week quarter. Our consolidatedfinancial statements include the accounts of Intel Corporation (Intel) and our subsidiaries. We have eliminated intercompanyaccounts and transactions. We use the equity method to account for equity investments in instances in which we own commonstock or similar interests and have the ability to exercise significant influence, but not control, over the investee. We havereclassified certain prior period amounts to conform to current period presentation.
As a result of our integration of McAfee Inc. (McAfee) in the third quarter of 2015, the functional currency for operations previouslyacquired from McAfee was changed to the U.S. dollar, making the U.S. dollar the functional currency for Intel and oursubsidiaries.
Note 2: Accounting Policies
Use of Estimates
The preparation of consolidated financial statements in conformity with U.S. generally accepted accounting principles requires usto make estimates and judgments that affect the amounts reported in our consolidated financial statements and theaccompanying notes. The accounting estimates that require our most significant, difficult, and subjective judgments include:• the valuation of non-marketable equity investments and the determination of other-than-temporary impairments;• the determination of useful lives for our property, plant and equipment and the related timing of when depreciation should
begin;• the valuation and allocation of assets acquired and liabilities assumed in connection with business combinations;• the valuation and recoverability of long-lived assets (property, plant and equipment; goodwill; and identified intangibles);• the recognition and measurement of current and deferred income taxes (including the measurement of uncertain tax
positions);• the valuation of inventory; and• the recognition and measurement of loss contingencies.
The actual results that we experience may differ materially from our estimates.
Fair Value
Fair value is the price that would be received from selling an asset or paid to transfer a liability in an orderly transaction betweenmarket participants at the measurement date. When determining fair value, we consider the principal or most advantageousmarket in which we would transact, and we consider assumptions that market participants would use when pricing the asset orliability. Our financial assets are measured and recorded at fair value, except for cost method investments, cost method loansreceivable, equity method investments, grants receivable, and reverse repurchase agreements with original maturities greaterthan approximately three months. Substantially all of our liabilities are not measured and recorded at fair value.
Fair Value Hierarchy
The three levels of inputs that may be used to measure fair value are as follows:
Level 1. Quoted prices in active markets for identical assets or liabilities.
70

INTEL CORPORATION
NOTES TO CONSOLIDATED FINANCIAL STATEMENTS (Continued)
Level 2. Observable inputs other than Level 1 prices, such as quoted prices for similar assets or liabilities, quoted prices in lessactive markets, or model-derived valuations in which all significant inputs are observable or can be derived principally from orcorroborated with observable market data for substantially the full term of the assets or liabilities. Level 2 inputs also include non-binding market consensus prices that can be corroborated with observable market data, as well as quoted prices that wereadjusted for security-specific restrictions.
Level 3. Unobservable inputs to the valuation methodology that are significant to the measurement of the fair value of assets orliabilities. Level 3 inputs also include non-binding market consensus prices or non-binding broker quotes that we were unable tocorroborate with observable market data.
For further discussion of fair value, see “Note 4: Fair Value” and “Note 16: Retirement Benefit Plans.”
Cash Equivalents
We consider all highly liquid debt investments with original maturities from the date of purchase of approximately three months orless as cash equivalents. Cash equivalents can include investments such as corporate debt, financial institution instruments,government debt, and reverse repurchase agreements classified as cash equivalents. See “Note 4: Fair Value” for theinstruments held as cash equivalents.
Trading Assets
Marketable debt instruments are generally designated as trading assets when a market risk is economically hedged at inceptionwith a related derivative instrument, or when the marketable debt instrument itself is used to economically hedge foreignexchange rate risk from remeasurement. Investments designated as trading assets are reported at fair value. The gains or lossesof these investments arising from changes in fair value due to interest rate and currency market fluctuations and credit marketvolatility, largely offset by losses or gains on the related derivative instruments and balance sheet remeasurement, are recordedin interest and other, net. We also designate certain floating-rate securitized financial instruments, primarily asset-backedsecurities, as trading assets.
Available-for-Sale Investments
We consider all liquid available-for-sale debt instruments with original maturities from the date of purchase of approximately threemonths or less to be cash and cash equivalents. Available-for-sale debt instruments with original maturities at the date ofpurchase greater than approximately three months and remaining maturities of less than one year are classified as short-terminvestments. Available-for-sale debt instruments with remaining maturities beyond one year are classified as other long-terminvestments.
Investments that we designate as available-for-sale are reported at fair value, with unrealized gains and losses, net of tax,recorded in accumulated other comprehensive income (loss), except as noted in the “Other-Than-Temporary Impairment” sectionthat follows. We determine the cost of the investment sold based on an average cost basis at the individual security level. Ouravailable-for-sale investments include:• Marketable debt instruments when the interest rate and foreign currency risks are not hedged at the inception of the
investment or when our criteria for designation as trading assets are not met. We generally hold these debt instruments togenerate a return commensurate with the U.S.-dollar three-month LIBOR. We record the interest income and realized gainsand losses on the sale of these instruments in interest and other, net.
• Marketable equity securities when there is no plan to sell or hedge the investment at the time of original classification. Weacquire these equity investments to promote business and strategic objectives. To the extent that these investments continueto have strategic value, we typically do not attempt to reduce or eliminate the equity market risks through hedging activities.We record the realized gains or losses on the sale or exchange of marketable equity securities in gains (losses) on equityinvestments, net.
71

INTEL CORPORATION
NOTES TO CONSOLIDATED FINANCIAL STATEMENTS (Continued)
Non-Marketable and Other Equity Investments
Our non-marketable equity and other equity investments are included in other long-term assets. We account for non-marketableequity and other equity investments for which we do not have control over the investee as:• Equity method investments when we have the ability to exercise significant influence, but not control, over the investee.
Equity method investments include marketable and non-marketable investments. Our proportionate share of the income orloss is recognized on a one-quarter lag and is recorded in gains (losses) on equity investments, net.
• Non-marketable cost method investments when the equity method does not apply.
We record the realized gains or losses on the sale of equity method and non-marketable cost method investments in gains(losses) on equity investments, net.
Other-Than-Temporary Impairment
Our available-for-sale investments and non-marketable and other equity investments are subject to a periodic impairment review.Investments are considered impaired when the fair value is below the investment’s adjusted cost basis. Impairments affectearnings as follows:• Marketable debt instruments when the fair value is below amortized cost and we intend to sell the instrument, or when it is
more likely than not that we will be required to sell the instrument before recovery of its amortized cost basis, or when we donot expect to recover the entire amortized cost basis of the instrument (that is, a credit loss exists). When we do not expect torecover the entire amortized cost basis of the instrument, we separate other-than-temporary impairments into amountsrepresenting credit losses, which are recognized in interest and other, net, and amounts related to all other factors, which arerecognized in other comprehensive income (loss).
• Marketable equity securities based on the specific facts and circumstances present at the time of assessment, which includethe consideration of general market conditions, the duration and extent to which the fair value is below cost, and our abilityand intent to hold the investment for a sufficient period of time to allow for recovery of value in the foreseeable future. Wealso consider specific adverse conditions related to the financial health of, and the business outlook for, the investee, whichmay include industry and sector performance, changes in technology, operational and financing cash flow factors, andchanges in the investee’s credit rating. We record other-than-temporary impairments on marketable equity securities andmarketable equity method investments in gains (losses) on equity investments, net.
• Non-marketable equity investments based on our assessment of the severity and duration of the impairment, and qualitativeand quantitative analysis, including:• the investee’s revenue and earnings trends relative to pre-defined milestones and overall business prospects;• the technological feasibility of the investee’s products and technologies;• the general market conditions in the investee’s industry or geographic area, including adverse regulatory or economic
changes;• the management and governance structure of the investee;• factors related to the investee’s ability to remain in business, such as the investee’s liquidity and debt ratios, and the rate
at which the investee is using its cash; and• the investee’s receipt of additional funding at a lower valuation.
We record other-than-temporary impairments for non-marketable cost method investments and equity method investments ingains (losses) on equity investments, net.
72

INTEL CORPORATION
NOTES TO CONSOLIDATED FINANCIAL STATEMENTS (Continued)
Derivative Financial Instruments
Our primary objective for holding derivative financial instruments is to manage currency exchange rate risk and interest rate risk,and, to a lesser extent, equity market risk, commodity price risk, and credit risk. When possible, we enter into master nettingarrangements with counterparties to mitigate credit risk in derivative transactions. A master netting arrangement may allowcounterparties to net settle amounts owed to each other as a result of multiple, separate derivative transactions. Generally, ourmaster netting agreements allow for net settlement in case of certain triggering events such as bankruptcy or default of one of thecounterparties to the transaction. We may also elect to exchange cash collateral with certain of our counterparties on a regularbasis. For presentation on our consolidated balance sheets, we do not offset fair value amounts recognized for derivativeinstruments under master netting arrangements. Our derivative financial instruments are recorded at fair value and are included inother current assets, other long-term assets, other accrued liabilities, or other long-term liabilities.
Our accounting policies for derivative financial instruments are based on whether they meet the criteria for hedge accountingdesignation.
A designated hedge with exposure to variability in the functional currency equivalent of the future foreign currency cash flows of aforecasted transaction or variability in the functional currency equivalent cash flows of a recognized asset or liability are examplesof cash flow hedges. The criteria for designating a derivative as a cash flow hedge include the assessment of the instrument’seffectiveness in risk reduction, matching of the derivative instrument to its underlying transaction, and the assessment of theprobability that the underlying transaction will occur. For derivatives with cash flow hedge accounting designation, we report theafter-tax gain or loss from the effective portion of the hedge as a component of accumulated other comprehensive income (loss)and reclassify it into earnings in the same period or periods in which the hedged transaction affects earnings, and in the same lineitem on the consolidated statements of income as the impact of the hedged transaction. Derivatives that we designate as cashflow hedges are classified in the consolidated statements of cash flows in the same section as the underlying item, primarilywithin cash flows from operating activities.
A designated hedge with exposure to changes in the fair value of a recognized asset or liability that are attributable to thechanges in the benchmark interest rate is one example of a fair value hedge. For derivatives with fair value hedge accountingdesignation, the gains and losses of the hedge as well as the offsetting gains and losses attributable to the changes in thebenchmark interest rate on the underlying hedged item are recognized in earnings in the current period. Derivatives that wedesignated as fair value hedges are classified in the consolidated statements of cash flows in the same section as the underlyingitem, primarily within cash flows from financing activities.
We recognize gains and losses from changes in fair value of derivatives that are not designated as hedges for accountingpurposes in the line item on the consolidated statements of income most closely associated with the related exposures, primarilyin interest and other, net and gains (losses) on equity investments, net. As part of our strategic investment program, we alsoacquire equity derivative instruments, such as equity conversion rights associated with debt instruments, which we do notdesignate as hedging instruments. We recognize the gains or losses from changes in fair value of these equity derivativeinstruments in gains (losses) on equity investments, net. Realized gains and losses from derivatives not designated as hedgesare classified in the consolidated statements of cash flows within cash flows from operating activities or investing activities,depending on the activity the exposure is most closely associated with.
73

INTEL CORPORATION
NOTES TO CONSOLIDATED FINANCIAL STATEMENTS (Continued)
Measurement of Effectiveness• Effectiveness for forwards is generally measured by comparing the cumulative change in the fair value of the hedge contract
with the cumulative change in the fair value of the forecasted cash flows of the hedged item. For currency forward contractsused in cash flow hedging strategies related to capital purchases, forward points are excluded, and effectiveness ismeasured using spot rates to value both the hedge contract and the hedged item. For currency forward contracts used incash flow hedging strategies related to operating expenditures, forward points are included, and effectiveness is measuredusing forward rates to value both the hedge contract and the hedged item.
• Effectiveness for options is generally measured by comparing the cumulative change in the intrinsic value of the hedgecontract with the cumulative change in the intrinsic value of an option instrument representing the hedged risks in the hedgeditem. Time value is excluded and effectiveness is measured using spot rates to value both the hedge contract and thehedged item.
• Effectiveness for interest rate swaps and commodity swaps is generally measured by comparing the cumulative change infair value of the swap with the cumulative change in the fair value of the hedged item.
If a cash flow hedge is discontinued because it is probable that the original hedged transaction will not occur as previouslyanticipated, the cumulative unrealized gain or loss on the related derivative is reclassified from accumulated other comprehensiveincome (loss) into earnings. Subsequent gains or losses on the related derivative instrument are recognized in interest and other,net in each period until the instrument matures, is terminated, is re-designated as a qualified cash flow hedge, or is sold.Ineffective portions of cash flow hedges, as well as amounts excluded from the assessment of effectiveness, are recognized inearnings in interest and other, net. For further discussion of our derivative instruments and risk management programs, see “Note6: Derivative Financial Instruments.”
Securities Lending
We may enter into securities lending agreements with financial institutions, generally to facilitate hedging and certain investmentand financing transactions. Selected securities may be loaned, secured by collateral in the form of cash or securities. The loanedsecurities continue to be carried as investment assets on our consolidated balance sheets. For lending agreements collateralizedby cash and cash equivalents, collateral is recorded as an asset with a corresponding liability. For lending agreementscollateralized by other securities, we do not record the collateral as an asset or a liability, unless the collateral is repledged.
Loans Receivable
We make loans to third parties that are classified within other current assets or other long-term assets. We may elect the fairvalue option for loans when the interest rate or foreign currency exchange rate risk is economically hedged at inception with arelated derivative instrument. We record the gains or losses on these loans arising from changes in fair value due to interest rate,currency, and counterparty credit changes, largely offset by losses or gains on the related derivative instruments, in interest andother, net. Loans that are denominated in U.S. dollars and have a floating-rate coupon are carried at amortized cost. We measureinterest income for all loans receivable using the interest method, which is based on the effective yield of the loans rather than thestated coupon rate. For further discussion of our loans receivable, see “Note 4: Fair Value.”
74

INTEL CORPORATION
NOTES TO CONSOLIDATED FINANCIAL STATEMENTS (Continued)
Inventories
We compute inventory cost on a first-in, first-out basis. Costs incurred to manufacture our products are included in the valuationof inventory beginning in the quarter in which a product meets the technical criteria to qualify for sale to customers. Prior toqualification for sale, costs that do not meet the criteria for research and development (R&D) are included in cost of sales in theperiod incurred. Inventories at the end of each period were as follows:
(In Millions)Dec 26,
2015Dec 27,
2014
Raw materials . . . . . . . . . . . . . . . . . . . . . . . . . . . . . . . . . . . . . . . . . . . . . . . . . . . . . . . . . . . . . . . . . . . . . . $ 532 $ 462Work in process . . . . . . . . . . . . . . . . . . . . . . . . . . . . . . . . . . . . . . . . . . . . . . . . . . . . . . . . . . . . . . . . . . . . . 2,893 2,375Finished goods . . . . . . . . . . . . . . . . . . . . . . . . . . . . . . . . . . . . . . . . . . . . . . . . . . . . . . . . . . . . . . . . . . . . . . 1,742 1,436
Total inventories . . . . . . . . . . . . . . . . . . . . . . . . . . . . . . . . . . . . . . . . . . . . . . . . . . . . . . . . . . . . . . . . . . . $ 5,167 $ 4,273
Property, Plant and Equipment
Property, plant and equipment, net at the end of each period were as follows:
(In Millions)Dec 26,
2015Dec 27,
2014
Land and buildings . . . . . . . . . . . . . . . . . . . . . . . . . . . . . . . . . . . . . . . . . . . . . . . . . . . . . . . . . . . . . . . . . . . $ 25,578 $ 22,989Machinery and equipment . . . . . . . . . . . . . . . . . . . . . . . . . . . . . . . . . . . . . . . . . . . . . . . . . . . . . . . . . . . . . 48,459 44,441Construction in progress . . . . . . . . . . . . . . . . . . . . . . . . . . . . . . . . . . . . . . . . . . . . . . . . . . . . . . . . . . . . . . 9,359 12,279
Total property, plant and equipment, gross . . . . . . . . . . . . . . . . . . . . . . . . . . . . . . . . . . . . . . . . . . . . . 83,396 79,709
Less: accumulated depreciation . . . . . . . . . . . . . . . . . . . . . . . . . . . . . . . . . . . . . . . . . . . . . . . . . . . . . . . . (51,538) (46,471)
Total property, plant and equipment, net . . . . . . . . . . . . . . . . . . . . . . . . . . . . . . . . . . . . . . . . . . . . . . . $ 31,858 $ 33,238
We compute depreciation for financial reporting purposes using the straight-line method. As of December 26, 2015, substantiallyall of our depreciable property, plant and equipment assets were depreciated over the following estimated useful lives: machineryand equipment, 2 to 4 years; and buildings, 10 to 25 years. Beginning in 2016, our machinery and equipment will be depreciatedover 2 to 5 years.
We capitalize a portion of interest on borrowings related to eligible capital expenditures. Capitalized interest is added to the costof qualified assets and depreciated over the estimated useful lives of the assets. We record capital-related government grantsearned as a reduction to property, plant and equipment.
Included within construction in progress we have certain facilities on hold and not in use. These facilities are being held in a safestate, and we have plans to place them into service at a future date. Depreciation is not recognized on these assets and they arenot eligible for capitalized interest when construction is on hold. The balance of such assets was approximately $3.4 billion as ofDecember 26, 2015 (approximately $2.2 billion as of December 27, 2014).
Goodwill
We record goodwill when the purchase price of an acquisition exceeds the fair value of the net tangible and identified intangibleassets acquired. We assign the goodwill to our reporting units based on the relative expected fair value provided by theacquisition. We perform an annual impairment assessment in the fourth quarter of each year, or more frequently if indicators ofpotential impairment exist, which includes evaluating qualitative and quantitative factors to assess the likelihood of an impairmentof a reporting unit’s goodwill. We perform impairment tests using a fair value approach when necessary. The reporting unit’scarrying value used in an impairment test represents the assignment of various assets and liabilities, excluding certain corporateassets and liabilities, such as cash, investments, and debt. For further discussion of goodwill, see “Note 10: Goodwill.”
75

INTEL CORPORATION
NOTES TO CONSOLIDATED FINANCIAL STATEMENTS (Continued)
Identified Intangible Assets
Licensed technology and patents are generally amortized on a straight-line basis over the periods of benefit. We amortize allacquisition-related intangible assets that are subject to amortization over their estimated useful life based on economic benefit.Acquisition-related in-process R&D assets represent the fair value of incomplete R&D projects that had not reached technologicalfeasibility as of the date of acquisition; initially, these are classified as “other intangible assets” that are not subject toamortization. Assets related to projects that have been completed are transferred from “other intangible assets” to “acquisition-related developed technology;” these are subject to amortization, while assets related to projects that have been abandoned areimpaired and expensed to R&D. In the quarter following the period in which identified intangible assets become fully amortized,we remove the fully amortized balances from the gross asset and accumulated amortization amounts.
The estimated useful life ranges for all identified intangible assets that are subject to amortization as of December 26, 2015 wereas follows:
(In Years)EstimatedUseful Life
Acquisition-related developed technology . . . . . . . . . . . . . . . . . . . . . . . . . . . . . . . . . . . . . . . . . . . . . . . . . . . . . . . . . . . 3–9Acquisition-related customer relationships . . . . . . . . . . . . . . . . . . . . . . . . . . . . . . . . . . . . . . . . . . . . . . . . . . . . . . . . . . 5–11Acquisition-related brands . . . . . . . . . . . . . . . . . . . . . . . . . . . . . . . . . . . . . . . . . . . . . . . . . . . . . . . . . . . . . . . . . . . . . . . 5–8Licensed technology and patents . . . . . . . . . . . . . . . . . . . . . . . . . . . . . . . . . . . . . . . . . . . . . . . . . . . . . . . . . . . . . . . . . 2–17
We perform a quarterly review of significant finite-lived identified intangible assets to determine whether facts and circumstancesindicate that the useful life is shorter than we had originally estimated or that the carrying amount of assets may not berecoverable. If such facts and circumstances exist, we assess recoverability by comparing the projected undiscounted net cashflows associated with the related asset or group of assets over their remaining lives against their respective carrying amounts.Impairments, if any, are based on the excess of the carrying amount over the fair value of those assets, which is calculated basedon projected discounted net cash flows. If an asset’s useful life is shorter than originally estimated, we accelerate the rate ofamortization and amortize the remaining carrying value over the new, shorter useful life.
We perform an annual impairment assessment in the fourth quarter of each year for indefinite-lived intangible assets, or morefrequently if indicators of potential impairment exist, to determine whether it is more likely than not that the carrying value of theassets may not be recoverable. If necessary, a quantitative impairment test is performed to compare the fair value of theindefinite-lived intangible asset with its carrying value. Impairments, if any, are based on the excess of the carrying amount overthe fair value of those assets.
For further discussion of identified intangible assets, see “Note 11: Identified Intangible Assets.”
Product Warranty
The vast majority of our products are sold with a limited warranty on product quality and a limited indemnification for customersagainst intellectual property rights infringement claims related to our products. The accrual and the related expense for knownproduct warranty issues were not significant during the periods presented. Due to product testing, the short time typically betweenproduct shipment and the detection and correction of product failures, and the historical rate of payments on indemnificationclaims, the accrual and related expense for estimated incurred but unidentified issues were not significant during the periodspresented.
76

INTEL CORPORATION
NOTES TO CONSOLIDATED FINANCIAL STATEMENTS (Continued)
Revenue Recognition
We recognize net product revenue when the earnings process is complete, as evidenced by an agreement with the customer,delivery has occurred, and acceptance, if applicable, as well as fixed pricing and probable collectability. We record pricingallowances, including discounts based on contractual arrangements with customers, when we recognize revenue as a reductionto both accounts receivable and net revenue. Because of frequent sales price reductions and rapid technology obsolescence inour industry, we defer product revenue and related costs of sales from component sales made to distributors under agreementsallowing price protection or right of return until the distributors sell the merchandise. The right of return granted generally consistsof a stock rotation program in which distributors are able to exchange certain products based on the number of qualifiedpurchases made by the distributor. Under the price protection program, we give distributors credits for the difference between theoriginal price paid and the current price that we offer. We include shipping charges billed to customers in net revenue, and includethe related shipping costs in cost of sales.
Revenue from license agreements on our McAfee products generally includes service and support agreements for which therelated revenue is deferred and recognized ratably over the performance period. Revenue derived from online subscriptionproducts is deferred and recognized ratably over the performance period. Professional services revenue is recognized asservices are performed or, if required, upon customer acceptance. For arrangements with multiple elements, including softwarelicenses, maintenance, and/or services, revenue is allocated across the separately identified deliverables and may be recognizedor deferred. When vendor-specific objective evidence does not exist for undelivered elements such as maintenance and support,the entire arrangement fee is recognized ratably over the performance period. Direct costs, such as costs related to revenue-sharing and royalty arrangements associated with license arrangements, as well as component costs associated with productrevenue and sales commissions, are deferred and amortized over the same period that the related revenue is recognized.
We record deferred revenue offset by the related cost of sales on our consolidated balance sheets as deferred income.
Advertising
Cooperative advertising programs reimburse customers for marketing activities for certain of our products, subject to definedcriteria. We accrue cooperative advertising obligations and record the costs at the same time that the related revenue isrecognized. We record cooperative advertising costs as marketing, general and administrative (MG&A) expenses to the extentthat an advertising benefit separate from the revenue transaction can be identified and the fair value of that advertising benefitreceived is determinable. We record any excess in cash paid to customers over the fair value of the advertising benefit we receiveas a reduction in revenue. Advertising costs, including direct marketing costs, recorded within MG&A expenses were $1.8 billionin 2015 ($1.8 billion in 2014 and $1.9 billion in 2013).
Employee Equity Incentive Plans
We have employee equity incentive plans, which are described more fully in “Note 18: Employee Equity Incentive Plans.” We usethe straight-line attribution method to recognize share-based compensation over the service period of the award. Upon exercise,cancellation, forfeiture, or expiration of stock options, or upon vesting or forfeiture of restricted stock units (RSUs), we eliminatedeferred tax assets for options and RSUs with multiple vesting dates for each vesting period on a first-in, first-out basis as if eachvesting period were a separate award.
Income Taxes
We compute the provision for income taxes using the asset and liability method, under which deferred tax assets and liabilitiesare recognized for the expected future tax consequences of temporary differences between the financial reporting and tax basesof assets and liabilities, and for operating losses and tax credit carryforwards. We measure deferred tax assets and liabilitiesusing the currently enacted tax rates that apply to taxable income in effect for the years in which those tax assets are expected tobe realized or settled. We record a valuation allowance to reduce deferred tax assets to the amount that it is believed more likelythan not to be realized.
77

INTEL CORPORATION
NOTES TO CONSOLIDATED FINANCIAL STATEMENTS (Continued)
We recognize tax benefits from uncertain tax positions only if that tax position is more likely than not to be sustained onexamination by the taxing authorities, based on the technical merits of the position. We then measure the tax benefits recognizedin the financial statements from such positions based on the largest benefit that has a greater than 50% likelihood of beingrealized upon ultimate settlement. We recognize interest and penalties related to unrecognized tax benefits within the provisionfor taxes on the consolidated statements of income. For more information about income taxes, see “Note 23: Income Taxes.”
Note 3: Recent Accounting Standards
In May 2014, the Financial Accounting Standards Board (FASB) issued a new standard to achieve a consistent application ofrevenue recognition within the U.S., resulting in a single revenue model to be applied by reporting companies under U.S.generally accepted accounting principles. Under the new model, recognition of revenue occurs when a customer obtains controlof promised goods or services in an amount that reflects the consideration to which the entity expects to be entitled in exchangefor those goods or services. In addition, the new standard requires that reporting companies disclose the nature, amount, timing,and uncertainty of revenue and cash flows arising from contracts with customers. On July 9, 2015, the FASB agreed to delay theeffective date by one year; accordingly, the new standard is effective for us beginning in the first quarter of 2018 and we expect toadopt it at that time. The new standard is required to be applied retrospectively to each prior reporting period presented orretrospectively with the cumulative effect of initially applying it recognized at the date of initial application. We have not yetselected a transition method, nor have we determined the impact of the new standard on our consolidated financial statements.
In 2015, the FASB issued an amended standard requiring that we classify all deferred tax assets and liabilities as non-current onthe balance sheet instead of separating deferred taxes into current and non-current. The amended standard is effective for usbeginning in the first quarter of 2017; early adoption is permitted and we are evaluating whether we will early adopt. The amendedstandard may be adopted on either a prospective or retrospective basis. We do not expect that the adoption of this standard willhave a significant impact on our financial position or results of operations.
In 2015, the FASB issued an amended standard requiring that we recognize the effect on earnings of any adjustments identifiedduring the measurement period after an acquisition in the same period the adjustment is identified, as opposed to the priorstandard which required material adjustments be retrospectively adjusted. The amended standard is effective for us beginning inthe first quarter of 2016. We do not expect that the adoption of this standard will have a significant impact on our consolidatedfinancial statements.
In January 2016, the FASB issued changes to the accounting for financial instruments that primarily affect equity investments,financial liabilities under the fair value option, and the presentation and disclosure requirements for financial instruments. Thisstandard is effective for us beginning in the first quarter of 2018; certain provisions allow for early adoption and we are evaluatingwhether we will elect to early adopt these provisions. The new standard should be applied by means of a cumulative-effectadjustment to the balance sheet as of the beginning of the fiscal year of adoption, with certain exceptions. We have not yetdetermined the impact of the new standard on our consolidated financial statements.
In 2015, we adopted an amended standard simplifying the presentation of debt issuance costs as a direct deduction from thecarrying value of the debt liability rather than showing the debt issuance costs as an asset. We have applied the amendmentretrospectively to the comparable period presented and it did not have a significant impact on our financial statements.
78

INTEL CORPORATION
NOTES TO CONSOLIDATED FINANCIAL STATEMENTS (Continued)
Note 4: Fair Value
Assets and Liabilities Measured and Recorded at Fair Value on a Recurring Basis
Assets and liabilities measured and recorded at fair value on a recurring basis at the end of each period were as follows:
December 26, 2015 December 27, 2014
Fair Value Measured andRecorded at Reporting Date Using
Total
Fair Value Measured andRecorded at Reporting Date Using
Total(In Millions) Level 1 Level 2 Level 3 Level 1 Level 2 Level 3
Assets
Cash equivalents:Corporate debt . . . . . . . . . . . . . . . . . $ — $ 1,829 $ — $ 1,829 $ — $ 48 $ — $ 48Financial institution instruments . . . . 8,238 1,277 — 9,515 321 1,119 — 1,440Government debt . . . . . . . . . . . . . . . — 130 — 130 — — — —Reverse repurchase agreements . . . — 2,368 — 2,368 — 268 — 268
Short-term investments:Corporate debt . . . . . . . . . . . . . . . . . 336 764 20 1,120 363 412 31 806Financial institution instruments . . . . 145 927 — 1,072 149 1,050 — 1,199Government debt . . . . . . . . . . . . . . . 65 425 — 490 252 173 — 425
Trading assets:Asset-backed securities . . . . . . . . . . — 275 94 369 — 766 58 824Corporate debt . . . . . . . . . . . . . . . . . 1,744 564 — 2,308 2,625 339 — 2,964Financial institution instruments . . . . 930 701 — 1,631 1,146 613 — 1,759Government debt . . . . . . . . . . . . . . . 1,107 1,908 — 3,015 1,295 2,221 — 3,516
Other current assets:Derivative assets . . . . . . . . . . . . . . . . 32 412 1 445 — 559 2 561Loans receivable . . . . . . . . . . . . . . . . — 137 — 137 — 505 — 505
Marketable equity securities . . . . . . . . . 5,891 69 — 5,960 7,097 — — 7,097Other long-term investments:
Asset-backed securities . . . . . . . . . . — — 4 4 — 2 4 6Corporate debt . . . . . . . . . . . . . . . . . 407 801 — 1,208 453 728 13 1,194Financial institution instruments . . . . 171 381 — 552 189 319 — 508Government debt . . . . . . . . . . . . . . . 79 48 — 127 75 240 — 315
Other long-term assets:Derivative assets . . . . . . . . . . . . . . . . — 30 10 40 — 35 22 57Loans receivable . . . . . . . . . . . . . . . . — 342 — 342 — 216 — 216
Total assets measured and recordedat fair value . . . . . . . . . . . . . . . . . . . 19,145 13,388 129 32,662 13,965 9,613 130 23,708
Liabilities
Other accrued liabilities:Derivative liabilities . . . . . . . . . . . . . . 2 210 — 212 — 563 — 563
Other long-term liabilities:Derivative liabilities . . . . . . . . . . . . . . — 33 — 33 — 17 — 17
Total liabilities measured andrecorded at fair value . . . . . . . . . . . $ 2 $ 243 $ — $ 245 $ — $ 580 $ — $ 580
Government debt includes instruments such as non-U.S. government bonds and U.S. agency securities. Financial institutioninstruments include instruments issued or managed by financial institutions in various forms, such as commercial paper, fixed andfloating rate bonds, money market fund deposits, and time deposits.
79

INTEL CORPORATION
NOTES TO CONSOLIDATED FINANCIAL STATEMENTS (Continued)
For the year ended December 26, 2015, we transferred corporate debt and financial institution instruments of approximately $628million from Level 1 to Level 2 of the fair value hierarchy and approximately $403 million of financial institution instruments,corporate debt, and government debt from Level 2 to Level 1 ($177 million of corporate debt, financial institution instruments, andgovernment debt from Level 1 to Level 2 and $395 million from Level 2 to Level 1 during 2014). These transfers were based onchanges in market activity for the underlying instruments. Our policy is to reflect transfers between the fair value hierarchy levelsat the beginning of the quarter in which a change in circumstances resulted in the transfer.
Investments in Debt Instruments
Debt instruments reflected in the preceding table include investments such as asset-backed securities, corporate debt, financialinstitution instruments, government debt, and reverse repurchase agreements classified as cash equivalents. We classify ourdebt instruments as Level 2 when we use observable market prices for identical instruments that are traded in less activemarkets. When observable market prices for identical instruments are not available, we price the debt instruments using our ownmodels, such as a discounted cash flow model, or non-binding market consensus prices based on the proprietary valuationmodels of pricing providers or brokers. These valuation models incorporate a number of inputs, including non-binding and bindingbroker quotes; observable market prices for identical or similar instruments; and the internal assumptions of pricing providers orbrokers that use observable market inputs and unobservable market inputs that we consider to be not significant. When we usenon-binding market consensus prices, we corroborate them with quoted market prices for similar instruments or compare them tooutput from internally developed pricing models such as a discounted cash flow model. The discounted cash flow model usesobservable market inputs, such as LIBOR-based yield curves, currency spot and forward rates, and credit ratings. All significantinputs are derived from or corroborated with observable market data.
The fair values of debt instruments classified as Level 3 are generally derived from discounted cash flow models, performedeither by us or our pricing providers, using inputs that we are unable to corroborate with observable market data. We monitor andreview the inputs and results of these valuation models to help ensure the fair value measurements are reasonable andconsistent with market experience in similar asset classes.
Fair Value Option for Loans Receivable
We elected the fair value option for loans receivable when the interest rate or currency exchange rate risk was hedged atinception with a related derivative instrument. As of December 26, 2015 and December 27, 2014, the fair value of our loansreceivable for which we elected the fair value option did not significantly differ from the contractual principal balance based on thecontractual currency. Loans receivable are classified within other current assets and other long-term assets. Fair value isdetermined using a discounted cash flow model, with all significant inputs derived from or corroborated with observable marketdata. Gains and losses from changes in fair value on the loans receivable and related derivative instruments, as well as interestincome, are recorded in interest and other, net. During all periods presented, changes in the fair value of our loans receivablewere largely offset by gains or losses on the related derivative instruments, resulting in an insignificant net impact on ourconsolidated statements of income. Gains and losses attributable to changes in credit risk are determined using observable creditdefault spreads for the issuer or comparable companies; these gains and losses were insignificant during all periods presented.We did not elect the fair value option for loans receivable when the interest rate or currency exchange rate risk was not hedged atinception with a related derivative instrument. Loans receivable not measured and recorded at fair value are included in thefollowing “Financial Instruments Not Recorded at Fair Value on a Recurring Basis” section.
Assets Measured and Recorded at Fair Value on a Non-Recurring Basis
Our non-marketable equity investments, marketable equity method investments, and non-financial assets, such as intangibleassets and property, plant and equipment, are recorded at fair value only if an impairment is recognized.
80

INTEL CORPORATION
NOTES TO CONSOLIDATED FINANCIAL STATEMENTS (Continued)
Some of our non-marketable equity investments have been measured and recorded at fair value due to events or circumstancesthat significantly impacted the fair value of those investments, resulting in other-than-temporary impairments. We classified theseinvestments as Level 3 because the valuations used unobservable inputs that were significant to the fair value measurementsand required management judgment due to the absence of quoted market prices. Impairments recognized on non-marketableequity investments held as of December 26, 2015 were $160 million in 2015 ($128 million in 2014 on non-marketable equityinvestments held as of December 27, 2014 and $106 million in 2013 on non-marketable equity investments held as ofDecember 28, 2013).
Financial Instruments Not Recorded at Fair Value on a Recurring Basis
On a quarterly basis, we measure the fair value of our grants receivable, cost method loans receivable, non-marketable costmethod investments, reverse repurchase agreements with original maturities greater than approximately three months, andindebtedness carried at amortized cost plus applicable hedge adjustments; however, the assets are recorded at fair value onlywhen an impairment is recognized. The carrying amounts and fair values of financial instruments not recorded at fair value on arecurring basis at the end of each period were as follows:
December 26, 2015
CarryingAmount
Fair Value Measured Using
Fair Value(In Millions) Level 1 Level 2 Level 3
Grants receivable . . . . . . . . . . . . . . . . . . . . . . . . . . . . . . . . . . . . . . $ 593 $ — $ 600 $ — $ 600Loans receivable . . . . . . . . . . . . . . . . . . . . . . . . . . . . . . . . . . . . . . $ 315 $ — $ 315 $ — $ 315Non-marketable cost method investments . . . . . . . . . . . . . . . . . . . $ 2,933 $ — $ — $ 3,904 $ 3,904Reverse repurchase agreements . . . . . . . . . . . . . . . . . . . . . . . . . . $ 1,000 $ — $ 1,000 $ — $ 1,000Short-term debt . . . . . . . . . . . . . . . . . . . . . . . . . . . . . . . . . . . . . . . $ 2,593 $ 1,513 $ 1,563 $ — $ 3,076Long-term debt . . . . . . . . . . . . . . . . . . . . . . . . . . . . . . . . . . . . . . . . $ 20,036 $ 14,058 $ 6,835 $ — $ 20,893NVIDIA Corporation cross-license agreement liability . . . . . . . . . . $ 199 $ — $ 200 $ — $ 200
December 27, 2014
CarryingAmount
Fair Value Measured Using
Fair Value(In Millions) Level 1 Level 2 Level 3
Grants receivable . . . . . . . . . . . . . . . . . . . . . . . . . . . . . . . . . . . . . . $ 676 $ — $ 679 $ — $ 679Loans receivable . . . . . . . . . . . . . . . . . . . . . . . . . . . . . . . . . . . . . . $ 250 $ — $ 250 $ — $ 250Non-marketable cost method investments . . . . . . . . . . . . . . . . . . . $ 1,769 $ — $ — $ 2,599 $ 2,599Reverse repurchase agreements . . . . . . . . . . . . . . . . . . . . . . . . . . $ 450 $ — $ 450 $ — $ 450Short-term debt . . . . . . . . . . . . . . . . . . . . . . . . . . . . . . . . . . . . . . . $ 1,580 $ — $ 2,145 $ — $ 2,145Long-term debt . . . . . . . . . . . . . . . . . . . . . . . . . . . . . . . . . . . . . . . . $ 12,059 $ 11,467 $ 1,309 $ — $ 12,776NVIDIA Corporation cross-license agreement liability . . . . . . . . . . $ 395 $ — $ 399 $ — $ 399
The fair value of our grants receivable is determined using a discounted cash flow model, which discounts future cash flows usingan appropriate yield curve. As of December 26, 2015 and December 27, 2014, the carrying amount of our grants receivable wasclassified within other current assets and other long-term assets, as applicable.
The carrying amount and fair value of loans receivable exclude loans measured and recorded at fair value on a recurring basis.The fair value of our loans receivable and reverse repurchase agreements, including those held at fair value, is determined usinga discounted cash flow model. All significant inputs in the models are derived from or corroborated with observable market data,such as LIBOR-based yield curves, currency spot and forward rates, and credit ratings. The credit quality of these assets remainshigh, with credit ratings of A+/A1 for most of our loans receivable and a substantial majority of our reverse repurchaseagreements as of December 26, 2015.
81

INTEL CORPORATION
NOTES TO CONSOLIDATED FINANCIAL STATEMENTS (Continued)
As of December 26, 2015, and December 27, 2014, the unrealized loss position of our non-marketable cost method investmentswas insignificant. Our non-marketable cost method investments are valued using a qualitative and quantitative analysis of eventsor circumstances that impact the fair value of the investment. Qualitative analysis of our investments involves understanding ourinvestee’s revenue and earnings trends relative to pre-defined milestones and overall business prospects; the technologicalfeasibility of our investee’s products and technologies; the general market conditions in the investee’s industry or geographicarea, including adverse regulatory or economic changes; and the management and governance structure of the investee.Quantitative assessments of the fair value of our investments are developed using the market and income approaches. Themarket approach includes the use of financial metrics and ratios of comparable public companies, such as revenue, earnings,comparable performance multiples, recent financing rounds, the terms of the investees’ issued interests, and the level ofmarketability of the investments. The selection of comparable companies requires management judgment and is based on anumber of factors, including comparable companies’ sizes, growth rates, industries, and development stages. The incomeapproach includes the use of a discounted cash flow model, which requires significant estimates regarding investees’ revenue,costs, and discount rates based on the risk profile of comparable companies. Estimates of revenue and costs are developedusing available market, historical, and forecast data. We measure the fair value of our non-marketable cost method investmentsas close to the end of the period as feasible.
The carrying amount and fair value of short-term debt exclude drafts payable. Our short-term debt recognized at amortized costincludes our 2009 junior subordinated convertible debentures due 2039 (2009 debentures) and our 2011 senior notes due 2016.During the fourth quarter of 2015, the 2009 debentures were classified as short-term debt on the consolidated balance sheet andconvertible at the option of the holder during the first quarter of 2016. For further information, see “Note 15: Borrowings.” Ourlong-term debt recognized at amortized cost is composed of our senior notes and our convertible debentures. The fair value ofour senior notes is classified as Level 1 when we use quoted prices in active markets and Level 2 when the quoted prices arefrom less active markets or when other observable inputs are used to determine fair value. The fair value of our 2009 and 2005convertible debentures is determined using discounted cash flow models with observable market inputs, and takes intoconsideration variables such as interest rate changes, comparable instruments, subordination discount, and credit-ratingchanges; it is, therefore, classified as Level 2.
The NVIDIA Corporation (NVIDIA) cross-license agreement liability in the preceding table was incurred as a result of entering intoa long-term patent cross-license agreement with NVIDIA in January 2011, pursuant to which we agreed to make payments toNVIDIA over six years. The carrying amount of the liability arising from the agreement was classified within other accruedliabilities and other long-term liabilities, based on the expected timing of the underlying payments ($200 million due in each ofJanuary 2015 and 2016 treated as cash used for financing activities). The fair value is determined using a discounted cash flowmodel, which discounts future cash flows using our incremental borrowing rates.
82

INTEL CORPORATION
NOTES TO CONSOLIDATED FINANCIAL STATEMENTS (Continued)
Note 5: Cash and Investments
Cash and investments at the end of each period were as follows:
(In Millions)Dec 26,
2015Dec 27,
2014
Available-for-sale investments . . . . . . . . . . . . . . . . . . . . . . . . . . . . . . . . . . . . . . . . . . . . . . . . . . . . . . . . . . $ 22,007 $ 13,038Cash . . . . . . . . . . . . . . . . . . . . . . . . . . . . . . . . . . . . . . . . . . . . . . . . . . . . . . . . . . . . . . . . . . . . . . . . . . . . . . 1,466 805Equity method investments . . . . . . . . . . . . . . . . . . . . . . . . . . . . . . . . . . . . . . . . . . . . . . . . . . . . . . . . . . . . 1,590 1,446Loans receivable . . . . . . . . . . . . . . . . . . . . . . . . . . . . . . . . . . . . . . . . . . . . . . . . . . . . . . . . . . . . . . . . . . . . 794 971Non-marketable cost method investments . . . . . . . . . . . . . . . . . . . . . . . . . . . . . . . . . . . . . . . . . . . . . . . . . 2,933 1,769Reverse repurchase agreements . . . . . . . . . . . . . . . . . . . . . . . . . . . . . . . . . . . . . . . . . . . . . . . . . . . . . . . . 3,368 718Trading assets . . . . . . . . . . . . . . . . . . . . . . . . . . . . . . . . . . . . . . . . . . . . . . . . . . . . . . . . . . . . . . . . . . . . . . 7,323 9,063
Total cash and investments . . . . . . . . . . . . . . . . . . . . . . . . . . . . . . . . . . . . . . . . . . . . . . . . . . . . . . . . . . $ 39,481 $ 27,810
Available-for-Sale Investments
Available-for-sale investments at the end of each period were as follows:
December 26, 2015 December 27, 2014
(In Millions)Adjusted
Cost
GrossUnrealized
Gains
GrossUnrealized
LossesFair
ValueAdjusted
Cost
GrossUnrealized
Gains
GrossUnrealized
LossesFair
Value
Asset-backed securities . . . $ 5 $ — $ (1) $ 4 $ 8 $ — $ (2) $ 6Corporate debt . . . . . . . . . . 4,164 3 (10) 4,157 2,040 13 (5) 2,048Financial institution
instruments . . . . . . . . . . 11,140 1 (2) 11,139 3,146 2 (1) 3,147Government debt . . . . . . . . 748 — (1) 747 741 — (1) 740Marketable equity
securities . . . . . . . . . . . . 3,254 2,706 — 5,960 3,318 3,779 — 7,097
Total available-for-saleinvestments . . . . . . . . . $ 19,311 $ 2,710 $ (14) $ 22,007 $ 9,253 $ 3,794 $ (9) $ 13,038
Government debt includes instruments such as non-U.S. government bonds and U.S. agency securities. Financial institutioninstruments include instruments issued or managed by financial institutions in various forms, such as commercial paper, fixed andfloating rate bonds, money market fund deposits, and time deposits. Substantially all time deposits were issued by institutionsoutside the U.S. as of December 26, 2015 and December 27, 2014.
For information on the unrealized holding gains (losses) on available-for-sale investments reclassified out of accumulated othercomprehensive income (loss) into the consolidated statements of income, see “Note 24: Other Comprehensive Income (Loss).”
During 2015, we sold available-for-sale investments for proceeds of $2.2 billion, of which $144 million related to sales of cash andcash equivalents ($1.7 billion in 2014, of which $509 million related to sales of cash and cash equivalents; and $1.3 billion in2013, of which $339 million related to sales of cash and cash equivalents). The gross realized gains on sales of available-for-saleinvestments were $133 million in 2015 ($136 million in 2014 and $146 million in 2013). We determine the cost of an investmentsold on an average cost basis at the individual security level. Impairments recognized on available-for-sale investments wereinsignificant for all periods presented.
83

INTEL CORPORATION
NOTES TO CONSOLIDATED FINANCIAL STATEMENTS (Continued)
The amortized cost and fair value of available-for-sale debt investments, by contractual maturity, as of December 26, 2015 wereas follows:
(In Millions) Cost Fair Value
Due in 1 year or less . . . . . . . . . . . . . . . . . . . . . . . . . . . . . . . . . . . . . . . . . . . . . . . . . . . . . . . . . . . . . . . . . $ 5,896 $ 5,893Due in 1–2 years . . . . . . . . . . . . . . . . . . . . . . . . . . . . . . . . . . . . . . . . . . . . . . . . . . . . . . . . . . . . . . . . . . . . 1,271 1,268Due in 2–5 years . . . . . . . . . . . . . . . . . . . . . . . . . . . . . . . . . . . . . . . . . . . . . . . . . . . . . . . . . . . . . . . . . . . . 623 620Instruments not due at a single maturity date . . . . . . . . . . . . . . . . . . . . . . . . . . . . . . . . . . . . . . . . . . . . . . 8,267 8,266
Total . . . . . . . . . . . . . . . . . . . . . . . . . . . . . . . . . . . . . . . . . . . . . . . . . . . . . . . . . . . . . . . . . . . . . . . . . . . . . $ 16,057 $ 16,047
Equity Method Investments
Equity method investments, classified within other long-term assets, at the end of each period were as follows:
December 26, 2015 December 27, 2014
(Dollars In Millions)Carrying
ValueOwnershipPercentage
CarryingValue
OwnershipPercentage
IM Flash Technologies, LLC . . . . . . . . . . . . . . . . . . . . . . . . . . . . . . . . . . . . . . $ 872 49% $ 713 49%Cloudera, Inc. . . . . . . . . . . . . . . . . . . . . . . . . . . . . . . . . . . . . . . . . . . . . . . . . . 256 17% 280 17%Intel-GE Care Innovations, LLC . . . . . . . . . . . . . . . . . . . . . . . . . . . . . . . . . . . 64 50% 108 50%Other equity method investments . . . . . . . . . . . . . . . . . . . . . . . . . . . . . . . . . . 398 345
Total . . . . . . . . . . . . . . . . . . . . . . . . . . . . . . . . . . . . . . . . . . . . . . . . . . . . . . . . $ 1,590 $ 1,446
IM Flash Technologies, LLC
Since the inception of IM Flash Technologies, LLC (IMFT) in 2006, Micron Technology, Inc. (Micron) and Intel have jointlydeveloped NAND flash memory and, most recently, 3D XPoint technology products. Intel also purchases jointly developedproducts directly from Micron under certain supply agreements.
The IMFT operating agreement, most recently amended in January 2016, continues through 2024 unless earlier terminated undercertain terms and conditions, and provides for certain buy-sell rights of the joint venture. Intel has the right to cause Micron to buyour interest in IMFT. If we exercise this right, Micron would set the closing date of the transaction within two years following suchelection and could elect to receive financing from us for one to two years. Subsequent to our put right, and commencing inJanuary 2019, Micron has the right to call our interest in IMFT with the closing date to be effective within one year. IMFT is avariable interest entity, and all costs of IMFT are passed on to Micron and Intel through sale of products or services inproportional share of ownership. Intel’s portion of IMFT costs, primarily related to product purchases and production-relatedservices, was approximately $400 million in 2015 (approximately $400 million in 2014 and approximately $380 million in 2013).The amount due to IMFT for product purchases and services provided was approximately $20 million as of December 26, 2015(approximately $60 million as of December 27, 2014). IMFT returned $6 million to Intel in 2014, which is reflected within investingactivities on the consolidated statements of cash flows ($45 million in 2013).
IMFT depends on Micron and Intel for any additional cash needs. Our known maximum exposure to loss approximated thecarrying value of our investment balance in IMFT, which was $872 million as of December 26, 2015. Except for the amount due toIMFT for product purchases and production-related services, we did not have any additional liabilities recognized on ourconsolidated balance sheets in connection with our interests in this joint venture as of December 26, 2015. Our potential futurelosses could be higher than the carrying amount of our investment, as Intel and Micron are liable for other future operating costsor obligations of IMFT. Future cash calls could also increase our investment balance and the related exposure to loss. In addition,because we are currently committed to purchasing 49% of IMFT’s production output and production-related services, we may berequired to purchase products at a cost in excess of realizable value.
We have determined that we do not have the characteristics of a consolidating investor in the variable interest entity and,therefore, we account for our interest in IMFT using the equity method of accounting.
84

INTEL CORPORATION
NOTES TO CONSOLIDATED FINANCIAL STATEMENTS (Continued)
Cloudera, Inc.
During 2014, we invested in Cloudera, Inc. (Cloudera). Our fully diluted ownership interest in Cloudera is 17% as ofDecember 26, 2015. Our investment is accounted for under the equity and cost methods of accounting based on the rightsassociated with different instruments we own, and is classified within other long-term assets. The carrying value of our equitymethod investment was $256 million and of our cost method investment was $454 million as of December 26, 2015 ($280 millionfor our equity method investment and $454 million for our cost method investment as of December 27, 2014).
Intel-GE Care Innovations, LLC
During 2011, Intel and General Electric Company (GE) formed Intel-GE Care Innovations, LLC (Care Innovations), an equallyowned joint venture in the healthcare industry that focuses on independent living and delivery of health-related services by meansof telecommunications. The company was formed by combining assets of GE Healthcare’s Home Health division and Intel’sDigital Health Group.
Care Innovations is a variable interest entity and depends on Intel and GE for any additional cash needs. Our known maximumexposure to loss approximated the carrying value of our investment balance in Care Innovations, which was $64 million as ofDecember 26, 2015.
Intel and GE equally share the power to direct all of Care Innovations’ activities that most significantly impact its economicperformance. We have determined that we do not have the characteristics of a consolidating investor in the variable interest entityand, therefore, we account for our interest in Care Innovations using the equity method of accounting.
Clearwire Communications, LLC
During 2013, we sold our interest in Clearwire Communications, LLC (Clearwire LLC), which we originally acquired in 2008, forproceeds of $328 million. These proceeds are included in other investing within investing activities on the consolidatedstatements of cash flows. We recognized a gain on the sale of our interest in Clearwire LLC of $328 million.
For proceeds received and gains recognized for each investment, see “Note 20: Gains (Losses) on Equity Investments, Net.”
Non-marketable cost method investments
The carrying value of our non-marketable cost method investments was $2.9 billion as of December 26, 2015 ($1.8 billion as ofDecember 27, 2014), of which $454 million and $966 million related to our cost method investments in Cloudera and BeijingUniSpreadtrum Technology Ltd. (UniSpreadtrum), respectively. In 2015, we recognized impairments of $164 million on non-marketable cost method investments, which is included within gains (losses) on equity investments, net on the consolidatedstatements of income ($130 million in 2014 and $103 million in 2013).
Investment in Beijing UniSpreadtrum Technology Ltd.
During 2014, we entered into a series of agreements with Tsinghua Unigroup Ltd. (Tsinghua Unigroup), an operating subsidiaryof Tsinghua Holdings Co. Ltd., to, among other things, jointly develop Intel architecture- and communications-based solutions forphones. We agreed to invest up to 9.0 billion Chinese yuan (approximately $1.5 billion as of the date of the agreement) for aminority stake of approximately 20% of UniSpreadtrum, a holding company under Tsinghua Unigroup. During 2015, we invested$966 million to complete the first phase of the equity investment. We have determined we will not have significant influence overthe company and, therefore, we account for our interest using the cost method of accounting. Subject to regulatory approvals andother closing conditions, the second phase of the investment will require additional funding of approximately $500 million.
Trading Assets
As of December 26, 2015, and December 27, 2014, substantially all of our trading assets were marketable debt instruments. Netlosses related to trading assets still held at the reporting date were $152 million in 2015 (net losses of $530 million in 2014 andnet losses of $70 million in 2013). Net gains on the related derivatives were $137 million in 2015 (net gains of $525 million in 2014and $86 million in 2013).
85

INTEL CORPORATION
NOTES TO CONSOLIDATED FINANCIAL STATEMENTS (Continued)
Note 6: Derivative Financial Instruments
Our primary objective for holding derivative financial instruments is to manage currency exchange rate risk and interest rate risk,and, to a lesser extent, equity market risk, commodity price risk, and credit risk.
Currency Exchange Rate Risk
We are exposed to currency exchange rate risk, and generally hedge our exposures with currency forward contracts, currencyinterest rate swaps, or currency options. Substantially all of our revenue is transacted in U.S. dollars. However, a significantportion of our operating expenditures and capital purchases is incurred in or exposed to other currencies, primarily the euro, theChinese yuan, the Japanese yen, and the Israeli shekel. We have established balance sheet and forecasted transaction currencyrisk management programs to protect against fluctuations in the fair value and the volatility of the functional currency equivalent offuture cash flows caused by changes in exchange rates. Our non-U.S.-dollar-denominated investments in debt instruments andloans receivable are generally hedged with offsetting currency forward contracts or currency interest rate swaps. We may alsohedge currency risk arising from funding foreign currency-denominated forecasted investments. These programs reduce, but donot eliminate, the impact of currency exchange movements.
Our currency risk management programs include:• Currency derivatives with cash flow hedge accounting designation that utilize currency forward contracts and currency
options to hedge exposures to the variability in the U.S.-dollar equivalent of anticipated non-U.S.-dollar-denominated cashflows. These instruments generally mature within 12 months. For these derivatives, we report the after-tax gain or loss fromthe effective portion of the hedge as a component of accumulated other comprehensive income (loss), and we reclassify itinto earnings in the same period or periods in which the hedged transaction affects earnings, and in the same line item on theconsolidated statements of income as the impact of the hedged transaction. We utilize currency interest rate swaps to hedgeexposures to the variability in the U.S.-dollar equivalent of coupon and principal payments associated with our non-U.S.-dollar-denominated indebtedness.
• Currency derivatives without hedge accounting designation that utilize currency forward contracts or currency interest rateswaps to economically hedge the functional currency equivalent cash flows of recognized monetary assets and liabilities,non-U.S.-dollar-denominated debt instruments classified as trading assets, and hedges of non-U.S.-dollar-denominatedloans receivable recognized at fair value. A substantial majority of these instruments mature within 12 months. Changes inthe functional currency equivalent cash flows of the underlying assets and liabilities are approximately offset by the changesin the fair value of the related derivatives. We record net gains or losses in the line item on the consolidated statements ofincome most closely associated with the related exposures, primarily in interest and other, net, except for equity-related gainsor losses, which we primarily record in gains (losses) on equity investments, net.
Interest Rate Risk
Our primary objective for holding investments in debt instruments is to preserve principal while maximizing yields. We generallyswap the returns on our investments in fixed-rate debt instruments with remaining maturities longer than six months into U.S.dollar three-month LIBOR-based returns, unless management specifically approves otherwise. We may elect to swap fixedcoupon payments on our debt issuances for floating rate coupon payments. These swaps are settled at various interest paymenttimes involving cash payments at each interest and principal payment date, with the majority of the contracts having quarterlypayments.
Our interest rate risk management programs include:• Interest rate derivatives with cash flow hedge accounting designation that utilize interest rate swap agreements to modify the
interest characteristics of debt instruments. For these derivatives, we report the after-tax gain or loss from the effectiveportion of the hedge as a component of accumulated other comprehensive income (loss), and we reclassify it into earnings inthe same period or periods in which the hedged transaction affects earnings, and in the same line item on the consolidatedstatements of income as the impact of the hedged transaction.
86

INTEL CORPORATION
NOTES TO CONSOLIDATED FINANCIAL STATEMENTS (Continued)
• Interest rate derivatives with fair value hedge accounting designation that utilize interest rate swap agreements to hedgeagainst changes in fair value on certain fixed rate debt due to fluctuations in the benchmark interest rate. For thesederivatives, we recognize gains and losses in interest and other, net, along with the offsetting gains and losses attributable tothe changes in the benchmark interest rate on the underlying hedged items.
• Interest rate derivatives without hedge accounting designation that utilize interest rate swaps and currency interest rateswaps in economic hedging transactions, including hedges of non-U.S.-dollar-denominated debt instruments classified astrading assets and hedges of non-U.S.-dollar-denominated loans receivable recognized at fair value. Floating interest rateson the swaps generally reset on a quarterly basis. Changes in the fair value of the debt instruments classified as tradingassets and loans receivable recognized at fair value are generally offset by changes in the fair value of the relatedderivatives, both of which are recorded in interest and other, net.
Equity Market Risk
Our investments include marketable equity securities and equity derivative instruments. We typically do not attempt to reduce oreliminate our equity market exposure through hedging activities at the inception of our investments. Before we enter into hedgearrangements, we evaluate legal, market, and economic factors, as well as the expected timing of disposal, to determine whetherhedging is appropriate. Our equity market risk management program may include equity derivatives with or without hedgeaccounting designation that utilize warrants, equity options, or other equity derivatives. We recognize changes in the fair value ofsuch derivatives in gains (losses) on equity investments, net.
We also utilize total return swaps to offset changes in liabilities related to the equity market risks of certain deferred compensationarrangements. Gains and losses from changes in fair value of these total return swaps are generally offset by the losses andgains on the related liabilities, both of which are recorded in cost of sales and operating expenses. Deferred compensationliabilities were $1.3 billion as of December 26, 2015 ($1.2 billion as of December 27, 2014), and are included in other accruedliabilities.
Commodity Price Risk
We operate facilities that consume commodities and have established forecasted transaction risk management programs toprotect against fluctuations in the fair value and the volatility of future cash flows caused by changes in commodity prices, such asthose for natural gas. These programs reduce, but do not always eliminate, the impact of commodity price movements.
Our commodity price risk management program may include commodity derivatives with cash flow hedge accounting designationthat utilize commodity swap contracts to hedge future cash flow exposures to the variability in commodity prices. Theseinstruments generally mature within 12 months. For these derivatives, we report the after-tax gain (loss) from the effective portionof the hedge as a component of accumulated other comprehensive income (loss) and reclassify it into earnings in the sameperiod or periods in which the hedged transaction affects earnings, and in the same line item on the consolidated statements ofincome as the impact of the hedged transaction.
87
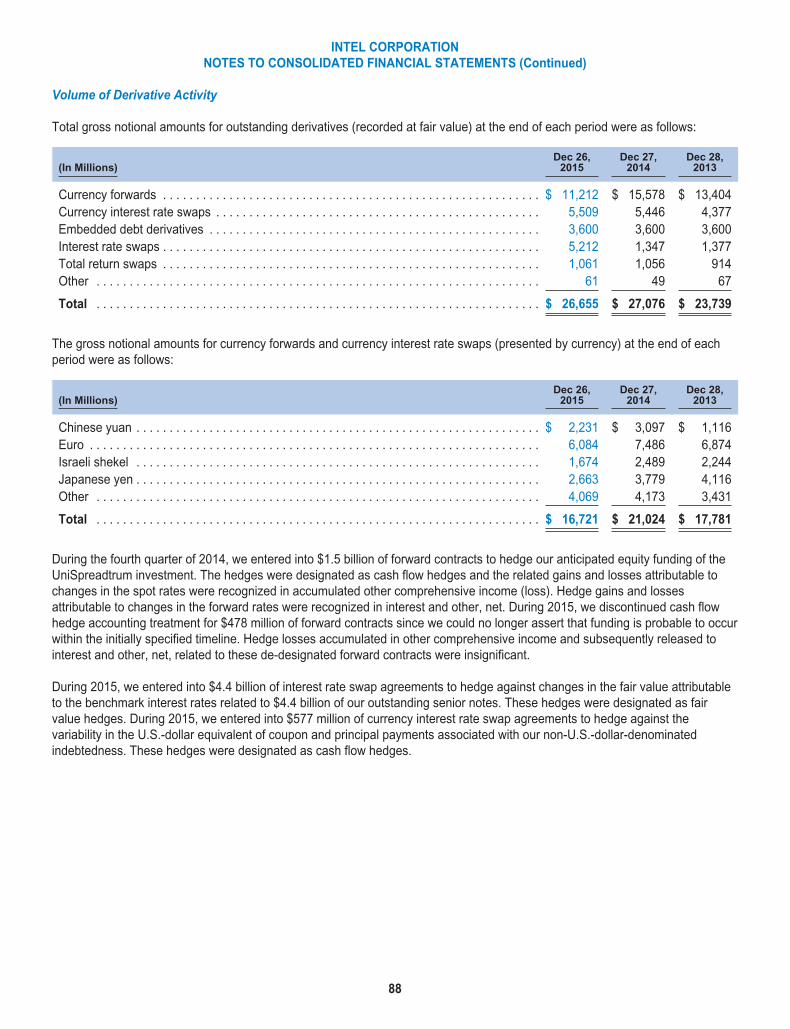
INTEL CORPORATION
NOTES TO CONSOLIDATED FINANCIAL STATEMENTS (Continued)
Volume of Derivative Activity
Total gross notional amounts for outstanding derivatives (recorded at fair value) at the end of each period were as follows:
(In Millions)Dec 26,
2015Dec 27,
2014Dec 28,
2013
Currency forwards . . . . . . . . . . . . . . . . . . . . . . . . . . . . . . . . . . . . . . . . . . . . . . . . . . . . . . . . . $ 11,212 $ 15,578 $ 13,404Currency interest rate swaps . . . . . . . . . . . . . . . . . . . . . . . . . . . . . . . . . . . . . . . . . . . . . . . . . 5,509 5,446 4,377Embedded debt derivatives . . . . . . . . . . . . . . . . . . . . . . . . . . . . . . . . . . . . . . . . . . . . . . . . . . 3,600 3,600 3,600Interest rate swaps . . . . . . . . . . . . . . . . . . . . . . . . . . . . . . . . . . . . . . . . . . . . . . . . . . . . . . . . . 5,212 1,347 1,377Total return swaps . . . . . . . . . . . . . . . . . . . . . . . . . . . . . . . . . . . . . . . . . . . . . . . . . . . . . . . . . 1,061 1,056 914Other . . . . . . . . . . . . . . . . . . . . . . . . . . . . . . . . . . . . . . . . . . . . . . . . . . . . . . . . . . . . . . . . . . . 61 49 67
Total . . . . . . . . . . . . . . . . . . . . . . . . . . . . . . . . . . . . . . . . . . . . . . . . . . . . . . . . . . . . . . . . . . . $ 26,655 $ 27,076 $ 23,739
The gross notional amounts for currency forwards and currency interest rate swaps (presented by currency) at the end of eachperiod were as follows:
(In Millions)Dec 26,
2015Dec 27,
2014Dec 28,
2013
Chinese yuan . . . . . . . . . . . . . . . . . . . . . . . . . . . . . . . . . . . . . . . . . . . . . . . . . . . . . . . . . . . . . $ 2,231 $ 3,097 $ 1,116Euro . . . . . . . . . . . . . . . . . . . . . . . . . . . . . . . . . . . . . . . . . . . . . . . . . . . . . . . . . . . . . . . . . . . . 6,084 7,486 6,874Israeli shekel . . . . . . . . . . . . . . . . . . . . . . . . . . . . . . . . . . . . . . . . . . . . . . . . . . . . . . . . . . . . . 1,674 2,489 2,244Japanese yen . . . . . . . . . . . . . . . . . . . . . . . . . . . . . . . . . . . . . . . . . . . . . . . . . . . . . . . . . . . . . 2,663 3,779 4,116Other . . . . . . . . . . . . . . . . . . . . . . . . . . . . . . . . . . . . . . . . . . . . . . . . . . . . . . . . . . . . . . . . . . . 4,069 4,173 3,431
Total . . . . . . . . . . . . . . . . . . . . . . . . . . . . . . . . . . . . . . . . . . . . . . . . . . . . . . . . . . . . . . . . . . . $ 16,721 $ 21,024 $ 17,781
During the fourth quarter of 2014, we entered into $1.5 billion of forward contracts to hedge our anticipated equity funding of theUniSpreadtrum investment. The hedges were designated as cash flow hedges and the related gains and losses attributable tochanges in the spot rates were recognized in accumulated other comprehensive income (loss). Hedge gains and lossesattributable to changes in the forward rates were recognized in interest and other, net. During 2015, we discontinued cash flowhedge accounting treatment for $478 million of forward contracts since we could no longer assert that funding is probable to occurwithin the initially specified timeline. Hedge losses accumulated in other comprehensive income and subsequently released tointerest and other, net, related to these de-designated forward contracts were insignificant.
During 2015, we entered into $4.4 billion of interest rate swap agreements to hedge against changes in the fair value attributableto the benchmark interest rates related to $4.4 billion of our outstanding senior notes. These hedges were designated as fairvalue hedges. During 2015, we entered into $577 million of currency interest rate swap agreements to hedge against thevariability in the U.S.-dollar equivalent of coupon and principal payments associated with our non-U.S.-dollar-denominatedindebtedness. These hedges were designated as cash flow hedges.
88

INTEL CORPORATION
NOTES TO CONSOLIDATED FINANCIAL STATEMENTS (Continued)
Fair Value of Derivative Instruments in the Consolidated Balance Sheets
The fair value of our derivative instruments at the end of each period were as follows:
December 26, 2015 December 27, 2014
(In Millions)
OtherCurrentAssets
OtherLong-Term
Assets
OtherAccrued
Liabilities
OtherLong-TermLiabilities
OtherCurrentAssets
OtherLong-Term
Assets
OtherAccrued
Liabilities
OtherLong-TermLiabilities
Derivatives designated ashedging instruments:Currency forwards . . . . . . . . $ 20 $ 3 $ 83 $ 2 $ 6 $ 1 $ 497 $ 9Interest rate swaps . . . . . . . . — 1 — 14 — — — —Currency interest rate
swaps . . . . . . . . . . . . . . . . — 7 — — — — — —
Total derivatives designatedas hedging instruments . . . 20 11 83 16 6 1 497 9
Derivatives not designated ashedging instruments:Currency forwards . . . . . . . . 20 — 63 — 207 — 44 —Currency interest rate
swaps . . . . . . . . . . . . . . . . 370 18 52 — 344 34 7 —Embedded debt
derivatives . . . . . . . . . . . . — — — 17 — — 4 8Interest rate swaps . . . . . . . . 2 — 12 — 3 — 11 —Total return swaps . . . . . . . . 32 — 2 — — — — —Other . . . . . . . . . . . . . . . . . . 1 11 — — 1 22 — —
Total derivatives notdesignated as hedginginstruments . . . . . . . . . . . . . 425 29 129 17 555 56 66 8
Total derivatives . . . . . . . . . . . $ 445 $ 40 $ 212 $ 33 $ 561 $ 57 $ 563 $ 17
89

INTEL CORPORATION
NOTES TO CONSOLIDATED FINANCIAL STATEMENTS (Continued)
Amounts Offset in the Consolidated Balance Sheets
The gross amounts of our derivative instruments and reverse repurchase agreements subject to master netting arrangementswith various counterparties, and cash and non-cash collateral posted under such agreements at the end of each period were asfollows:
December 26, 2015
Gross Amounts Not Offsetin the Balance Sheet
(In Millions)
GrossAmounts
Recognized
GrossAmounts
Offset in theBalance
Sheet
Net AmountsPresented inthe Balance
SheetFinancial
Instruments
Cash andNon-CashCollateral
Received orPledged Net Amount
Assets:Derivative assets subject to master
netting arrangements . . . . . . . . . . . . . $ 482 $ — $ 482 $ (201) $ (188) $ 93Reverse repurchase agreements . . . . . . 3,368 — 3,368 — (3,368) —
Total assets . . . . . . . . . . . . . . . . . . . . . . . 3,850 — 3,850 (201) (3,556) 93
Liabilities:Derivative liabilities subject to master
netting arrangements . . . . . . . . . . . . . 242 — 242 (201) (27) 14
Total liabilities . . . . . . . . . . . . . . . . . . . . . $ 242 $ — $ 242 $ (201) $ (27) $ 14
December 27, 2014
Gross Amounts Not Offsetin the Balance Sheet
(In Millions)
GrossAmounts
Recognized
GrossAmounts
Offset in theBalance
Sheet
NetAmounts
Presented inthe Balance
SheetFinancial
Instruments
Cash andNon-CashCollateral
Received orPledged Net Amount
Assets:Derivative assets subject to master
netting arrangements . . . . . . . . . . . . . $ 559 $ — $ 559 $ (365) $ (78) $ 116Reverse repurchase agreements . . . . . . 718 — 718 — (718) —
Total assets . . . . . . . . . . . . . . . . . . . . . . . 1,277 — 1,277 (365) (796) 116
Liabilities:Derivative liabilities subject to master
netting arrangements . . . . . . . . . . . . . 559 — 559 (365) (80) 114
Total liabilities . . . . . . . . . . . . . . . . . . . . . $ 559 $ — $ 559 $ (365) $ (80) $ 114
We obtain and secure available collateral from counterparties against obligations, including securities lending transactions andreverse repurchase agreements, when we deem it appropriate.
90

INTEL CORPORATION
NOTES TO CONSOLIDATED FINANCIAL STATEMENTS (Continued)
Derivatives in Cash Flow Hedging Relationships
The before-tax gains (losses), attributed to the effective portion of cash flow hedges, recognized in other comprehensive income(loss) for each period were as follows:
Gains (Losses)Recognized in OCI on
Derivatives (Effective Portion)
Years Ended(In Millions)
Dec 26,2015
Dec 27,2014
Dec 28,2013
Currency forwards . . . . . . . . . . . . . . . . . . . . . . . . . . . . . . . . . . . . . . . . . . . . . . . . . . . . . . . . . $ (305) $ (587) $ (167)Currency interest rate swaps and other . . . . . . . . . . . . . . . . . . . . . . . . . . . . . . . . . . . . . . . . . 7 (2) 1
Total . . . . . . . . . . . . . . . . . . . . . . . . . . . . . . . . . . . . . . . . . . . . . . . . . . . . . . . . . . . . . . . . . . . $ (298) $ (589) $ (166)
Gains and losses on derivative instruments in cash flow hedging relationships related to hedge ineffectiveness and amountsexcluded from effectiveness testing were insignificant during all periods presented in the preceding tables. Additionally, for allperiods presented, there was an insignificant impact on results of operations from discontinued cash flow hedges, which ariseswhen forecasted transactions are probable of not occurring.
For information on the unrealized holding gains (losses) on derivatives reclassified out of accumulated other comprehensiveincome into the consolidated statements of income, see “Note 24: Other Comprehensive Income (Loss).”
Derivatives in Fair Value Hedging Relationships
The effects of derivative instruments designated as fair value hedges, recognized in interest and other, net for each period wereas follows:
Gains (Losses)Recognized in Statement of Income
on Derivatives
Years Ended(In Millions)
Dec 26,2015
Dec 27,2014
Dec 28,2013
Interest rate swap . . . . . . . . . . . . . . . . . . . . . . . . . . . . . . . . . . . . . . . . . . . . . . . . . . . . . . . . . $ (13) $ — $ —Hedged item . . . . . . . . . . . . . . . . . . . . . . . . . . . . . . . . . . . . . . . . . . . . . . . . . . . . . . . . . . . . . . 13 — —
Total . . . . . . . . . . . . . . . . . . . . . . . . . . . . . . . . . . . . . . . . . . . . . . . . . . . . . . . . . . . . . . . . . . . $ — $ — $ —
There was no ineffectiveness during all periods presented in the preceding table.
Derivatives Not Designated as Hedging Instruments
The effects of derivative instruments not designated as hedging instruments on the consolidated statements of income for eachperiod were as follows:
Years Ended(In Millions)
Location of Gains (Losses)Recognized in Income on Derivatives
Dec 26,2015
Dec 27,2014
Dec 28,2013
Currency forwards Interest and other, net . . . . . . . . . . . . . . . . . . . . . . . . . . . . . $ (50) $ 144 $ 44Currency interest rate swaps Interest and other, net . . . . . . . . . . . . . . . . . . . . . . . . . . . . . 346 456 29Interest rate swaps Interest and other, net . . . . . . . . . . . . . . . . . . . . . . . . . . . . . (6) (3) —Total return swaps Various . . . . . . . . . . . . . . . . . . . . . . . . . . . . . . . . . . . . . . . . . (27) 68 140Other Gains (losses) on equity investments, net . . . . . . . . . . . . . . (11) (6) 6Other Interest and other, net . . . . . . . . . . . . . . . . . . . . . . . . . . . . . (2) — —
Total . . . . . . . . . . . . . . . . . . . . . . . . . . . . . . . . . . . . . . . . . . . . . . . . . . . . . . . . . . . . . . . . . . $ 250 $ 659 $ 219
91

INTEL CORPORATION
NOTES TO CONSOLIDATED FINANCIAL STATEMENTS (Continued)
Note 7: Concentrations of Credit Risk
Financial instruments that potentially subject us to concentrations of credit risk consist principally of investments in debtinstruments, derivative financial instruments, loans receivable, reverse repurchase agreements, and trade receivables. Whenpossible, we enter into master netting arrangements with counterparties to mitigate credit risk in derivative transactions. A masternetting arrangement may allow counterparties to net settle amounts owed to each other as a result of multiple, separate derivativetransactions. For presentation on our consolidated balance sheets, we do not offset fair value amounts recognized for derivativeinstruments under master netting arrangements.
We generally place investments with high-credit-quality counterparties and, by policy, we limit the amount of credit exposure toany one counterparty based on our analysis of that counterparty’s relative credit standing. Substantially all of our investments indebt instruments are in A/A2 or better rated issuances, and a substantial majority of the issuances are rated AA-/Aa3 or better.Our investment policy requires substantially all investments with original maturities at the time of investment of up to six months tobe rated at least A-2/P-2 by Standard & Poor’s/Moody’s, and specifies a higher minimum rating for investments with longermaturities. For instance, investments with maturities of greater than three years generally require a minimum rating of AA-/Aa3 atthe time of investment. Government regulations imposed on investment alternatives of our non-U.S. subsidiaries, or the absenceof A-rated counterparties in certain countries, result in some minor exceptions. Credit-rating criteria for derivative instruments aresimilar to those for other investments. Due to master netting arrangements, the amounts subject to credit risk related to derivativeinstruments are generally limited to the amounts, if any, by which the counterparty’s obligations exceed our obligations with thatcounterparty. As of December 26, 2015, our total credit exposure to any single counterparty, excluding money market fundsinvested in U.S. treasury and U.S. agency securities and reverse repurchase agreements collateralized by treasury and agencysecurities, did not exceed $500 million. To further reduce credit risk, we obtain and secure available collateral from counterpartiesagainst obligations, including securities lending transactions, when we deem it appropriate.
A substantial majority of our trade receivables are derived from sales to original equipment manufacturers and original designmanufacturers. We also have accounts receivable derived from sales to industrial and communications equipment manufacturersin the computing and communications industries. Hewlett-Packard Company, our largest customer in 2014, separated into HPInc. and Hewlett Packard Enterprise Company on November 1, 2015. These entities, together with Dell Inc. and Lenovo GroupLimited, represent our largest customers. Collectively, these customers accounted for 46% of net revenue for 2015 (46% for 2014and 44% for 2013) and 49% of net accounts receivable as of December 26, 2015 (43% as of December 27, 2014). We believethat the net accounts receivable balances from these largest customers do not represent a significant credit risk, based on cashflow forecasts, balance sheet analysis, and past collection experience.
We have adopted credit policies and standards intended to accommodate industry growth and inherent risk. We believe thatcredit risks are moderated by the financial stability of our major customers. We assess credit risk through quantitative andqualitative analysis. From this analysis, we establish shipping and credit limits, and determine whether we will seek to use one ormore credit support protection devices, such as obtaining a parent guarantee, standby letter of credit, or credit insurance.
92

INTEL CORPORATION
NOTES TO CONSOLIDATED FINANCIAL STATEMENTS (Continued)
Note 8: Acquisitions
During 2015, we completed eight acquisitions qualifying as business combinations in exchange for aggregate consideration (netof cash acquired) of $1.0 billion, a substantial majority of which was cash consideration. Substantially all of the consideration wasallocated to goodwill and other intangible assets, such as acquisition-related developed technology and acquisition-relatedcustomer relationships. Included in these acquisitions is our acquisition of Lantiq Semiconductor (Lantiq), intended to extendIntel’s success in cable home gateways into DSL and fiber markets. We acquired Lantiq in the second quarter of 2015 for netcash consideration of $345 million, substantially all of which was allocated to goodwill and intangible assets, such as acquisition-related developed technology and acquisition-related customer relationships. The operating results of Lantiq are included in ourClient Computing Group operating segment.
During 2014, we completed eight acquisitions qualifying as business combinations in exchange for aggregate consideration of$963 million, substantially all cash consideration. A substantial majority of the consideration was allocated to goodwill andacquisition-related developed technology intangible assets. Included in these acquisitions is our acquisition of the AxxiaNetworking Business (Axxia business) of Avago Technologies Limited, intended to accelerate growth in the mobile wireless basestation business. We acquired the Axxia business in the fourth quarter of 2014 for net cash consideration of $650 million,substantially all of which was allocated to goodwill and acquisition-related developed technology intangible assets. The operatingresults of the Axxia business are included in our Data Center Group (DCG) operating segment.
During 2013, we completed 12 acquisitions qualifying as business combinations in exchange for aggregate net cashconsideration of $925 million. Most of the consideration was allocated to goodwill and acquisition-related developed technologyintangible assets. Included in these acquisitions is our acquisition of Stonesoft Oyj (Stonesoft), intended to expand our networksecurity solutions, specifically addressing next-generation firewall products. We acquired Stonesoft in the third quarter of 2013 fornet cash consideration of $381 million, substantially all of which was allocated to goodwill and acquisition-related developedtechnology intangible assets. Stonesoft’s operating results are included in our software and services operating segments.
Acquisitions completed in 2015, 2014, and 2013, both individually and in the aggregate, were not significant to our results ofoperations. For information on the assignment of goodwill to our operating segments, see “Note 10: Goodwill” and for informationon the classification of intangible assets, see “Note 11: Identified Intangible Assets.”
Acquisition of Altera Corporation
During the second quarter of 2015, we entered into a definitive agreement to acquire Altera Corporation (Altera) in an all-cashtransaction. The transaction closed on December 28, 2015, subsequent to our fiscal 2015 year-end. Altera is a globalsemiconductor company that designs and sells programmable semiconductors and related products, including programmablelogic devices, which incorporate field-programmable gate array (FPGAs) and complex programmable logic devices, and highlyintegrated System-on-Chip (SoC) devices. This acquisition is expected to expand our reach within the compute continuum, as thecombination of our leading-edge products and manufacturing process with Altera’s leading FPGA technology is expected toenable new classes of platforms that meet customer needs in the data center and Internet of Things market segments.
Upon completion of the acquisition, each outstanding share of Altera common stock and, subject to certain exceptions, eachshare of Altera common stock underlying vested stock option awards, restricted stock unit awards and performance-basedrestricted stock unit awards were converted into the right to receive $54.00 per share in cash, without interest. During the thirdand fourth quarters of 2015, we issued $9.5 billion in aggregate principal amount of senior unsecured debt, and in the first quarterof 2016 we borrowed $4.0 billion against our short-term credit facility, in order to fund a portion of the total purchase price (net ofcash acquired) of $14.5 billion. For more information on our indebtedness, see “Note 15: Borrowings.”
93

INTEL CORPORATION
NOTES TO CONSOLIDATED FINANCIAL STATEMENTS (Continued)
Since the closing of this acquisition occurred subsequent to our fiscal year-end, the allocation of the purchase price to theunderlying assets acquired and liabilities assumed is subject to a formal valuation process, which has not yet been completed.We will reflect the preliminary valuation of the net assets acquired and the operational results of Altera beginning December 28,2015, the close date of the transaction, in our first quarter of 2016. The purchase price allocation will be finalized as soon aspracticable within the measurement period, but not later than one year following the acquisition close date.
Although the purchase price allocation for this acquisition and pro forma financial information is not yet available, we expect asubstantial majority of the purchase price will be allocated to goodwill and acquisition-related developed technology and otheridentified intangible assets. Additionally, we assumed $1.5 billion of aggregate principal amount of Altera’s outstandingindentures. Altera became a new Intel operating segment called the Programmable Solutions Group upon acquisition.
Note 9: Divestitures
In 2015, we completed three separate divestiture transactions. As a result of these transactions, we received aggregate net cashconsideration of $153 million, included within investing activities on the consolidated statements of cash flows, and recognized again within interest and other, net on the consolidated statements of income.
During the first quarter of 2014, we completed the divestiture of the assets of Intel Media, a business division dedicated to thedevelopment of cloud TV products and services, to Verizon Communications Inc. As a result of the transaction, we receivedaggregate net cash consideration of $150 million, included within investing activities on the consolidated statements of cashflows, and recognized a gain within interest and other, net on the consolidated statements of income.
Note 10: Goodwill
Goodwill activity for each period was as follows:
(In Millions)Dec 27,
2014 Acquisitions
CurrencyExchangeand Other
Dec 26,2015
Client Computing Group . . . . . . . . . . . . . . . . . . . . . . . . . . . . . . . . . . . . . . . . . $ 3,708 $ 370 $ — $ 4,078Data Center Group . . . . . . . . . . . . . . . . . . . . . . . . . . . . . . . . . . . . . . . . . . . . . 2,376 28 — 2,404Internet of Things Group . . . . . . . . . . . . . . . . . . . . . . . . . . . . . . . . . . . . . . . . . 428 — — 428Software and services operating segments . . . . . . . . . . . . . . . . . . . . . . . . . . . 4,236 10 (206) 4,040All other . . . . . . . . . . . . . . . . . . . . . . . . . . . . . . . . . . . . . . . . . . . . . . . . . . . . . . 113 269 — 382
Total . . . . . . . . . . . . . . . . . . . . . . . . . . . . . . . . . . . . . . . . . . . . . . . . . . . . . . . . $ 10,861 $ 677 $ (206) $ 11,332
(In Millions)Dec 28,
2013 Acquisitions
CurrencyExchangeand Other
Dec 27,2014
Client Computing Group . . . . . . . . . . . . . . . . . . . . . . . . . . . . . . . . . . . . . . . . . $ 3,689 $ 19 $ — $ 3,708Data Center Group . . . . . . . . . . . . . . . . . . . . . . . . . . . . . . . . . . . . . . . . . . . . . 1,969 407 — 2,376Internet of Things Group . . . . . . . . . . . . . . . . . . . . . . . . . . . . . . . . . . . . . . . . . 428 — — 428Software and services operating segments . . . . . . . . . . . . . . . . . . . . . . . . . . . 4,409 41 (214) 4,236All other . . . . . . . . . . . . . . . . . . . . . . . . . . . . . . . . . . . . . . . . . . . . . . . . . . . . . . 18 113 (18) 113
Total . . . . . . . . . . . . . . . . . . . . . . . . . . . . . . . . . . . . . . . . . . . . . . . . . . . . . . . . $ 10,513 $ 580 $ (232) $ 10,861
During the first quarter of 2015, we combined the PC Client Group and Mobile and Communications Group to create the ClientComputing Group (CCG). All prior-period amounts have been retrospectively adjusted to reflect this organizational structure. Forfurther information, see “Note 26: Operating Segments and Geographic Information.”
94

INTEL CORPORATION
NOTES TO CONSOLIDATED FINANCIAL STATEMENTS (Continued)
During the fourth quarters of 2015, 2014, and 2013, we completed our annual impairment assessments and we concluded thatgoodwill was not impaired in any of these years. The accumulated impairment losses as of December 26, 2015 were $719 million:$365 million associated with CCG, $275 million associated with DCG, and $79 million associated with the Internet of ThingsGroup.
Note 11: Identified Intangible Assets
Identified intangible assets at the end of each period were as follows:
December 26, 2015
(In Millions)GrossAssets
AccumulatedAmortization Net
Acquisition-related developed technology . . . . . . . . . . . . . . . . . . . . . . . . . . . . . . . . . . . . . $ 2,928 $ (2,276) $ 652Acquisition-related customer relationships . . . . . . . . . . . . . . . . . . . . . . . . . . . . . . . . . . . . 1,738 (1,219) 519Acquisition-related brands . . . . . . . . . . . . . . . . . . . . . . . . . . . . . . . . . . . . . . . . . . . . . . . . . 59 (55) 4Licensed technology and patents . . . . . . . . . . . . . . . . . . . . . . . . . . . . . . . . . . . . . . . . . . . 3,017 (1,200) 1,817
Identified intangible assets subject to amortization . . . . . . . . . . . . . . . . . . . . . . . . . . 7,742 (4,750) 2,992
Acquisition-related brands . . . . . . . . . . . . . . . . . . . . . . . . . . . . . . . . . . . . . . . . . . . . . . . . . 767 — 767Other intangible assets . . . . . . . . . . . . . . . . . . . . . . . . . . . . . . . . . . . . . . . . . . . . . . . . . . . 174 — 174
Identified intangible assets not subject to amortization . . . . . . . . . . . . . . . . . . . . . . . 941 — 941
Total identified intangible assets . . . . . . . . . . . . . . . . . . . . . . . . . . . . . . . . . . . . . . . . . . $ 8,683 $ (4,750) $ 3,933
December 27, 2014
(In Millions)GrossAssets
AccumulatedAmortization Net
Acquisition-related developed technology . . . . . . . . . . . . . . . . . . . . . . . . . . . . . . . . . . . . . $ 3,009 $ (2,192) $ 817Acquisition-related customer relationships . . . . . . . . . . . . . . . . . . . . . . . . . . . . . . . . . . . . 1,698 (1,001) 697Acquisition-related brands . . . . . . . . . . . . . . . . . . . . . . . . . . . . . . . . . . . . . . . . . . . . . . . . . 61 (49) 12Licensed technology and patents . . . . . . . . . . . . . . . . . . . . . . . . . . . . . . . . . . . . . . . . . . . 3,153 (1,224) 1,929
Identified intangible assets subject to amortization . . . . . . . . . . . . . . . . . . . . . . . . . . 7,921 (4,466) 3,455
Acquisition-related brands . . . . . . . . . . . . . . . . . . . . . . . . . . . . . . . . . . . . . . . . . . . . . . . . . 788 — 788Other intangible assets . . . . . . . . . . . . . . . . . . . . . . . . . . . . . . . . . . . . . . . . . . . . . . . . . . . 203 — 203
Identified intangible assets not subject to amortization . . . . . . . . . . . . . . . . . . . . . . . 991 — 991
Total identified intangible assets . . . . . . . . . . . . . . . . . . . . . . . . . . . . . . . . . . . . . . . . . . $ 8,912 $ (4,466) $ 4,446
As a result of our acquisitions and purchases of licensed technology and patents, identified intangible assets recorded for eachperiod and their respective estimated weighted average useful life were as follows:
December 26, 2015 December 27, 2014
GrossAssets
(In Millions)
EstimatedUseful Life(In Years)
GrossAssets
(In Millions)
EstimatedUseful Life(In Years)
Acquisition-related developed technology . . . . . . . . . . . . . . . . . . . . . . . . . . . $ 238 6 $ 175 6Acquisition-related customer relationships . . . . . . . . . . . . . . . . . . . . . . . . . . $ 110 11 $ 79 9Licensed technology and patents . . . . . . . . . . . . . . . . . . . . . . . . . . . . . . . . . $ 176 7 $ 93 8
95

INTEL CORPORATION
NOTES TO CONSOLIDATED FINANCIAL STATEMENTS (Continued)
All intangible assets acquired during 2015 are subject to amortization. During 2014, we acquired other intangible assets of $197million that were not subject to amortization.
Amortization expenses, with presentation location on the consolidated statements of income, for each period were as follows:
Years Ended(In Millions) Location
Dec 26,2015
Dec 27,2014
Dec 28,2013
Acquisition-related developed technology . . . . . . . Cost of sales $ 343 $ 600 $ 576Acquisition-related customer relationships . . . . . . Amortization of acquisition-related
intangibles 258 284 279Acquisition-related brands . . . . . . . . . . . . . . . . . . . Amortization of acquisition-related
intangibles 7 10 12Licensed technology and patents . . . . . . . . . . . . . Cost of sales 282 275 272Other intangible assets . . . . . . . . . . . . . . . . . . . . . Reduction of revenue — — 103
Total amortization expenses . . . . . . . . . . . . . . . . . . . . . . . . . . . . . . . . . . . . . . . . . . . . . . . $ 890 $ 1,169 $ 1,242
Based on identified intangible assets that are subject to amortization as of December 26, 2015 (which do not include intangiblesfrom the Altera acquisition), we expect future amortization expense for each period to be as follows:
(In Millions) 2016 2017 2018 2019 2020
Acquisition-related developed technology . . . . . . . . . . . . . . . . . . . $ 260 $ 115 $ 101 $ 98 $ 64Acquisition-related customer relationships . . . . . . . . . . . . . . . . . . 229 143 42 25 22Acquisition-related brands . . . . . . . . . . . . . . . . . . . . . . . . . . . . . . . 3 — — — —Licensed technology and patents . . . . . . . . . . . . . . . . . . . . . . . . . 282 239 187 186 174
Total future amortization expenses . . . . . . . . . . . . . . . . . . . . . . $ 774 $ 497 $ 330 $ 309 $ 260
Note 12: Other Long-Term Assets
Other long-term assets at the end of each period were as follows:
(In Millions)Dec 26,
2015Dec 27,
2014
Equity method investments . . . . . . . . . . . . . . . . . . . . . . . . . . . . . . . . . . . . . . . . . . . . . . . . . . . . . . . . . . . . $ 1,590 $ 1,446Non-marketable cost method investments . . . . . . . . . . . . . . . . . . . . . . . . . . . . . . . . . . . . . . . . . . . . . . . . . 2,933 1,769Non-current deferred tax assets . . . . . . . . . . . . . . . . . . . . . . . . . . . . . . . . . . . . . . . . . . . . . . . . . . . . . . . . 600 622Pre-payments for property, plant and equipment . . . . . . . . . . . . . . . . . . . . . . . . . . . . . . . . . . . . . . . . . . . . 623 636Loans receivable . . . . . . . . . . . . . . . . . . . . . . . . . . . . . . . . . . . . . . . . . . . . . . . . . . . . . . . . . . . . . . . . . . . . 642 416Grants receivable . . . . . . . . . . . . . . . . . . . . . . . . . . . . . . . . . . . . . . . . . . . . . . . . . . . . . . . . . . . . . . . . . . . . 318 312Reverse repurchase agreements . . . . . . . . . . . . . . . . . . . . . . . . . . . . . . . . . . . . . . . . . . . . . . . . . . . . . . . . 350 350Other . . . . . . . . . . . . . . . . . . . . . . . . . . . . . . . . . . . . . . . . . . . . . . . . . . . . . . . . . . . . . . . . . . . . . . . . . . . . . 679 954
Total other long-term assets . . . . . . . . . . . . . . . . . . . . . . . . . . . . . . . . . . . . . . . . . . . . . . . . . . . . . . . . . . $ 7,735 $ 6,505
As of December 26, 2015, the carrying amount of our non-marketable cost method investments includes $966 million related toour investment in UniSpreadtrum. For further information, see “Note 5: Cash and Investments.”
During 2015, we received and transferred $213 million of equipment from pre-payments for property, plant and equipment toproperty, plant and equipment. Substantially all of the equipment was prepaid in 2012 and 2013. We recognized the pre-payments within operating activities in the consolidated statement of cash flows when we paid for the equipment, and the receiptof the equipment is reflected as a non-cash transaction in the current period.
96

INTEL CORPORATION
NOTES TO CONSOLIDATED FINANCIAL STATEMENTS (Continued)
Note 13: Restructuring and Asset Impairment Charges
Restructuring and asset impairment charges by program for each period were as follows:
Years Ended(In Millions)
Dec 26,2015
Dec 27,2014
Dec 28,2013
2015 restructuring program . . . . . . . . . . . . . . . . . . . . . . . . . . . . . . . . . . . . . . . . . . . . . . . . . . $ 264 $ — $ —2013 restructuring program . . . . . . . . . . . . . . . . . . . . . . . . . . . . . . . . . . . . . . . . . . . . . . . . . . 90 295 240
Total restructuring and asset impairment charges . . . . . . . . . . . . . . . . . . . . . . . . . . . . . $ 354 $ 295 $ 240
2015 Restructuring Program
Beginning in the second quarter of 2015, management approved and commenced implementation of restructuring actions,primarily targeted workforce reductions, as we adjusted resources from areas of disinvestment to areas of investment. Thisprogram was substantially complete by the end of the 2015.
Restructuring and asset impairment charges for the 2015 restructuring program in 2015 were as follows:
Years Ended(In Millions)
Dec 26,2015
Employee severance and benefit arrangements . . . . . . . . . . . . . . . . . . . . . . . . . . . . . . . . . . . . . . . . . . . . . . . . . . . . . . $ 250Asset impairments and other restructuring charges . . . . . . . . . . . . . . . . . . . . . . . . . . . . . . . . . . . . . . . . . . . . . . . . . . . 14
Total restructuring and asset impairment charges . . . . . . . . . . . . . . . . . . . . . . . . . . . . . . . . . . . . . . . . . . . . . . . . . $ 264
Restructuring and asset impairment activities for the 2015 restructuring program in 2015 were as follows:
(In Millions)
EmployeeSeverance
and Benefits
AssetImpairments
and Other Total
Accrued restructuring balance as of December 27, 2014 . . . . . . . . . . . . . . . . . . $ — $ — $ —
Additional accruals . . . . . . . . . . . . . . . . . . . . . . . . . . . . . . . . . . . . . . . . . . . . . . . . . . . 292 14 306Adjustments . . . . . . . . . . . . . . . . . . . . . . . . . . . . . . . . . . . . . . . . . . . . . . . . . . . . . . . . (42) — (42)Cash payments . . . . . . . . . . . . . . . . . . . . . . . . . . . . . . . . . . . . . . . . . . . . . . . . . . . . . (225) (1) (226)Non-cash settlements . . . . . . . . . . . . . . . . . . . . . . . . . . . . . . . . . . . . . . . . . . . . . . . . — (6) (6)
Accrued restructuring balance as of December 26, 2015 . . . . . . . . . . . . . . . . . . $ 25 $ 7 $ 32
We recorded the additional accruals as restructuring and asset impairment charges in the consolidated statements of income andwithin the “all other” operating segments category. A substantial majority of the accrued restructuring balance as of December 26,2015 is expected to be paid within the next 12 months, and was recorded as a current liability within accrued compensation andbenefits on the consolidated balance sheets.
Restructuring actions related to this program that were approved in 2015 impacted approximately 4,000 employees.
97

INTEL CORPORATION
NOTES TO CONSOLIDATED FINANCIAL STATEMENTS (Continued)
2013 Restructuring Program
Beginning in the third quarter of 2013, management approved and commenced implementation of several restructuring actions,including targeted workforce reductions and the exit of certain businesses and facilities. These actions include the wind down ofour 200mm wafer fabrication facility in Massachusetts, which ceased production in the first quarter of 2015, and the closure of ourassembly and test facility in Costa Rica, which ceased production in the fourth quarter of 2014. These targeted reductions willenable us to better align our resources in areas providing the greatest benefit in the current business environment. This programwas substantially complete by the end of 2015.
Restructuring and asset impairment charges for the 2013 restructuring program for each period were as follows:
Years Ended(In Millions)
Dec 26,2015
Dec 27,2014
Dec 28,2013
Employee severance and benefit arrangements . . . . . . . . . . . . . . . . . . . . . . . . . . . . . . . . . . $ 82 $ 265 $ 201Asset impairments and other restructuring charges . . . . . . . . . . . . . . . . . . . . . . . . . . . . . . . 8 30 39
Total restructuring and asset impairment charges . . . . . . . . . . . . . . . . . . . . . . . . . . . . . $ 90 $ 295 $ 240
Restructuring and asset impairment activities for the 2013 restructuring program for each period were as follows:
(In Millions)
EmployeeSeverance
and Benefits
AssetImpairments
and Other Total
Accrued restructuring balance as of December 28, 2013 . . . . . . . . . . . . . . . . . . . $ 183 $ — $ 183
Additional accruals . . . . . . . . . . . . . . . . . . . . . . . . . . . . . . . . . . . . . . . . . . . . . . . . . . . . 252 31 283Adjustments . . . . . . . . . . . . . . . . . . . . . . . . . . . . . . . . . . . . . . . . . . . . . . . . . . . . . . . . . 13 (1) 12Cash payments . . . . . . . . . . . . . . . . . . . . . . . . . . . . . . . . . . . . . . . . . . . . . . . . . . . . . . (327) (6) (333)Non-cash settlements . . . . . . . . . . . . . . . . . . . . . . . . . . . . . . . . . . . . . . . . . . . . . . . . . . — (13) (13)
Accrued restructuring balance as of December 27, 2014 . . . . . . . . . . . . . . . . . . . 121 11 132
Additional accruals . . . . . . . . . . . . . . . . . . . . . . . . . . . . . . . . . . . . . . . . . . . . . . . . . . . . 101 9 110Adjustments . . . . . . . . . . . . . . . . . . . . . . . . . . . . . . . . . . . . . . . . . . . . . . . . . . . . . . . . . (19) (1) (20)Cash payments . . . . . . . . . . . . . . . . . . . . . . . . . . . . . . . . . . . . . . . . . . . . . . . . . . . . . . (171) (10) (181)Non-cash settlements . . . . . . . . . . . . . . . . . . . . . . . . . . . . . . . . . . . . . . . . . . . . . . . . . . — (3) (3)
Accrued restructuring balance as of December 26, 2015 . . . . . . . . . . . . . . . . . . . $ 32 $ 6 $ 38
We recorded the additional accruals and adjustments as restructuring and asset impairment charges in the consolidatedstatements of income and within the “all other” operating segments category. Substantially all of the accrued restructuring balanceas of December 26, 2015 is expected to be paid within the next 12 months, and was recorded as a current liability within accruedcompensation and benefits on the consolidated balance sheets.
Restructuring actions related to this program that were approved in 2015 impacted approximately 940 employees. Since the thirdquarter of 2013, we have incurred a total of $625 million in restructuring and asset impairment charges. These charges include$548 million related to employee severance and benefit arrangements for approximately 8,500 employees, and $77 million inasset impairment charges and other restructuring charges.
98

INTEL CORPORATION
NOTES TO CONSOLIDATED FINANCIAL STATEMENTS (Continued)
Note 14: Deferred Income
Deferred income at the end of each period was as follows:
(In Millions)Dec 26,
2015Dec 27,
2014
Deferred income on shipments of components to distributors . . . . . . . . . . . . . . . . . . . . . . . . . . . . . . . . . . $ 920 $ 944Deferred income from software, services, and other . . . . . . . . . . . . . . . . . . . . . . . . . . . . . . . . . . . . . . . . . 1,268 1,261
Current deferred income . . . . . . . . . . . . . . . . . . . . . . . . . . . . . . . . . . . . . . . . . . . . . . . . . . . . . . . . . . . . . 2,188 2,205
Non-current deferred income from software, services, and other . . . . . . . . . . . . . . . . . . . . . . . . . . . . . . . 530 483
Total deferred income . . . . . . . . . . . . . . . . . . . . . . . . . . . . . . . . . . . . . . . . . . . . . . . . . . . . . . . . . . . . . . . $ 2,718 $ 2,688
We classify non-current deferred income from software, services, and other within other long-term liabilities on the consolidatedbalance sheets.
Note 15: Borrowings
Short-Term Debt
Our short-term debt at the end of each period was as follows:
(In Millions)Dec 26,
2015Dec 27,
2014
Drafts payable . . . . . . . . . . . . . . . . . . . . . . . . . . . . . . . . . . . . . . . . . . . . . . . . . . . . . . . . . . . . . . . . . . . . . . $ 41 $ 16Commercial paper . . . . . . . . . . . . . . . . . . . . . . . . . . . . . . . . . . . . . . . . . . . . . . . . . . . . . . . . . . . . . . . . . . . — 500Current portion of long-term debt . . . . . . . . . . . . . . . . . . . . . . . . . . . . . . . . . . . . . . . . . . . . . . . . . . . . . . . . 2,602 1,088Less: debt issuance costs associated with the current portion of long-term debt . . . . . . . . . . . . . . . . . . . (9) (8)
Total short-term debt . . . . . . . . . . . . . . . . . . . . . . . . . . . . . . . . . . . . . . . . . . . . . . . . . . . . . . . . . . . . . . . . $ 2,634 $ 1,596
We have an ongoing authorization from our Board of Directors to borrow up to $5.0 billion, which our Board of Directors increasedin 2015 from $3.0 billion, under our commercial paper program. Maximum borrowings under our commercial paper program in2015 were $900 million ($2.4 billion in 2014). We had no outstanding commercial paper as of December 26, 2015 ($500 millionas of December 27, 2014). Our commercial paper was rated A-1+ by Standard & Poor’s and P-1 by Moody’s as of December 26,2015.
On December 21, 2015 we entered into a short-term credit facility to borrow up to $5.0 billion in order to facilitate the settlement ofour acquisition of Altera. There were no borrowings outstanding under this credit facility as of December 26, 2015 and it wasclosed in January 2016.
99

INTEL CORPORATION
NOTES TO CONSOLIDATED FINANCIAL STATEMENTS (Continued)
Long-Term Debt
Our indebtedness is carried at amortized cost plus applicable hedge adjustments. Our long-term debt at the end of each periodwas as follows:
(In Millions) Maturity DateStated
Interest RateDec 26,
2015Dec 27,
2014
Fourth quarter 2015 debt issuance of $915 millionSenior notes . . . . . . . . . . . . . . . . . . . . . . . . . . . . . . . . . . . . . . . . December 2045 4.70% $ 908 $ —
Fourth quarter 2015 Australian dollar-denominated debt issuanceof A$800 millionSenior notes1 . . . . . . . . . . . . . . . . . . . . . . . . . . . . . . . . . . . . . . . December 2019 3.25% 181 —Senior notes1 . . . . . . . . . . . . . . . . . . . . . . . . . . . . . . . . . . . . . . . December 2022 4.00% 397 —
Third quarter 2015 debt issuance of $1.0 billion
Senior notes . . . . . . . . . . . . . . . . . . . . . . . . . . . . . . . . . . . . . . . . August 2045 4.90% 1,009 —Third quarter 2015 debt issuance of $7.0 billion
Senior notes . . . . . . . . . . . . . . . . . . . . . . . . . . . . . . . . . . . . . . . . July 2020 2.45% 1,748 —Senior notes . . . . . . . . . . . . . . . . . . . . . . . . . . . . . . . . . . . . . . . . July 2022 3.10% 996 —Senior notes . . . . . . . . . . . . . . . . . . . . . . . . . . . . . . . . . . . . . . . . July 2025 3.70% 2,247 —Senior notes . . . . . . . . . . . . . . . . . . . . . . . . . . . . . . . . . . . . . . . . July 2045 4.90% 1,998 —
2012 debt issuance of $6.2 billion
Senior notes . . . . . . . . . . . . . . . . . . . . . . . . . . . . . . . . . . . . . . . . December 2017 1.35% 2,999 2,998Senior notes . . . . . . . . . . . . . . . . . . . . . . . . . . . . . . . . . . . . . . . . December 2022 2.70% 1,492 1,495Senior notes . . . . . . . . . . . . . . . . . . . . . . . . . . . . . . . . . . . . . . . . December 2032 4.00% 744 744Senior notes . . . . . . . . . . . . . . . . . . . . . . . . . . . . . . . . . . . . . . . . December 2042 4.25% 924 924
2011 debt issuance of $5.0 billion
Senior notes . . . . . . . . . . . . . . . . . . . . . . . . . . . . . . . . . . . . . . . . October 2016 1.95% 1,499 1,499Senior notes . . . . . . . . . . . . . . . . . . . . . . . . . . . . . . . . . . . . . . . . October 2021 3.30% 1,997 1,997Senior notes . . . . . . . . . . . . . . . . . . . . . . . . . . . . . . . . . . . . . . . . October 2041 4.80% 1,490 1,490
2009 debt issuance of $2.0 billion
Junior subordinated convertible debentures . . . . . . . . . . . . . . . . August 2039 3.25% 1,103 1,0882005 debt issuance of $1.6 billion
Junior subordinated convertible debentures . . . . . . . . . . . . . . . . December 2035 2.95% 975 960
Long-term debt . . . . . . . . . . . . . . . . . . . . . . . . . . . . . . . . . . . . . . . 22,707 13,195
Less: current portion of long-term debt . . . . . . . . . . . . . . . . . . . . (2,602) (1,088)Less: debt issuance costs . . . . . . . . . . . . . . . . . . . . . . . . . . . . . . (69) (48)
Total long-term debt . . . . . . . . . . . . . . . . . . . . . . . . . . . . . . . . . . . $ 20,036 $ 12,059
1 To manage foreign currency risk associated with the Australian-dollar-denominated notes issued in 2015, we entered intocurrency interest rate swaps with an aggregate notional amount of $577 million, which effectively converted these notes toU.S.-dollar-denominated notes. For further discussion on our currency interest rate swaps, see “Note 6: Derivative FinancialInstruments.”
Senior Notes
During 2015, we issued a total of $9.5 billion aggregate principal amount of senior unsecured notes to fund a portion of the cashconsideration for our acquisition of Altera. The acquisition of Altera closed on December 28, 2015, subsequent to our fiscal 2015year-end. For more information on the closing of our Altera acquisition, see “Note 8: Acquisitions.”
100

INTEL CORPORATION
NOTES TO CONSOLIDATED FINANCIAL STATEMENTS (Continued)
All of our senior notes pay a fixed rate of interest semiannually. A portion of our fixed coupon payments related to our seniornotes have been swapped for floating rate coupon payments. For more information on our interest rate swaps, see “Note 6:Derivative Financial Instruments.” We may redeem the notes prior to their maturity at our option at specified redemption pricesand subject to certain restrictions. The notes rank equally in right of payment with all of our other existing and future seniorunsecured indebtedness and will effectively rank junior to all liabilities of our subsidiaries.
Convertible Debentures
In 2009 and 2005, we issued junior subordinated convertible debentures due 2039 (2009 debentures) and 2035 (2005debentures), respectively. Both the 2009 and 2005 debentures pay a fixed rate of interest semiannually.
2009Debentures
2005Debentures
Annual stated coupon interest rate . . . . . . . . . . . . . . . . . . . . . . . . . . . . . . . . . . . . . . . . . . . . . . . . . . . . 3.25% 2.95%Annual effective interest rate . . . . . . . . . . . . . . . . . . . . . . . . . . . . . . . . . . . . . . . . . . . . . . . . . . . . . . . . . 7.20% 6.45%
The effective interest rate is based on the rate, at inception, for a similar instrument that does not have a conversion feature.
2009 Debentures. The 2009 debentures have a contingent interest component that requires us to pay interest based on certainthresholds or for certain events, commencing on August 1, 2019. After such date, if the 10-day average trading price of $1,000principal amount of the bond immediately preceding any six-month interest period is less than or equal to $650 or greater than orequal to $1,500, we are required to pay contingent 0.25% or 0.50% annual interest, respectively. The fair value of the relatedcontingent interest embedded derivative was $13 million as of December 26, 2015 ($8 million as of December 27, 2014).
The 2009 debentures are convertible, subject to certain conditions. Holders can surrender the 2009 debentures for conversion ifthe closing price of Intel common stock has been at least 130% of the conversion price then in effect for at least 20 trading daysduring the 30 consecutive trading-day period ending on the last trading day of the preceding fiscal quarter. We will settle anyconversion of the 2009 debentures in cash up to the face value, and any amount in excess of face value will be settled in cash orstock at our option. On or after August 5, 2019, we can redeem, for cash, all or part of the 2009 debentures for the principalamount, plus any accrued and unpaid interest, if the closing price of Intel common stock has been at least 150% of theconversion price then in effect for at least 20 trading days during any 30 consecutive trading-day period. In addition, if certainevents occur in the future, the indentures governing the 2009 debentures provide that each holder of the debentures can, for apre-defined period of time, require us to repurchase the holder’s debentures for the principal amount plus any accrued and unpaidinterest. The 2009 debentures are subordinated in right of payment to any existing and future senior debt and to the otherliabilities of our subsidiaries. We have concluded that the 2009 debentures are not conventional convertible debt instruments andthat the embedded stock conversion options qualify as derivatives. In addition, we have concluded that the embedded conversionoptions would be classified in stockholders’ equity if they were freestanding derivative instruments. As such, the embeddedconversion options are not accounted for separately as derivative liabilities.
101

INTEL CORPORATION
NOTES TO CONSOLIDATED FINANCIAL STATEMENTS (Continued)
2005 Debentures. The 2005 debentures have a contingent interest component that requires us to pay interest based on certainthresholds or for certain events. If the 10-day average trading price of $1,000 principal amount of the bond immediately precedingany six-month interest period is less than or equal to $800 or greater than or equal to $1,300, we are required to pay contingent0.25% or 0.40% annual interest, respectively. As of December 26, 2015, we did not meet either contingent interest threshold. Thefair value of the related contingent interest embedded derivative was $4 million as of December 26, 2015 ($4 million as ofDecember 27, 2014).
The 2005 debentures are convertible into shares of our common stock. Holders can surrender the 2005 debentures forconversion at any time. We can settle any conversion of the 2005 debentures in cash or stock at our option. The 2005 debentureswill become redeemable if the closing price of Intel common stock has been at least 130% of the conversion price then in effectfor at least 20 trading days during any 30 consecutive trading-day period. Once this condition has been met, we can redeem, forcash, all or part of the 2005 debentures for the principal amount, plus any accrued and unpaid interest. In addition, if certainevents occur in the future, the indentures governing the 2005 debentures provide that each holder of the debentures can, for apre-defined period of time, require us to repurchase the holder’s debentures for the principal amount plus any accrued and unpaidinterest. The 2005 debentures are subordinated in right of payment to any existing and future senior debt and to the otherliabilities of our subsidiaries. We have concluded that the 2005 debentures are not conventional convertible debt instruments andthat the embedded stock conversion options qualify as derivatives. In addition, we have concluded that the embedded conversionoptions would be classified in stockholders’ equity if they were freestanding derivative instruments. As such, the embeddedconversion options are not accounted for separately as derivative liabilities.
2009 Debentures 2005 Debentures
(In Millions, Except Per Share Amounts)Dec 26,
2015Dec 27,
2014Dec 26,
2015Dec 27,
2014
Outstanding principal . . . . . . . . . . . . . . . . . . . . . . . . . . . . . . . . . . . . . . . . . . . . . $ 2,000 $ 2,000 $ 1,600 $ 1,600Equity component (including temporary equity) carrying amount . . . . . . . . . . . $ 613 $ 613 $ 466 $ 466Unamortized discount . . . . . . . . . . . . . . . . . . . . . . . . . . . . . . . . . . . . . . . . . . . . $ 897 $ 912 $ 625 $ 640Net debt carrying amount . . . . . . . . . . . . . . . . . . . . . . . . . . . . . . . . . . . . . . . . . . $ 1,103 $ 1,088 $ 975 $ 960Conversion rate (shares of common stock per $1,000 principal amount of
debentures) . . . . . . . . . . . . . . . . . . . . . . . . . . . . . . . . . . . . . . . . . . . . . . . . . . 46.58 46.06 35.82 34.95Effective conversion price (per share of common stock) . . . . . . . . . . . . . . . . . . $ 21.47 $ 21.71 $ 27.92 $ 28.61
In the preceding table, the remaining amortization periods for the unamortized discounts for the 2009 and 2005 debentures areapproximately 24 and 20 years, respectively, as of December 26, 2015.
The conversion rate adjusts for certain events outlined in the indentures governing the 2009 and 2005 debentures, such asquarterly dividend distributions in excess of $0.14 and $0.10 per share for the 2009 and 2005 debentures, respectively, but itdoes not adjust for accrued interest. In addition, the conversion rate will increase for a holder of either the 2009 or 2005debentures who elects to convert the debentures in connection with certain share exchanges, mergers, or consolidationsinvolving Intel.
During the fourth quarter of 2015, the closing stock price conversion right condition of the 2009 debentures continued to be metand the debentures will be convertible at the option of the holders during the first quarter of 2016. As a result, the $1.1 billioncarrying amount of the 2009 debentures was classified as short-term debt on our consolidated balance sheet as of December 26,2015 ($1.1 billion as of December 27, 2014). The excess of the amount of cash payable if converted over the carrying amount ofthe 2009 debentures of $897 million has been classified as temporary equity on our consolidated balance sheet as ofDecember 26, 2015 ($912 million as of December 27, 2014). In future periods, if the closing stock price conversion right conditionis no longer met, all outstanding 2009 debentures would be reclassified to long-term debt and the temporary equity would bereclassified to stockholders’ equity on our consolidated balance sheet.
102

INTEL CORPORATION
NOTES TO CONSOLIDATED FINANCIAL STATEMENTS (Continued)
Debt Maturities
Our aggregate debt maturities based on outstanding principal as of December 26, 2015, by year payable, were as follows:
(In Millions)
2016 . . . . . . . . . . . . . . . . . . . . . . . . . . . . . . . . . . . . . . . . . . . . . . . . . . . . . . . . . . . . . . . . . . . . . . . . . . . . . . . . . . . . . . . . $ 1,5002017 . . . . . . . . . . . . . . . . . . . . . . . . . . . . . . . . . . . . . . . . . . . . . . . . . . . . . . . . . . . . . . . . . . . . . . . . . . . . . . . . . . . . . . . . 3,0002018 . . . . . . . . . . . . . . . . . . . . . . . . . . . . . . . . . . . . . . . . . . . . . . . . . . . . . . . . . . . . . . . . . . . . . . . . . . . . . . . . . . . . . . . . —2019 . . . . . . . . . . . . . . . . . . . . . . . . . . . . . . . . . . . . . . . . . . . . . . . . . . . . . . . . . . . . . . . . . . . . . . . . . . . . . . . . . . . . . . . . 1812020 . . . . . . . . . . . . . . . . . . . . . . . . . . . . . . . . . . . . . . . . . . . . . . . . . . . . . . . . . . . . . . . . . . . . . . . . . . . . . . . . . . . . . . . . 1,7502021 and thereafter . . . . . . . . . . . . . . . . . . . . . . . . . . . . . . . . . . . . . . . . . . . . . . . . . . . . . . . . . . . . . . . . . . . . . . . . . . . . 17,845
Total . . . . . . . . . . . . . . . . . . . . . . . . . . . . . . . . . . . . . . . . . . . . . . . . . . . . . . . . . . . . . . . . . . . . . . . . . . . . . . . . . . . . . . . $ 24,276
In the preceding table, the 2009 debentures are classified based on their stated maturity date, regardless of their classification onthe consolidated balance sheet.
Note 16: Retirement Benefit Plans
Retirement Contribution Plans
We provide tax-qualified retirement contribution plans for the benefit of eligible employees, former employees, and retirees in theU.S. and certain other countries. The plans are designed to provide employees with an accumulation of funds for retirement on atax-deferred basis. Employees hired prior to January 1, 2011 are eligible for and receive discretionary employer contributions inthe U.S. Intel Retirement Contribution Plan. Employees hired on or after January 1, 2011 receive discretionary employercontributions in the Intel 401(k) Savings Plan, which are participant-directed. Our Chief Executive Officer (CEO) determines theannual discretionary employer contribution amounts for the U.S. Intel Retirement Contribution Plan and the Intel 401(k) SavingsPlan under delegation of authority from our Board of Directors, pursuant to the terms of the plans. Effective January 1, 2015, theU.S. Intel Retirement Contribution plan assets and future discretionary employer contributions are participant-directed.
For the benefit of eligible U.S. employees, we also provide a non-tax-qualified supplemental deferred compensation plan forcertain highly compensated employees. This plan is designed to permit certain discretionary employer contributions and to permitemployees to defer a portion of compensation in addition to their Intel 401(k) Savings Plan deferrals. This plan is unfunded.
We expensed $337 million for the qualified and non-qualified U.S. retirement contribution plans in 2015 ($286 million in 2014 and$298 million in 2013). In the first quarter of 2016, we funded $318 million for the 2015 contributions to the qualified U.S. retirementcontribution plans.
Pension and Postretirement Benefit Plans
U.S. Pension Benefits. For employees hired prior to January 1, 2011, we provide a tax-qualified defined-benefit pension plan, theU.S. Intel Minimum Pension Plan, for eligible employees, former employees, and retirees in the U.S. Beginning on January 1,2015, future benefit accruals in the U.S. Intel Minimum Pension Plan were frozen to all employees at or above a specific gradelevel, and generally covering all highly compensated employees in the plan. Starting in 2016, the impacted employees will receivediscretionary employer contributions in the Intel 401(k) Savings Plan, instead of the Retirement Contribution plan. This changewas contingent on receiving a favorable private letter ruling from the U.S. Internal Revenue Service (IRS), which we received inOctober 2014. As a result, our projected benefit obligation was reduced by $1.1 billion in 2014, most of which was also includedas a change in actuarial valuation on the consolidated statements of comprehensive income.
103

INTEL CORPORATION
NOTES TO CONSOLIDATED FINANCIAL STATEMENTS (Continued)
The U.S. Intel Minimum Pension Plan benefit is determined by a participant’s years of service and final average compensation, asdefined by the plan document. The plan generates a minimum pension benefit if the participants’ U.S. Intel Minimum PensionPlan benefit exceeds the annuitized value of their U.S. Intel Retirement Contribution Plan benefit. If participant balances in theU.S. Intel Retirement Contribution Plan do not grow sufficiently, the projected benefit obligation of the U.S. Intel Minimum PensionPlan could increase significantly. Consistent with applicable law, assets of the U.S. Intel Minimum Pension Plan are held in trust,solely for the benefit of plan participants, and are not available for general corporate purposes.
Non-U.S. Pension Benefits. We also provide defined-benefit pension plans in certain other countries, most significantly Ireland,Israel, and Germany. Consistent with the requirements of local law, we deposit funds for certain plans with insurance companies,with third-party trustees, or into government-managed accounts, and/or accrue for the unfunded portion of the obligation. TheIreland pension plan and one of our Germany pension plans were closed to employees hired on or after June 20, 2012 andJanuary 1, 2014, respectively.
U.S. Postretirement Medical Benefits. Upon retirement, eligible U.S. employees who were hired prior to January 1, 2014 arecredited with a defined dollar amount, based on years of service, into a U.S. Sheltered Employee Retirement Medical Account(SERMA). These credits can be used to pay all or a portion of the cost to purchase coverage in the retiree’s choice of medicalplan. If the available credits are not sufficient to pay the entire cost of the coverage, the remaining cost is the retiree’sresponsibility. Employees hired on or after January 1, 2014 are not eligible to earn a SERMA benefit.
Funding Policy. Our practice is to fund the various pension plans in amounts sufficient to meet the minimum requirements ofapplicable local laws and regulations. Additional funding may be provided as deemed appropriate. Funding for the U.S.postretirement medical benefits plan is discretionary under applicable laws and regulations, and is reviewed annually; additionalfunding may be provided as deemed appropriate. Depending on the design of the plan, local customs, and market circumstances,the liabilities of a plan may exceed qualified plan assets.
Benefit Obligation and Plan Assets
The vested benefit obligation for a defined benefit pension plan is the actuarial present value of the vested benefits to which theemployee is currently entitled based on the employee’s expected date of separation or retirement. The changes in the projectedbenefit obligations and plan assets at the end of each period for the plans described above were as follows:
U.S. Pension BenefitsNon-U.S. Pension
BenefitsU.S. Postretirement
Medical Benefits
(In Millions)Dec 26,
2015Dec 27,
2014Dec 26,
2015Dec 27,
2014Dec 26,
2015Dec 27,
2014
Beginning projected benefit obligation . . . . . . . . . $ 892 $ 1,137 $ 2,423 $ 1,695 $ 546 $ 509
Service cost . . . . . . . . . . . . . . . . . . . . . . . . . . . . . . . . 18 88 128 104 30 26Interest cost . . . . . . . . . . . . . . . . . . . . . . . . . . . . . . . . 33 49 63 66 21 23Actuarial (gain) loss . . . . . . . . . . . . . . . . . . . . . . . . . . 126 760 (250) 767 (21) 10Currency exchange rate changes . . . . . . . . . . . . . . . — — (190) (254) — —Plan curtailments . . . . . . . . . . . . . . . . . . . . . . . . . . . . — (1,083) — — — —Other . . . . . . . . . . . . . . . . . . . . . . . . . . . . . . . . . . . . . (79) (59) (34) 45 (16) (22)
Ending projected benefit obligation . . . . . . . . . . . . $ 990 $ 892 $ 2,140 $ 2,423 $ 560 $ 546
104

INTEL CORPORATION
NOTES TO CONSOLIDATED FINANCIAL STATEMENTS (Continued)
U.S. Pension BenefitsNon-U.S. Pension
BenefitsU.S. Postretirement
Medical Benefits
(In Millions)Dec 26,
2015Dec 27,
2014Dec 26,
2015Dec 27,
2014Dec 26,
2015Dec 27,
2014
Beginning fair value of plan assets . . . . . . . . . . . . $ 623 $ 649 $ 1,017 $ 1,005 $ 427 $ 395
Actual return on plan assets . . . . . . . . . . . . . . . . . . . (4) 30 42 80 6 33Employer contributions . . . . . . . . . . . . . . . . . . . . . . . 90 — 72 73 1 —Currency exchange rate changes . . . . . . . . . . . . . . . — — (66) (114) — —Other . . . . . . . . . . . . . . . . . . . . . . . . . . . . . . . . . . . . . (82) (56) (54) (27) (24) (1)
Ending fair value of plan assets . . . . . . . . . . . . . . . $ 627 $ 623 $ 1,011 $ 1,017 $ 410 $ 427
The amounts recognized on the consolidated balance sheets at the end of each period were as follows:
U.S. Pension BenefitsNon-U.S. Pension
BenefitsU.S. Postretirement
Medical Benefits
(In Millions)Dec 26,
2015Dec 27,
2014Dec 26,
2015Dec 27,
2014Dec 26,
2015Dec 27,
2014
Other long-term assets . . . . . . . . . . . . . . . . . . . . . . . $ — $ — $ 15 $ 14 $ — $ —Other long-term liabilities . . . . . . . . . . . . . . . . . . . . . . (363) (269) (1,144) (1,420) (150) (119)Accumulated other comprehensive loss (income),
before tax . . . . . . . . . . . . . . . . . . . . . . . . . . . . . . . . 158 1 908 1,217 39 33
Net amount recognized . . . . . . . . . . . . . . . . . . . . . . $ (205) $ (268) $ (221) $ (189) $ (111) $ (86)
The amounts recorded in accumulated other comprehensive income (loss) before taxes at the end of each period were asfollows:
U.S. Pension BenefitsNon-U.S. Pension
BenefitsU.S. Postretirement
Medical Benefits
Years Ended(In Millions)
Dec 26,2015
Dec 27,2014
Dec 26,2015
Dec 27,2014
Dec 26,2015
Dec 27,2014
Net prior service credit (cost) . . . . . . . . . . . . . . . . . . . $ — $ — $ (12) $ (13) $ (43) $ (48)Net actuarial gain (loss) . . . . . . . . . . . . . . . . . . . . . . . (158) (1) (896) (1,204) 4 15
Accumulated other comprehensive income(loss), before tax . . . . . . . . . . . . . . . . . . . . . . . . . $ (158) $ (1) $ (908) $ (1,217) $ (39) $ (33)
We use a corridor approach to amortize actuarial gains and losses. Under this approach, net actuarial gains or losses in excessof 10% of the larger of the projected benefit obligation or the fair value of plan assets are amortized on a straight-line basis. Theperiod of amortization is the average remaining service of active participants who are expected to receive benefits under theplans.
105

INTEL CORPORATION
NOTES TO CONSOLIDATED FINANCIAL STATEMENTS (Continued)
As of December 26, 2015, the accumulated benefit obligation was $899 million for the U.S. Intel Minimum Pension Plan ($808million as of December 27, 2014) and $1.6 billion for the non-U.S. defined-benefit pension plans ($1.7 billion as of December 27,2014). Included in the aggregate data in the following tables are the amounts applicable to our pension plans with accumulatedbenefit obligations in excess of plan assets, as well as plans with projected benefit obligations in excess of plan assets. Amountsrelated to such plans at the end of each period were as follows:
U.S. Pension BenefitsNon-U.S. Pension
Benefits
(In Millions)Dec 26,
2015Dec 27,
2014Dec 26,
2015Dec 27,
2014
Plans with accumulated benefit obligations in excess of plan assets:Accumulated benefit obligations . . . . . . . . . . . . . . . . . . . . . . . . . . . . . . . . . . . . . $ 899 $ 808 $ 1,239 $ 1,344Plan assets . . . . . . . . . . . . . . . . . . . . . . . . . . . . . . . . . . . . . . . . . . . . . . . . . . . . . $ 627 $ 623 $ 645 $ 616
Plans with projected benefit obligations in excess of plan assets:Projected benefit obligations . . . . . . . . . . . . . . . . . . . . . . . . . . . . . . . . . . . . . . . . $ 990 $ 892 $ 2,079 $ 2,361Plan assets . . . . . . . . . . . . . . . . . . . . . . . . . . . . . . . . . . . . . . . . . . . . . . . . . . . . . $ 627 $ 623 $ 934 $ 941
On a worldwide basis, our pension and postretirement benefit plans were 55% funded as of December 26, 2015. The U.S. IntelMinimum Pension Plan, which accounts for 27% of the worldwide pension and postretirement benefit obligations, was 63%funded. Funded status is not indicative of our ability to pay ongoing pension benefits or of our obligation to fund retirement trusts.Required pension funding for U.S. retirement plans is determined in accordance with the Employee Retirement Income SecurityAct (ERISA), which sets required minimum contributions. Cumulative company funding to the U.S. Intel Minimum Pension Plancurrently exceeds the minimum ERISA funding requirements.
Assumptions
Weighted average actuarial assumptions used to determine benefit obligations for the plans at the end of each period were asfollows:
U.S. PensionBenefits
Non-U.S. PensionBenefits
U.S. PostretirementMedical Benefits
Dec 26,2015
Dec 27,2014
Dec 26,2015
Dec 27,2014
Dec 26,2015
Dec 27,2014
Discount rate . . . . . . . . . . . . . . . . . . . . . . . . . . . . . . . . . . . 4.0% 3.8% 3.1% 2.7% 4.1% 4.1%Rate of compensation increase . . . . . . . . . . . . . . . . . . . . . 3.7% 3.8% 3.8% 4.0% n/a n/a
Weighted average actuarial assumptions used to determine costs for the plans for each period were as follows:
U.S. Pension Benefits Non-U.S. Pension BenefitsU.S. Postretirement
Medical Benefits
2015 2014 2013 2015 2014 2013 2015 2014 2013
Discount rate . . . . . . . . . . . . . . . . . . . . . 3.8% 4.6% 3.9% 2.8% 4.0% 4.2% 3.9% 4.6% 4.2%Expected long-term rate of return on
plan assets . . . . . . . . . . . . . . . . . . . . 6.1% 5.4% 4.5% 5.7% 5.7% 5.2% 7.4% 7.4% 7.7%Rate of compensation increase . . . . . . . 3.8% 3.8% 4.1% 4.0% 4.1% 4.3% n/a n/a n/a
For the U.S. plans, we developed the discount rate by calculating the benefit payment streams by year to determine when benefitpayments will be due. We then matched the benefit payment streams by year to the AA corporate bond rates to match the timingand amount of the expected benefit payments and discounted back to the measurement date to determine the appropriatediscount rate. For the non-U.S. plans, we used two approaches to develop the discount rate. In certain countries, we used amodel consisting of a theoretical bond portfolio for which the timing and amount of cash flows approximated the estimated benefitpayments of our pension plans. In other countries, we analyzed current market long-term bond rates and matched the bondmaturity with the average duration of the pension liabilities.
106

INTEL CORPORATION
NOTES TO CONSOLIDATED FINANCIAL STATEMENTS (Continued)
The expected long-term rate of return on plan assets assumptions takes into consideration both duration and risk of theinvestment portfolios, and is developed through consensus and building-block methodologies. The consensus methodologyincludes unadjusted estimates by the fund manager on future market expectations by broad asset classes and geography. Thebuilding-block approach determines the rates of return implied by historical risk premiums across asset classes. In addition, weanalyze rates of return relevant to the country where each plan is in effect and the investments applicable to the plan,expectations of future returns, local actuarial projections, and the projected long-term rates of return from external investmentmanagers. The expected long-term rate of return on plan assets shown for the non-U.S. plan assets is weighted to reflect eachcountry’s relative portion of the non-U.S. plan assets.
Net Periodic Benefit Cost
In 2015, the net periodic benefit cost for U.S. pension benefits, non-U.S. pension benefits, and U.S. postretirement medicalbenefits was $26 million ($36 million in 2014 and $230 million in 2013), $198 million ($165 million in 2014 and $116 million in2013) and $26 million ($17 million in 2014 and $77 million in 2013), respectively.
The decrease in the U.S. net periodic pension benefit cost in 2014 compared to 2013 is primarily attributed to the one-timecurtailment gain related to the freeze of future benefit accruals and lower recognized net actuarial losses.
U.S. Pension Plan Assets
In general, the investment strategy for U.S. Intel Minimum Pension Plan assets is to maximize risk-adjusted returns, taking intoconsideration the investment horizon and expected volatility to help ensure that there are sufficient assets available to paypension benefits as they come due. The allocation to each asset class will fluctuate with market conditions, such as volatility andliquidity concerns, and will typically be rebalanced when outside the target ranges, which were 55% for equity investments and45% for fixed-income investments in 2015. For 2016, the expected long-term rate of return for the U.S. Intel Minimum PensionPlan assets is 5.6%.
U.S. Intel Minimum Pension Plan assets measured at fair value on a recurring basis consisted of the following investmentcategories at the end of each period:
December 26, 2015 Dec 27, 2014
Fair Value Measured at Reporting Date Using
(In Millions) Level 1 Level 2 Level 3 Total Total
Equity securities . . . . . . . . . . . . . . . . . . . . . . . . . . . . . $ 54 $ 314 $ — $ 368 $ 347Fixed income . . . . . . . . . . . . . . . . . . . . . . . . . . . . . . . 16 201 38 255 254Other investments . . . . . . . . . . . . . . . . . . . . . . . . . . . 4 — — 4 20
Total assets measured at fair value . . . . . . . . . . . . $ 74 $ 515 $ 38 $ 627 $ 621
Cash . . . . . . . . . . . . . . . . . . . . . . . . . . . . . . . . . . . . . . — 2
Total U.S. pension plan assets at fair value . . . . . $ 627 $ 623
A substantial majority of the fixed income investments in the preceding table are asset-backed securities, corporate debt, andgovernment debt. Government debt includes instruments such as non-U.S. government securities, U.S. agency securities, andU.S. treasury securities.
107

INTEL CORPORATION
NOTES TO CONSOLIDATED FINANCIAL STATEMENTS (Continued)
Non-U.S. Plan Assets
The investments of the non-U.S. plans are managed by insurance companies, pension funds, or third-party trustees, consistentwith regulations or market practice of the country where the assets are invested. The investment manager makes investmentdecisions within the guidelines set by Intel or local regulations. The investment manager evaluates performance by comparing theactual rate of return to the return on similar assets. Investments managed by qualified insurance companies or pension fundsunder standard contracts follow local regulations, and we are not actively involved in their investment strategies. For the assetsthat we have discretion to set investment guidelines, the assets are invested in developed country equity investments and fixed-income investments, either through index funds or direct investment. In general, the investment strategy is designed toaccumulate a diversified portfolio among markets, asset classes, or individual securities to reduce market risk and to help ensurethat the pension assets are available to pay benefits as they come due. The target allocation of the non-U.S. plan assets that wehave control over is 50% equity investments and 50% fixed-income investments. For 2016, the average expected long-term rateof return for the non-U.S. plan assets is 5.3%.
Non-U.S. plan assets measured at fair value on a recurring basis consisted of the following investment categories at the end ofeach period:
December 26, 2015 Dec 27, 2014
Fair Value Measured at Reporting Date Using
(In Millions) Level 1 Level 2 Level 3 Total Total
Equity securities . . . . . . . . . . . . . . . . . . . . . . . . . . . . . $ 274 $ 56 $ 15 $ 345 $ 521Fixed income . . . . . . . . . . . . . . . . . . . . . . . . . . . . . . . — 610 34 644 476
Total assets measured at fair value . . . . . . . . . . . . $ 274 $ 666 $ 49 $ 989 $ 997
Cash . . . . . . . . . . . . . . . . . . . . . . . . . . . . . . . . . . . . . . 22 20
Total non-U.S. plan assets at fair value . . . . . . . . . $ 1,011 $ 1,017
Substantially all of the equity investments in the preceding table are invested in a diversified mix of equities of developedcountries, including the U.S., and emerging markets throughout the world.
The majority of the fixed income investments in the preceding table are investments held by insurance companies and insurancecontracts that are managed by qualified insurance companies. We do not have control over the target allocation or visibility of theinvestment strategies of those investments. Insurance contracts and investments held by insurance companies made up 33% oftotal non-U.S. plan assets as of December 26, 2015 (35% as of December 27, 2014).
U.S. Postretirement Medical Plan Assets
In general, the investment strategy for U.S. postretirement medical benefits plan assets is to invest primarily in liquid assets, dueto the level of expected future benefit payments. The assets are invested solely in a tax-aware global equity portfolio, which isactively managed by an external investment manager. The tax-aware global equity portfolio is composed of a diversified mix ofequities in developed countries, including the U.S., and emerging markets throughout the world. For 2016, the expected long-termrate of return for the U.S. postretirement medical benefits plan assets is 7%. As of December 26, 2015, substantially all of theU.S. postretirement medical benefits plan assets were invested in exchange-traded equity securities and were measured at fairvalue using Level 1 inputs.
Concentrations of Risk
We manage a variety of risks, including credit, liquidity, and market risks, across our plan assets through our investmentmanagers. We define a concentration of risk as an undiversified exposure to one of the aforementioned risks that unnecessarilyincreases the exposure to a loss of plan assets. We monitor exposure to such risks in both the U.S. and non-U.S. plans bymonitoring the magnitude of the risk in each plan and diversifying our exposure to such risks across a variety of counterparties,instruments, and markets. As of December 26, 2015, we did not have concentrations of risk in any single entity, manager,counterparty, sector, industry, or country.
108

INTEL CORPORATION
NOTES TO CONSOLIDATED FINANCIAL STATEMENTS (Continued)
Funding Expectations
Under applicable law for the U.S. Intel Minimum Pension Plan, we are required to contribute a minimum of approximately $10million during 2016. Our expected required funding for the non-U.S. plans during 2016 is approximately $58 million.
Estimated Future Benefit Payments
Estimated benefit payments over the next 10 fiscal years are as follows:
(In Millions)U.S. Pension
Benefits
Non-U.S.PensionBenefits
U.S.Postretirement
MedicalBenefits
2016 . . . . . . . . . . . . . . . . . . . . . . . . . . . . . . . . . . . . . . . . . . . . . . . . . . . . . . . . . . . . . . $ 57 $ 26 $ 192017 . . . . . . . . . . . . . . . . . . . . . . . . . . . . . . . . . . . . . . . . . . . . . . . . . . . . . . . . . . . . . . $ 61 $ 28 $ 212018 . . . . . . . . . . . . . . . . . . . . . . . . . . . . . . . . . . . . . . . . . . . . . . . . . . . . . . . . . . . . . . $ 69 $ 31 $ 242019 . . . . . . . . . . . . . . . . . . . . . . . . . . . . . . . . . . . . . . . . . . . . . . . . . . . . . . . . . . . . . . $ 70 $ 34 $ 272020 . . . . . . . . . . . . . . . . . . . . . . . . . . . . . . . . . . . . . . . . . . . . . . . . . . . . . . . . . . . . . . $ 70 $ 37 $ 312021-2025 . . . . . . . . . . . . . . . . . . . . . . . . . . . . . . . . . . . . . . . . . . . . . . . . . . . . . . . . . $ 362 $ 251 $ 214
Note 17: Commitments
A portion of our capital equipment and certain facilities are under operating leases that expire at various dates through 2030.Additionally, portions of our real property are under leases that expire at various dates through 2062. Rental expense was $253million in 2015 ($257 million in 2014 and $270 million in 2013).
Minimum rental commitments under all non-cancelable leases with an initial term in excess of one year were as follows as ofDecember 26, 2015:
(In Millions)
2016 . . . . . . . . . . . . . . . . . . . . . . . . . . . . . . . . . . . . . . . . . . . . . . . . . . . . . . . . . . . . . . . . . . . . . . . . . . . . . . . . . . . . . . . . $ 2342017 . . . . . . . . . . . . . . . . . . . . . . . . . . . . . . . . . . . . . . . . . . . . . . . . . . . . . . . . . . . . . . . . . . . . . . . . . . . . . . . . . . . . . . . . 2092018 . . . . . . . . . . . . . . . . . . . . . . . . . . . . . . . . . . . . . . . . . . . . . . . . . . . . . . . . . . . . . . . . . . . . . . . . . . . . . . . . . . . . . . . . 1672019 . . . . . . . . . . . . . . . . . . . . . . . . . . . . . . . . . . . . . . . . . . . . . . . . . . . . . . . . . . . . . . . . . . . . . . . . . . . . . . . . . . . . . . . . 1442020 . . . . . . . . . . . . . . . . . . . . . . . . . . . . . . . . . . . . . . . . . . . . . . . . . . . . . . . . . . . . . . . . . . . . . . . . . . . . . . . . . . . . . . . . 1202021 and thereafter . . . . . . . . . . . . . . . . . . . . . . . . . . . . . . . . . . . . . . . . . . . . . . . . . . . . . . . . . . . . . . . . . . . . . . . . . . . . 326
Total . . . . . . . . . . . . . . . . . . . . . . . . . . . . . . . . . . . . . . . . . . . . . . . . . . . . . . . . . . . . . . . . . . . . . . . . . . . . . . . . . . . . . . . $ 1,200
Commitments for construction or purchase of property, plant and equipment totaled $5.7 billion as of December 26, 2015 ($3.5billion as of December 27, 2014), a majority of which will be due within the next 12 months. Other purchase obligations andcommitments totaled approximately $4.0 billion as of December 26, 2015 (approximately $2.5 billion as of December 27, 2014).Other purchase obligations and commitments include payments due under various types of licenses and agreements to purchasegoods or services, as well as payments due under non-contingent funding obligations. Funding obligations include agreements tofund various projects with other companies. In addition, we have various contractual commitments with Micron and IMFT. Forfurther information on these contractual commitments, see “Note 5: Cash and Investments.”
During 2012, we entered into a series of agreements with ASML Holding N.V. (ASML) intended to accelerate the development ofextreme ultraviolet lithography projects and deep ultraviolet immersion lithography projects, including generic developmentsapplicable to both 300mm and 450mm. Certain of these agreements were amended in 2014. Under the amended agreements,Intel agreed to provide R&D funding totaling €829 million over five years and committed to advance purchase orders for aspecified number of tools from ASML. Our remaining obligation, contingent upon ASML achieving certain milestones, isapproximately €367 million, or $403 million, as of December 26, 2015. As our obligation is contingent upon ASML achievingcertain milestones, we have excluded this obligation from other purchase obligations and commitments.
109

INTEL CORPORATION
NOTES TO CONSOLIDATED FINANCIAL STATEMENTS (Continued)
Note 18: Employee Equity Incentive Plans
Our equity incentive plans are broad-based, long-term programs intended to attract and retain talented employees and alignstockholder and employee interests.
In May 2015, stockholders approved an extension of the expiration date of the 2006 Equity Incentive Plan (the 2006 Plan) to June2018 and approved an additional 34 million shares for issuance. Under the 2006 Plan, 753 million shares of common stock areavailable for issuance as equity awards to employees and non-employee directors through June 2018. As of December 26, 2015,258.4 million shares of common stock remained available for issuance under the 2006 Plan.
Going forward, we may assume the equity incentive plans and the outstanding equity awards of certain acquired companies.Once they are assumed, we do not grant additional shares of common stock under those plans. The stock options and RSUsassumed generally retain their terms and conditions as they were originally granted.
We grant restricted stock units with both a market condition and a service condition (market-based restricted stock units), referredto in our 2015 Proxy Statement as outperformance stock units (OSUs), to a group of senior officers, employees, and non-employee directors. For OSUs granted in 2015, the number of shares of our common stock to be received at vesting will rangefrom 0% to 200% of the target amount, based on total stockholder return (TSR) on our common stock measured against thebenchmark TSR of a peer group over a three-year period. TSR is a measure of stock price appreciation plus any dividends paidin this performance period. As of December 26, 2015, 4.7 million OSUs were outstanding. These OSUs accrue dividendequivalents and generally vest three years and one month from the grant date. RSU and option awards generally vest over fouryears from the grant date. Stock options generally expire seven years from the date of grant.
In May 2015, stockholders approved an extension of the expiration date of the 2006 Stock Purchase Plan to August 2021. The2006 Stock Purchase Plan allows eligible employees to purchase shares of our common stock at 85% of the value of ourcommon stock on specific dates. Under the 2006 Stock Purchase Plan, 373 million shares of common stock are available forissuance through August 2021. As of December 26, 2015, 181.3 million shares of common stock were available for issuanceunder the 2006 Stock Purchase Plan.
Share-Based Compensation
Share-based compensation recognized in 2015 was $1.3 billion ($1.1 billion in 2014 and $1.1 billion in 2013).
On a quarterly basis, we assess changes to our estimate of expected equity award forfeitures based on our review of recentforfeiture activity and expected future employee turnover. We recognize the effect of adjustments made to the forfeiture rates, ifany, in the period that we change the forfeiture estimate. The effect of forfeiture rate adjustments in all periods presented was notsignificant.
The total share-based compensation cost capitalized as part of inventory as of December 26, 2015 was $49 million ($39 millionas of December 27, 2014 and $38 million as of December 28, 2013). During 2015, the tax benefit that we realized for the taxdeduction from share-based awards totaled $533 million ($555 million in 2014 and $385 million in 2013).
110

INTEL CORPORATION
NOTES TO CONSOLIDATED FINANCIAL STATEMENTS (Continued)
We estimate the fair value of RSUs with time-based vesting using the value of our common stock on the date of grant, reduced bythe present value of dividends expected to be paid on our shares of common stock prior to vesting. We estimate the fair value ofOSUs using a Monte Carlo simulation model on the date of grant. We based the weighted average estimated value of RSUgrants, as well as the weighted average assumptions that we used in calculating the fair value, on estimates at the date of grant,for each period as follows:
Dec 26,2015
Dec 27,2014
Dec 28,2013
Estimated values . . . . . . . . . . . . . . . . . . . . . . . . . . . . . . . . . . . . . . . . . . . . . . . . . . . . . . . . . . . . . $ 31.63 $ 25.40 $ 21.45Risk-free interest rate . . . . . . . . . . . . . . . . . . . . . . . . . . . . . . . . . . . . . . . . . . . . . . . . . . . . . . . . . . 0.6% 0.5% 0.2%Dividend yield . . . . . . . . . . . . . . . . . . . . . . . . . . . . . . . . . . . . . . . . . . . . . . . . . . . . . . . . . . . . . . . . 2.9% 3.3% 3.8%Volatility . . . . . . . . . . . . . . . . . . . . . . . . . . . . . . . . . . . . . . . . . . . . . . . . . . . . . . . . . . . . . . . . . . . . 27% 23% 25%
We use the Black-Scholes option pricing model to estimate the fair value of options granted under the 2006 Plan and rights toacquire shares of common stock granted under the 2006 Stock Purchase Plan. No options were granted in 2015. We based theweighted average estimated value of employee stock option grants and rights granted under the stock purchase plan, as well asthe weighted average assumptions used in calculating the fair value, on estimates at the date of grant, for each period as follows:
Stock Options Stock Purchase Plan
Dec 26,2015
Dec 27,2014
Dec 28,2013
Dec 26,2015
Dec 27,2014
Dec 28,2013
Estimated values . . . . . . . . . . . . . . . . . . . . . . . . . . . . . . . . . . n/a $ 3.61 $ 3.11 $ 6.56 $ 5.87 $ 4.52Expected life (in years) . . . . . . . . . . . . . . . . . . . . . . . . . . . . . n/a 5.1 5.2 0.5 0.5 0.5Risk-free interest rate . . . . . . . . . . . . . . . . . . . . . . . . . . . . . . . n/a 1.7% 0.8% 0.1% 0.1% 0.1%Dividend yield . . . . . . . . . . . . . . . . . . . . . . . . . . . . . . . . . . . . . n/a 3.6% 3.9% 3.1% 3.2% 4.0%Volatility . . . . . . . . . . . . . . . . . . . . . . . . . . . . . . . . . . . . . . . . . n/a 23% 25% 25% 22% 22%
We base the expected volatility on implied volatility because we have determined that implied volatility is more reflective of marketconditions and a better indicator of expected volatility than historical volatility. We use historical option exercise data as the basisfor determining expected life, as we believe that historical data provides a reasonable basis upon which to estimate the expectedlife input for valuing options using the Black-Scholes model.
Restricted Stock Unit Awards
Restricted stock unit activity for each period was as follows:
Number ofRSUs
(In Millions)
WeightedAverage
Grant-DateFair Value
December 29, 2012 . . . . . . . . . . . . . . . . . . . . . . . . . . . . . . . . . . . . . . . . . . . . . . . . . . . . . . . . . . . . . . . . . 109.3 $ 22.03
Granted . . . . . . . . . . . . . . . . . . . . . . . . . . . . . . . . . . . . . . . . . . . . . . . . . . . . . . . . . . . . . . . . . . . . . . . . . . 53.4 $ 21.45Vested . . . . . . . . . . . . . . . . . . . . . . . . . . . . . . . . . . . . . . . . . . . . . . . . . . . . . . . . . . . . . . . . . . . . . . . . . . . (44.5) $ 20.21Forfeited . . . . . . . . . . . . . . . . . . . . . . . . . . . . . . . . . . . . . . . . . . . . . . . . . . . . . . . . . . . . . . . . . . . . . . . . . . (4.9) $ 22.06
December 28, 2013 . . . . . . . . . . . . . . . . . . . . . . . . . . . . . . . . . . . . . . . . . . . . . . . . . . . . . . . . . . . . . . . . . 113.3 $ 22.47
Granted . . . . . . . . . . . . . . . . . . . . . . . . . . . . . . . . . . . . . . . . . . . . . . . . . . . . . . . . . . . . . . . . . . . . . . . . . . 57.2 $ 25.40Vested . . . . . . . . . . . . . . . . . . . . . . . . . . . . . . . . . . . . . . . . . . . . . . . . . . . . . . . . . . . . . . . . . . . . . . . . . . . (42.5) $ 22.33Forfeited . . . . . . . . . . . . . . . . . . . . . . . . . . . . . . . . . . . . . . . . . . . . . . . . . . . . . . . . . . . . . . . . . . . . . . . . . . (8.6) $ 22.94
December 27, 2014 . . . . . . . . . . . . . . . . . . . . . . . . . . . . . . . . . . . . . . . . . . . . . . . . . . . . . . . . . . . . . . . . . 119.4 $ 23.89
Granted . . . . . . . . . . . . . . . . . . . . . . . . . . . . . . . . . . . . . . . . . . . . . . . . . . . . . . . . . . . . . . . . . . . . . . . . . . 42.4 $ 31.63Vested . . . . . . . . . . . . . . . . . . . . . . . . . . . . . . . . . . . . . . . . . . . . . . . . . . . . . . . . . . . . . . . . . . . . . . . . . . . (46.6) $ 23.61Forfeited . . . . . . . . . . . . . . . . . . . . . . . . . . . . . . . . . . . . . . . . . . . . . . . . . . . . . . . . . . . . . . . . . . . . . . . . . . (7.8) $ 25.76
December 26, 2015 . . . . . . . . . . . . . . . . . . . . . . . . . . . . . . . . . . . . . . . . . . . . . . . . . . . . . . . . . . . . . . . . . 107.4 $ 26.93
Expected to vest as of December 26, 2015 . . . . . . . . . . . . . . . . . . . . . . . . . . . . . . . . . . . . . . . . . . . . . 102.5 $ 26.93
111

INTEL CORPORATION
NOTES TO CONSOLIDATED FINANCIAL STATEMENTS (Continued)
The aggregate fair value of awards that vested in 2015 was $1.5 billion ($1.1 billion in 2014 and $1.0 billion in 2013), whichrepresents the market value of our common stock on the date that the RSUs vested. The grant-date fair value of awards thatvested in 2015 was $1.1 billion ($949 million in 2014 and $899 million in 2013). The number of RSUs vested includes shares ofcommon stock that we withheld on behalf of employees to satisfy the minimum statutory tax withholding requirements. RSUs thatare expected to vest are net of estimated future forfeitures.
As of December 26, 2015, there was $1.8 billion in unrecognized compensation costs related to RSUs granted under our equityincentive plans. We expect to recognize those costs over a weighted average period of 1.2 years.
Stock Option Awards
As of December 26, 2015, options outstanding that have vested and are expected to vest were as follows:
Number ofOptions
(In Millions)
WeightedAverageExercise
Price
WeightedAverage
RemainingContractual
Term(In Years)
AggregateIntrinsic
Value(In Millions)
Vested . . . . . . . . . . . . . . . . . . . . . . . . . . . . . . . . . . . . . . . . . . . . . . . . . . . . 43.8 $ 21.07 1.8 $ 609Expected to vest . . . . . . . . . . . . . . . . . . . . . . . . . . . . . . . . . . . . . . . . . . . . 9.6 $ 24.07 4.1 $ 104
Total . . . . . . . . . . . . . . . . . . . . . . . . . . . . . . . . . . . . . . . . . . . . . . . . . . . . . 53.4 $ 21.61 2.2 $ 713
Aggregate intrinsic value represents the difference between the exercise price and $34.98, the closing price of our common stockon December 24, 2015, as reported on The NASDAQ Global Select Market, for all in-the-money options outstanding. Optionsoutstanding that are expected to vest are net of estimated future option forfeitures.
Options with a fair value of $42 million completed vesting in 2015 ($68 million in 2014 and $186 million in 2013). As ofDecember 26, 2015, there was $13 million in unrecognized compensation costs related to stock options granted under our equityincentive plans. We expect to recognize those costs over a weighted average period of approximately eight months.
112

INTEL CORPORATION
NOTES TO CONSOLIDATED FINANCIAL STATEMENTS (Continued)
Stock option activity for each period was as follows:
Number ofOptions
(In Millions)
WeightedAverageExercise
Price
December 29, 2012 . . . . . . . . . . . . . . . . . . . . . . . . . . . . . . . . . . . . . . . . . . . . . . . . . . . . . . . . . . . . . . . . . 202.8 $ 20.20
Granted . . . . . . . . . . . . . . . . . . . . . . . . . . . . . . . . . . . . . . . . . . . . . . . . . . . . . . . . . . . . . . . . . . . . . . . . . . 20.1 $ 22.99Exercised . . . . . . . . . . . . . . . . . . . . . . . . . . . . . . . . . . . . . . . . . . . . . . . . . . . . . . . . . . . . . . . . . . . . . . . . . (65.0) $ 18.76Cancelled and forfeited . . . . . . . . . . . . . . . . . . . . . . . . . . . . . . . . . . . . . . . . . . . . . . . . . . . . . . . . . . . . . . (3.0) $ 22.58Expired . . . . . . . . . . . . . . . . . . . . . . . . . . . . . . . . . . . . . . . . . . . . . . . . . . . . . . . . . . . . . . . . . . . . . . . . . . . (1.9) $ 22.56
December 28, 2013 . . . . . . . . . . . . . . . . . . . . . . . . . . . . . . . . . . . . . . . . . . . . . . . . . . . . . . . . . . . . . . . . . 153.0 $ 21.10
Granted . . . . . . . . . . . . . . . . . . . . . . . . . . . . . . . . . . . . . . . . . . . . . . . . . . . . . . . . . . . . . . . . . . . . . . . . . . 0.6 $ 25.34Exercised . . . . . . . . . . . . . . . . . . . . . . . . . . . . . . . . . . . . . . . . . . . . . . . . . . . . . . . . . . . . . . . . . . . . . . . . . (63.7) $ 19.87Cancelled and forfeited . . . . . . . . . . . . . . . . . . . . . . . . . . . . . . . . . . . . . . . . . . . . . . . . . . . . . . . . . . . . . . (2.7) $ 23.70Expired . . . . . . . . . . . . . . . . . . . . . . . . . . . . . . . . . . . . . . . . . . . . . . . . . . . . . . . . . . . . . . . . . . . . . . . . . . . (9.9) $ 27.00
December 27, 2014 . . . . . . . . . . . . . . . . . . . . . . . . . . . . . . . . . . . . . . . . . . . . . . . . . . . . . . . . . . . . . . . . . 77.3 $ 21.30
Granted . . . . . . . . . . . . . . . . . . . . . . . . . . . . . . . . . . . . . . . . . . . . . . . . . . . . . . . . . . . . . . . . . . . . . . . . . . — $ —Exercised . . . . . . . . . . . . . . . . . . . . . . . . . . . . . . . . . . . . . . . . . . . . . . . . . . . . . . . . . . . . . . . . . . . . . . . . . (21.9) $ 20.34Cancelled and forfeited . . . . . . . . . . . . . . . . . . . . . . . . . . . . . . . . . . . . . . . . . . . . . . . . . . . . . . . . . . . . . . (1.1) $ 23.23Expired . . . . . . . . . . . . . . . . . . . . . . . . . . . . . . . . . . . . . . . . . . . . . . . . . . . . . . . . . . . . . . . . . . . . . . . . . . . (0.1) $ 20.87
December 26, 2015 . . . . . . . . . . . . . . . . . . . . . . . . . . . . . . . . . . . . . . . . . . . . . . . . . . . . . . . . . . . . . . . . . 54.2 $ 21.65
Options exercisable as of:December 28, 2013 . . . . . . . . . . . . . . . . . . . . . . . . . . . . . . . . . . . . . . . . . . . . . . . . . . . . . . . . . . . . . . . 111.5 $ 20.25December 27, 2014 . . . . . . . . . . . . . . . . . . . . . . . . . . . . . . . . . . . . . . . . . . . . . . . . . . . . . . . . . . . . . . . 54.7 $ 20.29December 26, 2015 . . . . . . . . . . . . . . . . . . . . . . . . . . . . . . . . . . . . . . . . . . . . . . . . . . . . . . . . . . . . . . . 43.8 $ 21.07
The aggregate intrinsic value of stock option exercises in 2015 was $284 million ($611 million in 2014 and $265 million in 2013),which represents the difference between the exercise price and the value of our common stock at the time of exercise. No stockoptions were granted during 2015.
As of December 26, 2015, outstanding options and exercisable options information, by range of exercise prices, was as follows:
Outstanding Options Exercisable Options
Range of Exercise Prices
Number ofShares
(In Millions)
WeightedAverage
RemainingContractual
Life(In Years)
WeightedAverageExercise
Price
Number ofShares
(In Millions)
WeightedAverageExercise
Price
$1.82–$15.00 . . . . . . . . . . . . . . . . . . . . . . . . . . . . . . . 0.4 2.9 $ 11.70 0.4 $ 11.70$15.01–$20.00 . . . . . . . . . . . . . . . . . . . . . . . . . . . . . . 21.7 0.8 $ 18.48 21.7 $ 18.48$20.01–$25.00 . . . . . . . . . . . . . . . . . . . . . . . . . . . . . . 24.7 3.1 $ 22.92 16.9 $ 22.86$25.01–$27.42 . . . . . . . . . . . . . . . . . . . . . . . . . . . . . . 7.4 3.3 $ 27.15 4.8 $ 27.23
Total . . . . . . . . . . . . . . . . . . . . . . . . . . . . . . . . . . . . . 54.2 2.2 $ 21.65 43.8 $ 21.07
These options will expire if they are not exercised by specific dates through April 2021. Option exercise prices for optionsexercised during the three-year period ended December 26, 2015 ranged from $1.12 to $27.42.
113

INTEL CORPORATION
NOTES TO CONSOLIDATED FINANCIAL STATEMENTS (Continued)
Stock Purchase Plan
Approximately 77% of our employees were participating in our 2006 Stock Purchase Plan as of December 26, 2015 (76% in 2014and 76% in 2013). Employees purchased 15.8 million shares of common stock in 2015 for $421 million under the 2006 StockPurchase Plan (19.4 million shares of common stock for $393 million in 2014 and 20.5 million shares of common stock for $369million in 2013). As of December 26, 2015, unrecognized share-based compensation costs related to rights to acquire shares ofcommon stock under our stock purchase plan totaled $14 million. We expect to recognize those costs over a period ofapproximately two months.
Note 19: Common Stock Repurchases
Common Stock Repurchase Program
We have an ongoing authorization, originally approved by our Board of Directors in 2005, and subsequently amended, torepurchase up to $65.0 billion in shares of our common stock in open market or negotiated transactions. As of December 26,2015, $9.4 billion remained available for repurchase under the existing repurchase authorization limit.
During 2015, we repurchased 95.7 million shares of common stock at a cost of $3.0 billion (332.4 million shares of common stockat a cost of $10.8 billion in 2014 and 94.1 million shares of common stock at a cost of $2.1 billion in 2013). We have repurchased4.8 billion shares of common stock at a cost of $104.9 billion since the program began in 1990.
Restricted Stock Unit Withholdings
We grant RSUs pursuant to the 2006 Plan. For the majority of RSUs granted, the number of shares of common stock issued onthe date the RSUs vest is net of the minimum statutory withholding requirements that we pay in cash to the appropriate taxingauthorities on behalf of our employees. In our consolidated financial statements, we treat shares of common stock withheld for taxpurposes on behalf of our employees in connection with the vesting of RSUs as common stock repurchases because they reducethe number of shares that would have been issued upon vesting. These withheld shares of common stock are not consideredcommon stock repurchases under our authorized common stock repurchase plan. During 2015, we withheld 13.5 million sharesof common stock to satisfy $442 million (12.0 million shares of common stock to satisfy $332 million in 2014 and 13.1 millionshares of common stock to satisfy $293 million in 2013) of employees’ tax obligations.
Note 20: Gains (Losses) on Equity Investments, Net
The components of gains (losses) on equity investments, net for each period were as follows:
Years Ended(In Millions)
Dec 26,2015
Dec 27,2014
Dec 28,2013
Share of equity method investee losses, net . . . . . . . . . . . . . . . . . . . . . . . . . . . . . . . . . . . . . $ (95) $ (69) $ (69)Impairments . . . . . . . . . . . . . . . . . . . . . . . . . . . . . . . . . . . . . . . . . . . . . . . . . . . . . . . . . . . . . . (185) (146) (123)Gains on sales, net . . . . . . . . . . . . . . . . . . . . . . . . . . . . . . . . . . . . . . . . . . . . . . . . . . . . . . . . 145 422 515Dividends . . . . . . . . . . . . . . . . . . . . . . . . . . . . . . . . . . . . . . . . . . . . . . . . . . . . . . . . . . . . . . . . 52 57 46Other, net . . . . . . . . . . . . . . . . . . . . . . . . . . . . . . . . . . . . . . . . . . . . . . . . . . . . . . . . . . . . . . . . 398 147 102
Total gains (losses) on equity investments, net . . . . . . . . . . . . . . . . . . . . . . . . . . . . . . . . $ 315 $ 411 $ 471
The substantial majority of other, net for 2015 resulted from gains on third-party merger transactions, and the majority of gains onsales, net for 2014 resulted from gains on private equity sales.
114

INTEL CORPORATION
NOTES TO CONSOLIDATED FINANCIAL STATEMENTS (Continued)
During 2013, we sold our shares in Clearwire Corporation, which had been accounted for as available-for-sale marketable equitysecurities, and our interest in Clearwire LLC, which had been accounted for as an equity method investment. We receivedproceeds of $142 million on the sale of our shares in Clearwire Corporation and $328 million on the sale of our interest inClearwire LLC. The proceeds received on the sale of our shares in Clearwire Corporation and our interest in Clearwire LLC areincluded in “sales of available-for-sale investments” and “other investing,” respectively, within investing activities on theconsolidated statements of cash flows. During 2013, we recognized gains of $111 million on the sale of our shares in ClearwireCorporation and $328 million on the sale of our interest in Clearwire LLC. The total gain of $439 million on these transactions isincluded in “gains (losses) on equity investments, net” on the consolidated statements of income.
Note 21: Interest and Other, Net
The components of interest and other, net for each period were as follows:
Years Ended(In Millions)
Dec 26,2015
Dec 27,2014
Dec 28,2013
Interest income . . . . . . . . . . . . . . . . . . . . . . . . . . . . . . . . . . . . . . . . . . . . . . . . . . . . . . . . . . . $ 124 $ 141 $ 104Interest expense . . . . . . . . . . . . . . . . . . . . . . . . . . . . . . . . . . . . . . . . . . . . . . . . . . . . . . . . . . (337) (192) (244)Other, net . . . . . . . . . . . . . . . . . . . . . . . . . . . . . . . . . . . . . . . . . . . . . . . . . . . . . . . . . . . . . . . . 108 94 (11)
Total interest and other, net . . . . . . . . . . . . . . . . . . . . . . . . . . . . . . . . . . . . . . . . . . . . . . . . $ (105) $ 43 $ (151)
Interest expense in the preceding table is net of $258 million of interest capitalized in 2015 ($276 million in 2014 and $246 millionin 2013).
During 2015, we recognized an interest and other, net loss primarily due to higher interest expense, which includes the 2015issuances of our $9.5 billion aggregate principal amount of senior unsecured notes. For further information on these transactions,see “Note 15: Borrowings.” This was partially offset by divestiture gains recognized in 2015. For further information on thesetransactions, see “Note 9: Divestitures.”
During 2014, we completed the divestiture of our Intel Media assets. As a result of the transaction, we recognized a gain within“other, net” in the preceding table. For further information, see “Note 9: Divestitures.”
Note 22: Earnings Per Share
We computed our basic and diluted earnings per share of common stock for each period as follows:
Years Ended(In Millions, Except Per Share Amounts)
Dec 26,2015
Dec 27,2014
Dec 28,2013
Net income available to common stockholders . . . . . . . . . . . . . . . . . . . . . . . . . . . . . . . . $ 11,420 $ 11,704 $ 9,620
Weighted average shares of common stock outstanding—basic . . . . . . . . . . . . . . . . . 4,742 4,901 4,970
Dilutive effect of employee equity incentive plans . . . . . . . . . . . . . . . . . . . . . . . . . . . . . . . . . 64 75 68Dilutive effect of convertible debt . . . . . . . . . . . . . . . . . . . . . . . . . . . . . . . . . . . . . . . . . . . . . . 88 80 59
Weighted average shares of common stock outstanding—diluted . . . . . . . . . . . . . . . . 4,894 5,056 5,097
Basic earnings per share of common stock . . . . . . . . . . . . . . . . . . . . . . . . . . . . . . . . . . . $ 2.41 $ 2.39 $ 1.94
Diluted earnings per share of common stock . . . . . . . . . . . . . . . . . . . . . . . . . . . . . . . . . . $ 2.33 $ 2.31 $ 1.89
We computed basic earnings per share of common stock using net income available to common stockholders and the weightedaverage number of shares of common stock outstanding during the period. We computed diluted earnings per share of commonstock using net income available to common stockholders and the weighted average number of shares of common stockoutstanding plus potentially dilutive shares of common stock outstanding during the period. Net income available to participatingsecurities was insignificant for all periods presented.
115

INTEL CORPORATION
NOTES TO CONSOLIDATED FINANCIAL STATEMENTS (Continued)
Potentially dilutive shares of common stock from employee incentive plans are determined by applying the treasury stock methodto the assumed exercise of outstanding stock options, the assumed vesting of outstanding RSUs, and the assumed issuance ofcommon stock under the stock purchase plan. Potentially dilutive shares of common stock for our 2005 debentures aredetermined by applying the if-converted method. However, as our 2009 debentures require settlement of the principal amount ofthe debt in cash upon conversion, with the conversion premium paid in cash or stock at our option, potentially dilutive shares ofcommon stock are determined by applying the treasury stock method. For further discussion on the specific conversion featuresof our 2005 and 2009 debentures, see “Note 15: Borrowings.”
In 2015, we excluded on average 2 million outstanding stock options and RSUs from the computation of diluted earnings pershare of common stock because these shares of common stock would have been anti-dilutive (10 million in 2014 and 55 million in2013). These options could potentially be included in the diluted earnings per share of common stock calculation in the future ifthe average market value of the shares of common stock increases and is greater than the exercise price of these options.
In all years presented, we included our 2009 debentures in the calculation of diluted earnings per share of common stockbecause the average market price was above the conversion price. We could potentially exclude the 2009 debentures in thefuture if the average market price is below the conversion price.
Note 23: Income Taxes
Income Tax Provision
Income before taxes and the provision for taxes consisted of the following:
Years Ended(In Millions)
Dec 26,2015
Dec 27,2014
Dec 28,2013
Income before taxes:U.S. . . . . . . . . . . . . . . . . . . . . . . . . . . . . . . . . . . . . . . . . . . . . . . . . . . . . . . . . . . . . . . . . . . $ 8,800 $ 11,565 $ 9,374Non-U.S. . . . . . . . . . . . . . . . . . . . . . . . . . . . . . . . . . . . . . . . . . . . . . . . . . . . . . . . . . . . . . . 5,412 4,236 3,237
Total income before taxes . . . . . . . . . . . . . . . . . . . . . . . . . . . . . . . . . . . . . . . . . . . . . . . . . . 14,212 15,801 12,611
Provision for taxes:Current:
Federal . . . . . . . . . . . . . . . . . . . . . . . . . . . . . . . . . . . . . . . . . . . . . . . . . . . . . . . . . . . . . . 2,828 3,374 2,730State . . . . . . . . . . . . . . . . . . . . . . . . . . . . . . . . . . . . . . . . . . . . . . . . . . . . . . . . . . . . . . . . 40 38 68Non-U.S. . . . . . . . . . . . . . . . . . . . . . . . . . . . . . . . . . . . . . . . . . . . . . . . . . . . . . . . . . . . . 842 969 716
Total current provision for taxes . . . . . . . . . . . . . . . . . . . . . . . . . . . . . . . . . . . . . . . . . . . . 3,710 4,381 3,514
Deferred:Federal . . . . . . . . . . . . . . . . . . . . . . . . . . . . . . . . . . . . . . . . . . . . . . . . . . . . . . . . . . . . . . (862) (263) (412)Other . . . . . . . . . . . . . . . . . . . . . . . . . . . . . . . . . . . . . . . . . . . . . . . . . . . . . . . . . . . . . . . (56) (21) (111)
Total deferred provision for taxes . . . . . . . . . . . . . . . . . . . . . . . . . . . . . . . . . . . . . . . . . . . (918) (284) (523)
Total provision for taxes . . . . . . . . . . . . . . . . . . . . . . . . . . . . . . . . . . . . . . . . . . . . . . . . . . . $ 2,792 $ 4,097 $ 2,991
Effective tax rate . . . . . . . . . . . . . . . . . . . . . . . . . . . . . . . . . . . . . . . . . . . . . . . . . . . . . . . . . 19.6% 25.9% 23.7%
116

INTEL CORPORATION
NOTES TO CONSOLIDATED FINANCIAL STATEMENTS (Continued)
The difference between the tax provision at the statutory federal income tax rate and the tax provision as a percentage of incomebefore income taxes (effective tax rate) for each period was as follows:
Years Ended(In Millions)
Dec 26,2015
Dec 27,2014
Dec 28,2013
Statutory federal income tax rate . . . . . . . . . . . . . . . . . . . . . . . . . . . . . . . . . . . . . . . . . . . . . . 35.0% 35.0% 35.0%Increase (reduction) in rate resulting from:
Non-U.S. income taxed at different rates . . . . . . . . . . . . . . . . . . . . . . . . . . . . . . . . . . . . . . (7.9) (6.1) (5.8)Settlements, effective settlements, and related remeasurements . . . . . . . . . . . . . . . . . . . (2.9) — —Domestic manufacturing deduction benefit . . . . . . . . . . . . . . . . . . . . . . . . . . . . . . . . . . . . (2.0) (2.1) (2.1)Research and development tax credits . . . . . . . . . . . . . . . . . . . . . . . . . . . . . . . . . . . . . . . (1.7) (1.7) (3.5)Other . . . . . . . . . . . . . . . . . . . . . . . . . . . . . . . . . . . . . . . . . . . . . . . . . . . . . . . . . . . . . . . . . (0.9) 0.8 0.1
Effective tax rate . . . . . . . . . . . . . . . . . . . . . . . . . . . . . . . . . . . . . . . . . . . . . . . . . . . . . . . . . 19.6% 25.9% 23.7%
Most of the decrease in our effective tax rate in 2015 compared to 2014 was driven by one-time items, a higher proportion of ourincome from lower taxed jurisdictions, and our decision to indefinitely reinvest certain prior years’ non-U.S. earnings positivelyimpacted our effective income tax rate.
A substantial majority of the increase in our effective tax rate between 2014 and 2013 was driven by the reenacted U.S. R&D taxcredit in 2013 containing two years’ worth of R&D tax credits. The U.S. R&D tax credit was reenacted in the fourth quarter of 2014retroactive for the full year. It was also reenacted in the first quarter of 2013 retroactive to the beginning of 2012.
Income in certain non-U.S. countries is fully exempt from income taxes for a limited period of time due to eligible activities andcertain capital investment actions. These full tax exemptions expire at various dates through 2023; however, the exemptions incertain countries are eligible for renewal.
In 2015, the tax benefit attributable to tax holidays was $85 million ($166 million for 2014 and $213 million for 2013) with a $0.02impact on diluted earnings per share ($0.03 for 2014 and $0.04 for 2013).
During 2015, net income tax benefits attributable to equity-based compensation transactions that were allocated to stockholders’equity totaled $172 million (net benefits of $103 million in 2014 and net benefits of $3 million in 2013).
117

INTEL CORPORATION
NOTES TO CONSOLIDATED FINANCIAL STATEMENTS (Continued)
Deferred and Current Income Taxes
Deferred income taxes reflect the net tax effects of temporary differences between the carrying amounts of assets and liabilitiesfor financial reporting purposes and the amounts for income tax purposes. Significant components of our deferred tax assets andliabilities at the end of each period were as follows:
(In Millions)Dec 26,
2015Dec 27,
2014
Deferred tax assets:Accrued compensation and other benefits . . . . . . . . . . . . . . . . . . . . . . . . . . . . . . . . . . . . . . . . . . . . . . . $ 931 $ 982Share-based compensation . . . . . . . . . . . . . . . . . . . . . . . . . . . . . . . . . . . . . . . . . . . . . . . . . . . . . . . . . . 424 438Deferred income . . . . . . . . . . . . . . . . . . . . . . . . . . . . . . . . . . . . . . . . . . . . . . . . . . . . . . . . . . . . . . . . . . 694 691Inventory . . . . . . . . . . . . . . . . . . . . . . . . . . . . . . . . . . . . . . . . . . . . . . . . . . . . . . . . . . . . . . . . . . . . . . . . 598 339State credits and net operating losses . . . . . . . . . . . . . . . . . . . . . . . . . . . . . . . . . . . . . . . . . . . . . . . . . . 613 519Other, net . . . . . . . . . . . . . . . . . . . . . . . . . . . . . . . . . . . . . . . . . . . . . . . . . . . . . . . . . . . . . . . . . . . . . . . . 760 715
Gross deferred tax assets . . . . . . . . . . . . . . . . . . . . . . . . . . . . . . . . . . . . . . . . . . . . . . . . . . . . . . . . . . . . 4,020 3,684
Valuation allowance . . . . . . . . . . . . . . . . . . . . . . . . . . . . . . . . . . . . . . . . . . . . . . . . . . . . . . . . . . . . . . . . . . (701) (595)
Total deferred tax assets . . . . . . . . . . . . . . . . . . . . . . . . . . . . . . . . . . . . . . . . . . . . . . . . . . . . . . . . . . . . . 3,319 3,089
Deferred tax liabilities:Property, plant and equipment . . . . . . . . . . . . . . . . . . . . . . . . . . . . . . . . . . . . . . . . . . . . . . . . . . . . . . . . (505) (1,171)Licenses and intangibles . . . . . . . . . . . . . . . . . . . . . . . . . . . . . . . . . . . . . . . . . . . . . . . . . . . . . . . . . . . . (563) (576)Convertible debt . . . . . . . . . . . . . . . . . . . . . . . . . . . . . . . . . . . . . . . . . . . . . . . . . . . . . . . . . . . . . . . . . . . (1,042) (977)Unrealized gains on investments and derivatives . . . . . . . . . . . . . . . . . . . . . . . . . . . . . . . . . . . . . . . . . (717) (1,017)Investment in non-U.S. subsidiaries . . . . . . . . . . . . . . . . . . . . . . . . . . . . . . . . . . . . . . . . . . . . . . . . . . . (37) (252)Other, net . . . . . . . . . . . . . . . . . . . . . . . . . . . . . . . . . . . . . . . . . . . . . . . . . . . . . . . . . . . . . . . . . . . . . . . . (358) (291)
Total deferred tax liabilities . . . . . . . . . . . . . . . . . . . . . . . . . . . . . . . . . . . . . . . . . . . . . . . . . . . . . . . . . . (3,222) (4,284)
Net deferred tax assets (liabilities) . . . . . . . . . . . . . . . . . . . . . . . . . . . . . . . . . . . . . . . . . . . . . . . . . . . . . 97 (1,195)
Reported as:Current deferred tax assets . . . . . . . . . . . . . . . . . . . . . . . . . . . . . . . . . . . . . . . . . . . . . . . . . . . . . . . . . . 2,036 1,958Non-current deferred tax assets . . . . . . . . . . . . . . . . . . . . . . . . . . . . . . . . . . . . . . . . . . . . . . . . . . . . . . 600 622Non-current deferred tax liabilities . . . . . . . . . . . . . . . . . . . . . . . . . . . . . . . . . . . . . . . . . . . . . . . . . . . . . (2,539) (3,775)
Net deferred tax assets (liabilities) . . . . . . . . . . . . . . . . . . . . . . . . . . . . . . . . . . . . . . . . . . . . . . . . . . . . . $ 97 $ (1,195)
Non-current deferred tax assets are included within other long-term assets on the consolidated balance sheets.
The valuation allowance is based on our assessment that it is more likely than not that certain deferred tax assets will not berealized in the foreseeable future. The valuation allowance as of December 26, 2015 included allowances related to unrealizedstate credit carryforwards of $607 million and matters related to our non-U.S. subsidiaries of $94 million.
As of December 26, 2015, our federal, state, and non-U.S. net operating loss carryforwards for income tax purposes were $171million, $101 million, and $384 million, respectively. A majority of the non-U.S. net operating loss carryforwards have no expirationdate. The remaining non-U.S., as well as the U.S. federal and state net operating loss carryforwards, expire at various datesthrough 2035. A significant amount of the net operating loss carryforwards in the U.S. relates to acquisitions and, as a result, islimited in the amount that can be recognized in any one year. The non-U.S. net operating loss carryforwards include $218 millionthat is not likely to be recovered and has been reduced by a valuation allowance.
118

INTEL CORPORATION
NOTES TO CONSOLIDATED FINANCIAL STATEMENTS (Continued)
As of December 26, 2015, we had not recognized U.S. deferred income taxes on a cumulative total of $26.9 billion ofundistributed earnings for certain non-U.S. subsidiaries and $1.8 billion of other basis differences of our investments in certainnon-U.S. subsidiaries, primarily related to McAfee. Determining the unrecognized deferred tax liability related to investments inthese non-U.S. subsidiaries that are indefinitely reinvested is not practicable. We currently intend to indefinitely reinvest thoseearnings and other basis differences in operations outside the U.S.
Current income taxes receivable of $468 million as of December 26, 2015 ($79 million as of December 27, 2014) is included inother current assets. Current income taxes payable of $272 million as of December 26, 2015 ($443 million as of December 27,2014) is included in other accrued liabilities.
Long-term income taxes payable of $114 million as of December 26, 2015 ($262 million as of December 27, 2014) is included inother long-term liabilities, which includes uncertain tax positions, reduced by the associated federal deduction for state taxes andnon-U.S. tax credits, and may also include other long-term tax liabilities that are not uncertain but have not yet been paid.
Uncertain Tax Positions
The aggregate changes in the balance of gross unrecognized tax benefits for each period were as follows:
Years Ended(In Millions)
Dec 26,2015
Dec 27,2014
Dec 28,2013
Beginning gross unrecognized tax benefits . . . . . . . . . . . . . . . . . . . . . . . . . . . . . . . . . . . $ 577 $ 207 $ 189
Settlements and effective settlements with tax authorities and related remeasurements . . . (452) (220) (2)Increases in balances related to tax positions taken during prior periods . . . . . . . . . . . . . . . 4 173 21Decreases in balances related to tax positions taken during prior periods . . . . . . . . . . . . . . (34) (1) (9)Increases in balances related to tax positions taken during current period . . . . . . . . . . . . . . 6 418 8
Ending gross unrecognized tax benefits . . . . . . . . . . . . . . . . . . . . . . . . . . . . . . . . . . . . . . $ 101 $ 577 $ 207
The related tax benefit for settlements, effective settlements, and remeasurements is $419 million for 2015 (insignificant in 2014and 2013).
If the remaining balance of $101 million of unrecognized tax benefits as of December 26, 2015 ($577 million as of December 27,2014) were recognized in a future period, it would result in a tax benefit of $32 million ($485 million as of December 27, 2014) anda reduction in the effective tax rate.
During all years presented, we recognized interest and penalties related to unrecognized tax benefits within the provision fortaxes on the consolidated statements of income. Interest and penalties related to unrecognized tax benefits were insignificant in2015 ($21 million in 2014 and insignificant in 2013). As of December 26, 2015, we had $34 million of accrued interest andpenalties related to unrecognized tax benefits ($44 million as of December 27, 2014).
Our tax policy is to comply with the laws, regulations, and filing requirements of all jurisdictions in which we conduct business. Weregularly engage in discussions and negotiations with tax authorities regarding tax matters in various jurisdictions. Although thetiming of the resolutions and/or closures of audits is highly uncertain, it is reasonably possible that certain U.S. federal and non-U.S. tax audits may be concluded within the next 12 months, which could significantly increase or decrease the balance of ourgross unrecognized tax benefits. However, the estimated impact of income tax expense and net income is not expected to besignificant.
We file federal, state, and non-U.S. tax returns. For state and non-U.S. tax returns, we are generally no longer subject to taxexaminations for years prior to 2002. For federal tax returns, we are no longer subject to tax examination for years prior to 2009.
119

INTEL CORPORATION
NOTES TO CONSOLIDATED FINANCIAL STATEMENTS (Continued)
Note 24: Other Comprehensive Income (Loss)
The components of other comprehensive income (loss) and related tax effects for each period were as follows:
December 26, 2015 December 27, 2014 December 28, 2013
Years Ended(In Millions)
BeforeTax Tax
Net ofTax
BeforeTax Tax
Net ofTax
BeforeTax Tax
Net ofTax
Change in unrealized holding gains(losses) on available-for-saleinvestments . . . . . . . . . . . . . . . . . . . $ (999) $ 350 $ (649) $ 1,029 $ (359) $ 670 $ 1,963 $ (687) $ 1,276
Less: adjustment for (gains) losses onavailable-for-sale investments includedin net income . . . . . . . . . . . . . . . . . . (93) 32 (61) (142) 49 (93) (146) 51 (95)
Less: adjustment for (gains) losses ondeferred tax asset valuation allowanceincluded in net income . . . . . . . . . . . . — (18) (18) — (41) (41) — (26) (26)
Change in unrealized holding gains(losses) on derivatives . . . . . . . . . . . . (298) 93 (205) (589) 160 (429) (166) 76 (90)
Less: adjustment for (gains) losses onderivatives included in net income . . . . 522 (160) 362 13 (11) 2 30 (29) 1
Change in net prior service (costs)credits . . . . . . . . . . . . . . . . . . . . . . . (2) 1 (1) (42) 5 (37) 17 (2) 15
Less: adjustment for amortization of netprior service costs (credits) . . . . . . . . . 10 (2) 8 6 (2) 4 4 (1) 3
Change in actuarial gains (losses) . . . . . . 73 7 80 (433) 3 (430) 725 (275) 450Less: adjustment for amortization of
actuarial (gains) losses . . . . . . . . . . . . 67 (19) 48 37 (9) 28 101 (31) 70Change in net foreign currency translation
adjustment . . . . . . . . . . . . . . . . . . . . (187) 17 (170) (275) 24 (251) 45 (7) 38
Other comprehensive income (loss) . . . $ (907) $ 301 $ (606) $ (396) $ (181) $ (577) $ 2,573 $ (931) $ 1,642
In prior periods, we recorded a reversal of a portion of our deferred tax asset valuation allowance attributed to changes inunrealized holding gains on our available-for-sale investments. This amount is reduced and included in our provision for taxes asthese investments mature or are sold, and is included in the preceding table as an adjustment for (gains) losses on deferred taxasset valuation allowance included in net income.
The change in actuarial valuation in 2014 in the preceding table includes $1.4 billion in actuarial losses arising during the yearoffset by a $1.0 billion reduction in losses due to a freeze of future benefit accruals in the U.S. Intel Minimum Pension Plan. Forfurther information, see “Note 16: Retirement Benefit Plans.”
120

INTEL CORPORATION
NOTES TO CONSOLIDATED FINANCIAL STATEMENTS (Continued)
The changes in accumulated other comprehensive income (loss) by component and related tax effects for each period were asfollows:
(In Millions)
UnrealizedHoldingGains
(Losses) onAvailable-for-Sale
Investments
DeferredTax AssetValuationAllowance
UnrealizedHoldingGains
(Losses) onDerivatives
PriorServiceCredits(Costs)
ActuarialGains
(Losses)
ForeignCurrency
TranslationAdjustment Total
December 28, 2013 . . . . . . . . . . $ 1,882 $ 67 $ 4 $ (14) $ (602) $ (94) $ 1,243
Other comprehensive income(loss) beforereclassifications . . . . . . . . . 1,029 — (589) (42) (433) (275) (310)
Amounts reclassified out ofaccumulated othercomprehensive income(loss) . . . . . . . . . . . . . . . . . (142) — 13 6 37 — (86)
Tax effects . . . . . . . . . . . . . . . (310) (41) 149 3 (6) 24 (181)
Other comprehensive income(loss) . . . . . . . . . . . . . . . . . 577 (41) (427) (33) (402) (251) (577)
December 27, 2014 . . . . . . . . . . 2,459 26 (423) (47) (1,004) (345) 666
Other comprehensive income(loss) beforereclassifications . . . . . . . . . (999) — (298) (2) 73 (187) (1,413)
Amounts reclassified out ofaccumulated othercomprehensive income(loss) . . . . . . . . . . . . . . . . . (93) — 522 10 67 — 506
Tax effects . . . . . . . . . . . . . . . 382 (18) (67) (1) (12) 17 301
Other comprehensive income(loss) . . . . . . . . . . . . . . . . . (710) (18) 157 7 128 (170) (606)
December 26, 2015 . . . . . . . . . . $ 1,749 $ 8 $ (266) $ (40) $ (876) $ (515) $ 60
121

INTEL CORPORATION
NOTES TO CONSOLIDATED FINANCIAL STATEMENTS (Continued)
The amounts reclassified out of accumulated other comprehensive income (loss) into the consolidated statements of income, withpresentation location, for each period were as follows:
Income Before Taxes Impactfor Years Ended
(In Millions)
Comprehensive Income ComponentsDec 26,
2015Dec 27,
2014Dec 28,
2013 Location
Unrealized holding gains (losses) onavailable-for-sale investments:
$ 2 $ 10 $ 8 Interest and other, net91 132 138 Gains (losses) on equity investments, net
93 142 146
Unrealized holding gains (losses) onderivatives:Currency forwards . . . . . . . . . . . . . . . . . . (290) (31) (61) Cost of Sales
(177) 18 30 Research and development(46) 2 — Marketing, general and administrative
Other instruments . . . . . . . . . . . . . . . . . . . — (2) 1 Cost of Sales(9) — — Interest and other, net
(522) (13) (30)
Amortization of pension and postretirementbenefit components:Prior service credits (costs) . . . . . . . . . . . (10) (6) (4)Actuarial gains (losses) . . . . . . . . . . . . . . . (67) (37) (101)
(77) (43) (105)
Total amounts reclassified out ofaccumulated other comprehensiveincome (loss) . . . . . . . . . . . . . . . . . . . . . . $ (506) $ 86 $ 11
The amortization of pension and postretirement benefit components are included in the computation of net periodic benefit cost.For further information, see “Note 16: Retirement Benefit Plans.” The estimated net prior service costs and net actuarial losses forthe defined-benefit plans that will be amortized from accumulated other comprehensive income (loss) into net periodic benefitcost during 2016 are $7 million and $42 million, respectively.
We estimate that we will reclassify approximately $185 million (before taxes) of net derivative losses included in accumulatedother comprehensive income (loss) into earnings within the next 12 months.
122

INTEL CORPORATION
NOTES TO CONSOLIDATED FINANCIAL STATEMENTS (Continued)
Note 25: Contingencies
Legal Proceedings
We are a party to various legal proceedings, including those noted in this section. Although management at present believes thatthe ultimate outcome of these proceedings, individually and in the aggregate, will not materially harm our financial position, resultsof operations, cash flows, or overall trends, legal proceedings and related government investigations are subject to inherentuncertainties, and unfavorable rulings or other events could occur. Unfavorable resolutions could include substantial monetarydamages. In addition, in matters for which injunctive relief or other conduct remedies are sought, unfavorable resolutions couldinclude an injunction or other order prohibiting us from selling one or more products at all or in particular ways, precludingparticular business practices, or requiring other remedies. An unfavorable outcome may result in a material adverse impact on ourbusiness, results of operations, financial position, and overall trends. We might also conclude that settling one or more suchmatters is in the best interests of our stockholders, employees, and customers, and any such settlement could include substantialpayments. Except as specifically described below, we have not concluded that settlement of any of the legal proceedings noted inthis section is appropriate at this time.
Government Competition Matters and Related Consumer Class Actions
A number of proceedings generally have challenged and continue to challenge certain of our competitive practices. Theallegations in these proceedings vary and are described in more detail in the following paragraphs. In general, they contend thatwe improperly conditioned price rebates and other discounts on our microprocessors on exclusive or near-exclusive dealing bysome of our customers; and they allege that our software compiler business unfairly preferred Intel microprocessors overcompeting microprocessors and that, through the use of our compilers and other means, we have caused the dissemination ofinaccurate and misleading benchmark results concerning our microprocessors. Based on the procedural posture of the variousremaining competition matters, which we describe in the following paragraphs, our investment of resources to explain and defendour position has declined as compared to the period 2005-2011. Nonetheless, certain of the matters remain active, and thesechallenges could continue for a number of years, potentially requiring us to invest additional resources. We believe that wecompete lawfully and that our marketing, business, intellectual property, and other challenged practices benefit our customersand our stockholders, and we will continue to conduct a vigorous defense in the remaining proceedings.
In 2001, the European Commission (EC) commenced an investigation regarding claims by Advanced Micro Devices, Inc. (AMD)that we used unfair business practices to persuade customers to buy our microprocessors. We received numerous requests forinformation and documents from the EC and we responded to each of those requests. The EC issued a Statement of Objectionsin July 2007 and held a hearing on that Statement in March 2008. The EC issued a Supplemental Statement of Objections in July2008. In May 2009, the EC issued a decision finding that we had violated Article 82 of the EC Treaty and Article 54 of theEuropean Economic Area Agreement. In general, the EC found that we violated Article 82 (later renumbered as Article 102 by anew treaty) by offering alleged “conditional rebates and payments” that required our customers to purchase all or most of theirx86 microprocessors from us. The EC also found that we violated Article 82 by making alleged “payments to prevent sales ofspecific rival products.” The EC imposed a fine in the amount of €1.1 billion ($1.4 billion as of May 2009), which we subsequentlypaid during the third quarter of 2009, and ordered us to “immediately bring to an end the infringement referred to in” the ECdecision.
The EC decision contained no specific direction on whether or how we should modify our business practices. Instead, thedecision stated that we should “cease and desist” from further conduct that, in the EC’s opinion, would violate applicable law. Wetook steps, which are subject to the EC’s ongoing review, to comply with that decision pending appeal. We had discussions withthe EC to better understand the decision and to explain changes to our business practices.
123

INTEL CORPORATION
NOTES TO CONSOLIDATED FINANCIAL STATEMENTS (Continued)
We appealed the EC decision to the Court of First Instance (which has been renamed the General Court) in July 2009. Thehearing of our appeal took place in July 2012. In June 2014, the General Court rejected our appeal in its entirety. In August 2014,we filed an appeal with the European Court of Justice. On November 11, 2014, Intervener Association for CompetitiveTechnologies filed comments in support of Intel’s grounds of appeal. The EC and interveners filed briefs in November 2014, wefiled a reply in February 2015, and the EC filed a rejoinder in April 2015. The Court of Justice is likely to hold oral argument andissue its decision in 2016.
At least 82 separate class-action lawsuits have been filed in the U.S. District Courts for the Northern District of California,Southern District of California, District of Idaho, District of Nebraska, District of New Mexico, District of Maine, and District ofDelaware, as well as in various California, Kansas, and Tennessee state courts. These actions generally repeat the allegationsmade in a now-settled lawsuit filed against us by AMD in June 2005 in the U.S. District Court for the District of Delaware (AMDlitigation). Like the AMD litigation, these class-action lawsuits allege that we engaged in various actions in violation of theSherman Act and other laws by, among other things: providing discounts and rebates to our manufacturer and distributorcustomers conditioned on exclusive or near-exclusive dealing that allegedly unfairly interfered with AMD’s ability to sell itsmicroprocessors; interfering with certain AMD product launches; and interfering with AMD’s participation in certain industrystandards-setting groups. The class actions allege various consumer injuries, including that consumers in various states havebeen injured by paying higher prices for computers containing our microprocessors. We dispute these class-action claims andintend to defend the lawsuits vigorously.
All of the federal and state class actions other than the California class actions were transferred by the Multidistrict LitigationPanel to the U.S. District Court in Delaware for all pre-trial proceedings and discovery (MDL proceedings). The Delaware districtcourt appointed a Special Master to address issues in the MDL proceedings, as assigned by the court. In January 2010, theplaintiffs in the Delaware action filed a motion for sanctions for our alleged failure to preserve evidence. This motion largely copiesa motion previously filed by AMD in the AMD litigation, which has settled. The plaintiffs in the MDL proceedings also moved forcertification of a class of members who purchased certain personal computers containing products sold by us. In July 2010, theSpecial Master issued a Report and Recommendation (Report) denying the motion to certify a class. The MDL plaintiffs filedobjections to the Special Master’s Report, and a hearing on those objections was held before the district court in July 2013. InJuly 2014, the district court affirmed the Special Master’s ruling and issued an order denying the MDL plaintiffs’ motion for classcertification. In August 2014, plaintiffs filed a petition for interlocutory appeal of the district court’s decision with the U.S. Court ofAppeals for the Third Circuit, which the Third Circuit denied in October 2014. In December 2014, Intel filed a motion for summaryjudgment on the claims of the remaining individual plaintiffs. We subsequently negotiated a settlement of the claims and the casewas dismissed in September 2015.
All California class actions have been consolidated in the Superior Court of California in Santa Clara County. The plaintiffs in theCalifornia actions moved for class certification, which we are in the process of opposing. At our request, the court in the Californiaactions agreed to delay ruling on this motion until after the Delaware district court ruled on the similar motion in the MDLproceedings. The plaintiffs asked the court for leave to retain a new expert and to amend their previous motion for classcertification. The court granted plaintiffs’ request in February 2015 and the hearing on plaintiffs’ amended class certificationmotion took place in January 2016; we are awaiting the court’s decision. Given the procedural posture and the nature of thesecases, we are unable to make a reasonable estimate of the potential loss or range of losses, if any, arising from these matters.
124

INTEL CORPORATION
NOTES TO CONSOLIDATED FINANCIAL STATEMENTS (Continued)
In re High Tech Employee Antitrust Litigation
Between May and July 2011, former employees of Intel, Adobe Systems Incorporated, Apple Inc., Google Inc., Intuit Inc.,Lucasfilm Ltd., and Pixar filed antitrust class-action lawsuits in the California Superior Courts alleging that these companies hadentered into a conspiracy to suppress the compensation of their employees. The lawsuits were removed to the United StatesDistrict Court for the Northern District of California and in September 2011 the plaintiffs filed a consolidated amended complaint,captioned In re High Tech Employee Antitrust Litigation. The plaintiffs’ allegations reference the 2009 and 2010 investigation bythe Department of Justice (DOJ) into employment practices in the technology industry, as well as the DOJ’s complaints andsubsequent stipulated final judgments with the seven companies named as defendants in the lawsuits. The plaintiffs allege thatthe defendants entered into certain unlawful agreements not to cold call employees of particular other defendants and that therewas an overarching conspiracy among the defendants. Plaintiffs assert one such agreement specific to Intel, namely that Inteland Google entered into an agreement starting in 2005, not to cold call each other’s employees. Plaintiffs assert claims underSection 1 of the Sherman Antitrust Act and Section 4 of the Clayton Antitrust Act and seek a declaration that the defendants’alleged actions violated the antitrust laws, damages trebled as provided for by law under the Sherman Act or Clayton Act,restitution and disgorgement, and attorneys’ fees and costs.
In October 2013, the district court certified a class consisting of approximately 65,000 current or former employees of the sevendefendants and set the matter for trial in late May 2014. The so-called “technical class” consists of a group of current and formertechnical, creative, and R&D employees at each of the defendants. In January 2014, Intel filed a motion for summary judgment,which the court denied in March 2014.
In April 2014, Intel, Adobe, Apple, and Google reached an agreement with plaintiffs to settle this lawsuit, but in August 2014, thedistrict court denied preliminary approval of the settlement. In September 2014, defendants filed a petition for writ of mandamusasking the U.S. Court of Appeals for the Ninth Circuit to reverse the district court’s decision. The Ninth Circuit ordered briefing andscheduled a March 2015 hearing date on the writ petition. Defendants have withdrawn the petition for writ of mandamus in light ofthe settlement agreement discussed below.
In January 2015, Intel, Adobe, Apple, and Google reached a second agreement with plaintiffs to settle this lawsuit, which thecourt preliminarily approved in March 2015. The court held a final fairness hearing in July 2015, and in September 2015, gave itsfinal approval of the settlement and entered final judgment in the lawsuit. We made our settlement payment in October 2015,which we accrued for in our operating expenses for 2014. Although we disputed the plaintiffs’ claims, we agreed to settle thelawsuit to avoid the uncertainties, expenses, and diversion of resources from continued litigation.
In re Intel Corporation Shareholder Derivative Litigation regarding High Tech Employee Antitrust Litigation
In March 2014, the Police Retirement System of St. Louis (PRSSL) filed a shareholder derivative action in the Superior Court ofCalifornia in Santa Clara County against Intel, certain current and former members of our Board of Directors and a current officer.The complaint alleges that the defendants breached their duties to the company by participating in, or allowing, alleged antitrustviolations, which were alleged in In re High Tech Employee Antitrust Litigation. In March 2014, a second plaintiff, BarbaraTempleton, filed a substantially similar derivative suit in the same court. In May 2014, a third shareholder, Robert Achermann,filed a substantially similar derivative action in the same court. The court consolidated the three actions into one, which iscaptioned In re Intel Corporation Shareholder Derivative Litigation. Plaintiffs filed a consolidated complaint in July 2014. In August2015, the court granted our motion to dismiss the consolidated complaint. The plaintiffs thereafter filed a motion forreconsideration and a motion for new trial, both of which the court denied in October 2015. In November 2015, plaintiffs PRSSLand Templeton appealed the court’s decision.
125

INTEL CORPORATION
NOTES TO CONSOLIDATED FINANCIAL STATEMENTS (Continued)
In June 2015, the International Brotherhood of Electrical Workers (IBEW) filed a shareholder derivative action in the ChanceryCourt in Delaware against Intel, certain current and former members of our Board of Directors, and a current officer. The lawsuitmakes allegations that are substantially similar to those in the California shareholder derivative litigation described above, butcontain additional allegations regarding breach of the duty of disclosure surrounding the In re High Tech Employee AntitrustLitigation and that the Intel 2013 and 2014 proxy statements were false and misleading in that they misrepresented theeffectiveness of the Board’s oversight of compliance issues at Intel and the Board’s compliance with Intel’s Code of Conduct andBoard of Director Guidelines on Significant Corporate Governance Issues. In October 2015, the court stayed the IBEW lawsuit forsix months pending further developments in the California case.
Lehman Brothers Holdings Inc. and Lehman Brothers OTC Derivatives Inc. v. Intel
In May 2013, Lehman Brothers OTC Derivatives Inc. (LOTC) and Lehman Brothers Holdings Inc. (LBHI) filed an adversarycomplaint in the United States Bankruptcy Court in the Southern District of New York asserting claims against us arising from a2008 contract between Intel and LOTC. Under the terms of the 2008 contract, we prepaid $1.0 billion to LOTC, in exchange forwhich LOTC was required to deliver to us on or before September 29, 2008, quantities of Intel common stock and cashdetermined by a formula set forth in the contract. LOTC’s performance under the contract was secured by $1.0 billion of cashcollateral. Under the terms of the contract, LOTC was obligated to deliver approximately 50 million shares of our common stock tous on September 29, 2008. LOTC failed to deliver any Intel common stock or cash, and we exercised our right of setoff againstthe $1.0 billion collateral. LOTC and LBHI acknowledge in their complaint that we were entitled to set off our losses against thecollateral, but they assert that we withheld collateral in excess of our losses that should have been returned to LOTC. Thecomplaint asserts a claim for breach of contract, a claim for turnover under section 542(a) of the Bankruptcy Code, and a claim forviolation of the automatic stay under section 362(a)(3) of the Bankruptcy Code. The complaint does not expressly quantify theamount of damages claimed, but does assert multiple theories of damages that impliedly seek up to $312 million of allegedexcess collateral, plus interest at LIBOR plus 13.5%, compounded daily. In June 2013, we filed a motion to dismiss plaintiffs’bankruptcy claims and for a determination that the breach of contract claim is “non-core” under the Bankruptcy Code. Thebankruptcy court granted our motion in its entirety in December 2013. In May 2014, the United States District Court for theSouthern District of New York denied our request that it withdraw its reference of plaintiffs’ adversary complaint to the bankruptcycourt. In January 2015, Intel and the plaintiffs filed competing motions for summary judgment. Plaintiffs’ motion requestedjudgment against Intel “in the amount of no less than” $129 million, plus interest. In September 2015, the bankruptcy court ruled infavor of Intel and issued proposed findings of fact and conclusions of law recommending that the district court deny plaintiffs’motion for summary judgment and grant Intel’s motion for summary judgment. In October 2015, plaintiffs voluntarily dismissed thelawsuit with prejudice.
McAfee, Inc. Shareholder Litigation
On August 19, 2010, we announced that we had agreed to acquire all of the common stock of McAfee, Inc. (McAfee) for $48.00per share. Four McAfee shareholders filed putative class-action lawsuits in Santa Clara County, California Superior Courtchallenging the proposed transaction. The cases were ordered consolidated in September 2010. Plaintiffs filed an amendedcomplaint that named former McAfee board members, McAfee, and Intel as defendants, and alleged that the McAfee boardmembers breached their fiduciary duties and that McAfee and Intel aided and abetted those breaches of duty. The complaintrequested rescission of the merger agreement, such other equitable relief as the court may deem proper, and an award ofdamages in an unspecified amount. In June 2012, the plaintiffs’ damages expert asserted that the value of a McAfee share for thepurposes of assessing damages should be $62.08.
126

INTEL CORPORATION
NOTES TO CONSOLIDATED FINANCIAL STATEMENTS (Continued)
In January 2012, the court certified the action as a class action, appointed the Central Pension Laborers’ Fund to act as the classrepresentative, and scheduled trial to begin in January 2013. In March 2012, defendants filed a petition with the California Courtof Appeal for a writ of mandate to reverse the class certification order; the petition was denied in June 2012. In March 2012, atdefendants’ request, the court held that plaintiffs were not entitled to a jury trial, and ordered a bench trial. In April 2012, plaintiffsfiled a petition with the California Court of Appeal for a writ of mandate to reverse that order, which the court of appeal denied inJuly 2012. In August 2012, defendants filed a motion for summary judgment. The trial court granted that motion in November2012, and entered final judgment in the case in February 2013. In April 2013, plaintiffs appealed the final judgment. Intel, McAfee,and McAfee’s board of directors filed an opposition to plaintiff’s appeal in December 2014. Because the resolution of the appealmay materially impact the scope and nature of the proceeding, we are unable to make a reasonable estimate of the potential lossor range of losses, if any, arising from this matter. We dispute the class-action claims and intend to continue to defend the lawsuitvigorously.
Note 26: Operating Segments and Geographic Information
Our operating segments in effect as of December 26, 2015 included:
• Client Computing Group • All other• Data Center Group • Non-Volatile Memory Solutions Group• Internet of Things Group • New Devices Group• Software and services operating segments
• Intel Security Group• Software and Services Group
During the first quarter of 2015, we combined the PC Client Group and Mobile and Communications Group to create the ClientComputing Group (CCG). This change in our organizational structure reflects our strategy to address all aspects of the clientcomputing market segment and utilize our intellectual property to offer compelling customer solutions for a wide range of end-userdevices. All prior-period amounts have been retrospectively adjusted to reflect the way we internally manage and monitorsegment performance starting in fiscal year 2015, and include other minor reorganizations. Additionally, in the fourth quarter of2015 we renamed the McAfee operating segment as the Intel Security Group.
The Chief Operating Decision Maker (CODM) is our CEO. The CODM allocates resources to and assesses the performance ofeach operating segment using information about its revenue and operating income (loss).
We manage our business activities primarily based on a product segmentation basis. CCG and the Data Center Group (DCG) areour reportable operating segments. The Internet of Things Group and the aggregated “software and services operatingsegments,” as shown in the preceding operating segment list, do not meet the quantitative thresholds to qualify as reportableoperating segments; however, we have elected to disclose the results of these non-reportable operating segments. Our Non-Volatile Memory Solutions Group (NSG) and New Devices Group operating segments do not meet the quantitative thresholds toqualify as reportable segments and their combined results are included within the “all other” category.
127

INTEL CORPORATION
NOTES TO CONSOLIDATED FINANCIAL STATEMENTS (Continued)
Revenue for our reportable and aggregated non-reportable operating segments is primarily related to the following product lines:• Client Computing Group. Includes platforms designed for notebooks (including Ultrabook devices), 2 in 1 systems, desktops
(including all-in-ones and high-end enthusiast PCs), tablets, phones, wireless and wired connectivity products, and mobilecommunication components.
• Data Center Group. Includes platforms designed for the enterprise, cloud, communications infrastructure, and technicalcomputing segments.
• Internet of Things Group. Includes platforms designed for Internet of Things market segments, including retail,transportation, industrial, and buildings and home use, along with a broad range of other market segments.
• Software and services operating segments. Includes software products designed to deliver innovative solutions that securecomputers, mobile devices, and networks, and software products and services that promote Intel architecture as the platformof choice for software development.
We have sales and marketing, manufacturing, engineering, finance, and administration groups. Expenses for these groups aregenerally allocated to the operating segments, and the expenses are included in the following operating results.
The “all other” category includes revenue and expenses such as:• results of operations from our NSG and New Devices Group;• amounts included within restructuring and asset impairment charges;• a portion of employee benefits, compensation, and other expenses not allocated to the operating segments;• divested businesses for which discrete operating results are not regularly reviewed by our CODM;• results of operations of start-up businesses that support our initiatives, including our foundry business; and• acquisition-related costs, including amortization and any impairment of acquisition-related intangibles and goodwill.
The CODM does not evaluate operating segments using discrete asset information. Based on the interchangeable nature of ourmanufacturing and assembly and test assets, most of the related depreciation expense is not directly identifiable within ouroperating segments, as it is included in overhead cost pools and subsequently absorbed into inventory as each product passesthrough our manufacturing process. As our products are then sold across multiple operating segments, it is impracticable todetermine the total depreciation expense included as a component of each operating segment’s operating income (loss) results.Operating segments do not record inter-segment revenue. We do not allocate gains and losses from equity investments, interestand other income, or taxes to operating segments. Although the CODM uses operating income to evaluate the segments,operating costs included in one segment may benefit other segments. Except for these differences, the accounting policies forsegment reporting are the same as for Intel as a whole.
128

INTEL CORPORATION
NOTES TO CONSOLIDATED FINANCIAL STATEMENTS (Continued)
Net revenue and operating income (loss) for each period were as follows:
Years Ended(In Millions)
Dec 26,2015
Dec 27,2014
Dec 28,2013
Net revenue:
Client Computing Group
Platform . . . . . . . . . . . . . . . . . . . . . . . . . . . . . . . . . . . . . . . . . . . . . . . . . . . . . . . . . . . . . $ 30,654 $ 33,210 $ 32,385Other . . . . . . . . . . . . . . . . . . . . . . . . . . . . . . . . . . . . . . . . . . . . . . . . . . . . . . . . . . . . . . . 1,565 1,662 2,260
32,219 34,872 34,645
Data Center Group
Platform . . . . . . . . . . . . . . . . . . . . . . . . . . . . . . . . . . . . . . . . . . . . . . . . . . . . . . . . . . . . . 14,882 13,366 11,219Other . . . . . . . . . . . . . . . . . . . . . . . . . . . . . . . . . . . . . . . . . . . . . . . . . . . . . . . . . . . . . . . 1,095 1,021 944
15,977 14,387 12,163
Internet of Things
Platform . . . . . . . . . . . . . . . . . . . . . . . . . . . . . . . . . . . . . . . . . . . . . . . . . . . . . . . . . . . . . 1,976 1,814 1,485Other . . . . . . . . . . . . . . . . . . . . . . . . . . . . . . . . . . . . . . . . . . . . . . . . . . . . . . . . . . . . . . . 322 328 316
2,298 2,142 1,801
Software and services operating segments . . . . . . . . . . . . . . . . . . . . . . . . . . . . . . . . . 2,167 2,216 2,188
All other . . . . . . . . . . . . . . . . . . . . . . . . . . . . . . . . . . . . . . . . . . . . . . . . . . . . . . . . . . . . . . 2,694 2,253 1,911
Total net revenue . . . . . . . . . . . . . . . . . . . . . . . . . . . . . . . . . . . . . . . . . . . . . . . . . . . . . . . . . $ 55,355 $ 55,870 $ 52,708
Operating income (loss):
Client Computing Group . . . . . . . . . . . . . . . . . . . . . . . . . . . . . . . . . . . . . . . . . . . . . . . . . . $ 8,165 $ 10,323 $ 8,708Data Center Group . . . . . . . . . . . . . . . . . . . . . . . . . . . . . . . . . . . . . . . . . . . . . . . . . . . . . . . 7,844 7,390 5,456Internet of Things Group . . . . . . . . . . . . . . . . . . . . . . . . . . . . . . . . . . . . . . . . . . . . . . . . . . 515 583 532Software and services operating segments . . . . . . . . . . . . . . . . . . . . . . . . . . . . . . . . . . . . 210 81 57All other . . . . . . . . . . . . . . . . . . . . . . . . . . . . . . . . . . . . . . . . . . . . . . . . . . . . . . . . . . . . . . . (2,732) (3,030) (2,462)
Total operating income . . . . . . . . . . . . . . . . . . . . . . . . . . . . . . . . . . . . . . . . . . . . . . . . . . . . $ 14,002 $ 15,347 $ 12,291
Hewlett-Packard Company, our largest customer in 2014, separated into HP Inc. and Hewlett Packard Enterprise Company onNovember 1, 2015. These entities collectively accounted for 18% of our net revenue in 2015 (18% in 2014 and 17% in 2013). DellInc. accounted for 15% of our net revenue (16% in 2014 and 15% in 2013), and Lenovo Group Limited accounted for 13% of ournet revenue (12% in 2014 and 12% in 2013). A majority of the revenue from these customers was from the sale of platforms andother components by the CCG and DCG operating segments.
Net revenue by country as presented below is based on the billing location of the customer. Revenue from unaffiliated customersfor each period was as follows:
Years Ended(In Millions)
Dec 26,2015
Dec 27,2014
Dec 28,2013
China (including Hong Kong) . . . . . . . . . . . . . . . . . . . . . . . . . . . . . . . . . . . . . . . . . . . . . . . . . $ 11,679 $ 11,197 $ 9,890Singapore . . . . . . . . . . . . . . . . . . . . . . . . . . . . . . . . . . . . . . . . . . . . . . . . . . . . . . . . . . . . . . . . 11,544 11,573 10,997United States . . . . . . . . . . . . . . . . . . . . . . . . . . . . . . . . . . . . . . . . . . . . . . . . . . . . . . . . . . . . . 11,121 9,828 9,091Taiwan . . . . . . . . . . . . . . . . . . . . . . . . . . . . . . . . . . . . . . . . . . . . . . . . . . . . . . . . . . . . . . . . . . 10,661 8,955 8,888Other countries . . . . . . . . . . . . . . . . . . . . . . . . . . . . . . . . . . . . . . . . . . . . . . . . . . . . . . . . . . . 10,350 14,317 13,842
Total net revenue . . . . . . . . . . . . . . . . . . . . . . . . . . . . . . . . . . . . . . . . . . . . . . . . . . . . . . . . . $ 55,355 $ 55,870 $ 52,708
Revenue from unaffiliated customers outside the U.S. totaled $44.2 billion in 2015 ($46.0 billion in 2014 and $43.6 billion in 2013).
129

INTEL CORPORATION
NOTES TO CONSOLIDATED FINANCIAL STATEMENTS (Continued)
Net property, plant and equipment by country at the end of each period was as follows:
(In Millions)Dec 26,
2015Dec 27,
2014Dec 28,
2013
United States . . . . . . . . . . . . . . . . . . . . . . . . . . . . . . . . . . . . . . . . . . . . . . . . . . . . . . . . . . . . . $ 22,611 $ 24,020 $ 23,624Ireland . . . . . . . . . . . . . . . . . . . . . . . . . . . . . . . . . . . . . . . . . . . . . . . . . . . . . . . . . . . . . . . . . . 5,789 5,433 2,986Israel . . . . . . . . . . . . . . . . . . . . . . . . . . . . . . . . . . . . . . . . . . . . . . . . . . . . . . . . . . . . . . . . . . . 1,661 1,957 2,667Other countries . . . . . . . . . . . . . . . . . . . . . . . . . . . . . . . . . . . . . . . . . . . . . . . . . . . . . . . . . . . 1,797 1,828 2,151
Total property, plant and equipment, net . . . . . . . . . . . . . . . . . . . . . . . . . . . . . . . . . . . . . $ 31,858 $ 33,238 $ 31,428
Net property, plant and equipment outside the U.S. totaled $9.2 billion as of December 26, 2015 ($9.2 billion as of December 27,2014 and $7.8 billion as of December 28, 2013).
130

INTEL CORPORATION
FINANCIAL INFORMATION BY QUARTER (UNAUDITED)
2015 for Quarter Ended(In Millions, Except Per Share Amounts) December 26 September 26 June 27 March 28
Net revenue . . . . . . . . . . . . . . . . . . . . . . . . . . . . . . . . . . . . . . . . . . . . $ 14,914 $ 14,465 $ 13,195 $ 12,781Gross margin . . . . . . . . . . . . . . . . . . . . . . . . . . . . . . . . . . . . . . . . . . . $ 9,590 $ 9,111 $ 8,248 $ 7,730Net income . . . . . . . . . . . . . . . . . . . . . . . . . . . . . . . . . . . . . . . . . . . . . $ 3,613 $ 3,109 $ 2,706 $ 1,992Basic earnings per share of common stock . . . . . . . . . . . . . . . . . . . . $ 0.77 $ 0.65 $ 0.57 $ 0.42Diluted earnings per share of common stock . . . . . . . . . . . . . . . . . . . $ 0.74 $ 0.64 $ 0.55 $ 0.41Dividends per share of common stock:
Declared . . . . . . . . . . . . . . . . . . . . . . . . . . . . . . . . . . . . . . . . . . . . . $ — $ 0.4800 $ — $ 0.4800Paid . . . . . . . . . . . . . . . . . . . . . . . . . . . . . . . . . . . . . . . . . . . . . . . . $ 0.2400 $ 0.2400 $ 0.2400 $ 0.2400
Market price range common stock1:High . . . . . . . . . . . . . . . . . . . . . . . . . . . . . . . . . . . . . . . . . . . . . . . . $ 35.30 $ 30.56 $ 34.46 $ 37.18Low . . . . . . . . . . . . . . . . . . . . . . . . . . . . . . . . . . . . . . . . . . . . . . . . $ 28.76 $ 25.87 $ 30.81 $ 29.89
2014 for Quarter Ended(In Millions, Except Per Share Amounts) December 27 September 27 June 28 March 29
Net revenue . . . . . . . . . . . . . . . . . . . . . . . . . . . . . . . . . . . . . . . . . . . . $ 14,721 $ 14,554 $ 13,831 $ 12,764Gross margin . . . . . . . . . . . . . . . . . . . . . . . . . . . . . . . . . . . . . . . . . . . $ 9,621 $ 9,458 $ 8,917 $ 7,613Net income . . . . . . . . . . . . . . . . . . . . . . . . . . . . . . . . . . . . . . . . . . . . . $ 3,661 $ 3,317 $ 2,796 $ 1,930Basic earnings per share of common stock . . . . . . . . . . . . . . . . . . . . $ 0.77 $ 0.68 $ 0.56 $ 0.39Diluted earnings per share of common stock . . . . . . . . . . . . . . . . . . . $ 0.74 $ 0.66 $ 0.55 $ 0.38Dividends per share of common stock:
Declared . . . . . . . . . . . . . . . . . . . . . . . . . . . . . . . . . . . . . . . . . . . . . $ — $ 0.4500 $ — $ 0.4500Paid . . . . . . . . . . . . . . . . . . . . . . . . . . . . . . . . . . . . . . . . . . . . . . . . $ 0.2250 $ 0.2250 $ 0.2250 $ 0.2250
Market price range common stock1:High . . . . . . . . . . . . . . . . . . . . . . . . . . . . . . . . . . . . . . . . . . . . . . . . $ 37.67 $ 35.33 $ 30.93 $ 26.67Low . . . . . . . . . . . . . . . . . . . . . . . . . . . . . . . . . . . . . . . . . . . . . . . . $ 30.85 $ 30.79 $ 25.81 $ 23.52
1 Intel’s common stock (symbol INTC) trades on The NASDAQ Global Select Market. All stock prices are closing prices per TheNASDAQ Global Select Market.
131

ITEM 9. CHANGES IN AND DISAGREEMENTS WITH ACCOUNTANTS ON ACCOUNTING AND FINANCIAL DISCLOSURE
Not applicable.
ITEM 9A. CONTROLS AND PROCEDURES
Evaluation of Disclosure Controls and Procedures
Based on management’s evaluation (with the participation of our CEO and Chief Financial Officer (CFO)), as of the end of theperiod covered by this report, our CEO and CFO have concluded that our disclosure controls and procedures (as defined in Rules13a-15(e) and 15d-15(e) under the Securities Exchange Act of 1934, as amended (the Exchange Act)), are effective to providereasonable assurance that information required to be disclosed by us in reports that we file or submit under the Exchange Act isrecorded, processed, summarized, and reported within the time periods specified in U.S. Securities and Exchange Commission(SEC) rules and forms, and is accumulated and communicated to management, including our principal executive officer andprincipal financial officer, as appropriate, to allow timely decisions regarding required disclosure.
Changes in Internal Control Over Financial Reporting
There were no changes to our internal control over financial reporting (as defined in Rules 13a-15(f) and 15d-15(f) under theExchange Act) that occurred during the quarter ended December 26, 2015, that have materially affected, or are reasonably likelyto materially affect, our internal control over financial reporting.
Management Report on Internal Control Over Financial Reporting
Our management is responsible for establishing and maintaining adequate internal control over financial reporting (as defined inRules 13a-15(f) and 15d-15(f) under the Exchange Act) to provide reasonable assurance regarding the reliability of our financialreporting and the preparation of consolidated financial statements for external purposes in accordance with U.S. generallyaccepted accounting principles.
Management assessed our internal control over financial reporting as of December 26, 2015, the end of our fiscal year.Management based its assessment on criteria established in Internal Control—Integrated Framework issued by the Committee ofSponsoring Organizations of the Treadway Commission (2013 framework). Management’s assessment included evaluation ofelements such as the design and operating effectiveness of key financial reporting controls, process documentation, accountingpolicies, and our overall control environment.
Based on this assessment, management has concluded that our internal control over financial reporting was effective as of theend of the fiscal year to provide reasonable assurance regarding the reliability of financial reporting and the preparation ofconsolidated financial statements for external reporting purposes in accordance with U.S. generally accepted accountingprinciples. We reviewed the results of management’s assessment with the Audit Committee of our Board of Directors.
Our independent registered public accounting firm, Ernst & Young LLP, independently assessed the effectiveness of thecompany’s internal control over financial reporting, as stated in the firm’s attestation report, which is included within Part II, Item 8of this Form 10-K.
132

Inherent Limitations on Effectiveness of Controls
Our management, including the CEO and CFO, does not expect that our disclosure controls and procedures or our internalcontrol over financial reporting will prevent or detect all errors and all fraud. A control system, no matter how well-designed andoperated, can provide only reasonable, not absolute, assurance that the control system’s objectives will be met. The design of acontrol system must reflect the fact that there are resource constraints, and the benefits of controls must be considered relative totheir costs. Further, because of the inherent limitations in all control systems, no evaluation of controls can provide absoluteassurance that misstatements due to error or fraud will not occur or that all control issues and instances of fraud, if any, havebeen detected. The design of any system of controls is based in part on certain assumptions about the likelihood of future events,and there can be no assurance that any design will succeed in achieving its stated goals under all potential future conditions.Projections of any evaluation of the effectiveness of controls to future periods are subject to risks. Over time, controls maybecome inadequate because of changes in conditions or deterioration in the degree of compliance with policies or procedures.
ITEM 9B. OTHER INFORMATION
None.
133

PART III
ITEM 10. DIRECTORS, EXECUTIVE OFFICERS AND CORPORATE GOVERNANCE
The information in our 2016 Proxy Statement regarding directors and executive officers appearing under the headings “Proposal1: Election of Directors” and “Other Matters—Section 16(a) Beneficial Ownership Reporting Compliance” is incorporated byreference in this section. The information under the heading “Executive Officers of the Registrant” in Part I, Item 1 of thisForm 10-K is also incorporated by reference in this section. In addition, the information under the heading “CorporateGovernance” in our 2016 Proxy Statement is incorporated by reference in this section.
The Intel Code of Conduct (the Code) is our code of ethics document applicable to all employees, including all officers, andincluding our independent directors, who are not employees of the company, with regard to their Intel-related activities. The Codeincorporates our guidelines designed to deter wrongdoing and to promote honest and ethical conduct and compliance withapplicable laws and regulations. The Code also incorporates our expectations of our employees that enable us to provideaccurate and timely disclosure in our filings with the SEC and other public communications. In addition, the Code incorporatesguidelines pertaining to topics such as complying with applicable laws, rules, and regulations; reporting Code violations; andmaintaining accountability for adherence to the Code.
The full text of the Code is published on our corporate website at www.intel.com/governance. We intend to disclose futureamendments to certain provisions of the Code, or waivers of such provisions granted to executive officers and directors, on thewebsite within four business days following the date of such amendment or waiver.
ITEM 11. EXECUTIVE COMPENSATION
The information appearing in our 2016 Proxy Statement under the headings “Director Compensation,” “Compensation Discussionand Analysis,” “Report of the Compensation Committee,” and “Executive Compensation” is incorporated by reference in thissection.
134

ITEM 12. SECURITY OWNERSHIP OF CERTAIN BENEFICIAL OWNERS AND MANAGEMENT AND RELATED
STOCKHOLDER MATTERS
The information appearing in our 2016 Proxy Statement under the heading “Security Ownership of Certain Beneficial Owners andManagement” is incorporated by reference in this section.
Equity Compensation Plan Information
Information as of December 26, 2015, regarding equity compensation plans approved and not approved by stockholders issummarized in the following table (shares of common stock in millions):
Plan Category
(A)Number ofShares to
Be Issued UponExercise ofOutstanding
Options and Rights
(B)WeightedAverageExercisePrice of
OutstandingOptions ($)1
(C)Number of Shares
Remaining Available forFuture Issuance UnderEquity Incentive Plans
(Excluding SharesReflected in Column A)
2006 Equity Incentive Plan . . . . . . . . . . . . . . . . . . . . . . . . . . . 253.73
2006 Stock Purchase Plan . . . . . . . . . . . . . . . . . . . . . . . . . . . 181.3
Equity incentive plans approved by stockholders . . . . . . . . . . 165.42 $ 21.75 435.0Equity incentive plans not approved by stockholders . . . . . . . 0.94 $ 15.98 —
Total . . . . . . . . . . . . . . . . . . . . . . . . . . . . . . . . . . . . . . . . . . . . 166.3 $ 21.65 435.0
1 The weighted average exercise price does not take into account the shares of common stock issuable upon outstanding RSUsvesting, which have no exercise price.
2 Includes 112.1 million shares of common stock granted under the 2006 Equity Incentive Plan that are issuable upon RSUsvesting, including a maximum of 9.4 million shares of common stock that could be issued at the end of the requisite period foroutstanding OSUs. The remaining balance consists of outstanding stock option grants.
3 Assumes shares will be issued at the maximum vesting amount for outstanding OSUs. This number reflects a difference fromthe number of RSUs reported in “Note 18: Employee Equity Incentive Plans” to the financial statements in Part II, Item 8 of thisForm 10-K. If it is assumed that shares of common stock will be issued at the target vesting amount for outstanding OSUs, anadditional 4.7 million shares of common stock would be included in the shares of common stock available for future issuanceamount for a total of 258.4 million shares. All available shares may be granted as RSUs, OSUs, or options.
4 Shares issuable under outstanding options which were originally granted under plans that we assumed in connection withacquisitions.
ITEM 13. CERTAIN RELATIONSHIPS AND RELATED TRANSACTIONS, AND DIRECTOR INDEPENDENCE
The information appearing in our 2016 Proxy Statement under the headings “Corporate Governance” and “Certain Relationshipsand Related Transactions” is incorporated by reference in this section.
ITEM 14. PRINCIPAL ACCOUNTING FEES AND SERVICES
The information appearing in our 2016 Proxy Statement under the headings “Report of the Audit Committee” and “Proposal 2:Ratification of Selection of Independent Registered Public Accounting Firm” is incorporated by reference in this section.
135

PART IV
ITEM 15. EXHIBITS, FINANCIAL STATEMENT SCHEDULES
1. Financial Statements: See “Index to Consolidated Financial Statements” in Part II, Item 8 of this Form 10-K.
2. Financial Statement Schedule: See “Schedule II—Valuation and Qualifying Accounts” in this section of this Form 10-K.
3. Exhibits: The exhibits listed in the accompanying index to exhibits are filed, furnished, or incorporated by reference as part ofthis Form 10-K.
Certain of the agreements filed as exhibits to this Form 10-K contain representations and warranties by the parties to theagreements that have been made solely for the benefit of the parties to the agreement. These representations and warranties:• may have been qualified by disclosures that were made to the other parties in connection with the negotiation of the
agreements, which disclosures are not necessarily reflected in the agreements;• may apply standards of materiality that differ from those of a reasonable investor; and• were made only as of specified dates contained in the agreements and are subject to subsequent developments and
changed circumstances.
Accordingly, these representations and warranties may not describe the actual state of affairs as of the date that theserepresentations and warranties were made or at any other time. Investors should not rely on them as statements of fact.
* Other names and brands may be claimed as the property of others.
** Management contracts or compensation plans or arrangements in which directors or executive officers are eligible toparticipate.
Intel, the Intel logo, Intel Atom, Celeron, Celeron Inside, Intel Core, Intel Inside, the Intel Inside logo, Itanium, Pentium, PentiumInside, Quark, Intel RealSense, True Key, Thunderbolt, Xeon, Intel Xeon Phi, 3D XPoint, and Ultrabook are trademarks of IntelCorporation in the U.S. and/or other countries.
McAfee is a trademark of McAfee, Inc. in the U.S. and/or other countries.
The Bluetooth® word mark is a registered trademark owned by Bluetooth SIG, Inc. and any use of such marks by IntelCorporation is under license.
136

INTEL CORPORATION
SCHEDULE II—VALUATION AND QUALIFYING ACCOUNTS
Years Ended(In Millions)
Balance atBeginning of
Year
AdditionsCharged to
Expenses/OtherAccounts
Net(Deductions)Recoveries
Balance atEnd of Year
Allowance for doubtful receivablesDecember 26, 2015 . . . . . . . . . . . . . . . . . . . . . . . . . . . . . . . . . . . . $ 38 $ 12 $ (10) $ 40December 27, 2014 . . . . . . . . . . . . . . . . . . . . . . . . . . . . . . . . . . . . $ 38 $ 10 $ (10) $ 38December 28, 2013 . . . . . . . . . . . . . . . . . . . . . . . . . . . . . . . . . . . . $ 38 $ 5 $ (5) $ 38Valuation allowance for deferred tax assetsDecember 26, 2015 . . . . . . . . . . . . . . . . . . . . . . . . . . . . . . . . . . . . $ 595 $ 190 $ (84) $ 701December 27, 2014 . . . . . . . . . . . . . . . . . . . . . . . . . . . . . . . . . . . . $ 456 $ 128 $ 11 $ 595December 28, 2013 . . . . . . . . . . . . . . . . . . . . . . . . . . . . . . . . . . . . $ 389 $ 88 $ (21) $ 456
Deductions in allowance for doubtful receivables represent uncollectible accounts written off, net of recoveries.
137

ExhibitNumber
Incorporated by ReferenceFiled or
FurnishedHerewithExhibit Description Form File Number Exhibit
FilingDate
3.1 Intel Corporation Third Restated Certificate of Incorporation ofIntel Corporation dated May 17, 2006
8-K 000-06217 3.1 5/22/2006
3.2 Intel Corporation Bylaws, as amended and restated onJanuary 21, 2016
8-K 000-06217 3.2 1/26/2016
4.2.1 Indenture for the Registrant’s 2.95% Junior SubordinatedConvertible Debentures due 2035 between Intel Corporationand Wells Fargo Bank, National Association (as successor toCitibank N.A.), dated as of December 16, 2005 (the“Convertible Note Indenture”)
10-K 000-06217 4.2 2/27/2006
4.2.2 Indenture dated as of March 29, 2006 between IntelCorporation and Wells Fargo Bank, National Association (assuccessor to Citibank N.A.) (the “Open-Ended Indenture”)
S-3ASR 333-132865 4.4 3/30/2006
4.2.3 First Supplemental Indenture to Convertible Note Indenture,dated as of July 25, 2007
10-K 000-06217 4.2.3 2/20/2008
4.2.4 First Supplemental Indenture to Open-Ended Indenture, datedas of December 3, 2007
10-K 000-06217 4.2.4 2/20/2008
4.2.5 Indenture for the Registrant’s 3.25% Junior SubordinatedConvertible Debentures due 2039 between Intel Corporationand Wells Fargo Bank, National Association, dated as of July27, 2009
10-Q 000-06217 4.1 11/2/2009
4.2.6 Second Supplemental Indenture to Open-Ended Indenture forthe Registrant’s 1.95% Senior Notes due 2016, 3.30% SeniorNotes due 2021, and 4.80% Senior Notes due 2041, dated asof September 19, 2011
8-K 000-06217 4.01 9/19/2011
4.2.7 Third Supplemental Indenture to Open-Ended Indenture for theRegistrant’s 1.35% Senior Notes due 2017, 2.70% SeniorNotes due 2022, 4.00% Senior Notes due 2032, and 4.25%Senior Notes due 2042, dated as of December 11, 2012
8-K 000-06217 4.01 12/11/2012
4.2.8 Fourth Supplemental Indenture to Open-Ended Indenture forthe Registrant’s 4.25% Senior Notes due 2042, dated as ofDecember 14, 2012
8-K 000-06217 4.01 12/14/2012
4.2.9 Fifth Supplemental Indenture to Open-Ended Indenture, datedas of July 29, 2015, between Intel Corporation and WellsFargo Bank, National Association, as successor trustee
8-K 000-06217 4.1 7/29/2015
4.2.10 Sixth Supplemental Indenture to Open-Ended Indenture, datedas of August 11, 2015, among Intel Corporation, Wells FargoBank, National Association, as successor trustee, and ElavonFinancial Services Limited, UK Branch, as paying agent
8-K 000-06217 4.2 8/11/2015
4.2.11 Seventh Supplemental Indenture to Open-Ended Indenture,dated as of December 14, 2015, among Intel Corporation,Wells Fargo Bank, National Association, as successor trustee,and Elavon Financial Services Limited, UK Branch, as payingagent
8-K 000-06217 4.1 12/14/2015
4.2.12 Guarantee dated December 28, 2015 by Intel Corporation infavor of U.S. Bank, National Association, as Trustee for theholders of Altera’s 1.750% Senior Notes due 2017, 2.500%Senior Notes due 2018 and 4.100% Senior Notes due 2023.
8-K 000-06217 99.2 12/28/2015
Certain instruments defining the rights of holders of long-termdebt of Intel Corporation are omitted pursuant to Item601(b)(4)(iii) of Regulation S-K. Intel Corporation herebyagrees to furnish to the Securities and Exchange Commission,upon request, copies of such instruments.
10.1** Intel Corporation 2006 Equity Incentive Plan, as amended andrestated, effective May 17, 2006
8-K 000-06217 10.1 5/22/2006
138

ExhibitNumber
Incorporated by ReferenceFiled or
FurnishedHerewithExhibit Description Form File Number Exhibit
FilingDate
10.1.1** Form of Notice of Grant—Restricted Stock Units 8-K 000-06217 10.13 7/6/200610.1.2** Intel Corporation 2006 Equity Incentive Plan Standard Terms and
Conditions relating to Non-Qualified Stock Options granted onand after May 17, 2006 and before January 19, 2008 under the2006 Equity Incentive Plan (standard option program)
8-K 000-06217 10.14 7/6/2006
10.1.3** Intel Corporation Nonqualified Stock Option Agreement under the2006 Equity Incentive Plan (for options granted after May 17,2006 and before January 19, 2008 under the standard program)
8-K 000-06217 10.15 7/6/2006
10.1.4** Intel Corporation 2006 Equity Incentive Plan Terms andConditions relating to Nonqualified Stock Options granted on andafter May 17, 2006 and before January 19, 2008 under the 2006Equity Incentive Plan (for options granted under the ELTSOPoption program)
8-K 000-06217 10.19 7/6/2006
10.1.5** Form of Notice of Grant—Nonqualified Stock Options 8-K 000-06217 10.24 7/6/200610.1.6** Intel Corporation 2006 Equity Incentive Plan, as amended and
restated, effective May 16, 20078-K 000-06217 10.1 5/16/2007
10.1.7** Form of Terms and Conditions Relating to Nonqualified OptionsGranted to Paul Otellini under the 2006 Equity Incentive Plan
10-Q 000-06217 10.3 4/30/2009
10.1.8** Intel Corporation 2006 Equity Incentive Plan, as amended andrestated, effective May 20, 2009
8-K 000-06217 10.1 5/22/2009
10.1.9** Intel Corporation Non-Employee Director Restricted Stock UnitAgreement under the 2006 Equity Incentive Plan (for RSUsgranted on or after January 23, 2015 under the Director RSUprogram
10-Q 000-06217 10.1 4/27/2015
10.1.10** Intel Corporation Non-Employee Director Restricted Stock UnitAgreement under the 2006 Equity Incentive Plan (for RSUsgranted on or after January 23, 2015 under the Director OSUprogram)
10-Q 000-06217 10.2 4/27/2015
10.1.11** Intel Corporation Restricted Stock Unit Agreement under the2006 Equity Incentive Plan (for RSUs granted on or afterJanuary 23, 2015 under the Executive RSU program)
10-Q 000-06217 10.3 4/27/2015
10.1.12** Intel Corporation Restricted Stock Unit Agreement under the2006 Equity Incentive Plan (for RSUs granted on or afterJanuary 23, 2015 under the Executive OSU program)
10-Q 000-06217 10.4 4/27/2015
10.1.13** Intel Corporation Non-Employee Director Restricted Stock UnitAgreement under the 2006 Equity Incentive Plan (for RSUsgranted after January 17, 2008)
10-Q 000-06217 10.1 8/3/2009
10.1.14** Form of Notice of Grant—Restricted Stock Units 10-Q 000-06217 10.3 8/3/200910.1.15** Intel Corporation Restricted Stock Unit Agreement under the
2006 Equity Incentive Plan (for RSUs granted after January 20,2011 under the standard Management Committee Member-Restricted Stock Unit program)
8-K 000-06217 99.1 1/26/2011
10.1.16** Intel Corporation Restricted Stock Unit Agreement under the2006 Equity Incentive Plan (for RSUs granted on and afterJanuary 20, 2011 and before January 24, 2012 under thestandard OSU program)
8-K 000-06217 99.2 1/26/2011
10.1.17** Intel Corporation 2006 Equity Incentive Plan Standard Terms andConditions Relating to Restricted Stock Units Granted on andafter January 20, 2011 and before January 24, 2012 under the2006 Equity Incentive Plan (standard OSU program)
8-K 000-06217 99.3 1/26/2011
139
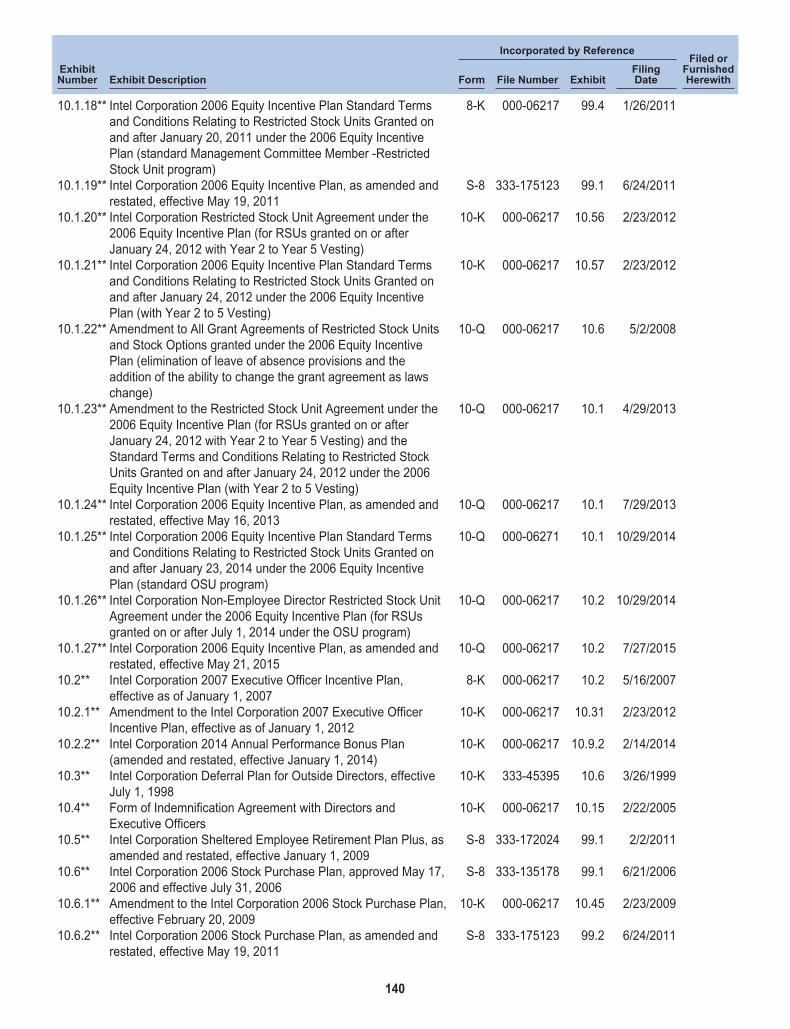
ExhibitNumber
Incorporated by ReferenceFiled or
FurnishedHerewithExhibit Description Form File Number Exhibit
FilingDate
10.1.18** Intel Corporation 2006 Equity Incentive Plan Standard Termsand Conditions Relating to Restricted Stock Units Granted onand after January 20, 2011 under the 2006 Equity IncentivePlan (standard Management Committee Member -RestrictedStock Unit program)
8-K 000-06217 99.4 1/26/2011
10.1.19** Intel Corporation 2006 Equity Incentive Plan, as amended andrestated, effective May 19, 2011
S-8 333-175123 99.1 6/24/2011
10.1.20** Intel Corporation Restricted Stock Unit Agreement under the2006 Equity Incentive Plan (for RSUs granted on or afterJanuary 24, 2012 with Year 2 to Year 5 Vesting)
10-K 000-06217 10.56 2/23/2012
10.1.21** Intel Corporation 2006 Equity Incentive Plan Standard Termsand Conditions Relating to Restricted Stock Units Granted onand after January 24, 2012 under the 2006 Equity IncentivePlan (with Year 2 to 5 Vesting)
10-K 000-06217 10.57 2/23/2012
10.1.22** Amendment to All Grant Agreements of Restricted Stock Unitsand Stock Options granted under the 2006 Equity IncentivePlan (elimination of leave of absence provisions and theaddition of the ability to change the grant agreement as lawschange)
10-Q 000-06217 10.6 5/2/2008
10.1.23** Amendment to the Restricted Stock Unit Agreement under the2006 Equity Incentive Plan (for RSUs granted on or afterJanuary 24, 2012 with Year 2 to Year 5 Vesting) and theStandard Terms and Conditions Relating to Restricted StockUnits Granted on and after January 24, 2012 under the 2006Equity Incentive Plan (with Year 2 to 5 Vesting)
10-Q 000-06217 10.1 4/29/2013
10.1.24** Intel Corporation 2006 Equity Incentive Plan, as amended andrestated, effective May 16, 2013
10-Q 000-06217 10.1 7/29/2013
10.1.25** Intel Corporation 2006 Equity Incentive Plan Standard Termsand Conditions Relating to Restricted Stock Units Granted onand after January 23, 2014 under the 2006 Equity IncentivePlan (standard OSU program)
10-Q 000-06271 10.1 10/29/2014
10.1.26** Intel Corporation Non-Employee Director Restricted Stock UnitAgreement under the 2006 Equity Incentive Plan (for RSUsgranted on or after July 1, 2014 under the OSU program)
10-Q 000-06217 10.2 10/29/2014
10.1.27** Intel Corporation 2006 Equity Incentive Plan, as amended andrestated, effective May 21, 2015
10-Q 000-06217 10.2 7/27/2015
10.2** Intel Corporation 2007 Executive Officer Incentive Plan,effective as of January 1, 2007
8-K 000-06217 10.2 5/16/2007
10.2.1** Amendment to the Intel Corporation 2007 Executive OfficerIncentive Plan, effective as of January 1, 2012
10-K 000-06217 10.31 2/23/2012
10.2.2** Intel Corporation 2014 Annual Performance Bonus Plan(amended and restated, effective January 1, 2014)
10-K 000-06217 10.9.2 2/14/2014
10.3** Intel Corporation Deferral Plan for Outside Directors, effectiveJuly 1, 1998
10-K 333-45395 10.6 3/26/1999
10.4** Form of Indemnification Agreement with Directors andExecutive Officers
10-K 000-06217 10.15 2/22/2005
10.5** Intel Corporation Sheltered Employee Retirement Plan Plus, asamended and restated, effective January 1, 2009
S-8 333-172024 99.1 2/2/2011
10.6** Intel Corporation 2006 Stock Purchase Plan, approved May 17,2006 and effective July 31, 2006
S-8 333-135178 99.1 6/21/2006
10.6.1** Amendment to the Intel Corporation 2006 Stock Purchase Plan,effective February 20, 2009
10-K 000-06217 10.45 2/23/2009
10.6.2** Intel Corporation 2006 Stock Purchase Plan, as amended andrestated, effective May 19, 2011
S-8 333-175123 99.2 6/24/2011
140

ExhibitNumber
Incorporated by ReferenceFiled or
FurnishedHerewithExhibit Description Form File Number Exhibit
FilingDate
10.6.3** Intel Corporation 2006 Stock Purchase Plan, as amended andrestated, effective July 19, 2011
10-Q 000-06217 10.3 8/8/2011
10.6.4** Intel Corporation 2006 Stock Purchase Plan, as amended andrestated, effective May 21, 2015
10-Q 000-06217 10.3 7/27/2015
10.7** Intel Corporation Special Deferred Compensation Plan S-8 333-45395 4.1 2/2/199810.8** Intel Corporation 2006 Deferral Plan for Outside Directors,
effective November 15, 200610-K 000-06217 10.41 2/26/2007
10.9 Settlement Agreement Between Advanced Micro Devices, Inc.and Intel Corporation, dated November 11, 2009
8-K 000-06217 10.1 11/12/2009
10.10 Patent Cross License Agreement between NVIDIACorporation and Intel Corporation, dated January 10, 2011,Portions of this exhibit have been omitted pursuant to an ordergranting confidential treatment.
8-K 000-06217 10.1 1/10/2011
10.11 Offer letter from Intel Corporation to Paul S. Otellini effectiveMay 17, 2013
10-Q 000-06217 10.2 7/29/2013
10.12 Agreement and Plan of Merger among Intel Corporation, 615Corporation and Altera Corporation, dated as of May 31, 2015
8-K 000-06217 2.1 6/1/2015
10.13 Transition Agreement between Intel Corporation and Reneé J.James dated July 01, 2015
10-Q 000-06217 10.4 7/27/2015
10.14 Offer Letter from Intel Corporation to Dr. Venkata S.M.“Murthy” Renduchintala dated November 17, 2015
X
12.1 Statement Setting Forth the Computation of Ratios of Earningsto Fixed Charges
X
21.1 Intel Corporation Subsidiaries X23.1 Consent of Ernst & Young LLP, Independent Registered
Public Accounting FirmX
31.1 Certification of Chief Executive Officer pursuant to Rule 13a-14(a) of the Securities Exchange Act of 1934, as amended(the Exchange Act)
X
31.2 Certification of Chief Financial Officer and PrincipalAccounting Officer pursuant to Rule 13a-14(a) of theExchange Act
X
32.1 Certification of the Chief Executive Officer and the ChiefFinancial Officer and Principal Accounting Officer pursuant toRule 13a-14(b) of the Exchange Act and 18 U.S.C. Section1350, as adopted pursuant to Section 906 of the Sarbanes-Oxley Act of 2002
X
101.INS XBRL Instance Document X101.SCH XBRL Taxonomy Extension Schema Document X101.CAL XBRL Taxonomy Extension Calculation Linkbase Document X101.DEF XBRL Taxonomy Extension Definition Linkbase Document X101.LAB XBRL Taxonomy Extension Label Linkbase Document X101.PRE XBRL Taxonomy Extension Presentation Linkbase Document X
** Management contracts or compensation plans or arrangements in which directors or executive officers are eligible toparticipate.
141

SIGNATURES
Pursuant to the requirements of Section 13 or 15(d) of the Securities Exchange Act of 1934, the Registrant has duly caused thisreport to be signed on its behalf by the undersigned, thereunto duly authorized.
INTEL CORPORATIONRegistrant
By: /S/ STACY J. SMITH
Stacy J. SmithExecutive Vice President, Chief Financial Officer, andPrincipal Accounting OfficerFebruary 12, 2016
Pursuant to the requirements of the Securities Exchange Act of 1934, this report has been signed below by the following personson behalf of the Registrant and in the capacities and on the dates indicated.
/S/ CHARLENE BARSHEFSKY /S/ BRIAN M. KRZANICH
Charlene Barshefsky Brian M. KrzanichDirectorFebruary 12, 2016
Chief Executive Officer, Director and PrincipalExecutive OfficerFebruary 12, 2016
/S/ ANEEL BHUSRI /S/ JAMES D. PLUMMER
Aneel Bhusri James D. PlummerDirector DirectorFebruary 12, 2016 February 12, 2016
/S/ ANDY D. BRYANT /S/ DAVID S. POTTRUCK
Andy D. Bryant David S. PottruckChairman of the Board and Director DirectorFebruary 12, 2016 February 12, 2016
/S/ SUSAN L. DECKER /S/ STACY J. SMITH
Susan L. Decker Stacy J. SmithDirector Executive Vice President, Chief Financial Officer, and
Principal Accounting OfficerFebruary 12, 2016February 12, 2016
/S/ JOHN J. DONAHOE /S/ FRANK D. YEARY
John J. Donahoe Frank D. YearyDirector DirectorFebruary 12, 2016 February 12, 2016
/S/ REED E. HUNDT /S/ DAVID B. YOFFIE
Reed E. Hundt David B. YoffieDirector DirectorFebruary 12, 2016 February 12, 2016
142

(This page intentionally left blank)

BOARD OF DIRECTORS
Ambassador Charlene Barshefsky5† Senior International Partner Wilmer Cutler Pickering Hale and Dorr LLP
Aneel Bhusri Co-Founder and Chief Executive Officer Workday, Inc.
Andy D. Bryant4 Chairman of the Board
Susan L. Decker1 3† 4† Principal Deck3 Ventures LLC
John J. Donahoe2 3 Chairman of the Board PayPal Inc.
Reed E. Hundt1 3 4 5 Principal REH Advisors
Brian M. Krzanich4 Chief Executive Officer
James D. Plummer1 5 John M. Fluke Professor of Electrical Engineering Stanford University
David S. Pottruck2† 4 Chairman and Chief Executive Officer Red Eagle Ventures, Inc.
Frank D. Yeary1† 5 Executive Chairman CamberView Partners, LLC
David B. Yoffie2 3† Max and Dorris Starr Professor of International Business Administration Harvard Business School
EXECUTIVE OFFICERS
Andy D. Bryant Chairman of the Board
William M. Holt Executive Vice President, General Manager, Technology and Manufacturing Group
Brian M. Krzanich Chief Executive Officer
Dr. Venkata S.M. “Murthy” Renduchintala Executive Vice President, President, Client and Internet of Things Business and System Architecture Group
Gregory R. Pearson Senior Vice President, General Manager, Sales and Marketing Group
Stacy J. Smith Executive Vice President, Chief Financial Officer
For additional listing of Intel senior management, please visit: www.intel.com/newsroom/bios
Corporate Directory**
1 Member of Audit Committee2 Member of Compensation Committee3 Member of Corporate Governance and Nominating Committee 4 Member of Executive Committee5 Member of Finance Committee† Committee Chairman
**As of February 12, 2016

Intel on NASDAQIntel’s common stock trades on The NASDAQ Global Select Market* under the symbol INTC.
Investor materials Intel’s Investor Relations website contains background on our company and our products, financial information, frequently asked questions, and our online annual report, as well as other useful information. For investor information, including additional copies of our annual report/10-K, 10-Qs, or other financial literature, visit our website at www.intc.com or call Intel at (408) 765-1480 (U.S.); (44) 1793 403 000 (Europe); (852) 2844 4555 (Hong Kong); (81) 298 47 8511 (Japan).
Direct stock purchase planIntel’s Direct Stock Purchase Plan allows stockholders to reinvest dividends and purchase Intel common stock on a weekly basis. For more information, contact Intel’s transfer agent, Computershare Trust Company, N.A., by phone at (800) 298-0146 (U.S. and Canada) or (312) 360-5123 (worldwide), or by e-mail through Computershare’s website at www.computershare.com/contactus.
Transfer agent and registrarComputershare Investor Services, LLC, 250 Royall Street, Canton, MA 02021 USA. Stockholders may call (800) 298-0146 (U.S. and Canada) or (312) 360-5123 (worldwide), or send e-mail through Computershare’s website at www.computershare.com/contactus with any questions regarding the transfer of ownership of Intel stock.
Independent registered public accounting firm Ernst & Young LLP, San Jose, California, USA.
About IntelYou know us best for our processors. But we do so much more. We are makers, catalysts, and inventors. We innovate at the boundaries of technology to make amazing experiences possible for business and society, and for every person on Earth.
Throughout our proud history, Intel has continuously expanded the reach, influence, and power of computing to improve people’s everyday lives. Intel has more than 100,000 employees in 63 countries and customers in over 120 countries, and its products and services create the foundation for limitless invention. Our innovations are bringing sight, touch, depth perception, and the ability to communicate to devices, objects, and spaces to make them smart and connected. More than an essential ingredient of the most valued devices, we harness the capability of the cloud and the Internet of Things to disrupt industries and solve global challenges—such as those in healthcare, agriculture, and commerce. We lead on important matters of policy, diversity, inclusion, education, and sustainability.
Intel has transformed from a company that primarily served the PC industry, to one now also powering the majority of the world’s data centers, connecting hundreds of millions of mobile and Internet of Things devices, and helping to secure and protect enterprise and government IT systems. Our manufacturing advantage—fueled by our pursuit of Moore’s Law—lets us continuously push the limits of performance and functionality and expand what experiences can be made possible.
Corporate governance and corporate responsibilityIntel is committed to the highest standards of business ethics and corporate governance. The Intel Code of Conduct guides the actions of our employees, officers, non-employee directors, wholly owned subsidiaries, and suppliers, ensuring consistent and uncompromising integrity as we build trusted relationships around the world. For more information about our corporate governance practices, read our latest Proxy Statement or visit www.intel.com/governance.
As a global technology and business leader, we are committed to doing the right things, the right way. Our corporate responsibility activities create value for Intel by helping to mitigate risks, save costs, protect our brand value, and develop new market opportunities. Intel’s annual Corporate Responsibility Report outlines our strategic priorities and performance on a range of environmental, social, and governance factors, including workplace practices, community engagement, and supply chain responsibility. The report and supporting materials are available at www.intel.com/responsibility.
Investor Information
© 2016 Intel Corporation. All rights reserved. Intel, Intel Core, Intel Curie, 3D XPoint, the Intel logo, Intel Experience What’s Inside, and the Intel Experience What’s Inside logo are trademarks of Intel Corporation in the U.S. and other countries. * Other names and brands may be claimed as the property of others. Printed on recycled paper using soy-based inks. 0316/TC/LM/HBD/RRD/170K

www.intel.comNews and information about Intel® products and technologies, customer support, careers, worldwide locations, and more.
www.intc.comStock information, earnings and conference webcasts, annual reports, and corporate governance and historical financial information.