2015 Annual Performance Presentation - · PDF fileOriginal Reservoir Pressure (kPa) 650...
95
2015 Annual Performance Presentation STP - McKay River Thermal Project
Transcript of 2015 Annual Performance Presentation - · PDF fileOriginal Reservoir Pressure (kPa) 650...
2015 Annual Performance Presentation
STP - McKay River Thermal Project

Outline
Introductions
3.1.1 Subsurface Overview Related to
Resource Evaluation and Recovery
3.1.2 Surface Operations, Compliance, and
Issues Not Related to Resource
Evaluation and Recovery
2

Subsurface Summary Table of
Contents
1. Project Background
2. Geology/Geoscience
3. Heave Monitoring and Caprock
4. Drilling and Completions
5. Artificial Lift
6. Instrumentation in Wells
7. Scheme Performance
8. Future Plans
3

PROJECT BACKGROUND
4

Project Background • The STP - McKay Thermal Project uses
Steam Assisted Gravity Drainage technology to recover bitumen from the underlying McMurray Formation.
• May 2009 – joint AESRD and ERCB application to construct STP - McKay Thermal Project (Phase 1).
• November 2010 - STP receives project approval:
• EPEA Approval No. 255245-00-00 • Oil Sands Conservation Act Approval
No. 11461.
• Phase 1 first steam in July 2012.
• Phase 1 first oil in October 2012.
• The Project consists of a central processing
facility (CPF), well pads (2), borrow pits, water source wells (3), observation wells, a water treatment plant, a wastewater treatment plant, access roads and operations camps.
• The facility is approved to produce 1,900m3/d (~12,000 bpd) of bitumen.
• In November of 2011 an expansion application (Phase 2) was submitted to AESRD and ERCB seeking approval to construct a second CPF on the east side of the MacKay River that would produce an additional 24,000 bpd of bitumen.
• In October of 2012 a Project Update was submitted to amend the Phase 2 application to increase production at the Phase 1 facility from 12,000 bpd to 18,000 bpd while decreasing production at the proposed Phase 2 facility from 24,000 bpd to 18,000 bpd.
5
STP-McKay: Full Bitumen Exploitation Plan
1
Conduction and cyclic steam
SAGD injector Infill horizontal wellSAGD producer

Project Background
• The Project is located
approximately 45 km
northwest of Fort McMurray
and 45 km southwest of the
community of Fort MacKay in
Section 7-91-14W4M
• Project Area is 10.5 sections
in Township 91, Range 14,
W4M and Township 91,
Range 15, W4M.
• Development Area is 1.25
Sections in Township 91,
Range 14, W4M.
6
Project Background
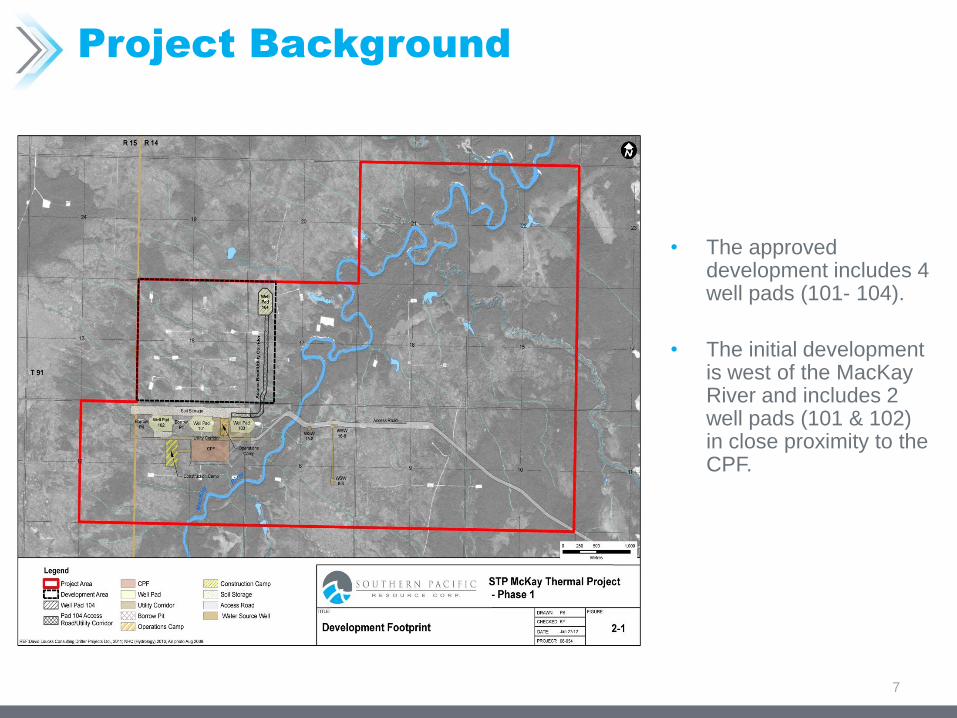
• The approved development includes 4 well pads (101- 104).
• The initial development is west of the MacKay River and includes 2 well pads (101 & 102) in close proximity to the CPF.
7

GEOLOGY/GEOSCIENCE
8

Geology Overview
Regional Geology – McMurray
Source: Mike Ranger’s Regional Study, 2011 9
STP McKay (T91-14w4)
McMurray Net Pay
McKay OBIP by Volumetrics
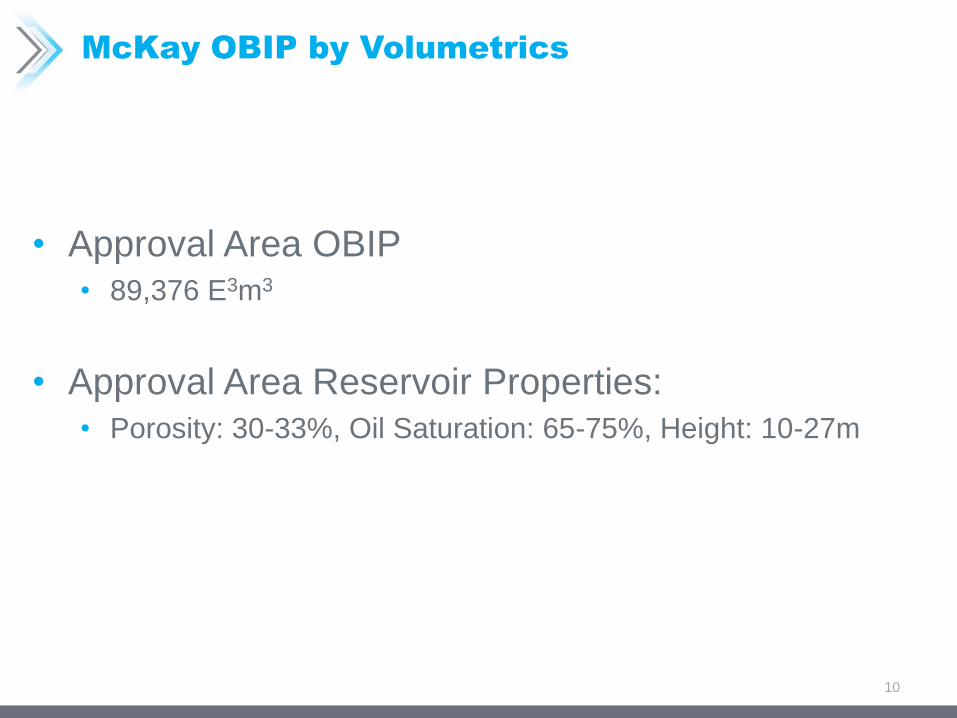
• Approval Area OBIP
• 89,376 E3m3
• Approval Area Reservoir Properties:
• Porosity: 30-33%, Oil Saturation: 65-75%, Height: 10-27m
10
Average Reservoir Properties
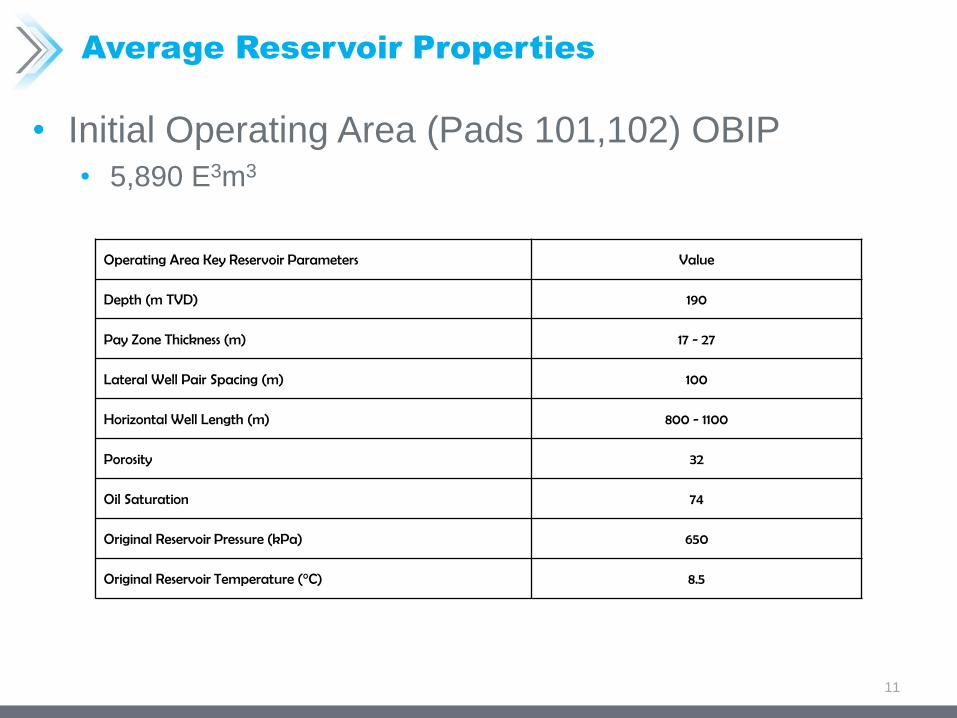
• Initial Operating Area (Pads 101,102) OBIP
• 5,890 E3m3
11
Operating Area Key Reservoir Parameters Value
Depth (m TVD) 190
Pay Zone Thickness (m) 17 - 27
Lateral Well Pair Spacing (m) 100
Horizontal Well Length (m) 800 - 1100
Porosity 32
Oil Saturation 74
Original Reservoir Pressure (kPa) 650
Original Reservoir Temperature (°C) 8.5

Isopach Map of Net Bitumen Pay with 2D Seismic lines
T. 91
R. 14W4 R. 15
31 36
6 1 Pay calculated: • GR <60 api
• Density >27% porosity
• Resistivity >20 ohm*m
Project Area
12

Volumetric Polygons on McMurray Net Bitumen Pay Map
T. 91
R. 15 R. 14W4
Pad 101
Pad 102
Project Area
13
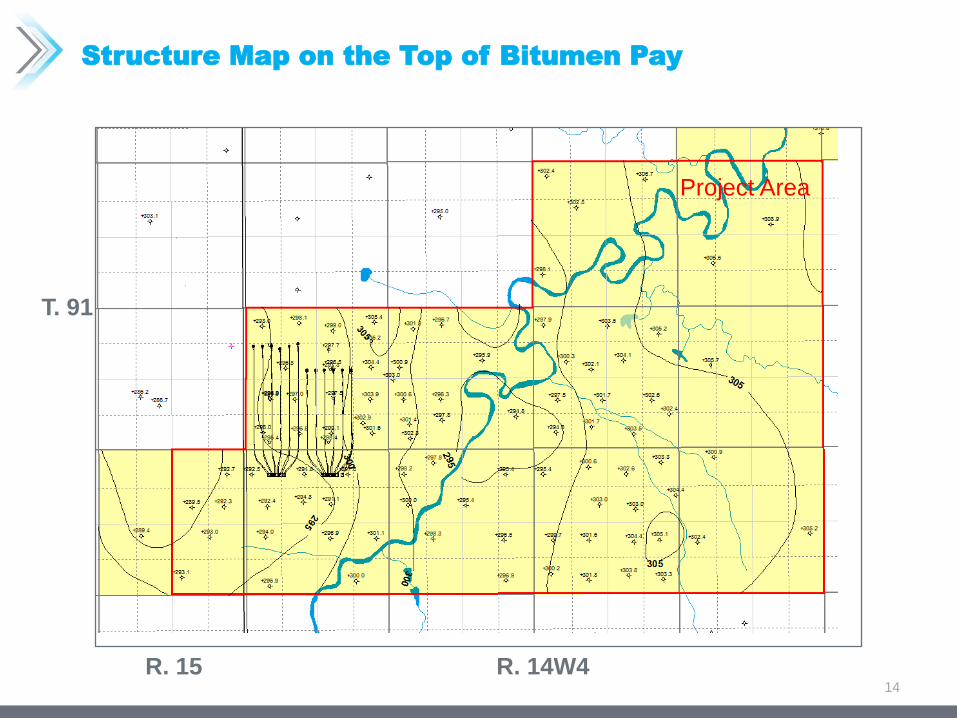
Structure Map on the Top of Bitumen Pay
T. 91
R. 14W4 R. 15
Project Area
14
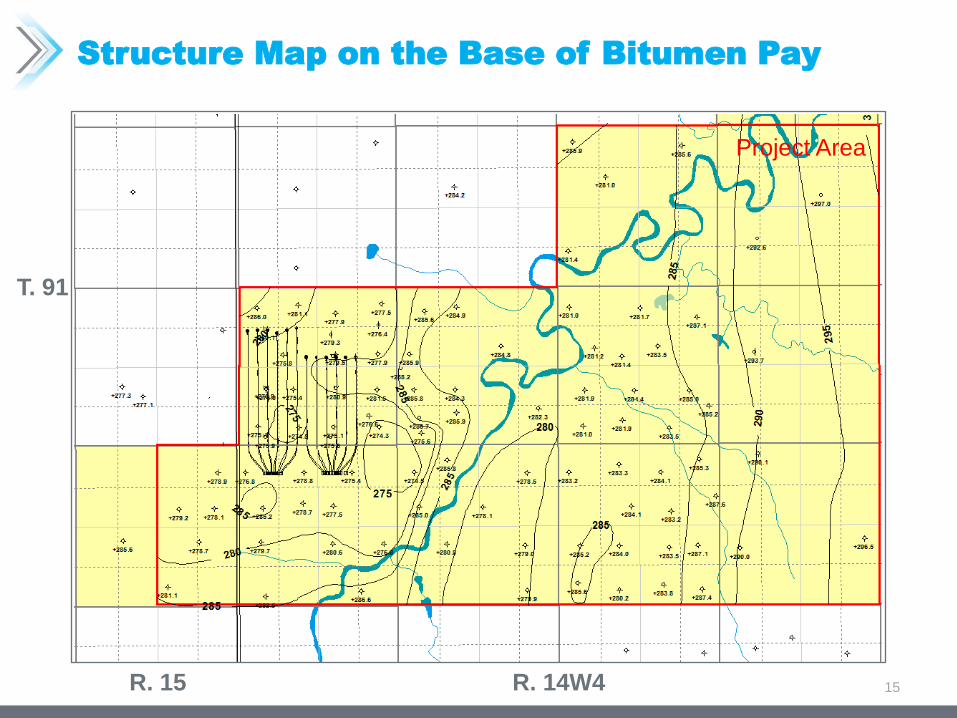
Structure Map on the Base of Bitumen Pay
T. 91
R. 14W4 R. 15
Project Area
15

STP-McKay Core Data
T. 91
R. 14W4
Project
Area
STP Lands
Delineation
Wells
96 107
Cored Wells 83 93
Wells
Drilled in
2012-13
6 13
16
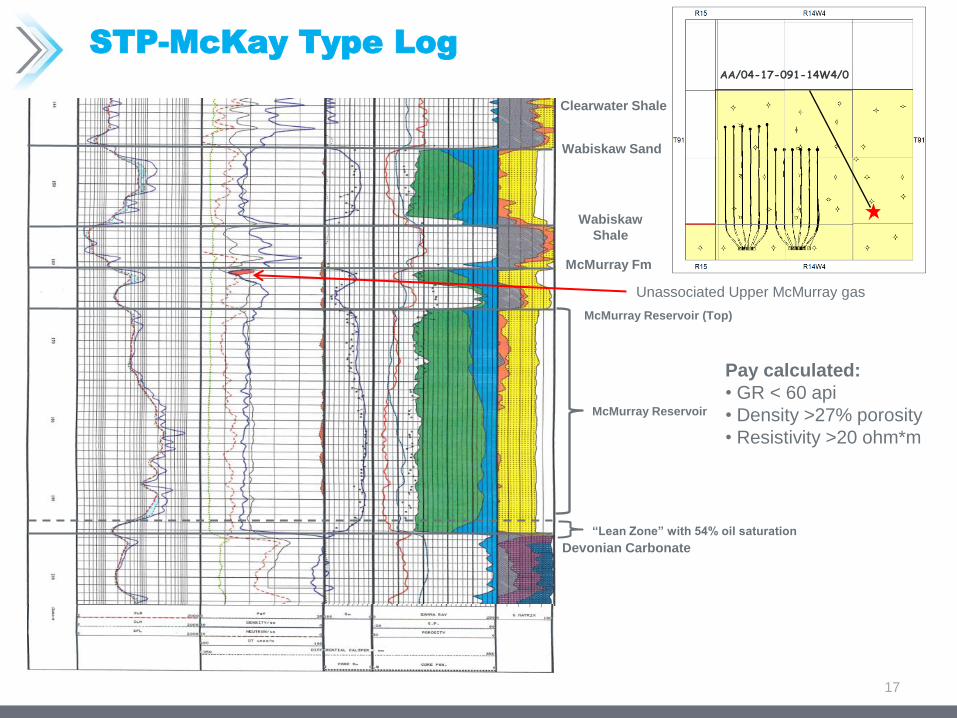
Wabiskaw Sand
McMurray Fm
McMurray Reservoir
Wabiskaw
Shale
Devonian Carbonate
“Lean Zone” with 54% oil saturation
Pay calculated:
• GR < 60 api
• Density >27% porosity
• Resistivity >20 ohm*m
Clearwater Shale
Unassociated Upper McMurray gas
McMurray Reservoir (Top)
17
STP-McKay Type Log
AA/04-17-091-14W4/0

18
STP-McKay McMurray Facies Types
Facies Name % Shale Sample Photo
F1 Upper Clean
Sand 2.5%
F2 Bioturbated
Facies 8.1%
F3 Lower Clean
Sand 2.5%
F4 Interbedded
Sand 20.0%
~ 20 cm
F4
F3
F3
F2
F2
F1
0%
10%
20%
30%
40%
50%
60%
70%
80%
90%
100%
Phase 1 Phase 2
• High quality reservoir identified in Phases
1 & 2
• No significant lean (“thief”) zones in
either Phase

X
X
X
X = Thin Section Samples
X
Main Reservoir • Fine to Medium grained (180-250 um)
• Moderately sorted, Subrounded with elongate and spherical grains
• Framework consists of quartz, chert, siltstones with some feldspars
• Similar clays with less interstitial clay found in the rock matrix.
• XRD: Analysis shows 93% qtz, 2% K-feldspar, 1% pyrite and 4% total clay.
Siltston
e
(Rx
Frag)
Quartz
Chert
Clay
Upper Reservoir (Bioturbated) • Very Fine to Fine grained (<180 um)
• Moderately sorted, Subangular with elongate grains
• Framework consists of quartz, common chert, siltstones with some feldspars
• Clays are within the microporosity of the chert or are grains that were
transported as a clast, but also exist within the pore spaces. Pore space has
10% clay in the pore space.
• XRD: Analysis shows 86% qtz, 4% K-feldspar, 2% Plagioclase, 1% dolomite,
1% pyrite and 6% total clay.
X
19
STP-McKay Core Analysis/Thin Section
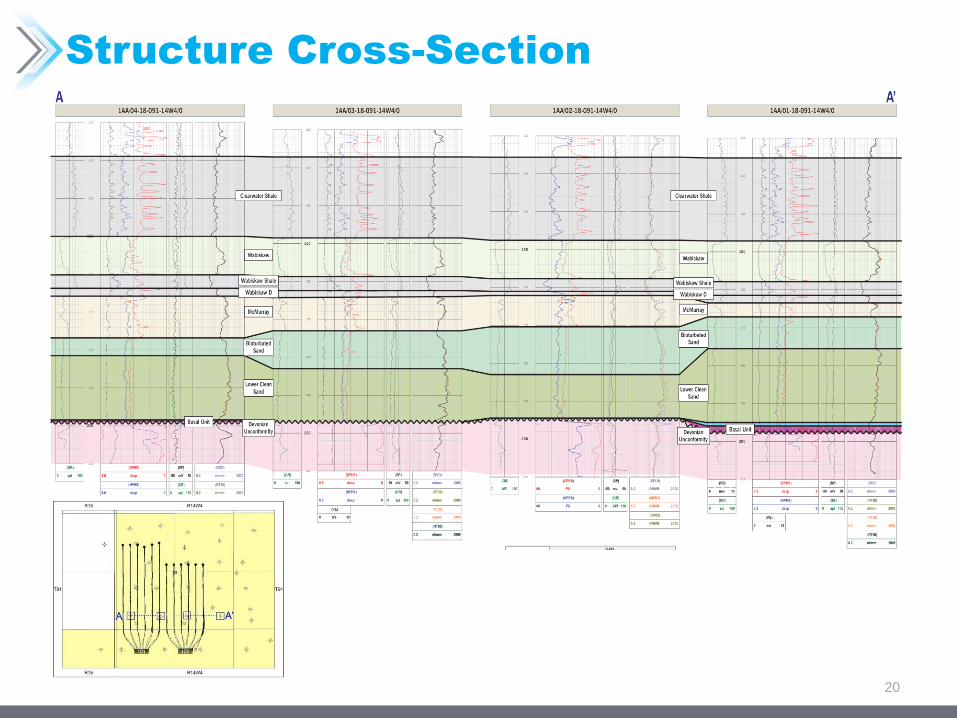
Structure Cross-Section
20
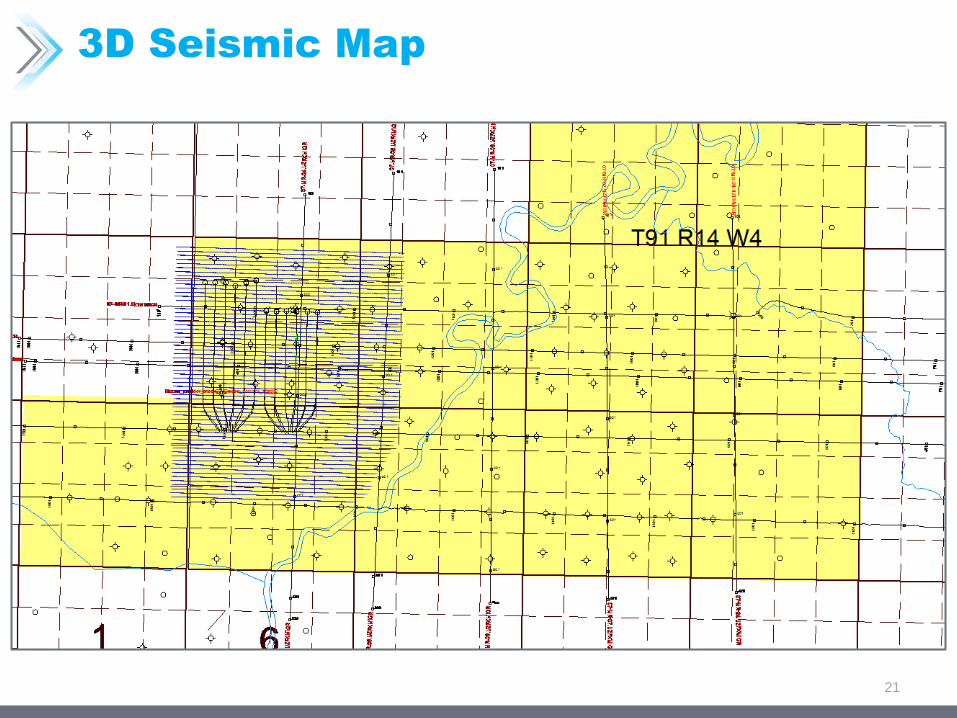
3D Seismic Map
21
HEAVE MONITORING
AND CAPROCK
22
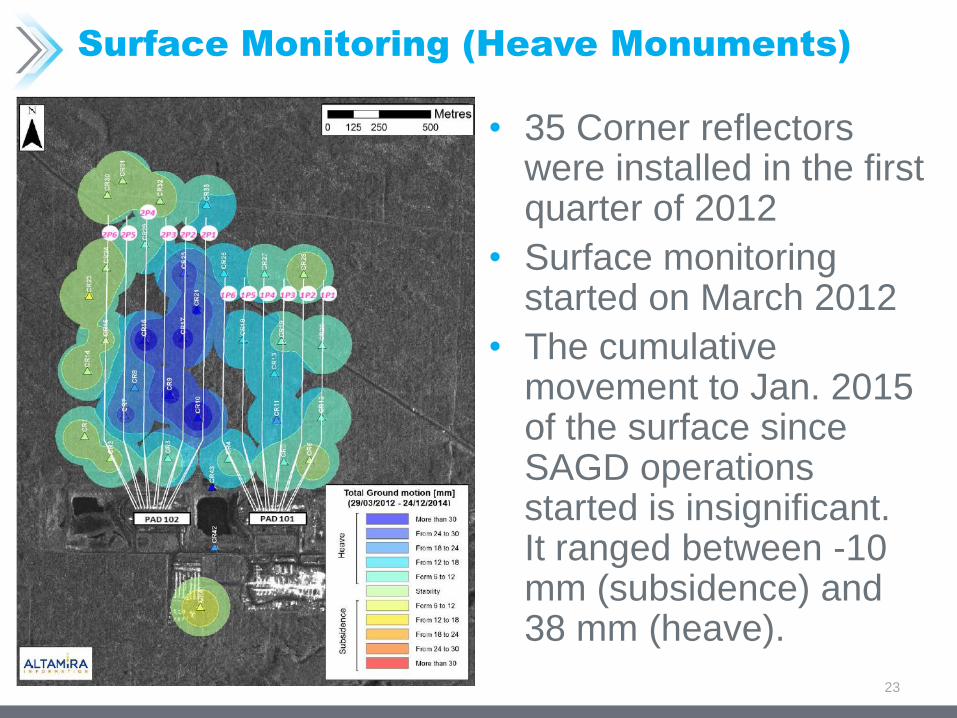
Surface Monitoring (Heave Monuments)
• 35 Corner reflectors were installed in the first quarter of 2012
• Surface monitoring started on March 2012
• The cumulative movement to Jan. 2015 of the surface since SAGD operations started is insignificant. It ranged between -10 mm (subsidence) and 38 mm (heave).
23

Caprock Integrity
• AER approved Maximum Operating Pressure (MOP) of 2450 kPa. • STP met all ERCB conditions and information requests and received approval June
2011
• Detailed caprock characterization studies were completed by STP and leading industry experts to evaluate sustained, caprock integrity at a MOP of 2450 kPa.
• Caprock integrity studies focused on: • Core and geological log evaluations (Weatherford,Advanced Geotechnology)
• No fault planes observed on logs or in core.
• No borehole breakouts/drilling induced fractures observed from 17 HMI logs.
• Laboratory testing (reservoir & geomechanical) • Low permeability caprock.
• Geomechanical properties derived from lab testing.
• Mini-frac testing for characterizing in situ stress state • Mini-frac tests conducted at 2 wells.
• Geomechanical simulation (Taurus Reservoir Solutions) • 2450kPa operating pressure is conservative.
• MOP exceeded during approved High Pressure Steam Stimulation (HPSS).
24
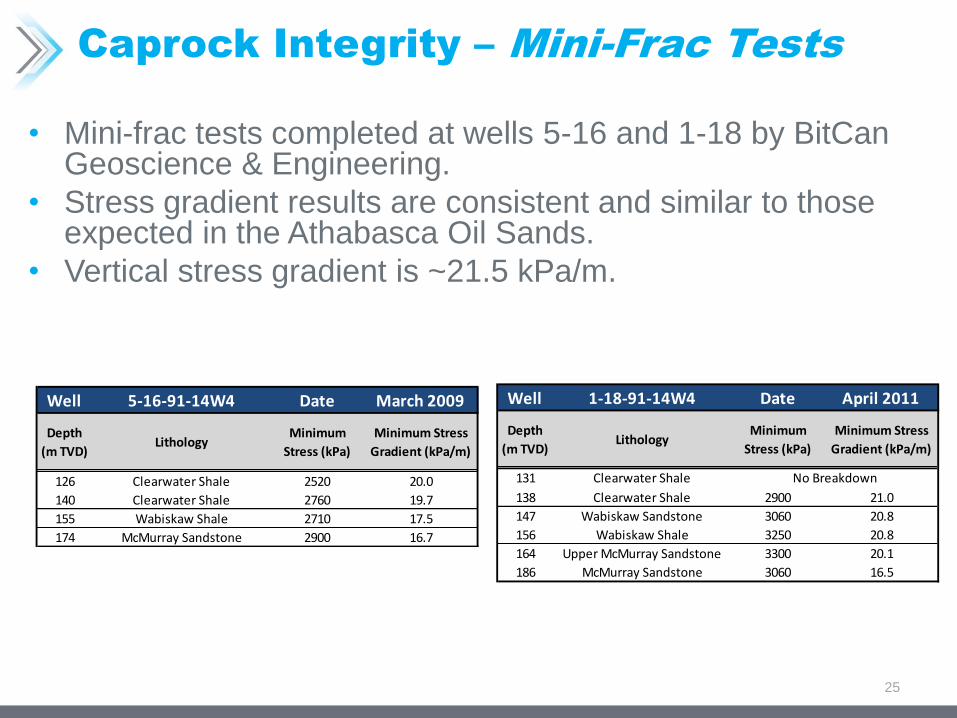
Caprock Integrity – Mini-Frac Tests
• Mini-frac tests completed at wells 5-16 and 1-18 by BitCan Geoscience & Engineering.
• Stress gradient results are consistent and similar to those expected in the Athabasca Oil Sands.
• Vertical stress gradient is ~21.5 kPa/m.
25
126 Clearwater Shale 2520 20.0
140 Clearwater Shale 2760 19.7
155 Wabiskaw Shale 2710 17.5
174 McMurray Sandstone 2900 16.7
Well 5-16-91-14W4 Date March 2009
Depth
(m TVD)Lithology
Minimum
Stress (kPa)
Minimum Stress
Gradient (kPa/m)
131 Clearwater Shale
138 Clearwater Shale 2900 21.0
147 Wabiskaw Sandstone 3060 20.8
156 Wabiskaw Shale 3250 20.8
164 Upper McMurray Sandstone 3300 20.1
186 McMurray Sandstone 3060 16.5
Date April 2011
No Breakdown
Depth
(m TVD)Lithology
Minimum
Stress (kPa)
Minimum Stress
Gradient (kPa/m)
Well 1-18-91-14W4

Caprock Integrity – Caprock
Fracture Pressure
• Assessment of minimum fracture pressure (Smin) at the base of the Clearwater Formation using mini-frac test results.
• Smin from both wells 5-16 and 1-18 are consistent.
• Smin fracture pressure at the base of the Clearwater Formation caprock is between ~2860 kPa and ~ 3020 kPa.
26
(m) (kPa/m) (kPa)
5-16 145 19.7 2857
1-18 144 21.0 3024
Note: Base of Clearwater Formation caprock determined from 1-18 well log.
Depth to
Caprock BaseFracture Gradient
Smin Fracture
PressureWell
Caprock Integrity – Monitoring
• Clearwater Formation:
• 6 vertical, nested observation wells measuring pressure and
temperature.
• Wabiskaw Member:
• 1 horizontal well measuring temperature and pressure
• Surface heave monitoring program.
• Blanket Gas system to monitor bottomhole injection
pressures.
27

DRILLING/COMPLETIONS
28
Drilling and Completions – Well Layout
29
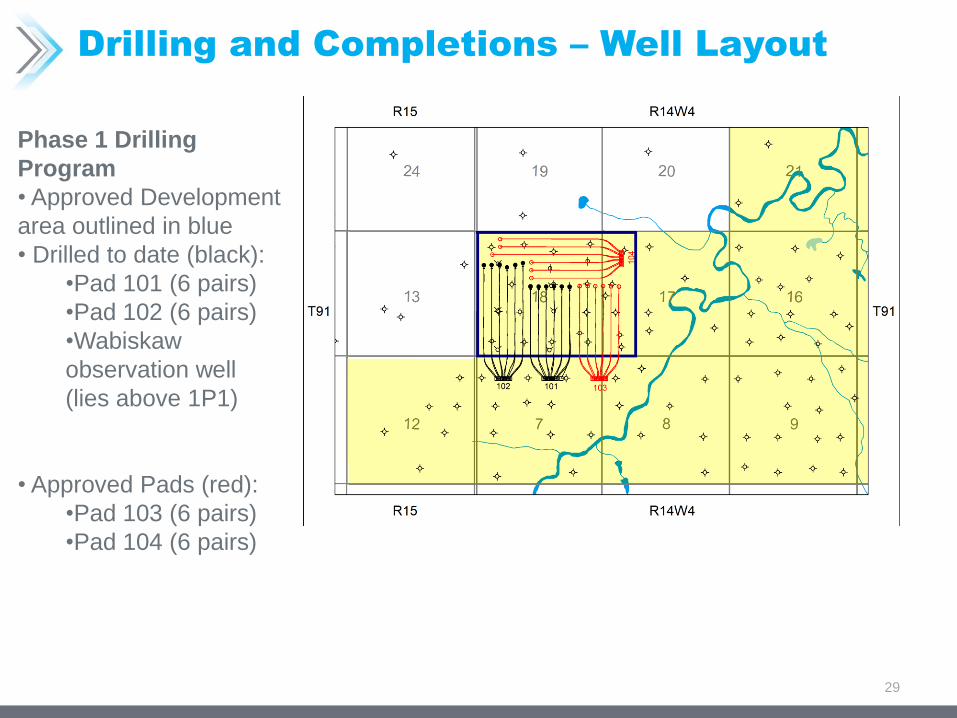
Phase 1 Drilling
Program
• Approved Development
area outlined in blue
• Drilled to date (black):
•Pad 101 (6 pairs)
•Pad 102 (6 pairs)
•Wabiskaw
observation well
(lies above 1P1)
• Approved Pads (red):
•Pad 103 (6 pairs)
•Pad 104 (6 pairs)

Drilling and Completions – Pad 101 SAGD Well
Design for Injection and Production (Gas Lift)
30

Drilling and Completions – Pad 102 SAGD Well
Design for Injection and Production (Gas Lift)
31

Installation
• Scab liner with swell packers and ICD tools were run.
• Six installations done to date in production wells (1P2,1P5,1P6,2P1,2P2,2P5)
• Both short and long string terminate at the heel.
• Coil tubing with temperature instrumentation is run to toe.
Drilling and Completions – ICD Installation for
Production (Gas Lift)

Artificial Lift
• All production wells are equipped for gas lift
• Amount of lift gas required is dependent on
operating pressure/temperature of the well.
• Using 3.5 to 7.2 E3m3/d lift gas volume and well
operating range has varied from 1200kPa to 2250kPa.
• Gas lift has been successful in achieving lift
through various down hole operating
temperatures and pressure.
33

INSTRUMENTATION
34
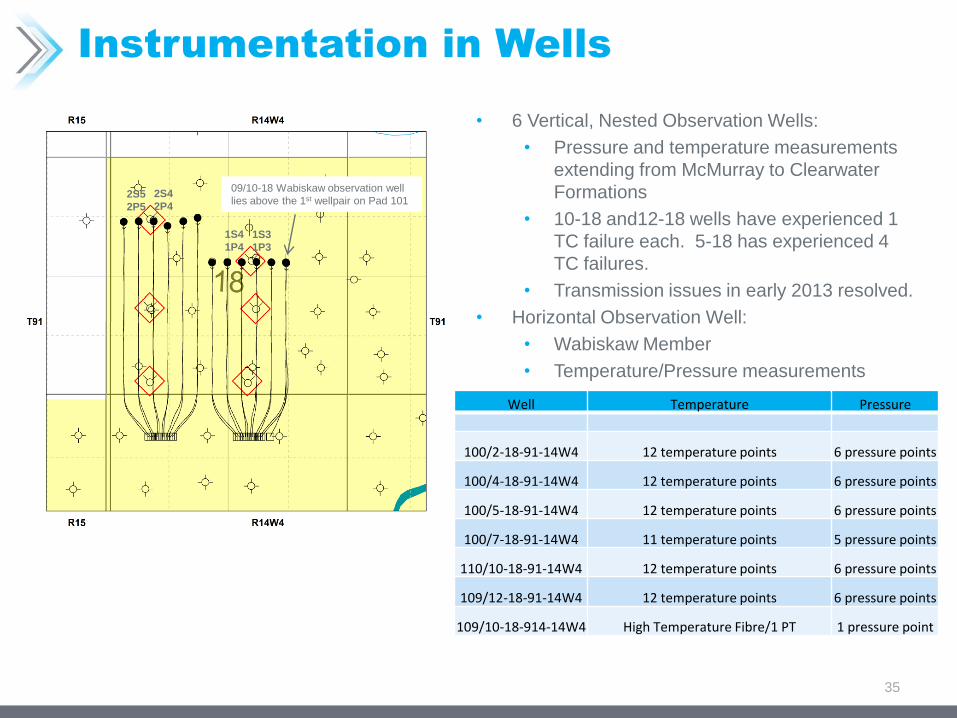
Instrumentation in Wells
• 6 Vertical, Nested Observation Wells:
• Pressure and temperature measurements
extending from McMurray to Clearwater
Formations
• 10-18 and12-18 wells have experienced 1
TC failure each. 5-18 has experienced 4
TC failures.
• Transmission issues in early 2013 resolved.
• Horizontal Observation Well:
• Wabiskaw Member
• Temperature/Pressure measurements
35
Well Temperature Pressure
100/2-18-91-14W4 12 temperature points 6 pressure points
100/4-18-91-14W4 12 temperature points 6 pressure points
100/5-18-91-14W4 12 temperature points 6 pressure points
100/7-18-91-14W4 11 temperature points 5 pressure points
110/10-18-91-14W4 12 temperature points 6 pressure points
109/12-18-91-14W4 12 temperature points 6 pressure points
109/10-18-914-14W4 High Temperature Fibre/1 PT 1 pressure point
09/10-18 Wabiskaw observation well
lies above the 1st wellpair on Pad 101 2S5
2P5
2S4
2P4
1S3
1P3
1S4
1P4

Instrumentation in Wells – Typical
Vertical Observation Well
36
12 thermocouples spaced between the Base of McMurray to Clearwater
6 piezometers spaced between Base of McMurray to Clearwater
Instrumentation strapped to outside of casing string
Surface casing
177.8 mm OD, 25.3 kg/m, H-40 STC
Thermal cement to surface
Open Hole - 159 mm
Production Casing
114.3 mm, 15.6 kg/m, L-80, NSCT set at 206.5 m
Cemented to surface with thermal cement
Casing
Centralizer
Thermocouples
Clearwater Shale Top
Piezometers
Wabiskaw Sand
Wabiskaw Shale
McMurray
Devonian
Southern Pacific Resource CorpTypical Observation Well Schematic (AB/02-18-91-14W4)
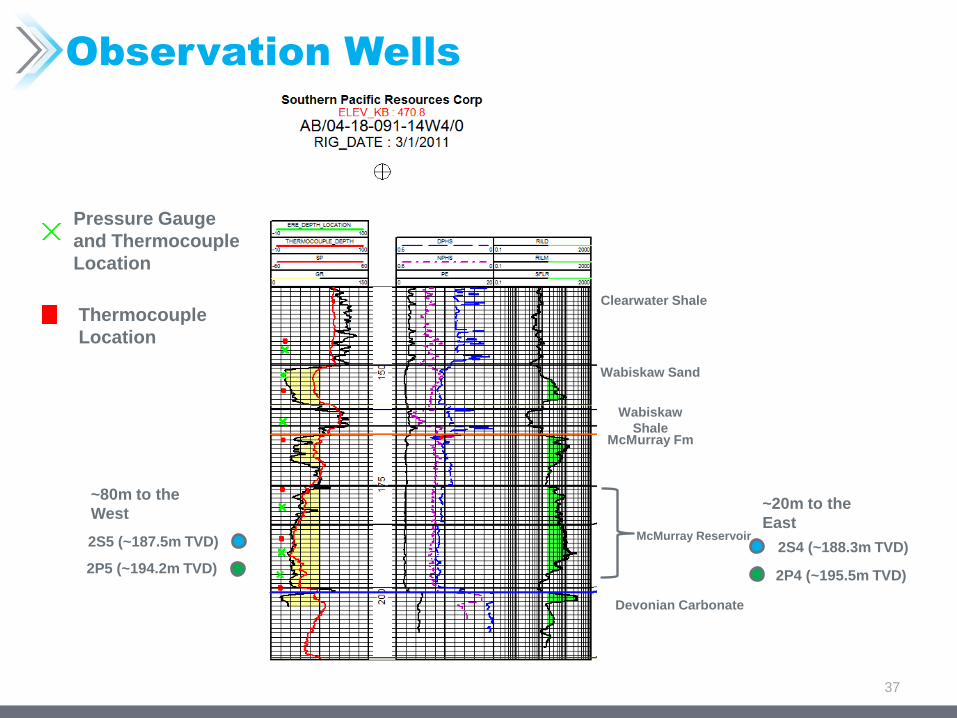
Wabiskaw Sand
McMurray Fm
McMurray Reservoir
Wabiskaw
Shale
Devonian Carbonate
Clearwater Shale
2P4 (~195.5m TVD)
2S4 (~188.3m TVD)
~20m to the
East
2P5 (~194.2m TVD)
2S5 (~187.5m TVD)
~80m to the
West
Pressure Gauge
and Thermocouple
Location
Thermocouple
Location
37
Observation Wells

McMurray Reservoir
2P4 (~194.8m TVD)
2S4 (~188.6m TVD)
~23m to the
East
2P5 (~192.5m TVD)
2S5 (~186.6m TVD)
~77m to the
West
Wabiskaw Sand
McMurray Fm
Wabiskaw
Shale
Devonian Carbonate
Clearwater Shale
Pressure Gauge
and Thermocouple
Location
Thermocouple
Location
38
Observation Wells
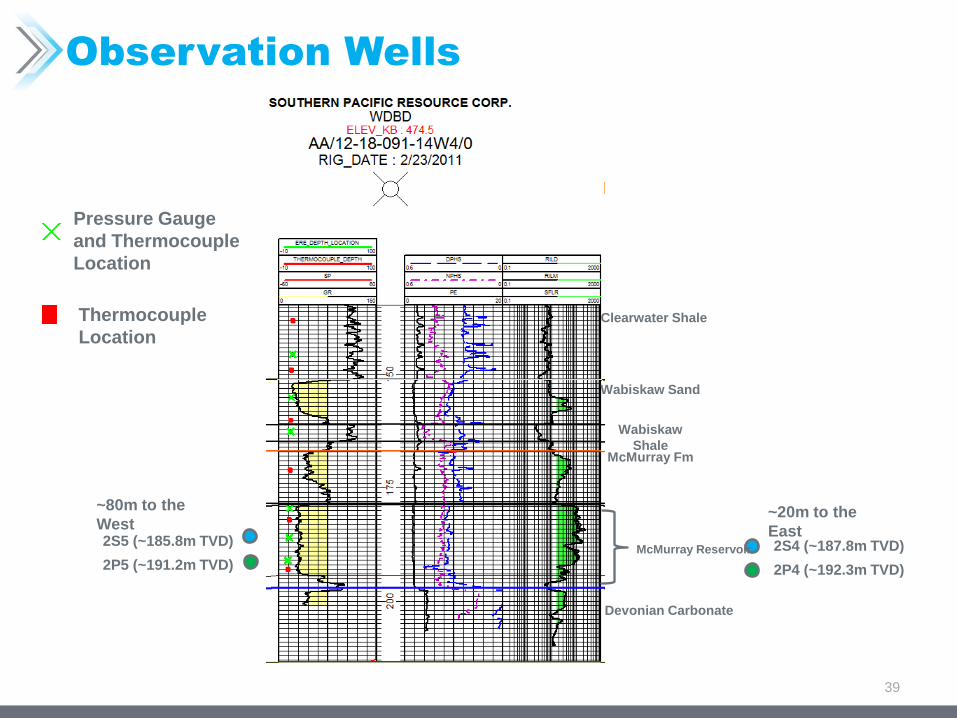
2P4 (~192.3m TVD)
2S4 (~187.8m TVD)
~20m to the
East
2P5 (~191.2m TVD)
2S5 (~185.8m TVD)
~80m to the
West
Wabiskaw Sand
McMurray Fm
McMurray Reservoir
Wabiskaw
Shale
Devonian Carbonate
Clearwater Shale
Pressure Gauge
and Thermocouple
Location
Thermocouple
Location
39
Observation Wells

1P3 (~193.5m TVD)
1S3 (~186.5m TVD)
~60m to the
East
1P4 (~193.2m TVD)
1S4 (~186.7m TVD)
~40m to the
West
Wabiskaw Sand
McMurray Fm
McMurray Reservoir
Wabiskaw
Shale
Devonian Carbonate
Clearwater Shale
Pressure Gauge
and Thermocouple
Location
Thermocouple
Location
40
Observation Wells

1P3 (~190.8m TVD)
1S3 (~184.6m TVD)
~14 m to the East
1P4 (~189.1m TVD)
1S4 (~183.5m TVD)
~93m to the
West
Wabiskaw Sand
McMurray Fm
McMurray Reservoir
Wabiskaw
Shale
Devonian Carbonate
Clearwater Shale
Pressure Gauge
and Thermocouple
Location
Thermocouple
Location
41
Observation Wells
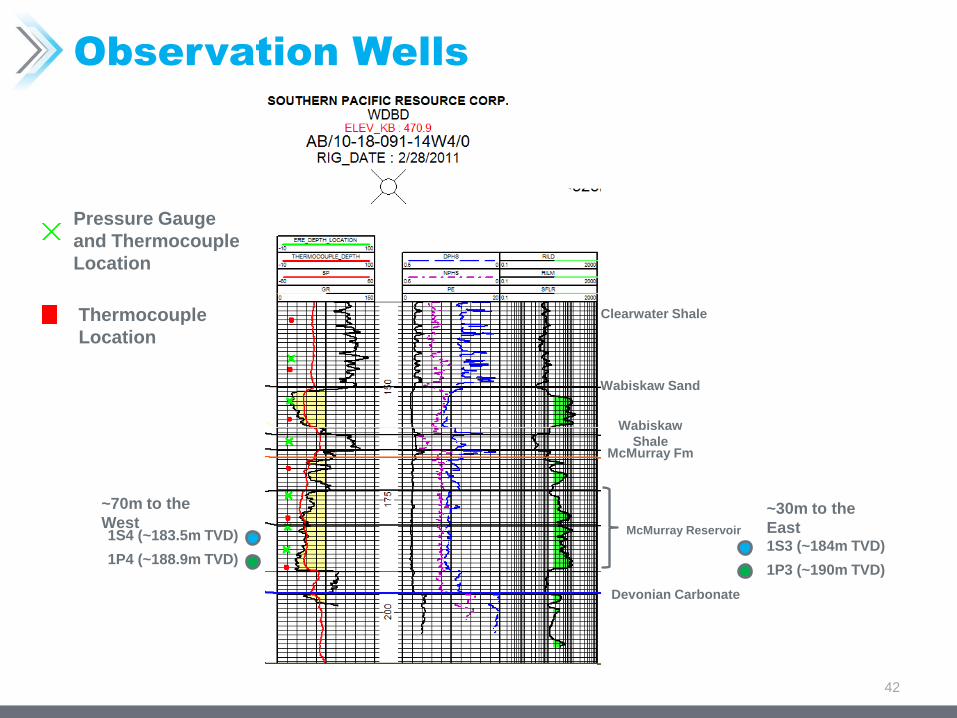
1P3 (~190m TVD)
1S3 (~184m TVD)
~30m to the
East
1P4 (~188.9m TVD)
1S4 (~183.5m TVD)
~70m to the
West
Wabiskaw Sand
McMurray Fm
McMurray Reservoir
Wabiskaw
Shale
Devonian Carbonate
Clearwater Shale
Pressure Gauge
and Thermocouple
Location
Thermocouple
Location
42
Observation Wells

Drilling and Completions – Pad 101
Wabiskaw Observation Well Design
43
TVD ~156mKB
38.1mm Coil Tubing with Piezometer @
420mKB
• Horizontal observation well designed and drilled in Wabiskaw formation for potential future
production from zone.

44
Observation Wells
07-18-091-14W4 Temperature – 1P3 Midpoint
140
150
160
170
180
190
0 10 20 30 40 50 60 70 80 90 100
Dep
th (
mK
B)
Temperature (oC)
100/7-18-91-14W4
Apr-13 May-13 Jun-13 Jul-13 Aug-13 Sep-13 Oct-13 Nov-13 Dec-13 Jan-14 Feb-14 Mar-14
Apr-14 May-14 Jun-14 Jul-14 Aug-14 Sep-14 Oct-14 Nov-14 Dec-14 Jan-15 Feb-15 Mar-15
WABISKAW
WABISKAW SHALE
WABISKAW
MCMURRA
BIOTURBATED
LOWER CLEAN
BASAL UNIT
Temperature data from 149 mTVD and 177
mTVD have been reversed. Temperature points
have been mapped incorrectly at surface.

45
Observation Wells
07-18-091-14W4 Pressure – 1P3 Midpoint
140
150
160
170
180
190
0 500 1000 1500 2000 2500
Dep
th (
mK
B)
Pressure (kPa)
100/7-18-91-14W4
Apr-13 May-13 Jun-13 Jul-13 Aug-13 Sep-13 Oct-13 Nov-13 Dec-13 Jan-14 Feb-14 Mar-14 Apr-14 May-14 Jun-14 Jul-14 Aug-14 Sep-14 Oct-14 Nov-14 Dec-14 Jan-15 Feb-15 Mar-15
WABISKAW SAND
WABISKAW SHALE
WABISKAW
MCMURRAY
BIOTURBATED SAND
LOWER CLEAN SAND
BASAL UNIT
46
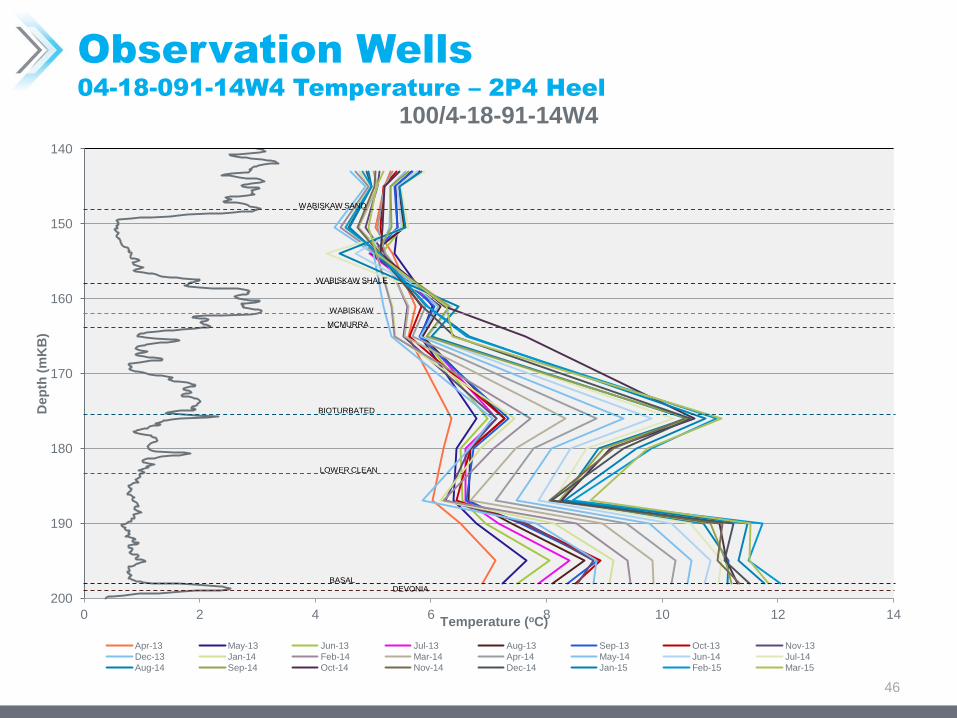
Observation Wells
04-18-091-14W4 Temperature – 2P4 Heel
140
150
160
170
180
190
200
0 2 4 6 8 10 12 14
Dep
th (
mK
B)
Temperature (oC)
100/4-18-91-14W4
Apr-13 May-13 Jun-13 Jul-13 Aug-13 Sep-13 Oct-13 Nov-13
Dec-13 Jan-14 Feb-14 Mar-14 Apr-14 May-14 Jun-14 Jul-14
Aug-14 Sep-14 Oct-14 Nov-14 Dec-14 Jan-15 Feb-15 Mar-15
WABISKAW SAND
WABISKAW SHALE
WABISKAW
MCMURRA
BIOTURBATED
LOWER CLEAN
BASAL DEVONIA

47
Observation Wells
04-18-091-14W4 Pressure – 2P4 Heel
140
150
160
170
180
190
200
0 500 1000 1500 2000 2500
Dep
th (
mK
B)
Pressure (kPa)
100/4-18-91-14W4
Apr-13 May-13 Jun-13 Jul-13 Aug-13 Sep-13 Oct-13 Nov-13
Dec-13 Jan-14 Feb-14 Mar-14 Apr-14 May-14 Jun-14 Jul-14
Aug-14 Sep-14 Nov-14 Dec-14 Jan-15 Feb-15 Mar-15
WABISKAW SAND
WABISKAW SHALE
WABISKAW
MCMURRAY
BIOTURBATED SAND
LOWER CLEAN SAND
BASAL UNIT DEVONIAN

Instrumentation in Wells
• Continuing to replace failed fiber strings in Pad 1 when
opportunities arise.
• Fiber strings in 1P3 and 1P5 need to be replaced.
• Original Pad 1 fibers failed as a result of moisture invading
the capillary lines. Previous manufacturing process has
been revised to ensure proper containment of fiber.
• Pad 2 Thermocouples continue to provide accurate data.
• No appreciable temperature response in McMurray
observation wells as of yet. Hottest temperature ~80 Deg C.
• As expected, there has been no temperature or pressure
response observed in the Wabiskaw observation well.
48

Scheme Performance
49
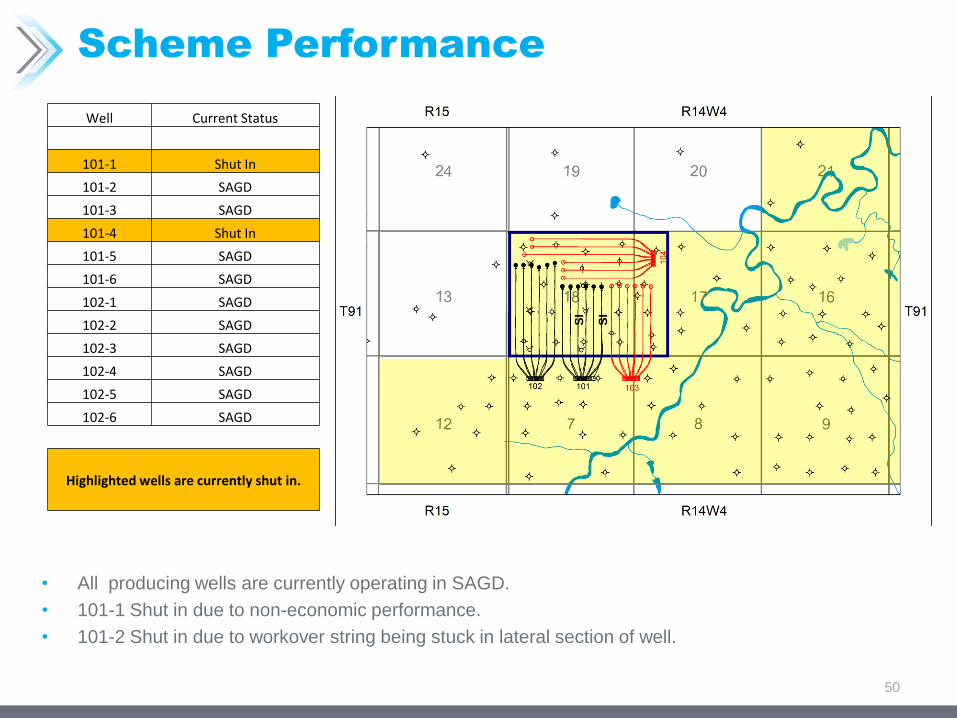
Scheme Performance
• All producing wells are currently operating in SAGD.
• 101-1 Shut in due to non-economic performance.
• 101-2 Shut in due to workover string being stuck in lateral section of well.
50
Well Current Status
101-1 Shut In
101-2 SAGD
101-3 SAGD
101-4 Shut In
101-5 SAGD
101-6 SAGD
102-1 SAGD
102-2 SAGD
102-3 SAGD
102-4 SAGD
102-5 SAGD
102-6 SAGD
Highlighted wells are currently shut in.
SI
SI

Scheme Performance
51
0.00
2.00
4.00
6.00
8.00
10.00
12.00
14.00
16.00
18.00
20.00
0
500
1,000
1,500
2,000
2,500
Jul-12 Sep-12 Nov-12 Jan-13 Mar-13 May-13 Jul-13 Sep-13 Nov-13 Jan-14 Mar-14 May-14 Jul-14 Sep-14 Nov-14 Jan-15 Mar-15
SO
R
Flu
ids (
m3/d
)
STP McKay Field Production
Oil Water Steam SOR

Scheme Performance
52
0.00
2.00
4.00
6.00
8.00
10.00
12.00
14.00
16.00
18.00
20.00
0
200
400
600
800
1,000
1,200
1,400
Jul-12 Sep-12 Nov-12 Jan-13 Mar-13 May-13 Jul-13 Sep-13 Nov-13 Jan-14 Mar-14 May-14 Jul-14 Sep-14 Nov-14 Jan-15 Mar-15
SO
R
Flu
ids (
m3/d
)
STP McKay Pad 101 Production
Oil Water Steam SOR
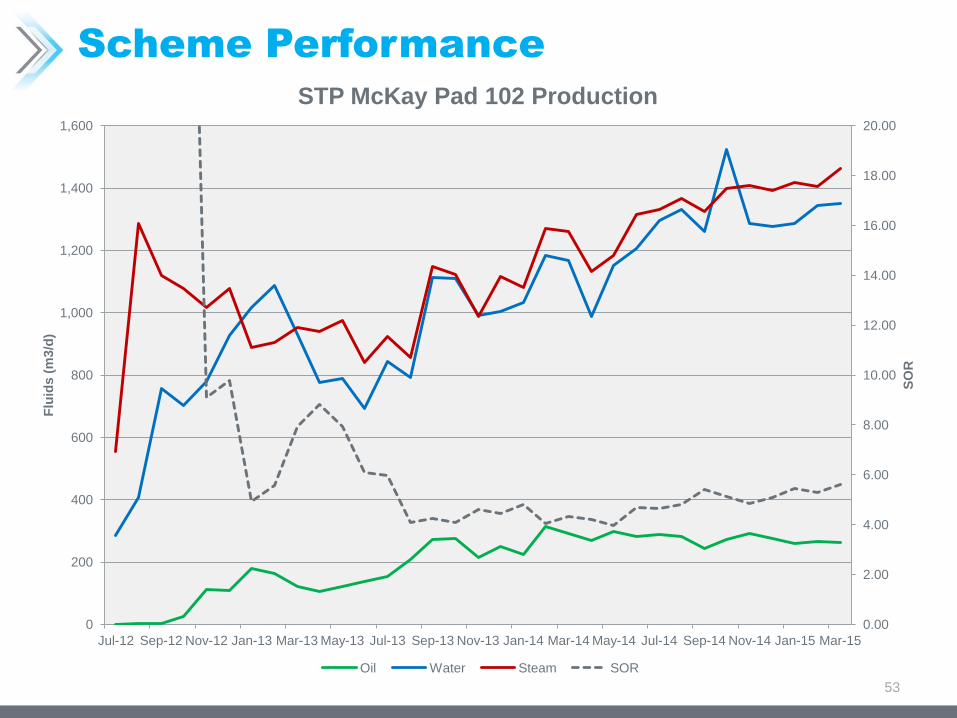
Scheme Performance
53
0.00
2.00
4.00
6.00
8.00
10.00
12.00
14.00
16.00
18.00
20.00
0
200
400
600
800
1,000
1,200
1,400
1,600
Jul-12 Sep-12 Nov-12 Jan-13 Mar-13 May-13 Jul-13 Sep-13 Nov-13 Jan-14 Mar-14 May-14 Jul-14 Sep-14 Nov-14 Jan-15 Mar-15
SO
R
Flu
ids (
m3/d
)
STP McKay Pad 102 Production
Oil Water Steam SOR

Scheme Performance
54
Pad Drainage Area
E3 m2 Average Net Pay,
m Porosity, fraction
Sw, fraction OOIP, E3 m3 Cum Oil, E3 m3 Current Recovery Factor,
fraction Ultimate Recovery
Factor, fraction
101 540 18 0.33 0.26 2374 43.1 0.018 0.50
102 720 20 0.33 0.26 3516 199.5 0.057 0.50
Scheme Performance
Pattern Examples Based on Recovery to Date
• Oil forecasting is based on theoretical flow equations for growing steam
chambers (Butler)
• All examples below are based on cumulative recovery to date and not
necessarily expected ultimate recovery.
55

Scheme Performance
Lower Recovery Example 1P5
• ICD was installed in February of 2014.
56
0.0
2.0
4.0
6.0
8.0
10.0
12.0
14.0
16.0
18.0
20.0
0
50
100
150
200
250
SO
R
Flu
ids (
m3/d
)
STP McKay 1P5 Production
Oil Water Steam SOR

• Instrumentation was not functioning prior to ICD installation.
• Have not been successful in heating toe section of well.
Scheme Performance
Lower Recovery Example 1P5
57
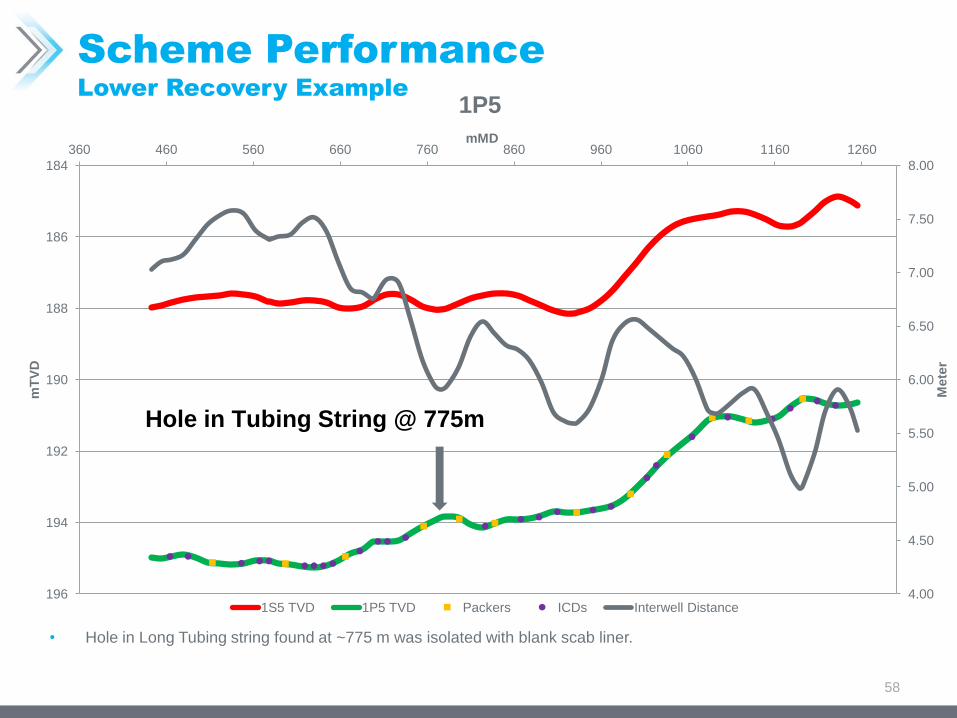
Scheme Performance
Lower Recovery Example
• Hole in Long Tubing string found at ~775 m was isolated with blank scab liner.
58
4.00
4.50
5.00
5.50
6.00
6.50
7.00
7.50
8.00 184
186
188
190
192
194
196
360 460 560 660 760 860 960 1060 1160 1260
Mete
r
mT
VD
mMD
1P5
1S5 TVD 1P5 TVD Packers ICDs Interwell Distance
Hole in Tubing String @ 775m

• Majority of well is clean with API cut off of 60. Cold section of toe clearly aligns with 30 API cut off.
Scheme Performance
Lower Recovery Example 1P5 Flowing Temperatures &
Trajectory
59
<30 API cutoff
<60 API cutoff

Scheme Performance
Medium Recovery Example 2P5
• ICD installed in June of 2014.
60
0.00
2.00
4.00
6.00
8.00
10.00
12.00
14.00
16.00
18.00
20.00
0
50
100
150
200
250
300
350
Jul-12 Sep-12 Nov-12 Jan-13 Mar-13 May-13 Jul-13 Sep-13 Nov-13 Jan-14 Mar-14 May-14 Jul-14 Sep-14 Nov-14 Jan-15 Mar-15
SO
R
Flu
ids (
m3/d
)
STP McKay 2P5 Production
Oil Water Steam SOR

Scheme Performance
Medium Recovery Example 2P5
• Cooling trend observed from toe to midpoint of well.
61
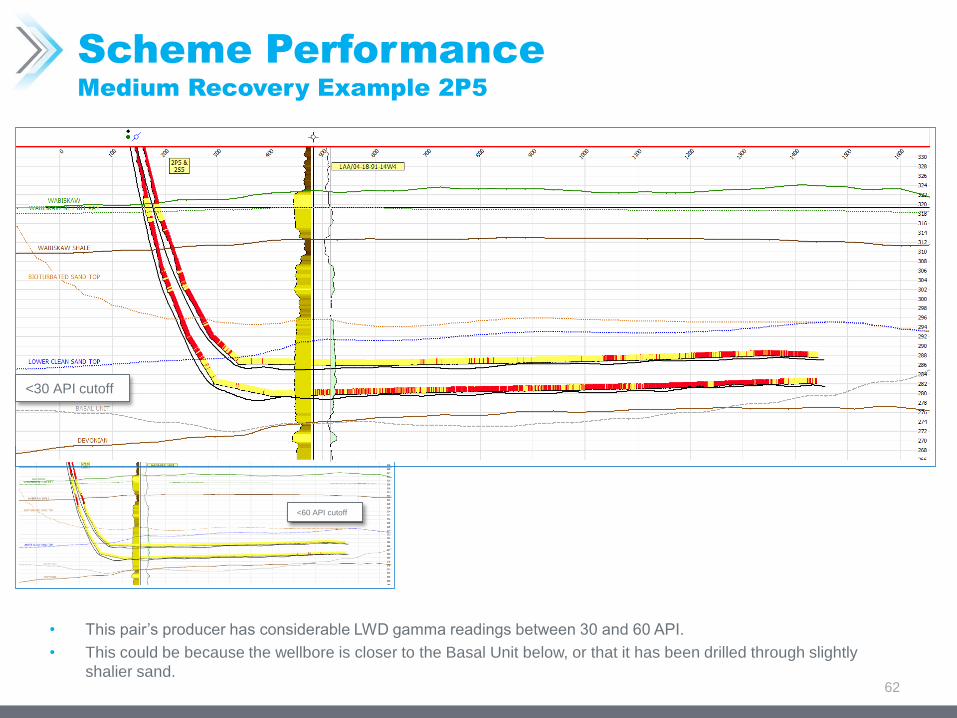
Scheme Performance
Medium Recovery Example 2P5
• This pair’s producer has considerable LWD gamma readings between 30 and 60 API.
• This could be because the wellbore is closer to the Basal Unit below, or that it has been drilled through slightly
shalier sand.
62
<30 API cutoff
<60 API cutoff
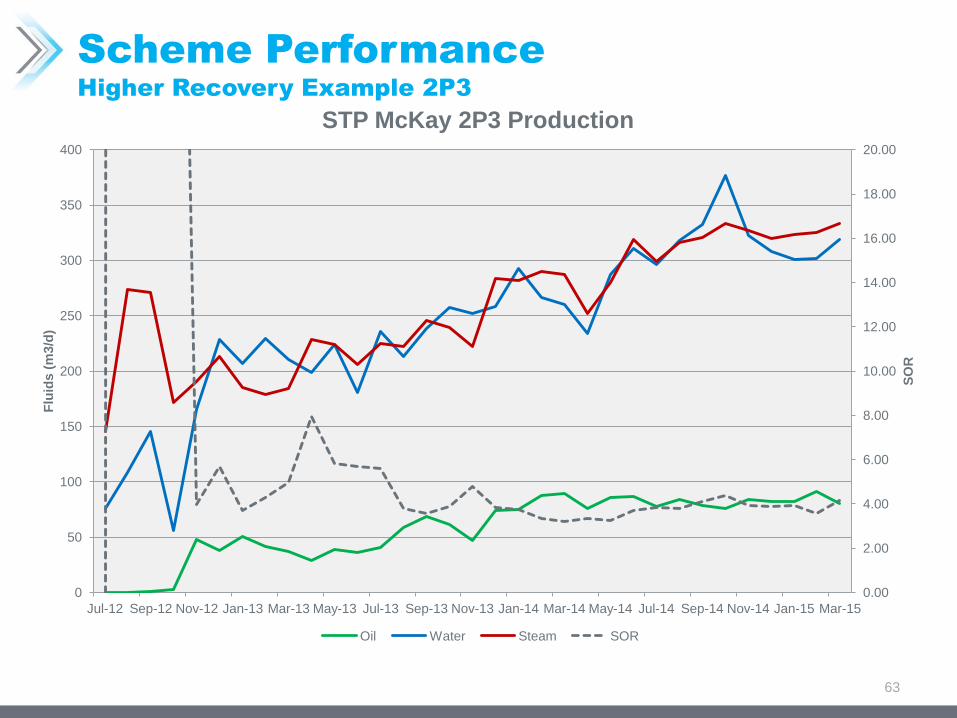
Scheme Performance
Higher Recovery Example 2P3
63
0.00
2.00
4.00
6.00
8.00
10.00
12.00
14.00
16.00
18.00
20.00
0
50
100
150
200
250
300
350
400
Jul-12 Sep-12 Nov-12 Jan-13 Mar-13 May-13 Jul-13 Sep-13 Nov-13 Jan-14 Mar-14 May-14 Jul-14 Sep-14 Nov-14 Jan-15 Mar-15
SO
R
Flu
ids (
m3/d
)
STP McKay 2P3 Production
Oil Water Steam SOR
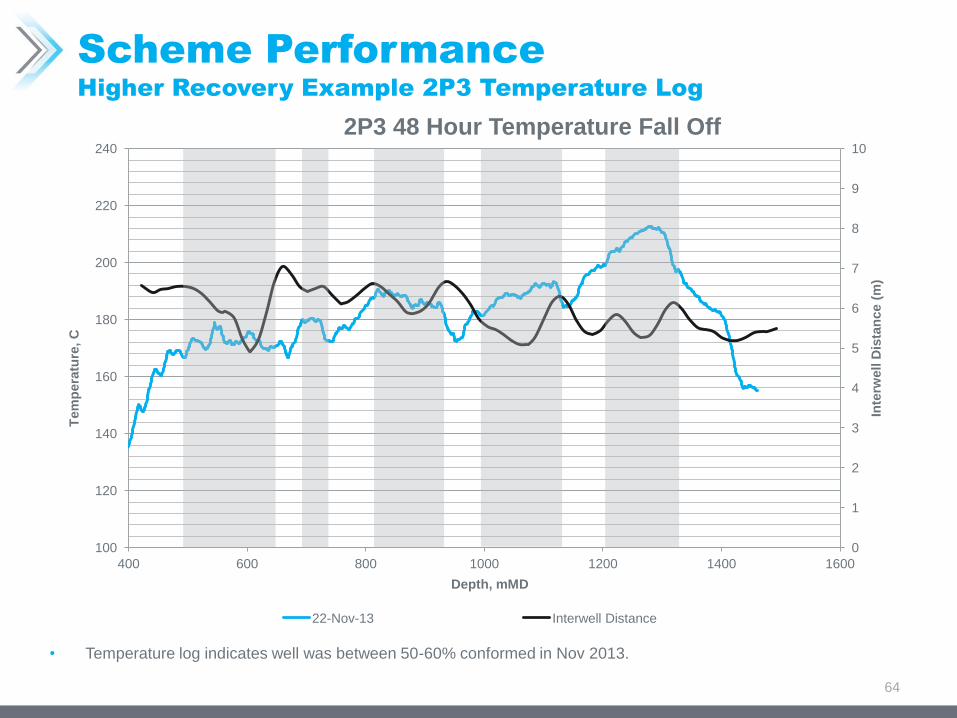
Scheme Performance
Higher Recovery Example 2P3 Temperature Log
• Temperature log indicates well was between 50-60% conformed in Nov 2013.
64
0
1
2
3
4
5
6
7
8
9
10
100
120
140
160
180
200
220
240
400 600 800 1000 1200 1400 1600
Inte
rwell
Dis
tan
ce (
m)
Tem
pera
ture
, C
Depth, mMD
2P3 48 Hour Temperature Fall Off
22-Nov-13 Interwell Distance
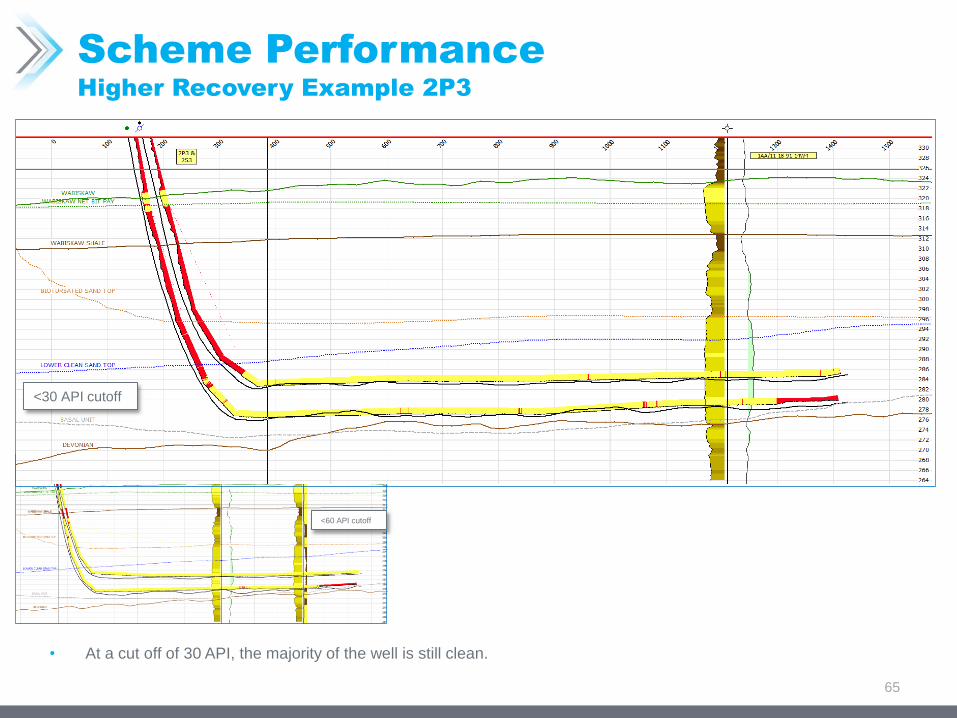
Scheme Performance
Higher Recovery Example 2P3
• At a cut off of 30 API, the majority of the well is still clean.
65
<30 API cutoff
<60 API cutoff

Scheme Performance
Liner Failures – 2P4/1P2
66
• Pad 102 - 2P4 Liner Failure
• Well Failed in December 2012 during circulation.
• See 2013 STP Performance Presentation for details.
• Pad101 - 1P2 Liner Failure
• Well failed in October 2013 during SAGD.
• High vapor rates and solids production were observed
in test immediately after failure.

Scheme Performance
Liner Failure – 1P2
• Liner failure at 1035 mMD repaired using ICD Scab liner with blank section from 1010 – 1060 mMD.
• Interval isolated using swellable packers.
• Completion installed during October of 2014. 67
180
182
184
186
188
190
192
194
400 500 600 700 800 900 1000 1100 1200 1300
mT
VD
mMD
1P2
1S2 TVD 1P2 TVD PACKERs mMD ICDs mMD HOLE
Hole in Liner @ 1035 m

ICD Summary
Why
• STP’s biggest challenge has been conformance. • Production rate impeded by single point breakthrough.
• Unbalanced wellbore inflow due to varied wellbore separation and reservoir heterogeneities.
Theory
• Producer wellbore is segmented and placement/number of ICD’s in each segment varied to promote and control flow by increasing pressure differential.
• Sections of the wellbore experiencing high vapour production will see an increased pressure drop through the device, allowing for more uniform inflow and drawdown along the length of the well.
68
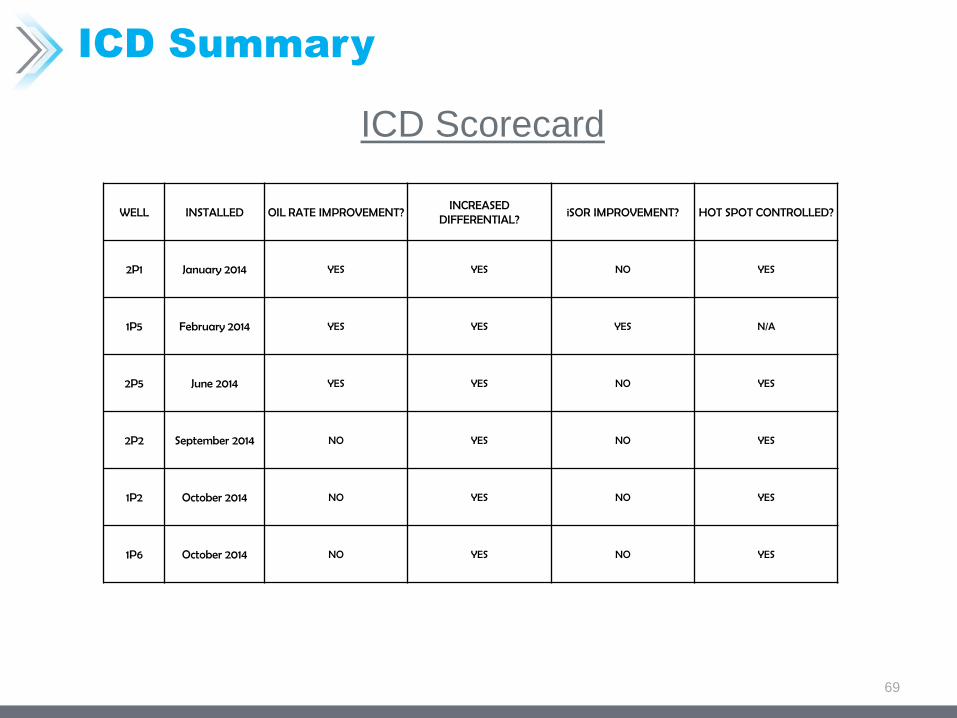
ICD Summary
ICD Scorecard
69
WELL INSTALLED OIL RATE IMPROVEMENT? INCREASED
DIFFERENTIAL? iSOR IMPROVEMENT? HOT SPOT CONTROLLED?
2P1 January 2014 YES YES NO YES
1P5 February 2014 YES YES YES N/A
2P5 June 2014 YES YES NO YES
2P2 September 2014 NO YES NO YES
1P2 October 2014 NO YES NO YES
1P6 October 2014 NO YES NO YES

ICD Summary
• 2P1 – ICD Installation • Slight improvement in bitumen rate.
• Believe well pair will continue to improve as SAGD chamber develops.
• 1P5 – ICD Installation • Short circuit has been repaired.
• Unable to gain inflow in toe section of well.
• 2P5 – ICD Installation • Short circuit has been repaired.
• Slight improvement in bitumen rate.
• 2P2 – ICD Installation • No significant bitumen rate improvements to date.
• Believe well pair will continue to improve as SAGD chamber develops.
• Previous short circuit has been repaired.
• 1P2 – ICD Installation • Well was shut-in for over a year and has cooled off.
• Was on steam circulation (bullhead to producer) for ~ 2 months to warm up.
• Only recently brought on stream, may require a few steam injection/production cycles before well pair converts fully to SAGD.
• 1P6 – ICD Installation • Short circuit has been minimized.
• Having difficulty establishing meaningful rates from heel section.
70

Scheme Performance
Key Learnings
71
Wellbore conformance has been the
biggest issue in delaying the ramp up
rate at McKay to date
• Almost every wellpair has developed discrete high temperature
sections in the horizontal section
• Managing subcool to the highest temperature in the well limits well
productivity and steam chamber development
Wider spacing on heel sections of Pad
101 has exacerbated conformance
issues
• Required longer circulation period
• Toe section developing short circuits, which further delays opening up
heel sections
Higher differential pressure (between
injector and producer) has been
required to initiate the flow of bitumen
than anticipated
• However, the better conformed well pairs have developed very
reasonable and stable differential pressure drops once communication
has been initiated
Based on observed production
performance, reservoir permeability to
oil has been reduced from original core
data estimates
• Attributed to revised interpretation of rock properties: grain maturity
(lower roundness)
From a geological perspective, minimal
alterations to the original mapping have
been made since the wells were brought
on stream
• No material thief zones are present, zone can be pressured up with
relative ease to MOP. We are not seeing lateral communication
between well pairs
Shalier sand sections in producer well
bores have not contributed meaningful
inflow to date
• Correlative production/temperature data suggests that <30 API
gamma sands conform the best, while >30 API are not contributing
much to inflow in the well pairs so far.

Subsurface Future Plans
72
• Downspacing accelerates rate and recovery,
and minimizes additional capital
infrastructure
• 50 m spacing on downspaced SAGD pairs
on Pads 101 and 102 provides improved
recovery and rapid economic enhancement
of the project
• Pad 102 will be the first downspacing project
• Timing of Pad 101 downspacing dependent
on steam availability and Pad 102
performance
• AER approval in place.
The most cost effective method to fill the plant is to drill additional SAGD well pairs
within the existing pads
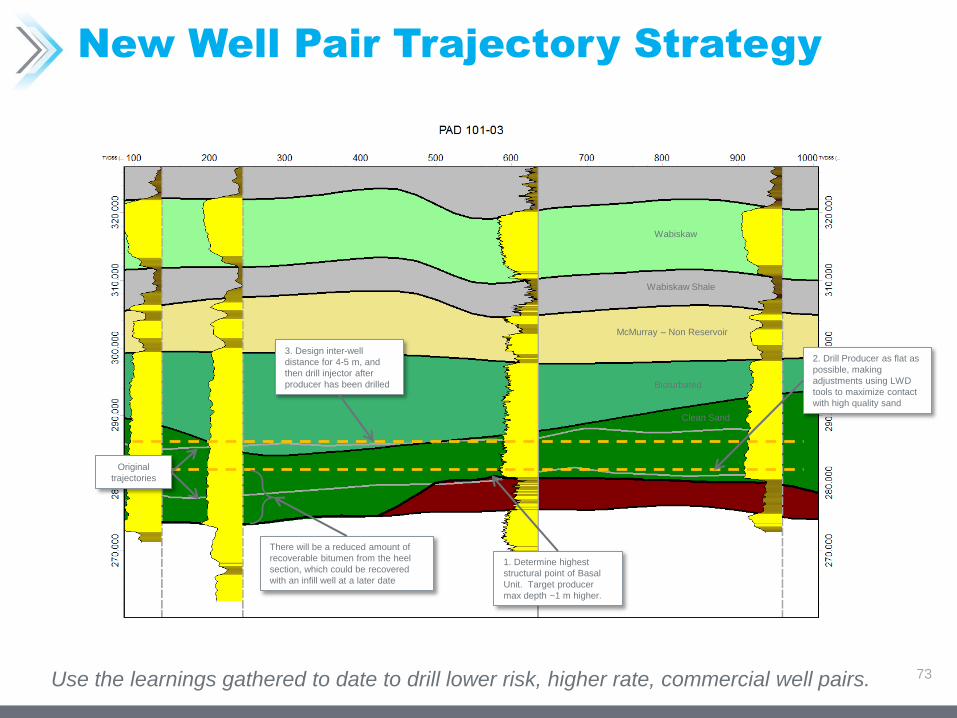
New Well Pair Trajectory Strategy
Use the learnings gathered to date to drill lower risk, higher rate, commercial well pairs. 73
1. Determine highest
structural point of Basal
Unit. Target producer
max depth ~1 m higher.
2. Drill Producer as flat as
possible, making
adjustments using LWD
tools to maximize contact
with high quality sand
3. Design inter-well
distance for 4-5 m, and
then drill injector after
producer has been drilled
Original
trajectories
There will be a reduced amount of
recoverable bitumen from the heel
section, which could be recovered
with an infill well at a later date
Bioturbated
Clean Sand
McMurray – Non Reservoir
Wabiskaw Shale
Wabiskaw

Surface Facilities & Environmental
Table of Contents
1. Facilities
2. Measurement Accounting & Reporting Plan
3. Water Sources & Uses
4. Water Treatment
5. Environmental Summary
6. Compliance Statement
7. 2014 Regulatory Summary
74

Facility Plot Plan – 2014 Amendments
75
• No facility amendments completed in 2014
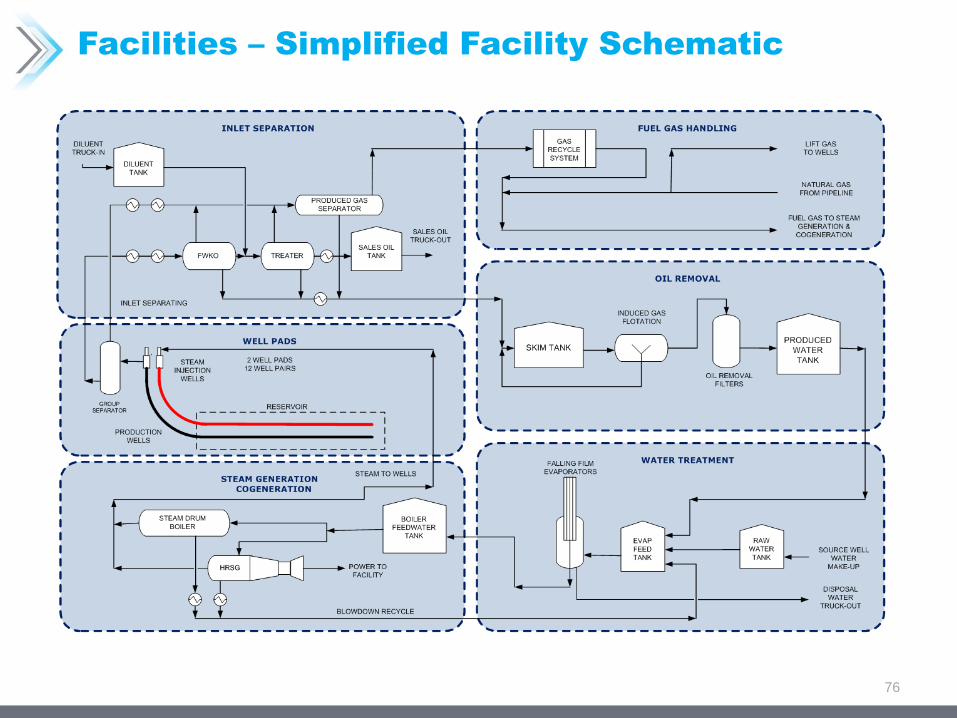
Facilities – Simplified Facility Schematic
76
Measurement/Reporting
77
General
• Annual 2014 MARP Update submitted February 16, 2015
• Review of Controls for EPAP Declaration completed, declaration submitted February 27th. Work to date
indicates that all of the measurement related controls are adequate and functioning as intended.
• Some issue with fouling of orifice plates in Produced Water service has led to some metering challenges during
the year. Use of backup produced water meter (Mag-type) for reporting, and as a tool to identify fouling of
primary meter has been successful at mitigating this concern.
• Accurate produced gas measurement at high lift gas use (>60:1 Sm3 gas / Sm3 emulsion) and high facility
turndown has been a challenge.
Well Production / Injection Volumes
• Well production is prorated from bulk scheme production using intermittent test data via dedicated test
separators on Pads 101 and 102. (6 pairs per separator)
• Wells meet or exceed the current minimum well test requirements per Directive 17. With six producers per pad,
11 testing hours every three days is the current operating protocol for each operating producer (12 hour test
duration – 1 hour flush, 11 hours test data).
• Manual samples are taken to determine bitumen, water, solids and chloride content and have proven reliable and
repeatable.

Measurement/Reporting
78
Water Balance
• Balance closure < 5%, but some room for
improvement. Tightening the water
balance will again be an area of focus for
2015.
• Water Recycle Performance per
Calculation defined in Directive 81
averaged 99.2% for the period analyzed.
• Per Disposal Limit formula in Directive 81,
(3% of Fresh Volumes + 10% of Produced
Water Volumes). The maximum disposal
limit for McKay was 9.01% of inlet volumes
for the period analyzed. McKay averaged a
disposal of 0.73% of inlets for the period
(8.1% of allowable).
• Evaporative / Venting Losses were
primarily associated with venting HP Steam
due to temporary water long imbalances in
the CPF
McKay Water Balance - 2014 Feb 1, 2014 - Mar 31, 2015
Inlet Flow
Produced Water 723,395.5 m3
Source Water 118,686.0 m3
Total Inlet 842,081.6 m3
Accumulation
Opening Inventory (Produced) 5,073.7 m3
Closing Inventory (Produced) 4,679.0 m3
Opening Inventory (Fresh) 1,595.6 m3
Closing Inventory (Fresh) 1,463.0 m3
Total Accumulation (527.3) m3
Outlet Flow
Steam Injection to Wells 793,982.7 m3
Evaporative and Venting Losses 3,016.0 m3
Disposal Volumes 6,129.4 m3
Water in Sales 840.5 m3
Total Outlet 803,968.6 m3
Difference (Inlet - (Outlet + Accum)) 38,640.3 m3
% Imbalance 4.59%

Monthly Proration Factors
79
0.00
0.20
0.40
0.60
0.80
1.00
1.20
1.40
1.60
1.80
2.00
STP Proration Factors
Oil Factor Water Factor Gas Factor Steam Factor

Steam Generation
80
Process Steam is produced at the McKay Project via:
• 2 x 100 T/hr Drum-type Natural Circulation Boilers.
• 3 x 5.67 MW Gas Turbines equipped with duct fired HRSG’s (2 operating, 1 standby).
• No significant process issues with Steam Generation equipment in 2014.
-
10,000.0
20,000.0
30,000.0
40,000.0
50,000.0
60,000.0
70,000.0
Jan-14 Feb-14 Mar-14 Apr-14 May-14 Jun-14 Jul-14 Aug-14 Sep-14 Oct-14 Nov-14 Dec-14 Jan-15 Feb-15 Mar-15
Vo
lum
es (
m3)
Month
McKay Project Monthly Steam Production Volumes

Power Generation
• Power is produced at the McKay Project via 3 x 5.67 MW Gas Turbines.
• Until July 2014, two turbines were operating while one was on standby, current normal
operating mode is one turbine operating while two are on standby.
• The McKay Project produces all its own power and has no connection to grid power, all
power generated is consumed on-site.
81
0.00
1.00
2.00
3.00
4.00
5.00
6.00
7.00
8.00
9.00
Jan-14 Feb-14 Mar-14 Apr-14 May-14 Jun-14 Jul-14 Aug-14 Sep-14 Oct-14 Nov-14 Dec-14 Jan-15 Feb-15 Mar-15
Av
era
ge M
on
thly
Po
wer
Gen
era
ted
(M
W)
Month
Monthly Power Generation

Oil Treatment
• Inlet Emulsion at McKay is treated conventionally via diluent blending and oil-water separation in two
stages (FWKO / Treater).
• Treating typically at target density of 960 kg/m3 with product oil < 1.2% BS&W (product from tanks typically
< 1.0% BS&W)
82
Jan-14 Feb-14 Mar-14 Apr-14 May-14 Jun-14 Jul-14 Aug-14 Sep-14 Oct-14 Nov-14 Dec-14 Jan-15 Feb-15 Mar-15 Apr-15
0
1
2
3
4
5
6
920
930
940
950
960
970
980
BS
&W
(%
)
Cle
an
Oil D
en
sit
y (
kg
/m3)
Date
Oil Treating Performance
Treater Clean Oil Density (kg/m3) Treater Clean Oil BS&W (%)

Water Sources & Uses
83
Fresh Water Uses - make-up water for the project to be drawn from the McKay
Channel Empress Formation. Details on the Water Act licence are as follows:
From Jan 1, 2014 to Dec 31, 2014: 99,471 m3 withdrawn
8-8-91-14-W4M: 10,757 m3
16-8-91-14-W4M: 49,855 m3
15-8-91-14-W4M: 38,859 m3
The total withdrawn from Jan.1 2015 to March 31, 2015 is: 25,815 m3
STP’s current Water Act licence expires on July 5, 2018.
Licence No.
00262149-01-00 (issued July 4, 2013)
8-8-91-14-W4M 853 m3/ day
16-8-91-14-W4M 2,401 m3/ day
15-8-91-14-W4M 2,475 m3/ day
Daily Maximum Diversion 5,729 m3/ day
Annual Maximum Diversion 419,750 m3

Water Sources and Uses
84
39,990 40,501
45,906
37,410
46,136 45,545
50,220
53,266
49,740
60,111
52,065 50,266 50,938
48,151
53,152
7,044 6,640 6,824 7,316
5,179
10,960 9,223
10,024 10,254
7,771 5,952 6,477
9,573
6,611 4,769
0
10,000
20,000
30,000
40,000
50,000
60,000
70,000
Vo
lum
e (
m3)
Month
STP McKay - Monthly Produced and Fresh Water Production
Produced Water
Source Water

Water Sources and Uses
Produced and Fresh Water Quality Summary
85
Produced Water Source Water
Na mg/L 249 271
K mg/L 6.6 7.9
Ca mg/L 0.8 53.5
Mg mg/L Trace 24.3
Ba mg/L Trace Trace
Sr mg/L Trace 0.7
Fe mg/L Trace Trace
Cl mg/L 122 12
Br mg/L 11 Trace
I mg/L 570 0.4
HCO3 mg/L 309 669
SO4 mg/L 22.7 244
CO3 mg/L 38 6
TDS mg/L 1380 1080
Reactive Silica mg/L 236 Not Measured
pH 8.81 8.31

Water Treatment
86
Water Treatment Technology
• Mechanical Vapour Recompression (MVR) Evaporator technology is
utilized for produced water treatment and production of boiler feedwater.
• Feed to MVR System is pretreated with MgO to facilitate silica removal.
• Make-up Water is treated using conventional cation exchange softening.
• Evaporator concentrate is directed to a steam-driven crystallizer unit for
further concentration and distillate recovery.

Waste Disposal Summary
•All Disposal Water at McKay is trucked out to third party disposal sites.
87
-
100.0
200.0
300.0
400.0
500.0
600.0
700.0
800.0
Vo
lum
e (
m3)
Month
McKay Disposal Water Volumes
Slop Oil & Misc Water Waste
Crystallizer Waste
Regen Waste

McKay Monthly Flared Volumes
88
0
2
4
6
8
10
12
14
16
18 P
rod
uced
Gas F
lare
d (
e3m
3)
Month
Environmental Summary
Sulphur Production & Ambient Air Monitoring
• EPEA approval limit for SO2 emissions from 2 steam generators and CPF flare stack is 0.50 tonnes/ day
• SO2 emissions from January 1, 2014 to December 31, 2014 were 80.31 tonnes
• Sulphur is tracked via monthly third party sampling and compositional analysis of the mixed gas stream to the Steam Generators.
• Average SO2 emission was 0.22 tonnes / day; peak emission was 0.30 tonnes / day. This puts plant inlet sulfur at an average of 0.11 tonnes / day, and peak of 0.15 tonnes / day
• STP is compliant with all requirements of ID2001-3
• 4 passive air monitoring stations at McKay that monitor H2S and SO2. 2014 results are as expected and within compliance limits.
• Passive air monitoring results from January 1, 2014 to December 31, 2014 : • Average monthly H2S concentration was 0.07 ppb; peak concentration was 0.16 ppb
• Average monthly SO2 concentration was 0.50 ppb; peak concentration was 1.3 ppb
(SO2 AAAQO 30-day limit = 11 ppb)
Continuous ambient air quality monitoring station was in operation from January 1, 2014 to March 31 2014. Results are as expected and within compliance limits.
• H2S average concentration was 0.17 ppb; peak 1-hour concentration was 3.2 ppb; peak 24-hour concentration was 1.2 ppb
• SO2 average concentration was 0.53 ppb; peak 1-hour concentration was 34.8 ppb; peak 24-hour concentration was 6.1 ppb
• NOx average concentration was 3.47 ppb; peak 1-hour concentration was 63 ppb; peak 24-hour concentration was 25.4 ppb
89

Environmental Summary
• AER Commercial Scheme Approval No. 11461 - no compliance issues since last presentation.
• EPEA Approvals No. 255245-00-01 (facility) & 287052-00-00 (Wastewater System) 2014 non-compliance summary:
• Water Act Diversion License No. 00262149 - no compliance issues in 2014.
90
AER Reference No. Description Resolved (Y/N)
284268 Manual Stack Emissions Exceedance Y
292396 Grey Water Spill Y
AER FIS No. Description Resolved (Y/N)
20140065 Process Water (Steam Condensate) spill Y
285818 Pipeline Leak - Venting Y

Environmental Summary
Corporate Initiatives
• Active Member of Canadian Association of Petroleum Producers (CAPP)
• Member of the CAPP Joint Oil Sands Monitoring Initiative Committee (JOSM)
• Member of the Fort McKay First Nation Sustainability Department
91

Compliance Statement
92
Southern Pacific Resource Corp. is currently in compliance with all conditions of it’s
OSCA and EPEA Approvals, the company is also aware of and meeting all of it’s
regulatory requirements.

2014 Regulatory Summary
Regulatory Amendment Filings
• Directive 78, Category 1 Amendment Application - Inflow Control Device Installation in 2P1.
Submitted on Dec. 20, 2013; Approved on January 7, 2014
• Directive 78, Category 1 Amendment Application - Inflow Control Device Installation in 1P5.
Submitted on Jan. 10, 2014; Approved on January 20, 2014
• Directive 78, Category 2 Amendment Application – Drilling of Infill wells at Pad 101 & 102.
Submitted on Feb. 18, 2014; Approved on July 2, 2014
• Directive 78, Category 1 Amendment Application - Inflow Control Device Installation in 1P2 and 2P2.
Submitted on Mar. 28, 2014; Approved on April 10, 2014
• Directive 78, Category 1 Amendment Application - Inflow Control Device Installation in 2P5.
Submitted on May 8, 2014; Approved on May 15, 2014
• Directive 78, Category 1 Amendment Application - Inflow Control Device Installation in 2P6.
Submitted on May 29, 2014; AER advised that applications are no longer required.
Key Approval Filings
• Soil Management Plan Proposal
Submitted to ESRD on Jan. 31, 2014
93

QUESTIONS?
94

95 Contact Information
Southern Pacific Resource Corp.
Suite 1700, 205 - 5th Ave. SW
Calgary, AB T2P 2V7
Phone: 403-269-5243
Fax: 403-269-5273
Email: [email protected]
www.shpacific.com