2015 ANNUAL REPORT 2015 Annual report 8 Message from Ana Botín, Group executive chairman 16 Message...
296
Annual report 2015 We want to help people and businesses prosper
-
Upload
trankhuong -
Category
Documents
-
view
214 -
download
1
Transcript of 2015 ANNUAL REPORT 2015 Annual report 8 Message from Ana Botín, Group executive chairman 16 Message...

Annual report2015
We want to help people and businesses prosper

Underlying attributable profit Ordinary RoTEMillion euros %
11.0% 11.0%6,566
5,816 5,9661
+13%2015/2014
2014 2015 2014 20151. Attributable profit, including non-recurring net capital gains
and provisions, +3%.
TNAV/share1 Cash dividend € €/share
4.124.01 0.16+3% +79%2015/2014 2015/20140.09
2014 2015 2014 2015
1. Calculated on a like-for-like basis with 2014.
2
Geographic diversification:97% of underlying profit generated in nine countries
and in consumer finance business in Europe
UNITED KINGDOM
UNITED STATES
23% SANTANDER CONSUMER
FINANCE
8% 11%
POLAND
MEXICO BRAZIL 4%7% 19%
PORTUGAL
4% SPAIN Main countries
12% Santander Consumer Finance
CHILE
5%ARGENTINA
4%Geographic credit risk distribution:
OTHER COUNTRIES
Europe United States and 72% Mexico 15%
South America 13%
3%
Meeting our commitments with shareholders

3
Helping people and businessesprosper in 2015
Our aim is to be the best retail and commercial bank that earns the lasting loyalty of our people,
customers, shareholders and communities.
People
employees193,863
of employees areproud to work atBanco Santander
82% of employees perceive Banco Santander as Simple, Personal and Fair
75%
Customers
million121
million loyal customers
13.8 (+10%)million digital customers
16.6 (+17%)
Business growth
loans+6%
customer funds+7%
Shareholders
3.6million
cash dividend per share
+79%fully loaded CET1 ratio
10.05%
1.2Communities
million people helped
scholarships granted
35,349agreements with universities and academic institutions in 21 countries
1,229

4
In 2015, we delivered on everything we promised a year ago and delivered in the right way. We increased our earnings and used them to pay a higher
cash dividend, to invest in our business and to strengthen our capital base organically. This success has put us ahead of our strategic plan.
Ana BotínGroup ExecutiveChairman
The second half of this year’s disappointing share price does nothing
to undermine my belief in our diversified structure which has been built to provide predictable earnings with lower volatility
through the cycle. Our critical mass, our personal relationships with customers
and our geographical diversification combine to create the large,
deep moat around us.
From our centre in Spain, we offer products and best practices,
ranging from technology systems to control, which enable our subsidiaries to capture significant economies of scale.
The synergies created by this system are worth 3 points of our cost-to-income
ratio that remains one of the best in the industry at 47.6%.
We are focused on becoming more efficient and
more transparent. At the corporate centre, we have reduced the number
of divisions from 15 to 10 as well as the number of top executives and executive
board directors at the Group level. This has allowed us to reduce the
total cost of compensation for those at this level by 23%.
The strong, underlying signal coming from Santander is of
steady growth and value-building. We derive enormous benefits from
the way our diverse geographies and retail and commercial banks with
critical mass minimize our risks and even out our revenues.

5
The foundations of our transformation
Corporate governance and team
What do we want? What have we done?
Strengthen the Bank’s corporate governance incorporating the best international practices and complying with the highest standards
• Significant renewal of the board with the appointment of newindependent directors. Consolidation of the position of lead director and of the board committees.
• New remuneration policy for executive directors and senior management aligned with our Simple, Personal and Fair culture.
• Changes in the corporate governance of the risk function and a new parent-subsidiary relationship framework.
Configure the executive team for the Bank’s new phase
New country heads have been appointed in five of the Group’s main local units and leadership in the corporate centre enhanced.
Foster the role of the corporate centre in the creation of value for the Group
Simplified the organisational structure and reduced the number of divisions (from 15 to 10), strengthened the compliance function and improved the transparency and efficiency of the corporate centre.
Capital
What do we want? What have we done?
Prepare the Bank for stronger organic growth, while comfortably meeting the new regulatory requirements
• €7,500 million capital increase. • Meeting the fully loaded CET1 capital ratio of more than
10% in 2015, and commitment to the market to raise it to above 11% in 2018.
Offer shareholders an attractive and sustainable return and a dividend that reflects our profits
New dividend policy that increases cash dividend pay-out to 30-40% of profits. Cash dividend per share increased 79% in 2015.
Strategy and culture
What do we want? What have we done?
Improve the Bank’s profitability, grow earnings and dividend per share in a sustainable way
Given a new focus to the strategy to transform us into the best retail and commercial bank for our employees, customers, shareholders and communities:• 10% growth in loyal customers. • Enhanced operational excellence.• Created a new innovation area and developed the Santander
Innoventures fund.
Ensure that our more than 190,000 professionals in all countries and businesses have a common purpose and way of doing things
Began to install a new culture throughout the Group, involving senior management and all employees in building an increasingly Simple, Personal and Fair bank.

6
2015Annual report
8 Message from Ana Botín, Group executive chairman
16 Message from José Antonio Álvarez, chief executive officer
22 Corporate governance
128 Business model and strategy30 Purpose and business model 32 Aim and value creation 34 Employees 38 Customers 44 Shareholders 48 Communities 52 Risk management
2 56 2015 results 58 Economic, banking and
regulatory environment 62 Santander Group results 65 Countries 73 Global Corporate Banking
Banco Santander’s 2015 annual report has an online version. Access it via this link.

7
3 74 Corporate governance report 76 Executive summary 78 Introduction 79 Ownership structure 82 Banco Santander’s board of directors 105 Shareholder rights and the
general shareholders’ meeting 107 Santander Group management team 109 Transparency and independence 111 Challenges for 2016
4112 Economic and financial review114 Consolidated financial report 114 2015 summary of
Santander Group 116 Santander Group results 122 Santander Group
balance sheet 129 Geographic businesses 132 Continental Europe 146 United Kingdom 149 Latin America 163 United States 166 Corporate centre 168 Global businesses 168 Retail and
commercial banking 171 Global Corporate Banking
5174 Risk management report176 Executive summary180 A. Pillars of the risk function182 B. Risk control and management
model - Advanced Risk Management
182 1. Map of risks 183 2. Risk governance 185 3. Management processes
and tools 192 4. Risk culture - Risk Pro 194 C. Background and upcoming
challenges199 D. Risk profile 199 1. Credit risk 230 2. Trading market risk
and structural risks 250 3. Liquidity risk and funding 261 4. Operational risk 270 5. Compliance and conduct risk 277 6. Model risk 279 7. Strategic risk 281 8. Capital risk290 Appendix: EDTF transparency
292 Historical data294 General information

8
2015 ANNUAL REPORTMessage from Ana Botín
Message from Ana Botín

9
2015 ANNUAL REPORTMessage from Ana Botín
Dear fellow shareholders,
In 2015, we delivered on everything we promised a year ago and delivered in the right way. We increased our earnings and used them to pay a higher cash dividend, to invest in our business and to strengthen our capital base organically. This success has put us ahead of our strategic plan.
2015 At a GlanceWe have increased our number of loyal customers by 1.2 million and improved customer satisfaction so that we are now in the top 3 in 5 of the countries where we operate, which is our aim in all markets. According to our internal surveys, we are all feeling more engaged in our work.
The results of more loyal customers and a more engaged team are a strong operating performance and a net statutory profit in 2015 of €6 billion:
• Customer loans grew by 6.4%.
• Customer revenues grew by 7.6% to €42 billion.
• Underlying profit after tax (excluding PPI and other one-off effects) grew by 13%.
• This growth in revenues and profitability has allowed us also to grow our capital organically by 40 basis points, to 10.05% (10.15% excluding PPI) and to grow our cash dividend per share by 79%.
• Finally, our company is more valuable than 1 year ago, as measured by our tangible net asset value (TNAV) per share, which grew by €0.11.
Those of you who acquired shares at the time of our capital raise on January 8 2015 and still hold them, have received a cash dividend per share of €0.11 and a total dividend per share of €0.40, equivalent to 6% of your investment.
But since that date our market valuation has fallen by 36%. This is probably related to a different perception of the strength of our capital and the extent of our regulatory capital buffers and to the concern about our presence in certain emerging markets.
The purpose of capital buffers is to protect our customers, shareholders and employees. We take this responsibility extremely seriously.
Our prudential minimum capital requirement today is to maintain a Common Equity Tier1 (CET1) of 9.75%. Our capital adequacy currently stands at 12.55%, a buffer of 280 bps, equivalent to €16 billion.
The reason we have these excess buffers is to get ready for 2019 when we will converge to the regulatory requirements known as Basel III.
GROWING CUSTOMER LOANS
Customer loans
+6.4%
GROWING CUSTOMER REVENUES
Customer revenues
+7.6%(€42,000 million)
INCREASING OUR PROFIT
Net profit
€6,000million (+3%)
AND GROWING OUR CAPITAL
+40 bpsorganic
capital growth

10
2015 ANNUAL REPORTMessage from Ana Botín
Since 2007, our preprovision profit has been on average 2.3 times the provisions we incurred
Our Brazilian team delivered strong recurring profits and made significant one-off positive contributions.
IN BRAZIL
+33%(+13% in euros)
Profit
14%RoTE
3.2%Best among
private banks
NPLs
As we announced to investors last September, our goal is to have a CET1 capital ratio fully compliant with Basel III criteria of more than 11% by December 2018, when our regulatory requirement will be 10.5%. I am confident that with the uplift we achieved in 2015 and our current growth and capital generation, we will meet our target.
We have set this goal of above 11% to align with the highest prudential standards for two reasons. First, our required minimum is less because our model is considered less interconnected, and easy to resolve. Second, we need lower management buffers over this minimum because of the relatively low volatility of our earnings and our better relative performance under stress scenarios.
The key factors in favor of Santander are:
• Our business is less volatile than that of our peers. We have paid a dividend every year for 50 years.
• We went through the financial crisis without reporting any quarterly loss. We paid dividends every year and at the lowest point, in 2012, we delivered a net statutory profit of €2.3 billion, as our retail and commercial banking activities continued to be profitable practically in every market.
• Our subsidiaries are autonomous in managing their capital and liquidity. We have more than sufficient capital to operate safely, to satisfy regulators in all of our markets and at the Group level, and to provide the returns expected by our investors.
• Since 2007 we have generated profits before taxes of €93 billion. Our pre-provision profit has been on average 2.3 times the provisions we incurred. We are now transforming our bank to expand our capacity to generate capital. This will make us even more resilient throughout the business cycle.
However, what best explains our market underperformance since our historical high valuation of €100 billion in April last year are concerns about the future of Brazil.
Brazil is going through a challenging period, but our bank performed excellently there this year. Our team delivered strong recurring profits and made significant one-off positive contributions. Net statutory profit grew by 33% in local currency and by 13% in euros in 2015. Our return on tangible equity (RoTE) in Brazil was a healthy 14%. Finally, our balance sheet in Brazil –which represents 8% of total Group customer loans- shows the lowest non-performing loan ratio among the top Brazilian private banks: 3.2%.
Today in Banco Santander, as our performance in 2015 shows, we have the people, the vision and the resources to deliver for our shareholders.
We will manage the business to deliver on earnings per share (EPS), dividends per share (DPS) and TNAV per share as I laid out in my letter last year and at our Investor Day in September.

11
2015 ANNUAL REPORTMessage from Ana Botín
The Santander “Moat” is large and deepIn summary, today’s market is not considering the full value and strength of our model and our diversification.
Warren Buffett often says that he likes to invest in companies with a “moat”, a competitive advantage which protects profits and market share over time.
Our moat is our critical mass in every one of our 9+1 (Santander Consumer Finance Europe) core markets, where we serve a total of 121 million customers. This provides consistent earnings, quarter after quarter and through the cycle.
We have earned the trust of our customers over many years, through hard work and careful stewardship of their financial affairs. Our relationship managers talk to many of these customers every day. They have helped them through difficult times, supporting when others who know them less well might have walked away.
We also operate in a carefully assembled mix of developed and developing markets. When one or two markets are struggling, others are thriving.
Santander Consumer Finance is the top consumer bank in Europe. In Mexico, we are the main bank for small and medium sized enterprises. In Poland, our bank is the most profitable among its peers. We have the second largest private bank and the most profitable one in Portugal. And that doesn’t take into account the continued strength of our most important banks in Spain and the UK, which have performed well despite continued low interest rates.
The combined growth of our continental European business this year has delivered €2.2 billion attributable profit, or 35% growth; our UK and US businesses delivered €2.6 billion attributable profit, 10% more, representing 31% of total attributable profit1.
The second half of this year’s disappointing share price does nothing to undermine my belief in our diversified structure which has been built to do exactly what it is doing: providing predictable earnings with lower volatility through the cycle.
Our critical mass, our personal relationships with customers and our geographical diversification combine to create the large, deep moat around us.
These are the sources of our unique competitive advantage and what give us confidence that we can deliver earnings at the same time as we adapt our business for the future.
They are the foundations upon which we are building Santander for the next 50 years.
We have scale and financial strength on our side and we are learning how to think and act like a challenger at the same time.
OUR “MOAT”:
Critical mass in
9+1markets
Personal relationships:
121million
customers
Geographical diversification
Consistent earnings
through the cycle
1. Excluding the corporate centre and Spain’s Real Estate activity.

2015 ANNUAL REPORTMessage from Ana Botín
12
We have made great strides in helping people and businesses, our customers, prosper
Loyal customers
+1.2MM(+10%)
We want more of our customers to do more of their banking with us
Digital customers
+2.5MM(+17%)
Customers
When I wrote to you last year and laid out my vision and plans to transform Santander, I said that the “measure of our success will be that wherever we operate our customers are the ones who champion our services and bring in new customers”. We have made great strides in helping people and businesses, our customers, prosper. I would like to review in detail what we have achieved in 2015.
Banking is an industry which will look very different very soon because of technology. But it remains at its heart a personal business. It is about satisfying the needs and aspirations of our customers, of families wanting to buy homes and businesses wanting to expand. Our daily work is about serving our 121 million customers today and to anticipate what they will need tomorrow: a loan as well as the latest mobile app to fit seamlessly into their digital lives.
Our focus this year and going forward, will be to earn the loyalty of our customers and encouraging greater use of our digital banking services. In simple terms: we want more of our customers to do more of their banking with us. And we are ready for them to do more of their banking digitally.
Progress in 2015• In the UK, one out of every three new accounts is now opened via our digital channels.
• In Poland, our customers can now apply for a cash loan using their phones and receive a response within 60 seconds.
• In Spain, a new 1|2|3 account is opened every minute through our digital channels.
As a result of these efforts, we have reached our targets and grown our number of loyal customers by 1.2 million and our digital customers by 2.5 million.
In the markets where our number of loyal customers has increased the most, so has our revenue. And this progress is reflected in rising customer satisfaction. In five of the markets we serve, we are ranked among the top three banks for customer satisfaction. We care a lot about these customer satisfaction rankings and loyalty numbers because they set the pulse of our business. If they are strong and healthy, our company is too.
People
Santander built a strong, successful culture over many years. This culture was at the root of our expansion and growth. Now we need to change. This is going to take hard work and time, but we are well on our way.
Internally, we have been undergoing a process of profound cultural change. We are reevaluating every one of our processes to ensure that we can be true to our values, purpose and aim, and be ready to embrace new technology sweeping through financial services.
I want every member of our global team to feel motivated and inspired by these changes, to know that we will do everything we can to support them in their work. I am asking for the same commitment to change from myself, my board and my most senior executives, as I am from those who work in our branches and help our customers every day.
Our latest survey of our global team showed that many more of us believe in this process today than when we started a year ago. We are rethinking how we measure performance and create incentives. Our program of flexiworking has been especially popular. We want our teams to guide us, to let us know how they can contribute most to our organization.

2015 ANNUAL REPORTMessage from Ana Botín
13
During 2015 we have worked to agree on the behaviours that will help us build a bank that is more Simple, Personal and Fair.
There are eight of them: show respect; truly listen; talk straight; keep promises; actively collaborate; bring passion; support people; and embrace change. It is a short list on purpose. It is meant to be achievable.
We value honesty, energy and directness in our families and friends, and we should expect no less from our colleagues at work.
Across the organization, we are focused on becoming more efficient and more transparent. At the corporate centre, we have reduced the number of divisions from 15 to 10 as well as the number of top executives and executive board directors at the Group level.
This has allowed us to reduce the total cost of compensation for those at this level by 23%.
Good governance has taken on fresh importance since the financial crisis, and we are working harder than ever to appoint the best people and create the clearest lines of accountability between all of our operations. Our industry is complex by nature, but our business should never be more complex than necessary.
We are constantly seeking the ideal balance between our corporate centre and our countries. We trust our local teams because they are closest to our customers. But we also want them to take advantage of being part of a global Group.
From our centre in Spain, we offer products and best practices, ranging from technology systems to control, which enable our subsidiaries to capture significant economies of scale. The synergies created by this system are worth 3 points of our cost-to-income ratio. Our in-country teams can stay close to their markets while operating more efficiently than their competitors. There are no intermediate levels between our country heads and the Group CEO, because we believe that a lean corporate structure, with the fewest possible layers of management, is the best guarantee of simplicity and transparency, and will deliver for both our customers and our shareholders.
This relationship between the centre and our subsidiaries is essential to continue to improve our cost-to-income ratio, a key measure of efficiency that remains one of the best in the industry at 47.6%. And our simple, geographically ring-fenced subsidiary model results in the lowest Financial Stability Board additional capital recommendation among our peers.
Shareholders
Until the situation in Brazil began to deteriorate in mid year, the relative performance of our share price was comparable to that of our peers and the major indexes.
The long-term story of Brazil is the growth and development of one of the largest emerging economies in the world. We are going to endure the current situation, be patient and be strongly positioned when Brazil resumes its upward journey.
It is important that our shareholders recognize this, and consider the growth in our TNAV per share in 2015. There is always a lot of noise in finance, but the strong, underlying signal coming from Santander is of steady growth and value-building. I am convinced that our share price will eventually come to reflect this and our shareholders patience will be rewarded.
Many more of our people believe in cultural change than they did when we started one year ago
Corporate centre value added:The synergies created by this system are worth 3 points of our cost-to-income ratio
% of Group underlying attributable profit
South NorthAmerica America Europe29% 15% 56%

14
2015 ANNUAL REPORTMessage from Ana Botín
14
THE DIVERSITY OF OUR GEOGRAPHIES WITH CRITICAL MASS(profit growth in euros)
Spain: SCF:
+18% +18%
UK: Portugal:
+27% +63%
Brazil: Mexico:
+13% +4%
We derive enormous benefits from the way our diverse geographies and retail and commercial banks with critical mass minimize our risks and even out our revenues.
During 2015, we grew our net profits (in euros) in Spain and SCF by 18%, in the UK by 27%, in Portugal by 63%, in Brazil by 13% and in Mexico by 4%. These businesses represent 81% of our customer loans and 76% of our Group profits. Chile reduced its profit by 9%, US by 21% and Poland by 15%. These three businesses represent 16% of our customer loans and 17% of our profits.
We see great potential for us to grow in Poland where we are leaders in digital channels and where loans are growing by 11%. We are working to improve our operations in the USA: we have put in place a new team in recent months, composed of top talent at both the executive and board levels. We know what we have to do in the USA to succeed on all fronts.
Our model proved its worth during the financial crisis, throughout which we never posted a single quarter of losses. We never required a bail-out in any of the countries where we operate. Though designated a global SIFI (Systemically Important Financial Institution) we have the lowest capital charge among global SIFIs. And for these reasons, we need lower capital buffers, as noted previously, than other international banks with different models.
It was not an easy decision to change our dividend policy, as we did last year. But we have to pay a dividend that reflects the reality of the macro-regulatory situation and our earnings, and is consistent with our strategy. What is important, is that our model delivers enough profits to reinvest further in: profitable growth; a strengthened capital base; and an increased dividend per share.
Communities
We continued our support for higher education through our Santander Universities programme which now reaches more than 1,200 universities around the world. Last year, we awarded around 35,000 scholarships to students attending these universities, as well as investing in programmes to improve financial inclusion and education.
We have launched the UK Discovery Project, helping people prosper through enhanced education, skills and innovation, which will support a million people by 2020.
We also supported around 7,000 entrepreneurs and 500 start-ups through our community programs to promote job creation.
Our target is to support 4.5 million people between now and 2018.
Looking ahead
It is said that strategy rarely survives first contact with adversity. But after eighteen months in charge of Santander, I am confident that the plan we have in place is the right one.
We are building from a strong and diverse base. Santander built a reputation over the past three decades as an expansive, acquisitive bank, venturing from Spain to markets across Europe and the Americas. I cannot rule out future bolt-on acquisitions in our 9+1 core markets, provided they make both strategic and financial sense, but for the immediate future we are focused on growing loyal customers and organic growth.
We are overhauling our operations and our management to make them more Simple, Personal and Fair. We want our employees to feel happier and prouder than ever to work for Santander. We are building and learning new technologies so that we can revamp our internal processes

15
2015 ANNUAL REPORTMessage from Ana Botín
15
and develop better products and services for our customers, whilst remaining best-in-class in efficiency.
And we are lowering our cost of risk with an average target for 2015-2018 of 1.2%.
Our goal is to grow earnings and dividends per share annually, reaching double digit EPS growth by 2018, from a stronger, more resilient capital base with a CET1 above 11%.
Over the coming year, we anticipate different contexts for the developed and developing economies where we operate. In the developed economies, we envisage steady low GDP growth and falling unemployment. Low oil prices and low interest rates will be good for both individual and corporate customers.
Interest rates in the United States seem to be moving upwards, but the return to normality in the credit markets after years of quantitative easing is going to take time. Political uncertainty persists in parts of Europe, and a new president will be elected in the United States in November. Our base case scenario is low and flat yield curves in the developed markets for quite some time.
In the developing economies, we are always braced for greater volatility. But the underlying trends remain hugely promising. We are well placed in markets with young and growing populations, low banking penetration and low borrowing levels, where we can earn returns on equity far higher than those we earn in the developed markets. As I mentioned above, diversification is our strength.
Listening to our customers and anticipating what they want from us; fixing things fast when we make mistakes; making their interactions with us Simple, Personal and Fair, each and every time - these are our main goals, today, tomorrow and as far into the future as we can see.
To guide us, we will focus on our purpose: to help people and businesses prosper. This is the Santander Way. It is the foundation for our success. And we have a clear aim: to be the best retail and commercial bank, earning the lasting loyalty of our people, customers, shareholders and communities.
Strong corporate governance is vital to all of our work. Banco Santander’s board is fully involved in the Group’s oversight. I would like to thank Juan Rodríguez Inciarte and Sheila Bair for their invaluable contribution to the bank.
We have strengthened our boards both centrally and in our regional subsidiaries, drawing on strong independent directors to provide fresh perspectives and advice.
2015 has been a year of tremendous learning and progress for me personally and for Santander. We can see a clear path to the objectives we have set ourselves for 2018. But we still have to walk that path and turn the unforeseen bumps ahead into opportunities if we want to deliver on our purpose of helping people and businesses prosper.
We still have to act each day in a way that is more Simple, Personal and Fair. The digital revolution in finance won’t happen by itself. We aspire to lead in ensuring that it delivers on its promise for our customers above all.
With the support of our nearly 4 million shareholders, a Board committed to our objectives and an excellent team, I am confident we will succeed.
Ana Botín Group Executive Chairman
We are well placed in markets with young and growing populations, low banking penetration and low borrowing levels, where we can earn returns on equity far higher than those we earn in the developed markets
2018 TARGETS:> In crease EPS
reaching double digit growth in 2018
> CET1 >11%
> A verage cost of credit 2015-2018: 1.2%
> In crease DPS and TNAV per share
16
2015 ANNUAL REPORTMessage from José Antonio Álvarez
Message from José Antonio Álvarez

17
2015 ANNUAL REPORTMessage from José Antonio Álvarez
We are living in a time of significant change. Technology is generating a new way of relating to one another and is increasing the information and decision-making capacity of all economic agents. In the financial sector, other challenges add to these changes, such as new regulations, the entry of new competitors, an environment of low interest rates and uneven growth between mature and emerging economies.
Developed economies continued in 2015 to show signs of recovery but emerging countries, as a whole, grew at a slower pace, because of their internal dynamics as well as the fall in commodity prices and China’s slowdown.
The markets were volatile. Emerging currencies depreciated against the dollar and interest rates remained low in mature markets. The Federal Reserve waited until December to announce the first increase in interest rates of only 25 b.p.
This environment continued to put pressure on banks’ profitability, added to which were regulatory requirements in two directions. Firstly, greater capital requirements, which have doubled in the last few years. Secondly, regulatory requirements hit income statements as they limited the capacity to generate revenues, required higher costs and investments in technology and personnel, while producing a higher tax charge.
Competition from banks and non-banks was also stronger in various countries and business areas.
Santander is facing these challenges with a business model that has proved its strength in recent years and which we are adapting to the new environment, in order to maximise our profitability goals.
2015 Group results
2015 was a year of transition in which we posted good results and the Bank advanced in its commercial transformation.
We want to have more loyal customers and make transaction banking the key element. We are analysing which products have opportunities for improvement in each market and we are working on them. We are launching the 1|2|3 strategy, as well as other global Group proposals such as Santander Advance, International Desk, Santander Passport and Santander Trade for the corporate world.
The number of digital customers reflect the boost provided by the multichannel strategy. Of note were Mexico, Spain, UK and Portugal, which grew at rates of around 20% or more.
Digitalisation is key for adapting to the new form of customer relationships. Handling big data will provide us with better knowledge on our customers and enable us to respond to their needs. Moreover, it is an effective way to cut costs, enhance efficiency of processes
Santander has a business model that has proved its strength in recent years and which we are adapting to the new environment

18
2015 ANNUAL REPORTMessage from José Antonio Álvarez
+8%Commercial
revenues
Costs (in real terms and on a like-for-like basis)
+1%
-4%
Loan-loss provisions
+13%Underlying attributable
profit
and simplify our structure. We are making significant progress in this direction and have been recognised in the sector as pioneers in the launch of various apps and services.
This strategy is reflected in increased customer satisfaction and in balanced growth in business volumes.
Lending increased 6%, with gains in market share, mainly in SMEs and companies. Customer funds rose 7%.
These dynamics spurred revenues and enhanced their quality, as the most commercial and recurring income (+8%) increased its percentage of the total:
• In an environment of very low interest rates in some countries where we operate, net interest income increased 9% thanks to commercial and spread management.
• Fee and commission income rose 4%, absorbing the negative impact of regulatory requirements. We have improvement plans for the coming years.
In contrast, trading gains fell 16% as they were hit by market volatility. Other income was affected by higher allocations to deposit guarantee and resolution funds, to which the Group assigned close to €800 million in 2015.
The efficiency plans and discipline in costs enabled growth in costs to be almost flat in real terms and on a like-for-like basis. We met the efficiency plan goals (€2,000 million) one year ahead of schedule, thereby making austerity in operating costs compatible with investment in regulatory requirements and in digitalisation and the multichannel strategy.
We are one of the international financial system’s most efficient banks, and in order to continue being so, we announced at the Investor Day that we had increased the efficiency plan by €1,000 million to €3,000 million of cost savings for 2018. These will enable us to make investments and improvements while continuing to achieve excellent cost-to-income ratios.
Revenue growth and cost control were accompanied by a 4% decline in loan-loss provisions. This was made possible by the improvement in credit quality in almost all countries, thanks to an adequate risk management policy. With the launch of the advanced risk management programme (ARM) and strengthening of the risk culture throughout the Group under a common identity (risk pro), we are continuing to advance toward prudent and sustainable risk management.
These measures also pushed down the NPL ratio to 4.36% at the end of 2015, 83 basis points lower than in 2014, while coverage was six percentage points higher at 73%.
Underlying attributable profit increased 13% to €6,566 million.
In addition, in 2015 we recorded the impact of the net of non-recurring positive and negative results of €600 million. Even after absorbing this impact, profit was 3% higher.
The year’s results contributed significantly to the generation of capital, where we have a comfortable position consistent with the stability and recurrence of our business model. In fully loaded terms, the ratio was above the 10% target we set at the start of the year, as optimisation of capital is one of our strategic objectives.
And we combined an increase of 3% in the tangible book value per share with a cash dividend distribution of more than €2,200 million compared to €1,143 million in 2014.

19
2015 ANNUAL REPORTMessage from José Antonio Álvarez
In underlying terms, the RoTE remained at 11% and the RoRWA rose to 1.30%.
In short, we progressed in 2015 toward our main goals, demonstrating our strength and the efforts to earn the lasting loyalty of our employees, customers, shareholders and communities.
I will now devote the rest of my message to the performance by the main units in 2015 and the management priorities for 2016.
Performance by business areas in 20151
In Spain, we focused on forging long-term relations with our customers. For example, launching the 1|2|3 strategy with which we attained 860,000 accounts. We want to be the bank of choice for companies and so we launched the 1|2|3 account for SMEs, and other programmes with differentiated offers. This increased our market share in the segment, and we are leaders in wholesale banking. We also achieved a significant improvement in customer satisfaction surveys. Lastly, we strengthened the corporate governance model, aligning it with the rest of the Group’s subsidiaries.
In an environment of tough competition, attributable profit was 18% higher than in 2014 at €977 million, thanks to lower provisions and control of costs.
In the United Kingdom, the positive trend continued in individual customers with the 1|2|3 strategy, as well as in companies where we continued to gain market share. We focused on mobile and online channels, launching a range of solutions that was well received by the market. The number of digital customers rose 22%. We also continued to increase the number of loyal customers. In companies, we gained more market share with sustained growth in a market that as a whole is not growing.
Underlying attributable profit was 14% higher at £1,430 million thanks to good commercial dynamics, reflected in revenues and in an improvement in credit quality that led to lower provisions.
In Brazil, we continued to improve the bank and carry on the commercial transformation, based on a multichannel approach and growth in digital customers, improving and simplifying processes and in operations such as Getnet and Bonsucesso, with which we increased our fee and commission income. All of this is reflected in a more sustainable business model.
Attributable profit was €1,631 million, up 33%, and driven by commercial revenues, enhanced efficiency and provisions growing at a slower pace than lending.
Although it is not possible to isolate oneself completely from the country’s current recession, the improvement in the franchise over the last few years, the better quality of the balance sheet and gains in productivity and efficiency enable us to face the current environment with guarantees.
In the United States, we continued to strengthen the governance structure. We bolstered the risk management and control models in order to meet the regulator’s expectations. We are creating the holding company that will integrate businesses in the country, which impacted costs. We are investing in improving the banking franchise, in order to enhance the customer relationship and increase profitability.
The priority at Santander Consumer USA is auto finance, as we are discontinuing the business of personal loans.
All these measures are temporarily impacting results and largely explain the drop in profit to $752 million.
>€2,200million in
cash dividend
860,0001|2|3 accounts
+22%digital customers
+33%attributable
profit
1. All changes in this section are calculated in local currency terms.

20
2015 ANNUAL REPORTMessage from José Antonio Álvarez
Beyond the current point in the cycle, emerging economies are a fundamental asset in Banco Santander’s strategy
Santander Consumer Finance is Europe’s consumer credit leader, with a unique business model and excellent credit quality. Geographic and product diversification was strengthened by the latest operations, such as the integration of GE Nordics and development of the agreement with Banque PSA Finance, which is meeting the timetable set. Attributable profit rose 18% to €938 million.
In Mexico, we completed the expansion plan begun in 2012, which was reflected in a faster pace of business growth and gains in market share. Pre-tax profit grew 8% thanks to the positive trend in revenues, mainly net interest income.
In Chile, the focus was on business growth in companies and in target segments of individual customers, as well as in improving the quality of customer attention. The result was better than expected despite the 13% fall in profit, which was due to lower UF inflation than in 2014 and a higher tax charge.
In Argentina, profit grew by more than 20%, thanks to progress in the new commercial strategy and the expansion plan, which produced higher net interest income, and fee and commission income.
In Poland, we are the best bank in terms of profitability and continued to be the leader in cards, and mobile and online banking. Profit fell 15% because of the drop in interest rates and the introduction of maximum rates for consumer credit and cards.
In Portugal, we gained market share, mainly in companies. We are in a process of normalising profits, which rose 63%. In December, Santander Totta was awarded most of assets and liabilities of Banco Internacional do Funchal (Banif), making us the country’s second largest private sector bank.
Business areas priorities for 2016
Looking to 2016, the outlook for the global economy points to a slight and uneven recovery. This improvement will come from advanced economies, which will consolidate their moderate recovery, while emerging economies will struggle to stabilise their growth.
Beyond the current point in the cycle, emerging economies are a fundamental asset in Banco Santander’s strategy. Firstly, because of their higher growth potential, in view of their demographic dynamics, and their more vigorous productive capacity; secondly, the considerable gap they still have to fill in terms of banking penetration, based on the improvement of their levels of development, and the substantial growth in their middle classes; and thirdly, the diversification and stability that these countries provide to our balance sheet and income statement from businesses in economies with different cycles, as shown once again in the extreme conditions of the last few years.
In this context, we will continue to focus on improving customer satisfaction in all the Group’s units, on advancing in the digital transformation process and on increasing the number of loyal customers. We will also continue to centre selectively on key businesses in order to gain market share in them. At the same time, setting priorities on the basis of the features and the circumstances of each market:
• In Spain, we want to have 2 million 1|2|3 accounts, continue to improve customer satisfaction, reduce the cost of credit and gain market share in SMEs.
• The UK will continue to focus on customer satisfaction, the digitization process, increase the range of services and grow again at a faster pace than the market in SMEs.
• In Brazil, the improvement in our franchise in the last few years, the enhanced quality of the balance sheet and further gains in productivity and efficiency should enable us to face the year with guarantees. We have management tools to take advantage of the high interest rate environment and we will concentrate on selective business growth, operational efficiency and control of risk.

21
2015 ANNUAL REPORTMessage from José Antonio Álvarez
• Santander Consumer Finance will complete the agreement with Banque PSA Finance, strengthen consumer business through Pan-European agreements and step up its presence in digital channels.
• In the United States, we will continue to bolster the franchise with differentiated strategies for each entity, while integrating the main units in the country into Santander Holding USA.
• In the rest of units, the priorities are the following. In Mexico, we will strengthen our position by consolidating key segments. In Chile, we will focus on improving customer attention and on transforming our commercial and retail banking, while renewing our branches. We have a very similar strategy in Argentina, where we are also expanding the network and advancing in digitization. Lastly, in Portugal we will manage Banif’s integration and in Poland we will continue to be the reference point bank in innovation and leaders in digital channels, with a clear objective of gaining more market share in companies.
Conclusions
We made progress in 2015 in the main strategic objectives and our financial variables performed well.
We will continue in 2016 to advance in the Group’s commercial transformation. We have clear goals for the year, as announced at the Investor Day, both for the whole Group and for countries:
• Raise the number of loyal customers, both individuals and companies, and digital customers.
• Increase market share in SMEs and companies.
• Reduce the cost of credit.
• Grow fee and commission income at a faster pace.
• Maintain the year-end cost-to-income ratio stable.
• Boost dividend and earnings per share.
These objectives are part of our medium-term priorities: grow in business volumes, increase revenues and improve profitability, with capital levels in line with business needs and regulatory requirements.
None of this would be possible without the help, work and motivation of Santander Group’s highly professional and experienced team. We want to continue to strengthen it through our talent management model that enables us to identify employees’ potential and develop a career plan that is individually tailored. In addition, we are implementing new ways of working, with more flexible models that are adapted to current life, in order to consolidate our bank as one of the best companies to work for.
I firmly believe that, with the commitment of our employees and the trust of our customers and shareholders, we can attain our goals and continue to help people and businesses prosper in a Simple, Personal and Fair way.
José Antonio ÁlvarezChief executive officer
We made progress in 2015 in the main strategic objectives and our financial variables performed well.We will continue in 2016 to advance in the Group’s commercial transformation

22
2015 ANNUAL REPORTCorporate governance
Corporate governanceSantander strengthened its corporate governance, focusing, in particular, on the role and functioning of the board of directors and leadership in the Group’s main policies and strategies, as well as the key role it plays in risk management, in accordance with the highest international standards.
Balanced and committed board
• Of the 15 directors, 11 are non-executive and 4 executive.
• A diverse board (33% of women) with international experience.
Equality of shareholders’ rights
• The principle of one share, one vote, one dividend.
• The Bylaws do not contain anti take-over measures.
• Encouragement of informed participation at shareholders’ meetings.
Maximum transparency, particularly in terms of remuneration
• This is key for generating shareholder and investor confidence and security.
• New remuneration policy for executive directors and senior management, aligned with our Simple, Personal and Fair culture.
At the forefront of international best governance practices. In 2015:
• The position of lead director gains importance and the role of the board’s committees is strengthened.
• Enhancement of risk management governance.
• Internal governance framework for relations between the parent bank and subsidiaries.
Board of directorsThe board of directors is the Group’s highest decision-making body, except for matters reserved for the general shareholders’ meeting. Santander has a first-class, highly qualified board; experience, knowledge, dedication and diversity are its main assets.
In line with the Bank’s aim and purpose and as part of its general oversight function, the board leads the decisions regarding the Group’s main policies, strategy and corporate culture. It defines the Group’s structures and promotes the appropriate policies in relation to corporate social responsibility. In particular, in the exercise of its responsibility and involvement in managing all risks, it must approve and monitor the risk appetite and framework and ensure that the “three lines of defence” model (business and risk origination; risk control and compliance and internal audit) are respected.
Its functioning and activities are regulated by the Bank’s internal rules, which are governed by the principles of transparency, responsibility, justice, effectiveness and defence of shareholders’ interests. The board also ensures compliance with the best international practices and continues to advance in attaining the highest corporate governance standards, for which several changes were made to the board’s rules and regulations during 2015.
The composition of Banco Santander’s board is balanced between executive and non-executive directors. The board was strengthened in 2015 with more non-executive directors (most of them independent) who ensure appropriate control of the business and decision-taking, fostering, furthermore, debate that is more challenging and of higher quality on these issues.
Robust corporate governance is key for guaranteeing a sustainable business model over thelong term
For more information on corporate governance see pages 74 to 111 of Banco Santander’s Annual Report

23
2015 ANNUAL REPORTCorporate governance
Composition of the boardNumber and % of directors
Executive directors4 (27%)
Non-executive directors
2 (13%)Non-executive
directors (independent)
8 (53%)Non-executive director (proprietary)1 (7%)
Banco Santander’s board
Diversity in the board Relevant expertise of board members% of female directors %
33% 80% 80%
67% 67%60%
19%
11%
2011 2013 2015 Accounting Banking Risks Latin America UK/USand finance
International experience
All board members are recognised for their professional capacity, integrity and independence and, individually and collectively meet the conditions, experience and necessary dedication for attaining the goal of turning Santander into the best retail and commercial bank. The non-executive directors’ profile includes professionals with extensive financial experience, wide knowledge of the markets where the Group has businesses and of the different sectors and customer service models from top-level executive positions.
At the end of 2014, Santander granted bylaw-stipulated status to the position of lead director and consolidated it further in 2015 through the appointment of Mr Bruce Carnegie-Brown.
Remuneration policyThe Bank’s remuneration policy for directors and senior management is based on the following principles:
1. Remuneration must be consistent with rigorous and prudent risk management.
2. Anticipating and adapting to the regulatory changes in remuneration matters. The executive directors’ variable remuneration deferred period, as well as that of other executives within the Group’s identified category, are consistent with the provisions of the CRD IV.
3. Involvement of the board, as, at the proposal of the remuneration committee, it approves the annual remuneration report for directors and submits it to the general shareholders’ meeting on a consultative basis and as a separate item on the agenda.
4. Transparent information.
The board held
21meetings in 2015.
Changes in the composition of the board
At its meeting on 30 June 2015, the board agreed ton College. In order to fill this vacancy, the board, to appoint Mr Ignacio Benjumea, until then at the proposal of the appointments committee general secretary and secretary of the board, as and after obtaining the corresponding regulatory non-executive director of Banco Santander. At authorisations, agreed to appoint Ms Belén Roma-the same date, Mr Jaime Pérez Renovales was na as an independent director.appointed as the new general secretary and secretary of the board, and Mr Juan Rodríguez The appointments of Mr Ignacio Benjumea and Inciarte tendered his resignation as director. Ms Belén Romana will be submitted to the next
general shareholders’ meeting for ratification. Ms Sheila Bair resigned as director as of October 1 after she was appointed president of Washing-
At its meeting of 6 July 2015, the board selected Pricewa-terhouseCoopers Auditores, S.L. (PwC) to be the external auditor of Banco Santander and its consolidated Group and verify the financial statements for 2016, 2017 and 2018. This decision was adopted in line with the cor-porate governance recom-mendations with regard to rotation of the auditor, at the proposal of the audit commi-ttee and as a result of a fully transparent selection pro-cess. The board submitted this appointment for appro-val by the ordinary general shareholders’ meeting.
New auditor

24
2015 ANNUAL REPORTCorporate governance
Board of directors of Banco Santander 16 11 5 87 310 1 2 4 13 15
9 146 12
1. 2. 3. 4. Ms Ana Patricia Botín-Sanzde Sautuola y O’Shea
Mr José Antonio Álvarez Álvarez
Mr Bruce Carnegie-BrownVice chairman. Non-executive
Mr Rodrigo Echenique Gordillo
Group executive chairman Chief executive officer director (independent) and Vice chairman and and executive director and executive director coordinator of the non-executive executive director
directors (lead director)
Pereda building, Santander Group city, Boadilla del Monte, Madrid, Spain. 22 December 2015.
9. 10. 11. 12. Mr Juan Miguel Villar MirNon-executive director (independent)
Ms Belén Romana GarcíaNon-executive director (independent)
Mr Javier Botín-Sanzde Sautuola y O’SheaNon-executive director (proprietary)
Ms Esther Giménez-Salinas i ColomerNon-executive director (independent)

25
2015 ANNUAL REPORTCorporate governance
Executive committee Audit committee Risk supervision, regulation Appointments committee and compliance committee (board risk committee) Remuneration committee International committee
Innovation and technology committee
You can access the interactive photo of the board online
5. Mr Matías Rodríguez InciarteVice chairman and executive director
6. Mr Guillermo de la Dehesa RomeroVice chairman and non-executive director
8. Mr Ignacio Benjumea Cabeza de VacaNon-executive director
7. Ms Isabel Tocino BiscarolasagaNon-executive director (independent)
13. Ms Sol Daurella ComadránNon-executive director (independent)
14. Mr Ángel Jado Becerro de BengoaNon-executive director (independent)
16. Mr Jaime Pérez RenovalesGeneral secretary and secretary of the board
15. Mr Carlos Fernández GonzálezNon-executive director (independent)

26
2015 ANNUAL REPORTCorporate governance
Banco Santander’s structure and internal governance
Subsidiary modelSantander Group is structured using a subsidiary model of which the parent is Banco Santander, S.A. Its registered office is in the city of Santander (Cantabria, Spain) and its corporate centre is in Boadilla del Monte (Madrid, Spain).
The Group’s subsidiary model is characterised by the following:
• The governing bodies of each subsidiary are responsible for rigorous and prudent management, ensuring economic soundness and overseeing the interests of shareholders and other stakeholders.
• The subsidiaries are managed on the basis of local criteria and by local teams that contribute considerable knowledge and experience of customer relationships in their markets, while benefiting from the synergies and advantages of belonging to Santander Group.
• They are subject to the regulation and supervision of their local authorities, in addition to the supervision performed globally by the European Central Bank on the Group.
• Their deposits are guaranteed by the respective deposit guarantee schemes of the countries where they are located.
The subsidiaries are funded autonomously in terms of capital and liquidity. The Group’s capital and liquidity positions are coordinated in the corporate committees. The intragroup exposures are limited, transparent and at market prices. The Group, moreover, has listed subsidiaries in some countries in which it retains a controlling stake.
The subsidiaries’ autonomy limits the contagion risk between the Group’s different units, which reduces systemic risk. Each subsidiary has its own resolution plan.
Corporate centreBanco Santander’s subsidiary model is complemented by a corporate centre that has support and control units which carry out functions for the Group in matters of risk, auditing, technology, human resources, legal affairs, communication and marketing, among others. The corporate centre adds value to the Group by:
• Making the Group’s governance more solid, through global control frameworks and supervision, and taking strategic decisions.
• Making the Group’s units more efficient, fostering the exchange of best practices in cost management, economies of scale and a common brand.
• Sharing the best commercial practices, focusing on global connectivity, launching global commercial initiatives and fostering digitalisation, the corporate centre contributes to the Group’s revenue growth.
Changes in the boards of the subsidiaries in 2015
Since the end of 2014 there have been chan-ges in the boards of the Group’s subsidiaries with the appointment of new non-executive chairmen and new country heads in the US, UK, Brazil, Spain and Mexico. Of note was the crea-tion of the Santander Spain board, which did not involve any corporate change, thereby making its governance structure similar to the subsi-diary model used in the Group’s other markets. Banco Santander also strengthened its presence and oversight of local units with the appoint-ment of new Group directors to the boards of its main subsidiaries.
Santander Group isstructured using a subsidiary modelof which the parent isBanco Santander, S.A.
27
2015 ANNUAL REPORTCorporate governance
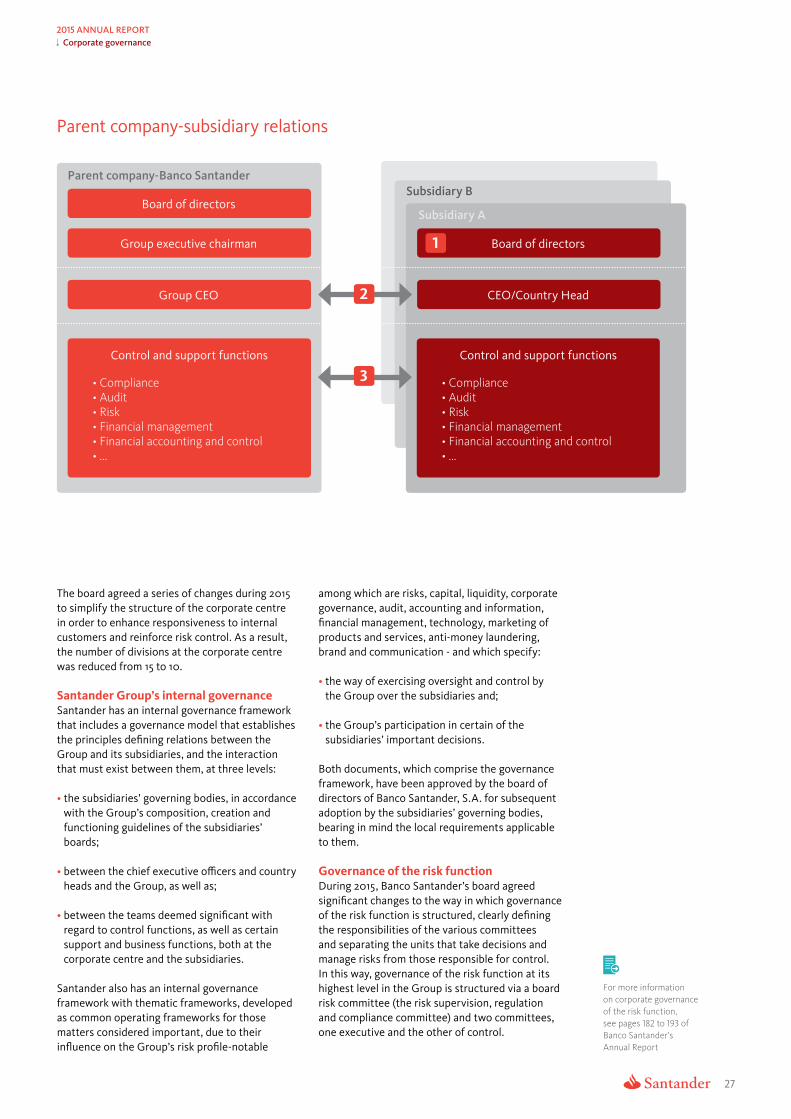
Parent company-subsidiary relations
Parent company-Banco Santander
Board of directors
Group executive chairman
Group CEO
Control and support functions
• Compliance• Audit• Risk• Financial management• F inancial accounting and control• ...
2
3
Subsidiary B
Subsidiary A
1 Board of directors
CEO/Country Head
Control and support functions
• Compliance• Audit• Risk• Financial management• Financial accounting and control• ...
The board agreed a series of changes during 2015 to simplify the structure of the corporate centre in order to enhance responsiveness to internal customers and reinforce risk control. As a result, the number of divisions at the corporate centre was reduced from 15 to 10.
Santander Group’s internal governanceSantander has an internal governance framework that includes a governance model that establishes the principles defining relations between the Group and its subsidiaries, and the interaction that must exist between them, at three levels:
• the subsidiaries’ governing bodies, in accordance with the Group’s composition, creation and functioning guidelines of the subsidiaries’ boards;
• between the chief executive officers and country heads and the Group, as well as;
• between the teams deemed significant with regard to control functions, as well as certain support and business functions, both at the corporate centre and the subsidiaries.
Santander also has an internal governance framework with thematic frameworks, developed as common operating frameworks for those matters considered important, due to their influence on the Group’s risk profile-notable
among which are risks, capital, liquidity, corporate governance, audit, accounting and information, financial management, technology, marketing of products and services, anti-money laundering, brand and communication - and which specify:
• the way of exercising oversight and control by the Group over the subsidiaries and;
• the Group’s participation in certain of the subsidiaries’ important decisions.
Both documents, which comprise the governance framework, have been approved by the board of directors of Banco Santander, S.A. for subsequent adoption by the subsidiaries’ governing bodies, bearing in mind the local requirements applicable to them.
Governance of the risk functionDuring 2015, Banco Santander’s board agreed significant changes to the way in which governance of the risk function is structured, clearly defining the responsibilities of the various committees and separating the units that take decisions and manage risks from those responsible for control. In this way, governance of the risk function at its highest level in the Group is structured via a board risk committee (the risk supervision, regulation and compliance committee) and two committees, one executive and the other of control.
For more information on corporate governance of the risk function, see pages 182 to 193 of Banco Santander’s Annual Report


1Business model and strategy
30 Purpose and business model 32 Aim and value creation
34 Employees 38 Customers 44 Shareholders 48 Communities
management Risk 52
We want to earn the lasting loyalty of our people, customers, shareholders and communities.
Employees
Communities
Customers
Shareholders
Access these and other real experiences

30
Purpose and business model1. Business model and strategy
2015 ANNUAL REPORT
Purpose and business modelSantander has a customer-focused business model that enables it to fulfil itspurpose of helping people and businesses prosper.
A large yet simple bank
1 Geographic diversification, focused on Europe and the Americas
Santander Group’s geographic footprint is As well as local services, Santander has globalbalanced between mature and emerging markets, businesses that develop products that arewith a significant presence in Argentina, Brazil, distributed through the Group’s retail networksChile, Spain, United States, Mexico, Poland, and provide services to customers worldwide.Portugal, United Kingdom and consumer finance business in Europe1.
Geographicdiversification
Contribution toattributable profit
Critical mass in Europe The Americas56% 44%10 core markets
1. Santander Consumer Finance develops its business mainly in Germany, France, Italy, the Nordic countries, Poland and other Central and Eastern European countries.
Focus on retailand commercial
banking2 Focus on retail and commercial banking
Banco Santander’s commercial model is designed tosatisfy the needs of all types of customers: individualswith different income levels; companies of any size anddifferent sectors of activity; private companies and publicinstitutions. Earning their lasting loyalty is the Bank’s mainobjective. The Bank has high market shares in retail andcommercial banking in its core markets where its principal
Subsidiarybusiness is to attract deposits and provide loans. The Bankmodelfocuses its wholesale banking offer on providing services to
its main customers in local markets.
3 Subsidiary model
Santander Group is structured using a subsidiary model thatare autonomous in capital and liquidity terms,and are subject
Retail and commercial to regulation and supervision by local authorities, as well as thatbanking generates exercised on the consolidated Group by the European Central Bank.
These subsidiaries are managed according to local criteria and by81%local teams that contribute substantial knowledge and experienceof profitswith customers in their markets, while also benefiting from thesynergies and advantages of belonging to Santander Group. Thesubsidiaries’ autonomy limits contagion between the Group’s unitsand reduces the risk.

31
Purpose and business model1. Business model and strategy
2015 ANNUAL REPORT
A value-adding corporate centre
4 International talent, with a shared culture and a global brand
Santander’s employees share a corporateculture focused on fulfilling the Group’spurpose and aim.
The Santander brand synthesises the Group’sidentity and expresses a corporate cultureand unique international positioning that isconsistent and coherent with a way of doing
International banking that helps people and businessestalent, culture prosper in a Simple, Personal and Fair way.
and brand
5 A strong balance sheet, prudent riskmanagement and global control frameworks
A strong balancesheet, prudent
risk managementand global control
frameworks
Santander has a medium-low riskprofile and high asset quality, with arisk management culture that strives toimprove every day. It has a solid capitalbase consistent with its business model,
corporate governance through operatingframeworks, corporate policies and globalcontrol systems. This enables the Groupto obtain better results and contributegreater value than that which would come
balance sheet structure, risk profile and from the sum of each of the local banks.regulatory requirements.
The corporate centre adds value andmaximises subsidiaries’ competitiveness,helping them to become more efficient,generate revenues and implement themost demanding standards in terms of 47.6%
Innovation, digitaltransformation and
Cost-to-incomeratio
best practices
6 Innovation, digital transformation and best practices
Innovation has been one of Santander Santander is carrying out an intense digitalGroup’s hallmarks since it was founded. On transformation which affects not onlymany occasions the Bank has revolutionised services provided to customers but also allthe financial industry with new products its operations, both internal and external;and services. The Group’s size enables it to how to use data to spur business growth;identify and quickly and efficiently transfer updating and modernising systems andits best practices between the different streamlining processes and the organisationmarkets in which it operates, adapting them as a whole.to local features.
32
Aim and value creation1. Business model and strategy
2015 ANNUAL REPORT
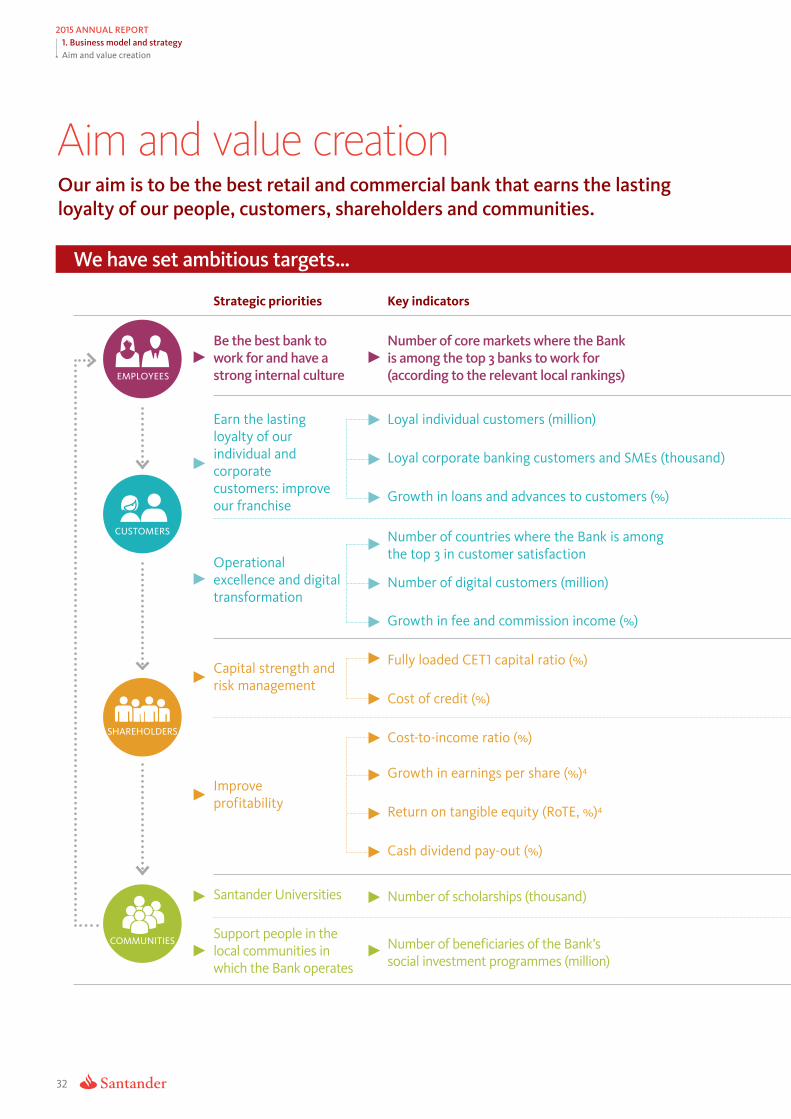
Aim and value creationOur aim is to be the best retail and commercial bank that earns the lasting loyalty of our people, customers, shareholders and communities.
We have set ambitious targets…
Strategic priorities Key indicators
Be the best bank to work for and have a
EMPLOYEES strong internal culture
Number of core markets where the Bank is among the top 3 banks to work for (according to the relevant local rankings)
Earn the lasting loyalty of our individual and corporate customers: improve our franchise
Loyal individual customers (million)
Loyal corporate banking customers and SMEs (thousand)
Growth in loans and advances to customers (%)
CUSTOMERS
Operational excellence and digital transformation
Number of countries where the Bank is among the top 3 in customer satisfaction
Number of digital customers (million)
Growth in fee and commission income (%)
Capital strength and risk management
Fully loaded CET1 capital ratio (%)
Cost of credit (%)
SHAREHOLDERS Cost-to-income ratio (%)
Improve profitability
Growth in earnings per share (%)4
Return on tangible equity (RoTE, %)4
Cash dividend pay-out (%)
Santander Universities Number of scholarships (thousand)
COMMUNITIES Support people in the local communities in which the Bank operates
Number of beneficiaries of the Bank’s social investment programmes (million)

33
Aim and value creation1. Business model and strategy
2015 ANNUAL REPORT
2014 2015 2018Pages with
more info
3 3 >5 34-37
11.6 12.7 17 38-39
968 1,049 1,646 38-39
5% 6% > peers 64
5 5 All2 43
14.1
5.4
16.6
4.3
30
c. 10%1
40-41
18
9.65% 10.05% >11% 44-64
1.43% 1.25% 1.2%1 64
47.0%
24.4%
11.0%
47.6%
-7.0%
11.0%
<45%
double dígit
C. 13%
63
62
62
20% 38% 30-40% 45
30 35 1303 50-51
— 1.2 4.53 49
1. 2015-2018 average.
2. Except in the US where it will likely be close to competitors.
3. Total amount 2016-2018.
4. Calculated on ordinary profit.
… and we have defined how to attain them.
Simple, Personal and Fair is the essence of the Bank’s corporate culture. It reflects how all Santander’s teams think and act and what our customers demand of us as a bank. It defines the behaviours that guide our actions and decisions and the way in which we should interact with our employees, customers, shareholders and communities.
We offer an accessible service for our Simplecustomers, with simple, easy-to-understand products. We use plain language and improve our processes every day.
We treat our customers in an Personalindividualised and personalised way, offering them the alternatives that best suit their needs. We want each and everyone of our employees and customers to feel unique and valued.
We treat our employees and customers Fairfairly and equally, are transparent and keep our promises. We establish relations in such a way that the Bank as well as its employees, customers and shareholders obtain benefits. Because we understand that what is good for them is also good for the Bank.
According to the engagement survey carried out in 2015 and which had a response rate of 84%, only eight months after the launch of the new corporate culture 75% of Santander’s professionals perceive the Bank as Simple, Personal and Fair.

34
Aim and value creation > Employees1. Business model and strategy
2015 ANNUAL REPORT
EmployeesIn order to be the best retail and commercial bank for our customers, we have to begin with our employees. If they feel proud of belonging to Santander and are more committed, they will be able to earn the lasting loyalty of our customers.
Santander aspires to be one of the top 3 banks to work for in most of the countries where it operates and continue strengthening its corporate culture.
Working differentlyNew ways of working at Santander were developed during 2015, based on the new corporate culture. We established more flexible corporate behaviour and work systems that allow for a better work-life balance.
• Corporate behaviours. Employees in all countries participated in a process to define eight corporate behaviours that will shape the way we work and make Santander an increasingly Simple, Personal and Fair bank. These behaviours have been adapted to the local reality of each country.
Corporate behaviours for a more Simple, Personal and Fair bank
Show respect“I show respect and I treat others as I would like to be treated, acknowledging and appreciating one another’s differences”.
Talk straight“I talk straight and adapt to others and the specific context, speaking out constructively”.
Actively collaborate“I actively encourage co-operation to find the best solution for my customers and colleagues”.
Support people“I give support to people in their development, providing feedback and appreciating their contribution”.
Truly listen“I listen and have empathy, to understand others’ needs”.
Keep promises“I keep my promises and I am consistent in everything I do”.
Bring passion“I bring passion and energy and I give my best to earn the lasting loyalty of my customers and colleagues”.
Embrace change“I embrace change, bringing innovative solutions and learning from mistakes”.

35
Aim and value creation > Employees1. Business model and strategy
2015 ANNUAL REPORT
Corporate flexibility policy A framework valid for all countries, adapted and implemented locally.
1Leadership and cultureManagement of people and teams that allows for a work-life balance and improves efficiency.
2Objectives and planningA work system planned with clear goals, where working hours no longer mark the way we work.
3Spaces and collaborationMore open and collaborative workspaces.
4Technology and resourcesTools for working remotely, at any moment and from anywhere.
5ProcessesStreamlining processes in order to make more productive use of time.
6
• Flexiworking. This is a new way of working in the Bank which aims to:
• Improve the organisation and planning of work, making it more efficient and collaborative, getting more out of technology, eliminating bureaucracy and making better use of meetings and e-mails.
• Give executives the autonomy to facilitate to their teams flexibility measures that help them to attain a better work-life balance.
• Acknowledge employees’ engagement and dedication.
The first initiative was the flexibility policy. A total of 939 flexibility plans were formalised in 2015 in the corporate centre, which led to 34,446 measures enjoyed by 93% of employees.
One of the keys of the success of Flexiworking is the ambassadors, professionals chosen in various divisions and countries to help to drive and implement the new culture.
• New relationship model between countries and the corporation, to identify and share the best practices for managing people and take advantage of the Group’s diversity. There are three areas of activity: regulation and governance, to ensure compliance with the regulatory requirements in matters of compensation, succession planning, training, etc; policies, to design the basic lines of managing the Group’s employees, but with the autonomy to adapt and execute depending on
each particular situation; and additional support of the corporation, contributing value-added, for example, ensuring that best practices are shared and promoting global projects.
• Digital transformation. Digital Days were launched in 2015, held in the corporate centre as well as in almost all countries, with the aim of turning employees into opinion leaders of digital banking.
Mobile phone apps were also launched, such as the app for expenses and problem-solving in the corporate centre, which, respectively, facilitate settlement of expenses and reporting of various types of incidents; and the É Conmigo Santander in Brazil, which also reports incidents.
• Corporate volunteer policy. Approved by the board in December in order to organise and highlight the current volunteer initiatives. Education will be the focal point of this policy and there will be two key events: the We are Santander Week in June and the International Volunteer Day in December. Each country also has its own initiatives. Santander had 55,254 volunteers worldwide in 2015.
• We are Santander Week. Under the slogan of “A Simple, Personal and Fair Week”, the new corporate culture was the central element of the We are Santander Week in 2015. Corporate and local activities were developed to foster commitment among employees, education, listening and pride in belonging to the Group.
193,863 Employees
55% 45%
Average number of years with Santander
9 11Graduates
55% 45%Average age (years)
37 39

36
Aim and value creation > Employees1. Business model and strategy
2015 ANNUAL REPORT
Annual engagement survey
The 2015 results were better compared to 2014, particularly in two aspects: work-life balance, which rose from 50% to 72%, thanks to the launch of Flexiworking, and the role of executives as people managers, especially in terms of respect and recognition, which improved from 61% to 72%.
Moreover, there were still areas of improvement regarding organisational support, such as the speed with which decisions are taken, the simplification of processes and the improvement in the organisation of positions, although in general it increased from 63% to 66%.
Town hall meeting of Ana Botín with employees at Santander Group City, June 2015.
Talent managementThe following measures were added to talent management in 2015, in order to align it with the transformation that the Group is undergoing.
• Succession planning policy and process: to establish the management and monitoring guidelines of possible replacements in key positions of senior management and control functions.
• Inclusion of customer satisfaction metrics: to calculate employees’ variable remuneration.
• Open offer policy: as of April the Group’s employees were able to choose the training courses they preferred on the basis of their interests and professional training needs.
• Employee Relationship Management (ERM): this tool allows our HR teams to improve its knowledge of the corporate centre’s professionals, segmenting them with a customer focus according to their profiles so as to adjust the training and development actions of human resources to their specific needs.
• Performance appraisal: 180-degree appraisal for executives, and new corporate behaviours included in this appraisal.
Various projects put into effect during 2014 were also consolidated:
• Talent Assessment Committees: bodies that regularly meet and involve senior management. The performance of professionals and their potential is analysed. More than 1,350 executives were assessed during 2015, of which close to 35% have an individual development plan.
• Global Job Posting: corporate platform that gives all professionals the possibility of knowing and opting to apply for job openings in the Group. In 2015, 381 offers were made.
Transparent communicationProgress was made in 2015 in the process of listening to and dialoguing with employees.
• Santander Ideas, the first internal social network enabling professionals in all countries to share their ideas on strategic issues for the Bank, vote on them and comment. Since the platform’s launch in 2014, 27,850 users contributed more than 13,000 ideas.
Santander Ideas received 3,046 ideas in 2015 and held seven challenges in six countries: Argentina, Chile, Portugal, Poland, the corporate centre (Spain) and Germany. Employees made suggestions on how to achieve an increasingly Simple, Personal and Fair bank for them, customers, shareholders and communities.
84%participation
75%engaged
employees
82%of employees feel
proud to work for Santander

37
Aim and value creation > Employees1. Business model and strategy
2015 ANNUAL REPORT
Of note among the ideas implemented in 2015, in addition to Flexiworking, was Best4us, which puts Group employees in touch with one another so that they can share common interests (language learning, cultural exchanges); Santander Benefits, an online space that promotes offers and services for the Group’s professionals in Spain; and ideas related to the Branch of the Future, a new branch model that allows simpler processes, a more intuitive technology and differentiated spaces according to the customers’ needs.
• Various town hall meetings were held, both in the corporate centre and in countries, led by our Group executive chairman, the Group CEO and country and division heads, in order to enhance the information on of the progress made in executing the strategy and fostering the corporate culture.
Recognitions Among the recognitions obtained by Banco Santander during 2015 were the following:
• The annual Most Attractive Employers study carried out by the Swedish consultancy Universum, which gathers the opinions of more than 16,000 Spanish students, places Banco Santander among the four best companies to work for by business students and business schools that also consider it their preferred bank.
• The 2015 Latam ranking of Universum puts Banco Santander as the most preferred bank to work for and the eighth company among business students in Latin America.
• The study by the consultancy Randstad among more than 8,000 potential candidates aged between 18 and 65 recognises Santander as one of the preferred banks to work for in Spain.
27,850users of the Santander Ideas platform
3,046ideas received from employees in 2015
SANTANDER EXPERIENCE
“When our customers are happy and satisfied, I know am doing a great job”Jigar Thakkar has been working at Banco Santander for the past nine years. He is a Branch Director in St. Albans (London, UK), where he also actively volunteers in the community.
With our Simple, Personal and Fair culture, he feels that the Bank has changed how it interacts with customers, simplified its branch processes and enabled us to have a more personal touch with each customer.
Access thise and other real experiences

38
Aim and value creation > Customers1. Business model and strategy
2015 ANNUAL REPORT
CustomersWe want to help our customers progress day by day: with simple and tailor-made solutions that increase their loyalty to the Bank; a fair and equal treatment based on trust and excellent service through our branches and digital channels.
Santander continued to make progress in 2015 in transforming its commercial model with three clear priorities:
• Customer loyalty, with specific programmes in all countries that enable us to reach our target of 18.6 million loyal customers by 2018.
• Digital transformation, with an end-to-end strategy to reach 30 million digital customers by 2018.
• Operational excellence, with initiatives that improve customer experience so that Santander is among the top 3 banks in 2018 in customer satisfaction in its core markets.
Customer loyaltyDeveloping value propositions by customer type and having a long-term strategy is the way to increase customer loyalty in the Group’s core markets. Among the main initiatives in 2015 were:
• 1|2|3 World. In Spain, the 1|2|3 Account for individual customers was launched in May and rewards balances with interest rates of 1%, 2% and 3% up to €15,000 and cashback on household bills. This product has also been adapted and extended to the SME segment, reimburses in cash part of payroll and social security payments, taxes and supplies related to business activity and provides loans on preferential terms.
In Portugal, 1|2|3 World was launched in March and offers discounts on purchases made with the 1|2|3 card, cashback on household bills and discounts on petrol, among other benefits.
In the United Kingdom, the 1I2I3 value proposition consolidated as the first choice of customers who decide to switch their bank.
• Santander Select. The Group’s differentiated value proposal for high income customers is already installed in all countries and has more than 2 million customers. It is a specialised attention model, with a global and exclusive offer tailored to the needs of these customers, which during 2015 was improved and extended. Of note among these practices is Select Expat in Mexico, which exploits the Group’s global scale to accompany customers in their internationalisation process; the launch of a range of profiled funds in several countries; and the consolidation of the Débito Global card.
• Santander Private Banking. A comprehensive and specialised service model for higher income customers, which during 2015 received important awards, such as those given by Euromoney magazine in Argentina, Chile and Portugal; and Global Finance in Spain, Mexico and Portugal. The volume of funds managed by the private banking business increased 5% during 2015.
• Santander has specific programmes for SMEs which combine a strong financial offer with non-financial solutions that help spur internationalisation, connectivity, training, talent attraction, etc. This programme was extended to Uruguay, Argentina, Brazil and Chile in 2015 and is now in place in eight of the Group’s markets. Santander Advance and Breakthrough are the main hallmarks of this programme.
1|2|3 World in figures
UK4.6million 1|2|3 customers
1million new 1|2|3 World customers in 2015
96% of 1|2|3 current account holders have a primary banking relationship
Spain860,000accounts
237,000payroll accounts captured
Portugal>110,000customers
53,920 customers with full 1|2|3 which includes account, card and insurance protection

39
Aim and value creation > Customers1. Business model and strategy
2015 ANNUAL REPORT
Group customersMillion
Spain 12.7
Portugal 3.8
UK 26.0
Poland 4.3
Germany 6.1
Rest of Europe 10.8
Total Europe 63.7
Brazil 32.4
Mexico 12.4
Chile 3.6
Argentina 2.8
Rest of Latin America 0.8
Total Latin America 52.0
United States 5.1
Total customers 120.8
Santander has a significant potential in customer loyalty Million c
121
ustomers
100
56 +10%in 2015
Total
14
Retail and Active Loyal customers commercial customers customers
banking customers1
1. Excluding consumer finance customers.
A loyal customer is much more profitable
x4 retailx4 SMEsx5 corporates
Moreover, by harnessing its synergies and international presence, Santander has specific solutions to support the internationalisation of its customers. Among the main initiatives are:
• Santander Passport. A customer service model with a consistent offer for global companies in all the countries where the Group operates. It has more than 6,000 registered customers and is installed in eight countries. The rest of countries where the Bank has a commercial presence are due to join the model during 2016.
• Santander Trade. A portal dedicated to foreign trade that provides information, tools and resources to help companies grow their business abroad. It is already available in 14 countries and has received more than two million visits since its creation and more than 35,000 registered exporters and importers.
As part of this portal, the Santander Trade Club is an innovative social platform that enables the Bank’s customers from various countries to contact one another and expand their international activity. There are currently more than 11,000 members.
• International Desk. A service established in 14 countries with over 8,000 registered customers and offering support to companies that want to enter markets where the Bank is operating, thereby facilitating their entry into a new country.
Progress was made in defining trade corridors within the Group (for example, UK-Spain, Mexico-Spain). Its international trade tools, products and services are also being improved in order to offer our customers the best solutions.
Know customers’ needs
In order to deepen knowledge of this knowledge, commercial actions can customers and have a 360º view of be launched and customers’ opinions their behaviour and preferences with collected, thereby improving commercial regard to the Bank, the NEO CRM was effectiveness and customer satisfaction.developed further during 2015. This tool uses business intelligence methodology NEO CRM was launched in Chile in 2012 to compile more than 500 relationship and then extended to Spain, Brazil, United instances with the Bank and learn how States and Uruguay. In 2016, it will be customers behaved. On the basis of installed in Mexico, Argentina and Poland.

40
Aim and value creation > Customers1. Business model and strategy
2015 ANNUAL REPORT
Multichannel customer profile
Our customers increasingly use their mobile phone to bank with Santander.
Digital users: Number of accesses/month per customer:
16.6 17% more than Internet million in 2014 9 accesses/monthdigital users
Mobile 50% more 6.9 13 accesses/month
million mobile than in 2014banking users
Sales:
15% in digital channels
Monetary transactions (except cash+direct debit)
58% in digital channels
Digital transformationThe multichannel transformation of the commercial model is one of Santander’s strategic priorities. Digital channels offer new opportunities to personalise customer relationships, facilitate greater availability and proximity and contribute to improving satisfaction and loyalty with the Bank.
Santander has four basic drivers for this transformation:
1. Incorporate digital channels in the day-to-day commercial activity, without forgetting personal attention.
2. Offer a first-class customer experience, with new and different multichannel relationship models for each segment.
3. Develop new functionalities, in order to have best-in-class digital channels, particularly in the area of mobile banking.
4. Foster a multichannel culture that involves and engages all teams in our transformation plans.
Our local units have developed specific projects for each of these drivers and all have their own Multichannel Transformation Plans.
The M programme was launched during 2015 in order to drive change. This programme has a global-local collaborative approach and is based on the best practices implemented in our local markets to incorporate multichannel services in day-to-day retail and commercial banking.
Among the major developments achieved by our local units during 2015 in our digital transformation agenda were:
• Santander UK is participating in the first group of Apple Pay issuers in the UK and has developed new apps such as Cash Kitti, a group money management app, and Spendlytics, a card expenses tracking app.
Digital initiatives
Cash Kitti Spendlytics Santander Mobile Apple Pay App Spain App Poland OthersWatch Deposit
Capture

41
Aim and value creation > Customers1. Business model and strategy
2015 ANNUAL REPORT
The new Santander branch • Barrier-free entry to the self-service area.• Multichannel zone. (a)• ATM with extended operating hours. (b)• Personalised reception.• Waiting area with digital display and queue management.• Flexible customer service desks not assigned to staff. (c)• Out-of-sight tills.• Executive rooms and meeting rooms. (d)• Specialised attention in exclusive zones.
b
• In Spain, Santander renewed its commercial website and launched a new mobile app for SMEs and companies, and Santander Watch, which allows customers to check their accounts and card transactions from smart watches.
• Brazil launched a strong plan for digital customers (“Vale a pena ser digital”) in order to inform customers of the Bank’s digital offer. A new version of the Bank’s mobile app was also launched.
• In Argentina, Global Finance magazine chose Santander Río as the country’s best digital bank for the 16th consecutive year.
• Bank Zachodni WBK’s mobile banking app is considered to be the best in Poland and the second in Europe, according to a study by the consulting firm Forrester. The Bank was also awarded the prize by Global Finance magazine as the best mobile bank and the best app in Central and Eastern Europe.
• In the United States, Santander launched its online bank for SMEs and companies, as well as Mobile Deposit Capture, which enables cheques to be easily and safely processed via a mobile phone.
• Santander Mexico carried out a project to simplify credentials, which allows access to various digital channels from a single password.
As a result of these initiatives, the number of digital customers is growing at a brisk pace: 17% since December 2014 to 16.6 million.
The Bank has an innovation area whose purpose is to research and anticipate market trends, and design businesses and solutions for customers from a global, disruptive and long-term standpoint. The Group also fosters innovation via Santander Innoventures, a corporate $100 million venture capital fund that holds minority stakes in financial sector start-ups, helping
a
d
c

42
Aim and value creation > Customers1. Business model and strategy
2015 ANNUAL REPORT
Examples of simplified processes - Customer Journeys
Brazil PortugalProcess for opening a current account Process for opening a current account
BEFORE... BEFORE...Account: D+8 TODAY...Card: D+16
D+1*.Channels: D+22Access code: D+28
The customer was asked to sign six/eight pages in the contract to open an account (paper-based process)
TODAY...Only two signatures (digital process on a
tablet)
*D+1 = 24H.
United KingdomProcess for opening a current account
BEFORE... TODAY...It took six days to The customer leaves
the branch with the complete the process for account activated opening an account
and operating from the day it is
arranged
MexicoRequesting a loan (SMEs)
BEFORE...13 days to complete the process
TODAY...Digital process:
48 hours between requesting the loan
and receiving it
them to grow and, in turn, learning about the new technologies they develop in order to use them for the Group and its customers. The Retail and Commercial Banking, and Technology and Operations divisions carry out the day-to-day digital transformation, improving the Bank’s offer and responding to business needs.
In order to drive the process of change and ensure coordination between all the involved areas of the Bank, a committee to coordinate digital transformation was created in 2015. It involves the areas of Strategy and Innovation and the divisions of Retail and Commercial Banking, Technology and Operations and the Group’s main local units. This committee reports to the Bank’s management and strategy committees.
In addition, while making progress in the digital world, we continued to work to improve customer experience in traditional channels. Branches are the key channel for maintaining and strengthening long-term relations with our customers. Our Spanish and Brazilian units launched their new Santander branch model in 2015, which responds to the current form of customer relations with technological developments to simplify processes and make them easier and intuitive, and differentiated spaces that allow the advantages of technology to be combined with the proximity of personal treatment by the Bank’s professionals. Argentina inaugurated its first
digital branch. Other countries such as Mexico and the UK will soon open their new spaces.
Operational excellenceSantander made progress in the following three key areas:
• Transform the customer experience for the main customer journeys, such as, customer onboarding (opening and activating accounts, applying for loans, etc).
• Improve customer experience and customer satisfaction.
• Create value for customers by reducing costs. The Group aims to generate €3,000 million of cost savings by 2018 through greater efficiency in technology and operations and at its corporate centre, and through the digitalisation of the commercial distribution model.
Transform customer journeysA best-in-class customer experience is essential to achieve more satisfied and loyal customers.

43
Aim and value creation > Customers1. Business model and strategy
2015 ANNUAL REPORT
Customer satisfaction% of active satisfied customers
Bank 2015 2014
Argentina 87.6% 86.8%
Brazil 71.6% 70.6%
Chile 92.6% 88.4%
Spain 87.6% 85.0%
Mexico 94.0% 95.0%
Poland 96.4% 93.5%
Portugal 93.1% 94.1%
UK 95.7% 94.5%
US 81.8% 80.8%
Uruguay 94.3% 90.0%
TOTAL 86.6% 85.3%
Source: Corporate Benchmark of Customer Experience and Satisfaction of active individual customers. (Figures at the end of 2015, corresponding to the results of surveys in the second half of the year).
In order to incorporate customers’ suggestions and improve their experience in their main processes and interactions with the Bank, Santander strives to continuously improve customer journeys.
In 2015, all countries made progress in the customer journey transformation programme, a project that involves all the Bank’s areas and entails redesigning and streamlining all its processes.
Improve customer experience and customer satisfactionSantander has several initiatives to measure and monitor customer satisfaction. Every year more than one million surveys are conducted and work continues to incorporate the voice of more customers and at more moments in their relationship with the Bank.
As a result of these initiatives, customer satisfaction improved at Group level in 2015.
In 2015, Spain, UK, Mexico, Argentina and Portugal were among the top 3 in customer satisfaction in their markets, in line with the target set for 2018
‘‘My bank works for me’’Eugenio Navarrete has been a Banco Santander customer in Chile since 1999 (17 years).
A few years ago his family had economic and health problems.
Eugenio says Santander was always by his side, supporting him as a person and not as just another number.
For Eugenio, Santander is his Bank and “My bank works for me”.
SANTANDER EXPERIENCE
Access thise and other real experiences

44
Aim and value creation > Shareholdersusiness model and strategy
2015 ANNUAL REPORT1. B
Shareholders and investorsWith more committed employees and more satisfied customers, Banco Santander can offer its shareholders an attractive and sustainable return, and maintain their loyalty in the long term.
Banco Santander has set the following strategic priorities for its shareholders:• Obtain an attractive and sustainable return.• Attain high recurring income.• Maintain prudent risk management.• Manage capital in a disciplined way.
The Bank made significant progress during 2015 in all of these aspects:
A good return was maintained:• 13% increase in underlying attributable profit.
• 11.0% ordinary RoTE and 3% improvement in the net tangible book value per share on a like-for-like basis.
Increased remuneration in cash and payment of the four usual dividends maintained:• The remuneration in cash rose from 20% to 38%
of profit, in line with the aim of maintaining a cash pay-out of between 30% and 40% of the recurring profit.
• The total shareholder remuneration out of 2015 profit was €0.20 per share. Three of these dividends have already been paid (€0.05 per share each). The fourth and final dividend is scheduled to be paid in May 2016.
Strengthened its capital position:• As a result of the organic capital generation and
the accelerated book-building process carried out in January. Three scrip dividends were also paid, two of which were charged to 2014 s earnings and one to 2015 s.
• Santander has a comfortable capital position, with a Basel III capital ratio (fully loaded CET1 ratio) of 10.05% at the end of 2015, which will enable it to take advantage of the organic growth opportunities in its core markets. The Santander regulatory capital ratio (12.55%) is 280 basis points above that required by the ECB for 2016 (9.75%).
Improved risk management:• The NPL ratio dropped by 83 b.p. to 4.36% and the
cost of credit stood at 1.25%.
• By implementing Santander Advanced Risk Management, the Bank wants to lay the foundations for having the industry’s best comprehensive risk management model.
Established the groundwork for a new commercial model which will enable organic capital growth:• This model is based on four main drivers: an
increase in loyal customers; more digital customers; enhanced customer satisfaction; and a focus on higher growth businesses such as SMEs, consumer finance and private banking.
Increased the number of shareholders:• The total number of Banco Santander
shareholders was 3.6 million from more than 100 countries at the end of 2015.
Santander’s goal is to increase its dividend per share every year
10.05%fully loaded CET1 ratio
11.0%Ordinary RoTE
Banco Santander has set the following objectives for the next three years
Obtain a cost-to-income ratio below 45%, which will mean managing assets even more efficiently.
Maintain an average cost of credit of 1.2%.
Increase profitability, raising RoTE to around 13%.
Continue to generate capital organically, in order to have a fully loaded CET1 ratio of more than 11%, which will increase the dividend and earnings per share.

45
Aim and value creation > Shareholders1. Business model and strategy
2015 ANNUAL REPORT
3.6million shareholders
38%payment of dividend
in cash
The Santander share in 2015
Share performance In an environment of volatility marked by the Greek crisis, the slowdown of the Chinese economy, lower expectations in emerging markets (particularly Brazil) and falling oil prices, total shareholder return in 2015, taking into account the change in the share price and the remuneration received (with reinvestment of the dividend) was 31% negative. In the same period, the MSCI World Banks, the main global index for banks, registered a total return that was also negative (9%).
Banco Santander was the largest bank in the euro zone by market capitalisation at the end of 2015 and the 19th in the world, with a value of €65,792 million.
Shareholder base and capitalAt the end of 2015, Banco Santander had 3.6 million shareholders in more than 100 countries.
Shareholder base and capital31 December 2015
Dec 2015 Dec 2014
Shareholders (number) 3,573,277 3,240,395
Outstanding shares (number) 14,434,492,579 12,584,414,659
Average daily trading (number of shares) 103,736,264 77,340,428
TNAV/share1
€
+3%
5.13
4.26 4.123.89 4.01
2011 2012 2013 2014 2015
1. Calculated on a like-for-like basis with prior years.
Cash dividend€/share
+79%0.23
0.160.11 0.090.08
2011 2012 2013 2014 2015
Comparative performance of the Santander shareDecember 2014 vs. December 2015
120
110 Beginning of the year High 7.169 €(31/12/14) 6.996 €
100
90
80
70
60
50Dec14 Mar15 Jun15 Sep15
SAN MSCI World Banks
Low 4.445 €Year-end (31/12/15)
4.558 €
Dec15
Distribution of share capital Geographic distribution by type of shareholder of share capital31/12/15 31/12/15
Institutional investors Board Americas Rest of world
56.3% 1.2% 17.1% 0.5%
Non-controlling interests42.5%
Europe82.4%

46
Aim and value creation > Shareholdersusiness model and strategy
2015 ANNUAL REPORT1. B
The SAN share trades as an ordinary share in Spain, via the continuous market, and in Milan, Lisbon, Buenos Aires, Mexico and Warsaw. In New York, it trades in ADR form, in Sao Pãulo BDR and in London CDI.
The Santander share in the world
USA: SAN US
Mexico: SAN* MM
Portugal: SANT PL
Spain: SAN SM Italy: SANT IM
UK: BNC LN
Brazil: BSAN33 BZ
Argentina: STD AR
Poland: SAN PW
Countries where the Santander share trades and its respective tickers
Milestones in 2015
8 January: €7,500 million capital
increase 3 February:
February: presentation of 2014 result
third interim dividend, 201427 March: general shareholders’
28 April: meeting
presentation of first quarter 2015 results May:
final dividend, 2014
30 July: presentation of second
quarter 2015 results
August: first interim dividend, 2015
23-24 September: Investor Day
29 October: presentation of third
November: quarter 2015 results
second interim dividend, 2015
s
Held in London, UK.
+350 analysts and investors attended
59 members of the Bank’s senior management gave presentations
More than 150 questions from investors and analysts were answered

47
Aim and value creation > Shareholders1. Business model and strategy
2015 ANNUAL REPORT
Commitment to shareholders via the Shareholder and Investor Relations area The Shareholder and Investor Relations area implemented initiatives in 2015 to improve transparency with shareholders and facilitate the exercise of their rights. These included:
Communications
• Communications via channels selected by the shareholders to inform them of material facts, shareholders’ meetings, dividends, performance of the share price and the Group, marketing campaigns, promotions and events.
• Quarterly shareholders’ report: print and online versions in seven countries.
• Sending of daily and weekly financial newsletters.
• Launch of communication channels with shareholders based on new technologies: a new corporate website, a new commercial website and an app for Santander shareholders and investors.
Attention
• 42,805 e-mails handled.• 241,553 telephone enquiries received.• 22,336 personal formalities.
1 2
3 5
4
Exclusive benefits
• Financial products for shareholders.• Waiver of fees.• Promotions in products and services via
the “Yo Soy Accionista” website.• Delivery of study scholarships to
disabled university students.• Participation in charity projects
worldwide.
Shareholders’ meeting
• Record participation in the meeting held in March 2015, in terms of both share capital and number of shareholders.
Quality studies
• Ongoing assessment of the various services provided. Nine out of ten shareholders would recommend the telephone and Internet helpline services.
SANTANDER EXPERIENCE
“I am a businessman who invests and manages on a long-term basis, which is why I trust in Santander”Josep Rosàs owns Masia Rosàs in Barcelona and has been a Banco Santander shareholder for more than 12 years.
He invests in Santander because of its three great strengths. First, the attractive geographic diversification of its assets. Second, its permanent focus on the shareholder which makes him feel he is a real owner of the bank. Third, Santander’s proven track record throughout its history when measuring risk, while continuing to take courageous decisions.
A bank which, for Josep, has never failed at the most difficult times.
Access this and other real experiences
48
Aim and value creation > Communities1. Business model and strategy
2015 ANNUAL REPORT
CommunitiesSantander carries out its business in a responsible and sustainable way while contributing to the economic and social progress of the communities in which it operates, and is particularly committed to fostering higher education.
Banco Santander has a business model and a corporate culture focused on creating long-term value for all its stakeholders: employees, customers, shareholders and communities.
The Bank voluntarily assumes certain ethical, social and environmental commitments which go beyond the related legal obligations, and makes a large social investment mainly via Santander Universities.
Sustainability governanceSantander has a well defined sustainability governance structure, at both corporate and local level, which facilitates the involvement of all the Bank’s business and support areas in the Group. The board is the highest governing body in sustainability matters, and is responsible for approving the sustainability strategy and policies.
The sustainability committee, chaired by the CEO and comprising the heads of divisions and/or areas, proposes the strategy and the initiatives in sustainability.
Santander has a working group, chaired by the chief compliance officer, which analyses and assesses the social, environmental and reputational risks of financing operations in sensitive sectors.
Lastly, the board risk committee is responsible for reviewing the sustainability policy ensuring that it is
focused on creating value for the Bank; monitoring the related strategy and practices, and assessing its degree of compliance.
There are also local sustainability committees in most of the Bank’s local units, chaired by the corresponding country head. This committee proposes and develops, using common corporate frameworks, the sustainability strategy and initiatives adapted to each country’s needs and features.
Corporate sustainability policiesIn December 2015, the Bank’s board approved an update to the social and environmental policy. This policy, now called the general policy of sustainability, defines Banco Santander’s main lines of action in this area and it is the reference framework in corporate social responsibility and in social and environmental risk management.
The Bank’s climate change and human rights policies were also updated and a new corporate volunteer policy drawn up.
The Group also defined sector-specific environmental policies which incorporate the criteria for analysing social and environmental risk in sensitive sectors (defence, energy and soft commodities).
Santander fosters ethical behaviour both among its employees, in accordance with the Group’s general
Santander is part of the main stock market indicesthat analyse and value companies’ actions in matters of sustainability
International initiatives in sustainability to which Banco Santander adheres
United Nations Global Compact Equator Principles
Banking Environment Initiative (BEI) Round Table on Responsible Soy
World Business Council for Sustainable Development (WBCSD)
UNEP Finance Initiative
Principles for Responsible Investment (PRI)
Working Group on Sustainable Livestock
Wolfsberg GroupCarbon Disclosure Project
For more information, see the 2015 Sustainability report

49
Aim and value creation > Communities1. Business model and strategy
2015 ANNUAL REPORT
Beneficiaries of social programmesIndividuals (thousand)
Education543
Entrepreneurship and job creation
246
Social well-being429
Environment
3
Closing ceremony of the seventh edition of the Euros from your payroll social project programme.
code of conduct, and among its suppliers, who are requested to comply with the ten principles of the Global Compact.
Santander, a bank committed to society and its environmentBanco Santander also contributes to the economic and social progress of communities through many social investment programmes in areas such as education, entrepreneurship, social well-being and culture, in a large number of which the participation of the Group’s professionals is fostered as a way to promote solidarity and pride in working for Santander.
Education Banco Santander supports education as a catalyst for developing and growing the communities and countries in which it operates, with a specific focus on higher education via Santander Universities, the Group’s hallmark of social investment.
The Bank is also firmly committed to financial literacy and children’s education, as it is conscious of the need to promote better knowledge of the basic aspects of finance for the different stages of life.
Entrepreneurship The creation of social companies, social inclusion and fostering entrepreneurial capacity are some of the Bank’s lines of action in this area.
Banco Santander has significant microcredit programmes in Brazil, Chile and El Salvador that enable the most disadvantaged groups to access loans and improve their social inclusion, standard of living and environment.
Social well-being The Bank has a wide array of programmes that aim to eradicate the social exclusion of the most vulnerable groups, foster research to improve people’s health and make life easier for the disabled.
Environment The Group conducts its activity while preserving the environment, and promoting initiatives and projects that require protection and mitigate the environmental impact. The Bank’s environmental initiatives focus on reducing consumption and emissions derived from its activity, developing financial solutions to combat climate change (leadership position in financing renewable energy projects), and integrating social and environmental risks into the process of granting loans.
Art and cultureSantander is very active in protecting, preserving and disseminating art and culture, mainly via the Banco Santander Foundation in Spain and Santander Cultural in Brazil.
1.2million beneficiaries in 20151
207 million of social investment in communities
7,125partnerships with NGOs
7,362megawatts financed in renewable energy projects
1. People who have benefited from the programmes, services and products of Banco Santander, its employees and customers which have a social and/or environmental component in the 10 core countries where the Bank operates. It does not include those who benefit from the Santander Universities Programme or from cultural programmes.

50
Aim and value creation > Communities1. Business model and strategy
2015 ANNUAL REPORT
Santander Universities
Investing in higher education is the hallmark of the Bank’s social commitment, which is organised and managed through Santander Universities.
Santander cooperates with more than 3,900 projects to improve education, such as programmes to internationalise universities, encourage mobility by academics, provide students with access to the labour market, foster an entrepreneurial culture, research and innovation, and to increase financial literacy.
The main initiatives in 2015 included the following:
• The largest scholarship programme provided by a private company. A total of 35,349 were granted in 2015. These include:
• 15,553 travel scholarships for university stu-dents, with programmes such as Becas Ibe-roamérica. Jovenes Profesores e Investigadores and the Top programmes.
• 10,865 Santander internship scholarships in SMEs to facilitate the insertion of students in the labour market. This programme is carried out in Argentina, Spain, UK, Puerto Rico and, for the first time, in Brazil, Chile and Uruguay.
• 7,536 study scholarships, with initiatives such as the Itaca-Salary Scholarships of the Auto-nomous University of Barcelona and training scholarships and aid to university entrepreneurs in Babson College.
• Entrepreneurship is another of the main lines of action, with programmes such as YUZZ jóvenes con ideas, managed by the Santander International Entrepreneur Centre which, in its sixth edition, supported and trained more than 900 young people who presented 710 business projects in 41 high performance centres throughout Spain. Also of note were the initiatives promoted by RedEmprendia such as the SOLA project (Spin-Off Lean Acceleration), as well as the Santander University prizes for Entrepreneurship in Brazil which in 2015 set a new record of entries: almost 24,000 university projects throughout the country. These awards were also held in Argentina, Chile, Spain, Portugal and UK.
• Research and innovation is supported by an annual investment of €24 million and is used to support research groups on cancer, stem cells, biomaterials, protection of endangered species, innovation and digital transformation, protection of human rights, as well as science parks and Chairs of excellence in universities.
Some of this investment goes to the Santander Universities Prizes for Innovation which are awarded in Brazil, Mexico, US and Puerto Rico; and to the University Scientific Research Prize in Chile, among others. Initiatives such as the ComFuturo Programme (CSIC) are also supported, which helps to retain talent in Spain through grants to highly qualified young scientists.
• The Universia network also helps young people to join the labour market with one million jobs created in 2015. It acted as the intermediary through its job community, which includes websites where 17.3 million job applications were registered.
Banco Santander joined the Ibero-American General Secretariat (SEGIB) in 2015 to foster mobility by students, teachers and researchers in Latin American countries via the Alliance for Latin American Academic Mobility. The aim is to boost academia, contribute to sustainable growth and reduce inequality in the region. At least 200,000 Latin American students, teachers and researchers are expected to further their studies and knowledge in other countries of the region by 2020. Santander joins this commitment through international mobility programmes.
This commitment follows the path established by the 2014 Universia Río Declaration, which set out the conclusions of the III International Meeting of Chancellors organised by Universia in Rio de Janeiro in July 2014 was attended by 1,109 university chancellors from 32 countries.
universities form part of Universia
1,401
1million jobs
intermediated
51
Aim and value creation > Communities1. Business model and strategy
2015 ANNUAL REPORT
Banco Santander is the company that invests
the most in education in the world, according to a Varkey Foundation report
in cooperation with Unesco
€160million contributed
to universities
35,349scholarships
and grants in 2015
1,229agreements with
universities and academic institutions in 21 countries
Santander Universities. Strategic priorities 2016-2018
Innovation and entrepreneurship: fostering the Internationalisation: international mobility entrepreneurial culture and university innovation will be scholarships, exchange programmes and driving key in cooperation with universities. transversal cooperation projects between the
universities of various countries.
University digitalisation: encouraging the digitalisation Employability: initiatives to help university students and modernisation of universities will be another priority access the labour market, with scholarship programmes in Santander’s commitment to education, with projects for internships in cooperation with universities. to incorporate new technologies to the teaching process, virtual campuses, and the creation of digital academic university services.
Objective: 130,000 scholarships in 2016-2018.
SANTANDER EXPERIENCE
‘‘Santander offered me the gift of getting to know other entrepreneurs who like me are eager to change the world”Miguel Ruiz Capella was one of 5,000 winners of the Santander Scholarship programme for work practice in SMEs and participated in Universia’s 2015 Jumping Talent contest.
He is currently COO and legal advisor of Rivekids Technology, an engineering company that develops child retention systems in cars.
He says the opportunities that Santander makes available to students and those who have recently graduated go well beyond simple practices. “Its firm conviction in allowing talent to prosper, without any conditions, is impressive. Always.”
Access thise and other real experiences

52
Risk management1. Business model and strategy
2015 ANNUAL REPORT
Risk managementSantander Group aims to build the future through forward-looking risk management, protecting the present via a robust control environment.
During its more than 150 years of activity, Santander has combined prudence in risk management with the use of advanced techniques that have proven to be decisive in generating recurring economic results.
Santander Group’s risk policy is focused on maintaining a medium-low and predictable risk profile. Its risk management model is a key factor for achieving the Group’s strategic objectives.
Risk governanceResponsibility for risk management and control, particularly in setting the Group’s risk apetite, lies ultimately with the board of directors, which delegates powers to the committees. The board is supported by the board risk committee, an independent risk control and supervision committee. The Group’s executive committee also devotes particular attention to managing the Group’s risks.
The following committees form the top level of risk governance.
Independent control bodies • The purpose of the board risk committee is to
assist the board in the supervision and control of risk, through defining the group’s risk policies, developing relationships with regulatory and supervisory authorities and overseeing the group’s management of regulation, compliance, sustainability and corporate governance.
• The risk control committe is in charge of the effective control of risks. It ensures that risks are managed in accordance with the risk appetite approved by the board, taking a comprehensive view, at all times, of all the risks included in the general risk framework. This involves the identification and monitoring of current and emerging risks, and their impact on the Group’s risk profile.
Pillars of the risk function
Integration of the risk culture and A risk function independent Management of all risks with a involvement of senior management of the business functions forward-looking and comprehensive in managing and taking decisions view at all levelson risks
Formulating and monitoring the Best-in-class processes and risk appetite of the Group and its infrastructuresubsidiaries

53
Risk management1. Business model and strategy
2015 ANNUAL REPORT
All the Santander team engaged in risk
“Risk pro” risk culture
ResponsibilityAll units and employees must know the risk they incur and be responsible for identifying, assessing, managing and reporting them.
ResilienceAll employees must be prudent, avoid risks they do not know or which exceed the established risk appetite, and be flexible, adapting to new environments and unforeseen scenarios.
ChallengePromote continuous debate within the Bank on how to manage risk in order to be able to anticipate future challenges.
SimplicityClear processes and decisions, easy for employees and customers to understand.
Customer focusSound risk management helps people and businesses prosper.
Decision-making bodies• T he executive risk committee is the collective
body responsible for risk management, in accordance with the powers assigned to it by the board. It is involved with all risks. It participates in making decisions on risk assumption at the highest level, ensuring that they are within the limits set in the Group’s risk appetite, and it informs the board and its committees of its activity when required.
Lines of defenceBanco Santander follows a risk management and control model based on three lines of defence.
The business or activity functions that assume or generate risk exposure constitute the first line of defence. The assumption or generation of risk in this line must be aligned with the pre-defined risk appetite and limits.
The second line consists of the risk supervision and control function and the compliance function. It ensures that risks are controlled effectively and are managed in line with the set risk appetite.
Internal audit, as the third line of defence and the last layer of control, regularly assesses that the policies, methods and procedures are adequate and tests their effective implementation.
Risk cultureHaving a solid risk culture is one of the keys that has enabled Santander Group to respond to the changes in economic cycles, customers’ new requirements and to increased competition, and to position itself as a bank in which employees, customers, shareholders and communities can trust.
This culture, called risk pro, is aligned with the general principles of Simple, Personal and Fair, and is the series of behaviours that each employee must develop to proactively manage the risks that arise from daily activity.
Cost of credit
NPL ratio
1.25%
4.36%

54
Risk management1. Business model and strategy
2015 ANNUAL REPORT
Santander Group’s risk profile
The risks that Santander faces as a result of its activity are: credit, market, liquidity, structural and capital, operational, conduct, compliance and legal, model, reputational and strategic. We set out below a brief description of the main risks and their evolution in 2015.
Definition Risk profile Evolution in 2015
Credit This risk comes from the • More than 80% of Santander Group’s • Customer credit risk increased 6% to
risk possibility of losses derived from total or partial failure to
credit risk comes from retail and commercial banking activities.
€850,909 million.
perform the financial obligations • The trend toward reducing the cost contracted with the Group by its • High degree of geographic of credit, which stood at 1.25%, and customers or counterparties. diversification of risks. loan-loss provisions continued.
See pages 199-229 of Banco Santander’s
Annual Report
Other credit risk standpoints:
• Credit risk from activity in the
• Limited concentrations in customers, business groups, sectors, products and countries.
• The NPL ratio reduced to 4.36% and the coverage ratio increased to 73%.
financial markets.
• Concentration risk.
risk. • Country
• The exposure to Spain’s sovereign risk is maintained at adequate levels from the regulatory and management standpoint.
• The net exposure to run-off real estate risk in Spain reduced by €1,017 million to €6,303 million.
• In Brazil (8% of the Group s loan • Sovereign risk and that with the
rest of public administrations.• Very limited cross-border risk
exposure, in line with the model of portfolio) the NPL ratio remains below the average of private banks.
risk. • Environmentalautonomous subsidiaries in terms of capital and liquidity.
• High credit quality of the Group’s assets.
Liquidity and funding
risk
Liquidity risk is that incurred from potential losses that could arise as a result of a bank’s inability to obtain funding in the
• Liquidity management and funding is a basic element of the business strategy.
• The funding and liquidity model
• Early compliance with regulatory ratios, with a liquidity coverage ratio (LCR) of 146% at the end of the year.
market and/or from the higher is decentralised and based on • Net loan-to deposit ratio in the financial cost of accessing new autonomous subsidiaries that are Group at very comfortable levels sources of funding. responsible for covering their own (116%).
liquidity needs.See pages 250-260 Management of this risk aims • High medium and long-term
of Banco Santander’s to ensure the availability of the • The needs derived from medium and capturing of wholesale funds (issues Annual Report funds needed in adequate time long-term activity must be funded by and securitisations): €56,609 million
and cost to meet obligations and medium and long-term instruments. via 18 issues in 15 countries and 14 develop operations.
• High participation of customer deposits, currencies.
as a result of an essentially retail and • High liquidity reserve, strengthened commercial banking balance sheet. in quantity (€257,740 million) and
• Diversification of wholesale funding sources by: instruments/investors,
quality (52% of the total are high quality liquid assets) over 2014.
markets/currencies, and maturities.
• Limited recourse to short-term wholesale funding.
• Availability of a sufficient liquidity reserve, which includes the discounting capacity in central banks to be used in adverse situations.

55
Risk management1. Business model and strategy
2015 ANNUAL REPORT
Definition Risk profile Evolution in 2015
Market risk
Market risk covers those financial activities where equity risk is assumed as a result of a
• Santander maintains a moderate exposure to market risk.
• The VaR of trading activity in markets fluctuated in 2015 between €10 million and €31 million.
See pages 230-249 of Banco Santander’s
Annual Report
change in market factors. This rise stems from changes in interest rates, the inflation rate, exchange rates, equities, credit spreads, commodity prices and volatility in each of these factors, as well as the liquidity risk of the various products and markets in which the Group
• Diversification in terms of both risk factors and geographic distribution.
• Trading activity centred on customer business.
• The average VaR in trading activity remained in a low range, in line with previous years.
• The main fluctuations were due to changes in the exposure to exchange rates and interest rates, as well as market volatility.
operates.• Limited exposure to complex
structured assets.
Operational risk
The risk of losses resulting from defects or failures in internal processes, human resources
• Santander expressly assumes that although certain volumes of expected operational losses can occur, severe
• Improvement in the operational risk management and control model in its evolution toward advanced
or systems, or from external unexpected losses are not acceptable standards (Advanced Operational circumstances. In general, and as a result of failures in controls on Risk Management programme).unlike other types of risk, it activities.
See pages 261-269 of Banco Santander’s
Annual Report
is not a risk associated with products or businesses. It is found in processes and/or assets and is internally generated
• In operational risk control and management, the Group focuses on identifying, measuring/assessing,
• Launch of the project to install a new common application (Heracles) for operational risk functions in general and compliance risks, and
(people, systems, processes) or monitoring, controlling, mitigating and documentation of the internal as a result of external risks, such reporting this risk. control model.as natural disasters.
• Organisational model of control and • Encouragement for operational management based on three lines risk training and culture throughout of defence and on an evolution to the Group.advanced management standards (AORM programme to be completed • Promotion of key initiatives for in 2016). mitigating risk: control of suppliers,
information security and cyber risk.• Risk profile aligned with the business
model and geographic presence. No significant events in particular at the Bank.
Compliance nd conduct risk
Compliance risk embraces control and management of the following risks:
• In formulating its risk appetite in relation to compliance, the Group includes a statement that it does not have any
• With regard to regulatory compliance, 2015 saw an increase in new and complex relations, with a high impact:
appetite for this type of risk and that it Volcker, Market Abuse, MiFID II, • Regulatory compliance risk: has the clear objective of minimising the EMIR, Corporate Defence, etc.
understood as that due to occurrence of any economic, regulatory
See pages 270-276 failure to meet the legal framework, internal rules
or reputational impact on the Group. • In the field of governance of products and consumer protection, 2015
of Banco Santander’s Annual Report
or the requirements of regulators and supervisors.
• To this end, the compliance function promotes Santander Group’s adherence
witnessed the addition of a new scope for defining conduct, beyond
to rules, supervisory requirements, the the traditional definition, and new • Product and consumer principles and values of good conduct, implications of the stress test in this
protection risk: understood acting as a second line of defence, area, as well as regulatory pressure in as that caused by inadequate through setting standards, debating, matters of consumer protection.practices in the dealings advising and reporting, in the interest of between the Bank and its employees, customers, shareholders and • In the prevention of money customers, the treatment and society in general. laundering and terrorist financing, products offered to them and supervisory pressure with global whether they are sufficiently regulations was stepped up in 2015, tailored to each particular and there was an increase in the customer. impact of the sanctions regime.
• Reputational risk: understood • In reputational risk, 2015 saw the as that derived from damage development of a new model with the in the eyes of public opinion, aim of defining the scope, management customers, investors or any and control of this risk, as well as other stakeholder in the an update to policies to attain the perception of the Bank. highest standards, in accordance with
stakeholders’ expectations.
a


w22015 results
58 Economic, banking and regulatory environment
Group results Santander 62 65 Countries 73 Global Corporate Banking
Santander maintained
a high level of revenues and a strong generation of capital, while advancing its commercial transformation.

58
Economic, banking and regulatory environment2. Results
2015 ANNUAL REPORT
Economic, banking and regulatory environmentSantander developed its activity in 2015 in an environment of uneven growth across the countries in which it operates and increasing regulatory pressure.
International economic environment The global economy slowed in 2015 (3.1% vs. 3.4% in 2014). The upswing in developed economies could not offset the downturn in emerging economies. The fall in commodity prices and the slowdown of the Chinese economy had a bigger relative impact on emerging economies, although the degree of slowdown varied according to each market’s domestic situation.
• The US is in a phase of moderate but solid growth. GDP grew 2.5% in 2015 and the unemployment rate continued to fall to levels regarded as full employment (5%). Inflation came down as a result of the fall in oil prices, although the underlying rate (1.3%) remained below the target (2%). The Federal Reserve raised its interest rates in December 2015 to 0.25-0.5%.
• The United Kingdom maintained the robust pace of growth (2.2%) of the last few years, accompanied by a decline in the jobless rate close to pre-crisis levels. Inflation was around
0% without signs of salary tensions. The Bank of England held its rate at 0.5%.
• The euro zone economy accelerated. Inflation continued to be close to 0%, which led the European Central Bank to further cut its rates and launch new quantitative easing measures, with an increased programme of purchasing public sector securities.
• Spain grew by around 3.2% with a well diversified base that lowered the unemployment rate to 21% at the end of 2015. The budget deficit continued to decline and the current account remained in surplus. Inflation was negative for most of the year due to the impact of lower oil prices, although the underlying rate remained positive.
• Germany expanded at a faster pace as the year progressed. Domestic demand remained strong and unemployment low.
GDP% c
10.0
hange
GlobalDeveloped economies
8.0 Emerging economies
6.0
4.0
2.0
0.0
-2.0
-4.0
1990 1993 1996 1999 2002 2005 2008 2011 2014 2017 2020
Source: IMF, World Economic Outlook.
The global economy slowed in 2015, with an upturn in developed economies and a slowdown in emerging markets

2015 GDP% annual change
UNITED KINGDOM
UNITED STATES
POLAND
MEXICOGERMANY
<0%PORTUGAL
0% - 1%SPAIN
1% - 2%BRAZIL
2% - 3%
+3% CHILE ARGENTINA
Source: IMF.
59
Economic, banking and regulatory environment2. Results
2015 ANNUAL REPORT
» US consolidated growth, the Fed raised interest rates
» UK maintained solid growth without inflationary pressures
» Euro zone growth accelerated but remained moderate. Spain grew faster than the European average
» Uneven growth in Latin America
• Poland grew briskly (3.6%) and inflation (-0.9%) was well below the the target (2.5%) of the National Bank of Poland, which cut interest rates to 1.5% in March.
• Latin America’s GDP shrank 0.4% after growing 1.2% in 2014, in a complex international environment with the prospect of a rise in US interest rates, the slowdown in international trade and lower growth in China. The evolution of countries varied between recession in some countries and a gradual recovery in others. Inflation increased slightly, mainly due to the impact of the depreciation of Latin American currencies.
• Brazil entered recession, with consumption and private investment falling and the unemployment rate higher. The cut in subsidies and the increase in prices for public services pushed up inflation to 10.7%. The central bank reinforced its commitment to control inflation and raised the Selic rate by 250 b.p. to 14.25%.
• The Chilean economy recovered in 2015, spurred by increased investment and private consumption, which led the central bank to begin to normalise its monetary policy and raise its benchmark rate by 50 b.p. to 3.5%.
• Mexico improved in the second half of the year, fuelled by stronger domestic demand and exports. Although inflation remained low, the central bank decided to raise its key rate in response to the Fed’s move, in order to anticipate possible bouts of volatility given the strong trade and financial links with the US.
Financial markets and exchange rates The performance of the markets in 2015 can be divided into two parts. Stock market indices rose in the first half of the year and risk premiums on sovereign and private debt fell significantly, particularly in developed economies. Access to capital markets was more fluid and lending conditions in developed economies eased.
This performance was supported by central banks’ monetary policies, which injected plenty of liquidity, and thus made investors’ search for profitability easier. The European Central Bank’s quantitative easing contained any contagion effect during the worst moments of Greece’s bailout negotiations.

60
Economic, banking and regulatory environment2. Results
2015 ANNUAL REPORT
MSCI World Banks index
-9% total return in 2015
€/$ 1.09
-10% in 2015
Brent crude oil $37 a barrel
-35% in 2015
The summer saw an episode of increased volatility in the markets linked to concern over the slowdown in the Chinese economy and in emerging markets. Although the beginning of monetary policy normalisation in the US was put back to December, share prices took a tumble, which eroded a significant part of the year’s cumulative gains. The main stock markets, however, rallied slightly in the last part of the year.
Exchange rates fluctuated considerably during 2015. The dollar appreciated significantly against the euro and the main Latin American currencies, reaching a 12-year high in effective terms. Emerging market currencies were affected by the ongoing slide in commodity prices, as well as the outflows of capital into developed economies.
Banking sector environment The banking environment of the countries where Santander operates continued to feel the impact of regulatory changes and a challenging economic situation, which posed a major management challenge for increasing profitability.
In developed countries, banks continued to bolster their balance sheets and their capital levels. The return on capital improved. According to the European Banking Authority, the profitability of european banks increased from 0% on average at the end of 2014 to 7.3% in mid-2015, thanks to the improvement in net interest income and reduced needs for provisions.
Even so, banks continued to face important challenges to spur profitability. Interest rates remained at extraordinarily low levels; business volumes, despite gradually recovering, were still low; and competition was much tougher in most markets.
Competition was high among banks as well as with new players. Shadow banking continued to gain weight and non-banking financial institutions, which are focusing on niches in sectors such as means of payment, financial advice and credit, carried on growing.
In this context, the restructuring process cannot be considered over. Most banks are embarking on changes to their culture, in order to regain the confidence of society and, in general, all need to adapt to the digital revolution, which is going to mark the way that banks relate to their customers, the level of services provided and the efficiency of processes.
International banks are also facing divergent socio-demographic changes, against a backdrop of ageing in developed economies and a sharp rise in middle classes in emerging economies, which will require differentiated strategies for each market.
Supervisory and regulatory contextThe regulatory agenda remained intense in 2015. While progress was made in reviewing the prudential framework and developing crisis management plans, attention increased on issues related to consumer and investor protection. All of these areas will be addressed while at the same time driving economic growth.
With regard to capital, the Basel Committee is reviewing its initial proposals for the standard calculation of capital consumption derived from credit, market and operational risks, scheduled to be completed in 2016. The objective is to ensure simplicity, comparability and sensitivity to risk, while not involving an increase in capital for all players. In 2016, the Basel Committee will also present the final proposal on the regulatory treatment of interest rates in the banking book, and will review the treatment of sovereign debt in the prudential framework. The committee will also review the prudential framework in its entirety, in order to assess the impact of the package of regulatory reforms.
In 2015, the Financial Stability Board finalised the framework needed to address the “too big to fail” issue in the banking industry. The last piece —the Total Loss Absorbing Capacity (TLAC) that will be required of global systemically important banks— was finalised in November.
In developed countries,financial institutions continued to strengthen theirbalance sheets and increase their capital levels in 2015

61
2015 ANNUAL REPORT
Economic, banking and regulatory environment2. Results
Milestones of the construction of European Banking Union
November 2014 Third quarter of 2015 January 2016The European resolution authority The European Central The ECB establishes the minimum fully assumes its functions and Bank takes on the single capital requirements for 2016 as the bail-in comes into force as supervision of banks the conclusion of the Supervisory the resolution tool for banks.in the euro zone. Review Evaluation Process (SREP).
January 2015 December 2015The Bank Recovery and Resolution The European Commission presents its Directive (BRRD) comes into effect. single deposit guarantee fund proposal.
Europe continued to progress in implementing the crisis management framework. The Single Resolution Board (SRB) was scheduled to be fully operational as of 1 January 2016. The SRB will set this year the Minimum Requirement for own funds and Eligible Liabilities (MREL) for banks.
In order to finalise the establishment of a Banking Union, the European Commission published in November its proposal for the creation of a single deposit guarantee fund, with a gradual framework until 2024. The European Banking Authority (EBA) meanwhile continued to publish standards and guidelines that help to guarantee harmonised implementation in the European Union of the minimum capital requirements and improve the level playing field.
2015 marked a turning point in the European regulatory agenda. The European Commission stated that, after making progress in forging a more robust and solid financial system, its priority now was to finance growth and support the creation of a capital markets union, analyse the evidence for assessing the impact of regulations and conduct a consultation on the impact of the CRD IV capital requirements directive on financing the economy.
In relation to retail financial services, the European Commission presented a green paper for consultation with the aim of increasing transparency in pricing and eliminating trade barriers inside Europe. It backs digitalisation in particular as a means for achieving this. The Commission also unveiled its Digital Agenda initiative in order to address the launch of the single digital market. In 2016, certain complementary regulatory initiatives are planned, such as the cyber security and data protection directives.
Banking supervision via the Single Supervisory Mechanism (SSM)Since its launch in November 2014, the SSM has enabled the European Central Bank (ECB) to assume comprehensive supervision of banks in the euro zone. In 2015, the SSM consolidated its functioning and the 129 most important banks came under the ECB’s direct supervision.
Each bank has a joint supervisory team formed by ECB staff and those who work for the national authorities of member states. The Joint Supervisory Team for Banco Santander worked intensely and held more than 100 meetings in 2015 with the Bank.
At the end of 2015, the ECB sent to each bank its decision, establishing the prudential minimum capital requirements for the following year. In 2016, at consolidated level, Santander Group must maintain a minimum CET1 phase-in capital ratio of 9.75% (9.5% is required by Pillar 1, Pillar 2 and the capital conservation buffer and 0.25% is the requirement for being a global systemically important financial institution).
The Joint Supervisory Team for Banco Santander
Comprising staff from the European Central Bank as well as the Bank of Spain, the Bank of Portugal, the Bank of Italy, the Bundesbank, BaFin and the French Prudential Supervisory Authority, among other national authorities.

2015 ANNUAL REPORT
Santander Group results2. Results
62
Santander Group key data
Balance sheet (million euros) 2015 2014 % 2015/2014 2013
Total assets 1,340,260 1,266,296 5.8 1,134,128
Net customer loans 790,848 734,711 7.6 684,690
Customer deposits 683,122 647,628 5.5 607,836
Managed and marketed customer funds 1,075,565 1,023,437 5.1 946,210
Shareholders’ equity 88,040 80,806 9.0 70,327
Total managed and marketed funds 1,506,520 1,428,083 5.5 1,270,042
Underlying income statement1 (million euros) 2015 2014 % 2015/2014 2013
Net interest income 32,189 29,548 8.9 28,419
Gross income 45,272 42,612 6.2 41,920
Pre-provision profit (net operating income) 23,702 22,574 5.0 21,762
Profit before taxes 10,939 9,720 12.5 7,362
Attributable profit to the Group 6,566 5,816 12.9 4,175
Underlying EPS, profitability and efficiency1 (%) 2015 2014 % 2015/2014 2013
EPS2 (euro) 0.45 0.48 (7.0) 0.39
RoE3 7.2 7.0 5.8
RoTE3 11.0 11.0 9.6
RoA 0.6 0.6 0.4
RoRWA4 1.3 1.3 –
Efficiency ratio (with amortisations) 47.6 47.0 48.1
Solvency and NPL ratios (%) 2015 2014 % 2015/2014 2013
CET1 fully loaded3 4 10.05 9.65 –CET1 phase-in3 4 12.55 12.23 –NPL ratio 4.36 5.19 5.61Coverage ratio 73.1 67.2 64.9
Market capitalisation and shares 2015 2014 % 2015/2014 2013
Shares (million) 14,434 12,584 14.7 11,333Share price (euros) 4.558 6.996 (34.8) 6.506Market capitalisation (EUR million) 65,792 88,041 (25,3) 73,735Book value (euro) 6.12 6.42 6.21Price/Book value (x) 0.75 1.09 1.05P/E ratio (x) 10.23 14.59 16.89
Other data 2015 2014 % 2015/2014 2013
Number of shareholders 3,573,277 3,240,395 10.3 3,299,026Number of employees 193,863 185,405 4.6 186,540Number of branches 13,030 12,951 0.6 13,781
Information on total profit5 (million euros) 2015 2014 % 2015/2014 2013
Attributable profit to the group 5,966 5,816 2.6 4,175
EPS (euro)2 0.40 0.48 (15.9) 0.39
RoE3 6.6 7.0 5.8
RoTE3 10.0 11.0 9.6
RoA 0.5 0.6 0.4
RoRWA4 1.2 1.3 –
P/E ratio 11.3 14.6 16.9
Variations w/o exchange rate: Quarterly: net interest income: +8.0%; Gross income: +5.6%; Pre-provision profit: +4.4%; Attributable profit: +9,4%. 1. Excluding non-recurring capital gains and provisions (2015: -€600 million). 2. EPS: Attributable profit including the AT1 cost recorded in shareholders’ equity/average number of shares for the period excluding treasury shares. 3. In 2014, pro-forma taking into account the January 2015 capital increase. 4. Due to applying the new CRD IV directive, the 2013 figure is not included because it is not homogeneous with the other figures. 5. Including net capital gains and provisions.
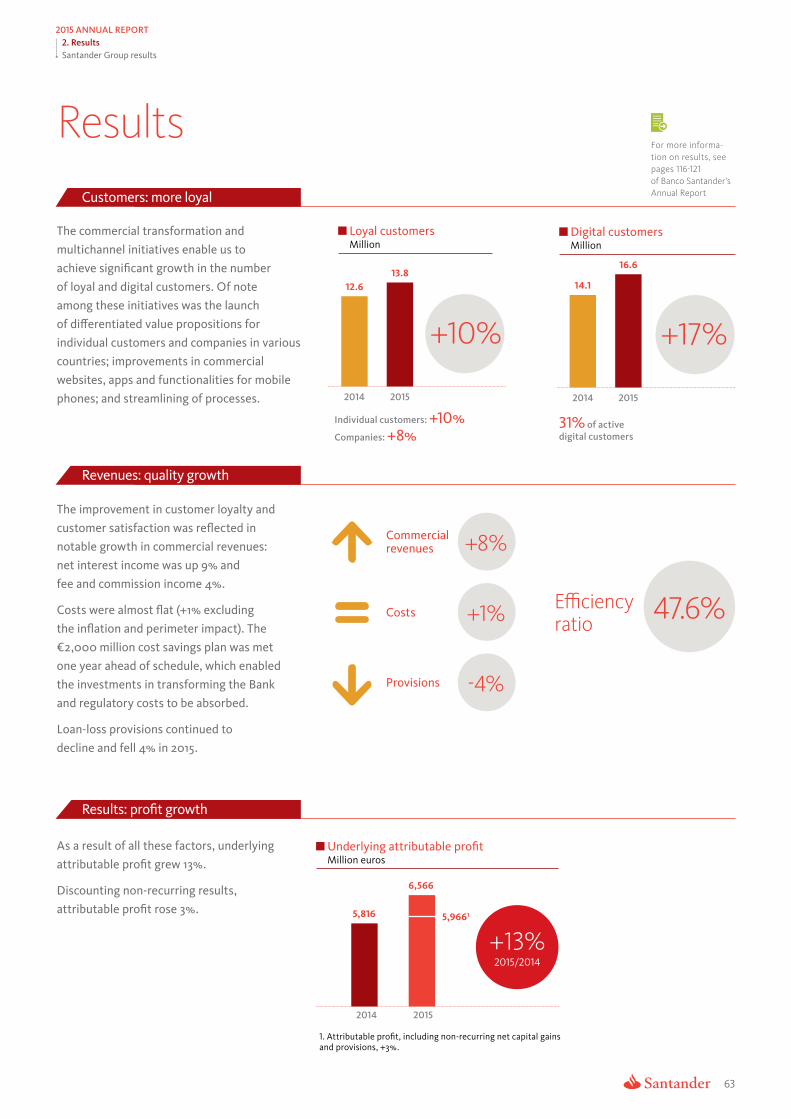
2015 ANNUAL REPORT
Santander Group results2. Results
63
ResultsFor more informa-tion on results, see pages 116-121 of Banco Santander’s Annual ReportCustomers: more loyal
The commercial transformation and multichannel initiatives enable us to achieve significant growth in the number of loyal and digital customers. Of note among these initiatives was the launch of differentiated value propositions for individual customers and companies in various countries; improvements in commercial websites, apps and functionalities for mobile phones; and streamlining of processes.
Loyal customers Digital customersMillion Million
16.613.8
12.6 14.1
+10% +17%
2014 2015 2014 2015
Individual customers: +10% 31% of active Companies: +8% digital customers
Revenues: quality growth
The improvement in customer loyalty and customer satisfaction was reflected in notable growth in commercial revenues: net interest income was up 9% and fee and commission income 4%.
Costs were almost flat (+1% excluding the inflation and perimeter impact). The €2,000 million cost savings plan was met one year ahead of schedule, which enabled the investments in transforming the Bank and regulatory costs to be absorbed.
Loan-loss provisions continued to decline and fell 4% in 2015.
Commercial revenues
Costs
Provisions
+8%
+1%
-4%
Efficiency ratio 47.6%
Results: profit growth
As a result of all these factors, underlying attributable profit grew 13%.
Discounting non-recurring results, attributable profit rose 3%.
Underlying attributable profitMillion euros
6,566
5,96615,816
2014
1. Attributable profiand provisions, +3%.
+13%2015/2014
2015
t, including non-recurring net capital gains

64
2015 ANNUAL REPORT
Santander Group results2. Results
Balance sheetFor more information on ba-lance sheet, see pages 122 to 128 of Banco Santander’s Annual Report
Commercial activity: robust growth
Santander continued to help its customers prosper, as reflected by the growth in loans to individual customers and companies in most countries.
The increased activity pushed up the volume of customer funds managed, spurred by more current accounts and investment funds.
Loans1 Customer funds1
+7%
+6% +6%
+5%
20152014 2015 2014
1. Without repos. 1. Without repos.
Credit quality: further improvement
Enhanced credit quality, with a decline in the NPL ratio in almost all countries and higher coverage. The cost of credit, calculated as loan-loss provisions over the last 12 months/average lending, declined in nine of the Group’s ten core units.
NPL and coverage ratios %
Coverage ratio 73
65
NPL ratio
67 Cost of credit +1.25%
(-18 b.p.)
5.61 5.19 4.36
2013 2014 2015
Capital: 10% goal met
The growth in the Bank’s revenues and profitability fuelled strong organic generation of capital, bringing the fully loaded CET1 ratio to 10.05%, meeting the goal set at the start of the year and compatible with an increase in the shareholder return.
Fully loaded CET1 ratio%
CET1 +0.50 10.15 -0.10 10.05 phase- 12.55%
9.65 in
Surplus of 280 b.p.
CET1 2015 Non- CET1 over the capital D´141 generation recurring net D´15 ratio required by
gains/losses the ECB for 2016
1. Pro-forma, incorporating the January 2015 capital increase.

65
Countries2. Results
2015 ANNUAL REPORT
Results by countries and businesses
SpainSantander Spain operates in retail, commercial and wholesale banking and has market shares of 13.2% in loans and 14.2% in savings.
Employees
24,216Customers (million)
12.7Loans1 2
155,204 (-3%)Attributable profit1
977 (+18%) 1. Million euros. 2. Change without repos.
New Santander branch model in Madrid, Spain.
In 2015, Santander Spain made significant pro-gress in its new strategy which, based on the Simple, Personal and Fair culture, rests on five pillars:
- Building long-term relations with customers. To this end, the 1/2/3 accounts for individual customers and SMEs were launched. This strate-gy proposes a new concept of relationship that rewards loyalty for transactions and enhances customers’ relationship with the Bank. The 1|2|3 account had more than 860,000 customers at the end of 2015 and captured 237,000 payroll accounts. The 1|2|3 SME account, which offers cashback on salaries deposited at the Bank and payment of social security contributions, taxes and supplies related to business activity, was opened by more than 50,000 small and me-dium-sized firms.
- Be the bank of choice for companies in Spain. The commercial team specialised in the seg-ment for SMEs and businesses was strengthe-ned. New lending to companies grew 18% and the Bank consolidated its leadership in global corporate banking.
- Achieve excellence in service quality. The operational excellence plan aims to increase customer satisfaction through digital transfor-mation, reviewing the processes and improving
the customer experience in all channels. San-tander Spain also began to implement a new branch model in 2015 which, with an innovative and functional design, integrates digital techno-logy into the branch.
- Develop advanced risk management throu-gh comprehensive management. The new 1|2|3 strategy facilitates greater knowledge of customers for risk analysis and the possi-bility of increasing the customer vision from the risk area. The NPL ratio was reduced in 2015 to 6.53%.
- Maintain a sustainable level of profitability, based on stable results and a more efficient capi-tal model.
Corporate governance of this Group unit was also strengthened in 2015 with the creation of the Santander Spain board, equating its gover-nance structure to the subsidiary model of the Group’s other local units. This board will over-see the actions of Santander Spain in policies and strategies, risk-taking, human resources and senior management appointments.
Main 2016 objectives
• Reach 2 million 1|2|3 accounts.
• Increase the market share of SMEs from 20% to 22%1.
• Cost of credit below 0.60%.
1. As main bank.

66
Countries2. Results
2015 ANNUAL REPORT
PolandBank Zachodni WBK is one of the largest and most modern Polish banks and the leader in digital banking.
Bank Zachodni WBK branch in Poland.
2015 highlights Bank Zachodni WBK aims to maintain a leading position in banking for individual customers and become the best bank for businesses in Poland, through a range of modern products for SMEs, helping customers to internationalise (specifically in the food, agriculture and automotive sectors) and provide comprehensive services for the largest financial projects in Poland.
BZ WBK is Poland’s leader in mobile and online banking and cards.
- The BZWBK app for mobile phones (666,000 users) is one of the best in Europe, having won several local and international prizes (for example, the 2015 World’s Best Digital Bank Awards from Global Finance magazine and first place in the Polish Newsweek ranking).
- 2 million customers use electronic banking services. 6.72 million transactions were made in 2015.
- Card sales amounted to PLN 1.2 million at the end of the year and included 903,700 prepaid cards, 736,800 credit cards and 3.22 million debit cards.
- The bank also launched innovative card payments using HCE technology. The cloud card is available via the BZ WBK24 mobile application for Android (NFC) phone users.
Lending in 2015 increased by 11%, driven by strategic segments such as mortgages, direct credit, SMEs and corporates.
Euromoney magazine named Bank Zachodni WBK the Best Bank in Poland in 2015.
Employees
11,474Customers (Million)
4.3 Loans1 2
18,977 (+11%)Attributable profit1
300 (-15%) 1. Million euros, change in local
currency. 2. Change without repos.
PortugalSantander Totta is the bank in Portugal that grew the most in lending to companies and is the leader in terms of attributable profit generated in the country.
Santander Totta branch in Portugal.
2015 highlights The Bank’s strategy focused on managing lending rates, increasing market shares, particularly in companies, controlling NPLs and enhancing efficiency. From its position of strength and profitability, Santander Totta was able to benefit from the improvement in the economic cycle and so keep on helping people and businesses prosper.
At the end of the year, the Bank announced its acquistion of Banco Banif, which added
2.5 percentage points to its market share and turned it into the country’s second largest private sector bank.
Santander Totta increased its market share in lending to companies to 9.7% in 2015 (+1 p.p.) and its share of new loans was 15.3%, up from 11.7% in 2014. This performance was in contrast to the sector’s shrinkage in this business segment.
Of note in banking for individual customers was the launch of the 1|2|3 World. Since its
launch in March, the number of 1|2|3 accounts has risen to 110,000. In mortgages, Santander Totta grew at a much faster pace than the sector average, gaining 3.2 p.p. in market share of new lending to 17.9%. Deposits amounted to €29,000 million (including Banif), 21% more than in 2014.
In 2015, Santander Totta was named Best Bank in Portugal by Euromoney and Global Finance, and Bank of the Year by The Banker.
Employees
6,568Customers (Million)
3.8Loans1 2
28,221 (+26%)Attributable profit1
300 (+63%) 1. Million euros.2. Change without repos.

67
Countries2. Results
2015 ANNUAL REPORT
Santander Consumer Finance With a strong position of leadership in Europe’s consumer finance market, SCF specialises in auto finance, loans to buy durable goods, personal loans and credit cards.
Employees
14,533Customers (Million)
16.8Loans1 2
73,709 (+21%)Attributable profit1
938 (+18.0%) 1. Million euros. 2. Change without repos.
Santander Consumer Finance branch in Benelux.
SCF is among the top three consumer finance The NPL ratio (3.42%) and coverage (109%) providers in the main markets in which it operates. were clearly better than the consumer business Its geographic diversification is well balanced standards.between countries in north and south Europe.
Of note, by unit, was Germany whose profit was It operates through 130,000 associated points- €393 million, the Nordic countries (€234 million) of-sale (car dealers and shops), and has a large and Spain (€169 million).number of finance agreements with car and motorcycle manufacturers, as well as major The agreements coming into effect in 2015 retail distribution groups. strengthen SCF’s position in its markets:
In an environment of fledgling consumer More than 60% of the agreement with Banque recovery and car sales (+9% in the footprint), PSA was completed in 2015, enabling SCF to SCF continued to gain market share backed consolidate its leadership in auto finance.by a business model based on: geographic and product diversification with leadership The integration of GE Nordics countries positions and critical mass in key markets; increased the weight of direct loans in the higher efficiency than that of its competitors; product mix, reinforcing profitable and strong analytical capabilities; and management diversified growth in the region. Nordics, which of risks and recoveries that enables it to operates in economies with the highest credit maintain high credit quality. ratings, is one of SCF’s key units.
The trend in profits (+18%) reflects revenue Growth in new lending in the main countries: growth (+23%) higher than the rise in costs Germany, Nordic countries and Spain.(+21%) and loan-loss provisions that were 1% lower. The cost of credit was 0.77%. SCF shows a consistent profitability and set a new profit record in 2015 (€938 million).
Main 2016 objectives
• Reach 17 million active customers.
• Increase lending from €77,000 million to €87,000 million.
• Maintain a cost-to-income ratio of 45% despite the integration of PSA.

68
Countries2. Results
2015 ANNUAL REPORT
United Kingdom Santander UK aims to deepen customer relationships and continue to improve its service proposition, achieving consistent and growing profitability and a strong balance sheet.
Employees
25,866Customers (Million)
26.0Loans1 2
282,673 (+5%)Attributable profit1
1,971 (+14%) 1. Million euros, change in local
currency. 2. Change without repos.
Santander UK headquarters in London.
Santander UK wants to grow customer loyalty Customer satisfaction scores improved and market share, deliver operational and significantly in 2015 to 62.9%, according to the digital excellence, and achieve consistent, Financial Research Survey (FRS). The top three growing profitability and a strong balance sheet. bank peers have an average of 62%.The Bank continues to deliver a culture that is Simple, Personal and Fair, while supporting Santander UK increased net interest income the communities in which it operates. by 5% in local currency, driven by liability
margin improvement and increased retail and 2015 highlights corporate lending. Banking NIM remained
1I2I3 customers increased by one million to 4.6 broadly flat at 1.83% versus 2014.million in 2015. Retail banking current account balances increased by an average of £1 billion These results were achieved while maintaining per month in the same period, ending the year a strong balance sheet and capital position, at £53.2 billion. as well as increased profitability. 2015 RoTE
increased to 11.8%. Santander UK continued to support the UK housing market. Gross mortgage lending amounted to £26.5 billion, of which £4.5 billion related to first time home buyers. Net mortgage lending was £2.7 billion.
Santander UK continued to support UK companies utilising a broader product suite and expanded footprint. Customer loans increased 10% to £26.4 billion, despite market weakness. New facilities increased 14% and bank account openings grew 4%.
Main 2016 objectives
• Increase digital customers from 3.7 million to 4.3 million.
• Credit growth to companies 5 p.p. higher than the market.
• CAGR of fee and commission income 5-10%.

69
Countries2. Results
2015 ANNUAL REPORT
Brazil Santander Brazil is the third largest private sector bank by assets. In a difficult economic context the Bank improved its franchise and results.
Employees
49,520Customers (Million)
32.4Loans1 2
60,238 (+9%)Attributable profit1
1,631 (+33%) 1. Million euros, change in local
currency. 2. Change without repos.
Santander Select branch in Sao Paulo, Brazil.
2015 highlights Santander Brazil is increasing its customer Santander Brazil made progress in its main base, seeking to gain customers’ loyalty strategic lines to simplify, modernise and through better levels of service. The improve the customer experience, installing Bank made significant investments such as a business model that places the customer at the acquisition of Súper, a digital platform the centre of all decisions and operations. that provides an electronic banking
account, a prepayment card and access Pacote Boas Vindas, which enables new to simplified financial services. It also individual customers to obtain the number entered into a joint venture with Banco of their current account, debit and credit Bonsucesso to create Banco Bonsucesso cards and full access to electronic channels Consignado. Furthermore, it created Certo, quickly and efficiently in two days from the a new commercial banking and customer time of signing off, was launched; and the relationship management model.offer of Contas Combinadas, which includes two types of service options, was renewed: As part of the Group’s digital transformation the Conta Básica, for those who carry out process, Santander Brazil fostered the use of fewer operations with their account and digital channels among its customers through require tailored services and the Conta Mais, the Vale a pena ser digital campaign. The for customers who use their account more number of digital customers rose 15% in 2015. frequently.
All these investments had a direct impact on The Bank launched Santander Negócios & customer satisfaction and on reducing the Empresas for SMEs. This platform is focused number of claims (-39%).on products, services and attention for these companies, adapted to the profile of each The Bank increased the number of loyal entrepreneur. In Global Corporate Banking, customers in 2015 to 3.2 million, grew lending the Bank took part in the main business (9%), rationalised costs and reduced loan-loss transactions that took place in the year. provisions and NPLs according to local criteria.
Main 2016 objectives
• Increase the number of loyal customers from 3.2 million to 3.6 million.
• Maintain control of bad loans with a NPL ratio below the sector’s average.
• Profits higher than those in 2015 in local currency terms.

70
Countries2. Results
2015 ANNUAL REPORT
Mexico Santander consolidated its position as the country’s third largest bank by business volume with a 14% market share and a sound and diversified portfolio.
Employees
17,847Customers (Million)
12.4Loans1 2
30,158 (+19%)Attributable profit1
629 (+3%) 1. Million euros, change in local
currency. 2. Change without repos.
Santander Select branch in Mexico.
2015 highlights bank in 2015 in loans for SMEs (+22%). Loans Santander Mexico wants to be the leader in to companies grew 25%, also higher than the the Mexican market in terms of profitability market. Mortgages rose 13%, consumer credit and growth. To this end, it is acquiring new 31%, more than double the pace of the market, customers with substantial business potential, and insurance business 4%.increasing loyalty among current customers and reducing the churn rate. It is also gaining In the energy and infrastructure sectors, market share in larger SMEs and mid-market Santander confirmed its leadership by financing enterprises and increasing its participation in more than 14 projects worth over $88 billion. It infrastructure projects. The Bank continues also reached an agreement to supply banking to consolidate its leadership in mortgages services to more than 11,000 petrol stations in for medium and high-income customers and Mexico.is carrying out a thorough transformation of its operational model in technology and The strong growth in lending was accompanied infrastructure, talent, quality, processes, by a strict process of monitoring and assessing marketing and brand. the quality of the portfolio. The NPL rate
decreased to 3.38%. In 2015, the Bank completed its most ambitious expansion programme in Mexico The magazine LatinFinance recognised in recent years, whereby it increased the Santander Mexico in 2015 as the Best Bank in number of branches by 200 over the last Infrastructure in Mexico, Global Finance as the three years, made progress in multichannel Best Private Bank in Mexico and International services through mobile banking initiatives Finance Magazine as the most socially and had a network of 5,989 ATMs in place at responsible bank in Mexico.the end of the year.
Thanks to its efforts to help customers prosper, Santander Mexico was once again the leading
Main 2016 objectives
• Exceed one million digital customers from 876,000 in 2015.
• Attain more than 3.3 million payroll accounts.
• Reach MXN 75 billion in loans to SMEs.

71
Countries2. Results
2015 ANNUAL REPORT
ChileSantander is the country’s largest bank in terms of assets and customers.
Banco Santander branch in Chile.
2015 highlights The Bank continued to grow in 2015 despi-te the downturn in the local economy. In individual customers, progress was made in consolidating the Select model for high-in-come customers and in developing the new branch model in the traditional network. In SMEs, Santander Advance was launched which is backed by its own CRM system (NEO Advance). The Bank continued to open its new centres for companies, generating more proximity with customers, which produced gains in market shares in loans and deposits.
Santander Chile has market shares of 19.1% in loans and 18.3% in deposits. Lending grew 14% and deposits 13%.
Santander Chile received the prize for the Best Bank of the Year in Chile from The Banker magazine and the Best Private Bank in Chile from Euromoney.
The four strategic pillars of Santander Chile are:
- Improve the quality of customer attention and experience.
- Transform the retail and commercial banking business, particularly with medium and high-income customers and SMEs.
- Strengthen business with large and me-dium-sized companies.
- Foster a new culture focused on the custo-mer and a Simple, Personal and Fair way of doing things.
Employees
12,454Customers (Million)
3.6Loans1 2
32,338 (11%)Attributable profit1
455 (-13%) 1. Million euros, change in local
currency. 2. Change without repos.
ArgentinaSantander Río is the country’s leading private sector bank by volume of assets and liabilities.
New branch model of Santander Río, Argentina.
2015 highlights Santander Río has a market share of 10.0% in loans and 10.3% in deposits. In 2015, the Bank’s business posted strong growth, with loans rising 52% and savings 58%. Income increased by 27% in pesos and costs by 43%.
The Bank has a multichannel network focused on quality of service and customer satisfaction. The branch network increased by 10%, with the opening of 21 new spaces, 82 corners and 125 Select boxes for high-
income customers. Four business centres were also opened for SMEs and companies. The project to transform the branch network continued, with the aim of installing a new customer attention model based on automated processes and use of new technology.
The commercial strategy centred on customer acquisition and loyalty, particularly high-income customers and SMEs. In the medium and long-term, Santander Río will focus on increasing the reach of its distribution network, improving efficiency and service quality, and fostering financial inclusion and banking penetration.
Santander Río was recognised by Euromoney and The Banker magazines as the Best Bank in Argentina. It was also awarded the prize for Best Digital Bank and Best Mobile Bank in Latin America by Global Finance magazine.
Employees
7,952Customers (Million) 2.8Loans1 2
6,028 (+52%)Attributable profit1
378 (+22%) 1. Million euros, change in local
currency. 2. Change without repos.

72
Countries2. Results
2015 ANNUAL REPORT
United States Santander carries out retail banking in the northeast of the country as Santander Bank and consumer finance nationwide through Santander Consumer USA.
Employees
18,123Customers (Million)
5.1Loans1 2
84,190 (+7%)Attributable profit1
678 (-34%) 1. Million euros, change in constant
currency. 2. Change without repos.
Santander branch in the United States.
2015 highlights all of Santander’s main units in the US will Santander Bank increased the number of loyal be integrated into the Group’s holding in customers to 266,000, while customers who the country, Santander Holdings USA, which use the online and mobile channels increased currently comprises Santander Bank and 12% to 617,000. The Bank launched Simply Santander Consumer USA.Right, an easy-to-use current account that waives commissions for those who perform at Santander Bank made contributions to 286 least one financial transaction a month. It also not-for-profit organisations in the territory simplified its current accounts by reducing where it operates. Santander Bank’s the line of products from 13 to 5 and launched employees donated 13,696 hours of voluntary a new, more modern and updated website. service to the communities where they live
and work. Santander Consumer USA’s (SC’s) net income increased 17% to $900 million, driven by In the years to come, Santander US will focus disciplined originations and additional fee on acquiring individual customers through income from its services for other platforms. the development of a simple and innovative To better serve its customers, enhance value proposal, while improving its digital vendor management oversight and diversify capabilities and customer satisfaction. The and de-risk its business, SC focused on emphasis in commercial banking will be on expanding its servicing capabilities in 2015 its product, sales and risk capabilities. SC as it moves to open new facilities in Mesa USA, meanwhile, will increase services for (Arizona) and San Juan (Puerto Rico). other businesses, take full advantage of the
potential of the agreement with Chrysler and Santander US launched a transformation focus on its core businesses.programme to bolster its capabilities in risk management, finance and technology to manage its business better and be able to comply with the regulator’s expectations. This programme includes high investments and strengthening of the franchise. In 2016,
Main 2016 objectives
• Increase the number of digital customers from 617,000 to 725,000.
• Boost lending to companies to $20.7 bn.

73
2. Results2015 ANNUAL REPORT
Global Corporate Banking
Global Corporate BankingSGCB is the global business division mainly focused on corporate clients and institutions which, due to their size or sophistication, require a tailored service or value-added wholesale products.
Loans1 2
Treasury room, Torre Santander, Sao Paulo, Brazil.
The SGCB business model rests on three ping a wide range of products and services for pillars: a customer focus, strong global pro- the customers in this segment.duct capabilities and interconnection with local units. All combined with permanent 2018 objectivesand optimum management of risk, capital SGCB will centre on the following aspects of its and liquidity. value proposals:
2015 highlights Continue to be an expert in Latin America. Optimisation of capital was one of SGCB’s priorities during 2015. In order to make pro- Maintain unique, differentiated capabilities in gress in this objective, SGCB created a new relation to origination, structuring and distribu-area called Asset Rotation and Capital Opti- tion of loans, and its leadership in Acquisition mization (ARCO), which incorporates all the Finance, Structured Credit and Project Finance.capabilities of structuring and sales to impro-ve the Originate to Distribute initiative. Spur the commercialisation of a wide range of
solutions for retail and commercial banking SGCB attained a leadership position in customers, tailored to their needs and/or risk Latin America in debt capital markets, cash tolerance.management and emerging Latin American currencies, according to the main rankings Be the customers’ bank of choice for access and market awards. It is also the leader in Ac- to euro and sterling capital markets.quisition & Project Finance, Export & Agency Finance and Trade Finance. Continue to be the leading bank in internatio-
nal trade. In order to respond adequately to the transfor-mation of international trade finance, SGCB fo- SGCB will also put into effect measures to cused on innovation, digitalisation and further reduce the consumption of capital and will development of some of its products. continue the gradual change toward a business
based more on fee and commission, through SGCB deepened its cooperation with the Retail an improved offer in advisory services and the and Commercial Banking division by develo- Originate to Distribute initiative.
90,167 (+4%)Attributable profit1 3
1,625 (+2%) 1. Million euros, change in local currency. 2. Change without repos.3. The results for this global unit are
included in the data for each local unit.

The purpose of the changes made to the Bank’s board of directors and management team is to have the best prepared and most qualified
people and to provide the Group with best corporate governance practices at an international level
Ms Ana Botín, Group executive chairman General shareholders’ meeting
27 March 2015

3Corporate governance report
76 Executive summary 78 Introduction 79 Ownership structure 82 Banco Santander’s board of directors 105 Shareholder rights and the general
shareholders’ meeting 107 Santander Group management team 109 Transparency and independence 111 Challenges for 2016
Balanced and committed board. Of 15 directors, 11 are non-executive and 4 are executive.
Equality of shareholders’ rights. Principle of one share, one vote, one dividend. No defensive mechanisms in the Bylaws. Encouragement of informed participation at meetings.
Maximum transparency, particularly as regards remuneration.
A corporate governance model recognised by socially responsible investment indexes.
Santander has been included in the FTSE4Good and DJSI indexes since 2003 and 2000, respectively.

76
3. Corporate governance report2015 ANNUAL REPORT
Executive summary
Banco Santander complies with the recommendations and the highest standards regarding good governance that are applicable
to listed companies and credit institutions
Ms Ana Botín, Group executive chairmanGeneral shareholders’ meeting27 March 2015
Executive summary
Changes in the composition of the boardThe following changes have led to a more qualified, international, independent and diverse board:
At its meeting on 25 November 2014, at the proposal of the appointments committee, the board of directors approved the following appointments:
• Mr Bruce Carnegie-Brown, as vice chairman, independent director and lead director.
• Ms Sol Daurella Comadrán and Mr Carlos Fernández González, as independent directors.
These independent directors filled the vacancies created by the death of Mr Emilio Botín-Sanz de Sautuola y García de los Ríos as well as by the resignations of Mr Fernando de Asúa Álvarez and Mr Abel Matutes Juan. The appointments, once cleared by the European Central Bank, took effect on 12 February 2015 in the case of Mr Bruce Carnegie-Brown and Mr Carlos Fernández González, and on 18 February in the case of Ms Sol Daurella Comadrán.
On 25 November 2014, at the proposal of the appointments committee, the board of directors appointed Mr José Antonio Álvarez Álvarez as a member of the board and chief executive officer, replacing Mr Javier Marín Romano. These appointments, once cleared by the European Central Bank and having complied with the related legal requirements, took effect on 13 and 14 January 2015, respectively.
At its meeting on 16 January 2015, at the proposal of the appointments committee, the board of directors resolved to appoint Mr Rodrigo Echenique Gordillo, vice chairman of the board, executive director of the Bank.
At its meeting on 30 June 2015, at the proposal of the appointments committee, the board resolved to appoint by co-option Mr Ignacio Benjumea Cabeza de Vaca as a non-executive director following the resignation of Mr Juan Rodríguez Inciarte as member of the board. The appointment took effect on 21 September, once cleared by the European Central Bank.
Mr Jaime Pérez Renovales was appointed general secretary and secretary of the board and head of the General Secretariat and Human Resources division effective as of 1 September.
Lastly, following the resignation of Ms Sheila C. Bair from her position as a director of the Bank, the board, at its meeting held on 22 December, at the proposal of the appointments committee, resolved to appoint by co-option Ms Belén Romana García as an independent director, once cleared by the European Central Bank.
Activities of the board The board held 21 meetings during 2015. In addition to
the report made by the Group executive chairman at each annual meeting, the chief executive officer submitted management reports on the Group and the vice chairman, Mr Matías Rodríguez Inciarte, reported on the Group’s risks. As in previous years, the board held one meeting on the Group’s global strategy in 2015.
The Group’s external auditors and heads of internal audit participated, respectively, in 12 and 11 of the 13 meetings held by the audit committee in 2015 and reported to the board on two occasions.
Capital increase In 2015 the Bank carried out four capital increases, effective
9 January, 29 January, 29 April and 4 November.
• In the first capital increase, carried out through an accelerated bookbuilding, 1,213,592,234 new shares were issued, representing 9.64% of the Bank’s share capital at year-end 2014.
• In the last three capital increases, carried out within the framework of the Santander Scrip Dividend programme, 262,578,993, 256,046,919 and 117,859,774 new shares were issued, representing 2.09%, 2.03% and 0.94%, respectively, of the Bank’s share capital at year-end 2014.
All this entailed a total increase in share capital equal to 14.7% in comparison with share capital at year-end 2014.

77
3. Corporate governance report2015 ANNUAL REPORT
Executive summary
New dividend policy In 2015 the Bank’s dividend policy was redirected, effective
from the first dividend paid for this year and for the purpose of once again paying most remuneration in cash, announcing the remuneration for 2015 would be EUR 0.20 —three cash dividends and a scrip dividend, in an approximate amount of five cents per share for each of them—.
The Bank also announced its intent that the cash payout represent between 30% and 40% of its recurring profit in the coming years, instead of the previous 20%, and that payments to shareholders reflect the growth in its profit.
Bylaw-stipulated emoluments Bylaw-stipulated emoluments earned by the board amounted
to EUR 5.2 million in 2015, which is 13.6% less than the maximum amount approved at the general shareholders’ meeting.
Remuneration of executive directors At the general shareholders’ meeting on 27 March 2015,
shareholders also approved the maximum ratio of variable components of remuneration in relation to fixed components for 2015 for a maximum of 1,300 members of the identified group, including executive directors.
Under no circumstances may this maximum ratio exceed 200%. At this general shareholders’ meeting of 27 March 2015, shareholders also resolved to amend article 58 (remuneration of directors) and article 59-2 (transparency of the director remuneration system) of the Bylaws, including a new wording to article 59 (approval of the director remuneration policy) and renumbering former article 59 as article 59-2.
At the general shareholders’ meeting of 27 March 2015, shareholders approved, on a binding basis, the director remuneration policy of Banco Santander, S.A. for 2015 and 2016 and submitted the annual report on director remuneration to the consultative vote of shareholders.
These amendments to the Bylaws, together with other amendments approved by the shareholders at the general meeting of 27 March 2015, were registered with the Cantabria Commercial Registry on 1 July 2015.
Appointment of new country heads in the US, Spain, Mexico and Brazil
In March 2015, Mr Scott Powell was appointed the new country head and chief executive officer of Santander Holdings USA (SHUSA), the head of all Santander business in the United States. In his career over the last few years, Mr Powell has held positions of responsibility at J.P. Morgan Chase and Citigroup Inc., and until such date was the executive chairman of National Flood Services, an insurance company. He has broad experience in commercial banking, consumer finance and risks.
On 30 June 2015, the board of directors of Banco Santander resolved to appoint Mr Rami Aboukhair Hurtado, the Bank’s senior executive vice president with vast experience in retail banking in Spain and the UK, as the new country head of Santander Spain.
On 24 August 2015, Mr Marcos Martínez Gavica and Mr Héctor Blas Grisi Checa were appointed as non-executive chairman and chief executive officer of Grupo Financiero Santander México. Both appointments took effect on 1 January 2016 and 1 December 2015, respectively. Mr Grisi joined the Bank as country head in Mexico following a long career in this country’s financial system.
Lastly, in September 2015 Mr Sérgio Rial was appointed country head of the Group in Brazil, an appointment which took effect as of 1 January 2016. Mr Rial joined the Group in March 2015 as chairman of the board of directors of Santander Brazil and since then has collaborated with Mr Jesús María Zabalza Lotina in carrying out this bank’s executive duties. He has vast international experience and has had a successful career in banking as well as in other businesses, in addition to having been a member of the board of important Brazilian and other international companies.
Financial information that the Bank publicly discloses periodically
The board has approved or prepared quarterly, semi-annual financial information, the annual accounts and the manage-ment report for 2015, along with other documents such as the annual report, the sustainability report, information of prudential relevance (Pillar III), the annual corporate gover-nance report, the reports of the board committees and the annual report on director compensation.

78
3. Corporate governance report2015 ANNUAL REPORT
1. Introduction
1. Introduction
In this new phase, we have reinforced our corporate governance, with particular emphasis on the role and operation of the board of directors and its role in risk management, in accordance with the highest international standards in this regard. For Santander, robust governance is a key element in ensuring a sustainable long-term business model.
We have a board of directors that is highly qualified; the experience, knowledge and dedication of the directors and diversity of the board form part of the essential elements to reach the goal of making Santander the best commercial bank in the world.
In line with the Bank’s vision and mission and within the framework of its general supervisory function, the board of directors takes decisions that relate to the Group’s main policies and strategies, its corporate culture, the definition of its corporate structure and the promotion of suitable corporate social responsibility policies. In addition, and especially in exercising its responsibility for the management of all risks, the board must approve and monitor the risk framework and appetite, ensure it is in line with the Bank’s business plans, verify that such risk is correctly reported by all units and oversee the operation of the three lines of defence, guaranteeing the independence of the heads of risk, compliance and internal audit and their direct access to the board.
During the last year and a half, the presence of non-executive directors —most of which are independent— has increased, which ensures adequate oversight of the executive management of the business and decision making and is also conducive to an intense and high-quality debate of all matters.
Santander continues to bring its governance system into line with the highest international standards, both at corporate and subsidiary level, through the implementation of the new internal governance model approved by the Group.

79
3. Corporate governance report2015 ANNUAL REPORT
2. Ownership structure
2. Ownership structure
Number of shares and significant interests
Number of sharesIn 2015 the Bank carried out four capital increases, effective 9 January, 29 January, 29 April and 4 November, with the issuance of 1,213,592,234, 262,578,993, 256,046,919 and 117,859,774 new shares, representing 9.64%, 2.09%, 2.03% and 0.94%, respectively, of the Bank’s share capital at year-end 2014.
The first increase was carried out through an accelerated bookbuilding and the last three within the framework of the Santander Scrip Dividend programme. All this entailed a total increase in share capital equal to 14.70% in comparison with share capital at year-end 2014.
Number of shares % of share capital*
9 January 1,213,592,234 9.64
29 January 262,578,993 2.09
29 April 256,046,919 2.03
4 November 117,859,774 0.94
Total 1,850,077,920 14.70
* Of share capital at year-end 2014.
The Bank’s share capital at 31 December 2015 was represented by 14,434,492,579 shares, whose value according to the listing price on the Electronic Spanish Stock Market Interconnection System at such date was EUR 65,792.4 million.
All shares carry the same voting and dividend rights.
Significant interestsNo shareholder held significant interests (of more than 3% of the share capital1 or interests that would permit a significant influence over the Bank) at 31 December 2015.
The interests held by State Street Bank and Trust Company (12.62%); The Bank of New York Mellon Corporation (6.05%); Chase Nominees Limited (4.84%); EC Nominees Limited (3.99%); Societe Generale S.A. (3.81%); Clearstream Banking S.A. (3.50%); and Guaranty Nominees Limited (3.23%), which were the only ones in excess of 3%, were held by them on behalf of their customers. The Bank is not aware of any of them holding individual interests of 3% or more of its share capital.
Bearing in mind the current number of members of the board of directors (15), the percentage of capital needed to exercise the right to appoint a director, in accordance with article 243 of the Spanish Corporate Enterprises Act (Ley de Sociedades de Capital) on proportional representation, is 6.67%.
Shareholders’ agreements and other significant agreements
Section A.6 of the annual corporate governance report, which forms part of the management report, contains a description of the shareholders’ agreement executed in February 2006 by Mr Emilio Botín-Sanz de Sautuola y García de los Ríos, Ms Ana Botín-Sanz de Sautuola y O’Shea, Mr Emilio Botín-Sanz de Sautuola y O’Shea, Mr Francisco Javier Botín-Sanz de Sautuola y O’Shea, Simancas, S.A., Puente San Miguel, S.A., Puentepumar, S.L., Latimer Inversiones, S.L. and Cronje, S.L. Unipersonal, providing for the syndication of the Bank shares held by the signatories to the agreement or whose voting rights have been granted to them. Such agreement was also reported to the Spanish National Securities Market Commission (CNMV) as a material fact and is described in the public records thereof.
On 3 August and 19 November 2012, Banco Santander notified the CNMV, through a material fact, that it had been formally notified of amendments to this shareholders’ agreement with regard to the signatories thereto.
On 17 October 2013, the Bank also notified the CNMV, through a material fact, of an update to the signatories and the distribution of shares included in the syndication, as a result of a business reorganisation carried out by one of the parties to the agreement.
On 3 October 2014, Banco Santander notified the CNMV, through a material fact, of a new update to the signatories and the distribution of shares included in the syndication, as well as the change in the chairmanship of the syndicate, which is vested in Mr Francisco Javier Botín-Sanz de Sautuola y O’Shea, the current chairman of the board of trustees of the Botín Foundation, supplementing such information through a material fact notification on 6 February 2015.
On 6 February and 29 May 2015, Banco Santander notified the CNMV, through respective material facts, of the updates to the signatories and the distribution of shares included in the syndication, all within the framework of the inheritance process as a result of the death of Mr Emilio Botín-Sanz de Sautuola y García de los Ríos.
Lastly, on 29 July 2015 Banco Santander notified the CNMV, through a material fact, of an update to the signatories and the distribution of shares included in the syndication as a result of extinguishing the usufruct over the shares of one of the parties to the agreement along with the voting rights arising therefrom, thereby consolidating the full price of the aforementioned shares in the Botín Foundation.
1. Limit set by Royal Decree 1362/2007, of 19 October, for defining the concept of significant interest.
80
3. Corporate governance report2015 ANNUAL REPORT
2. Ownership structure
Shares included in the syndicationAt 31 December 2015, the syndication included a total of 72,933,193 shares of the Bank (0.505% of its share capital), broken down as follows:
Number of Signatories to the shareholders’ agreement sharess
Ms Ana Patricia Botín-Sanz de Sautuola O'Shea1 8,294,091
Mr Emilio Botín-Sanz de Sautuola O'Shea2 16,873,709
Mr Francisco Javier Botín-Sanz de Sautuola O'Shea3 16,290,053
Ms Paloma Botín-Sanz de Sautuola O'Shea4 7,835,293
Ms Carmen Botín-Sanz de Sautuola O'Shea 8,636,449
PUENTEPUMAR, S.L. -
LATIMER INVERSIONES, S.L. -
CRONJE, S.L., Unipersonal5 9,428,319
6NUEVA AZIL, S.L. 5,575,279
TOTAL 72,933,193
1. 8,074,263 shares indirectly through Bafimar, S.L.
2. 7,800,332 shares indirectly through Puente San Miguel, S.L.U.
3. 4,652,747 shares indirectly through Inversiones Zulú, S.L. and 6,794,391 shares indirectly through Agropecuaria El Castaño, S.L.U.
4. 6,628,291 shares indirectly through Bright Sky 2012, S.L.
5. Controlled by Ms Ana Botín-Sanz de Sautuola O’Shea.
6. Controlled by Ms Carolina Botín-Sanz de Sautuola O’Shea.
In all other respects the aforementioned syndication agreement remains unchanged.
The aforementioned material facts may be viewed on the Group’s corporate website (www.santander.com).
Treasury shares
Treasury share policyThe sale and purchase of own shares, by the company or by companies controlled thereby, must conform to the provisions of applicable law and the resolutions adopted at the general shareholders’ meeting in this regard.
The Bank, by resolution of the board of directors on 23 October 2014, approved the current treasury share policy2 taking into account the criteria recommended by the CNMV.
Treasury share transactions have the following objectives:
a) To provide liquidity or a supply of securities, as applicable, in the market for the Bank’s shares, giving depth to such market and minimising possible temporary imbalances between supply and demand.
b) To take advantage, in benefit of shareholders as a whole, of situations of weakness in the price of the shares in relation to prospects of changes in the medium term. Such transactions are subject to the following general guidelines.
• They may not entail a proposed intervention in the free formation of prices.
• Trading may not take place if the unit entrusted with such transaction is in possession of insider or relevant information.
• Where applicable, the execution of buy-back programmes and the acquisition of shares to cover obligations of the Bank or the Group shall be permitted.
Transactions with treasury shares are carried out by the investments and holdings department, which is isolated as a separate area from the rest of the Bank’s activities and protected by the respective chinese walls, preventing it from receiving any insider or relevant information. The head of such department is responsible for the management of treasury shares.
Key dataAt 31 December 2015, the Bank held 40,291,209 treasury shares, representing 0.279% of its share capital at that date (at year-end 2014, there were 1,465,371 treasury shares, representing 0.012% of the Bank’s share capital at such date).
The following table sets out the monthly average percentages of treasury shares in 2015 and 2014.
Monthly average percentages of treasury shares1
% of the Bank’s social capital2
2015 2014
January 0.200 0.154
February 0.218 0.232
March 0.233 0.241
April 0.246 0.136
May 0.181 0.260
June 0.169 0.297
July 0.132 0.284
August 0.187 0.414
September 0.244 0.337
October 0.336 0.156
November 0.336 0.258
December 0.335 0.141
1. Further information in this regard is included in section A.8 of the annual corporate governance report, which forms part of the management report, and in the capital and treasury share section of this latter report.
2. Monthly average of daily positions of treasury shares.
The transactions with treasury shares performed in the Group’s interest by the consolidated companies in 2015 entailed the acquisition of 537,314,450 shares, equivalent to a par value of EUR 268.7 million (cash amount of EUR 3,224.9 million) and the sale of 498,448,612 shares, with a par value of EUR 249.2 million (cash amount of EUR 3,048.3 million).
2. The treasury share policy is published on the Group’s corporate website (www.santander.com).

81
3. Corporate governance report2015 ANNUAL REPORT
2. Ownership structure
The average purchase price of the Bank’s shares in 2015 was EUR 6.00 per share, and the average sale price of the Bank’s shares was EUR 6.12 per share.
The net gain in 2015, net of tax, on transactions involving shares issued by the Bank, amounting to EUR 16,442,887, was recognised in the Group’s equity under Shareholders’ equity-Reserves.
AuthorisationThe current authorisation for transactions with treasury shares arises from resolution Five adopted by the shareholders at the general shareholders’ meeting held on 28 March 2014, item II) of which reads as follows:
“To expressly authorise the Bank and the subsidiaries belonging to the Group to acquire shares representing the Bank’s share capital for any valuable consideration permitted by law, within the limits of the law and subject to all legal requirements, up to a maximum number of shares (including the shares they already hold) equal to 10% of the share capital existing at any given time or the maximum percentage permitted by law while this authorisation remains in force, such shares being fully paid at a minimum price per share equal to the par value thereof and a maximum price of up to 3% higher than the last listing price for transactions in which the Bank does not act on its own behalf on the Continuous Market of the Spanish stock exchanges (including the block market) prior to the acquisition in question. This authorisation may only be exercised within five years of the date of the general shareholders’ meeting. The authorisation includes the acquisition of any shares that must be delivered to the employees and directors of the company either directly or as a result of the exercise of the options held by them”.
Resolutions in effect regarding the possible issuance of new shares or of bonds convertible into shares
The capital authorised by the shareholders at the annual general meeting held on 27 March 2015, under item Eight of the agenda, amounted to EUR 3,515,146,471.50. The Bank’s directors have until 27 March 2018 to carry out capital increases up to this limit. The shareholders gave the board (or, by delegation, the executive committee) the power to exclude pre-emptive rights, in full or in part, pursuant to the provisions of article 506 of the Spanish Corporate Enterprises Act, although this power is limited to capital increases carried out under this authorisation up to EUR 1,406,058,588.50.
This authorisation had not been used as of the date of this document.
In addition, the shareholders at the annual general meeting held on 27 March 2015 approved the following resolutions in connection with the content of this section:
1. Two increases in share capital with a charge to reserves for the maximum amounts of EUR 2,300 million and EUR 750 million at market value, respectively, within the shareholder compensation scheme (Santander Scrip Dividend) whereby the Bank has offered shareholders the possibility of receiving shares under a scrip issue for an amount equal to the dividends on the dates on which the final dividend for 2014 and the second interim dividend for 2015 are customarily paid.
The two capital increases were carried out on 29 April and 4 November 2015. A number of shares with a par value of EUR 0.50 each were issued in each case, equal to EUR 128,023,459.50 and EUR 58,929,887, respectively, which corresponds to a total of 2.590% of the Bank’s share capital at year-end 2015.
2. Delegation to the board of directors, in accordance with the general rules on issuing debentures and pursuant to the provisions of article 319 of the Commercial Registry Regulations (Reglamento del Registro Mercantil), of the power to issue, on one or more occasions, debentures, bonds, preferred shares and other fixed-income securities or debt instruments of a similar nature in any of the forms allowed by law and convertible into and/or exchangeable for shares of the Bank (resolution Ten A). Such delegation also includes warrants or similar securities that may directly or indirectly carry the right to subscribe for or acquire shares of the Bank, whether newly-issued or already outstanding, payable by physical delivery or through set-off. The issuance or issuances of securities carried out pursuant to this delegation come to the aggregate maximum amount of EUR 10,000 million or the equivalent amount in another currency, and the Bank’s directors have until 27 March 2020 to implement this resolution.
This authorisation had not been used as of the date of this document.
3. Delegation to the board of directors, pursuant to the provisions of article 297.1.a) of the Spanish Corporate Enterprises Act, of the broadest powers such that, within one year of the date on which the aforementioned shareholders’ meeting is held, it may set the date and the terms and conditions, as to all matters not provided for by the shareholders themselves, of an increase in capital, approved by the shareholders, in the amount of EUR 500 million. If the board does not exercise the powers delegated to it within the aforementioned period, these powers will be rendered null and void.
This authorisation also had not been used as of the date of this document.

82
2015 ANNUAL REPORT3. Corporate governance report3. Banco Santander’s board of directors
3. Banco Santander’s board of directors3
Ms Ana Botín-Sanz de Sautuola y O’Shea
GROUP EXECUTIVE CHAIRMANExecutive director
Born in 1960 in Santander, Spain.
Joined the board in 1989.
Graduate in Economics.
Joined the Bank after a period at JP Morgan (1980-1988). She was appointed senior executive vice president of Banco Santander, S.A. in 1992, and subsequently became executive chairman of Banesto from 2002 to 2010 and chief executive officer of Santander UK from 2010 to 2014.
Other significant positions: She is a non-executive director of The Coca-Cola Company. She is also a member of the board of Deusto Business School and of the Financial Services Trade and Investment Board (FSTIB), created by the British Ministry of Economy to promote the financial services industry of the United Kingdom. She is also Dame Commander of the British Empire, Business Ambassador of the government of the United Kingdom and member of the Trilateral Commission and of the advisory board of Saïd Business School (University of Oxford).
Committees of the board of which she is a memberExecutive (chairman), international (chairman) and innovation and technology (chairman).
Mr José Antonio Álvarez Álvarez
CHIEF EXECUTIVE OFFICER Executive director
Born in 1960 in León, Spain.
Joined the board in 2015.
Graduate in Economics and Business Administration. MBA from the University of Chicago.
Joined the Bank in 2002 and was appointed senior executive vice president of the financial management and investor relations division in 2004 (Group chief financial officer).
Other significant positions: He is a member of the board of Banco Santander (Brasil), S.A. and SAM Investments Holdings Limited. He has also served as a director of Santander Consumer Finance, S.A. and Santander Holdings USA, Inc. and a member of the supervisory boards of Santander Consumer AG, Santander Consumer Holding GMBH and Bank of Zachodni WBK, S.A., as well as director of Bolsas y Mercados Españoles (BME).
Committees of the board of which he is a memberExecutive, international and innovation and technology.
Mr Bruce Carnegie-Brown
VICE CHAIRMAN Non-executive director (independent) and lead director
Born in 1959 in Freetown, Sierra Leone.
Joined the board in 2015.
MA degree in English Language and Literature from the University of Oxford.
Other significant positions: He was the non-executive chairman of Aon UK Ltd, founder and managing partner of the quoted private equity division of 3i Group Plc., chairman and chief executive officer of Marsh Europe and has held various positions at JP Morgan Chase and Bank of America. He was also lead independent director at Close Brothers Group Plc (2008-2014) and Catlin Group Ltd (2010-2014). He is currently the non-executive chairman of Moneysupermarket.com Group Plc and a non-executive director of Santander UK Plc.
Committees of the board of which he is a memberExecutive, appointments (chairman), remuneration (chairman), risk supervision, regulation and compliance (chairman) and innovation and technology.
Mr Rodrigo Echenique Gordillo
VICE CHAIRMANExecutive director
Born in 1946 in Madrid, Spain.
Joined the board in 1988.
Graduate in Law and Government Attorney.
Other significant positions: He was the former chief executive officer of Banco Santander, S.A. (1988-1994). He has served on the board of directors of several industrial and financial companies such as Ebro Azúcares y Alcoholes, S.A. and Industrias Agrícolas, S.A. He was the chairman of the advisory board of Accenture, S.A. He also held the position of non-executive chairman of NH Hotels Group, S.A., Vocento, S.A. and Vallehermoso, S.A. He is currently a non-executive director of Inditex, S.A. and the chairman of the board of directors of Metrovacesa, S.A.
Committees of the board of which he is a member Executive, international and innovation and technology.
3. Unless otherwise specified, the main activity of the members of the board is that carried out at the Bank in their capacity as directors, whether executive or non-executive.

83
2015 ANNUAL REPORT3. Corporate governance report3. Banco Santander’s board of directors
Mr Matías Rodríguez Inciarte
VICE CHAIRMAN Executive director
Born in 1948 in Oviedo, Spain.
Joined the board in 1988.
Graduate in Economics, and Government Economist. He also carried out business administrations studies at the Massachusetts Institute of Technology (MIT).
Other significant positions: He was Minister of the Presidency between 1981 and 1982, as well as technical general secretary of the Ministry of Economy, general secretary of the Ministry for European Community Relations and deputy secretary of state to the President. He is currently chairman of Unión de Crédito Inmobiliario, S.A. the Princess of Asturias Foundation and of the social council of the Universidad Carlos III de Madrid. He is also a non-executive director of Sanitas, S.A. de Seguros, Financiera Ponferrada, S.A., SICAV and Financiera El Corte Inglés E.F.C.
Committees of the board of which he is a memberExecutive and innovation and technology.
Mr Guillermo de la Dehesa Romero
VICE CHAIRMANNon-executive director
Born in 1941 in Madrid, Spain.
Joined the board in 2002.
Government Economist and head of office of the Bank of Spain (on leave of absence).
He is an international advisor to Goldman Sachs International.
Other significant positions: He was secretary of state for Economy, secretary general for Trade and chief executive officer of Banco Pastor, S.A. He is currently a non-executive vice chairman of Amadeus IT Holding, S.A., honorary chairman of the Centre for Economic Policy Research (CEPR) based in London, a member of the Group of Thirty based in Washington, chairman of the board of trustees of IE Business School and non-executive chairman of Aviva Grupo Corporativo, S.L. and of Aviva Vida y Pensiones, S.A. de Seguros y Reaseguros.
Committees of the board of which he is a member Executive, appointments, remuneration, risk supervision, regulation and compliance, international and innovation and technology.
Mr Ignacio Benjumea Cabeza de Vaca
Non-executive director
Born in 1952 in Madrid, Spain.
Joined the board in 2015.
Graduate in Law at the Deusto University, ICADE E-3, and Government Attorney.
He is vice chairman of the Financial Studies Foundation and a member of the board of trustees and the executive committee of the Banco Santander Foundation.
Other significant positions: He was senior executive vice president, general secretary and secretary of the board of Banco Santander, S.A. and director, senior executive vice president, general secretary and secretary of the board of Banco Santander de Negocios and Santander Investment. He was also technical general secretary of the Ministry of Employment and Social Security, general secretary of Banco de Crédito Industrial and director of Dragados, S.A., Bolsas y Mercados Españoles (BME) and of the Governing Body of the Madrid Stock Exchange.
Committees of the board of which he is a memberExecutive, appointments, remuneration, risk supervision, regulation and compliance, international and innovation and technology.
Mr Javier Botín-Sanz de Sautuola y O’Shea
Non-executive director (proprietary)
Born in 1973 in Santander, Spain
Joined the board in 2004.
Graduate in Law.
He is chairman and chief executive officer of JB Capital Markets, Sociedad de Valores, S.A.U.
Other significant positions: In addition to his professional activity in the financial sector, he collaborates with several non-profit organisations. Since 2014 he has been chairman of the Botín Foundation and trustee of the Princess of Girona Foundation and of the Prehistoric Research Institute of Cantabria.

84
3. Corporate governance report2015 ANNUAL REPORT
3. Banco Santander’s board of directors
Ms Sol Daurella Comadrán
Non-executive director (independent)
Born in 1966 in Barcelona, Spain.
Joined the board in 2015.
Graduate in Business and MBA in Business Administration.
She is executive chairman of Olive Partners, S.A. and holds several positions in companies of the Cobega Group.
Other significant positions: She has served as a member of the governing board of the Círculo de Economía and an independent non-executive director of Banco Sabadell, S.A., Ebro Foods, S.A. and Acciona, S.A. She is also honorary consul-general for Iceland in Catalonia.
Committees of the board of which she is a memberAppointments and remuneration.
Mr Carlos Fernández González
Non-executive director (independent)
Born in 1966 in Mexico City, Mexico.
Joined the board in 2015.
An industrial engineer, he has undertaken graduate studies in business administration at the Instituto Panamericano de Alta Dirección de Empresas.
He is the chairman of the board of directors of Finaccess, S.A.P.I.
Other significant positions: He is currently a member of the advisory board of the Modelo Group.
Committees of the board of which he is a memberAudit, appointments and risk supervision, regulation and compliance.
Ms Esther Giménez-Salinas i Colomer
Non-executive director (independent)
Born in 1949 in Barcelona, Spain.
Joined the board in 2012.
Doctor in Law.
She is Professor Emeritus of Ramon Llull University, director of Unibasq and Aqu (agencies for quality of the Basque and Catalan university system) and of Gawa Capital Partners, S.L., and a member of the advisory board of Endesa-Catalunya.
Other significant positions: She has been rector of Ramon Llull University, a member of the General Council of the Judiciary, a member of the standing committee of the Conference of Rectors of Spanish Universities and executive vice president of the Centre for Legal Studies of the Department of Justice of the Catalonia Government.
Committees of the board of which she is a memberInternational and innovation and technology.
Mr Ángel Jado Becerro de Bengoa
Non-executive director (independent)
Born in 1945 in Santander, Spain.
Joined the board in 2010.
Graduate in Law and degree in Business Administration.
Other significant positions: He was director of Banco Santander from 1972 to 1999 and director of Banco Banif, S.A. from 2001 to 2013. He currently holds various positions in investment trusts.
Committees of the board of which he is a memberAudit, appointments, remuneration and risk supervision, regulation and compliance.
Board membership underwent an important renewal, bringing in new independent and non-executive directors, thereby shoring up diversity on the governing body. A rigorous selection process was carried out with the assistance of an external firm, which selected a plurality of candidates, based on an assessment of the directors’ capacities (skills matrix) and the identification of the most suitable profiles for consolidating the Group’s strategic objectives. This process, headed by the appointments committee, included a thorough succession procedure for posts on the board, taking the shape of the corresponding succession plans.

85
3. Corporate governance report2015 ANNUAL REPORT
3. Banco Santander’s board of directors
Ms Belén Romana García
Non-executive director (independent)
Born in 1965 in Madrid, Spain.
Joined the board in 2015.
Graduate in Economics and Business Administration from Universidad Autónoma de Madrid and Government Economist.
She is a non-executive director of Aviva Plc, London.
Other significant positions: She was executive vice president of Economic Policy and executive vice president of the Treasury of the Ministry of Economy of the Spanish Government, as well as director of the Bank of Spain and the Spanish National Securities Market Commission. She also held the position of director of the Instituto de Crédito Oficial and of other entities on behalf of the Spanish Ministry of Economy. She was the executive chairman of Sociedad de Gestión de Activos Procedentes de la Reestructuración Bancaria, S.A. (SAREB).
Committees of the board of which she is a memberAudit.
Ms Isabel Tocino Biscarolasaga
Non-executive director (independent)
Born in 1949 in Santander, Spain.
Joined the board in 2007.
Doctor in Law. She has undertaken graduate studies in business administration at IESE and the Harvard Business School.
She is a professor at Universidad Complutense de Madrid.
Other significant positions: She has been Minister for the Environment, chairman of the European Affairs Committee and of the Foreign Affairs Committee of the Spanish Congress and chairman for Spain and Portugal and vice chairman for Europe of Siebel Systems. She is currently an elected member of the Spanish State Council, a member of the Royal Academy of Doctors and a non-executive director of ENCE Energía y Celulosa, S.A., Naturhouse Health, S.A. and Enagas, S.A.
Committees of the board of which she is a memberExecutive, audit, remuneration and risk supervision, regulation and compliance.
Mr Juan Miguel Villar Mir
Non-executive director (independent)
Born in 1931 in Madrid, Spain.
Joined the board in 2013.
Doctorate in Civil Engineering, graduate in Law and degree in Industrial Organisation.
He is the chairman of the OHL Group and of the Villar Mir Group, and represents these entities as vice chairman and director of Abertis Infraestructuras, S.A. and Inmobiliaria Colonial, S.A., respectively.
Other significant positions: He was Minister of Finance and vice president of the Government for Economic Affairs from 1975 to 1976, and chairman of Electra de Viesgo, Altos Hornos de Vizcaya, Hidro Nitro Española, Empresa Nacional de Celulosa, Empresa Nacional Carbonífera del Sur, Cementos del Cinca, Cementos Portland Aragón, Puerto Sotogrande, the COTEC Foundation and of the National College of Civil Engineering. He is also currently Professor of Business Organisation at Universidad Politécnica de Madrid, a full numerary member of the Royal Academy of Engineering and of the Royal Academy of Moral and Political Sciences, an honorary member of the Royal Academy of Doctors and supernumerary of the Royal Academy of Economics and Finance.
Committees of the board of which he is a memberAudit (chairman) and risk supervision, regulation and compliance.
Mr Jaime Pérez Renovales
General secretary and secretary of the board
Born in 1968 in Valladolid, Spain.
Joined the Group in 2003.
Graduate in Law and Business Administration at Universidad Pontificia de Comillas (ICADE E-3), and Government Attorney.
Other significant positions: He was deputy director of legal services at the CNMV, director of the office of the second vice president of the Government for Economic Affairs and the Minister of Economy, general secretary and secretary of the board of Banco Español de Crédito, S.A., general vice secretary and vice secretary of the board and head of legal advisory services of Grupo Santander, deputy secretary of the Presidency of the Government and chairman of the committee for the reform of public administration.
He was director of Patrimonio Nacional, Sociedad Estatal de las Participaciones Industriales, Holding Olímpico, S.A., Autoestradas de Galicia, S.A. and Sociedad Estatal para la Introducción del Euro, S.A., among others . He is a member of the board of trustees and the executive commitee of Fundación Banco Santander.
Secretary of committees of the boardExecutive, audit, appointments, remuneration, risk supervision, regulation and compliance, international and innovation and technology.

86
3. Corporate governance report2015 ANNUAL REPORT
3. Banco Santander’s board of directors
Re-election of directors at the 2016 annual general shareholders’ meetingPursuant to article 55 of the Bylaws4 and article 22 of the Rules and Regulations of the Board4, directors are appointed to three-year terms, such that one-third of the board is renewed each year.
The following directors will be proposed for re-election at the 2016 annual general shareholders’ meeting, scheduled for 17 or 18 March on first and second call, respectively, and following the order determined by seniority for annual renewal and for renewal of one-third of the board, Mr Javier Botín-Sanz de Sautuola y O’Shea, Mr Bruce Carnegie-Brown, Mr Ángel Jado Becerro de Bengoa, Ms Sol Daurella Comadrán and Ms Isabel Tocino Biscarolasaga, the first as a proprietary director and the rest as independent directors.
The appointments of Mr Ignacio Benjumea Cabeza de Vaca, as non-executive director (neither proprietary nor independent), and Ms Belén Romana García, as an independent director, will be submitted for ratification by the shareholders at the general meeting.
Their professional profiles, together with the description of their activities, appear on the preceding pages, on the Bank’s corporte website (www.santander.com) and in the proposed resolutions of the general shareholders’ meeting of 2016.
Each of the re-elections and ratifications will be submitted separately to a vote of the shareholders at the general meeting (article 21.2 of the Rules and Regulations for the General Shareholders’ Meeting), a practice in place since 2005, whereby all the current directors were appointed.
Powers and duties
The basic responsibility of the board of directors is to supervise the Group, delegating the day-to-day management thereof to the appropriate executive bodies and the various management teams.
The Rules and Regulations of the Board (article 3) reserve thereto the power, which cannot be delegated, to approve general policies and strategies and, in particular, the following: strategic or business plans;
4. The Bylaws and the Rules and Regulations of the Board of Banco Santander are published on the Group’s corporate website ( www.santander.com).
Composition and structure of the board of directors1
Board of directors Committees Shareholding
Exec
utiv
e
Non
-exe
cuti
ve
1. Ex
ecut
ive
com
mit
tee
2. A
udit
com
mit
tee
3. A
ppoi
ntm
ents
co
mm
itte
e
4. R
emun
erat
ion
com
mit
tee
5. R
isk
supe
rvis
ion,
re
gula
tion
and
co
mpl
ianc
e co
mm
itte
e
6. In
tern
atio
nal
com
mit
tee
7. I n
nova
tion
and
te
chno
logy
com
mit
tee
Dire
ct
Indi
rect
Shar
es re
pres
e nte
d
Tota
l
% o
f sha
re c
apit
al
Dat
e of
firs
t ap
poin
tmen
t
Dat
e of
last
ap
poin
tmen
t
End
date
2
Dat
e of
last
pro
posa
l of
the
appo
intm
ents
co
mm
itte
e
Group executive chairman Ms Ana Botín-Sanz de Sautuola y O’Shea C C C 219,828 17,502,582 - 17,722,4103 0.123% 04/02/1989 28/03/2014 First six months of 2017 17/02/2014
Chief executive officer Mr José Antonio Àlvarez Àlvarez 438,930 1,287 - 440,217 0.003% 25/11/20144 27/03/2015 First six months of 2018 20/02/2015
Vice chairmen Mr Bruce Carnegie-Brown I C C C 10,099 - - 10,099 0.000% 25/11/20145 27/03/2015 First six months of 2018 11/02/2016
Mr Rodrigo Echenique Gordillo 665,153 14,023 - 679,176 0.005% 07/10/1988 28/03/2014 First six months of 2017 13/02/2014
Mr Matías Rodríguez Inciarte 1,327,697 306,729 205,751 1,840,177 0.013% 07/10/1988 27/03/2015 First six months of 2018 20/02/2015
Mr Guillermo de la Dehesa Romero N 143 - - 143 0.000% 24/06/2002 27/03/2015 First six months of 2018 20/02/2015
Members Mr Ignacio Benjumea Cabeza de Vaca6 N 2,926,372 - - 2,926,372 0.020% 30/06/20157 30/06/2015 First six months of 2019 11/02/2016
Mr Javier Botín-Sanz de Sautuola y O’Shea P 4,793,481 11,496,572 116,250,650 132,540,703 0.918% 25/07/2004 22/03/2013 First six months of 2016 11/02/2016
Ms Sol Daurella Comadrán I 949 412,521 - 413,470 0.003% 25/11/20148 27/03/2015 First six months of 2018 11/02/2016
Mr Carlos Fernández González I 15,839,714 - - 15,839,714 0.110% 25/11/20145 27/03/2015 First six months of 2018 20/02/2015
Ms Esther Giménez-Salinas i Colomer I 5,344 - - 5,344 0.000% 30/03/2012 28/03/2014 First six months of 2017 17/02/2014
Mr Ángel Jado Becerro de Bengoa I 2,200,000 5,100,000 - 7,300,000 0.051% 11/06/2010 22/03/2013 First six months of 2016 11/02/2016
Ms Belén Romana García6 I 149 - - 149 0.000% 22/12/2015 22/12/2015 First six months of 2019 11/02/2016
Ms Isabel Tocino Biscarolasaga I 207,511 - - 207,511 0.001% 26/03/2007 22/03/2013 First six months of 2016 11/02/2016
Mr Juan Miguel Villar Mir I C 1,186 - - 1,186 0.000% 07/05/2013 27/03/2015 First six months of 2018 20/02/2015
Total 28,636,556 34,833,714 116,456,401 179,926,671 1.247%
General secretary and secretary of the board Mr Jaime Pérez Renovales
1. Data at 31 December 2015.
2. However, and pursuant to the provisions of article 55 of the Bylaws, one-third of the board will be renewed each year, based on length of service and according to the date and order of the respective appointment.
3. Syndicated shares. See page 80.
4. Effective 13 January 2015.

87
3. Corporate governance report2015 ANNUAL REPORT
3. Banco Santander’s board of directors
management objectives and the annual budget; fiscal strategy and capital and liquidity strategy; investment, financing, dividend, treasury share, risk management and control (including fiscal), corporate governance, corporate social responsibility and regulatory compliance policies; policies regarding the internal governance of the Bank and its Group; remuneration policies for employees of the Bank and its Group; and policies for reporting to and notifying shareholders, markets and public opinion.
Various matters, which likewise cannot be delegated, are also reserved for the board, including decisions regarding: the acquisition and disposal of substantial assets (except when the decisions come within the purview of the shareholders at a general shareholders’ meeting) and major corporate transactions; the determination of each director’s remuneration and the approval of contracts governing the performance by the directors of duties other than those of a director, including executive duties, as well as the remuneration to which they are entitled for the discharge thereof; the selection, appointment by co-option and ongoing assessment of directors; the selection, appointment and, if necessary, removal of the other members of senior management (senior executive vice presidents and equivalents) and the monitoring of management activity and ongoing assessment thereof, as well as the determination of the basic terms and conditions of their contracts; the authorisation for the creation or acquisition of interests in special purpose entities or in entities registered in countries or territories regarded as tax havens; the approval of
investments or transactions of a strategic nature or with a particular tax risk; and the approval of certain related transactions. With regard to those powers that cannot be delegated, the executive committee may make any appropriate decisions, by delegation of the board and whenever justified by reasons of urgency, provided that the board is subsequently informed at the first meeting held to ratify such decisions.
The Bylaws (article 40) as well as the aforementioned Rules and Regulations (article 5) establish the board’s obligation to ensure that the Bank faithfully complies with applicable law, observes usage and good practices of the industries or countries where it does business and abides by the additional social responsibility principles that it has voluntarily accepted. The board of directors and its standing committees shall exercise their powers and, in general, carry out their duties in accordance with the interests of the company, understood to be the attainment of a long-term sustainable and profitable business that furthers its continuity and maximises the value of the company.
In addition, the Bank’s board takes a very active interest in the Group’s risk function. Of its 15 members, 11 are members of at least one of the two board committees that deal with risk: the executive committee and the risk supervision, regulation and compliance committee. Three executive directors are also members of the executive risk committee, which is the body not mandated by the bylaws responsible for global risk management in the Group.
Composition and structure of the board of directors1
Board of directors Committees Shareholding
Dire
ct
Indi
rect
Shar
es re
pres
ente
d
Tota
l
% o
f sha
re c
apit
al
Dat
e of
firs
t ap
poin
tmen
t
Dat
e of
last
ap
poin
tmen
t
End
date
2
Dat
e of
last
pro
posa
l of
the
appo
intm
ents
co
mm
itte
e
219,828 17,502,582 - 17,722,4103 0.123% 04/02/1989 28/03/2014 First six months of 2017 17/02/2014
438,930 1,287 - 440,217 0.003% 25/11/20144 27/03/2015 First six months of 2018 20/02/2015
10,099 - - 10,099 0.000% 25/11/20145 27/03/2015 First six months of 2018 11/02/2016
665,153 14,023 - 679,176 0.005% 07/10/1988 28/03/2014 First six months of 2017 13/02/2014
1,327,697 306,729 205,751 1,840,177 0.013% 07/10/1988 27/03/2015 First six months of 2018 20/02/2015
143 - - 143 0.000% 24/06/2002 27/03/2015 First six months of 2018 20/02/2015
2,926,372 - - 2,926,372 0.020% 30/06/20157 30/06/2015 First six months of 2019 11/02/2016
4,793,481 11,496,572 116,250,650 132,540,703 0.918% 25/07/2004 22/03/2013 First six months of 2016 11/02/2016
949 412,521 - 413,470 0.003% 25/11/20148 27/03/2015 First six months of 2018 11/02/2016
15,839,714 - - 15,839,714 0.110% 25/11/20145 27/03/2015 First six months of 2018 20/02/2015
5,344 - - 5,344 0.000% 30/03/2012 28/03/2014 First six months of 2017 17/02/2014
2,200,000 5,100,000 - 7,300,000 0.051% 11/06/2010 22/03/2013 First six months of 2016 11/02/2016
149 - - 149 0.000% 22/12/2015 22/12/2015 First six months of 2019 11/02/2016
207,511 - - 207,511 0.001% 26/03/2007 22/03/2013 First six months of 2016 11/02/2016
1,186 - - 1,186 0.000% 07/05/2013 27/03/2015 First six months of 2018 20/02/2015
28,636,556 34,833,714 116,456,401 179,926,671 1.247%
Exec
utiv
e
Non
-exe
cuti
ve
1. Ex
ecut
ive
com
mit
tee
2. A
udit
com
mit
tee
3. A
ppoi
ntm
ents
co
mm
itte
e
4. R
emun
erat
ion
com
mit
tee
5. R
isk
supe
rvis
ion,
re
gula
tion
and
co
mpl
ianc
e co
mm
itte
e
6. In
tern
atio
nal
com
mit
tee
7. In
nova
tion
and
te
chno
logy
com
mit
tee
Group executive chairman Ms Ana Botín-Sanz de Sautuola y O’Shea C C C
Chief executive officer Mr José Antonio Àlvarez Àlvarez
Vice chairmen Mr Bruce Carnegie-Brown I C C C
Mr Rodrigo Echenique Gordillo
Mr Matías Rodríguez Inciarte
Mr Guillermo de la Dehesa Romero N
Members Mr Ignacio Benjumea Cabeza de Vaca6 N
Mr Javier Botín-Sanz de Sautuola y O’Shea P
Ms Sol Daurella Comadrán I
Mr Carlos Fernández González I
Ms Esther Giménez-Salinas i Colomer I
Mr Ángel Jado Becerro de Bengoa I
Ms Belén Romana García6 I
Ms Isabel Tocino Biscarolasaga I
Mr Juan Miguel Villar Mir I C
Total
General secretary and secretary of the board Mr Jaime Pérez Renovales
5. Effective 12 February 2015.
6. Their appointment will be submitted for ratification at the general shareholders’ meeting scheduled for 17 or 18 March 2016, on first or second call.
7. Effective 21 September 2015.
8. Effective 18 February 2015.
C Chairman of the committeeP ProprietaryI IndependentN Non-executive (neither proprietary nor independent)

88
3. Corporate governance report2015 ANNUAL REPORT
3. Banco Santander’s board of directors
Corporate governance of the risk function
• In line with the Group’s goal of strengthening its corporate governance, governance of the risk function was updated and strengthened in 2015 by incorporating best international practices, establishing committees for making decisions and managing risk, with the involvement of the business functions, and independent committees responsible for controlling risk.
• The Bank’s risk supervision, regulation and compliance committee was set up in June 2014 with general powers to support and advise the board of directors on risk supervision and control, on determining the Group’s risk policies, on relations with supervisory authorities, on regulation and compliance, corporate social responsibility and corporate governance. This committee held 13 meetings in 2015, each of which lasteapproximately four hours.
• With regard to the risk function, Mr José María Nus Badía is the Group chief risk officer and reports to Mr Matías Rodríguez Inciarte, the Bank s executive vice chairman of Banco Santander and chairman of the non-statutory executive risk committee.
• The executive risk committee held 81 meetings in 2015, each of which lasted approximately three hours. The committee was disbanded by resolution of the board on1 December 2015.
• The executive committee held 59 meetings in 2015 and devoted a very significant amount of its time to discussions on risks.
• The board of directors approved a new risk governance model at its meeting on 29 September 2015. This model entered into force on 1 November and is based on the following principles:
• Separate decision-making functions from control functions.
• Strengthen the responsibility of the first line of defence in decision-making.
• Ensure that all decisions concerning risk follow a formal approval process.
• Ensure there is an overall vision of all types of risks, including those outside the scope of control of the risk function.
• Strengthen the role of risk control committees, affording them additional powers.
• Simplify the committee structure.
• In this context, two internal risk committees, not mandated by the bylaws, were created: the executive risk committee, as the body in charge of global risk management, which replaces the board’s delegate risk committee, and the risk control committee, as the body in charge of global risk supervision and management. This organisation model is in line with best practices regarding risk governance.
Banco Santander follows a risk management and control model based on three lines of defence:
the first, carried out by the business and support functions; the second, performed by the Risk and Compliance functions;
and the third, which is the responsibility of Internal Audit.
Average rate of attendance at meetings of the committees of the board %
Executive committee Audit committee
Executive risk committee* Risk supervision, regulation and compliance committee
98.0 98.1 98.095.4 95.8 95.0 96.489.2 90.2 90.2 90.987.5 88.8 89.185.6
83.3 78.4
2011 2012 2013 2014 2015
Disbanded by resolution of the board on 1 December 2015, as a result of the new risk governance model. The executive committee devoted a very significant amount of its time to discussions on risks.
d
*
Number of meetings of the executive, executive risk, audit, and risk supervision, regulation and compliance committees
Committees 2011 2012 2013 2014 2015
Executive 59 59 58 65 59
Executive risk 99 98 97 96 81
Audit 12 11 12 13 13
Risk supervision, regulation and compliance - - - 5 13
Total meetings 170 168 167 179 166
Cross-participation on executive, audit, and risk supervision, regulation and compliance committees
5 of the directors are members of 1 of the 3 committees
6 of the directors are members of 2 of
the 3 committees
1 of the directors is a member of the
3 committees

89
3. Corporate governance report2015 ANNUAL REPORT
3. Banco Santander’s board of directors
Size and composition of the board
Since the end of 2010, the size of the board has been reduced by 25%, from 20 to 15 members.
The composition of the board of directors is balanced between executive and non-executive directors, most of whom are independent. All members are distinguished by their professional ability, integrity and independence of opinion.
Pursuant to article 6.3 of the Rules and Regulations of the Board, the appointments committee verified the status of each director at its meeting on 11 February 2016. Its proposal was submitted to the board and approved thereby at its meeting on 12 February 2016.
Of the 15 members currently sitting on the board, 4 are executive and 11 are non-executive. Of the latter, eight are independent, one is proprietary and the other two, in the opinion of the board, are neither proprietaries nor independents.
Size of the board
20
2010
18
2011
16
2012
16
2013
14
2014
15
2015
Commitment of the board5
Number of shares of the board6 Listed price Share price
179,926,671 EUR 820 EUR 4.5581.247% of the share capital million
5. Data at 31 December 2015.
6. Since year-end 2015 various members of the board have made significant investments in shares of Banco Santander, thereby increasing their individual stakes in the Bank’s capital.
Executive directorsPursuant to the Rules and Regulations of the Board (article 6.2.a)), the following are executive directors: Ms Ana Botín-Sanz de Sautuola y O’Shea, Mr José Antonio Álvarez Álvarez, Mr Rodrigo Echenique Gordillo and Mr Matías Rodríguez Inciarte.
Proprietary non-executive directorsAccording to article 6.2.b) of the Rules and Regulations of the Board, proprietary directors are non-executive directors who hold or represent shareholdings equal to or greater than that which qualifies as significant under the law, or who have been designated as such on account of their status as shareholders despite their shareholdings not reaching the threshold to be considered significant, as well as anyone representing such shareholders.
Since 2002 the appointments committee and the board of directors have made holding or representing at least 1% of the Bank’s share capital a necessary condition, though not the only condition, to be appointed a non-executive director. This percentage was established by the Bank in accordance with its self-regulatory powers and is less than that deemed significant by law, although the Bank believes it is sufficient so as to enable the board to classify directors that hold or represent a shareholding equal to or greater than such percentage as proprietary directors.
The board, taking into consideration the circumstances in question and following a report from the appointments committee, appointed Mr Javier Botín-Sanz de Sautuola y O’Shea as proprietary non-executive director to represent the following shareholders: Fundación Botín, Bafimar, S.L., Cronje, S.L., Puente de San Miguel, S.L.U., Inversiones Zulú, S.L., Latimer Inversiones, S.L., Nueva Azil, S.L., Agropecuaria El Castaño, S.L.U., Bright Sky 2012, S.L., Ms Ana Botín-Sanz de Sautuola y O’Shea, Mr Emilio Botín-Sanz de Sautuola y O’Shea, Ms Carmen Botín-Sanz de Sautuola y O’Shea, Ms Paloma Botín-Sanz de Sautuola y O’Shea, Mr Jorge Botín-Sanz de Sautuola Ríos, Mr Francisco Javier Botín-Sanz de Sautuola Ríos, Ms Marta Botín-Sanz de Sautuola Ríos and his own shareholding.
The voting rights of the aforementioned shareholders corresponded to 1.041% of the Bank’s share capital at year-end 2015.
Current composition of the board
Executive directors
4; 27%
Proprietary non-executive directors
1; 7%Non-executive
directors (neither propietaries nor
independents)2; 13%
Independent non-executive directors8; 53%

90
3. Corporate governance report2015 ANNUAL REPORT
3. Banco Santander’s board of directors
Independent non-executive directorsThe Rules and Regulations of the Board (article 6.2.c)) include the legal definition of independent director established in article 529-12.4 of the Spanish Corporate Enterprises Act.
Taking into account the circumstances in each case and following a report from the appointments committee, the board considers the following eight directors to be independent non-executive directors: Mr Bruce Carnegie-Brown (lead independent director), Ms Sol Daurella Comadrán, Mr Carlos Fernández González, Ms Esther Giménez-Salinas i Colomer, Mr Ángel Jado Becerro de Bengoa, Ms Belén Romana García, Ms Isabel Tocino Biscarolasaga and Mr Juan Miguel Villar Mir.
Given the current number of members of the board (15), independent non-executive directors account for 53% of the board.
Such percentage significantly exceeds the minimum of one-third established by article 6.1 of the Rules and Regulations of the Board and reflects the board’s goal for the board to be made up predominantly of non-executive directors, which in turn are predominantly independent, in compliance with best practices in corporate governance.
Other non-executive directorsMr Guillermo de la Dehesa Romero and Mr Ignacio Benjumea Cabeza de Vaca are non-executives directors that are neither proprietary nor independent. Neither can be classified as a proprietary director as they do not hold shareholdings equal to or greater than that which qualifies as significant under the law and have not been designated as such on account of their status as shareholders. Likewise, neither can be considered an independent director since, in the case of Mr de la Dehesa, he has held the position of director for more than 12 years and, in the case of Mr Benjumea, since 3 years have not yet elapsed since his resignation as a member of the Group’s senior management.
Therefore, following a report from the appointments committee, the board of directors has classified both as non-executive directors that are neither proprietary nor independent, in accordance with article 529-12 of the Spanish Corporate Enterprises Act and article 6.2 of the Rules and Regulations of the Board.
Diversity on the board
As established in article 17.4.a) of the Rules and Regulations of the Board, the appointments committee is responsible for proposing and reviewing the director selection policies and succession plans and the internal procedures for determining who is to be proposed for the position of director.
As regards gender diversity, both the appointments committee and the board of directors are aware of the importance of fostering equal opportunities between men and women and of the appropriateness of appointing to the board women who fulfil the requirements of ability, suitability and effective dedication to the position of director.
The appointments committee approved raising the target percentage of women serving on the board from the previous minimum of 25% to 30%, in line with good corporate governance recommendations.
At present, there are five women on the board of directors, one of whom is its Group executive chairman, Ms Ana Botín-Sanz de Sautuola y O’Shea, while the others are independent non-executive directors: Ms Sol Daurella Comadrán, Ms Esther Giménez-Salinas, Ms Belén Romana García and Ms Isabel Tocino Biscarolasaga.
The percentage of women on the Banco Santander board (33.3%) exceeds the target established by the appointments committee and is clearly higher than the average for large European listed companies. According to a study carried out by the European Commission with data from April 2015 the average percentage of female board members of large listed companies was 21.2% for all 28 countries in the European Union and 16.8% for Spain.
Years of service of independent directors
At the date of this document, the average length of service for independent non-executive directors in the position of board member is three years.
11.110.2
9.5
7.3
3.0
2011 2012 2013 2014 2015

91
3. Corporate governance report2015 ANNUAL REPORT
3. Banco Santander’s board of directors
Roles and responsibilities
Group executive chairman The Group executive chairman of the board is the Bank’s
highest-ranking officer, responsible for managing the board and ensuring its effective operation (article 48.1 of the Bylaws and article 8.1 of the Rules and Regulations of the Board). In accordance with her position as such, the Group executive chairman is responsible, among others, for the following duties:
• Ensure compliance with the Bylaws and that the resolutions of the general shareholders’ meeting and of the board of directors are faithfully executed.
• Carry out the inspection of the Bank and all its services.
• Meet with the chief executive officer and senior executive vice presidents to keep informed of the performance of the businesses.
The board of directors has delegated to the Group executive chairman all its powers, except those that cannot be delegated by law, the Bylaws or the Rules and Regulations of the Board.
The corporate strategic functions report to the Group executive chairman.
Chief executive officer The chief executive officer is entrusted with the day-to-day
management of the business and the highest executive functions (article 49.1 of the Bylaws and article 10.1 of the Rules and Regulations of the Board).
The board of directors has delegated to the chief executive officer all its powers, except those that cannot be delegated by law, the Bylaws or the Rules and Regulations of the Board.
The corporate business divisions and the corporate divisions directly related to ordinary management report to the chief executive officer.
The country heads, who are the Group’s first representatives in the countries in which the Group operates, also report to the chief executive officer.
Percentage of women on the board
33%
29%
19% 19%
11%
2011 2012 2013 2014 2015
The table below shows the number and percentage of women on the board and on each of its committees.
Number % of Number of of female female
members directors directors
Board 15 5 33.3%
Executive committee 8 2 25.0%
Audit committee 5 2 40.0%
Appointments committee 6 1 16.7%
Remuneration committee 6 2 33.3%
Risk supervision, regulation and compliance committee 7 1 14.3%
International committee 6 2 33.3%
Innovation and technology committee 8 2 25.0%
Group executive chairman and chief executive officer
There is a clear separation of duties between those of the Group executive chairman, the chief executive officer, the board, and its committees, and various checks and balances that assure proper equilibrium in the Bank’s corporate governance structure, including the following:
• The board and its committees oversee and control the activities of both the Group executive chairman and the chief executive officer.
• The lead independent director chairs the appointments, the remuneration and the risk supervision, regulation and compliance committees.
• The audit committee is chaired by an independent director.
• The powers delegated to the Group executive chairman and the chief executive officer exclude those that are exclusively reserved for the board itself.
• The Group executive chairman may not simultaneously hold the position of chief executive officer of the Bank.
• The corporate risk, compliance and internal audit functions report to a committee or a member of the board of directors and have direct access thereto.

92
3. Corporate governance report2015 ANNUAL REPORT
3. Banco Santander’s board of directors
Succession plans for the Group executive chairman and the chief executive officerSuccession planning for the main directors is a key element of the Bank’s good governance, assuring an orderly leadership transition at all times. The process is regulated by article 24 of the Rules and Regulations of the Board, which also provides for the succession plans for the Group’s other directors and senior management. The board of directors prepared skills matrix that it must have, together with a succession plan aligned with these skills that, when vacancies arise, it must reinforce. Also, at its meeting of 6 July 2015, it approved the succession planning policy for the Group’s senior executives.
Rules for interim replacement of the Group executive chairman
Article 44.2 of the Bylaws and article 9-2 of the Rules and Regulations of the Board set out interim replacement rules for the temporary performance (in cases of absence, inability to act or indisposition) of the duties of the Group executive chairman of the board of directors in the absence of the vice chairmen, in the expectation that in such cases she will be substituted by the vice chairman or vice chairmen, using the criterion of the time that they have been on the board. However, if one of the vice chairmen is the lead director, he will be the first in the order of replacement. If there are no vice chairmen, the remaining directors will replace the Group executive chairman in the order established by the board, whereby the lead director should be the first in this order if such director does not hold the position of vice chairman.
Lead director
By resolution of the general shareholders’ meeting of 28 March 2014, the figure of lead director, already established in the Rules and Regulations of the Board, has been included in the Bylaws, the responsibilities thereof being defined in article 49-2. Pursuant to that established above and article 12-2 of the Rules and Regulations of the Board, the lead director will be especially empowered to: (i) request that a meeting of the board of directors be called or that new items be added to the agenda for a meeting of the board that has already been called; (ii) coordinate and organise meetings of the non-executive directors and voice their concerns; (iii) direct the regular assessment of the chairman of the board of directors and coordinate the succession plan; (iv) contact investors and shareholders to obtain their points of view for the purpose of gathering information on their concerns, in particular, with regard to the Bank’s corporate governance; and (v) replace the chairman in the event of absence under the terms envisaged in the Rules and Regulations of the Board.
At its meeting on 25 November 2014, the board of directors appointed Mr Bruce Carnegie-Brown as vice chairman and lead director, replacing Mr Fernando de Asúa Álvarez. This appointment as director was ratified by resolution of the shareholders at the general shareholders’ meeting on 27 March 2015.
The appointment of the lead director has been made for an indefinite period of time and with the abstention of the executive directors, as provided in the Bylaws.
In a study carried out on the dedication of the directors, the firm Spencer Stuart concluded that the average time dedicated by each of the Bank’s director to the tasks of the board and its committees was 379.9 hours, against an average of 95.1 hours for the directors of the main banks in the UK (Lloyds, Barclays, Standard Chartered and HSBC), 113.5 hours for those in the US and Canada (Bank of America, Goldman Sachs, JP Morgan Chase, Citigroup, Morgan Stanley, Wells Fargo and Royal Bank of Canada), and 132.2 hours for a range of international banks (Société Générale, BNP Paribas, BBVA, Credit Suisse, Deutsche Bank, UBS, UniCredit, Intesa SanPaolo and Nordea).
Comparison of number of meetings held*
Santander
US and Canada
averageUK
average
Europe and other countries
average
Board 21 12.9 9.8 14.9
Executive committee 59 1 - 20.0
Executive risk committee** 81 - - 45.0
Audit committee 13 12.4 8.4 13.8
Appointments committee 12 7.0 4.0 5.9
Remuneration committee 10 8.3 8.6 7.8
Risk supervision, regulation and compliance committee 13 9.9 6.9 7.6
* The data for other banks refers to December 2014, the last period for which comparative information is available.
** Disbanded by the resolution of the board of 1 December 2015; the committee held its last meeting on 29 October.

93
3. Corporate governance report2015 ANNUAL REPORT
3. Banco Santander’s board of directors
Secretary of the board
The Bylaws (article 45.2) and the Rules and Regulations of the Board (article 11) include among the duties of the secretary those of ensuring the formal and substantive legality of all action taken by the board, ensuring that the good governance recommendations applicable to the Bank are taken into consideration, and ensuring that governance procedures and rules are observed and regularly reviewed.
At the annual general shareholders’ meeting scheduled for 17 or 18 March on first and second call, respectively, a proposal was put forward to amend article 45.2 of the Bylaws for the purpose of bringing its content into line with recommendation 35 of the new code of good governance for listed companies approved by resolution of the Spanish Securities Market Commission on 18 February 2015, which replaces recommendation 17 of the unified good governance code for listed companies approved by resolution of the Spanish Securities Market Commission on 22 May 2006, with reference to the fact that the secretary of the board will strive to ensure that the board of directors’ actions and decisions take into account the recommendations on good governance applicable to the company, in line with that already included in article 11 of the Rules and Regulations of the Board.
The secretary of the board is the general secretary of the Bank, and also acts as secretary for all board committees.
Mr Jaime Pérez Renovales was appointed general secretary and secretary of the board and head of the Office of the General Secretary and the Human Resources division effective as of 1 September 2015, having been previously cleared by the Bank of Spain on 30 July 2015.
The Rules and Regulations of the Board (article 17.4.e)) provide that the appointments committee must report on proposals for the appointment or withdrawal of the secretary of the board prior to submission thereof to the board.
Proceedings of the board
The board of directors held 21 meetings during 2015.
The board holds its meetings in accordance with an annual calendar and there is list of annual matters to be discussed, without prejudice to any that may arise as a result of the needs of the business. Directors may also propose the inclusion of items on the agenda. The Rules and Regulations of the Board provide that the board shall hold not less than nine annual ordinary meetings.
The board shall meet whenever the chairman so decides, acting on her own initiative or at the request of not less than three directors (article 46.1 of the Bylaws). Additionally, the lead director shall be especially authorised to request that a meeting of the board of directors be called or that new items be added to the agenda for a meeting that has already been called (articles 49-2.1 (i) of the Bylaws and 12-2 of the Rules and Regulations of the Board).
When directors are unable to personally attend a meeting, they may grant any other director proxy, in writing and specifically for each meeting, to represent them for all purposes at such meeting. Proxy is granted with instructions and non-executive directors may only be represented by another non-executive director.
The board may meet in various rooms at the same time, provided that interactivity and communication among them in real time is ensured by audiovisual means or by telephone and the concurrent holding of the meeting is thereby ensured.
Board meetings shall be validly convened when more than half of its members are present in person or by proxy.
Except in instances in which a greater majority is specifically required pursuant to legal provisions, the Bylaws or the Rules and Regulations of the Board, resolutions are adopted by absolute majority of the directors attending in person or by proxy. The chairman has the casting vote in the event of a tie.
In 2015 the board was kept continuously and fully informed of the performance of the various business areas of the Group through the management reports and risk reports submitted thereto, among others. During the year, the board has also reported on the conclusions of the external and internal audits.
The chart below shows a breakdown of the approximate time devoted to each task at the meetings held by the board in 2015.
Approximate time dedicated to each duty
Business performance30%
Capital and liquidity15%
General policies and strategies
15%
Internal and external audit and review of the financial
information 10%Risk Management30%

94
3. Corporate governance report2015 ANNUAL REPORT
3. Banco Santander’s board of directors
Dedication to board duties
One of the directors’ duties expressly established in the Rules and Regulations of the Board is that of diligent management, which, among other duties, requires that directors dedicate the necessary time and effort to their position. The maximum number of boards of directors to which they may belong is established in article 26 of Law 10/2014, of 26 June, on the organisation, supervision and solvency of credit institutions. The Bank’s directors therefore may not at the same time hold more than: (a) one executive position and two non-executive positions; or (b) four non-executive positions. For such purposes, positions held within the same group will be counted as a single position, and positions held at non-profit organisations or organisations not pursuing commercial ends will not be included. The European Central Bank may authorise a director to hold an additional non-executive position if it considers that it does not impede the proper performance of the director’s duties at the Bank.
Directors shall endeavour to ensure that absences from meetings of the board and of the committees to which they belong are reduced to cases of absolute necessity.
The appointments committee analyses directors’ dedication to their position on an annual basis, using information received regarding their other professional obligations and other available information to evaluate whether the directors are able to dedicate the necessary time and effort to complying with the duty of diligent management. Dedication is also taken into account for re-election, since proposals by the appointments committee must contain an assessment of their work and of effective dedication to the position during the most recent period of time in which the proposed director has performed his or her duties.
Training of directors and information or induction programme for new directorsAs a result of the board’s self-assessment process of 2005, an ongoing training programme for directors was implemented.
Within the framework of the Bank’s ongoing director training programme, nine sessions were held in 2015 with an average attendance of eight directors, who devoted approximately two hours to each session. Various issues were covered in depth at such meetings, including: capital requirements and assessment, liquidity, structural reforms, the EU MiFID II directive, the new regulatory system, as well as matters relating to new trends in risk appetite and operational risk.
The Rules and Regulations of the Board (article 21.7) establish that the board must make an information and induction programme available to new directors that provides swift and sufficient knowledge of the Bank and its Group, including their governance rules.
New directors therefore attended an information or induction programme specifically for new directors, which addressed the following matters:
• General presentation of the Group and the regulatory context in which it operates.
• The Group’s main regions and businesses.
• Key support areas (technology and operations, risk, audit, human resources, organisation and costs).
• Corporate governance and internal governance.
• Sustainability, communication and the Santander brand.
Decision-making process
A board of directors is aware of the business, is well balanced and has vast experience.
It takes decisions by consensus and has a long-term vision.
Debate of the issues and effective challenge by external directors.
% Of board members with relevant experience
Banking
80%
Risk
67%
Accounting and financial
LATAM
International experience
80%
60%
UK/US
67%

95
3. Corporate governance report2015 ANNUAL REPORT
3. Banco Santander’s board of directors
Self-assessment by the boardIn line with the provisions of the Rules and Regulations of the Board, the ongoing self-assessment exercise performed by the board with the support of the firm Spencer Stuart, on the basis of a questionnaire and personal interviews with the directors, includes a special section for the individual assessment of the chairman of the board, the chief executive officer and the other directors, as well as an independent assessment based, among other things, on benchmarking with respect to other comparable international banks.
The Group executive chairman led the assessment of the lead director, who in turn led that of the Group executive chairman and also the process of individual cross-assessments.
This exercise was based on a questionnaire and personal interviews with the directors and on international best corporate governance practices, as well as an independent assessment based, among other things, on benchmarking with respect to other comparable international banks.
The latest self-assessment focused on the following matters: organisation, internal trend and culture, roles and contribution of directors; composition and content of the board and its committees; comparison with other international banks; and open questions regarding the future (strategy and internal and external factors that might affect the Group’s performance) and other matters of interest.
The directors consider the following as strengths of the Group’s corporate governance: the high level of dedication and commitment of the members of the board and their involvement in the control of all types of risks, not only credit risk; the directors’ experience in and knowledge of the banking business; the balance between executive and non-executive directors, both on the board and on its committees; and the excellent operation of the board committees, particularly the executive committee. They also note the sound combination of experience, skills and knowledge among the members of the board and the high degree of diversity in respect of their skills. They also highlight the leadership of the Group executive chairman, who strives to involve all members of the board and to properly moderate discussions. Moreover, the duties of lead director are properly discharged and incorporate international best practices in good governance. The frequency and duration of the board meetings is considered to be adequate.
For the independent assessment, Spencer Stuart compared the Bank with another 23 top international financial institutions with regard to the composition and dedication of the board, the committees, remuneration and other aspects of corporate governance; the Bank ranks very highly.
The findings were presented at the board meeting of 29 September 2015.
Some specific measures or practices adopted as a consequence of the board’s self-assessment in the last few years
A more detailed succession plan for positions on the Greater involvement of the appointments committee in board, in particular those of the Group executive the process of appointing new directors.chairman and chief executive officer, established in the Rules and Regulations of the Board and reflected in the related succession plans.
Review of the Bylaws and the Rules and Regulations of the Board for the purpose of adapting the duties of some committees to applicable regulations and to best
Annual board meetings dedicated specifically to the corporate governance practices.Group’s strategy.
Improvement in board members’ relationships outside An ongoing director training programme, which has been of meetings, as well as the interaction between these implemented continuously since it was proposed in the directors and company executives.self-assessment process of 2005.
Inclusion of corporate social responsibility in the Directors have immediate access, via electronic devices, to functions of the risk supervision, regulation and all the information pertaining to the board and committees compliance committee.(calendar, agendas, presentations and minutes).
The board approved an amendment to the functions of Review of the board’s composition, incorporating the innovation and technology committee (article 17-5 of new directors with a more international profile and the Rules and Regulations of the Board of Directors), with strengthening diversity. the aim of including functions relating to the new digital
The Group executive chairman encourages debate at environment in which banking business will be developed.
board meetings, inviting directors to ask questions and present queries.

96
3. Corporate governance report2015 ANNUAL REPORT
3. Banco Santander’s board of directors
Appointment, re-election and ratification of directorsThe proposals for appointment, re-election and ratification of directors, regardless of the status thereof, that the board of directors submits to the shareholders for consideration at the general shareholders’ meeting and the appointment decisions adopted by the board itself, by virtue of the powers of co-option attributed thereto as permitted by law, must, in turn, be preceded by the corresponding report and proposal of the appointments committee.
Although the proposals of such committee are not binding, the Rules and Regulations of the Board provide that if the board does not follow them, it must give reasons for its decision.
Currently, all directors have been appointed or re-elected at the proposal of the appointments committee.
Skills matrix of the members of the board and diversity analysis*
In 2015, an external firm was commissioned to conduct an analysis of the skills and diversity of the members of the board of directors. The findings of this analysis are shown in the skills analysis below.
The findings of the analysis identified the need to strengthen skills, with profiles that specialise in new technologies, non-financial business activity, regulation and experience in certain countries (US). This was taken into consideration in the subsequent appointments and the preparation of the succession plans.
Vice chairmen Members
Cha
irm
an
CEO
Vic
e ch
airm
an 1
Vic
e ch
airm
an 2
Vic
e ch
airm
an 3
Vic
e ch
airm
an 4
Mem
ber 1
Mem
ber 2
Mem
ber 3
Mem
ber 4
Mem
ber 5
Mem
ber 6
Mem
ber 7
Mem
ber 8
Mem
ber 9
Senior management
Financial service experience
General
Banking
International diversity
International experience
Spain Latam UK/US
Others Accounting and financial
Other commercial
Risk Government/ Academic/ Research
IT/Digital Strategy Regulation/ Regulatory Relations
Corporate governance experience
Gender diversity
Skills obtained as an Executive Skills obtained as a Non-Executive Nature * Data at February 2016
Independent non-executive directors 8
Members of the board 15

97
3. Corporate governance report2015 ANNUAL REPORT
3. Banco Santander’s board of directors
Due to the vacancies left on the board by the resignations from their posts and other positions on the board presented by Mr Juan Rodríguez Inciarte and Ms Sheila C. Bair, the appointments committee commenced selection processes for new directors, with the assistance of an external firm, which drew up a list of candidates based on an assessment of the board’s capacities (using a skills matrix) to determine the profiles in line with the Group’s strategic objectives.
The committee analysed the various candidates on the list, as well as the short-listed candidates’ CVs and assessment of their skills and suitability as directors of the Bank, and proposed to the board the appointment of Mr Ignacio Benjumea Cabeza de Vaca, as a non-executive director, and Ms Belén Romana García, as an independent director, whose profiles may be consulted at the beginning of section 3 of this report. In the case of Mr Ignacio Benjumea, his appointment was based essentially on his experience and knowledge of legal and tax matters, compliance, corporate governance and regulatory matters. In assessing Ms Belén Romana’s candidacy, her financial and international experience, and the posts she has occupied in both the public and private sectors were taken into account.
The European Central Bank cleared Mr Ignacio Benjumea and Ms Belén Romana to hold the position of director of the Bank by means of the resolutions of 21 September and 19 November, respectively.
Keep remuneration
Remuneration systemAt the general shareholders’ meeting of 28 March 2014, the shareholders resolved to amend the Bylaws to bring the remuneration system for executive directors into line with the provisions contained in Royal Decree-Law 14/2013 (today Law 10/2014) and in CRD IV, such that the variable components of their remuneration may not exceed 100% of the fixed components, unless the shareholders acting at the general shareholders’ meeting approve a higher ratio, which shall in no case exceed 200%.
With relation to the foregoing, the shareholders acting at the general shareholders’ meeting of 27 March 2015 approved a maximum ratio between fixed and variable components of executive directors’ remuneration of 200% for 2015.
At the general shareholders’ meeting of 27 March 2015, the shareholders once again amended the Bylaws to bring the directors remuneration system into line with the new developments introduced in the Spanish Corporate Enterprises Act by Law 31/2014.
The remuneration of directors acting as such, whether they are executive or not, is made up of fixed annual emoluments and attendance fees, as set forth in the Bylaws, which are determined by the board of directors within the maximum amount approved by the shareholders at the general meeting based on the positions held by each director on the board, their membership on and attendance at the various committees and any other objective circumstances that the board may take into account. Accordingly, the board of directors, at the proposal of the remuneration committee, is responsible for establishing director remuneration for carrying out executive functions, taking into account for such purpose the director remuneration policy approved by the shareholders at the general meeting. The shareholders at the general meeting also approved those remuneration plans that entail the delivery of shares of the Bank or options thereon or that entail remuneration tied to the value of the shares.
Remuneration of the board in 2015Bylaw-stipulated emoluments earned by the board amounted to EUR 5.2 million in 2015, which is 13.6% lower than the maximum amount of EUR 6 million approved by the shareholders at the general shareholders’ meeting.
All details regarding the director remunaration and the director remuneration policy for 2015 may be consulted in the remuneration committee’s report that forms part of the corporate documentation of Banco Santander.
The chart below shows the evolution of total remuneration of directors with executive duties against the total return for shareholders pay for performance.
Evolution of the remuneration for all items of directors with executives duties against attributable net profit*
7,000 37.3 40
6,000 5,8165,966
35
5,000 5,351 24.7 4,37030
4,000 27.0 25
21.723.8
203,000
152,000
2,205 10
1,000 Total remuneration (mill €)Attributable net profit (mill €) 5
0 02011 2012 2013 2014 2015
* Remuneration data of executive directors and attributable net profit in millions of euros.

98
3. Corporate governance report2015 ANNUAL REPORT
3. Banco Santander’s board of directors
Anticipation of and adjustment to the regulatory frameworkAt the proposal of the remuneration committee, the board of directors promotes and encourages a remuneration system that fosters rigorous risk management, and implements ongoing monitoring of the recommendations issued by the main Spanish and international bodies with authority in this field.
Director remuneration policy and annual report on director remunerationAs provided in article 541 of the Spanish Corporate Enterprises Act and in the Bylaws (article 59-2.1), the board of directors annually approves an annual report on director remuneration, which sets forth the standards and basis for determining remuneration for the current financial year, as well as an overall summary of the application of the remuneration policy during the financial year ended, and a breakdown of the individual remuneration earned for all items by each of the directors during such year. The report is available to shareholders with the call notice for the annual general shareholders’ meeting and is submitted to a consultative vote.
The content of such report is subject to the provisions of article 10 of Order ECC/461/2013 and CNMV Circular 4/2013, of 12 June (amended by Circular 7/2015, of 22 December).
In 2015, the report corresponding to 2014 was submitted to the shareholders at the general shareholders’ meeting held on 27 March, as a separate item on the agenda and as a consultative matter, with 92.430% of the votes being in favour of the report.
The director remuneration policy for 2015 and 2016 will also be submitted for approval, on a binding basis, by the shareholders at the annual general shareholders’ meeting in accordance with article 529. novodecies of the Spanish Companies Act, having been approved with 91.7% of the votes in favour.
TransparencyPursuant to the Bylaws (article 59-2.5), the annual report includes itemised information on the remuneration received by each director, with a statement of the amounts for each item of remuneration. The report also sets forth, on an individual basis for each item, the remuneration for the executive duties entrusted to the executive directors of the Bank. All such information is contained in note 5 to the Group’s legal report.
Some measures taken by the board
2012: maximum limit for share capital increases without pre-emptive rightsAt the proposal of the board, the shareholders for the first time established a maximum limit on the power to exclude pre-emptive rights for share capital increases; pre-emptive rights may only be excluded for up to the equivalent of 20% of the Bank’s share capital as of the date of the general shareholders’ meeting.
2013: cap on annual remuneration of the directorsThe shareholders established a maximum amount of EUR 6 million, which may only be amended by a decision of the shareholders acting at the general shareholders’ meeting.
2014: maximum variable remuneration for executive directorsThe shareholders approved an amendment to the Bylaws establishing a maximum ratio between the fixed and variable components of total remuneration of the executive directors and other employees belonging to categories with professional activities that significantly affect the Group’s risk profile.
2015: changes in the remuneration policiesA series of changes were proposed at the 2016 general shareholders’ meeting, with regard to the remuneration policies for executive directors and senior management, that are in line with the new Simple, Personal and Fair Group’s culture. The main new developments with regard to the previous policy are as follows:
• Simplification: a new structure more simple for the variable and long term remuneration of executive directors.
• Alignment with the objectives announced at Investor Day held in September 2015: a new set of objectives linked to variable remuneration which includes the four categories on which the Bank’s strategy is based: employees, customers, shareholders and society.
• More alignment with the shareholders’ interests, by setting a mandatory requirement for senior executives to invest in shares and basing long-term remuneration on earnings per share, total shareholder return, capital targets and profitability.
99
3. Corporate governance report2015 ANNUAL REPORT
3. Banco Santander’s board of directors
Duties of directors, related-party transactions and conflicts of interest
DutiesThe duties of the directors are governed by the Rules and Regulations of the Board, which conform to both the provisions of current Spanish law and to the recommendations of the new good governance code for listed companies.
The Rules and Regulations expressly provide for the duties of diligent management, loyalty and inactivity in the event of knowledge of confidential information.
The duty of diligent management includes the directors’ duty to adequately inform themselves of the Bank’s progress and to dedicate the time and effort needed to effectively carry out their duties, and take the measures necessary for proper management and control of the Entity.
Related-party transactionsIn accordance with that stipulated by law, article 53 of the Bylaws and articles 3, 16 and 33 of the Rules and Regulations of the Board, the board of directors will be aware of any transactions that the company or companies of its Group carry out with directors; under the terms envisaged by law and in the Rules and Regulations of the Board; with shareholders, either individually or in concert with other shareholders, holding a significant ownership interest, including shareholders represented on the board of directors of the company or of other Group companies; or with persons related thereto.
In accordance with applicable legislation, authorisation will not be necessary in the case of transactions with standardised conditions, normal market prices and where the amount does not exceed 1% of the company’s annual income.
These transactions will require authorisation from the board, following a favourable report from the audit committee, except in those cases where by law approval is required by the shareholders at the general shareholders’ meeting. The directors affected or representing or related to the affected shareholders will refrain from participating in the deliberation and vote on the resolution in question.
Such transactions will be evaluated from the point of view of equality of treatment and of market conditions, and will be included in the annual corporate governance report and in the periodic public information under the terms envisaged in applicable regulations.
By way of exception, when advisable for reasons of urgency, related transactions may be authorised by the executive committee and subsequently ratified by the board.
The audit committee has verified that the transactions carried out with related parties during the year were compliant with all conditions set out in the Rules and Regulations of the Board of Directors and thus did not require approval from governance bodies; or obtained such approval following a positive report issued by the audit commission once the agreed terms and rest of considerations were verified to be within market parameters.
Control mechanismsAs provided in the Rules and Regulations of the Board (article 30), directors must inform the board of any direct or indirect conflict of interest with the interests of the Bank in which they may be involved, them or persons related thereto. If the conflict relates to a transaction, the director may not carry it out without the approval of the board, following a report from the audit committee.
The director involved must abstain from participating in the discussion and voting on the transaction to which the conflict refers, the body in charge of resolving any disputes being the board of directors itself.
There were 177 occasions during 2015 in which the directors abstained from participating in and voting on the discussion of matters at the meetings of the board of directors or of its committees.
The breakdown of the 177 cases is as follows: on 56 occasions the abstention was due to proposals to appoint, re-elect or withdraw directors, and to appoint members of the committees of the board or in Group companies; on 92 occasions the matter under consideration related to remuneration or granting loans or credits; on 20 occasions the matter concerned the discussion of financing proposals or other risk transactions in favour of companies related to various directors; on seven occasions the abstention concerned the annual verification of the status of the directors carried out by the appointments committee, pursuant to article 6.3 of the Rules and Regulations of the Board; and on two occasions, the matter was to approve a related-party transactions.

100
3. Corporate governance report2015 ANNUAL REPORT
3. Banco Santander’s board of directors
Committees of the board
General informationThe board has set up an executive committee to which general decision-making powers are delegated.
The board also has other committees with powers of supervision, information, advice and proposal (the audit, appointments, remuneration, risk supervision, regulation and compliance, international, and innovation and technology committees).
The committees of the board hold their meetings in accordance with an annual calendar and there is a suggested list of annual matters to be discussed for committees with supervisory powers.
The board is entrusted with fostering communication between the different committees, and particularly between the risk supervision, regulation and compliance committee and the audit committee, as well as between the former and the remunerations committee.
In 2015 the delegate risk committee was disbanded as a result of the Bank’s new risk governance model and the regulations of the innovation and technology committee were amended in accordance with the terms detailed in this section.
At the annual general shareholders’ meeting scheduled for 17 or 18 March on first and second call, respectively, a proposal was put forward to amend articles 53, 54, 54-2 and 54-3 in order to increase the maximum number of members of the audit, the appointments, the remuneration and the risk supervision, regulation and compliance committees from the current seven directors to a maximum of nine directors for the purpose of giving the board of directors more flexibility in establishing the adequate composition for these committees at any given time.
Executive committeeThe executive committee is a basic instrument for the corporate governance of the Bank and its Group. It exercises by delegation all the powers of the board (except those which cannot be delegated pursuant to the law, the Bylaws or the Rules and Regulations of the Board). It reports to the board on the principal matters dealt with and resolutions adopted and provides directors with a copy of the minutes of its meetings. It generally meets once a week and in 2015 it held 59 meetings.
There are currently eight directors sitting on the committee, four of whom are executive and the other four are non-executive, two of which are independent.
Its duties, composition and functioning are established in the Bylaws (article 51) and in the Rules and Regulations of the Board (article 14).
Audit committeeThe audit committee, among other duties, reviews the Group’s financial information and its internal control systems, serves as a communication channel between the board and the external auditor, ensuring the independent exercise of the latter’s duty, and supervises work regarding the Internal Audit function. It normally meets on a monthly basis and met 13 times in 2015.
As provided in the Bylaws (article 53) and the Rules and Regulations of the Board (article 16), the committee must be made up of non-executive directors, the majority of whom must be independent, with an independent director acting as chairman.
The committee is currently made up of five independent non-executive directors.
Appointments committeeThe appointments committee, among other duties, proposes the appointments of members of the board, including executive directors, and those of the other members of senior management and the Group’s key personnel.
The Bylaws (article 54) and the Rules and Regulations of the Board (article 17) provide that this committee is also to be made up exclusively of non-executive directors and that its chairman and the majority of its members must be independent directors.
The committee met on 12 occasions in 2015.
The committee is currently made up of six non-executive directors, four of which are independent.

101
3. Corporate governance report2015 ANNUAL REPORT
3. Banco Santander’s board of directors
Remuneration committeeAmong other duties, the remuneration committee proposes the director remuneration policy to the board, drawing up the corresponding report, and proposes the remuneration of the board members, including executive directors, and that of the other members of senior management and the Group’s key personnel, also proposing the remuneration policy for the senior management.
The Bylaws (article 54-2) and the Rules and Regulations of the Board (article 17-2) provide that this committee is also to be made up exclusively of non-executive directors and that its chairman and the majority of its members must be independent directors.
The committee met on 10 occasions in 2015.
The committee is currently made up of six non-executive directors, four of which are independent.
Risk supervision, regulation and compliance committeeThe risk supervision, regulation and compliance committee, among other duties, supports and advises the board on the definition and assessment of the risk strategy and policies and on its relationship with authorities and regulators in the various countries in which the Group has a presence, assists the board with its capital and liquidity strategy, and monitors compliance with the General Code of Conduct and, in general, with the Bank’s governance rules and compliance and criminal risk prevention programmes. Matters such as sustainability, communication and relationships with the Bank’s stakeholders, as well as matters regarding corporate governance and regulation, are also discussed at committee meetings.
The committee met on 13 occasions in 2015.
As provided in the Bylaws (article 54-3) and the Rules and Regulations of the Board (article 17-3, the committee must be made up of non-executive directors, the majority of whom must be independent, with an independent director acting as chairman.
The committee is currently made up of seven non-executive directors, five of which are independent.
The role of the committees was strengthened and their functions widened. Plans were made for joint meetings to be held in order to address matters subject to examination by more than one committee.

102
3. Corporate governance report2015 ANNUAL REPORT
3. Banco Santander’s board of directors
International committeePursuant to article 17-4 of the Rules and Regulations of the Board, the international committee must: (i) monitor the development of the Group’s strategy and of the activities, markets and countries in which the Group desires to have a presence through direct investments or specific transactions, keeping informed of the commercial initiatives and strategies of the various units within the Group and of the new projects presented thereto; and (ii) review the performance of the financial investments and businesses, as well as the international economic situation in order to make corresponding proposals, where applicable, in order to adjust the risk-country limits, its structure and return and its assignment by businesses and/or units.
This committee is made up of six directors, of whom three are executive and three are non-executive, one of which is independent.
Innovation and technology committeeGiven the importance assigned to innovation and technology as a strategic priority for the Group, the regulations of the Innovation and technology committee have been amended to raise to eight the maximum number of members. The committee’s duties have also been extended pursuant to board resolutions dated 29 September 2015 and 26 January 2016, respectively. In addition, article 17-5 of the Regulations of the Board of directors has therefore been duly amended. These amendments were entered in the Cantabria Companies’ Registry on 13 October and 4 February 2016, respectively.
The innovation and technology committee is responsible, among other functions for: (i) studying and reporting on relevant projects in innovation and technology; (ii) assisting the board in evaluating the quality of the technological service; new business models, technologies, systems and platforms; and (iii) assisting the commission in overseeing risk, regulation and compliance with the monitoring requirements for technological and safety risks, and overseeing the management of cybersecurity.
This committee is made up of eight directors, of whom four are executive and four are non-executive, two of which are independent.
Improvements were made to the functioning of the board and its committees. These include the use of devices and technological tools in order to make the documents relating to each item on the agenda available to the board members, thereby enhancing their knowledge of the matters to be addressed, the related debates, and their ability to challenge any proposals made by the directors.
In accordance with the Rules and Regulations of the Board, any director may attend meetings of board committees of which the director is not a member, with the right to participate but not to vote, at the invitation of the chairman of the board and of the respective committee, and by prior request to the chairman of the board.
Additionally, all board members who are not also members of the executive committee may attend its meetings, whatever the chairman’s reason is for calling such meeting. In 2015, nine directors not forming part of the executive committee each attended an average of seven meetings thereof.
The audit, appointments, remuneration and risk supervision, regulation and compliance committees have prepared reports on their activities in 2015. The remuneration committee’s report also includes the director remuneration policy. All such reports are made available to shareholders as part of the Bank’s annual documentation for 2015.

103
3. Corporate governance report2015 ANNUAL REPORT
3. Banco Santander’s board of directors
Composition of the committees of the board
Executive Non executive
Executive committee Audit committee Appointments committee Remuneration committee
50% 50% 100% 100% 100%
Risk supervision, regulation and Innovation and compliance committee
100%
International committee technology committee
50%50% 50% 50%
Number of meetings and duration of committees
Committees No. of meetings Hours1
Executive committee 59 295
Executive risk committee2 81 243
Audit committee 13 52
Appointments committee 12 36
Remuneration committee 10 30
Risk supervision, regulation and compliance committee 13 52
International committee - -
Innovation and technology committee - -
1. Estimated average hours devoted by each director.
2 Disbanded by the resolution of the board of 1 December 2015; the committee held its last meeting on 29 October.
Attendance at meetings of the board of directors and its committees in 2015
Pursuant to the Rules and Regulations of the Board (article 20.1), absences from meetings must be limited to unavoidable cases. The average attendance rate at board meetings in 2015 was 92.83%.
Rate of attendance at board meetings%
91.5
2011
98.4
2012
91.0
2013
89.8
2014
92.8
2015

104
3. Corporate governance report2015 ANNUAL REPORT
3. Banco Santander’s board of directors
Committees
Decision-making Advisory Reportinga
Directors Boa
rd
Exec
utiv
e
Exec
utiv
e ri
skb
Aud
it
App
oint
men
ts
Rem
uner
atio
n
Ris
k su
perv
isio
n,
regu
lati
on a
nd
com
plia
nce
Inno
vati
on a
nd
tech
nolo
gy
Inte
rnat
iona
l
Average attendance 92.83% 90.89% 78.44% 97.96% 92.86% 90.57% 96.39% – –
Individual attendance
Ms Ana Botín-Sanz de Sautuola y O´Shea 21/21 52/59
Mr José Antonio Álvarez Álvarez1 19/19 52/56 23/67
Mr Bruce Carnegie-Brown2 17/17 40/51 9/9 9/9 12/12
Mr Rodrigo Echenique Gordillo 20/21 53/59 50/81 2/2 1/1 0/0
Mr Matías Rodríguez Iniciarte 21/21 57/59 81/81
Mr Guillermo de la Dehesa Romero 21/21 54/59 4/4 11/12 9/10 11/11
Mr Ignacio Benjumea Cabeza de Vaca3 4/4 16/16 11/11 3/3 4/4 3/3
Mr Javier Botín-Sanz de Sautuola y O´Shea 14/21
Ms Sol Daurella Comadrán4 15/17 6/8 6/9
Mr Carlos Fernández González2 15/17 11/11 7/8 10/11
Ms Esther Giménez-Salinas i Colomer 19/21
Mr Ángel Jado Becerro de Bengoa 21/21 62/67 10/11 8/8 8/9 13/13
Ms Belén Romana García5 1/1 0/0
Ms Isabel Tocino Biscarolasaga 21/21 57/59 79/81 11/11 10/10 11/11
Mr Juan Miguel Villar Mir 19/21 10/10 10/11
Mr Javier Marín Romano6 0/2 1/2
Mr Fernando de Asúa Álvarez7 4/4 7/8 11/11 1/1 3/3 1/1 1/1
Mr Abel Matutes Juan8 3/4 1/1 3/3
Mr Juan Rodríguez Inciarte9 15/15 36/51
Ms Sheila C. Bair10 15/18 9/10
a. No meetings were held in 2015.
b. Disbanded by resolution of the board on 1 December 2015 and held its last meeting on 29 October. Against this backdrop, two internal non-statutory committees were created: the executive risk committee (which replaces the delegate risk committee of the board) and the risk control committee. The executive committee devoted a very significant amount of its time to discussions on risks.
1. Director since 13 January 2015.
2. Director since 12 February 2015.
3. Director since 21 September 2015.
4. Director since 18 February 2015.
5. Director since 22 December 2015.
6. Withdrawal from position of director effective 12 January 2015.
7. Withdrawal from position of director effective 12 February 2015.
8. Withdrawal from position of director effective 18 February 2015.
9. Withdrawal from position of director effective 30 June 2015.
10. Withdrawal from position of director effective 1 October 2015.

105
2015 ANNUAL REPORT3. Corporate governance report4. Shareholder rights and the general shareholders’ meeting
4. Shareholder rights and the general shareholders’ meeting
One share, one vote, one dividend. No control-enhancing mechanisms foreseen in the Bylaws
The Bank’s Bylaws do not establish any control-enhancing mechanisms, fully conforming to the principle of one share, one vote, one dividend.
The Bylaws of Banco Santander provide for only one class of shares (ordinary shares), granting all holders thereof the same rights.
There are no non-voting or multiple-voting shares, or preferences in the distribution of dividends, or limitations on the number of votes that may be cast by a single shareholder, or quorum requirements or qualified majorities other than those established by law.
Any person is eligible for the position of director, subject only to the limitations established by law.
Quorum at the annual general shareholders’ meeting held in 2015
The informed participation of shareholders at general shareholders’ meetings is an objective expressly acknowledged by the board (article 31.3 of the Rules and Regulations of the Board).
The quorum at the 2015 annual general shareholders’ meeting was 59.724%, continuing a trend of improvement in the last years.
Quorum at annual general shareholders’ meetings
2012
54.9%
2013
55.9%
2014 2015
58.8% 59.7%
2011
53.7%
Encouragement of informed participation of shareholders at general shareholders’ meetings
The Bank continues to implement measures designed to encourage the informed participation of shareholders at general shareholders’ meetings. Since the annual general meeting held in 2011, shareholders have had access to an electronic shareholders’ forum, in compliance with the provisions of the Spanish Corporate Enterprises Act.
Such forum, which the Bank made available on the Group’s corporate website (www.santander.com), enables shareholders to post supplementary proposals to the agenda announced in the call notice, requests for support for such proposals, initiatives aimed at reaching the percentage required to exercise minority shareholder rights contemplated by law, such as offers or requests to act as a voluntary proxy.
Furthermore, remote attendance at the shareholders’ meetings was made possible, thereby enabling shareholders to exercise their information and voting rights remotely and in real time.
Key points of the 2015 annual general shareholders’ meeting
Shareholders approved the corporate management of the Bank in 2014 with a 95% favourable vote.
The 2014 annual report on director remuneration received a 92% favourable vote.

106
3. Corporate governance report2015 ANNUAL REPORT
4. Shareholder rights and the general shareholders’ meeting
Annual general shareholders’ meeting held on 27 March 2015
Information on the call notice, establishment of a quorum, attendance, proxy-granting and votingA total of 471,628 shareholders attended in person or by proxy, with 8,397,610,313 shares. The quorum was thus 59.724% of the Bank’s share capital at the date of the annual general shareholders’ meeting.
The shareholders acting at the general shareholders’ meeting approved the corporate management of the Bank in 2014 with a 95.024% favourable vote.
The average percentage of affirmative votes upon which the proposals submitted by the board were approved was 93.712%.
The following data are expressed as percentages of the Bank’s share capital at the date of the annual general shareholders’ meeting:
Physically present 0.354%1
By proxy 43.442%2
Absentee votes 15.929%3
Total 59.724%
1. Of such percentage (0.354%), 0.003% is the percentage of share capital that attended by remote means through the Internet.
2. The percentage of share capital that granted proxies through the Internet was 0.903%.
3. Of such percentage (15.929%), 15.712% corresponds to the votes cast by post, and the rest is the percentage of electronic votes.
At that meeting, nine of the board’s fifteen directors at that date exercised, in accordance with article 186 of the Spanish Corporate Enterprises Act, the right to vote on behalf of a total of 5,963,432,540 shares, equivalent to the same number of votes, the breakdown being as follows:
Ms Ana Patricia Botín-Sanz de Sautuola y O’Shea 5,829,121,951
Mr José Antonio Álvarez Álvarez 35,865
Mr Francisco Javier Botín-Sanz de Sautuola y O’Shea 127,872,267
Mr Ángel Jado Becerro de Bengoa 5,100,000
Mr Matías Rodríguez Inciarte 789,693
Mr Juan Miguel Villar Mir 90,549
Ms Isabel Tocino Biscarolasaga 187,862
Mr Guillermo de la Dehesa Romero 225,647
Ms Sol Daurella Comadrán 8,706
Resolutions adopted at the general shareholders’ meeting held in 2015The full texts of the resolutions adopted at the general shareholders’ meeting held in 2015 are available on the websites of both the Group (www.santander.com) and the CNMV (www.cnmv.es).
Information provided to shareholders and communication with themIn 2015 Banco Santander continued to strengthen communication with, service to and its relationship with shareholders and investors.
Channels for shareholder information and service
Telephone service lines
241,553 queries received
Shareholder’s mailbox 42,805 e-mails answered
Personal actions 22,336 actions carried out
During 2015, there were 450 meetings with investors, analysts and rating agencies, which entailed contact with 829 investors/analysts. In addition, the Shareholders Relations area maintained direct contact with the Bank’s shareholders throughout the financial year to disseminate information regarding the Group’s policies relating to sustainability and governance. The Group’s Investor Day was organised in London in September. Over the span of two days senior executives analysed and communicated the outlook, Banco Santander’s strategic vision and objectives for 2018 and its main business units to the investors. More than 350 people, including the Group’s main analysts and investors, attended these sessions at Investor Day.
Finally, in compliance with the recommendations of the CNMV, both call notices of the meetings with analysts and investors and the documentation to be used thereat are published sufficiently in advance.
Policy for communications and contact with shareholders
The board of directors of the Bank approved a policy for communication and contact with shareholders, institutional investors and proxy advisors, which is published on the Group’s corporate website (www.santander.com). In this policy, the general principles governing communication and contacts between the Bank and its shareholders, institutional investors and proxy advisors are laid out. In addition, it defines the main channels and procedures for improving the services provided by the bank to these stakeholders and its relationship with same. In accordance with the principles of transparency, equal treatment and protection of the interests of shareholders and within the framework of the new Simple, Personal and Fair culture, the Bank makes available to its shareholders and investors the information and communication channels detailed in the Shareholder section of this annual report.
Communication between the board and shareholders and investors has been stepped up through the Investors Day and the corporate governance road shows carried out by the lead director.
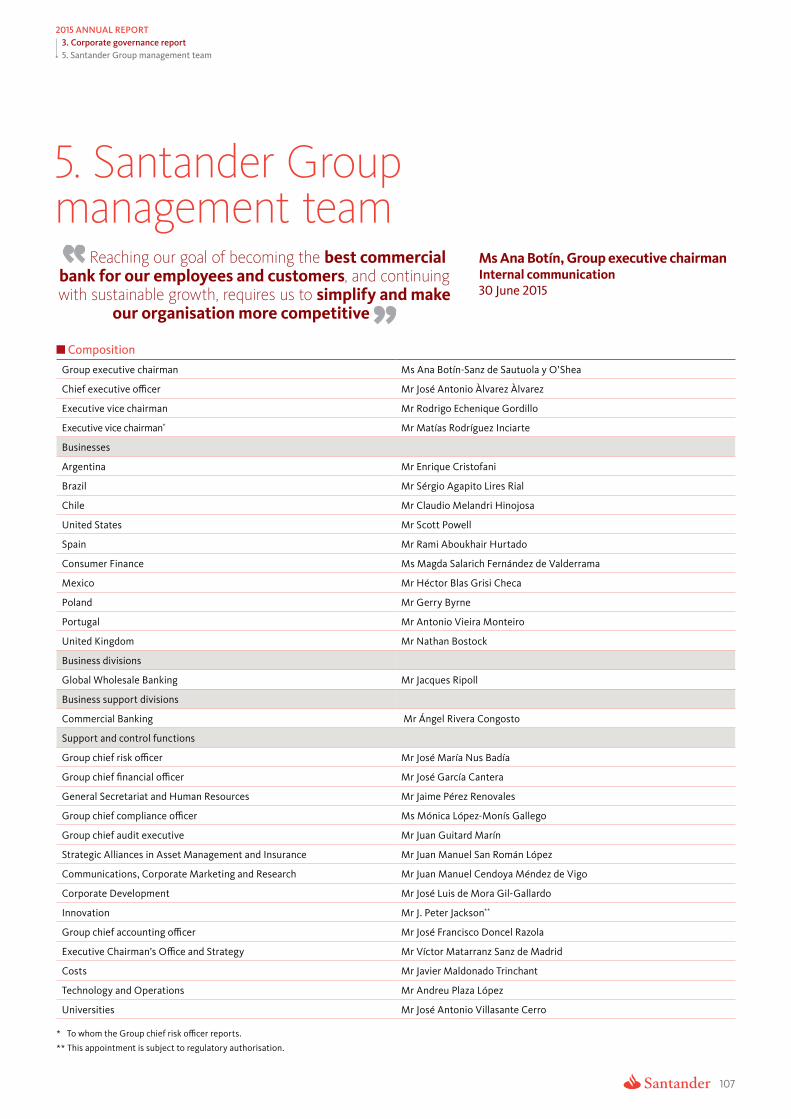
107
3. Corporate governance report2015 ANNUAL REPORT
5. Santander Group management team
5. Santander Group management team
Reaching our goal of becoming the best commercial bank for our employees and customers, and continuing with sustainable growth, requires us to simplify and make
our organisation more competitive
Ms Ana Botín, Group executive chairmanInternal communication30 June 2015
Composition
Group executive chairman Ms Ana Botín-Sanz de Sautuola y O’Shea
Chief executive officer Mr José Antonio Àlvarez Àlvarez
Executive vice chairman Mr Rodrigo Echenique Gordillo
Executive vice chairman* Mr Matías Rodríguez Inciarte
Businesses
Argentina Mr Enrique Cristofani
Brazil Mr Sérgio Agapito Lires Rial
Chile Mr Claudio Melandri Hinojosa
United States Mr Scott Powell
Spain Mr Rami Aboukhair Hurtado
Consumer Finance Ms Magda Salarich Fernández de Valderrama
Mexico Mr Héctor Blas Grisi Checa
Poland Mr Gerry Byrne
Portugal Mr Antonio Vieira Monteiro
United Kingdom Mr Nathan Bostock
Business divisions
Global Wholesale Banking Mr Jacques Ripoll
Business support divisions
Commercial Banking Mr Ángel Rivera Congosto
Support and control functions
Group chief risk officer Mr José María Nus Badía
Group chief financial officer Mr José García Cantera
General Secretariat and Human Resources Mr Jaime Pérez Renovales
Group chief compliance officer Ms Mónica López-Monís Gallego
Group chief audit executive Mr Juan Guitard Marín
Strategic Alliances in Asset Management and Insurance Mr Juan Manuel San Román López
Communications, Corporate Marketing and Research Mr Juan Manuel Cendoya Méndez de Vigo
Corporate Development Mr José Luis de Mora Gil-Gallardo
Innovation Mr J. Peter Jackson**
Group chief accounting officer Mr José Francisco Doncel Razola
Executive Chairman’s Office and Strategy Mr Víctor Matarranz Sanz de Madrid
Costs Mr Javier Maldonado Trinchant
Technology and Operations Mr Andreu Plaza López
Universities Mr José Antonio Villasante Cerro
* To whom the Group chief risk officer reports.
** This appointment is subject to regulatory authorisation.

108
3. Corporate governance report2015 ANNUAL REPORT
5. Santander Group management team
Remuneration
Information on the remuneration of senior executive vice presidents is provided in note 5 to the Group’s legal report.
Related-party transactions
To the Bank’s knowledge, no member of senior management who is not a director, no person represented by a member of senior management who is not a director, and no company in which such persons or persons with whom they act in concert or who act through nominees therein are directors, members of senior management or significant shareholders, has carried out any unusual or significant transaction therewith during 2015 and through the date of publication of this report.
Conflicts of interest
The control mechanisms and the bodies in charge of resolving this type of situation are described in the Code of Conduct in Securities Markets, which is available on the Group’s corporate website (www.santander.com).

109
3. Corporate governance report2015 ANNUAL REPORT
6. Transparency and independence
6. Transparency and independenceSantander has been included in the FTSE4Good and DJSI indexes since 2003 and 2000, respectively, and its corporate governance model is recognised by socially responsible investment indexes.
Financial information and other relevant information
Financial informationPursuant to the provisions of its Rules and Regulations (article 34.2), the board has taken the necessary actions to ensure that the quarterly and half-yearly information and any other information made available to the markets is prepared following the same principles, standards and professional practices as are used to prepare the financial statements. To such end, this information is reviewed by the audit committee prior to being released.
The financial statements are reported on by the audit committee and certified by the head of financial accounting prior to the authorisation for issue thereof by the board.
Other relevant informationPursuant to the provisions of the Code of Conduct in Securities Markets, the Compliance area is responsible for informing the CNMV of the relevant information generated in the Group.
Such communication is simultaneous to the release of relevant information to the market or to the media and occurs as soon as the decision in question is made or the resolution in question has been signed or carried out. Relevant information shall be disseminated in a true, clear, complete and equitable fashion and on a timely basis and, whenever practicable, such information shall be quantified.
In 2015, the Bank published 100 material facts, which are available on the websites of the Group (www.santander.com) and the CNMV (www.cnmv.es).
Relationship with the auditor
Independence of the auditorThe shareholders at the 2015 annual general shareholders’ meeting approved the re-election of Deloitte, S.L. as auditor for one year, with the affirmative vote of 94.287% of the share capital present in person or by proxy.
The Bank has the necessary mechanisms in place to preserve the independence of the external auditor, and its audit committee verifies that the services provided by this auditor comply with applicable legislation.
In addition, the Rules and Regulations of the Board establish limits upon hiring the audit firm for the provisions of services other than audit services that could jeopardise the independence thereof, and impose on the board the duty to make public the overall fees paid by the Bank to the auditor for services other than audit services. The information for 2015 is contained in note 48 to the Group’s legal report.
The Rules and Regulations of the Board determine the mechanisms to be used to prepare the accounts such that there is no room for qualifications in the auditor’s report. Nevertheless, the Bylaws and the Rules and Regulations also provide that, whenever the board believes that its opinion must prevail, it shall provide an explanation, through the chairman of the audit committee, of the content and scope of the discrepancy and shall endeavour to ensure that the auditor issue a report in this regard. The financial statements of the Bank and of the consolidated Group for 2015 are submitted without qualifications.
At its meeting of 10 February 2016, the audit committee received written confirmation from the external auditor of its independence in respect of the Bank and the entities directly or indirectly related thereto, as well as information regarding additional services of any kind provided to such entities by the auditors or by entities related thereto, in accordance with that provided in legislation governing financial audits.
The committee, at this meeting of 10 February 2015, issued a report expressing a favourable opinion regarding the independence of the external auditors and reporting, among other matters, on the provision of additional services as mentioned in the preceding paragraph.
This report, issued prior to the auditor’s report on the financial statements, includes the content required under article 529-14 of the Spanish Corporate Enterprises Act and may be viewed on the Group’s website (www.santander.com).

110
3. Corporate governance report2015 ANNUAL REPORT
6. Transparency and independence
The Bylaws, the Rules and Regulations for the General Shareholders’ Meeting and the Rules and Regulations of the Board were amended to bring them into line with both regulatory changes and best practices in corporate governance.
Proposal for a new external auditorAt its meeting on 6 July 2015, the board of directors chose PricewaterhouseCoopers Auditores, S.L. (PwC) as the external auditor of Banco Santander and its consolidated Group to audit the financial statements for 2016, 2017 2018. This decision was taken in accordance with the corporate governance recommendations regarding the rotation of the external auditor, at the proposal of the audit committee and as a result of a selection process conducted with full transparency, independence and objectivity, involving the leading audit firms present in the markets where the Group operates. The audit committee was actively involved in designing and conducting this process and was notified of its progress on a regular basis, as well as the plans to ensure that PwC complied with the regulatory requirements with regard to independence and incompatibility and to ensure a smooth transition between the external auditors with the least possible impact on the Group’s daily activities and on the quality of the financial information.
The board will propose this appointment at the annual general shareholders’ meeting scheduled for 17 or 18 March on first and second call, respectively.
Intra-group transactions
There were no intra-group transactions in 2015 that were not eliminated in the consolidation process and that are not part of the ordinary course of business of the Bank or of the Group companies as regards the purpose and conditions thereof.
Group’s corporate Website
Since 2004, the Group’s corporate website (www.santander.com) has disclosed, in the Information for shareholders and investors Relations section of the main menu, all information required under applicable law (basically, the Spanish Corporate Enterprises Act, Order ECC/461/2013, of 20 March and CNMV Circular 3/2015, of 23 June).
The content of the Group’s website, which is presented with specific sections for institutional investors and shareholders and is accessible in Spanish, English and Portuguese, receives approximately 165,000 visits per week.
The information available on such website includes:
• The Bylaws.• The Rules and Regulations for the General Shareholders’ Meeting.• The Rules and Regulations of the Board.• The composition of the board and its committees.• Professional profiles and other information on the directors.• The annual report.• The annual corporate governance report and the annual report on
director remuneration.• The Code of Conduct in Securities Markets.• The General Code of Conduct.• The sustainability report.• The reports of the board committees.• Pillar III disclosures report.
The call notice for the 2016 annual general shareholders’ meeting may be viewed as from the date of publication thereof, together with the information relating thereto, which shall include the proposed resolutions and mechanisms for exercising rights to receive information, to grant proxies and to vote, including an explanation of the mechanisms for exercising such rights by means of data transmission and the rules applicable to the electronic shareholders’ forum that the Bank will make available on the Group’s corporate website (www.santander.com).
New good governance code for listed companiesBanco Santander follows the recommendations concerning corporate governance in the new good governance code for listed companies.
Banco Santander follows the good governance recommendations and best practices for credit institutions, such as the corporate governance principles for banks of the Basel Committee and the recommendations of the Organisation for Economic Co-operation and Development (OECD), and also takes into account the good governance codes of the stock markets on which its shares are listed.

111
3. Corporate governance report2015 ANNUAL REPORT
7. Challenges for 2016
7. Challenges for 2016
The board’s goals for 2016 with regard to corporate governance are as follows:
Promote the culture and corporate values of Improve board members’ relationships Simple, Personal and Fair, ensure the entire outside of meetings, especially non-organisation is aware of these values. executive directors, as well as the
interaction between these directors and Consolidate the governance model to strengthen the relationship between the
company executives.
Parent Bank and the subsidiaries, especially Promote communication between the with regard to corporate governance, various committees, especially between ensuring its gradual implementation the risk supervision, regulation and throughout the Group’s main geographical compliance committee and the audit areas. The board of directors will also be committee, as well as between the responsible for ensuring there is a clear audit committee and the remuneration governance framework that is suitable committee, and schedule joint meetings for the structure, businesses and risks of whenever necessary.the Group and the entities that form part thereof, respecting the local legislation of each of the units.


4Economic and financial review
114 Consolidated financial report 114 2015 summary of
Santander Group 116 Santander Group results 122 Santander Group balance sheet
129 Geographic businesses 132 Continental Europe 146 United Kingdom 149 Latin America 163 United States 166 Corporate centre
168 Global businesses 168 Retail and commercial banking 171 Global Corporate Banking

114
2015 annual rEport4. Economic and financial reviewSummary
ConsolidatedFinancial Report
Grupo Santander 2015 summary
Developed economies continued to show signs of recovery in 2015.Emerging countries, however, grew more moderately because oftheir internal dynamics as well as lower commodity prices andChina’s slowdown.
The markets were also very volatile, with share prices plunging in thesecond half of the year and emerging market currencies depreciatingagainst the euro and particularly against the dollar. This depreciationwas very intense in Brazil for several months.
The banking environment is challenging. As well as this evolution,interest rates were extraordinarily low in developed countries,business volumes grew at a slow pace, competition from banks andnon-banks was tough and the regulatory environment demanding.
In this context, the Group’s performance during 2015 was positive, aswe were able to combine the development of the commercialtransformation process with achieving the goals we set at the startof the year. We grew in volumes and profit, accumulated capital andincreased the cash dividend.
The highlights in 2015 were:
Strong results. Santander faced these challenges with a businessmodel that has proven its strength in the last few years and whichwe are adapting to the new environment, in order to maximiseprofitability levels.
The Santander model, which showed its validity during the crisis, hastwo main pillars:
– Santander is a big but simple bank. Our diversification isunique, 97% of our underlying profit is generated in ninecountries and in Santander Consumer Finance in Europe. Ourmanagement focus is tailored to each market, and oursubsidiaries, autonomous in capital and liquidity, have thecritical mass to be among the three top players in each marketand generate shareholder value.
– We have a Corporate Centre that contributes value and enables usto attract talent, share best practices and best-in-class informationand control systems. The centre will continue to add value in thefuture and will do so even more efficiently.
As a result of all this, Grupo Santander posted an underlyingattributable profit of €6,566 million, 13% more than in 2014, backed by:
• Consistent and recurring growth in commercial revenues quarterafter quarter, enabling us to generate record net interest incomeand gross income.
• Control of costs and operational excellence. Costs grew by only 1%in real terms and on a like-for-like basis.
• Reduced provisions and a lower cost of credit, reflecting thestrategy in growth and an adequate risk management policy.
We also recorded a net charge of €600 million of non-recurringpositive and negative results, which left the final attributable profit3% higher at €5,966 million.
Commercial transformation process. We continued in 2015 totransform our commercial model and make it more Simple, Personaland Fair. The focus is on our individual customers and companies,and our efforts are aimed at developing specialized models, rangesof simple products and global proposals that cover all their needs,anticipating them and gaining their confidence.
There was a significant improvement in customer loyalty and in long-term relationships, strongly supported by differential value offersand their expansion to all countries, sharing the best practices.Examples of this are:
– Launch of the 1|2|3 strategy in Spain, following its success in the UKand Portugal, and similar products in Poland and Germany. In thehigh-income segment, we launched products and services such asSelect Premium Portfolios in Germany and Select Expat in Mexico.
– In SMEs and companies, global proposals to reinforce our support ofthis segment: Santander Advance is now installed in eight countries,Santander Trade is available in 12 countries with more than 30,000exporter and importer users, International Desk, Santander Passportand the new 1|2|3 pymes current account in Spain.
We gave a big push to multi channels, particularly thedevelopments in digital channels and the openinf of new branches,which are key for the transformation process. Innovation and

115
2015 annual rEport4. Economic and financial reviewSummary
technological development constitute a strategic pillar of the Group,in order to respond to the new challenges from the digital revolutionand focus on operational excellence and the customer experience.
We improved the commercial websites, as well as launching newapps and developments for mobile phones such as, for example,Cash KiTTi and Spendlytics in the UK, and the new Deposit Capturefunctionality for mobile phones in the US. Also noteworthy weresome initiatives in intelligent watches such as the participation inthe UK and Spain in the first group of Apple Pay issuers.
Equally important was the simplification of processes and products,implementation of a new commercial front with 360º vision in manyof the countries, latest generation ATMs and opening so-calledoffices of the future.
Branches will continue to be a significant channel for customers and theBank, and will be more dedicated to selling products of greatercomplexity and offering advisory services, and more digitally integrated.
These improvements in the commercial transformation processwere reflected in increases in customer loyalty and digitisation . Thenumber of loyal customers increased 10% to 13.8 million (+1.2million) and digital clients rose 17% to 16.6 million (+2.5 million).These improvements are already producing revenue growth.
Business growth. The commercial activity and greater loyalty werereflected in growth in loans and customer funds.
Nine of the 10 main units increased their lending to individualcustomers as well as to SMEs and big companies. All countries grewin funds, while maintaining the strategy of cutting the funding cost(reflected in growth in demand deposits and mutual funds andreduction in time deposits).
Strengthened solvency. We met the goal set for capital, despite theextraordinary negative impacts. Our CET1 fully loaded ratio was10.05% at the end of 2015, demonstrating our capacity to generatecapital organically (about 10 b.p. per quarter).
Furthermore, in regulatory terms, we ended the year with CET1 of12.55%, 280 b.p. above the minimum requirement set by theEuropean Central Bank for 2016.
On 3 February 2016, the European Central Bank authorised the use ofthe Alternative Standardised Approach to calculate the capitalrequirements at consolidated level for operational risk at BancoSantander (Brasil) S.A. The impact of the aforementionedauthorisation on the Group’s risk-weighted assets (EUR -7,836million) and, in consequence, on its capital ratios, was not taken intoaccount in the data published on 27 January 2016, which are thosepresented in this report.
Enhanced credit quality. The year was good in terms of creditquality, as the Group’s main indicators improved. The NPL ratio was83 b.p. lower at 4.36%, coverage rose 6 p.p. to 73% and the cost ofcredit dropped to 1.25%.
This positive evolution was registered in almost all countries,reflecting the change of mix to lower risk products in somecountries, as well as an adequate risk management policy that we arereinforcing with the launch of the Advanced Risk Management(ARM) programme.
Creation of shareholder value. We continue to offer an attractiveshareholder return.
On the basis of the underlying profit, the Group’s RoTE in 2015 wasclose to 11.0%, higher than the sector average. We also improved theGroup’s RoRWA a little to 1.30%.
Tangible book value per share increased 3% on a like-for-like basis,which was compatible with distributing a cash dividend of more than€2,200 million, charged to 2015 results.
The Bank’s dividend yield was 4.4% based on the year-end shareprice.
Exchange rates: 1 euro / currency parity
2015 2014
Period-end Average Period-end Average
US$ 1.089 1.109 1.214 1.326
Pound sterling 0.734 0.725 0.779 0.806
Brazilian real 4.312 3.645 3.221 3.118
Mexican peso 18.915 17.568 17.868 17.647
Chilean peso 773.772 724.014 737.323 756.718
Argentine peso 14.140 10.207 10.277 10.747
Polish zloty 4.264 4.182 4.273 4.185

2015 annual rEport4. Economic and financial reviewConsolidated financial information
Grupo Santander. Income statement
Attributable profit of €5,966 million, 3% more than in 2014, after absorbing a charge of €600 million (the net between non-recurringpositive and negative items).
Underlying attributable profit rose 13% to €6,566 due to:
• Consistent and recurring growth of commercial revenues quarter after quarter, excluding the exchange rate impact.
• Costs control and operational excellence. Efficiency ratio of 47.6%, one of the best among our competitors.
• lower cost of credit in all units.
Underlying RoTE was 11.0%, +4 b.p. year-on-year.
Income statementillion€ M
Variation2015 2014 amount % % w/o FX 2013
Net interest income 32,189 29,548 2,642 8.9 8.0 28,419
Net f omeee inc 10,033 9,696 337 3.5 4.3 9,622
Gains (losses) on financial transactions 2,386 2,850 (464) (16.3) (18.2) 3,496
Other opera ometing inc 665 519 146 28.1 24.6 383
ividendsD 455 435 20 4.5 5.5 378
Income f accrom equity- ounted method 375 243 132 54.3 72.4 283
Other opera ometing inc e/ xpenses (165) (159) (6) 3.8 43.6 (278)
Gross income 45,272 42,612 2,660 6.2 5.6 41,920
Opera xpensesting e (21,571) (20,038) (1,532) 7.6 6.9 (20,158)
General administrativ xpensese e (19,152) (17,781) (1,371) 7.7 6.9 (17,758)
Personnel (11,107) (10,213) (894) 8.8 7.6 (10,276)
Other general administrative expenses (8,045) (7,568) (477) 6.3 6.0 (7,482)
Depreciation and amortisation (2,419) (2,257) (161) 7.1 6.8 (2,400)
Net operating income 23,702 22,574 1,128 5.0 4.4 21,762
Net loan-loss provisions (10,108) (10,562) 454 (4.3) (4.0) (12,340)
Impairment losses on other assets (462) (375) (87) 23.2 22.7 (524)
Other income (2,192) (1,917) (275) 14.3 17.5 (1,535)
Underlying profit before taxes 10,939 9,720 1,219 12.5 10.3 7,362
Tax on profit (3,120) (2,696) (424) 15.7 13.6 (1,995)
Underlying profit from continuing operations 7,819 7,024 795 11.3 9.0 5,367
Net profit from disc tionsontinued opera — (26) 26 (100.0) (100.0) (15)
Underlying consolidated profit 7,819 6,998 822 11.7 9.4 5,352
M erinority int ests 1,253 1,182 72 6.1 6.0 1,177
Underlying attributable profit to the Group 6,566 5,816 750 12.9 10.1 4,175
Net capital gains and provisions (600) — (600) — —
Attributable profit to the Group 5,966 5,816 150 2.6 0.1 4,175
Pro memoria:
vA erage total assets 1,345,657 1,203,260 142,397 11.8 1,230,166
vA erage stockholders' equity* 90,798 82,545 8,253 10.0 71,509
(*).- Stockholders' equity: Sharedholders' eq quity + E uity adjustments by valuation. In 2014, pro-forma taking into account the January 2015 capital increase.
116
—

117
2015 annual rEport4. Economic and financial reviewConsolidated financial information
Grupo Santander posted an underlying attributable profit of €6,566million, 13% more than the €5,816 million generated in 2014.
Moreover, non-recurring results and provisions for a net negativeamount of €600 million were recorded in 2015. This amount is listedseparately as “Net capital gains and provisions”, in order to make theanalysis of results derived from business easier. Attributable profitincluding these items was €5,966 million, 3% more than in 2014.
Before analyzing the income statement, some aspects that affectcomparisons between 2014 and 2015 need to be pointed out.
• A macroeconomic environment with slower global growth.
• Interest rates that remained at historic lows in most countries.
• Tough competition in some of the markets where the Groupoperates.
• A more demanding regulatory environment, with impacts thatlimited revenues and increased costs.
• A positive perimeter effect from consumer business (mainly theagreements with PSA) and Brazil (agreement with Bonsucesso,GetNet and the acquisition of minority interests in the fourthquarter of 2014).
• The impact of exchange rates of the different currencies in whichthe Group operates as regards the euro was less than onepercentage point positive for the whole Group in revenues andcosts. The impacts were as follows: US (+21 p.p.), UK (+12 p.p.),Argentina (+7 p.p.), Chile (+5 p.p.), Brazil (-16 p.p.), while in Mexicoand Poland it was less than one point.
The main developments were as follows:
Quarterly income statementillion€ M
2014 2015
1Q 2Q 3Q 4Q 1Q 2Q 3Q 4Q
Net interest income 6,992 7,370 7,471 7,714 8,038 8,281 7,983 7,888
Net f omeee inc 2,331 2,403 2,439 2,524 2,524 2,586 2,474 2,448
Gains (losses) on financial transactions 767 511 952 620 695 372 634 684
Other opera ometing inc 34 204 99 182 186 379 225 (126)
ividendsD 31 220 72 112 33 239 75 107
Income f accrom equity- ounted method 65 42 72 64 99 101 93 82
Other opera ometing inc e/ xpenses (63) (58) (45) 6 53 39 57 (315)
Gross income 10,124 10,488 10,961 11,040 11,444 11,618 11,316 10,894
Opera xpensesting e (4,847) (4,906) (5,070) (5,216) (5,377) (5,429) (5,342) (5,422)
General administrativ xpensese e (4,256) (4,360) (4,509) (4,656) (4,785) (4,826) (4,731) (4,810)
Personnel (2,455) (2,515) (2,572) (2,670) (2,755) (2,836) (2,717) (2,799)
Other general administrative expenses (1,801) (1,844) (1,937) (1,985) (2,030) (1,989) (2,015) (2,011)
Depreciation and amortisation (590) (546) (560) (560) (592) (603) (611) (612)
Net operating income 5,277 5,582 5,891 5,824 6,067 6,189 5,974 5,472
Net loan-loss provisions (2,695) (2,638) (2,777) (2,452) (2,563) (2,508) (2,479) (2,558)
Impairment losses on other assets (87) (71) (67) (151) (60) (78) (110) (215)
Other income (347) (438) (491) (642) (454) (605) (606) (526)
Underlying profit before taxes 2,149 2,435 2,556 2,580 2,990 2,998 2,778 2,173
Tax on profit (569) (664) (649) (814) (922) (939) (787) (471)
Underlying profit from continuing operations 1,579 1,771 1,908 1,766 2,067 2,059 1,991 1,702
Net profit from disc tionsontinued opera (0) (0) (7) (19) 0 0 (0) —
Underlying consolidated profit 1,579 1,771 1,901 1,746 2,067 2,059 1,991 1,702
M erinority int ests 277 318 296 291 350 350 311 242
Underlying attributable profit to the Group 1,303 1,453 1,605 1,455 1,717 1,709 1,680 1,460
Net capital gains and provisions — — — — — 835 — (1,435)
Attributable profit to the Group 1,303 1,453 1,605 1,455 1,717 2,544 1,680 25

118
2015 annual rEport4. Economic and financial reviewConsolidated financial information
Gross income
Gross income increased 6% to a record €45,272 million. Growth wasqualitative as it was based on increases in the most commercialrevenues (net interest income and fee income), and with gains onfinancial transactions representing only 5% of the Group’s grossincome (7% in 2014). As follows:
• net interest income also notched up a new record of €32,189million (71% of gross income), 9% more than in 2014 (+8%excluding the forex impact), mainly due to growth in lending and alower cost of funds.
All countries increased net interest income except for Poland (-6%),due to the fall in interest rates, Spain (-5%), in an environment oflow interest rates and strong competition in loans, and Chile (-1%),because of the impact of the lower inflation rate and regulationsregarding the policy of maximum rates.
Of note was the growth at Santander Consumer Finance (+31%),partly because of the perimeter effect, Mexico (+14%), due to therise in loans, Brazil (+10%), following improvements quarter afterquarter during the year, and US (+7%) due to the larger portfolioat Santander Consumer USA and Santander Bank.
• net fee income was 4% higher at €10,033 million. Theperformance by units was very uneven due to different economicand business cycles. In some cases, moreover, the impact of
regulatory changes limited revenues, mainly from insurance andcards.
• net interest income plus net fee income amounted to €42,222million (+8%) and represented 93% of gross income (92% in 2014).
• Gains on financial transactions fell 16%, conditioned by the highones in 2014 from management of portfolios of interest ratehedging and the global corporate unit.
• other operating income increased by €146 million in net terms. Onthe one hand, positive impact of income from leasing (mainly in theUS) and higher results from companies that are accounted by theequity method. On the other hand, the contribution to the depositguarantee and resolution funds, also recorded in this line, of morethan €750 million for all the Group (up more than 30%), mainly inPoland (where the sector had to make extraordinary contributionsbecause of the collapse of a bank), Spain and Argentina
Operating expenses
Operating expenses increased 8% to €21,571 million (+7% excludingthe forex impact). This rise was due to several factors: theevolution of inflation in Latin America, investments in programmesfor innovation and improvements in future efficiency, the impact ofthe measures adopted by the Bank as a result of new regulatoryrequirements (particularly in the US) and the change of perimeter.
Net fee income€ Million
Variation2015 2014 amount % 2013
Fees from services 6,040 5,827 213 3.7 5,851
Mutual & pension funds 862 913 (50) (5.5) 831
Securities and custody 905 763 142 18.6 655
Insurance 2,225 2,193 32 1.5 2,284
Net fee income 10,033 9,696 337 3.5 9,622
Net interest income Net fee incomeillion illion€ M € M

119
2015 annual rEport4. Economic and financial reviewConsolidated financial information
• Adjusted for the perimeter impact and for the year’s averageinflation, costs only rose 1%, reflecting the positive effect of thethree-year efficiency and productivity plan launched at the endof 2013, which is enabling us to make the higher investmentscommented on previously, and maintain real growth in costs ofclose to zero.
• Of note was the fall in real terms in Brazil (-6% on a like-for-likebasis), Spain and Portugal (-1% in both).
The efficiency ratio was 47.6% (47.0% in 2014), due to theevolution of gains on financial transactions, as without this theratio was stable.
Loan-loss provisions
Loan-loss provisions fell 4% to €10,108 million, with significantreductions in the UK (-71%), Spain (-43%), Portugal (-42%) and RealEstate Activity Spain (-26%). They were also lower in Poland andSantander Consumer Finance but higher in Chile (+4%), Brazil (+5%),Mexico (+15%) and the US (+16%), in all of which volumes increasedsignificantly. All these changes are excluding the exchange rate.
• The lower provisions, coupled with higher lending, continued toimprove the Group’s cost of credit, which dropped from 1.43% in2014 to 1.25% in 2015. Excluding Santander Consumer USA, whichbecause of the nature of its business has a high level of provisions,the cost of credit fell from 1.15% to 0.90%.
• All the Group’s units improved their cost of credit, except for theUS. Of note were Spain, Portugal, UK and Brazil. This evolutionwas due to the improvement in the quality of their portfolios,thanks to active risk management combined with the bettermacroeconomic environment in some countries.
Net operating income after provisions
Net operating income after provisions increased 13% (+12% excludingthe forex impact), spurred by double-digit growth in most units.
Other income and provisions
Other income and provisions was €2,654 million negative comparedto €2,292 million also negative in 2014. These amounts includedprovisions of different nature, as well as capital gains, capital lossesand impairment of financial assets. The increase over 2014 is verydiluted by concepts, countries and businesses.
Operating expenses Efficiency ratioillion€ M %
Operating expenses€ Million
Variation2015 2014 amount % 2013
Personnel expenses 11,107 10,213 894 8.8 10,276
General expenses 8,045 7,568 477 6.3 7,482
Information technology 1,039 936 102 10.9 985
Communications 587 489 99 20.2 540
Advertising 705 654 50 7.6 637
Buildings and premises 1,786 1,775 11 0.6 1,815
Printed and office material 157 155 2 1.0 169
Taxes (other than profit tax) 529 460 69 14.9 458
Other expenses 3,243 3,098 144 4.7 2,879
Personnel and general expenses 19,152 17,781 1,371 7.7 17,758
Depreciation and amortisation 2,419 2,257 161 7.1 2,400
Total operating expenses 21,571 20,038 1,532 7.6 20,158

120
2015 annual rEport4. Economic and financial reviewConsolidated financial information
Loan-loss provisions Cost of creditillion€ M %
Underlying attributable profit*illion€ M
ttribut(*) A€5,966 mil
fitable prolion; +2.6%
, including apitnon-recurring c al gains and provisions:
Net loan-loss provisions€ Million
Variation2015 2014 amount % 2013
Non performing loans 11,484 11,922 (438) (3.7) 13,405
Country-risk (0) (24) 23 (98.8) 2
Recovery of written-off assets (1,375) (1,336) (39) 2.9 (1,068)
Total 10,108 10,562 (454) (4.3) 12,340
Underlying profit
Underlying profit before tax, which reflects the business evolution,rose 13% in current euros (+10% in constant euros).
Taxes increased to a greater extent because of the increased taxpressure in some units, particularly Portugal, Santander ConsumerFinance, Mexico, Chile and the US.
Minority interests increased 6%, as the rises in the US (from thebetter results of Santander Consumer USA) and SantanderConsumer Finance (materialization of the agreements with PSA)were partly offset by the repurchase of the stake in Santander Brazilin the fourth quarter of 2014.
Underlying attributable profit was €6,566 million, up 13% (+10% inconstant euros). The largest rises were in Portugal (+63%), Brazil(+33%, partly due to the repurchase of minority interests), SCF (+18%,partly due to the perimeter), Spain (+18%) and the UK (+14%). In allcases, these increases are in the currencies used to manage business.
On the other hand, falls in Poland (mainly because of lower interestrates and the extraordinary charge for the deposit guarantee fund),Chile (reduced UF inflation, whose impact could not be fully offsetby the increase in business volumes and higher gains on financialtransactions, to which is added a higher tax rate) and the US (wherethe establishment of the Intermediate Holding Company (IHC), theimprovement in the Santander Bank franchise and the
discontinuation of personal credits in order to focus more on autofinance is having a temporary impact on revenues and costs).
The underlying RoTE was 11.0% and underlying earnings per share€0.45, 7% lower than in 2014 as it was affected by the increase inthe number of shares (January’s 2015 capital increase and SantanderDividendo Elección scrip programmes), as well as by the higherfinancial cost due to the new AT1 issues made.

121
2015 annual rEport4. Economic and financial reviewConsolidated financial information
€ Million
€Underlying earning per share* Underlying RoTE*
%
(*) Attributable profit, including non-recurring capital gains and provisions:€0.40; -15.9%
The cost of these issues, in accordance with accounting rules, is notrecorded in the income statement, but against shareholders’ equity,but it is taken into account for calculating earnings per share.
Attributable profit to the Group
As indicated at the beginning, non-recurring capital gains andprovisions were recorded in 2015, as follows:
• On the one hand, non-recurring positive items of €1,118 million,which correspond to the net result of the reversal of tax iabilitiesin Brazil (€835 million) recorded in the second quarter and thegeneration of €283 million of badwill, as a result of theacquisition of assets and liabilities of Banco Internacional doFunchal (Banif) in Portugal in the fourth quarter.
• On the other, the following charges, all of them in the fourthquarter: €600 million set aside in the UK to cover possible claims
(*) RoTE, including non-recurring capital gains and provisions: 10.0%; -1.0 p.p.
related to payment protection insurance (PPI); €683 million for theimpairment of intangible assets and €435 million for goodwill andother items. The total amount of these charges was €1,718 million.
In 2014, €1,589 million of capital gains were recorded by the Altamiraoperation, the flotation of Santander Consumer USA and changes inUK pension commitments. At the same time, a fund was establishedfor restructuring costs and impairment of intangible assets andother provisions of a similar amount. The net impact of theseamounts was zero on the year’s profit
After incorporating non-recurring net capital gains and provisions,the Group’s attributable profit was €5,966 million (+3%).
The RoTE was 10.0% and earnings per share €0.40, a decline of 16%in the year.
Non-recurring results net of tax

122
2015 annual rEport4. Economic and financial reviewConsolidated financial information
Balance sheetillion€ M
VariationAssets 2015 2014 amount % 2013
Cash on hand and deposits at central banks 81,329 69,428 11,901 17.1 77,103
Trading portfolio 147,287 148,888 (1,601) (1.1) 115,309
Debt securities 43,964 54,374 (10,410) (19.1) 40,841
Customer loans 6,081 2,921 3,160 108.2 5,079
Equities 18,225 12,920 5,305 41.1 4,967
Trading derivatives 76,724 76,858 (134) (0.2) 58,920
Deposits from credit institutions 2,293 1,815 478 26.4 5,503
Other financial assets at fair value 45,043 42,673 2,370 5.6 31,441
Customer loans 14,293 8,971 5,322 59.3 13,255
Other (deposits at credit institutions, debt securities
and equities) 30,750 33,702 (2,952) (8.8) 18,185
Available-for-sale financial assets 122,036 115,251 6,785 5.9 83,799
Debt securities 117,187 110,249 6,938 6.3 79,844
Equities 4,849 5,001 (152) (3.0) 3,955
Loans 831,637 781,635 50,002 6.4 731,420
Deposits at credit institutions 50,256 51,306 (1,050) (2.0) 57,178
Customer loans 770,474 722,819 47,655 6.6 666,356
Debt securities 10,907 7,510 3,397 45.2 7,886
Held-to-maturity investments 4,355 — 4,355 —
Investments 3,251 3,471 (220) (6.3) 3,377
Intangible assets and property and equipment 27,790 26,109 1,681 6.4 18,137
Goodwill 26,960 27,548 (588) (2.1) 24,263
Other 50,572 51,293 (721) (1.4) 49,279
Total assets 1,340,260 1,266,296 73,964 5.8 1,134,128
Liabilities and shareholders' equityTrading portfolio 105,218 109,792 (4,574) (4.2) 94,695
Customer deposits 9,187 5,544 3,643 65.7 8,500
Marketable debt securities — — — —
Trading derivatives 76,414 79,048 (2,634) (3.3) 58,910
Other 19,617 25,200 (5,583) (22.2) 27,285
Other financial liabilities at fair value 54,768 62,318 (7,550) (12.1) 42,311
Customer deposits 26,357 33,127 (6,770) (20.4) 26,484
Marketable debt securities 3,373 3,830 (457) (11.9) 4,086
Due to central banks and credit institutions 25,038 25,360 (322) (1.3) 11,741
Financial liabilities at amortized cost 1,039,343 961,053 78,290 8.1 880,115
Due to central banks and credit institutions 148,079 122,437 25,642 20.9 92,390
Customer deposits 647,578 608,956 38,622 6.3 572,853
Marketable debt securities 201,656 193,059 8,597 4.5 182,234
Subordinated debt 21,153 17,132 4,021 23.5 16,139
Other financial liabilities 20,877 19,468 1,409 7.2 16,499
Insurance liabilities 627 713 (86) (12.0) 1,430
Provisions 14,494 15,376 (882) (5.7) 14,599
Other liability accounts 27,057 27,331 (274) (1.0) 20,680
Total liabilities 1,241,507 1,176,581 64,926 5.5 1,053,830
Shareholders' equity 102,402 91,664 10,738 11.7 84,479
Capital stock 7,217 6,292 925 14.7 5,667
Reserves 90,765 80,026 10,739 13.4 75,044
Attributable profit to the Group 5,966 5,816 150 2.6 4,175
Less: dividends (1,546) (471) (1,075) 228.4 (406)
Equity adjustments by valuation (14,362) (10,858) (3,504) 32.3 (14,153)
Minority interests 10,713 8,909 1,804 20.3 9,972
Total equity 98,753 89,714 9,039 10.1 80,298
Total liabilities and equity 1,340,260 1,266,296 73,964 5.8 1,134,128
—
1
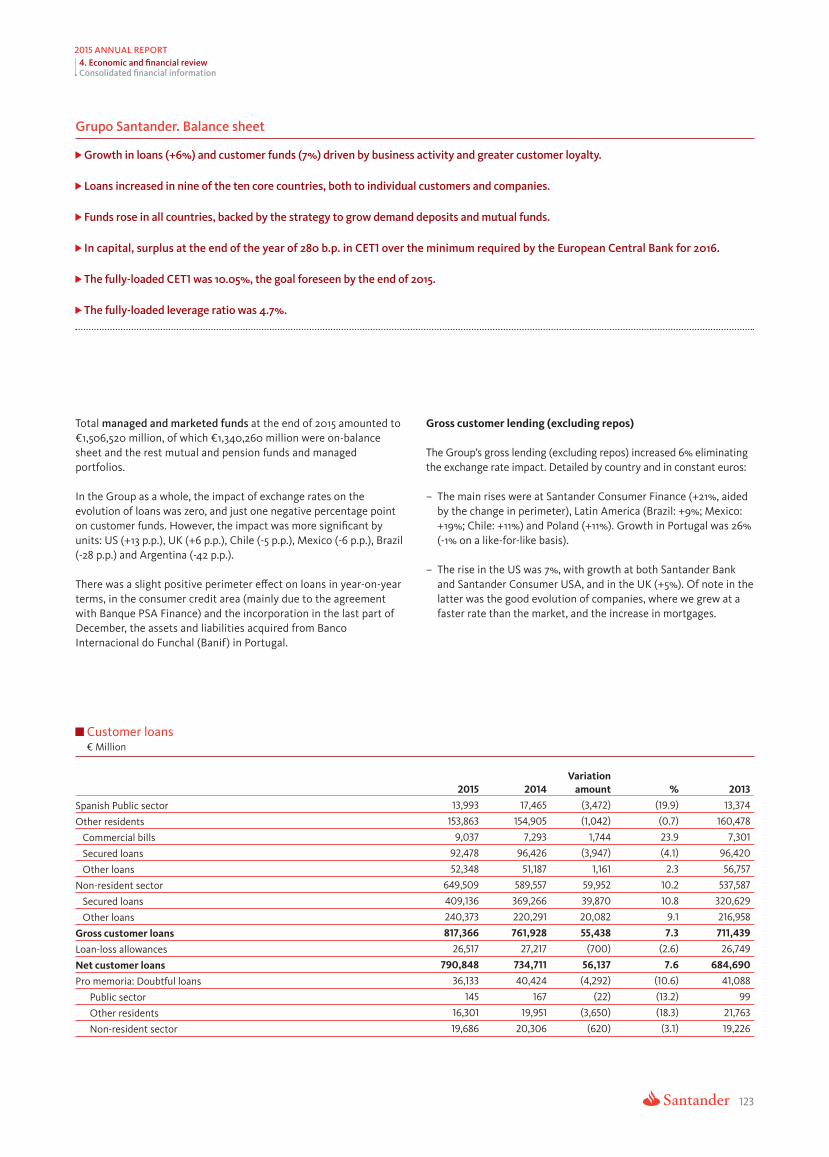
123
2015 annual rEport4. Economic and financial reviewConsolidated financial information
Grupo Santander. Balance sheet
Growth in loans (+6%) and customer funds (7%) driven by business activity and greater customer loyalty.
loans increased in nine of the ten core countries, both to individual customers and companies.
Funds rose in all countries, backed by the strategy to grow demand deposits and mutual funds.
In capital, surplus at the end of the year of 280 b.p. in CEt1 over the minimum required by the European Central Bank for 2016.
the fully-loaded CEt1 was 10.05%, the goal foreseen by the end of 2015.
the fully-loaded leverage ratio was 4.7%.
Total managed and marketed funds at the end of 2015 amounted to Gross customer lending (excluding repos)€1,506,520 million, of which €1,340,260 million were on-balancesheet and the rest mutual and pension funds and managed The Group’s gross lending (excluding repos) increased 6% eliminatingportfolios. the exchange rate impact. Detailed by country and in constant euros:
In the Group as a whole, the impact of exchange rates on the – The main rises were at Santander Consumer Finance (+21%, aidedevolution of loans was zero, and just one negative percentage point by the change in perimeter), Latin America (Brazil: +9%; Mexico:on customer funds. However, the impact was more significant by +19%; Chile: +11%) and Poland (+11%). Growth in Portugal was 26%units: US (+13 p.p.), UK (+6 p.p.), Chile (-5 p.p.), Mexico (-6 p.p.), Brazil (-1% on a like-for-like basis).(-28 p.p.) and Argentina (-42 p.p.).
– The rise in the US was 7%, with growth at both Santander BankThere was a slight positive perimeter effect on loans in year-on-year and Santander Consumer USA, and in the UK (+5%). Of note in theterms, in the consumer credit area (mainly due to the agreement latter was the good evolution of companies, where we grew at awith Banque PSA Finance) and the incorporation in the last part of faster rate than the market, and the increase in mortgages. December, the assets and liabilities acquired from BancoInternacional do Funchal (Banif) in Portugal.
Customer loans€ Million
Variation2015 2014 amount % 2013
Spanish Public sector 13,993 17,465 (3,472) (19.9) 13,374
Other residents 153,863 154,905 (1,042) (0.7) 160,478
Commercial bills 9,037 7,293 1,744 23.9 7,301
Secured loans 92,478 96,426 (3,947) (4.1) 96,420
Other loans 52,348 51,187 1,161 2.3 56,757
Non-resident sector 649,509 589,557 59,952 10.2 537,587
Secured loans 409,136 369,266 39,870 10.8 320,629
Other loans 240,373 220,291 20,082 9.1 216,958
Gross customer loans 817,366 761,928 55,438 7.3 711,439
Loan-loss allowances 26,517 27,217 (700) (2.6) 26,749
Net customer loans 790,848 734,711 56,137 7.6 684,690
Pro memoria: Doubtful loans 36,133 40,424 (4,292) (10.6) 41,088
Public sector 145 167 (22) (13.2) 99
Other residents 16,301 19,951 (3,650) (18.3) 21,763
Non-resident sector 19,686 20,306 (620) (3.1) 19,226

– Spain declined 3% in an environment of strong competition inprices and where the double-digit growth in new lending was stillbelow the pace of maturities. SMEs and companies rose 1%.
– As for Real Estate Activity in Spain, net lending was down 33%, asa result of continuing the deleveraging strategy of recent years.
Credit risk
Net NPL entries in 2015 amounted to €7,705 million after eliminatingthe perimeter and exchange-rate effects (-20% year-on-year), mainlydue to Spain.
Non-performing loans ended the year at €37,094 million, 11% lower (-9% excluding the forex impact). This balance brought the Group’sNPL ratio to 4.36%, 83 b.p. lower than in 2014 and on a downwardpath every quarter of 2015.
Loan-loss allowances amounted to EUR 27,121 million, whichprovided coverage of 73% (+6 p.p.). In order to properly view thisfigure, one has to take into account that the UK and Spain ratios are
affected by the weight of mortgage balances, which require fewerprovisions as these loans have guarantees.
The improved credit quality is reflected in the reduction in loan-lossprovisions (-4% over 2014) and in the consequent improvement ofthe cost of credit, which dropped from 1.43% at the end of 2014 to1.25%. Excluding Santander Consumer USA, which because of thenature of its business has a high level of provisions and recoveries,the cost of credit was below 1% at the end of 2015 (0.90% comparedto 1.15% in 2014).
Credit quality ratios performed well in almost all countries andreflected the appropriate risk management policy, which we arestrengthening with the launch of the Advanced Risk Management(ARM) programme and boosting the risk culture throughout theGroup under a common identity, risk-pro.
More information on credit risk, the control and monitoring systemsand the internal risk models for calculating provisions can be foundin the specific section of the Risk Management Report in this AnnualReport.
124
2015 annual rEport4. Economic and financial reviewConsolidated financial information
Gross loans to customersillion€ B
x t(*) Excluding e change ra e impact: +7.4%
Loans to customers% / operating areas. December 2015
OtArgentina: 1%
her America: 1%
Chile: 4%Brazil: 8%
Mexico: 4%
USA: 10%United Kingdom: 36%
Other Europe: 1%Act. inmob. Spain: 0.4%
Portugal: 4%Poland: 2%
SCF: 9%Spain: 20%
Credit risk management*illion€ M
Variation2015 2014 amount % 2013
Non-performing loans 37,094 41,709 (4,615) (11.1) 42,420
NPL ratio (%) 4.36 5.19 (0.83) 5.61
Loan-loss allowances 27,121 28,046 (925) (3.3) 27,526
Specific 17,707 21,784 (4,077) (18.7) 22,433
Collective 9,414 6,262 3,152 50.3 5,093
Coverage ratio (%) 73.1 67.2 5.9 64.9
Cost of credit (%) ** 1.25 1.43 (0.18) 1.69
(*) Excluding country-risk(**) 12 months net loan-loss provisions / average lending
Note: NPL ratio: Non-performing loans / computable assets

Managed and marketed customer funds
Total managed funds (deposits excluding repos and mutual funds)rose 6%. At constant exchange rates, customer deposits withoutrepos increased 6% and mutual funds 14%. The combined increasewas 7%.
All countries were the Group is present, increased their balance incustomer funds, excluding the forex impact, as follows:
– Growth of 12% in Brazil, of or around 10% in the US, Mexico andChile, while the UK rose 6%, Portugal 5% (excluding the perimeterimpact) and Poland 4%.
– Spain increased 1%, more in line with the lending growth ratesalready mentioned.
The strategy to grow in demand deposits and mutual funds, withalmost all countries increasing in both items, and reduce timedeposits continued.
125
2015 annual rEport4. Economic and financial reviewConsolidated financial information
Grupo Santander. NPL and coverage ratios%
illionManaged and marketed customer funds€ M
Variation2015 2014 amount % 2013
Resident public sector 11,737 9,349 2,388 25.5 7,745
Other residents 157,611 163,340 (5,729) (3.5) 161,649
Demand deposits 108,410 88,312 20,098 22.8 74,969
Time deposits 47,297 67,495 (20,198) (29.9) 80,146
Other 1,904 7,532 (5,629) (74.7) 6,535
Non-r toresident sec 513,775 474,939 38,836 8.2 438,442
Demand deposits 313,175 273,889 39,286 14.3 230,715
Time deposits 146,317 151,113 (4,796) (3.2) 161,300
Other 54,283 49,937 4,346 8.7 46,427
Customer deposits 683,122 647,628 35,495 5.5 607,836
Debt securities 205,029 196,890 8,139 4.1 186,321
Subordinated debt 21,153 17,132 4,021 23.5 16,139
On-balance-sheet customer funds 909,304 861,649 47,655 5.5 810,296
utM undsual f 129,077 124,708 4,369 3.5 103,967
P undsension f 11,376 11,481 (105) (0.9) 10,879
Mana tged por folios 25,808 25,599 209 0.8 21,068
Other managed and marketed customer funds 166,260 161,788 4,473 2.8 135,914
Managed and marketed customer funds 1,075,565 1,023,437 52,128 5.1 946,210
Net NPL entriesillion€ M

As well capturing customer deposits, Grupo Santander, for strategicreasons, maintains a selective policy of issuing securities in theinternational fixed income markets and strives to adapt thefrequency and volume of its market operations to the structuralliquidity needs of each unit, as well as to the receptiveness of eachmarket.
In 2015, various Group units carried out:
– Medium and long-term senior debt issues amounting to €36,986million, subordinated debt issue of €4,217 million and coveredbonds of €3,657 million.
– Securitizations placed in the market (€14,379 million).
Maturities of medium and long-term debt amounted to €36,462million.
The loan-to-deposit ratio was 116% and the ratio of deposits plusmedium- and long-term funding to the Group’s loans was 114%,underscoring the comfortable funding structure.
Other items of the balance sheet
The balance of financial assets available for sale stood at €122,036million at the end of 2015, €6,785 million more than in 2014 (+6%),due mainly to Spain, US and Mexico.
Held-to-maturity investments was €4,355 million, all of which wasgenerated in 2015 due to the revision of those portfolios included infinancial assets available for sale whose economic logicrecommended their re-classification to held-to-maturityinvestments.
Total goodwill was €26,960 million, €588 million less than in 2014, asthe increase due to the change in perimeter was fully offset by theevolution of the Brazilian real against the euro.
Lastly, tangible and intangible assets amounted to €27,790 million,€1,681 million more than December 2014. Increase mainly in the USdue to the exchange rate and to assets associated with leasingbusiness.
126
2015 annual rEport4. Economic and financial reviewConsolidated financial information
Managed and marketed customer fundsillion€ B
total
OtherDebt securities
and subordinadebt
ted
Deposits
(*) Ex xcluding e change rate impact: +6.8%
Managed and marketed customer funds% / operating areas. December 2015
OtArgentina: 1%
her America: 1%
Chile: 4%
Brazil: 12%
United Kingdom: 31%Mexico: 4%
USA: 10%
Other Europe: 1%Portugal: 4%
Poland: 2%SCF: 5%
Spain: 25%
Total Group. Loan-to-deposit ratio%

Shareholders’ equity and solvency ratios
Total shareholders’ funds amounted to €88,040 million (+9%). Therise was due to January’s €7,500 million capital increase and retainedearnings, which was partly reduced by the negative evolution ofequity valuation adjustments.
In regulatory terms, phase-in eligible equity was €84,346 million,which gave a total capital ratio of 14.40% and a common equity Tier 1(CET1) ratio of 12.55%. This ratio was 280 b.p. above the 9.75%minimum that the European Central Bank (under its SupervisoryReview and Evaluation Process) established for Grupo Santander in2016 on a consolidated basis (including the 0.25% derived from beinga global systemically important bank).
127
2015 annual rEport4. Economic and financial reviewConsolidated financial information
illionEligible capital (Phase-in)€ M
2015 2014
CET1 73,478 71,598
Basic capital 73,478 71,598
Eligible capital 84,346 77,854
iskR eight-w ed assets 585,609 585,243
CET1 capital ratio 12.55 12.23
T1 capital ratio 12.55 12.23
BIS ratio 14.40 13.30
Capital ratios%
(1) Minimum prudential requirements established by the ECB, based on the supervisor eviewy rand evaluation process (SREP)
illionEligible capital (fully loaded)*€ M
Variation
2015 2014 amount %
Capital stock and reserves 98,193 93,748 4,445 4.7
ttributA fitable pro 5,966 5,816 150 2.6
ividendsD (2,268) (1,014) (1,254) 123.7
Other retained earnings (15,448) (11,468) (3,980) 34.7
M erinority int ests 6,148 4,131 2,017 48.8
Goodwill and intangible assets (28,254) (29,164) 910 (3.1)
rT easury stock and other deductions (5,633) (5,767) 134 (2.3)
Core CET1 58,705 56,282 2,423 4.3
rP eferred shares and other eligibles T1 5,504 4,728 776 16.4
Tier 1 64,209 61,010 3,199 5.2
Generic funds and eligible T2 instruments 11,996 7,561 4,435 58.7
Eligible capital 76,205 68,571 7,634 11.1
iskR eight-w ed assets 583,893 583,366 527 0.1
CET1 capital ratio 10.05 9.65 0.40
T1 capital ratio 11.00 10.46 0.54
BIS ratio 13.05 11.75 1.30
(*).- In 2014, pro-f torma da a taking into account the January 2015 capit easeal incr

In fully-loaded terms, the CET1 at the end of 2015 was 10.05%, thegoal set at the start of the year and an increase of 40 b.p. in the year(excluding the capital increase). The rise was 50 b.p. before non-recurring net capital gains and provisions.
The fully-loaded total capital ratio was 13.05% (+130 b.p. in the year),as to the rise in the CET1 was added the favourable impact from theeligibility of the hybrid issues made.
Qualitatively speaking, the Group has solid and appropriate ratiosfor its business model, balance sheet structure and risk profile.
The fully-loaded leverage ratio (as established by regulation2015/621) was 4.7%.
128
2015 annual rEport4. Economic and financial reviewConsolidated financial information
Fully-loaded capital ratio%
Fully-loaded CET1 performance%
rating agencies
The Group’s access to the wholesale funding markets, as well as thecost of issues, depends to some extent on the ratings of ratingagencies.
Rating agencies regularly review the Group’s ratings. The ratingdepends on a series of internal (solvency, business model, capacity togenerate results) and external factors related to the general economicenvironment, the banking sector’s situation and the sovereign risk ofthe countries in which the Bank operates.
During 2015:
• Moody’s upgraded its rating of Santander’s long-term senior debtfrom Baa1 to A3, and changed the outlook from stable to positive.
• Standard & Poor’s upgraded its rating of long-term senior debt fromBBB+ to A-.
Long Shortterm term Outlook
DBRS A R1 (low) Stable
Fitch Ratings A- F2 Stable
GBB Rating AA- Stable
Moody’s A3 P-2 Positive
Standard & Poor´s A- A-2 Stable
Scope A+ S-1 Stable
• Scope also upgraded its rating of long-term senior debt from A to A+.
• GBB upgraded its rating from A+ to AA- with stable outlook.
• DBRS confirmed its ratings with stable outlook.

129
2015 annual rEport4. Economic and financial reviewInformation by business
Description of the business
Some changes w
by
holding
ere made in the third quarter of 2015 to the All these changes do not affect the figures of the consolidatedcriteria applied and to the composition of some units, in order to roupG , which were unchanged.
roup’enhance the G s transparency acilit, f ate the analysis of some
orporabusiness units and place value on the acC tion. The criteria changes are:
tivity developed by the The financial stdrawn up by ag
agrtegaements of each business segment ha
roupting the G ’s basic operave been
ting units. Theinformation relates to both the acc tounting da a of the units
• n pain iI S , nternal tran sfer rate s in (ITR) dividualised by integrated in each segment, as well as that provided by thetransaction were appl ied to ca lculate th e fin ancial margin so , mana ormagement inf tion systems. In all cases, the same generalthat the b alance shee t was ma tched in terms of interest rate risk. principles as those used in the Group are applied.
he countT erpart of th ese resu lts was th e o C rporate entre C .orlolouwp’
isncgo
FG
tuhnistr
ciehsan
agn
ed
u
, n
piatisn
aiS
, sn
hd
oamll
oth
gee
nreisseudlt
ws o
itfhftinhaenrceisatlo
f the The operating business areas are structured into t elswo lev
min
ate
nraegsetmra
etne
trois
fkth
aere
br
,
aelap
no
crete
sd
h ienetth
iins
cul,
nu
idtin.
g the aforementi oned Geographic businessesis segment
. The aced by geographic ar
rouptivity of the Geas. This c
’s operaroup
ting unitsoincides with the G ’s
• The cost o
optimise capitorpora
f AT1 issued assumed by the C t entr
Brazil and e C
Mee as they w
al in these units. This c
xic
ost is now r
o to rer
ec
eplace CET1 wase operations to
orded byThe segments r
first levthe world’
el os thr
f mana
eport
gement and ree main curr
ed on arenc
eflecy ar
e:
anderts Santeas (euro, st
’s positioning inerling and dollar).
ountreach c y. • ontinentC uropeal E . This covers all businesses in the area.
•w
hideesnceodpeT , in
ofa
ccoco
strsda
cnh
ca
erg
wed
ithto
t
h u
eni
ntsew
fros
mtru
tcth e
u re
orporate entC C.
re is
al
DetP
l the r
ailed financial informaoland and Santander C
egion's business, including the thr
tion is proonsumer Finance (which inc
ee countriesorpora
ortvided on Spain, Ptes
ugal,
mentioned herewith).In addition, the Spain R ateal Est ce A tivity unit is created, which
vaces
groups together the fSpain and other rMetro
eal esta and those o
atormer unit o
f the f
f Run-oe assets, such as the st
ormer r
ff R
eal estatak
at
eviously
ceal Est e Ae in
e fund pr
tivity in • unitvarious units and branches in the c
ingdomed K . This includes the businesses devountry.
eloped by the
orporaincluded in the C t entre C e. • latin america. This embraces al roup’l the G s financial activities
ower
The Latin Americf Banco Sant ernaander Int
e in the Latin Americ
a and the US ar
a area, ar
ereas wtional and the New Yor
e also changed. The unitsk branch, which
e now included in the US.
c
pro
onduct
vided. individual financial stat
ed via its banks and subsidiaries in the rements o xicf Brazil, Me
egion. Theo and Chile are
• unit ted S ates Includes the (SHUSA), the businesses of
accinc
The results obusiness units and o
ordance with the new critome, gains on financial trans
f 2014 and those oorporaf the C
ac
f the first half ot entre C
eria. This mainly afftions and opera
e havec
staert
f 2015 of thee been re-
ts net intting e
ested in
xpenses.
SantSantInterna
uer icoander Bank, Santander P to R , the specialised unit o
tional and the New Yor
ander Consumer USA and
k branch.
oBancf Banco Santander
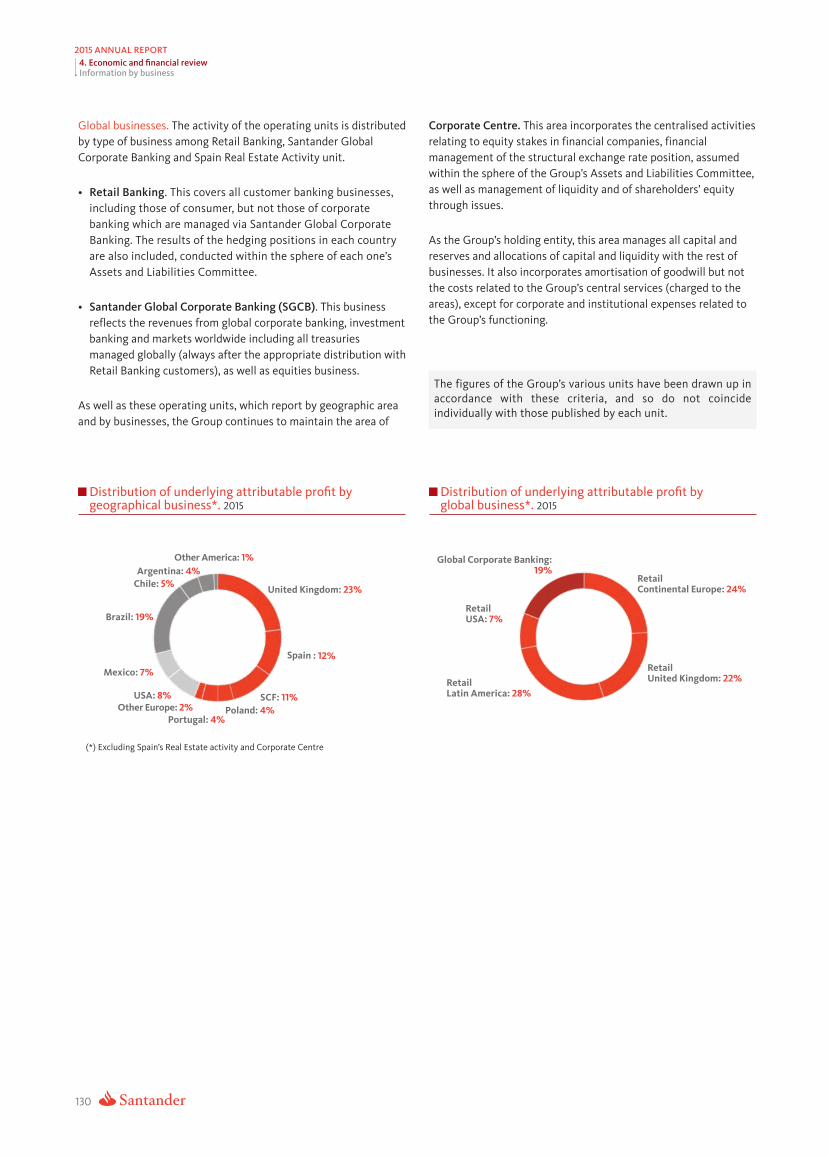
Global businesses. The activity of the operating units is distributedby type of business among Retail Banking, Santander GlobalCorporate Banking and Spain Real Estate Activity unit.
• retail Banking. This covers all customer banking businesses,including those of consumer, but not those of corporatebanking which are managed via Santander Global CorporateBanking. The results of the hedging positions in each countryare also included, conducted within the sphere of each one’sAssets and Liabilities Committee.
• Santander Global Corporate Banking (SGCB). This businessreflects the revenues from global corporate banking, investmentbanking and markets worldwide including all treasuriesmanaged globally (always after the appropriate distribution withRetail Banking customers), as well as equities business.
As well as these operating units, which report by geographic areaand by businesses, the Group continues to maintain the area of
Corporate Centre. This area incorporates the centralised activitiesrelating to equity stakes in financial companies, financialmanagement of the structural exchange rate position, assumedwithin the sphere of the Group’s Assets and Liabilities Committee,as well as management of liquidity and of shareholders’ equitythrough issues.
As the Group’s holding entity, this area manages all capital andreserves and allocations of capital and liquidity with the rest ofbusinesses. It also incorporates amortisation of goodwill but notthe costs related to the Group’s central services (charged to theareas), except for corporate and institutional expenses related tothe Group’s functioning.
130
2015 annual rEport4. Economic and financial reviewInformation by business
ain
hcdce
iov
fri
idd
gau
una
re
lcl
sey
o
w
fwi
t
tih
hthe
thotrhs
oee
usp
p’eu
s
bcv
lri
a
sirth
ieo
eru
dias
b
u
y
nae
ina
tds
ch
hsa
uov
n
e
itdboeen
nodtraw
conin
ucpid
ine
T G , .
2015Distribution of underlying attributable profit bygeographical business*.
Other America: 1%Argentina: 4%
Chile: 5%United Kingdom: 23%
Brazil: 19%
Spain : 12%
Mexico: 7%
USA: 8% SCF: 11%Other Europe: 2% Poland: 4%
Portugal: 4%
(*) Ex ’ at orporat entrecluding Spain s Real Est e activity and C e C
2015Distribution of underlying attributable profit byglobal business*.
Global Corporate Banking:19%
RetailContinental Europe: 24%
RetailUSA: 7%
Retail
Retail United Kingdom: 22%
Latin America: 28%
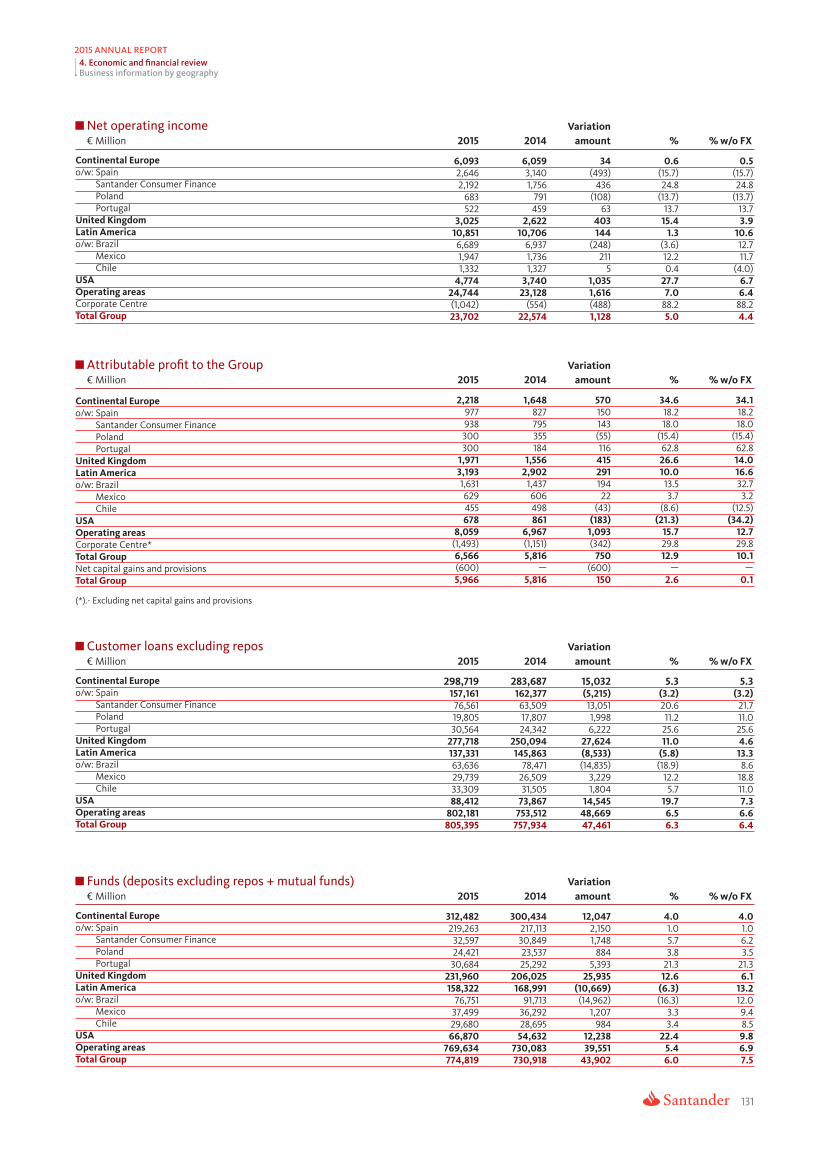
131
2015 annual rEport4. Economic and financial reviewBusiness information by geography
o
o
o
o
o
o
o
o
orpora
orpora
w
w
w
w
w
w
w
w
apit
olandor
olandor
olandor
olandor
il
il
il
il
xic
t
xic
xic
xic
t
t
lion
t
lion
t
lion
t
lion
ugal
ugal
ugal
ugal
o
o
o
o
entr
entr
e
apit
visions
inance
inance
inance
inance
visions
(600)
300300
629
683
938
522
977
455
(554)
606498
459
827795355184
791
— (600)
(493)
(248)
(488)
(342)
(108)
(43)
436
984
884
(55)
150
194
143
211
116
63
22
5
—
Net operating income Variation€ M 2015 2014 amount % % w/o FX
Continental Europe 6,093 6,059 34 0.6 0.5/ : Spain 2,646 3,140 (15.7) (15.7)
Santander Consumer F 2,192 1,756 24.8 24.8P (13.7) (13.7)P 13.7 13.7
United Kingdom 3,025 2,622 403 15.4 3.9Latin America 10,851 10,706 144 1.3 10.6
/ : Brazil 6,689 6,937 (3.6) 12.7Me 1,947 1,736 12.2 11.7Chile 1,332 1,327 0.4 (4.0)
USA 4,774 3,740 1,035 27.7 6.7Operating areas 24,744 23,128 1,616 7.0 6.4C e C (1,042) 88.2 88.2Total Group 23,702 22,574 1,128 5.0 4.4
Attributable profit to the Group Variation€ M 2015 2014 amount % % w/o FX
Continental Europe 2,218 1,648 570 34.6 34.1/ : Spain 18.2 18.2
Santander Consumer F 18.0 18.0P (15.4) (15.4)P 62.8 62.8
United Kingdom 1,971 1,556 415 26.6 14.0Latin America 3,193 2,902 291 10.0 16.6
/ : Brazil 1,631 1,437 13.5 32.7Me 3.7 3.2Chile (8.6) (12.5)
USA 678 861 (183) (21.3) (34.2)Operating areas 8,059 6,967 1,093 15.7 12.7C e C e* (1,493) (1,151) 29.8 29.8Total Group 6,566 5,816 750 12.9 10.1Net c al gains and proTotal Group 5,966 5,816 150 2.6 0.1
(*).- Excluding net c al gains and pro
Customer loans excluding repos Variation€ M 2015 2014 amount % % w/o FX
Continental Europe 298,719 283,687 15,032 5.3 5.3/ : Spain 157,161 162,377 (5,215) (3.2) (3.2)
Santander Consumer F 76,561 63,509 13,051 20.6 21.7P 19,805 17,807 1,998 11.2 11.0P 30,564 24,342 6,222 25.6 25.6
United Kingdom 277,718 250,094 27,624 11.0 4.6Latin America 137,331 145,863 (8,533) (5.8) 13.3
/ : Brazil 63,636 78,471 (14,835) (18.9) 8.6Me 29,739 26,509 3,229 12.2 18.8Chile 33,309 31,505 1,804 5.7 11.0
USA 88,412 73,867 14,545 19.7 7.3Operating areas 802,181 753,512 48,669 6.5 6.6Total Group 805,395 757,934 47,461 6.3 6.4
Funds (deposits excluding repos + mutual funds) Variation€ M 2015 2014 amount % % w/o FX
Continental Europe 312,482 300,434 12,047 4.0 4.0/ : Spain 219,263 217,113 2,150 1.0 1.0
Santander Consumer F 32,597 30,849 1,748 5.7 6.2P 24,421 23,537 3.8 3.5P 30,684 25,292 5,393 21.3 21.3
United Kingdom 231,960 206,025 25,935 12.6 6.1Latin America 158,322 168,991 (10,669) (6.3) 13.2
/ : Brazil 76,751 91,713 (14,962) (16.3) 12.0Me 37,499 36,292 1,207 3.3 9.4Chile 29,680 28,695 3.4 8.5
USA 66,870 54,632 12,238 22.4 9.8Operating areas 769,634 730,083 39,551 5.4 6.9Total Group 774,819 730,918 43,902 6.0 7.5
—

132
2015 annual rEport4. Economic and financial reviewBusiness information by geography
illionContinental Europe€ M
VariationIncome statement 2015 2014 amount % % w/o FX
Net interest income 8,006 7,517 489 6.5 6.6
Net f omeee inc 3,417 3,500 (83) (2.4) (2.7)
Gains (losses) on financial transactions 1,186 1,220 (34) (2.8) (2.8)
Other operating income* 220 267 (46) (17.3) (17.7)
Gross income 12,830 12,504 326 2.6 2.5
Opera xpensesting e (6,736) (6,444) (292) 4.5 4.4
General administrativ xpensese e (6,274) (5,972) (302) 5.1 4.9
Personnel (3,223) (3,113) (110) 3.5 3.3
Other general administrative expenses (3,051) (2,859) (192) 6.7 6.7
Depreciation and amortisation (463) (472) 10 (2.0) (2.1)
Net operating income 6,093 6,059 34 0.6 0.5
Net loan-loss provisions (1,975) (2,880) 905 (31.4) (31.3)
Other income (753) (693) (59) 8.6 8.5
Profit before taxes 3,366 2,486 880 35.4 35.0
Tax on profit (887) (639) (248) 38.9 38.8
Profit from continuing operations 2,479 1,847 631 34.2 33.7
Net profit from disc tionsontinued opera — (26) 26 (100.0) (100.0)
Consolidated profit 2,479 1,821 658 36.1 35.6
M erinority int ests 261 173 87 50.4 50.3
Attributable profit to the Group 2,218 1,648 570 34.6 34.1
Balance sheetCustomer loans** 287,252 268,735 18,517 6.9 6.9
T trading por folio (w/o loans) 60,151 65,863 (5,712) (8.7) (8.7)
A orvailable-f s- ale financial assets 60,913 56,845 4,068 7.2 7.1
Due from credit institutions** 81,867 66,602 15,265 22.9 22.5
Intangible assets and proper uipmentty and eq 11,798 11,796 2 0.0 (0.6)
Other assets 36,664 26,757 9,906 37.0 36.9
Total assets/liabilities & shareholders' equity 538,645 496,598 42,047 8.5 8.4
Customer deposits** 263,462 256,909 6,552 2.6 2.5
Marketable debt securities** 50,934 54,431 (3,497) (6.4) (6.1)
Subordinated debt** 170 409 (240) (58.5) (58.6)
Insurance liabilities 626 713 (87) (12.2) (12.2)
Due to credit institutions** 132,688 90,305 42,382 46.9 46.4
Other liabilities 58,251 64,304 (6,053) (9.4) (9.4)
Stockholders' equity *** 32,515 29,526 2,989 10.1 9.6
Other managed and marketed customer funds 71,389 66,825 4,563 6.8 6.5
utM ual and pension funds 62,669 58,417 4,252 7.3 7.3
Mana tged por folios 8,720 8,408 312 3.7 1.6
Managed and marketed customer funds 385,954 378,575 7,379 1.9 1.9
Ratios (%) and operating meansROE 7.13 5.82 1.31
Efficiency ratio (with amortisations) 52.5 51.5 1.0
NPL ratio 7.27 8.88 (1.61)
oC vera tioge ra 64.2 57.2 7.0
Number o yf emplo ees 58,049 56,645 1,404 2.5
Number of branches 5,548 5,482 66 1.2
eserv
(*).- Including dividends. inc(**).- Including all on-balance sheet balances f(***).- Capital + r es + pro
ome from eq
fit + valua
accuity-
tion adjustments
ountor this item
ed method and other opera ometing inc e/ xpenses
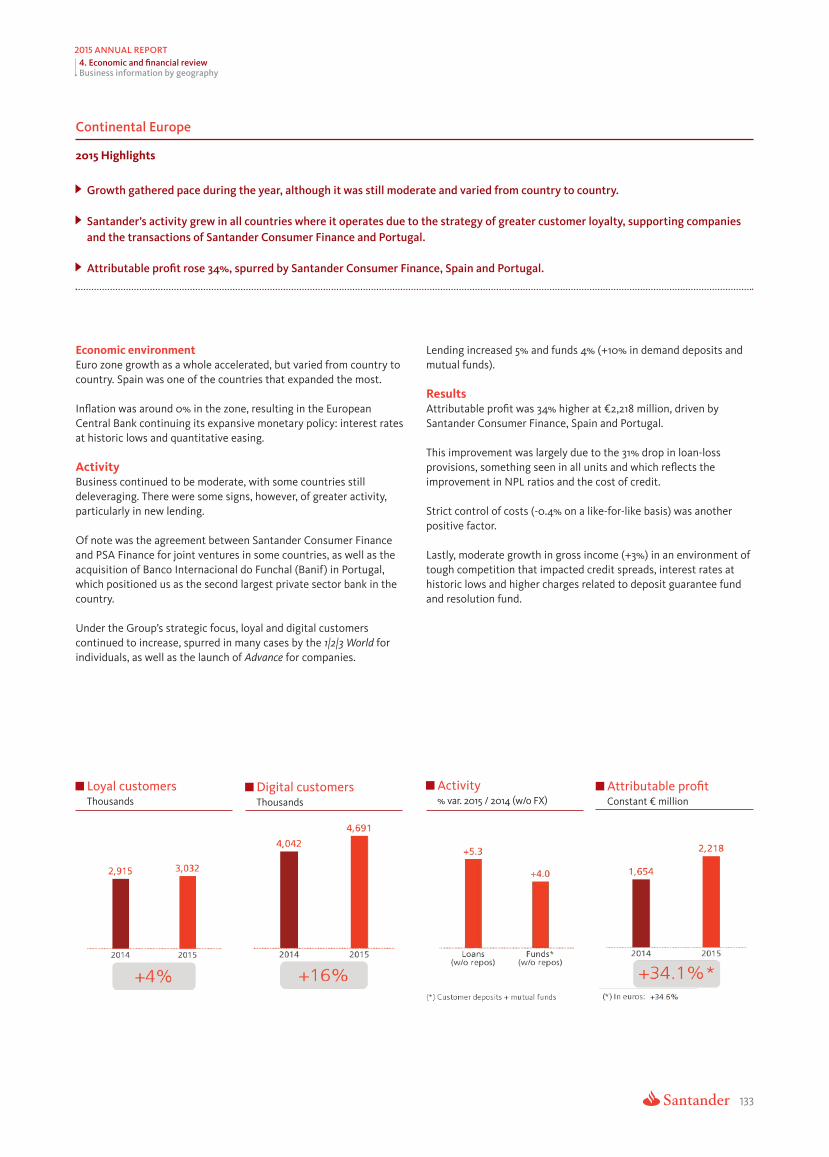
133
2015 annual rEport4. Economic and financial reviewBusiness information by geography
Continent ural E ope
2015 Highlights
row atherG th g ed pace during the year, although it was still moderate and v raried f om country to country.
ander’Sant s activity grew in all countries where it operates due to the strategy of greater customer loyalty, suppor ompaniesting cacand the trans tions of Santander Consumer F orinance and p tugal.
ttributa able profit rose 34%, spurred by Santander C inanceonsumer F , S orpain and p tugal.
c
a
delevpar
acq
c
c
ountr
ountr
era
y
y
ging
roup
el
’
gr
uantit
er
t
ent
ativxpansiv
urw
t
t
ev
f
er
ar
t
ea
yuropean
t
orel
er
ountr
t
tivity
inance
l
for
tes
Economic environmentEuro zone growth as a whole accelera ed, but varied from c y to
. Spain was one of the countries that expanded the most.
Inflation was around 0% in the zone, resulting in the ECentral Bank continuing its e e monet y polic : int est ra
t historic lows and q e easing.
ActivityBusiness continued to be modera e, with some countries stil
. There w e some signs, how , of gr er ac ,ticularly in new lending.
Of note was the a eement bet een Santander Consumer Fand PSA Finance for joint v es in some countries, as w l as the
uisition of Banco Internacional do Funchal (Banif) in P ugal,which positioned us as the second largest priva e sector bank in the
.
Under the G s stra egic focus, loyal and digital customersontinued to increase, spurred in many cases by the 1|2|3 World
individuals, as w l as the launch of Advance or companies.
Lending increased 5% and funds 4% (+10% in demand deposits andmutual funds).
ResultsAttributable profit was 34% higher at €2,218 million, driven bySantander Consumer Finance, Spain and Portugal.
This improvement was largely due to the 31% drop in loan-lossprovisions, something seen in all units and which reflects theimprovement in NPL ratios and the cost of credit.
Strict control of costs (-0.4% on a like-for-like basis) was anotherpositive factor.
Lastly, moderate growth in gross income (+3%) in an environment oftough competition that impacted credit spreads, interest rates athistoric lows and higher charges related to deposit guarantee fundand resolution fund.
ands ands var (w o X) onst lionLoyal customers Digital customers Activity Attributable profitThous Thous % . 2015 / 2014 / F C ant € mil

134
2015 annual rEport4. Economic and financial reviewBusiness information by geography
illionSpain€ M
VariationIncome statement 2015 2014 amount %
Net interest income 3,430 3,627 (197) (5.4)
Net f omeee inc 1,688 1,793 (105) (5.9)
Gains (losses) on financial transactions 784 1,034 (250) (24.2)
Other operating income* 178 182 (3) (1.9)
Gross income 6,080 6,636 (556) (8.4)
Opera xpensesting e (3,434) (3,496) 63 (1.8)
General administrativ xpensese e (3,244) (3,319) 75 (2.3)
Personnel (1,670) (1,761) 90 (5.1)
Other general administrative expenses (1,573) (1,558) (15) 1.0
Depreciation and amortisation (190) (177) (13) 7.1
Net operating income 2,646 3,140 (493) (15.7)
Net loan-loss provisions (992) (1,745) 754 (43.2)
Other income (263) (212) (51) 24.0
Profit before taxes 1,392 1,183 209 17.7
Tax on profit (393) (350) (44) 12.5
Profit from continuing operations 999 833 166 19.9
Net profit from disc tionsontinued opera — — —
Consolidated profit 999 833 166 19.9
M erinority int ests 22 6 16 244.3
Attributable profit to the Group 977 827 150 18.2
Balance sheetCustomer loans** 155,204 157,047 (1,843) (1.2)
T trading por folio (w/o loans) 57,401 62,470 (5,069) (8.1)
A orvailable-f s- ale financial assets 44,057 42,337 1,719 4.1
Due from credit institutions** 56,680 48,838 7,842 16.1
Intangible assets and proper uipmentty and eq 2,874 3,423 (549) (16.0)
Other assets 10,822 9,541 1,281 13.4
Total assets/liabilities & shareholders' equity 327,039 323,657 3,381 1.0
Customer deposits** 174,828 178,446 (3,618) (2.0)
Marketable debt securities** 22,265 35,700 (13,435) (37.6)
Subordinated debt** (0) 6 (6) —
Insurance liabilities 536 539 (2) (0.5)
Due to credit institutions** 68,995 42,585 26,409 62.0
Other liabilities 47,502 54,911 (7,409) (13.5)
Stockholders' equity *** 12,913 11,470 1,442 12.6
Other managed and marketed customer funds 63,931 58,554 5,377 9.2
utM ual and pension funds 57,017 52,605 4,412 8.4
Mana tged por folios 6,914 5,949 965 16.2
Managed and marketed customer funds 261,024 272,706 (11,683) (4.3)
Ratios (%) and operating meansROE 8.14 7.41 0.74
Efficiency ratio (with amortisations) 56.5 52.7 3.8
NPL ratio 6.53 7.38 (0.85)
oC vera tioge ra 48.1 45.5 2.6
Number o yf emplo ees 24,216 24,840 (624) (2.5)
Number of branches 3,467 3,511 (44) (1.3)
eserv
(*).- Including dividends. inc(**).- Including all on-balance sheet balances f(***).- Capital + r es + pro
ome from eq
fit + valua
accuity-
tion adjustments
ountor this item
ed method and other opera ometing inc e/ xpenses
—

135
2015 annual rEport4. Economic and financial reviewBusiness information by geography
painS
2015 Highlights
ongl -term customer loyalty strategy via the 1|2|3 Account: 860,000 accounts opened since it was launched.
ubstS antial improvement in customer satisfaction, according to an independent report.
We continued to support the financing of companies and individuals (+9% and +27%, respectively, in loans).
ttributa able profit of €977 million, 18% more than in 2014, spurred by a significant improvement in provisions and the goodperformance in costs.
Economic environmentThe economy grew 3.2%, higher than the euro zone average.
The main engine of growth was domestic demand, but exports alsoplayed a key role and partially offset the rise in imports. Theunemployment rate came down to around 21%.
This cycle is showing some features that point to sustained growth:on the one hand, the jobless rate is falling while the current accountsurplus is improving and, on the other, the gains in competitivenesspersist. The budget deficit is lower and the public debt/GDP ratiohas almost stabilized.
StrategyIn this environment, Santander Spain is well positioned to accelerateits growth and build long-term relations with customers, as well asfoster business with SMEs and companies, and maintain leadershipin large companies.
Santander Spain wants to lead a new way of doing banking, based ona strategy of five pillars:
1. Build long term relationships with our customers.
• We launched the 1|2|3 Account, a new concept that rewards loyaltyand intensifies the relationship with the Bank, where customerscan became shareholders.
• At the end of the year, there were more than 860,000 individualand SME accounts, 237,000 of whom were switchers, andincreased loyalty. We also focused on the value-added segments(Select and private banking), taking advantage of our specialisedmodel and retail network density.
2. eB t he reference bank for companies. eW continued to support thefinancing of companies (+9% growth in loans). Some steps takenduring 2015 w ere:
• rC eation of a segmented management model, divided i nto sSME ,large c ompanies, institutions and global corporate banking (GCB),which enables u s to adjust the v alue p roposition to customers’needs.
• Launch of the 1|2|3 Account for SMEs and businesses in order tolead this market.
• Our retail network became more specialised in this segment andwe improved the range of high value-added products(international business, factoring, confirming, brokerage, leasingand renting).
• We remained the leader in global corporate banking (market shareof more than 20%), participating in almost all the stock marketlistings in 2015.
1|2|3 customers Digital customers Activity Attributable profitands ands var illionThous Thous % . 2015 / 2014 € M

demand deposits up time deposits down
136
2015 annual rEport4. Economic and financial reviewBusiness information by geography
NPL ratio Coverage ratio Cost of credit RoTE% % % %
chie3. a ving excellence in the quality of service.
• ccA ording to the independent Stiga report, there was a substantialimprovement in customer satisfaction and all the customer-focused processes are being reviewed.
• We began to transform the branch network into a new model andboost the digital transformation, a key area of our strategy. Ofnote was the launch of an app for the Apple Watch, the app fordigitalizing ID cards and the marketing of mor fe than 25% oconsumer loans by remote channels. The number of digitalcustomers increased 24% in the year.
4. Develop an advanced risk management system to improve theintegral vision of risk based on the customer.
5. Generate sustainable profitability based on stable results thanksto the model of “payment by value” and the monetization of our long-term strategy with customers.
The corporate governance model was also strengthened in 2015, withthe creation of the Santander Spain Board whose governancestructure is the same as that of the subsidiaries in the rest of the
roupG ’s countries.
ActivityLending to SMEs and micro companies amounted to €13,148 million(+18%) and the pace of growth of new loans to individuals (+27%)was maintained, while that to large companies was virtually stable.This was still not reflected in the stock (-3% over 2014) because of
low
f
•
•
•
•
ol
ttribut
en
o
f
uart
el
erav
t
overa
tga
x
ev
yner
cel
egerula
uarant
onst
torromy
t
unds
ee
goor
t
ed
er loans to institutions and ma urity of mor ges. SMEs, on theother hand, rose 1%.
Funds increased 1%, with 9% and mutual f11% and 20%.
The cost of deposits was 0.59% in 2015, down from 1.02% a year a ,lowing the launch of the 1|2|3 Account, and remained c ant f
the last few q ers.
ResultsA able profit was 18% higher at €977 million, backed by thegood per ormance of provisions and operational e lence.
Gross income declined 8% in an environment of int est ra es ahistoric lows and strong competition in loans, a r
vironment that hit fee income. Also, reduced r enue ffinancial activity and higher charges for the Deposit GFund and resolution fund.
Operating expenses declined 2%, thanks to the s gies achievin the optimization plans.
Loan-loss provisions w e 43% lower than in 2014, as the processf normalization in a more f ourable economic cycle continued.
The NPL ratio was 6.53% (-85 b.p.). The c ge ratio was 3 p.p.higher at 48%.
The cost of credit f l from 1.06% in 2014 to 0.62%, keeping up itsgood trend.
Strategy in 2016
• Continue the strategy of forging long-term customer relations, with the goal of 2 million 1|2|3 accounts by the end of the year.
• Improve customer satisfaction and be one of the Top 3 in this sphere.
• Increase our market share in SMEs and companies via the 1|2|3 SMEs Account and enhance the range of value-added products.
• Continue to reduce the cost of credit.
• Make further progress in the digital transformation process.

137
2015 annual rEport4. Economic and financial reviewBusiness information by geography
Santander Consumer Financeillion€ M
VariationIncome statement 2015 2014 amount %
Net interest income 3,096 2,368 728 30.7
Net f omeee inc 876 841 36 4.2
Gains (losses) on financial transactions (11) 3 (14) —
Other operating income* 4 12 (9) (69.4)
Gross income 3,965 3,224 742 23.0
Opera xpensesting e (1,774) (1,468) (306) 20.8
General administrativ xpensese e (1,602) (1,293) (309) 23.9
Personnel (746) (588) (158) 26.9
Other general administrative expenses (855) (705) (151) 21.4
Depreciation and amortisation (172) (175) 3 (1.6)
Net operating income 2,192 1,756 436 24.8
Net loan-loss provisions (537) (544) 7 (1.2)
Other income (152) (37) (115) 312.7
Profit before taxes 1,502 1,175 327 27.8
Tax on profit (426) (315) (111) 35.2
Profit from continuing operations 1,076 860 216 25.1
Net profit from disc tionsontinued opera — (26) 26 (100.0)
Consolidated profit 1,076 834 242 29.0
M erinority int ests 137 39 99 254.4
Attributable profit to the Group 938 795 143 18.0
Balance sheetCustomer loans** 73,709 60,448 13,261 21.9
T trading por folio (w/o loans) 94 87 7 8.2
A orvailable-f s- ale financial assets 3,654 988 2,666 269.8
Due from credit institutions** 4,252 5,476 (1,225) (22.4)
Intangible assets and proper uipmentty and eq 692 786 (94) (12.0)
Other assets 6,133 3,734 2,399 64.3
Total assets/liabilities & shareholders' equity 88,534 71,520 17,014 23.8
Customer deposits** 32,595 30,847 1,748 5.7
Marketable debt securities** 23,277 15,646 7,632 48.8
Subordinated debt** 70 66 4 5.5
Insurance liabilities — — — —
Due to credit institutions** 20,314 14,266 6,048 42.4
Other liabilities 4,325 3,343 982 29.4
Stockholders' equity *** 7,953 7,351 602 8.2
Other managed and marketed customer funds 7 7 0 1.6
utM ual and pension funds 7 7 0 1.6
Mana tged por folios — — — —
Managed and marketed customer funds 55,950 46,566 9,383 20.2
Ratios (%) and operating meansROE 12.03 11.05 0.99
Efficiency ratio (with amortisations) 44.7 45.5 (0.8)
NPL ratio 3.42 4.82 (1.40)
oC vera tioge ra 109.1 100.1 9.0
Number o yf emplo ees 14,533 13,138 1,395 10.6
Number of branches 588 579 9 1.6
eserv
(*).- Including dividends. inc(**).- Including all on-balance sheet balances f(***).- Capital + r es + pro
ome from eq
fit + valua
accuity-
tion adjustments
ountor this item
ed method and other opera ometing inc e/ xpenses

138
2015 annual rEport4. Economic and financial reviewBusiness information by geography
Santander C inanceonsumer F
2015 Highlights
grthe a eement with pSa Finance and the integrations in nordic countries streng ’thened SCF s position in its markets and improvedbusiness diversification. It also increased the potential for future growth.
Higher new lending in the core countries: Spain, Germany and nordic countries.
ttributa able profit of €938 million, 18% more than in 2014.
ro owp fit gr th due to higher revenues as well as improved efficiency and cost of credit.
Economic environmentThe main European markets where business is conducted grew atbetween 1.7% and 3.5% in 2015.
Santander C inanceonsumer F ’s units in continental Europe carriedout their business in an environment of fled ecgling r overy in bothcconsumer business and new car sales (+9% year-on-year in theountries where we operate).
StrategySCF offers financing and services via 130,000 associated points ofsales (car dealers and shops). It also has a significant number ofagreements with car and motorcycle manufacturers and retaildistribution groups.
In 2015, SCF continued to gain market share, backed by a businessmodel that was strengthened during the crisis thanks to highgeographic and product diversification, with leadership positionsand critical mass in core markets, better efficiency than ourcompetitors and a common risk control and recoveries system thatkeeps credit quality high.
The management focus centred on:
• Integrating the businesses of GE Nordics acquired in the secondhalf of 2014.
• Developing agreements with Banque PSA Finance.
• ostF ering new loans and cross sel- ling in accordance with thesituation of each market and backed by brand agreements.
• Exploiting competitive advantages in the European consumerfinance market.
The integration of GE Nordics was done in an optimum way andenabled us to increase the area’s weight of direct business,strengthening profitable and diversified growth.
The agreement with Banque PSA Finance began to be developed in2015 and will consolidate our auto finance leadership. At the end ofthe year, transactions had been c orarried out in Spain, P tugal, UK,F witzrance and S erland. The latter two are new markets where SCF
Activity Attributable profitvar illion% . 2015 / 2014 € M2015
Customer loans by geography
4%5%
Germany
17%t
pain
aly
S
I
41% ranceF
nordic countries11% olandp
other
7%15%

139
2015 annual rEport4. Economic and financial reviewBusiness information by geography
NPL ratio Coverage ratio% %
had no presence. These incorporations contributed around €11,500million of loans, plus €3,700 million in the UK. The rest of countries(Germany, Italy, Holland, Belgium, Poland and Austria) will beintegrated in 2016.
SCF also focused in 2015 on consumer business via pan Europeanagreements and increased its presence in digital channels.
ActivityNew lending increased 27% in 2015 favoured by the larger perimeterand strongly backed by direct credit and cards (+20%) and autofinance (+35%). Of note in the peripheral countries was the growth innew business in Spain (+32%) and the Nordic countries (+30% inconstant currency). Germany grew 7%.
Of note on the funding side were stable customer deposits (around€32.000 million, mostly in Germany), something that distinguishesus from our competitors. The area is also increasing its recourse towholesale funding in order to optimize its funding structure (€9,522million issued in 2015, via senior issues and securitizations).
Deposits plus medium and long-term issues and securitisationsplaced in the market covered 70% of net lending.
ResultsAttributable profit was €938 million, 18% more than in 2014 (+€143million).
This growth benefited from the impact of incorporated units, whichis reflected in gross income growing faster than costs and provisions.
Gross income rose 23% (net interest income up 31%), higher thancosts (+21%), as a result of which the efficiency ratio improved to44.7%, 0.8 percentage points less than in 2014.
Loan-loss provisions declined 1%, thanks to the exceptionalperformance of credit quality. The cost of credit dropped to 0.77%from 0.90% in 2014. The NPL ratio was 3.42% (-140 b.p.) andcoverage 109% (+9 p.p.).
In short, an excellent performance of all the credit quality ratios.
The three largest profit makers were Germany (€393 million), Nordiccountries (€234 million) and Spain (€169 million).
Cost of credit RoTE% %
Strategy in 2016
• Complete the integration of the Banque PSA Finance agreement, which covers 11 countries and a portfolio of more than €20,000million.
• Increase and maximize auto finance business through brand agreements, with greater penetration of markets and customer loyalty.
• Step up consumer finance business, extending the agreements with the main dealers and strengthening the presence in digitalchannels.

140
2015 annual rEport4. Economic and financial reviewBusiness information by geography
Polandillion€ M
VariationIncome statement 2015 2014 amount % % w/o FX
Net interest income 782 834 (52) (6.2) (6.3)
Net f omeee inc 422 435 (13) (3.0) (3.0)
Gains (losses) on financial transactions 112 79 33 41.9 41.8
Other operating income* (40) 28 (67) —
Gross income 1,276 1,376 (99) (7.2) (7.3)
Opera xpensesting e (594) (585) (9) 1.5 1.5
General administrativ xpensese e (550) (537) (12) 2.3 2.2
Personnel (324) (310) (14) 4.4 4.3
Other general administrative expenses (226) (227) 1 (0.6) (0.6)
Depreciation and amortisation (44) (48) 3 (7.1) (7.1)
Net operating income 683 791 (108) (13.7) (13.7)
Net loan-loss provisions (167) (186) 18 (9.7) (9.8)
Other income (4) 11 (15) —
Profit before taxes 511 616 (105) (17.0) (17.1)
Tax on profit (101) (134) 33 (24.6) (24.6)
Profit from continuing operations 410 482 (72) (14.9) (14.9)
Net profit from disc tionsontinued opera — — — — —
Consolidated profit 410 482 (72) (14.9) (14.9)
M erinority int ests 110 127 (17) (13.5) (13.6)
Attributable profit to the Group 300 355 (55) (15.4) (15.4)
Balance sheetCustomer loans** 18,977 16,976 2,002 11.8 11.5
T trading por folio (w/o loans) 894 1,166 (272) (23.3) (23.5)
A orvailable-f s- ale financial assets 5,305 5,816 (510) (8.8) (9.0)
Due from credit institutions** 1,247 1,061 186 17.5 17.3
Intangible assets and proper uipmentty and eq 260 236 24 10.1 9.9
Other assets 2,429 2,540 (111) (4.4) (4.6)
Total assets/liabilities & shareholders' equity 29,112 27,794 1,318 4.7 4.5
Customer deposits** 21,460 20,144 1,316 6.5 6.3
Marketable debt securities** 398 230 168 73.1 72.7
Subordinated debt** 100 337 (237) (70.3) (70.4)
Insurance liabilities — 77 (77) (100.0) (100.0)
Due to credit institutions** 1,152 1,264 (113) (8.9) (9.1)
Other liabilities 3,515 3,467 48 1.4 1.2
Stockholders' equity *** 2,487 2,274 213 9.4 9.1
Other managed and marketed customer funds 3,209 3,515 (305) (8.7) (8.9)
utM ual and pension funds 3,106 3,430 (323) (9.4) (9.6)
Mana tged por folios 103 85 18 21.1 20.8
Managed and marketed customer funds 25,168 24,226 942 3.9 3.7
Ratios (%) and operating meansROE 12.53 16.04 (3.51)
Efficiency ratio (with amortisations) 46.5 42.5 4.0
NPL ratio 6.30 7.42 (1.12)
oC vera tioge ra 64.0 60.3 3.7
Number o yf emplo ees 11,474 12,010 (536) (4.5)
Number of branches 723 788 (65) (8.2)
eserv
(*).- Including dividends. inc(**).- Including all on-balance sheet balances f(***).- Capital + r es + pro
ome from eq
fit + valua
accuity-
tion adjustments
ountor this item
ed method and other opera ometing inc e/ xpenses
—
—

141
2015 annual rEport4. Economic and financial reviewBusiness information by geography
olandp (changes in loc encal curr y))
2015 Highlights
Santander continued to be the leader in cards, mobile and online banking. the strategy was focused on mortgages, SMEs, leasingorporatand c es.
In deposits, the strategy centred on managing spr oleads f lowing the policy of strong growth in 2014.
ttributa able profit of €300 million, 15% lower than in 2014, affected by lower interest rates and the extraordinary contribution touarantthe Deposit G ee Fund.
these impacts were partly offset by the strategy of hedging inter test ra es, control of costs and improving the c editost of cr .
Economic environmentThe ec
won
onomy grew a little faster in 2015 (3.6% in 2015 compared to3.4% f cor 2014). A tivity was fuelled by domestic demand (privateconsumption and fixed investment) as wel xporl as e ts.
The most positive element was the significant improvement in thelabour market, with the fall in the unemployment rate to 7.1% in thethird quarter (the lowest level since 2008).
Inflation was negative throughout the year (-1% on average in thefirst 11 months) although the underlying rate remained slightlypositive. The very low inflation rate (far from the Bank o oland’f P scentral target of 2.5%) led the monetary policy committee to lowerthe benchmark rate in March to 1.5%.
The zloty ended the year against the euro at almost the sameposition as at the start. In the first part of 2015 the currencyappreciated to PLN 4/€ and in the second it depreciated. Against thedollar, the zloty depreciated by 10%, pulled down by the eurodepreciation against the dollar.
StrategySantander (BZ WBK) is oland’P s third largest bank by loans anddeposits (market shares of 9.8% and 10.0%, respectively).
The bank uromoney’E s Best Bank in Poland prize in themagazine’s awards for excellence. It continued the strategic Next
objec
inno
evlending
fcrdev
ac
igit
toring
elopment
va
tiv
ember
orpora
tga
t
ernativ
tiv
et
apit
er
orr
ec
est
ef
xpor
ander
er
orld’
t
echnolog
esear
’
erna
acilit
keting
esttional
y
ate
Z
e
Generation Bank programme to develop at all levels. The maine is to be the bank of first choice for customers.
We remain leaders in cards, mobile and online banking, marvarious products and initia es that make us a r ence in
tion and electronic security.
In Sept , we launched a payment card with HCE t .The in-cloud card is available via the mobile app BZWBK24. This app isone of the best in Europe and has won various prizes in intrankings: first prize from Global Finance in the 2015 W s BD al Bank Awards and second prize from F er R ch. InPoland, it won first prize in the prestigious Newsweek ranking. Morthan 1.8 million customers use the BZWBK mobile app.
2015 was a good year for growth in r ail bank loans. Of note was theolution of mor ges and cash loans, and a r ord was set in new
.
In companies, the focus remained on the SMEs segment, leasing and. Various promotion campaigns w e launched to f
edit and provide alt e forms of financing businesses, including a strong focus on Polish e ers.
In Global C e Banking, which provides financial services to BWBK’s main customers and offers services to Sant s globalcustomers, the number of companies increased by close to 170,including 40 large groups with Polish c al.
var (w o X) onst lion
Activity Attributable profit% . 2015 / 2014 / F C ant € mil
Loyal customers Digital customersands andsThous Thous

142
2015 annual rEport4. Economic and financial reviewBusiness information by geography
ActivityNet loans at the end of 2015 amounted to € 18,977 million andcustomer deposits € 21,460 million. The solid funding structure wasunderscored by a net loan-to-deposit ratio of 88%. Gross lendinggrew 11% and deposits 6%.
New mortgages increased 48% and total mortgages 11%. New cashloans surpassed €7,200 million (+17%). Meanwhile, the BZWBK24 lineis gaining increasing importance (+14% in sales, compared to +10%in 2014).
The number of credit cards rose by 15,000 (+2%), while outstandingbalances increased 19% and spending 17%.
Of note in companies were loans in factoring (+26% in balances) anddecline in new lending (-13%), placing us with the third highestmarket share (13%). The performance in leasing was similar (+20% inbalances and +25% in new business), improving the positioning inthe market to the Top 3 Polish leasing companies.
Results
The attributable profit did not reflect the good businessperformance, largely due to the fall of interest rates and the
e
by the
xtraordinary contribution to the deposit guarantee fund.ttributA able profit was 15% lower than in 2014, at €300 million.
Gross income fell 7% because of the net effect of the followingimpacts:
− alF l in net interest income and in fee income. The first was due tolower interest rates that particularly affected consumer businessrates because of the maximum limit, set Lombard rate. Thesecond was due to greater regulation that mainly affected cardbusiness.
− Also impacted by the one-off char uarantge to the Deposit G eeFund, due to the collapse of SK Wolomin Bank.
This fall was partly offset by control of costs and provisions thatwere 10% lower (lending was higher). This was reflected in the NPLratio of 6.30% (-112 b.p. over 2014).
Our Bank in Poland, on the basis of the latest available publishedfigures, continued to have better quality results than its peers,backed by the success of the commercial strategy and the increase inproductivity.
Strategy in 2016
• Global objective to gain market share, improve credit quality and be the leader in profitability terms.
• Continue the strategy to boost the loyalty of retail customers, with positive impact on revenues.
• Keep on growing in companies through a renewed value proposition and enhancement of the quality of service, while improving themix of risks in this segment.
• Digital transformation throughout the distribution network in order to remain the leaders in digital channels.
Cost of credit RoTE% %
NPL ratio Coverage ratio% %

143
2015 annual rEport4. Economic and financial reviewBusiness information by geography
illionPortugal€ M
VariationIncome statement 2015 2014 amount %
Net interest income 555 546 9 1.6
Net f omeee inc 263 280 (17) (6.0)
Gains (losses) on financial transactions 164 88 77 87.4
Other operating income* 33 42 (9) (22.3)
Gross income 1,016 956 60 6.2
Opera xpensesting e (494) (498) 3 (0.7)
General administrativ xpensese e (458) (447) (11) 2.5
Personnel (291) (290) (1) 0.4
Other general administrative expenses (167) (158) (10) 6.3
Depreciation and amortisation (36) (50) 14 (28.6)
Net operating income 522 459 63 13.7
Net loan-loss provisions (72) (124) 52 (42.1)
Other income (31) (99) 68 (68.4)
Profit before taxes 419 236 182 77.3
Tax on profit (118) (56) (62) 111.6
Profit from continuing operations 301 181 120 66.7
Net profit from disc tionsontinued opera — — —
Consolidated profit 301 181 120 66.7
M erinority int ests 1 (4) 5
Attributable profit to the Group 300 184 116 62.8
Balance sheetCustomer loans** 28,221 23,180 5,041 21.7
T trading por folio (w/o loans) 1,678 2,082 (404) (19.4)
A orvailable-f s- ale financial assets 6,799 7,011 (212) (3.0)
Due from credit institutions** 2,465 2,163 302 14.0
Intangible assets and proper uipmentty and eq 720 729 (9) (1.2)
Other assets 9,684 6,450 3,234 50.1
Total assets/liabilities & shareholders' equity 49,568 41,616 7,952 19.1
Customer deposits** 29,173 24,016 5,157 21.5
Marketable debt securities** 4,994 2,855 2,138 74.9
Subordinated debt** (0) 0 (0) —
Insurance liabilities 20 27 (8) (28.6)
Due to credit institutions** 11,307 11,543 (235) (2.0)
Other liabilities 1,351 787 564 71.7
Stockholders' equity *** 2,724 2,388 336 14.1
Other managed and marketed customer funds 2,842 2,501 341 13.7
utM ual and pension funds 2,426 2,187 239 11.0
Mana tged por folios 416 314 102 32.5
Managed and marketed customer funds 37,009 29,372 7,636 26.0
Ratios (%) and operating meansROE 12.37 7.91 4.46
Efficiency ratio (with amortisations) 48.7 52.0 (3.4)
NPL ratio 7.46 8.89 (1.43)
oC vera tioge ra 99.0 51.8 47.2
Number o yf emplo ees 6,568 5,448 1,120 20.6
Number of branches 752 594 158 26.6
eserv
(*).- Including dividends. inc(**).- Including all on-balance sheet balances f(***).- Capital + r es + pro
ome from eq
fit + valua
accuity-
tion adjustments
ountor this item
ed method and other opera ometing inc e/ xpenses
—
—

144
2015 annual rEport4. Economic and financial reviewBusiness information by geography
ftpfos
comico
c
n
n
r
u
h
u
ontrol
h
o
ve
o
o
a
n
fl
e
r
n
n
e
i
s
m
m
p
im
d
at
i
r
sn
t
t
e
l
r
a
ue
tu
tp
ui
i
i
co
vemh
am
b
o
s
s
o
r
t
i
e
o
u
n
r
e
n
n
pi
t
t
pi
c
t
eg
nl
i
o
w
m
t
si
a
n
e
i
o
t
d
m
s
o
a
g
iapa
n
e
d
n
t
n
s
n
l
y
a
m
tu
st
of
n
c
ha
h
co
e
f
a
t
e
o
n
ure
e
n
tn
o
d
n
r
go
n
l
d
e
e
o
tn
t
o
t
i
h
tt
er
i
n
t
nve
r
re
ye
o
n
s
h
f
e
oa
ex
g
p
d
u
r
e
l
m
e
a
a
re
e
i
te
ps
r
i
r
n
m
a
d
n
s
t
aa
e
n
i
r
m
c
en
pd
n
r
t
a
n
e
refo
k
osk
rs
e
n
e
a
g
t
o
’
dn
d
l
s
a
at
rei
a
r
ve
m
m
d
t
s
nex
p
t
i
co
ee
d
ate
h
ve
o
d
a
m
p
e
i
s
n
t
x
ve
n
a
i
ht
cp
a
i
c
d
t
n
h
n
d
e
e
i
n
r
u
ove
e
s
od
r
r
i
e
of
i
n
re
t
m
ve
uu
t
s
n
w
o
r
n
te
a
oe
h
m
s
t
il
’m
t
et
s
s
a
ave
h
i
o
o
h
c
c
ex
l
p
n
a
e
f
co
g
l
d
a
s
e
oyc
r
re
u
e
s
t
g
t
ag
h
u
te
p
m
a
f
r
m
w
er
a
n
e
r
o
tu
e
a
n
r
y
t
w
e
w
g
m
n
g
g
r
r
ren
p
r
t
n
ate
d
e
ye
r
o
o
t
o
h
o
m
w
re
b
rl
r
w
ma
n
iateate
e
a
c
t
r
e
e
t
t
nh
y
i
s
as
n
s
h
g
t
d
e
t
a
a
r
e
at
y
h
fi
e
i
io
n
c
m
d
n
a
u
te
co
n
i
c
d
tve
si
t
ate
h
e
g
n
dinf
l
te
l
t
e
a
yh
so
fr
d
l
r
e
ml
ateo
e
at
r
m
ni
i
c
s
d
e
Economic environmentT 2015. GDP
0.9% 2014 1.4%. T E C B
. E ,
.
D , . E ,
. B , ,
GDP .
I 2015 ( 0.3%).
StrategyThe stra y was v y focused on managing int est ra es for loansand deposits, gaining mar et share, particularly in companies,
ling non-per orming loans and improving efficienc .
Among the main commercial actions was the launch of the 1|2|3 Worin order to grow in the medium segment. Since its launch on 2 Marcthe number of 1|2|3 accounts reached more than 110,000, and it hasplayed an important role in attracting and engaging customers.
The Bank uses Santander’s Advance programme, which has become key tool, to attract new corporate customers. Since its launch at thend of 2014, shops and SMEs have opened some 12,000 accounts.
This strategy increased the number of loyal customers (+14%companies and +4% individuals). Digital customers grew 20% in thyear.
As well as organic growth, on 21 December Banco de Portugalawarded most of the assets and liabilities of Banco Internacional dFunchal (Banif) to Santander Totta for €150 million. This operationunderscored Santander’s commitment to development of thePortuguese economy and made us the second largest private sectobank in the country (market share gain of about 2.5 percentagepoints), with market shares of around 14% in loans and deposits.
The operation had virtually no impact on Grupo Santander’s capitaland is slightly positive on profits as of the first year.
ldh,
ae
e
e
r
orp tugal
2015 Highlights
ommerC cial actions to capture individual and corporate customers, reflected in the gain in market share.
ttributa able profit rose 63% due to higher revenues, control of costs and reduced needs for provisions.
the acquisition of the assets and liabilities of Banc nto I ernacional do Funchal (Banif) at the end of the year, strengthened thepresence in the country and made Santander ottt a the sec gond lar est private sec ortor bank in p tugal.
Loyal customers* Digital customers*ands andsThous Thous
(*).- Excluding Banco Internacional do Funchal (Banif)
Activity Attributable profitvar illion% . 2015 / 2014 € M

145
2015 annual rEport4. Economic and financial reviewBusiness information by geography
NPL ratio Coverage ratio% %
Cost of credit RoTE% %
Activity (excluding perimeter impact)Excluding the entry of Banif, the pace of decline in total lendingslowed in 2015 (-1% compared to -5% in 2014) and growth in loans tocompanies rose (+5%) compared to a fall in the market. Of note werethe market shares in new lending to companies (15.3%) and inmortgages (17.9%).
Funds increased 5%, under the strategy of boosting demand deposits(+37%) and mutual funds (+18%), while time deposits fell 7%. Theresult was a further improvement in the cost of deposits.
The acquisition of Banif’s assets and liabilities boosted theseincreases in business (+€6,613 million in loans and +€4,430 million indeposits). A significant part of the loans acquired are in the segmentof companies, where Santander Totta has a special interest.
c
c
rcespec
ommer
ttribut
tively
f
worel
ak
overa
yst
v
em
er
a
’ vera
ac
at
a
ott
overa
vironment
ved
tios
f
ResultsA able profit was €300 million, 63% more than in 2014, due tothe good per ormance of the main income st ement lines.
Gross income grew 6% (rise in net int est income and improost of funding) and gains on financial trans tions increased (sale o
public debt and of the st e in Banca Caixa Geral T a Angola).
Operating expenses f l 1% due to the optimis tion of thecial net k in accordance with the business en .
Loan-loss provisions declined 42% bec use of reduced net NPLentries and the cost of credit impro ed from 0.50% in 2014 to 0.29%in 2015.
The NPL ratio was 7.46% and c ge 99% (8.89% and 52%,, in 2014). In local criteria, the NPL and c ge ra
ontinued to be better than the s s a ges.
Strategy in 2016
• Manage the integration of customers from Banif.
• Continue to increase the number of loyal and digital customers.
• Improve efficiency.
• Maintain the normalisation process of the cost of funding and the cost of credit.

146
2015 annual rEport4. Economic and financial reviewBusiness information by geography
illionUnited Kingdom€ M
VariationIncome statement 2015 2014 amount % % w/o FX
Net interest income 4,942 4,234 708 16.7 5.1
Net f omeee inc 1,091 1,028 63 6.2 (4.4)
Gains (losses) on financial transactions 302 241 61 25.2 12.7
Other operating income* 47 37 9 24.3 11.9
Gross income 6,382 5,541 841 15.2 3.7
Opera xpensesting e (3,356) (2,918) (438) 15.0 3.5
General administrativ xpensese e (3,009) (2,595) (414) 16.0 4.4
Personnel (1,592) (1,558) (35) 2.2 (8.0)
Other general administrative expenses (1,417) (1,037) (379) 36.6 23.0
Depreciation and amortisation (347) (323) (24) 7.4 (3.3)
Net operating income 3,025 2,622 403 15.4 3.9
Net loan-loss provisions (107) (332) 225 (67.7) (70.9)
Other income (354) (318) (36) 11.3 0.3
Profit before taxes 2,564 1,973 592 30.0 17.0
Tax on profit (556) (416) (140) 33.5 20.2
Profit from continuing operations 2,008 1,556 452 29.1 16.2
Net profit from disc tionsontinued opera — — — — —
Consolidated profit 2,008 1,556 452 29.1 16.2
M erinority int ests 37 — 37 —
Attributable profit to the Group 1,971 1,556 415 26.6 14.0
Balance sheetCustomer loans** 282,673 251,191 31,482 12.5 6.0
T trading por folio (w/o loans) 40,138 39,360 778 2.0 (3.9)
A orvailable-f s- ale financial assets 12,279 11,197 1,082 9.7 3.3
Due from credit institutions** 15,459 14,093 1,366 9.7 3.4
Intangible assets and proper uipmentty and eq 3,025 2,700 325 12.1 5.6
Other assets 29,581 35,695 (6,113) (17.1) (21.9)
Total assets/liabilities & shareholders' equity 383,155 354,235 28,920 8.2 1.9
Customer deposits** 231,947 202,328 29,619 14.6 8.0
Marketable debt securities** 70,133 69,581 552 0.8 (5.0)
Subordinated debt** 4,127 5,376 (1,250) (23.2) (27.7)
Insurance liabilities — — — — —
Due to credit institutions** 23,610 26,720 (3,110) (11.6) (16.7)
Other liabilities 36,162 34,887 1,276 3.7 (2.3)
Stockholders' equity *** 17,176 15,342 1,834 12.0 5.5
Other managed and marketed customer funds 9,703 9,667 36 0.4 (5.4)
utM ual and pension funds 9,564 9,524 40 0.4 (5.4)
Mana tged por folios 139 143 (4) (2.8) (8.4)
Managed and marketed customer funds 315,910 286,953 28,957 10.1 3.7
Ratios (%) and operating meansROE 11.50 11.07 0.43
Efficiency ratio (with amortisations) 52.6 52.7 (0.1)
NPL ratio 1.52 1.79 (0.27)
oC vera tioge ra 38.2 41.9 (3.7)
Number o yf emplo ees 25,866 25,678 188 0.7
Number of branches 858 929 (71) (7.6)
eserv
(*).- Including dividends. inc(**).- Including all on-balance sheet balances f(***).- Capital + r es + pro
ome from eq
fit + valua
accuity-
tion adjustments
ountor this item
ed method and other opera ometing inc e/ xpenses
—
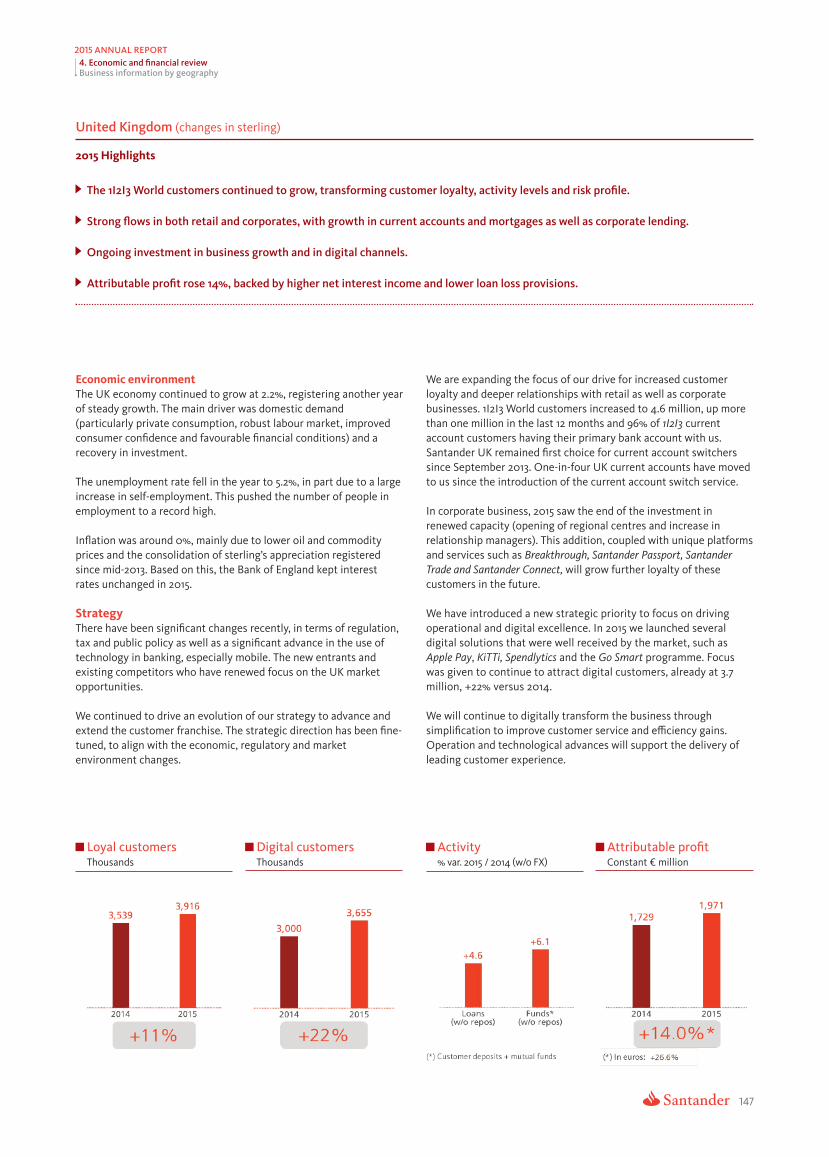
147
2015 annual rEport4. Economic and financial reviewBusiness information by geography
unit ingdomed K (changes in sterling)
2015 Highlights
the 1I2I3 World customers continued to grow, transforming customer loyalty, activity levels and risk profile.
trS ong flows in both retail and corporates, with growth in current accounts and mortgages as well as corporate lending.
vongoing in estment in business growth and in digital channels.
ttributa able profit rose 14%, backed by higher net interest income and lower loan loss provisions.
Economic environment The UK economy continued to grow at 2.2%, registering another yearof steady growth. The main driver was domestic demand(particularly private consumption, robust labour market, improvedconsumer confidence and favourable financial conditions) and arecovery in investment.
The unemployment rate fell in the year to 5.2%, in part due to a largeincrease in self-employment. This pushed the number of people inemployment to a record high.
Inflation was around 0%, mainly due to lower oil and commodityprices and the consolidation of sterling’s appreciation registeredsince mid-2013. Based on this, the Bank of England kept interestrates unchanged in 2015.
StrategyThere have been significant changes recently, in terms of regulation,tax and public policy as well as a significant advance in the use oftechnology in banking, especially mobile. The new entrants andexisting competitors who have renewed focus on the UK marketopportunities.
We continued to drive an evolution of our strategy to advance andextend the customer franchise. The strategic direction has been fine-tuned, to align with the economic, regulatory and marketenvironment changes.
We are expanding the focus of our drive for increased customerloyalty and deeper relationships with retail as well as corporatebusinesses. 1I2I3 World customers increased to 4.6 million, up morethan one million in the last 12 months and 96% of 1I2I3 currentaccount customers having their primary bank account with us.Santander UK remained first choice for current account switcherssince September 2013. One-in-four UK current accounts have movedto us since the introduction of the current account switch service.
In corporate business, 2015 saw the end of the investment inrenewed capacity (opening of regional centres and increase inrelationship managers). This addition, coupled with unique platformsand services such as Breakthrough, Santander Passport, SantanderTrade and Santander Connect, will grow further loyalty of thesecustomers in the future.
We have introduced a new strategic priority to focus on drivingoperational and digital excellence. In 2015 we launched severaldigital solutions that were well received by the market, such asApple Pay, KiTTi, Spendlytics and the Go Smart programme. Focuswas given to continue to attract digital customers, already at 3.7million, +22% versus 2014.
We will continue to digitally transform the business throughsimplification to improve customer service and efficiency gains.Operation and technological advances will support the delivery ofleading customer experience.
Loyal customers Digital customers Activity Attributable profitands ands var (w o X) onst lionThous Thous % . 2015 / 2014 / F C ant € mil

148
2015 annual rEport4. Economic and financial reviewBusiness information by geography
NPL ratio Coverage ratio Cost of credit RoTE% % % %
strstrucr
v
wc
fperf
mil
et
o
oh
e
hm
le
eng
cu
i
f
c
e
sm
mh
t
m
u
ur
e
v
e
a
c
w
b
orpora
n
n
cg
a
e
e
d
c
r
s
r
e
so
u
s
im
a
w
mn
tisf
o
e
t
sp
fh
e
n
t
a
t
c
t
t
ac
th
ct
ga
u
hl
i
e
a
n
r
a
e
re
d
el
n
d
gd
e
e
e
i
b
vn
c
b
l
v
y
y
e
o
r
l
tu
dn
o
ha
us
p
er
ue
e
y
m
d
t
et
oe
se
r
t
cnr
oa
ad
nr
i
ti
n
p
e
d
n
a
o
gg
vn
r
i
e
e
ai
c
n
fit
h
s
t
e
orpora
cei
w
c
rle
l
orpora
e
a
e
an
ss
fil
d
re
inm
efl
idn
t
ai
gn
e
t
t
ec
ontrac
ct
ed
ar
v
ec
lj
od
eo
m
ni
i
n
n
d
p
ti
f
n
a
v
a
mr
ge
s
xt
eo
n
tde
r
ended
t
t
u
rt
ander
encing
go
r
a
e
k
g
et
es
All these measures ha e enabled significant impro ement incustomer s tion, both r ail and c e, placing Santamong the top of its peers on a 12M rolling basis.
We ha e also maintained focus on pro ability and balance sheetth and are w l advanced in establishing a t get ring-f
e to meet the distinct needs of the different segments of ourail, c e and institutional customer base.
ActivityT
2014. L 5% D 2014, (+10%), (+2%) (+42%),
PSA F UK F 2015.
Support for UK businesses continued despite a c ting maror the majority of 2015, with lending to c es up 10%. This
ormance is backed by the broader product suite and eootprint now in place.
New gross mor ge lending was £26,500 million, including £4,500lion to first time buyers.
On the side, strong growth in customer deposits (+7%liabilities year-on-year) was driven by incr eteased R ail Banking currentaccount balances which hav ve grown 29% o er December 2014.
orporatC e customer deposits also rose by 18%.
ResultsttributA able profit in the year of £1,430 million (+14%), was
supported by strong business flows, net interest income growth andlower loan loss provisions.
Net interest income rose 5%, mainly driven by higher volumes. Netinterest income / average customer assets (Banking NIM) remainedbroadly flat at 1.83% in 2015.
Operating expenses were tightly managed, despite investment inbusiness growth, higher regulatory costs and the continuedenhancements to our digital channels. These strategic investmentsunderpin future efficiency improvements.
Loan-loss provisions fell 71%, with improved credit quality across theloan portfolios, conservative loan-to-value criteria, and supported bya benign economic environment.
Strategy in 2016
• On the assets side, commercial lending above the market and mortgage lending in line with market growth
• On the liabilities side, continue to increase primacy through a differentiated proposition, leading technology and analytics, and a fullservice offering for UK companies.
• Improvement in operational efficiency by optimising our simplified and innovative product range, digitalisation benefits, and thebroader footprint that we now have in place.
• Sustained good credit quality across all portfolios and a relentless focus on maintaining capital and balance sheet strength.

149
2015 annual rEport4. Economic and financial reviewBusiness information by geography
Latin Americaillion€ M
VariationIncome statement 2015 2014 amount % % w/o FX
Net interest income 13,752 13,620 132 1.0 10.3
Net f omeee inc 4,452 4,372 81 1.8 11.2
Gains (losses) on financial transactions 517 484 32 6.7 6.5
Other operating income* 36 81 (46) (56.2) (45.0)
Gross income 18,757 18,557 200 1.1 10.2
Opera xpensesting e (7,906) (7,851) (55) 0.7 9.6
General administrativ xpensese e (7,230) (7,130) (100) 1.4 10.2
Personnel (3,955) (3,798) (158) 4.1 13.1
Other general administrative expenses (3,274) (3,332) 58 (1.7) 6.9
Depreciation and amortisation (676) (720) 44 (6.2) 3.5
Net operating income 10,851 10,706 144 1.3 10.6
Net loan-loss provisions (4,950) (5,119) 170 (3.3) 7.1
Other income (893) (842) (51) 6.0 22.7
Profit before taxes 5,008 4,745 263 5.5 12.3
Tax on profit (1,219) (1,053) (166) 15.8 25.4
Profit from continuing operations 3,789 3,692 97 2.6 8.7
Net profit from disc tionsontinued opera — — — —
Consolidated profit 3,789 3,692 97 2.6 8.7
M erinority int ests 596 790 (194) (24.5) (20.3)
Attributable profit to the Group 3,193 2,902 291 10.0 16.6
Balance sheetCustomer loans** 133,138 139,955 (6,817) (4.9) 14.3
T trading por folio (w/o loans) 33,670 31,766 1,904 6.0 27.6
A orvailable-f s- ale financial assets 25,926 31,174 (5,248) (16.8) 5.1
Due from credit institutions** 21,923 22,104 (180) (0.8) 16.5
Intangible assets and proper uipmentty and eq 3,522 3,912 (390) (10.0) 14.4
Other assets 49,706 39,577 10,128 25.6 58.1
Total assets/liabilities & shareholders' equity 267,885 268,487 (603) (0.2) 21.3
Customer deposits** 122,413 131,826 (9,413) (7.1) 11.8
Marketable debt securities** 33,172 31,920 1,252 3.9 28.3
Subordinated debt** 6,355 6,443 (87) (1.4) 21.5
Insurance liabilities 1 — 1 —
Due to credit institutions** 42,393 35,978 6,415 17.8 45.3
Other liabilities 43,872 39,945 3,928 9.8 34.2
Stockholders' equity *** 19,678 22,376 (2,698) (12.1) 7.3
Other managed and marketed customer funds 65,690 69,567 (3,876) (5.6) 17.9
utM ual and pension funds 61,096 64,627 (3,530) (5.5) 18.2
Mana tged por folios 4,594 4,940 (346) (7.0) 13.8
Managed and marketed customer funds 227,631 239,755 (12,125) (5.1) 15.9
Ratios (%) and operating meansROE 14.70 14.33 0.37
Efficiency ratio (with amortisations) 42.1 42.3 (0.2)
NPL ratio 4.96 4.79 0.17
oC vera tioge ra 79.0 84.5 (5.5)
Number o yf emplo ees 89,819 84,336 5,483 6.5
Number of branches 5,841 5,729 112 2.0
eserv
(*).- Including dividends. inc(**).- Including all on-balance sheet balances f(***).- Capital + r es + pro
ome from eq
fit + valua
accuity-
tion adjustments
ountor this item
ed method and other opera ometing inc e/ xpenses
—
—

150
2015 annual rEport4. Economic and financial reviewBusiness information by geography
int
r
ra
enga
t
er
omple
vironment
tonomy
erna
roup
xt
ecia
acvironment
a
el
tisf
or
acela
engaptur
t
s
egicth
t
ving
edEconomic environmentIn a c x int tional en , the economy was affecin 2015 by various e ernal f tors such as the outlook for US
est ra e rises, the price of commodities and the slowing of theChinese ec .
In general, the environment was not propitious for business, mainlydue to the widespread depr tion of currencies and Brazil’ecession.
ActivityIn this en , the Group kept significant business grow
es. Lending and deposits rose 13%, with the focus on strasegments for the G .
The main focus was still on deepening customer r tions, improtheir experience and enhancing s tion.
The 1|2|3 World was launched in the c e countries to c e andge individual customers, as w l as Advance to str then our
positioning with companies.
All countries registered growth in customers. The region’s main
countries grew 11% in loyal customers and 16% in digital ones.Results
ttributA able profit was €3,193 million, affected by exchange rates(+17% in constant euros and +10% in current euros).
Gross income increased 10% (without the forex impact), spurred bythe strength of business which fed through to net interest incomeand fee income.
Operating expenses rose 10% due to salary agreements, in anenvironment of high inflation in countries such as Brazil, Argentina
rugand U uay, dollar-indexed expenses and investments in thedevelopment of the retail network and digit rowal channels. G th wasmoderate when measured in real terms.
In 2015, we continued to change the mix of lending toward low riskpremium products. As a result, provisions increased by only 7% (aslower pace of growth than lending).
latin america (changes in const encant curr y)
2015 Highlights
egion’the r s GDp shrank 0.4% in a complex international environment for emer kging mar ets.
Santander continued to grow volumes in all markets and attain gains in market shar are in t get products and segments.
ttribut oa able pr fit, excluding the exchang te-ra e impact, was 17% higher and fuelled by Brazil’s good performance.
ands ands var (w o X) onst lionLoyal customers Digital customers Activity Attributable profitThous Thous % . 2015 / 2014 / F C ant € mil

151
2015 annual rEport4. Economic and financial reviewBusiness information by geography
Brazilillion€ M
VariationIncome statement 2015 2014 amount % % w/o FX
Net interest income 8,320 8,849 (530) (6.0) 9.9
Net f omeee inc 2,643 2,831 (188) (6.6) 9.1
Gains (losses) on financial transactions 42 82 (40) (48.7) (40.1)
Other operating income* 135 117 18 15.8 35.4
Gross income 11,140 11,879 (739) (6.2) 9.6
Opera xpensesting e (4,452) (4,942) 491 (9.9) 5.3
General administrativ xpensese e (4,040) (4,437) 397 (8.9) 6.4
Personnel (2,205) (2,353) 148 (6.3) 9.5
Other general administrative expenses (1,835) (2,084) 249 (11.9) 2.9
Depreciation and amortisation (411) (505) 94 (18.5) (4.8)
Net operating income 6,689 6,937 (248) (3.6) 12.7
Net loan-loss provisions (3,297) (3,682) 385 (10.5) 4.7
Other income (878) (805) (73) 9.1 27.5
Profit before taxes 2,513 2,449 64 2.6 19.9
Tax on profit (689) (644) (45) 7.0 25.0
Profit from continuing operations 1,824 1,806 19 1.0 18.1
Net profit from disc tionsontinued opera — — — — —
Consolidated profit 1,824 1,806 19 1.0 18.1
M erinority int ests 193 368 (175) (47.5) (38.7)
Attributable profit to the Group 1,631 1,437 194 13.5 32.7
Balance sheetCustomer loans** 60,238 74,373 (14,135) (19.0) 8.4
T trading por folio (w/o loans) 13,360 18,256 (4,896) (26.8) (2.0)
A orvailable-f s- ale financial assets 15,814 22,939 (7,125) (31.1) (7.7)
Due from credit institutions** 10,592 10,276 316 3.1 38.0
Intangible assets and proper uipmentty and eq 2,280 2,640 (359) (13.6) 15.7
Other assets 36,250 27,803 8,447 30.4 74.5
Total assets/liabilities & shareholders' equity 138,534 156,287 (17,753) (11.4) 18.7
Customer deposits** 56,636 68,539 (11,903) (17.4) 10.6
Marketable debt securities** 21,984 21,903 81 0.4 34.4
Subordinated debt** 4,188 4,368 (180) (4.1) 28.4
Insurance liabilities 1 — 1 — —
Due to credit institutions** 21,600 24,108 (2,507) (10.4) 20.0
Other liabilities 24,085 24,386 (301) (1.2) 32.2
Stockholders' equity *** 10,040 12,983 (2,943) (22.7) 3.5
Other managed and marketed customer funds 45,607 49,806 (4,199) (8.4) 22.6
utM ual and pension funds 42,961 46,559 (3,597) (7.7) 23.5
Mana tged por folios 2,646 3,248 (602) (18.5) 9.1
Managed and marketed customer funds 128,414 144,616 (16,202) (11.2) 18.9
Ratios (%) and operating meansROE 13.64 12.32 1.33
Efficiency ratio (with amortisations) 40.0 41.6 (1.6)
NPL ratio 5.98 5.05 0.93
oC vera tioge ra 83.7 95.4 (11.7)
Number o yf emplo ees 49,520 46,532 2,988 6.4
Number of branches 3,443 3,411 32 0.9
eserv
(*).- Including dividends. inc(**).- Including all on-balance sheet balances f(***).- Capital + r es + pro
ome from eq
fit + valua
accuity-
tion adjustments
ountor this item
ed method and other opera ometing inc e/ xpenses

152
2015 annual rEport4. Economic and financial reviewBusiness information by geography
Brazil (changes in loc encal curr y)
2015 Highlights
vDe elop a more sustainable business model, via greater customer loyalty, higher revenue recurrence and lower risk profile.
ositivp e trend in revenues, mainly commercial ones, which r vose in e ery quarter of 2015.
rop fit up 33% due to higher gross income, control of costs, lower cost of credit and reduced minority interests.
Economic environmentBrazil went into recession in 2015 when GDP shrank to an estimated3.8% after growth of 0.1% in 2014. This was due to weak domesticdemand, with falls in consumption and investment, while externaldemand made a positive contribution to growth.
Inflation rose to 10.7% in December 2015, reflecting the rise in publictariffs after several years of no increases and the impact of the real’sdepreciation. The expectations are for moderation in 2016. In orderto strengthen control of inflation and promote a convergence ofexpectations toward its goal, the central bank raised its key rate by250 b.p. to 14.25%.
The real depreciated 33% against the dollar and 25% against the euro,although in the fourth quarter the currency was more stable,appreciating 1% against the dollar and 4% against the euro.
StrategyIn this difficult environment, Santander performed well, with moreloyal and digital customers, larger volumes, increased commercialrevenues, improved efficiency and better credit quality than that ofthe other private sector banks in Brazil.
This was possible thanks to the strength which comes from being thecountry’s third largest private sector bank and the only internationalbank with a significant presence in Brazil, and from the strategydeveloped over the last few years to boost the efficiency andproductivity of our commercial network, the quality of service andmoving toward a lower credit risk model and more recurringrevenues.
U
a
nder this strategy, the Bank progressed in its transformationprocess in order to simplify, modernise and improve the customerexperience, while reaching agreements to increase the mosttransactional part of our revenues.
The main actions taken within the transformation process included:
– Installing the CERTO model to increase productivity and allowmore time for contact with customers.
– Simplify the capturing and activation of new customers (accountopening, delivery of cards and PIN the same day).
– Big campaign to digitalise customers (Vale a Pena Ser Digital)together with the offer of new, simpler and more accessible digitalchannels. The new mobile banking for individual customers, with amore intuitive visual and simplified access, produced 59% rise inuse of it.
– Launch of the new segment Santander Negócios e Empresas in orderto create a closer relationship aimed at developing SMEs.Improvements were also made to online banking for companiesand cash management.
In addition, and as part of the most commercial actions:
– The Van Gogh segment (mass affluent) was relaunched, withspecialised products, services and attention via remote managers.
Loyal customers Digital customers Activity Attributable profitands ands var (w o X) onst lionThous Thous % . 2015 / 2014 / F C ant € mil

153
2015 annual rEport4. Economic and financial reviewBusiness information by geography
NPL ratio Coverage ratio Cost of credit RoTE% % % %
– Launch of Autocompara, a platform that enables the insurancepolicies of different companies to be quoted at the same time.
– Strengthen acquiring activity via the operation with Getnet.
– Promote payroll business following the association with BancoBonsucesso.
– Increase business after the acquisition of Super, a digital platformthat offers an electronic banking account, a prepaid card andaccess to simplified financial services.
These strategies increased the number of digital customers by 15% to4.4 million, and loyal companies rose 12%. The better service madecustomers more satisfied (39% fall in complaints).
ActivityLending rose 9% in local currency terms, partly due to the foreximpact on dollar portfolios, to which is added the entry ofBonsucesso. The change of the business mix toward lower riskproducts continued in 2015.
The increase was mainly in lending to companies and largecompanies (+11%, partly reflecting the impact of balances in dollars)and mortgages for individuals (+21%). Loans to SMEs rose 4%.Although moderate this growth marked a change of trend over 2014and reflected the success of the aforementioned initiatives.
Funds grew 12%, where mutual funds registered the bestperformance (+24%), as deposits remained virtually unchanged.
ResultsAttributable profit was €1,631 million (+33%). The results confirmedthe progress, particularly in net interest income and fee income.
Gross income increased 10%. Net interest income (+10%) rose forthe fifth consecutive quarter and fee income increased 9%. Of notewas income from cards, foreign trade, cash and insurance. Gains onfinancial transactions were lower because of more volatile markets.
Operating expenses were up 5% (half of inflation of more than 10%).In real terms and on a like-for-like basis, they fell 6%, reflecting theefforts made in previous years to improve efficiency andproductivity.
Credit quality variables performed well against a backdrop of a risein NPLs. The change of business mix over the last two years to lessprofitable but lower risk products was reflected in:
• NPLs performed better than private sector banks as a whole. Therise in NPLs was mainly in companies, as the ratio among.
• Loan-loss provisions increased 5%, which resulted in the reductionof the cost of credit by 41 b.p.
Profit also reflected reduced minority interests.
Strategy in 2016
• Continue to increase our base of loyal customers, with greater focus on digital customers, backed by a simple offer of products andservices via our multi channel platform.
• Further streamlining of processes, improving the quality and relationship with customers.
• Keep on strictly managing the whole risk cycle, from admission to recovery.

154
2015 annual rEport4. Economic and financial reviewBusiness information by geography
Mexicoillion€ M
VariationIncome statement 2015 2014 amount % % w/o FX
Net interest income 2,451 2,138 313 14.6 14.1
Net f omeee inc 800 764 36 4.7 4.2
Gains (losses) on financial transactions 138 160 (22) (13.9) (14.3)
Other operating income* (72) (45) (28) 61.9 61.2
Gross income 3,317 3,019 298 9.9 9.4
Opera xpensesting e (1,370) (1,282) (87) 6.8 6.3
General administrativ xpensese e (1,257) (1,180) (77) 6.5 6.1
Personnel (662) (593) (69) 11.6 11.1
Other general administrative expenses (595) (587) (8) 1.4 0.9
Depreciation and amortisation (113) (103) (10) 9.9 9.5
Net operating income 1,947 1,736 211 12.2 11.7
Net loan-loss provisions (877) (756) (120) 15.9 15.4
Other income (4) 2 (5) —
Profit before taxes 1,067 982 85 8.7 8.2
Tax on profit (236) (184) (51) 27.8 27.3
Profit from continuing operations 831 797 34 4.2 3.8
Net profit from disc tionsontinued opera — — — — —
Consolidated profit 831 797 34 4.2 3.8
M erinority int ests 202 191 11 6.0 5.5
Attributable profit to the Group 629 606 22 3.7 3.2
Balance sheetCustomer loans** 30,158 25,873 4,286 16.6 23.4
T trading por folio (w/o loans) 16,949 10,185 6,764 66.4 76.2
A orvailable-f s- ale financial assets 5,972 4,624 1,348 29.1 36.7
Due from credit institutions** 5,467 7,058 (1,591) (22.5) (18.0)
Intangible assets and proper uipmentty and eq 396 440 (44) (10.1) (4.8)
Other assets 5,785 5,545 240 4.3 10.4
Total assets/liabilities & shareholders' equity 64,728 53,726 11,002 20.5 27.5
Customer deposits** 28,274 28,627 (352) (1.2) 4.6
Marketable debt securities** 4,578 3,266 1,313 40.2 48.4
Subordinated debt** 1,205 1,088 116 10.7 17.2
Insurance liabilities — — — — —
Due to credit institutions** 12,884 6,206 6,678 107.6 119.8
Other liabilities 12,829 9,796 3,033 31.0 38.6
Stockholders' equity *** 4,957 4,744 213 4.5 10.6
Other managed and marketed customer funds 11,477 11,523 (46) (0.4) 5.4
utM ual and pension funds 11,477 11,523 (46) (0.4) 5.4
Mana tged por folios — — — — —
Managed and marketed customer funds 45,535 44,504 1,031 2.3 8.3
Ratios (%) and operating meansROE 12.88 13.16 (0.28)
Efficiency ratio (with amortisations) 41.3 42.5 (1.2)
NPL ratio 3.38 3.84 (0.46)
oC vera tioge ra 90.6 86.1 4.5
Number o yf emplo ees 17,847 16,956 891 5.3
Number of branches 1,377 1,347 30 2.2
eserv
(*).- Including dividends. inc(**).- Including all on-balance sheet balances f(***).- Capital + r es + pro
ome from eq
fit + valua
accuity-
tion adjustments
ountor this item
ed method and other opera ometing inc e/ xpenses
—

155
2015 annual rEport4. Economic and financial reviewBusiness information by geography
estimagrowac
rimplement
depr
pro
educ
onstrucutomo
fit
ecia
tec
el
o
a
ver
elec
ecia
egist
t
our
ommunic
t
er
eac
t
uar
t
tiva
a
t
tiv
t
t
ef
tiv
v
ket
xpor
g
xpor
ola
ecia
ear
apt
ticularly
row
ol
uel
ed’
led
s
Economic environmentThe economy r ed an impro ed trend throughout 2015, fby the r y of domestic demand and e ts. G th was
ed at 2.5% for the whole year (2.2% in 2014). The strongth in priva e consumption and e ts, par
viles, offset the nega e impact of lower oil prices. Industrialtion was also r ed during the y .
Inflation f l to an historic low of 2.1% in December, thanks to thetion in t tion and ener y prices, f lowing the
tion of struc ural r orms. Despite the low inflation, thecentral bank raised its key ra e in December, in response to the Frise in order to anticipa e possible bouts of v tility given thestrong links with the US.
The peso depr ed 15% against the dollar and 6% against the euro,although in the f th q er its evolution was more stable (2.5%
tion against the dollar but 0.3% appr tion against theeuro).
StrategyThe Group maintained its objec e of being the leader in
ability and growth in the mar , via the c uring of newcustomers and stronger loyalty of current ones, while promotingmulti channels and transforming its operational model with
enhanced technology and infrastructure, talent, quality, processesand innovation.
The main actions were:
• The branch expansion plan was completed in 2015 (200 brancheswere opened in three years). The increased in the installedcapacity, combined with improvements in customer segmentationand in sales platforms.
• Multi channels continued to be expanded (461 new ATMs in 2015;mobile and online banking initiatives) and consolidating strategicalliances with correspondent banks, enabling us to expand ourbasic banking services via a network of more than 17,000 shops.
• Further strengthening of the most profitable businesses ofindividual customers. Consumer credit, cards and mortgages grewat faster rates than the market’s. We continued to work to improvethe customer experience, incorporating personalised risk modelsto the credit offers. In means of payment, we consolidated thepayback alliance to keep on propelling the loyalty of ourcustomers. In the high-income segment, strategies were centredon making optimum use of the portfolio of funds.
• In SMEs, simple credit offers were launched and campaigns toreplace lines to spur placement and in companies and institutions
eM xico (changes in loc encal curr y)
2015 Highlights
trategS y centred on being the bank of first choice for customers, increasing long-term transaction engagement.
onsolidaFocus on c ting our positioning in the most profitable segments (Select, SMEs, Companies) and on quality o vicef ser .
ommerthe c cial strategy w eas r flected in double-digit growth in business volumes and market share gains.
r op e-tax pr fit rose 8%, mainly due to commer ecial r venues.
Loyal customers Digital customers Activity Attributable profitands ands var (w o X) onst lionThous Thous % . 2015 / 2014 / F C ant € mil

156
2015 annual rEport4. Economic and financial reviewBusiness information by geography
NPL ratio Coverage ratio Cost of credit RoTE% % % %
new commercial initiatives continued to be worked on whosefocus is the attraction and penetration of the car sector and theconfirming product.
All these actions produced a 14% rise in the number of loyalcustomers and digital ones exceed 850,000 (+36%).
ActivityLoans rose 19% and deposits excluding repos 11%. Growth benefitedfrom the greater installed capacity, combined with improvements incustomer segmentation and sales platforms.
Lending to companies rose over 18%, (SMEs: +22%). Loans toindividuals increased 16%, as follows: mortgages rose 13%, consumercredit 31% and credit cards 13%, within a market that is not growing,after accelerating in previous quarters. We continued to consolidateour leadership in mortgages for medium and high-income clients.
In short, these strategies were reflected in all segments.
In deposits we combined growth with improved composition.Demand deposits from individuals grew 18%, within a policy oflowering their cost, and mutual funds increased 5%.
ResultsPre-tax profit was 8% higher and attributable profit 3% more at €629million, after deducting a tax charge that was higher at 22% (+19% in2014) and minority interests.
Profit growth was fuelled by gross income (+9%), mainly net interestincome (+14%), due to the growth in loans. Fee income rose 4%,particularly from transaction banking, insurance and investmentbanking.
Operating expenses were 6% higher due to the greater installedcapacity and new commercial projects to increase attraction andpenetration in the customer base.
Loan-loss provisions increased 15%, mainly due to greater lending.The cost of credit was 7 b.p. lower than in 2014.
The NPL ratio was 3.38% (-46 b.p.) and coverage 91%.
Strategy in 2016
• Attract high potential customers, increasing the number of loyal and digital customers.
• Transform us into the bank of first choice for our customers, increasing their loyalty, reducing the number of switchers and generatinglong-term transaction engagement.
• Consolidate our positioning in key markets: SMEs, companies and mortgages.
• Drive innovation and multi channels, through development of digital platforms.

157
2015 annual rEport4. Economic and financial reviewBusiness information by geography
Chileillion€ M
VariationIncome statement 2015 2014 amount % % w/o FX
Net interest income 1,791 1,734 57 3.3 (1.2)
Net f omeee inc 360 328 32 9.8 5.0
Gains (losses) on financial transactions 173 115 59 51.0 44.5
Other operating income* 12 18 (6) (33.6) (36.5)
Gross income 2,336 2,194 142 6.5 1.9
Opera xpensesting e (1,004) (866) (137) 15.8 10.8
General administrativ xpensese e (926) (804) (123) 15.2 10.3
Personnel (568) (477) (91) 19.1 14.0
Other general administrative expenses (358) (327) (31) 9.6 4.9
Depreciation and amortisation (77) (63) (15) 23.4 18.1
Net operating income 1,332 1,327 5 0.4 (4.0)
Net loan-loss provisions (567) (521) (46) 8.9 4.2
Other income 3 (24) 27 —
Profit before taxes 768 783 (14) (1.8) (6.1)
Tax on profit (114) (54) (59) 109.0 99.9
Profit from continuing operations 655 728 (74) (10.1) (14.0)
Net profit from disc tionsontinued opera — — — —
Consolidated profit 655 728 (74) (10.1) (14.0)
M erinority int ests 199 230 (31) (13.4) (17.1)
Attributable profit to the Group 455 498 (43) (8.6) (12.5)
Balance sheetCustomer loans** 32,338 30,550 1,788 5.9 11.1
T trading por folio (w/o loans) 3,144 3,075 69 2.2 7.3
A orvailable-f s- ale financial assets 2,668 2,274 394 17.3 23.1
Due from credit institutions** 4,579 3,837 742 19.3 25.2
Intangible assets and proper uipmentty and eq 355 347 8 2.4 7.5
Other assets 2,876 2,680 196 7.3 12.6
Total assets/liabilities & shareholders' equity 45,960 42,763 3,197 7.5 12.8
Customer deposits** 24,347 23,352 995 4.3 9.4
Marketable debt securities** 6,504 6,650 (146) (2.2) 2.6
Subordinated debt** 963 985 (22) (2.2) 2.6
Insurance liabilities — — — —
Due to credit institutions** 5,886 4,393 1,493 34.0 40.6
Other liabilities 5,280 4,437 843 19.0 24.9
Stockholders' equity *** 2,980 2,946 33 1.1 6.1
Other managed and marketed customer funds 7,370 7,256 114 1.6 6.6
utM ual and pension funds 5,422 5,564 (142) (2.5) 2.3
Mana tged por folios 1,948 1,693 256 15.1 20.8
Managed and marketed customer funds 39,184 38,242 942 2.5 7.5
Ratios (%) and operating meansROE 15.32 19.50 (4.19)
Efficiency ratio (with amortisations) 43.0 39.5 3.5
NPL ratio 5.62 5.97 (0.35)
oC vera tioge ra 53.9 52.4 1.5
Number o yf emplo ees 12,454 12,123 331 2.7
Number of branches 472 475 (3) (0.6)
eserv
(*).- Including dividends. inc(**).- Including all on-balance sheet balances f(***).- Capital + r es + pro
ome from eq
fit + valua
accuity-
tion adjustments
ountor this item
ed method and other opera ometing inc e/ xpenses
—
—
—

158
2015 annual rEport4. Economic and financial reviewBusiness information by geography
Chile (changes in loc encal curr y)
2015 Highlights
ommerthe c cial transformation is reflected in greater activity in the target segments of loans and funds.
Sharp rise in the number of loyal companies and digital clients, with improved customer service quality.
ttributa able profit of €455 million. of note the positiv ve e olution o ef r venues (excluding uF inflation impact) and the lower cost of credit.
in
impaclow
aeuro
o
prcbac
eu
on
hr
u
v
go
s
m
e
ds
estment
ut
f
i
i
onsp
lta
t
me
a
a
t
r
r
t
s
n
ob
e
ies
o
i
enc
ui
n
r
e
lnip
gp
s
t
s
t
y
ea
m
h
rr
a
et
a
va
eng
g
ecia
in
i
i
c
nc
na
iu
ae
n
i
our
tn
l
a
g
gaa
t
si
e
r
n
n
t
b
m
l
e
dyu
a
’
d
e
sfe
b
i
n
o
v
x
i
n
a
uar
t
t
rp
c
e
s
w
h
kd
e
s
s
ecia
i
t
s
ra
on
t
g
ecia
er
i
rr
se
wh
oa
n
v
f
i
tp
a
o
t
c
er
e
nh
ce
og
d
uf
l
y
a
tsr
mr
o
rg
ee
a
f
d
e
d
our
n
e
i
d
uos
m
ai
c
fn
uo
n
pe
md
ir
d
ar
r
mm
ov
m
s
h
uar
pi
ar
p
n
i
ie
r
n
g
rovg
t
d
eg
h
t
i
a
r
er
u
i
l
ce
do
n
mlt
y
s
i
n
gae
a
xpec
g
i
sn
tl
n
i
h
tze
t
b
d
s
e
e
t
a
ecia
r
ad
gqun
t
m
n
a
r
k
e
diaa
nltigteyr
o
s
f
Economic environmentThe economy grew 2% in 2015, spurred by priva e consumption and
.
Inflation was 4.4%, abo e the central bank’s t get range (2%-4%),ed by the peso s depr tion, which was partly offset by
er oil prices.
The peso depr ed 15% against the dollar and 5% against the euro.The curr y was more stable in the f th q , depr ting 1%
gainst the dollar and appr ting by a similar amount against the.
In order to str then the c gence of inflation e tions, thecentral bank began to normalise its monet y polic , with two rises
f 25 b.p. in the f th q , which brought the key ra e to 3.50%.
StrategyT G -
. M
, , - SME ,
.
In the segment of individual customers, NEO CRM supported thisstra
rose
tegy and better and new capacities were installed in remote anddigital attention channels (VOX and Internet). Of note in the latterwas the recent launch of Neo CLICK, which converts the NEO CRMplatform from one focused solely on customer relations to onecentred on transactions as well, enabling executives to offer,formalise and manage the Bank’s products online and notably reducemanagement time.
More branches were opened and exclusive Select spaces (highincome, which 23%). Also, branches and Advance spaces forSMEs (18 overall), while the traditional network was refurbished intothe new model of branches.
The Advance strategy was launched for the SMEs segment. This is amethodology of work that seeks to manage customers integrally,acc
par
ompanying them in the different phases of their life cycle, beclose to them and improve the quality of service responding to their
ticular needs. Neo Advance, the CRM of SMEs, supports it.
Banca de Empresas e Instituciones advanced in its objective ofbecoming the best bank for companies. The new corporate centresgenerated greater proximity with clients, particularly in the regions,which increased the market share of the segment in loans anddeposits.
Loyal customers Digital customers Activity Attributable profitands ands var (w o X) onst lionThous Thous % . 2015 / 2014 / F C ant € mil

159
2015 annual rEport4. Economic and financial reviewBusiness information by geography
NPL ratio Coverage ratio Cost of credit RoTE% % % %
The quality of customer attention and satisfaction continued toimprove, closing gaps with competitors significantly.
These achievements were reflected in many recognitions in 2015,including Bank of the Year by The Banker magazine, while theSanodelucas programme received the award for the best financialeducation initiative in Latin America in the IDB’s Beyond Bankingawards. Also, for the third year running the bank received the bestprivate bank award from Euromoney.
ActivityThe total number of clients grew 2% (high income: +8%). Loyalcustomers also rose (companies: +11% and high income individuals:+10%). Digital customers increased to more than 900,000.
Lending grew 11%, with advances in the target segments. Of notewas 17% growth in high income and 9% in companies.
Deposits rose 10% (demand deposits: +12%).
ResultsAttributable profit was 13% lower at €455 million, mainly due tolower inflation-indexed UF, some regulatory impact, highertechnology costs and higher tax pressure.
• Gross income increased 2%, which should be viewed positively as2014 was a year when it was exceptionally high because of thefavourable impact of the high inflation-indexed UF.
The rise came from fee income (+5%) and higher gains on financialtransactions. Net interest income was down by only 1%, as lendingwas higher and the cost of funding was lower, the impact of thelower UF rate (4.1% compared to 5.7% in 2014) and the regulationon maximum rates.
• Operating expenses increased 11% due to rises in inflation-indexedrentals and salaries, the impact of the exchange rate ontechnology service contracts indexed to the dollar and the euro, aswell as the higher investment in technological developments.
• The cost of credit dropped from 1.75% to 1.65% as the rise inprovisions (+4%) was well below the growth in lending. This wasreflected in better credit quality ratios; the NPL ratio was 35 b.p.lower at 5.62%.
• Pre-tax profit fell 6%. Attributable profit was down 13% because ofthe higher tax charge resulting from the 2014 tax reform.
Strategy in 2016
• Increase the number of loyal customers (individuals, SMEs and companies), focusing on those using digital channels.
• Continue improving the quality of customer service and satisfaction.
• Promote the new culture centred on the customer and the Simple, Personal and Fair style.
• Adequate business profitability, underpinned by proactive risk management.
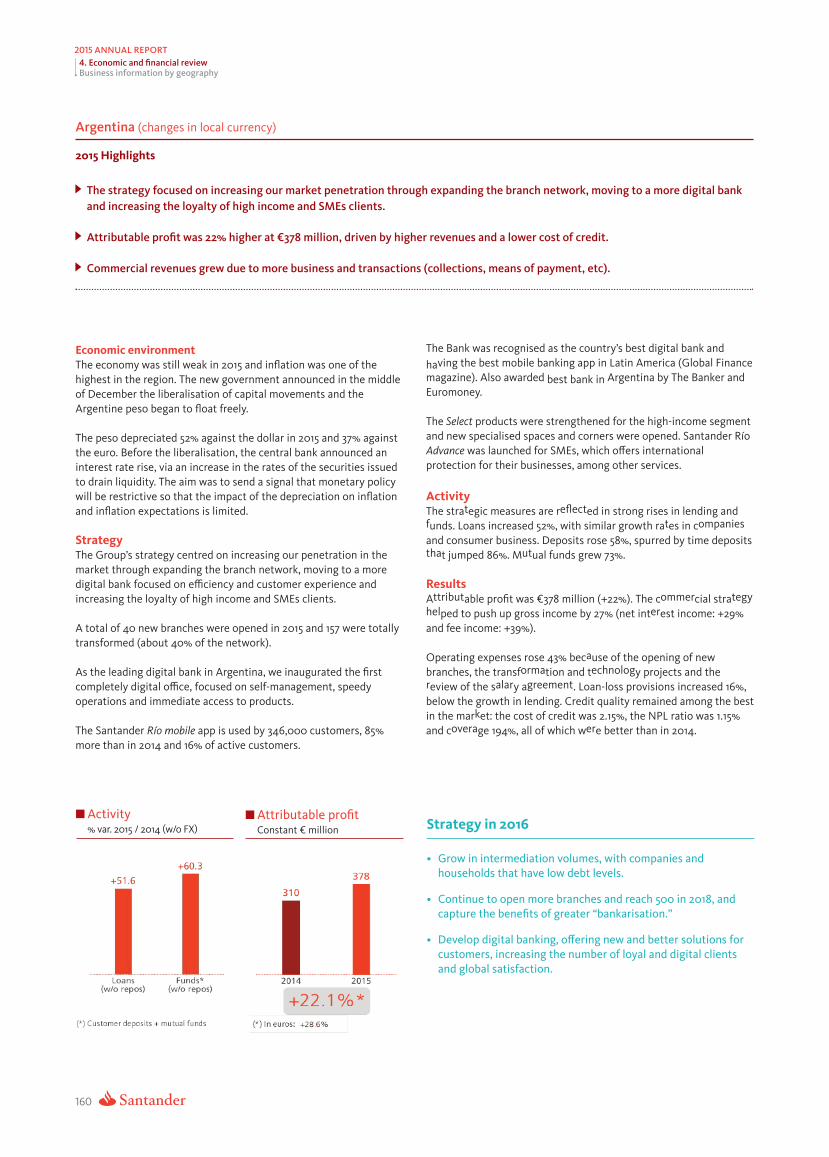
160
2015 annual rEport4. Economic and financial reviewBusiness information by geography
best bank in
argentina (changes in loc encal curr y)
2015 Highlights
tegthe stra y focused on increasing our market penetration through expanding the branch network, moving to a more digital bankand increasing the loyalty of high income and SMEs clients.
ttributa able profit was 22% higher at €378 million, driven by higher revenues and a lower cost of credit.
ommer eC cial r venues grew due to more business and transactions (collections, means o ymentf pa , etc).
Economic environmentThe economy was still weak in 2015 and inflation was one of thehighest in the region. The new government announced in the middleof December the liberalisation of capital movements and theArgentine peso began to float freely.
The peso depreciated 52% against the dollar in 2015 and gainst37% athe euro. Before the liberalisation, the central bank announced aninterest rate rise, via an increase in the rates of the securities issuedto drain liquidity. The aim was to send a signal that monetary policywill be restrictive so that the impact of the depreciation on inflationand inflation expectations is limited.
StrategyroupThe G ’s strategy centred on increasing our penetration in the
market through expanding the branch network, moving to a moredigital bank focused on efficiency and customer experience andincreasing the loyalty of high income and SMEs clients.
A total of 40 new branches were opened in 2015 and er157 w e totallytransformed (about 40% of the network).
As the leading digital bank in Argentina, we inaugurated the firstcompletely digital office, focused on self-management, speedyoperations and immediate access to products.
The Santander Río mobile app is used by 346,000 customers, 85%more than in 2014 and 16% of active customers.
hama
prot
f
tha
hel
r
uromoney
ttribut
ec
overa
t
k
produc
alar
ec
orma
ut
gr
er
eement
eng
eflect
ountr
a
er
echnolog
y’
er
er
erna
ommer
t
tional
ompanies
inance
tegy
The Bank was r ognised as the c s best digital bank andving the best mobile banking app in Latin America (Global Fgazine). Also awarded Argentina by The Banker and
E .
The Select ts w e str thened for the high-income segmentand new specialised spaces and corners w e opened. Santander RíoAdvance was launched for SMEs, which offers int
tion for their businesses, among other services.
ActivityThe stra egic measures are r ed in strong rises in lending andunds. Loans increased 52%, with similar growth ra es in c
and consumer business. Deposits rose 58%, spurred by time depositst jumped 86%. M ual funds grew 73%.
ResultsA able profit was €378 million (+22%). The c cial stra
ped to push up gross income by 27% (net int est income: +29%and fee income: +39%).
Operating expenses rose 43% bec use of the opening of newbranches, the transf tion and t y projects and theeview of the s y a . Loan-loss provisions increased 16%,
below the growth in lending. Credit quality remained among the bestin the mar et: the cost of credit was 2.15%, the NPL ratio was 1.15%and c ge 194%, all of which w e better than in 2014.
Activity Attributable profitvar (w o X) onst lion% . 2015 / 2014 / F C ant € mil Strategy in 2016
• Grow in intermediation volumes, with companies andhouseholds that have low debt levels.
• Continue to open more branches and reach 500 in 2018, andcapture the benefits of greater “bankarisation.”
• Develop digital banking, offering new and better solutions forcustomers, increasing the number of loyal and digital clientsand global satisfaction.

161
2015 annual rEport4. Economic and financial reviewBusiness information by geography
urug
la
uay (changes in loc encal curr y)
2015 Highlights
cqa uisition in July of Créditos de Casa, the fourth largest finance company, consolidating our market share of this segment at28% and 25% of the consumer credit of the private financial system.
Double-digit growth in lending and deposits, ranking first in the customer satisfaction.
ttributa able profit rose 38%. on a like-for-like basis, growth was 28% due to gross income (mainly commer ecial r venues).
grow
a
f
measur
•
•
io
fi
nf
r
ldl
s
r
i
t
ovf
i
i
n
dt
rug
h
hu
t
tiv
eh
ias
e
l
ua
n
w
t
l
uc
o
ak
a
mu
ys
s
a
bt
er
rl
oe
eflc
rm
u
o
es
e
t
f
ct
r
o
ontribut
d
uar
sa
uar
em
el
i
d
gt
e
ii
i
t
t
r
t
s
et
n
a
er
s
f
ecia
la
ta
c
h
ct
l
v
el
me
ix
ieo
t
eocnn
l
vsut
ot
s
ountr
s
d
ld
ur
u
ino
o
r
t
v
gs
uio
ee
er
b
ountr
i
y
y’
n
t
ear
leo
on
u
da
va
f
p
n
t
v
fd
tiv
f
y’
ho
er
r
e
c
o
ll
foo
m
n
nmwu
of
mip
ot
n
ar
orma
aeu
bgn
rw
eti
t
r
eh
ha
t
s
oe
sp
f
ib
an
l
c
a
c
ec
u
c
q
irne
s
eut
ga
i
io
n
ssp
or
mi
vice
et
l
ida
eo
c
rn
e
s
d
Economic environmentThe economy grew by around 1.2% in 2015 (3.5% in 2014). GDP
th in the third q er was 0.6% y -on-year after shrinking0.3% in the second q .
Inflation was 9.4%, w l abo e the central bank’s t get of (+3%-7%).The key ra e remained high in order to c ge toward this goal.The U yan peso depr ed 20% against the dollar and 10%
gainst the euro.
StrategyThe Group continued to be the c s leading priva e sector bank,ocusing on growing in r ail banking and improving efficiency and
the quality of service.
Value-added products and services w e launched in 2015 and otheres t en to c e to the c s development:
Launch of the Advance programme for SMEs.
Initia es w e also launched to reduce waiting times in branches(a new version of the app with an inno e inf tion seron the nearest branch and occupancy levels) and deadlines fesolving complaints.
A : ,
Créditos de la Casa (+22% ) 10%. T 32%. O
, 2014.
Activity
deposits
la
Lending rose 21%, particularly consumer finance, cards (+18%); SMEs:(+34%) and 32%.
Santander’s credit cards are classified as the best in the market,according to quality surveys. The EMV chip was launched in 2015 toimprove security.
In line with the enhancement of value added products and tocontribute to the country’s development, the following actions wereimplemented in 2015:
• Structuring and issuance of the bond to finance the first project tobe dev rugeloped in U uay under the private public participationlaw. We also structured the first thermosolar projec rugt in U uay.
• Santander was the placement agent for issuing $1.2 billion ofrugU uay’s sovereign bonds.
ResultsttributA able profit was 38% higher at €70 million, fuelled by net
operameasur
ting income (+49%) benefiting from the efficiency planes.
Loan-loss provisions increased 46%, albeit from a low base, andcredit quality remained excellent (NPL ratio at 1.27% and coverage205%).
Excluding the incorporation of Créditos de Casa (€5 million profit),attributable profit was 28%.
Activity Attributable profitvar (w o X) onst lion% . 2015 / 2014 / F C ant € mil Strategy in 2016
• Continue to grow in retail business, keeping excellent levels ofquality of service.
• Attain leadership in the segments for individuals and SMEs, aswell as in products such as consumer credit, means of paymentand liabilities in pesos.
• Continue to improve the efficiency ratio.

162
2015 annual rEport4. Economic and financial reviewBusiness information by geography
peru (changes in loc encal curr y)
2015 Highlights
Both lending and deposits continued to gr onglyow str .
r op e-tax pr fit increased 52%, mainly due to gross income and improved efficiency.
trategS y focused on the corporate and large companies segment, as well as infrastructure businesses.
c
p
picon
ountr
r
a
row
roup
u
f
ci
n
rr
ol
rtat
or
n
i
s
s
is
n
e
tp
t
e
’
i
urreer
ue
cw
sre
cd
i
vironment
eser
aitu
t
t
l
t
laat
hi
ore
skel
ii
co
o
v
ond
pn
ng
rn
aug
s
os
ah
eq
jex
o
d
e
t
ip
o
l
v
c
uir
i
p
d
a
t
w
fies
n
ate
nr
it
a
t
iaag
es
h
nn
ia
c
t
ce
cds
u
e
erna
e
of
v
s
a
co
i
t
i
csn
osy
te
m
m
irv
n
atp
i
e
at
e
ecia
a
n
r
y
i
rs
nynd
gai
fi
en
teser
scmn
d
re
a
w
e
q
n
orpora
ater
iu
c
t
i
v
c
ha
iaa
l
d
io
l
t
s
t
p
y
wh
tar
t
of
ie
rt
u
t
rhtc
t
i
s
ctu
a
e
inp
r
re
ov
ateiui
n
r
cpte
e
adn
uwe
educed
rid
nnn
f
lar
iattresio
f
nal
Economic environmentG th slowed in 2015 to 2.7%, a similar growth ra e to that odomestic demand. Inflation was 4.4% and the central bank rthe cash r e r ements and raised the key ra e from 3.25% to3.75%.
Public debt was 21% of GDP, one of the lowest in the region and they has $61 billion of int tional r es (more than 30% o
GDP). The Peruvian nuevo sol depr ed 12% against the dol .
StrategyIn this en , business focused on c e banking and theG s global customers.
A , Gr .
O , L A ,
.
Activitydeposits Lending rose 24% and 18%, complemented by stable
medium-term growth in funding.
Results rP e-tax profit was €43 million (+52%), spurred by net operating
income (+56%), which, in turn, was due to the improvement inefficiency (gross income: +46%; costs: +27%).
Loan-loss provisions increased 25%, with cost of credit of 0.69%.
The NPL ratio was 0.52% and covera erge v y high at 402%.
The rise in pre-tax profit did not fully feed through to attributableprofit (+37%) due to higher taxes.
Activity Attributable profitvar (w o X) onst lion% . 2015 / 2014 / F C ant € mil Strategy in 2016
• Continue to increase lending to the corporate segment, globalcustomers and large companies.
• Promote investment banking, offering advice for publicinfrastructure works via public and private sector link ups.
olombiaC
• Banca special emphasis on global
o Santander de Negocios Colombia began to operate in January 2014. The new bank has capital of $100 million and specializes in thecorporate and business market, with customers, clients o roupf the G ’s International Desk and those localclients bec ernaoming more int tional.
• Its products ar ve focused on in estment banking and capital markets, transaction banking, treasury and risk coverage, foreign tradefinancing and wor apitking c al financing products in local currency, such as confirming.
• The Bank reached a point of equilibrium in 2015.

163
2015 annual rEport4. Economic and financial reviewBusiness information by geography
United Statesillion€ M
VariationIncome statement 2015 2014 amount % % w/o FX
Net interest income 6,116 4,789 1,327 27.7 6.8
Net f omeee inc 1,086 830 256 30.9 9.4
Gains (losses) on financial transactions 231 205 26 12.6 (5.9)
Other operating income* 367 156 211 135.6 97.0
Gross income 7,799 5,979 1,820 30.4 9.0
Opera xpensesting e (3,025) (2,239) (785) 35.1 12.9
General administrativ xpensese e (2,761) (2,040) (722) 35.4 13.2
Personnel (1,543) (1,141) (401) 35.1 13.0
Other general administrative expenses (1,219) (898) (320) 35.7 13.4
Depreciation and amortisation (264) (200) (64) 32.0 10.3
Net operating income 4,774 3,740 1,035 27.7 6.7
Net loan-loss provisions (3,103) (2,233) (870) 39.0 16.2
Other income (148) 13 (161) — —
Profit before taxes 1,523 1,520 3 0.2 (16.2)
Tax on profit (516) (440) (77) 17.4 (1.8)
Profit from continuing operations 1,007 1,081 (73) (6.8) (22.1)
Net profit from disc tionsontinued opera — — — — —
Consolidated profit 1,007 1,081 (73) (6.8) (22.1)
M erinority int ests 329 219 110 50.1 25.5
Attributable profit to the Group 678 861 (183) (21.3) (34.2)
Balance sheetCustomer loans** 84,190 70,420 13,771 19.6 7.2
T trading por folio (w/o loans) 2,299 5,043 (2,743) (54.4) (59.1)
A orvailable-f s- ale financial assets 19,145 12,737 6,408 50.3 34.8
Due from credit institutions** 3,901 3,460 441 12.7 1.1
Intangible assets and proper uipmentty and eq 9,156 6,905 2,251 32.6 18.9
Other assets 11,892 9,469 2,423 25.6 12.6
Total assets/liabilities & shareholders' equity 130,584 108,034 22,551 20.9 8.4
Customer deposits** 60,115 51,304 8,811 17.2 5.1
Marketable debt securities** 23,000 16,000 7,000 43.8 28.9
Subordinated debt** 906 796 109 13.7 2.0
Insurance liabilities — — — — —
Due to credit institutions** 26,169 17,760 8,410 47.4 32.1
Other liabilities 9,073 10,543 (1,469) (13.9) (22.8)
Stockholders' equity *** 11,321 11,632 (310) (2.7) (12.7)
Other managed and marketed customer funds 19,478 15,729 3,750 23.8 11.0
utM ual and pension funds 7,123 3,621 3,502 96.7 76.4
Mana tged por folios 12,355 12,107 248 2.0 (8.5)
Managed and marketed customer funds 103,499 83,828 19,670 23.5 10.7
Ratios (%) and operating meansROE 6.05 7.82 (1.77)
Efficiency ratio (with amortisations) 38.8 37.5 1.3
NPL ratio 2.13 2.42 (0.29)
oC vera tioge ra 225.0 193.6 31.4
Number o yf emplo ees 18,123 16,687 1,436 8.6
Number of branches 783 811 (28) (3.5)
eserv
(*).- Including dividends. inc(**).- Including all on-balance sheet balances f(***).- Capital + r es + pro
ome from eq
fit + valua
accuity-
tion adjustments
ountor this item
ed method and other opera ometing inc e/ xpenses

164
2015 annual rEport4. Economic and financial reviewBusiness information by geography
unit ted S ates (changes in dollars)
2015 Highlights
vContinued in ovestment to impr e commercial activity and comply with regulatory requirements.
ea ntermediaCr ting I t ompane Holding C y (IHC) and strengthening risk, capital and liquidity management.
Santander Consumer uSa kept up a strong pace in new lending and servicing. Focus will be in auto finance.
ll these actioa ns h ave a temporar y e eff ct o n rev enues a nd c osts, and largely justify the l ower pro tfi (-34%; -21% in e uros).
fGood per ormance of loans, funds and revenues.
Economic environmentThe US economy grew a modest but solid pace (2.5%). Thanks to theimpro
is
the
ving economy, the unemployment rate fell on a sustained basisto 5% at the end of the year, a level regarded as full employment.
Inflation, however, remained low (1.3%) and at some distance fromthe F eserederal R ve’s target (set in terms of the underlying deflatorof private consumption), which 2%.
In this context, the Fed raised its interest rates at the end of the year,accompanied by a message indicating the interest rate profileoutlook would be moderate.
StrategySantander in the US includes the holding company (SHUSA),Santander Bank, Banco Sant uerander P icto R o, Sant onsumerander CUSA, Banco Santander International (BSI), Santander InvestmentSecurities (SIS) and Spanish Branch of Santander in New York.
Santander US continues to focus on several strategic prioritiesaimed at impro roupving the G ’s position and diversification in theUS, including:
–
led to
A multiannual project to comply with regulatory requirements.
– Improve the governance structure, including the creation ofIntermediat ompane Holding C y (IHC).
– Create a local executive team with wide experience in managingfinancial institutions in the US.
– Improve the profitability of Santander Bank NA.
– Optimise the auto finance business of Santander Consumer USA.
During 2015 Santander US continued to strengthen its governancestructure and executive teams and improve the risk managementand control systems. This is part of the multiannual project toimprove the bank and meet the regulatory requirements, includingmanagement of capital and stress tests in the US.
Santander Bank has focused on improving customer experience inorder to boost number of clients and cross selling. Additionally, itlaunched initiatives in checking accounts and enhanced its digitalcapabilities, which ear12% y -on-year in digital customers.
ote he a
ands
nnual growth includes a change in the loyal custo
ands
mers measurement methodology
var (w o X) onst lionLoyal customers Digital customers Activity Attributable profitThous Thous % . 2015 / 2014 / F C ant € mil
N . T

165
2015 annual rEport4. Economic and financial reviewBusiness information by geography
NPL ratio Coverage ratio Cost of credit RoTE% % % %
Sant
its deposits
new lending
ander Consumer USA was among the five largest retail autofinance companies. Its strategy centred on optimising the mix ofassets retained versus sold, increasing servicing to third parties as away to lift revenues through fee income, while materialising thevalue of the relationship with Chrysler.
The strateg uery in P icto R o focused on the customer relationship,with initiatives to digitise, simplify and personalise.
ActivitySantander Bank’s lending rose 6% and 7%.
Most of the growth in lending came from credit to companies, bothin the commercial and industrial segment, as well as in globalcorporate banking.
Funds growth was driven by core deposits, which is reflected in thecost of funding ut. M ual funds rose 9%.
Sant onsumerander C ’s loans rose 11% and 10%.
ResultsevR enues performed well, with gross income up 9% due to
Santander Consumer USA, as a result of a larger volume of newlending, which fuelled net interest income, as well as fee incomefrom servicing. Santander Bank’s net interest income was underpressure from lower than expected interest rates, which was offsetby gains on financial transactions.
This performance, however, did not feed through to profits whichwere 34% lower at $752 million.
hT e fall was due t o higher operating expenses derived from thegrowth of the s ervicing platform, regulatory requirements andone o- ff r estructuring charges.
Loan-loss provisions also increased, mainly due to greater lendingand loan retentions in Santander Consumer USA, which accounts formore than 95% of the country’s provisions.
Lastly, the higher tax charge also dragged down profits.
Strategy in 2016
• Improve the customer experience and loyalty with knowledgeable and effective salesforce at Santander Bank through an easy to useproduct suite and multchannel capability.
• Santander Consumer USA focuses on auto finance activity to optimise the mix between retained and sold assetsand serviced forothers, as well as realising the full value of the Chrysler Capital relatiionship.
• Continue to strengthen risk, capital and liquidity risk management in meeting regulatory requirements.

166
2015 annual rEport4. Economic and financial reviewBusiness information by geography
illionCorporate Centre€ M
VariationIncome statement 2015 2014 amount %
Net interest income (627) (612) (15) 2.5
Net f omeee inc (13) (33) 20 (60.2)
Gains (losses) on financial transactions 150 700 (549) (78.5)
Other opera ometing inc (5) (22) 17 (78.0)
ividendsD 72 30 42 138.7
Income f accrom equity- ounted method (43) (28) (15) 55.2
Other opera ometing inc e/ xpenses (34) (25) (9) 38.2
Gross income (495) 32 (527) —
Opera xpensesting e (547) (586) 39 (6.6)
Net operating income (1,042) (554) (488) 88.2
Net loan-loss provisions 27 2 25 —
Other income (507) (453) (55) 12.1
Underlying profit before taxes (1,523) (1,004) (518) 51.6
Tax on profit 59 (148) 207 —
Underlying profit from continuing operations (1,464) (1,152) (312) 27.0
Net profit from disc tionsontinued opera — — — —
Underlying consolidated profit (1,464) (1,152) (312) 27.0
M erinority int ests 30 (1) 31 —
Underlying attributable profit to the Group (1,493) (1,151) (342) 29.8
Net capital gains and provisions (600) — (600) —
Attributable profit to the Group (2,093) (1,151) (942) 81.9
BalanceT trading por folio (w/o loans) 2,656 2,916 (260) (8.9)
A orvailable-f s- ale financial assets 3,773 3,299 475 14.4
Goodwill 26,960 27,547 (587) (2.1)
Capital assigned to G easroup ar 77,163 75,030 2,133 2.8
Other assets 37,583 32,585 4,998 15.3
Total assets/liabilities & shareholders' equity 148,136 141,377 6,759 4.8
Customer deposits* 5,185 5,261 (75) (1.4)
Marketable debt securities* 27,791 24,958 2,833 11.4
Subordinated debt* 9,596 4,107 5,489 133.6
Other liabilities 21,049 30,091 (9,041) (30.0)
Stockholders' equity ** 84,515 76,961 7,554 9.8
Other managed and marketed customer funds — — — —
utM ual and pension funds — — — —
Mana tged por folios — — — —
Managed and marketed customer funds 42,572 34,325 8,246 24.0
Operating meansNumber o yf emplo ees 2,006 2,059 (53) (2.6)
(*). Including al(**).- Capital + reserv
l on-balance sheet balances fes + profit + valua
emor this ittion adjustments

167
2015 annual rEport4. Economic and financial reviewBusiness information by geography
Strategy and functions
Banco Santander subsidiaries’ model is complemented by acorporate centre that has support and control units which carry outfuntions for the Group in matters of risk, auditing, technology,human resources, legal affairs, communication and marketing,among others.
This centre contributes value to the Group in various ways:
• It makes the Group’s governance more solid, through frameworksof control and global supervision, and taking strategic decisions.
• It makes the Group’s units more efficient, fostering the exchangeof best practices in management of costs and economies of scale.This enables us to be among the most effiicent in the sector.
• By sharing best commercial practices, launching global commercialinitiatives and driving digitization, the centre contributes to theGroup’s revenue growth.
It also develops functions related to financial and capitalmanagement:
• Functions developed by Financial Management:
– Structural management of liquidity risk associated with fundingthe Group’s recurring activity, stakes of a financial nature andmanagement of net liquidity related to the needs of somebusiness units.
– This activity is carried out through diversifying the varioussources of funding (issues and others), always maintaining anadequate profile (volumes, maturities and costs). The price atwhich these operations are conducted with other units of theGroup is the market rate (euribor or swap) plus the premiumwhich, in concept of liquidity, the Group supports byimmobilizing funds during the term of the operation.
– Also active management of interest rate risk to soften theimpact of interest rate changes on net interest income,conducted via derivatives of high quality, high liquidity and lowconsumption of capital.
– Strategic management of the exposure to exchange rates onequity and dynamic on the countervalue of the units’ results ineuros for the next 12 months. Net investments in equity arecurrently covered by €20,349 million (mainly Brazil, UK, Mexico,Chile, US, Poland and Norway) with different instruments (spot,fx, forwards).
– Total management of capital and reserves: assigning capital toeach of the units.
Lastly, and marginally, the corporate centre reflects the stakes of afinancial nature that the Group makes under its policy of optimizinginvestments.
Results
We reformulated the centre’s role in the Group, in order to improvethe transparency and visibility of both the centre’s accounts and theGroup’s, as well as the responsibility of the operating units. Thecentre generated 23% of the Group’s profits in 2015, close to ourtarget of 25%.
In year-on-year terms:
• Lower revenues due to reduced results from centralizedmanagement of the different risks (mainly interest rate risk).
• Costs were 7% lower, and were due to the streamlining of thecorporation.
• Other results and provisions recorded losses of €507 million, upfrom €437 million in 2014. These amounts included provisions ofdifferent nature, as well as capital gains, capital losses andimpairment of financial assets.
• The losses in 2015 were €1,493 million compared to €1,151 million in2014. After including the impact of the net of non-recurringpositive and negative results of €600 million, the total loss was€2,093 million.
orporaC t entre C e
2015 Highlights
We have a or C porate eC ntre whose objective is to improve efficiency and contribute va lue-added for the operating units. tI a lso c arriesout functions r elated to nfi ancial and capital management.
n year on yeaI - - r terms h, igher l osses because o f lower revenues f rom centralized management o f t he v arious r isks m( ainly i nterest r aterisk).
t includes theI i mpact o f th e net of non-recurring positive and negative results of €600 million.

168
2015 annual rEport4. Economic and financial reviewInformation by global business
etr ail Banking
2015 Highlights
he retail bankt ing model c ontinued to be t ransformed i nto an increasingly iS mple, ep rsonal and a F ir m odel.
ustomer visioC n, developing specialised models, range of sim ple products and global o eff rs.
urther develoF pment of the multi ch- annel m odel, centred on digital channels.
rogress in achp ieving our goals: 13.8 loyal customers and 16.6 digital customers.
illionRetail Banking€ M
VariationIncome statement 2015 2014 amount % % w/o FX
Net interest income 30,029 27,699 2,330 8.4 7.2
Net f omeee inc 8,620 8,337 283 3.4 4.4
Gains (losses) on financial transactions 1,345 1,395 (50) (3.6) (6.2)
Other operating income* 365 258 107 41.5 31.5
Gross income 40,359 37,689 2,670 7.1 6.2
Opera xpensesting e (18,730) (17,382) (1,348) 7.8 7.1
Net operating income 21,629 20,307 1,322 6.5 5.5
Net loan-loss provisions (9,249) (9,740) 490 (5.0) (4.9)
Other income (1,751) (1,386) (365) 26.3 34.3
Profit before taxes 10,629 9,181 1,448 15.8 12.2
Tax on profit (2,663) (2,129) (534) 25.1 21.1
Profit from continuing operations 7,966 7,052 914 13.0 9.6
Net profit from disc tionsontinued opera — (26) 26 (100.0) (100.0)
Consolidated profit 7,966 7,026 940 13.4 10.0
M erinority int ests 1,112 1,032 80 7.7 6.9
Attributable profit to the Group 6,854 5,994 860 14.4 10.5
(*).- Including dividends. income f accrom equity- ounted method and other opera ometing inc e/ xpenses
Strategy and activitySantander continued to make significant progress during 2015 in itsprogramme to transform its retail banking model. The mainelements are to improve the knowledge of our customers and theirrelations with the Bank, specialised management of each segment,develop more efficient distribution models, focused on digitalchannels, and capture the opportunities provided by the Group’sinternational positioning. All of this under a Simple, Personal andFair culture of service, aimed at excellence in customer satisfaction.
In order to deepen customer knowledge, we improved our analyticalcapacities. a new commercial front was developed in order toenhance business productivity and customer satisfaction. This tool,based on a best practice in Chile, was installed in Uruguay in 2015and continued to be developed in the US with a mobility project
Levers for our commercial transformation

169
2015 annual rEport4. Economic and financial reviewInformation by global business
(tablet and transactional business), in Chile with the launch of NeoInversiones and commercial planner, and in Brazil, with newfunctionalities offering continuous improvement. The tool willgradually be extended to other units during 2016.
In order to improve customer loyalty and long-term relations,different value propositions were launched and consolidated, amongwhich were:
• The 1|2|3 World: following the success of the initiative in the UK,similar propositions were launched in 2015 in other countries andwell received, such as in Portugal and Spain, which already hasmore than 800,000 accounts.
• Integral offers launched in Chile with propositions such as PlanesSantander LANPASS, which rewards transactions and improves thebenefits for customers, or in Brazil, the Contas Combinadas, whichoffer new solutions that simplify the value offer for individualcustomers and make choosing accounts easier:
• Expansion of the Select model for high-income clients. It is nowinstalled in all countries and provides service to more than twomillion customers. The value propositions were improved andincreased during 2015.
• Strengthening private banking business, with the Euromoneyaward for best private banking in 2015 in Argentina, Chile andPortugal, best private bank in Spain, Mexico and Portugal (GlobalFinance) and best private bank in Latin America and Portugal (TheBanker).
• rolling out of the programme for SMEs to make us the referencepartner, combining a very attractive financial offer with non-financial solutions (connectivity, internationalisation, training,etc). The programme was extended to Uruguay, Argentina, Braziland Chile in 2015, bringing the number of countries to eight.
We continued to advance in developing our distribution modelsfocused on digital channels, which produced significant improvementsin various channels. Some examples:
– New app for mobile phones in Spain (aimed at SMEs andcompanies), Portugal, Uruguay and Poland (chosen by Forrester asthe country’s best app and the second in Europe).
– New developments and functionalities for mobile phones in theUK such as Cash KiTTi (which lets people create and managecollective pots of money) and Spendlytics (which gives customersbetter control over their card expenses).
– Deposit Capture in the US, which enables cheques to be easily andsafely processed by mobile phone.
– Santander Watch in Spain, which lets customers consult theiraccounts and cards from smart watches.
– Santander UK among the first group of banks participating in ApplePay in the UK.
– Simplification of credentials in Mexico, which allows access tovarious digital channels from a single password.
Digital initiatives
ands ands ands andsLoyal customers Retail loyal customers SMEs & corporate loyal Digital customersThous Thous customers. Thous Thous

170
2015 ANNUAL REPORT4. Economic and financial reviewInformation by global business
The new Santander branch
– New office model in Spain and Brazil, which offers simplerprocesses, more intuitive technology and differentiated spaces.
In recognition of our digital channel proposal, the magazine GlobalFinance awarded our bank in Chile the prize for the best LatinAmerican website for financial products and payment of accounts,while Santander Rio was awarded the prize for the best online bankin Argentina.
We continued to support the internationalisation of our corporatecustomers, taking advantage of the Group’s synergies andinternational capacities, via a coordinated plan of initiatives focusedon two elements:
1. Ensuring a consistent and homogenous relationship with ourcustomers via all our local units:
– International Desk, now in 12 countries and with more than 8,000registered customers, which provides services to companies thatwant to enter markets where we operate.
– Santander Passport, specialised attention model for companieswith multinational activity, which offers global management andthe same attention in all the countries where the Group operates.It already has more than 6,000 registered customers and isinstalled in eight countries.
2. Connecting up our customers and capturing internationalcommercial flows:
– Santander Trade Portal, which provides information, tools andresources to help companies grow their business abroad. It isalready available in 12 countries and has registered more than35,000 exporter and importer users.
– Santander Trade Club, innovative platform that lets customers fromdifferent countries get in touch with one another and startcommercial relations. There are already more than 10,000 members.
Lastly, we continued to improve the customer experience, focusingon the most common processes when relating to the Bank. Of notewere the improvements in Onboarding (opening and activatingaccounts): in Brazil and the UK, with immediate activation inelectronic channels, in Portugal, with the incorporation of thedigital signature and in Poland, with the complete process ofopening done remotely.
Results (in constant euros)Ordinary attributable profit was €6,854 million (+10%).
This evolution was spurred by the good performance of gross income(+6% year-on-year, driven by net interest income). Operatingexpenses were 7% higher (+1% excluding perimeter and in real terms)and loan-loss provisions were 5% lower.
Attributable profitConstant € million
Strategy in 2016
• Continue to improve processes and the customer experience and satisfaction.
• Develop more efficient distribution models: digital banking, new branch model, remote manager.
• Consolidate specialised attention to each type of customer.
• Place value on our connectivity.
• Expand our culture of service: Simple|Personal|Fair.

171
2015 annual rEport4. Economic and financial reviewInformation by global business
orporaGlobal C te Banking
2015 Highlights
ustomer focuC - sed strategy, underpinned by the division’s global capacities and its interconnection w ith l ocal u nits.
eference posr itions in expor t nfi ance co, rporate loans, project nfi ance and issues, among others, in uE rope a nd al tin m a erica.
ttributable pa ro tfi of €1,625 million, 2% more i n c onstant e uros.
ositive evolup tion in revenues a nd higher provisions and c osts due t o investments t o develop the franchise.
npntpbduSGCB maintained in 2015 the key pillars of its business model,focused on the customer, the division’s global capacities and itsinterconnection with local units, while actively managing risk, capitaland liquidity.
The main lines of action were:
• In optimisation of capital, SGCB has well-defined objectives incapital and return on capital at the division level, and by countries,products and clients. The return on capital is one of the maincriteria for approving operations. In addition, improvements weremade during the year to the capital models and the quality of dataof operations was reviewed.
• The creation of a new area to promote the model of origination fordistribution. Asset Rotation and Capital Optimisation (ARCO) is aglobal structure that provides service to various countries in orderto improve the profitability of our business through optimisationof capital and rotation of the balance sheet, thereby strengtheninga model lighter in capital.
• The strengthening of our leadership position in Latin America,mainly in equity capital markets, debt capital markets, cashmanagement and Latin American currencies.
• Greater cooperation with Retail Banking, developing a wide rangeof products adapted to the needs of various segments andfacilitating greater connectivity between its clients and theGroup’s banks (participation in chain of supply operations,financing suppliers, payroll, etc).
illionGlobal Corporate Banking€ M
VariationIncome statement 2015 2014 amount % % w/o FX
Net interest income 2,830 2,481 348 14.0 17.1
Net f omeee inc 1,425 1,392 33 2.4 2.5
Gains (losses) on financial transactions 739 747 (9) (1.2) (4.9)
Other operating income* 277 302 (25) (8.3) (8.2)
Gross income 5,271 4,923 348 7.1 7.9
Opera xpensesting e (2,058) (1,841) (218) 11.8 10.0
Net operating income 3,212 3,082 130 4.2 6.5
Net loan-loss provisions (679) (543) (136) 25.0 28.8
Other income (93) (102) 9 (9.2) (10.0)
Profit before taxes 2,441 2,437 4 0.2 2.3
Tax on profit (695) (667) (29) 4.3 7.2
Profit from continuing operations 1,746 1,771 (25) (1.4) 0.5
Net profit from disc tionsontinued opera — — — — —
Consolidated profit 1,746 1,771 (25) (1.4) 0.5
M erinority int ests 121 146 (25) (17.1) (12.8)
Attributable profit to the Group 1,625 1,625 0 0.0 1.7
(*).- Including dividends. income f accrom equity- ounted method and other opera ometing inc e/ xpenses

172
2015 annual rEport4. Economic and financial reviewInformation by global business
•
•
•
•
•
c
r
dev
ohistor
cross
e
eleapor
f
s
c
er
yndic
orpora
fónic
apit
a
il
ul
t
tapit
g
el
orpora
subst
k
k
est
t
v
er
eb
ort
ander
k
w
xic
ompan
’
o
ticipa
o
anderapit
v
xpor
’
xic
efer
ticipa
orpora
ountries
or
f
uisition
tugal
est
a
te
ActivityOf note, among others, w e:
In trade finance, antial progress in e t finance whichpositioned Santander as the second best bank in the business,with strong growth in the last few years both in our mainountries as w l as in new mar ets.
Strong positioning and growth in trade business, as confirmed byspecialised media (Best Trade Finance Bank in Latin America, BTrade Finance in Spain, P ugal, Chile and Me o).
Cash mana ement business continued to increase in all cand particularly in Latin America, where Santander is the
ence bank.
In ed c e loans, e maintained a r ence positionin Europe and Latin America, acc ying our clients in the
elopment of their businesses and expansion plans.
Of particular note was Sant s par tion in the acqf SAB M ler by AB In , the largest such operation in c
y ($107,000 million).
In e finance, strong rise in activity in Spain and Pin equity c al mar ets, including Sant s par tion inthe listing of AENA and Ferrari and the c al increases oT a in Brazil, V a in Me , Compañía Sudamericana deV es in Chile and Credit Suisse.
In debt c al mar ets, Santander is the leader in Latin Americwith the f lest range of products and c ering both local and
-border needs.
In Europe, success in liability management and hybrid capitaltransactions, Santander’s key role in Iberdrola (global coordinatorand tender agent) and in LafargeHolcim (largest operation ofEuropean issuers with $2,250 million).
Of note in hybrid capital was participation in transactions of RBS,Barclays and HSBC, among others.
In project finance, Santander was at the top of the world leaguetables in both the number of transactions as well as in volumes offinancing, financial advisory services and issues of project bonds.It led transactions such as Line 2 of the Lima Metro, which was thelargest placement of debt in the international markets to finance aproject in Peru ($1,155 million). Santander was the financial advisorto the consortium, global coordinator and financial advisor for theplacement of the project bonds.
asset & capital structuring continued to support its clients indeveloping their international projects in asset financeoperations for ships and aircraft in various countries: Spain, Asiaand the Middle East. Of note was the operating lease of aircraftfor Singapore Airlines and All Nippon Airways, as well asfinancial leasing operations of ships for clients such as Tristar,Shell Singapore, Elcano and Voestalpine.
As regards markets’ activity, good results with positive evolutionof income from sales business, especially in the corporatesegment with strong growth in the Americas, particularly Brazil,and the UK. Lower contribution, on the other hand, frommanagement of books.
•
•
•
Gross income breakdown Attributable profitillion€ M onst lionC ant € mil
Customers+5%*
(*) xE cluding ex change r ate i mpact: total revenues: +8%; customers: +5%

173
2015 annual rEport4. Economic and financial reviewInformation by global business
Results (in constant euros) SGCB’s results were fuelled by the strength and diversification ofcustomer revenues (88% of the total).
The area accounted for 12% of gross income and 19% of theattributable profit o roupf the G ’s operating areas.
Gross income grew 8% in 2015, with growth in all products. GlobalransT action Banking increased 5% against a backdrop of
containment of spreads and low interest rates, financing solutionsand advisory 9%, reflecting the soundness of the various businesses,and global markets 1% (good performance in the Americas, Spain andPortugal).
Operating expenses rose due to the investments in high potentialmarkets, particularly the UK and Poland, and loan-loss provisionsincreased, mainly in Brazil.
JNaXVaT Va xvwy
Activity Area Country / region Source
wardA
asset
q E oluity F low-On of the Year ele: T fonica Brazil BRL16,1 bn CIB America La inancetin F
wardA European Infrastructure Deal of the Year idewa: Thames T y FS&A urope E PFI
wardA Europe L obaccoan: Imperial T o FS&A urope E The Banker
wardA Americas Deal of the Year: Lima metro Line 2 FS&A America PFI
wardA orpora C te High Y emeield Bond: C x FS&A America La inancetin F
wardA Best Infrastructure Bank in Mexico FS&A Mexico La inancetin F
wardA Best Overall Trade Bank in Latam GTB Latam T inancerade F
wardA Best Export Finance Arranger in Latam GTB Latam T inancerade F
wardA Best Commodity Finance Bank in Latam GTB Latam T inancerade F
wardA Best Supply Chain Finance Bank in Latam GTB Latam T inancerade F
wardA Best Trade Advisor in Latam GTB Latam T inancerade F
wardA Best Trade Bank in Latam GTB Latam TFR
wardA Best Trade Bank in Latam GTB Latam GTR
wardA Best Bank f meror E ging Latam Global Markets Latam FX Week
wardA T uarop q tile for Pan-European product Global Markets urope E Institut, Inv vestor sur ey
N1. Best Broker Spain and orP t esearugal: Sales. R ch. Trading & Ex ompanecution. C y & Expert Meetings Global Markets Iberia Extel Survey
N1. q E uity House o qf E uity Derivatives in Spain Global Markets Spain isk R
(*).- Ranking acc vording to sur ey selec eriation crit
(GtB) Global ranst action Banking: includes the business of cash management. trade finance. basic financing and custody.
(FS&a) F dvisorinancing Solutions & a y: includes the units of origination and distribution of corporate loans and structured financings. bond and securitisation originationteams. corporate finance units (mergers and acquisitions. primary markets of equities. investment solutions for corporate clients via derivatives). and & capitalstructuring.
(GM) lG obal aM rkets includes the: sale and distribution of fixed i ncome and equity derivatives. interest rates a nd i nflation; the trading and hedging of exchange r ates. andshort-term money markets fo r the Group»s wholesale and re tail clients; management of b ooks a ssociated with d istribution; and b rokerage of e quities. andderivatives for investment an d h edging solutions.
Strategy in 2016
• In 2016, SGCB will keep on focusing its strategy on the six pillars of its value proposal: maintain its capacity of origination, structuringand credit distribution; leadership in aquisition finance, structured credit and project finance; be the reference bank in access tocapital markets in euros and sterling: maintain its presence as international trade finance bank; knowledge of Latin American marketsand contribute solutions and product distribution for Retail Banking.
• Efficient use of capital will continue to be one of the key elements of business, both from the standpoint of optimisation initiatives aswell as the gradual change toward a business model lighter in capital.
• Promote accompanying our clients in their international expansion, in cooperation with the commercial banking division(Connectivity Project). This project includes various initiatives to improve our strength as an international bank with a large networkof local banks.
• Innovation to adapt to the needs of our customers and face the new non-banking players who are seeking to position themselves inpart of the value chain.

174
Subcapítulo5. Risk management report
2015 ANNUAL REPORT

175
Subcapítulo5. Risk management report
2015 ANNUAL REPORT
5Risk Management Report
176 EXECUTIVE SUMMARY 180 A. PILLARS OF THE RISK FUNCTION 182 B. RISK CONTROL AND MANAGEMENT
MODEL - Advanced Risk Management 182 1. Map of risks 183 2. Risk governance 185 3. Management processes and tools 192 4. Risk culture - Risk Pro 194 C. BACKGROUND AND UPCOMING
CHALLENGES 199 D. RISK PROFILE
199 1. Credit risk 230 2. Trading market risk and
structural risks 250 3. Liquidity risk and funding 261 4. Operational risk 270 5. Compliance and conduct risk 277 6. Model risk 280 7. Strategic risk 281 8. Capital risk 290 APPENDIX: EDTF TRANSPARENCY

176
Executive summary5. Risk management report
2015 ANNUAL REPORT
Pillars of the risk function páginas de 180 a 181
On-going improvement in credit risk profile páginas de 199 a 229
Integration of the risks culture and involvement of senior management in risk decisions and management.
Management of all risks with a forward-looking and comprehensive vision at all levels of the organisation.
Separation of risk functions from business functions.
Formulation and monitoring of the risk appetite, use of scenario analysis with advanced models and metrics, establishing a control, reporting and escalation framework for identifying risks.
Best in class for processes and infrastructure.
Over 80% of risk relates to retail banking.
Significant geographic and sector diversification.
Continuing improvement in main credit quality indicators, which at December 2015 stood at:
• Group NPL ratio 4.36%, down 83 b.p. on the previous year, with noteworthy reductions in Spain, Poland, SCF and Brazil.
• Coverage ratio of 73%, up 6 p.p. on year-end 2014.
• Provisions of EUR 10,108 million, with main reductions in the UK, Spain, Portugal and Poland.
• Falling cost of credit, down to 1.25%. A fall of 41 b.p in Brazil to 4.50%, supported by the strategy of changing the mix and launch of the Defence Plan.
Grupo Santander is focused on building the future through forward-looking management of all risks, protecting the present through a robust control environment.
Executive summary
Customer credit risk by country%
Spain20%
Brazil8%
UK33%
Portugal4%
Chile4%
US11%
Other20%
Main figures
NPL and coverage ratio%
Cost of credit1
%
2014 20142015 2015
Net inflowsMillion euros
2014 2015 2014 2015
1. Cost of credit = loan-loss provisions twelve months / average lending.
67
739,652
1.43
4.91
1.06
4.50
0.62
7,7051.25
0.14 0.03
4.36
5.19
Brazil
NPL ratio
Coverage ratio
Spain
UK

177
Executive summary5. Risk management report
2015 ANNUAL REPORT
Regulatory capital pages 281 to 289Non-financial risks pages 261 to 276
Liquidity risk and funding pages 250 to 260
Trading market risk and structural risks pages 230 to 249
The average VaR on SGCB trading activity remained low, due to our focus on customer service and geographic diversification.
An appropriate balance sheet structure ensures that the impact of changes in interest rates on net interest income and equity value are contained.
Coverage levels for the core capital ratio stand at around 100% for changes in interest rates.
Santander has a comfortable liquidity position, based on its commercial strength and model of autonomous subsidiaries, and substantial customer deposits.
Compliance with regulatory requirements (LCR 146%) ahead of schedule, with a further increase in the Group’s liquidity reserve to EUR 258,000 million.
The loan-to-deposit ratio remains at very comfortable levels (116%).
More favourable market scenario, with abundant liquidity at lower costs and increased recourse to medium and long-term wholesale finance in 2015: 18 issuing units in 15 countries and 14 currencies.
The CET1 ratio stands at 10.05%, in line with the Group s outlook for organic growth, and above the ECB’s required level for 2016 of 9.75%.
Operational risk Transformation project for the advanced measurement approach to risk.
Fostering measures against cyber-risk (Santander Cyber-Security Program) and fraud and to bolster information security.
Fostering awareness and knowledge of operational risk at all levels of the organisation.
Compliance and conduct risk Increasing supervisory pressure, particularly for conduct. New scope for the definition of conduct, and new implications in the context of stress testing.
New customer protection supervisors in various countries.
Updating social and environmental policies, laying out the principles and criteria for action in financing to certain customer segments in the Group
MIN (8.2)
Jan
2013
Mar
20
13
May
20
13
Jul 2
013
Sep
2013
Nov
20
13
Jan
2014
Mar
20
14
May
20
14
Jul 2
014
Sep
2014
Nov
20
14
Jan
2015
Mar
20
15
May
20
15
Jul 2
015
Sep
2015
Nov
20
15
Dec
20
15
35
30
25
20
15
10
5
VaR 2013-2015: change over timeMillion euros. VaR at 99% confidence interval over a one day horizon
— VaR— 15-day moving average— 3-year average VaR
MAX (31.0)
Short-term liquidity coverage ratio (LCR )
Dec 14
120%
Dec 15
146%
CET1D´14*
CET1D´15
Non-recurring positive and
negative net results
Generation2015
9.65%
+0.50 10.15%
-0.10
10.05%
Evolution of fully loaded CET1 %
* The 2014 proforma figure includes January 2015 capital increase.

178
Navigation map5. Risk management report
2015 ANNUAL REPORT
This report contains extensive information on the risks faced by the Group, how it manages and controls these, and the way they affect its activity and results. The report also provides details of the actions taken by the entity to minimise the occurrence of such risks and mitigate their severity.
Following best practice in the market, the following navigation map helps to follow the main issues dealt with in this risk management report through the various documents the Group publishes:
the annual report, the audit report, the annual financial statements and the prudential relevance report (PRI or Pillar III). To further foster transparency, the PRI also includes a glossary of the basic risk terminology used in this section and the PRI itself.
The appendix at the end of the risk report includes a table detailing the location of the EDTF recommendations (EnhancedDisclosure Task Force, promoted by the Financial Stability Board) in the information published by Grupo Santander.

179
Navigation map5. Risk management report
2015 ANNUAL REPORT
Map for navigating Grupo Santader’s documents with risk management and control information
Annual Audit Report & IPR Block Points Report Annual accounts (Pillar III)
Risk function pillars Risk function pillars Page 180 Note 54.a Section 5Map of risks Page 182Risk governance Page 183
Lines of defence Page 183Risk committees structure Page 183Structural organisation of the risk function Page 184The Group’s relationship with subsidiaries in risk management Page 185
Risk control and Section 5Management processes and tools Page 185 Note 54.bmanagement modelRisk appetite and structure of limits Page 186Risk Identification Assessment (RIA) Page 188Analysis of scenarios Page 189Recovery and resolution plans Page 190Risk Data Agreggation and Risk Reporting Framework (RDA & RRF) Page 191
Risk culture Page 192Background and Background and upcoming challenges Page 194 Sections 2 and 5upcoming challenges
Introduction to the treatment of credit risk Page 199Main magnitudes and evolution (risk map, evolution, conciliation, Page 200geographic distribution and segmentation, management metrics)Detail of main markets: UK, Spain, Brazil Page 208Other risk credit risk optics (credit risk by activities in financial markets, Page 216 Note 54.cconcentration risk, country risk, sovereign risk and social and environmental risk) and other notes Credit risk Section 6Credit risk cycle (pre-sale, sale and post sale) Page 224 and related
informationRisk study and process of credit rating, and planning Page 224and setting of limits (analysis of scenarios)Decision on operations (mitigation techniques of credit risk) Page 226Monitoring, measurement and control Page 227Recovery management Page 228
Activities subject to market risk and types of market risk Page 230Trading market risks Page 232
Main magnitudes and evolution Page 232Methodologies Page 241
Note 54.dTrading market risk System for controlling limits Page 243 and other notes Section 8and structural risk Structural risk balance sheet Page 244 and related
informationMain magnitudes and evolution Page 244Methodologies Page 247System of control of limits Page 248
Pension and actuarial risks Page 248Introduction to the treatment of liquidity and funding risk Page 250Liquidity management (organisational model and governance, balance sheet analysis Note 54.e
Liquidity risk Page 250and measurement of liquidity risk, Management adapted to business needs) and other notes Section 9and funding and related
Financing strategy and evolution of liquidity in 2015 Page 254 informationFunding outlook for 2016 Page 260Definition and objectives. Page 261Risk management model and control of operational risk (management Note 54.f cycle, identification model, measurement and risk assessment, Page 261 and other notes Section 10Operational risk implementation of the model, reporting system) and related Evolution of the main metrics. Mitigation measures. Business continuity plan Page 265 information
Other aspects of control and monitoring of operational risk Page 268Mission, scope, definitions and purpose Page 270Compliance risk control and supervision Page 270Governance and the organisational model Page 271
Note 54.g Compliance and Regulatory compliance Page 272 and other notes Section 11conduct risk Governance of products and consumer protection Page 274 and related
informationAnti-money laundering and terrorist financing Page 275Reputational risk Page 275Regulatory risk assessment model and risk appetite and exercise Page 276
Model risk Model risk Page 277 Note 54.hStrategic risk Strategic risk Page 280 Note 54.i
Regulatory framework Page 282Note 54.j
Regulatory capital Page 283 and other notes Section 4Capital riskEconomic capital Page 286 and related
informationPlanning of capital and stress test exercices Page 287
Appendix: EDTF table of recommendations Page 290 Section 3EDTF transparency
180
Pillars of the risk function5. Risk management report
2015 ANNUAL REPORT
EXECUTIVE SUMMARYA. PILLARS OF THE RISK FUNCTIONB. RISK CONTROL AND MANAGEMENT MODEL - Advanced Risk ManagementC. BACKGROUND AND UPCOMING CHALLENGESD. RISK PROFILEAPPENDIX: EDTF TRANSPARENCY
A. Pillars of the risk function
Grupo Santander has set itself the target of achieving excellence in risk management. Throughout its 150 year history, risk management has always been a priority for the Group. In 2015, major progress has been made to anticipate and to meet the big challenges faced against a constantly shifting economic, social and regulatory background.
This means that the risk function is now more crucial than ever for Grupo Santander, as it enables it to be a solid, secure and sustainable bank.
Grupo Santander is focused on building the future through a forward-looking management of all risks, while safeguarding the present through a robust control environment. Thus, its policy is that the risks function is based on the following pillars, which are aligned
with the Santander Group’s strategy and business model, that take on board the recommendations of supervisory bodies, regulators and best market practices:
1. The business strategy is defined by the risk appetite. The board of Grupo Santander determines the quantity and type of risk it considers reasonable to assume in the execution of its business strategy and to create targets that are objective, comparable and consistent with the risk appetite for each key activity.
2. All risks have to be managed by the units which generate them using advanced models and tools and integrated in the different businesses. Grupo Santander is promoting advanced

181
Pillars of the risk function5. Risk management report
2015 ANNUAL REPORT
risk management using models and innovative metrics, and also a control, reporting and escalation framework in order to pinpoint and manage risks from different standpoints.
3. The forward-looking approach for all risk types must be part of the risk identification, assessment and management processes.
4. The independence of the risk function encompasses all risks and provides an appropriate separation between the risk generating units and units responsible for controlling these risks. It implies that the risk function should also have sufficient authority and direct access to management and governance bodies which are responsible for establishing and overseeing risk strategy and policies.
5. Risk management has to have the best processes and infrastructures. Grupo Santander aims to be a benchmark model in developing risk management support infrastructure and processes.
6. A risk culture which is integrated throughout the organisation, composed of a series of attitudes, values, skills and guidelines for action to cope with all risks. Grupo Santander believes that advanced risk management cannot be achieved without a strong and steadfast risk culture which is found in each and every one of its activities.
RISK APPETITE DRIVES
BUSINESS
Integration of risks within business
Forward looking approach for all risk types
Risk function Independence
Best-in-class risk infrastructure
GROUP-WIDE EMBEDDED RISK CULTURE

182
5. Risk management report2015 ANNUAL REPORT
Risk control and management model - Advanced Risk Management > Map of risks
EXECUTIVE SUMMARYA. PILLARS OF THE RISK FUNCTIONB. RISK CONTROL AND MANAGEMENT MODEL - Advanced Risk Management 1. Map of risks 2. Risk governance 3. Management processes and tools 4. Risk culture - Risk ProC. BACKGROUND AND UPCOMING CHALLENGESD. RISK PROFILEAPPENDIX: EDTF TRANSPARENCY
B. Risk control and management model - Advanced Risk ManagementThe model of managing and controlling risks ensures the risk profile is maintained within the levels set by the risk appetite and the other limits. It also incorporates the adoption of the necessary corrective and mitigation measures to maintain risk levels in line with the defined objectives.
In 2014, the Group launched the Advanced Risk Management (ARM) programme, which is mainly aimed at helping to the Group’s shift towards advanced management, laying down the foundations to have the best enterprise wide risk management model in the financial industry.
Through the roll-out of ARM in 2015 in all the Group units, progress has been made in strategic projects already under way such as the Risk Data Aggregation/Risk Reporting Framework (RDA/RRF), evolving the risk appetite, bolstering the control environment through governance of the risk function, and in developing new initiatives such as model risk management or Advanced Operational Risk Management (AORM), inter alia. The programme is also helping to reinforce the risk culture which is still one of the Group’s hallmarks.
The elements enabling adequate management and control of all these risks derived from Grupo Santander’s activity are set out below.
B.1. Map of risks
Identifying and evaluating all risks is a corner stone for controlling and managing risks. The risks map covers the main risk categories in which Grupo Santander has its most significant exposures, current and/or potential, facilitating this identification.
Credit risk
Model risk
Operational risk
Market risk
Reputational riskConduct risk
Liquidity risk
Strategic risk
Compliance and legal risk
Structural and capital risks
Financial risks Non-financial risks Transversal Risks
The first level includes the following risks
Financial risks• Credit risk: risk of loss derived from non-compliance with
contractual obligations agreed in financial transactions.
• Market risk: that incurred as a result of the possibility of changes in market factors that affect the value of positions in the trading book.
• Liquidity risk: risk of not complying with payment obligations on time or doing so with an excessive cost.
• Structural and capital risks: risk occasioned in the management of the various balance sheet items, including those concerning sufficient equity levels and those resulting from insurance and pension activities.

183
5. Risk management report2015 ANNUAL REPORT
Risk control and management model - Advanced Risk Management > Risk governance
Non-financial risks• Operational risk: risk of losses resulting from inadequate or
failed processes, people and internal systems, or from external events.
• Conduct risk: risk caused by inadequate practices in the Bank’s relationships with its customers, the treatment and products offered and their adequacy for each specific customer.
• Compliance and legal risk: risk owing to the breach of the legal framework, norms or regulators’ and supervisors’ requirements.
Transversal risks• Model risk: consists of losses arising from decisions mainly
based on results of models, due to errors in the design, application or usage of such models.
• Reputational risk: risk of damages to the way the bank is perceived by public opinion, but its clients, investors or any other interested party.
• Strategic risk: risk that results are significantly removed from the entity’s strategy or business plan due to changes in the general rules of business and risks associated to strategic decisions. It includes the risk of badly implementing decisions or the lack of response capacity to changes in the business environment.
All risk should be referenced to the basic risk categories established in the Risk Map, in order to organise its management, control and related information.
B.2. Risk governance
In 2015, governance of the risk function was updated and reinforced, by including the best international practices, in order to strengthen the Group’s corporate governance. The responsibilities of the different committees have been defined more clearly, separating risk decision-making and management units which take part in business functions from those responsible for risk control.
The governance of the risk function should safeguard adequate and efficient decision-taking and the effective control of risks, and ensure that they are managed in accordance with the risk appetite defined by the Group’s Top Management and by the units, if applicable.
For this purpose, the following principles are established:
• Segregation between risk decision-taking and control.
• Stepping up the responsibility of risk generating functions in the decision making process.
• Ensuring that all risks decisions have a formal approval process.
• Ensuring an aggregate overview of all risk types.
• Bolstering the risk control committees.
• Maintaining a simple committees structure.
B.2.1. Lines of defence
Banco Santander’s management and control model is based on three lines of defence.
The business functions or activities that create exposure to a risk are the first line of defence. The acceptance or generation of risk in the first line of defence should be adjusted to appetite and the limits defined. In order to tend to this function, the first
line of defence must have the resources to identify, measure, manage and report the risks assumed.
The second line of defence consists of the risk control and oversight function and by the compliance function. This line vouches for effective control of the risks and ensures they are managed in accordance with the level of risk appetite defined.
Internal audit is the third line of defence and as the last layer of control in the Group regularly assesses the policies, methods and procedures to ensure they are adequate and are being implemented effectively.
There is a sufficient degree of segregation between the risk control function, the compliance function and the internal audit function, and also between them and other functions which control or supervise them, to ensure that their functions are performed and that they have access to the board of directors and/or its committees through their heads.
B.2.2. Risk committees structure
Ultimately, the board of directors is responsible for risk control and management, and, in particularly, for setting the risk appetite for the Group, and it can delegate its powers to committees. The board uses the risk supervision, regulation and compliance committee (Board Risk Committee, BRC), as an independent risk control and oversight committee. The executive committee of the Group also pays special attention to managing the Group’s risks.

184
5. Risk management report2015 ANNUAL REPORT
Risk control and management model - Advanced Risk Management > Risk governance
The following bodies form the highest level of risk governance.
Bodies for independent control Board Risk Committee:The purpose of this committee is to assist the board in the sphere of risk supervision and control, define the Group’s risk policies, relations with the supervisory authorities and matters of regulation and compliance, sustainability and corporate governance.
It is made up of external non-executive directors (mostly independent ones) and is chaired by an independent director.
The functions of the board risk committee are:
• Support and advise the board in defining and assessing the risk policies that affect the Group and in determining the risk propensity and risk strategy.
• Provide assistance to the board for overseeing implementation of the risk strategy and its alignment with strategic commercial plans.
• Systematically review the exposures with the main clients, economic sectors, geographic areas and types of risk.
• Know about and assess management tools, ideas for improvement, the progress in projects and any other relevant activity relating to risk control over the course of time, including the internal risk model policy and its internal validation.
• Support and advise the board as regards supervisors and regulators in the various countries where the Group operates.
• Oversee compliance with the general code of conduct, of the anti-money laundering and combating terrorism financing manuals and procedures, and, in general, for the rules of governance and the Company’s compliance programme, and make proposals necessary for improvement. In particular, it is the committee’s responsibility to receive information and, where necessary, issue reports on the disciplinary measures for senior management.
• Supervise the Group’s policy and rules of governance and compliance and, in particular, adopt the actions and measures that results from the reports or the inspection measures of the administrative authorities of supervision and control.
• Monitor and assess the proposed regulations and regulatory developments that result from their implementation and the possible consequences for the Group.
Risk control committee (RCC):This collegiate body is responsible for the effective control of risks, ensuring they are managed in accordance with the level of risk appetite approved by the board, permanently adopting an all-inclusive overview of all the risks included in the general risk framework. This duty implies identifying and tracking both current and emerging risks, and gauging their impact on the Group’s risk profile.
This committee is chaired by the Group Chief Risk Officer (GCRO) of the Group and is made up of Bank senior management. The risk function, which chairs the committee, and the compliance, financial accounting and control and risk control are represented, at least. The
CROs of local entities will take part in the committee meetings on a regular basis in order to report on the risk profile of the different interiorised, as well as other tasks.
The risk control committee reports to the board risk committee and assists it in its function of supporting the board.
Decision making bodiesExecutive risk committee (ERC): This collegiate body is responsible for risk management, due to the powers assigned to it by the board of directors, and, within its field of action and decision making, it addresses all matters relating to risks.
It takes part in risk decision making at the highest level, ensuring that risk decisions are within the limits set out in the Group’s risk appetite, and it reports its activity to the board or its committees whenever it is required to do so.
This committee is chaired by an executive vice president of the board, and includes the chief executive officer, executive directors, and other directors of the entity. The risk function, financial function and compliance function, inter alia, are represented. The CRO of the Group has a right to veto the decisions taken by this committee.
B.2.3. Structural organisation of the risk function
The Group Chief Risk Officer (GCRO) is responsible for the risk function and reports to the Bank’s executive vice-chairman, who is a member of the board of directors and chairman of the executive risk committee.
The GCRO advises and challenges the executive line and also reports independently in the risk, regulatory and compliance committee and to the board.
Advanced risk management has a holistic and forward-looking approach to risks, based on intensive use of models, designed to build up a solid control environment while also complying with the regulator’s and supervisor’s requirements.
The risk management and control model is structured on the following pillars:
• Coordination of the relationship between the local units and the Corporation, assessing the effective deployment of the risk management and control framework in each unit and ensuring they are aligned to achieve strategic risk targets.
• Enterprise Wide Risk Management (EWRM) provides a consolidated oversight of all risks to the senior management and the Group’s governance bodies, and the development of the risk appetite and the risk identification and assessment exercise. It also develops risks relations with supervisors and regulators.
• Control of financial, non-financial and transversal risks (see the map of risks in section B.1. Map of risks), verifying that management and exposure by type of risk is in line with what senior management establishes.

185
5. Risk management report2015 ANNUAL REPORT
Risk control and management model - Advanced Risk Management > Management processes and tools
• Development within the scope of risk of the policy, methodologies, scenario analyses, stress tests and data infrastructure, and robust risk governance.
B.2.4. The Group’s relationship with subsidiaries in risk management
Regarding the alignment of units with the corporationThe management and control model shares, in all the Group’s units, basic principles via corporate frameworks. These frameworks are established by the Group, and the local units adhere to them through their respective boards of directors, shaping the relations between the subsidiaries and the Group, including the role played by the latter in taking important decisions by validating them.
Over and above these principles and basics, each unit adapts its risk management to its local reality, in accordance with corporate frameworks and reference documents provided by the Corporation, so creating a recognisable risk management model in Grupo Santander.
One of the strengths of this model is the adoption of the best practices developed in each of the units and markets in which the Group operates. The corporate risk divisions act as centralisers and conveyors of these practices.
Furthermore, the Santander Group-Subsidiary Governance Model and good governance practices establishes regular interaction and functional reporting by each local CRO to the GCRO, and
B.3. Management processes and tools
also stipulates that the Group must take part in the process of appointing, setting targets, assessment and remuneration of those local CRO, all in order to ensure risks are adequately managed in the Group.
Regarding the structure of committeesThe Group-Subsidiaries Governance Model and good governance practices for subsidiaries recommends that each subsidiary should have a statutory risk committee and also an executive risk committee, chaired by the CEO, in keeping with the best corporate governance practices, and homogeneous to those already in place in the Group.
The governance bodies of the subsidiary entities are structured in accordance with the local regulatory and legal requirements and the dimension and complexity of each subsidiary, being coherent with those of the parent company, as established in the internal governance framework, thereby facilitating communication, reporting and effective control.
The administration bodies of the subsidiaries, in accordance with the internal governance framework established in the Group, will define their own model of risk powers (quantitative and qualitative). These local models of assigning powers must follow the principles contained in the reference models and frameworks developed at the corporate level.
Given its capacity of comprehensive (enterprise wide) and aggregated vision of all risks, the Corporation will exercise a role of validation and questioning of the operations and management policies in the various units, insofar as they affect the Group’s risk profile.
Risk identification and Recovery and Assessment (RIA) resolution plans
• More robust and systematic risk profile • Adaptation to new international assessment guidelines
• Approach based on:
- risk performance
- assessment of the control environment
- identification of potential risks
• New crisis management model
Risk Data Aggregation & Risk Reporting Framework (RDA/RRF) Analysis of scenarios
• Compliance with the principles • Make strategic planning more robust by of BCBS239* for effective risk data challenging the modelaggregation and risk reporting • Draw up improvement plans for
• Structural and operational processes and procedures, backed by improvements to enhance reporting of self-assessment exercisesall risks at all levels
* Basel Committee on Banking Supervision.
Risk appetite
• Significant improvement in metrics with the greatest granularity and inclusion of new capital, liquidity, and structural and operational risk metrics
• Significant extension of the risk appetite culture and governance

186
5. Risk management report2015 ANNUAL REPORT
Risk control and management model - Advanced Risk Management > Management processes and tools
B.3.1. Risk appetite and structure of limits
Santander defines risk appetite as the amount and type of risks considered reasonable to assume for implementing its business strategy, so that the Group can maintain its ordinary activity in the event of unexpected circumstances. Severe scenarios are taken into account that could have a negative impact on the levels of capital, liquidity, profitability and/or the share price.
The board is responsible for annually setting and updating the risk appetite, monitoring the Bank’s risk profile and ensuring consistency between both of them. The risk appetite is set for the whole of the Group as well as for each of the main business units in accordance with a corporate methodology adapted to the circumstances of each unit/market. At the local level, the boards of the subsidiaries are responsible for approving the respective risk appetite proposals once they have been validated by the Group.
In the 2015 year, the risk appetite local implementation process was completed, and it was bolstered by all units signing up to the corporate risk appetite Framework. This framework sets out common requirements across the entire organisation in processes, metrics, governance bodies, controls and corporate standards for integration in risk appetite management, and it is also cascaded down in an effective and traceable way to management policies and limits.
In 2015, the Group also moved ahead in aligning strategic planning with risk appetite. The business plans for the next three years were approved while also analysing their consistency with local appetites and the Group appetite in all units. Likewise, crisis management plans in 2015 were directly linked to risk appetite metrics and limits.
The scope of the metrics has also been broadened, improving coverage of operational, liquidity and structural risk, and with a greater focus on losses and capital stress metrics.
In 2016, the Group will make further efforts towards ongoing improvement and deeper analysis of risk appetite within the Advanced Risk Management (ARM) programme. It will seek to reinforce the treatment of non-financial risks, defining specific plans for management and treatment of risk appetite, inter alia.
Banking business model and fundamentals of the risk appetiteThe definition and establishment of the risk appetite in Grupo Santander is consistent with its risk culture and banking business model from the risk perspective. The main elements that define this business model and which are behind the risk appetite are:
• A general medium-low and predictable risk profile based on a diversified business model, focused on retail and commercial banking and with an internationally diversified presence and with important market shares, and a wholesale banking business model that gives priority to relations with clients in the Group’s main markets.
• A stable and regular earnings and shareholder remuneration policy, underpinned by a sound base of capital and liquidity and an effective diversification strategy in terms of sources and terms.
• An organisational structure based on subsidiaries that are autonomous and self-sufficient in capital and liquidity, minimising the use of non-operational or shell companies, and ensuring that no subsidiary has a risk profile that jeopardises the Group’s solvency.
• An independent risk function with very active involvement of senior management that guarantees a strong risk culture focused on protecting and ensuring an adequate return on capital.
• A management model that ensures a global and inter-related view of all risks, through an environment of control and robust monitoring of risks, with global scope responsibilities: all risk, all businesses, all countries.
• Focus in the business model on those products that the Group knows sufficiently well and has the management capacity (systems, processes and resources).
• The development of its activity on the basis of a conduct model that oversees the interests of clients and shareholders.
• Adequate and sufficient availability of staff, systems and the tools that guarantee maintaining a risk profile compatible with the established risk appetite, both at the global and local levels.
• A remuneration policy that has the necessary incentives to ensure that the individual interests of employees and executives are aligned with the corporate framework of risk appetite and that these are consistent with the evolution of the Bank’s long-term results.
Corporate risk appetite principlesThe following principles govern Grupo Santander’s risk appetite in all its units:
• Responsibility of the board and of senior management. The board is the maximum body responsible for setting the risk appetite and supporting regulations, as well as supervising compliance.
• Enterprise Wide Risk, backtesting and questioning risk profile. The risk appetite must consider all significant risks to which the Bank is exposed, facilitating an aggregate vision of the risk profile through the use of quantitative metrics and qualitative indicators. This enables the board and senior management to question and assimilate the current risk profile and that envisaged in business and strategic plans and its coherence with the maximum risk limits.
• Forward-looking view. The risk appetite must consider the desirable risk profile for the current moment as well as in the medium term, taking into account both the most probable circumstances as well as stress scenarios.
• Linkage with strategic and business plans, and integration in management. The risk appetite is a benchmark in strategic and business planning and is integrated into management through a bottom-up and top-down focus:

187
5. Risk management report2015 ANNUAL REPORT
Risk control and management model - Advanced Risk Management > Management processes and tools
• top-down vision: the board must lead the setting of the risk appetite, vouching for the disaggregation, distribution and transfer of the aggregated limits to the management limits set at the portfolio level, unit or business line.
• bottom-up vision: the risk appetite must emanate from the board’s effective interaction with senior management, the risk function and those responsible for the business lines and units. The risk profile contrasted with the risk appetite limits will be determined by aggregation of the measurements at the portfolio, unit and business line level.
• Coherence in the risk appetite of the various units and common risk language throughout the organisation. The risk appetite of each unit of the Group must be coherent with that defined in the remaining units and that defined for the Group as a whole.
• Regular review, continuous backtesting and adapting to the best practices and regulatory requirements. Assessing the risk profile and backtesting it against the limits set for the risk appetite must be an iterative process. Adequate mechanisms must be established for monitoring and control that ensure the risk profile is maintained within the levels set, as well as taking corrective and mitigating measures that are necessary in the event of non-compliance.
Limits structure, monitoring and controlThe risk appetite is formulated every year and includes a series of metrics and limits on these metric (statements) which express in quantitative and qualitative terms the maximum risk exposure that each unit of the Group or the Group as a whole is prepared to assume.
Fulfilling the risk appetite limits is continuously monitored. The specialised control functions report at least every quarter to the board and its risk committee on the adequacy of the risk profile with the risk appetite authorised.
The excesses and non-compliance with the risk appetite are reported by the risk control function to the relevant governance bodies. The presentation is accompanied by an analysis of the causes that provoke it, an estimation of the time they will remain this way as well as the proposed actions to correct the excess when the corresponding governance body deems it opportune.
Linkage of the risk appetite limits with the limits used to manage the business units and portfolios is a key element for making the risk appetite an effective risk management tool.
The management policies and structure of the limits used to manage the different types and categories of risk, which are described in greater detail in sections D.1.5.2. Planning (Strategic Commercial Plan), D.2.2.3. and D.2.3.3. Systems for controlling limits in this Report, have a direct and traceable relation with the principles and limits defined in the risk appetite.
In this way, the changes in the risk appetite are transferred to changes in the limits and controls used in Santander’s risk management and each one of the business and risk areas is responsible for verifying that the limits and controls used in their daily management are set in such a way that they cannot fail to comply with the risk appetite limits. The risk control and supervision function will then validate this assessment, ensuring the adequacy of the management limits to the risk appetite.
Pillars of the risk appetiteThe risk appetite is expressed via limits on quantitative metrics and qualitative indicators that measure the exposure or risk profile by type of risk, portfolio, segment and business line, both in current and stressed conditions. These metrics and risk appetite limits are articulated in five large areas that define the positioning that Santander’s senior management wants to adopt or maintain in the development of its business model:
• The volatility in the income statement that the Group is willing to accept.
• The solvency position that the Group wants to maintain.
• The minimum liquidity position that the Group wants to have.
• The maximum levels of concentration that the Group considers reasonable to admit.
• Qualitative aspects and supplementary metrics.
Core areas of appetite and key metrics
Volatility of results Solvency Liquidity Concentration
Complementary aspects
•
•
•
Maximum loss the Group is prepared to accept under a scenario of acute tensionMaximum technological and operational risk (RTO)Sensitivity of net interest margin to changes in interest rates
•
•
The minimum capital position the Group is prepared to accept under a scenario of acute tensionImpact in CET1 ratios in specific tension exercises for its main types of risks
•
•
Minimum structural liquidity positionMinimum liquidity horizon position that the Group is prepared to accept under a scenario of acute tension
•
• •
• •
Concentration by individual customerConcentration by top-NConcentration in non-investment grade counterpartiesSector concentrationConcentration in high-volatility portfolios
•
•
Qualitative operational risk indicators:• Fraud• Technological• Cyber risk and security• Litigation• Other... Qualitative restrictions

188
5. Risk management report2015 ANNUAL REPORT
Risk control and management model - Advanced Risk Management > Management processes and tools
Volatility of resultsIts object is to limit the potential negative volatility of the results projected in the strategic and business plan in the event of stress conditions.
This axis contains metrics which measure the behaviour and evolution of real or potential losses in the business.
Stress tests included at this level measure the maximum level in the fall in results, under adverse conditions, in the main types of risk to which the Bank is exposed, with a feasible probability of occurring and similar by risk type (so that they can be aggregated).
SolvencyThe object of this axis is to ensure that risk appetite adequately considers the maintenance and upkeep of the entity’s equity, keeping capital higher than the levels marked by regulatory requirements and market demand.
Its purpose is to determine the minimum level of capital which the entity considers it needs to maintain to cope with potential losses under both normal and stressed conditions and arising from its activity and from its business and strategic plans.
This capital focus included in the risk appetite framework is supplementary and consistent with the Group’s capital objective approved within the capital planning process implemented in the Group and which extends to a period of three years (further details are provided in chapter D.8 Capital risk of this report and the Prudential Relevance Report -Pillar III-).
Liquidity positionGrupo Santander has developed a funding model based on autonomous subsidiaries that are responsible for covering their own liquidity needs. On this basis, liquidity management is conducted by each subsidiary within a corporate framework of management that develops its basic principles (decentralisation, equilibrium in the medium and long term of sources-applications, high weight of customer deposits, diversification of wholesale sources, reduced recourse to short-term funds, sufficient reserve of liquidity) and revolves around three main pillars (governance model, balance sheet analysis and measurement of liquidity risk, with management adapted to business needs). D.3 Liquidity risk and funding of this Report has more information on the corporate framework Liquidity risk and funding of this Report.
Santander’s liquidity risk appetite establishes demanding objectives of position and time frames for systemic stress scenarios (local and global) and idiosyncratic. In addition, a limit is set on a structural funding ratio that relates customer deposits, equity and medium and long term issues to structural funding needs.
ConcentrationSantander wants to maintain a widely diversified risk profile from the standpoint of its exposure to large risks, certain markets and specific products. In the first instance, this is achieved by virtue of Santander’s retail and commercial banking focus with a high degree of international diversification.
This level includes individual maximum exposure limits with customers, aggregated maximum exposure with major counterparties, maximum exposure by activity sectors, in Commercial Real Estate and in portfolios with a high risk profile. Customers with an internal rating lower than investment grade or equivalent or which are in excess of a certain degree of exposure are also monitored.
Qualitative aspects and other complementary metricsThis seeks to delimit risk exposures in a complementary way to the previous pillars.
Risk limits expressed both qualitatively (for example, the ban on operating with complex market products) as well as expressed in other quantitative metrics (for example, operational risk indicators) are studied so that relevant risks not considered in the other categories can be controlled. A qualitative indicator on the state of management is incorporated in operational risk, based on the results of indicators on other issues including governance and management, budgetary compliance, quality of the data bases of events, and corporate self-assessment questionnaires on the control environment. An indicator of compliance and reputational risk is also incorporated from an assessment matrix created for the purpose.
B.3.2. Risk identification and assessment (RIA)
Banco Santander, as part of its routine management, identifies and assesses the risks to which it is exposed in the countries in which it operates, and which are inherent in its activity.
In late 2014 the Group launched a corporate Risk identification & assessment exercise with the aim of making the Group’s risk profile assessment more robust and systematic. In 2015, the risk profile of the Group, its units and the most important risk types have been assessed, and a high degree of correlation was obtained between the sensitivity to risk factor results in the Risk identification and assessment (RIA) exercise and the corporate ICAAP stress scenarios.
The Group has also made headway in the methodological development of the corporate Risk Identification and Assessment exercise, underlining the importance of the identification and assessment of potential risk factors for the Group, greater stringency in assessing the control environment, extending the scope of the exercise and a more robust link with generating idiosyncratic scenarios in capital planning.
Risk identification & assessment is one of the initiatives which form part of the ARM (Advanced Risk Management) programme which pursues the goal of advanced risk management in order to ensure Santander is a solid and sustainable bank in the long term.
It also complies with regulatory requirements concerning a more in-depth understanding of the Group’s risk profile and the importance attached to pinpointing, assessing and evaluating the entity’s top risks, the associated control environment and any potential factors which could jeopardise the success of the Group’s strategic plan.

189
5. Risk management report2015 ANNUAL REPORT
Risk control and management model - Advanced Risk Management > Management processes and tools
According to the methodology used in the RIA exercise, three factors are taken into account in determining the Group’s risk profile:
Top risks Control
environment
Risk performance
Assessment of risk profile
• Risk performance, indicating the profile by risk type and business activity.
• Control environment to objectively establish a self-assessment regarding the effectiveness of risk management and control in accordance with pre-established targets and a defined control model.
• Top Risks to identify the material risks which could jeopardise strategic and business targets, and setting up action plans, which are then monitored.
One of the most important points for the RIA exercise is to develop a methodology to identify current material risks which senior management considers to be an area of attention. Such risks are considered to be risks which could alone, or in combination with other risks, have a significant impact on the Bank’s results, on its financial position and its capacity to maintain appropriate capital levels.
It is also used to identify what are known as emerging risks, in other words risks which could potentially have an adverse impact on the Group’s future performance, although their result and horizontal time frame are uncertain and difficult to predict (for further details see section ‘Emerging risks’ from chapter C. Background and upcoming challenges).
Looking towards 2016, the Group has its sights set on reinforcing the identification and assessment exercise, including all risks and extending the scope to all entities in which the Group has a presence.
B.3.3. Analysis of scenarios
Banco Santander conducts advanced management of risks by analysing the impact that different scenarios could provoke on the environment in which the Bank operates. These scenarios are expressed both in terms of macroeconomic variables as well as other variables that affect management.
Analysis of scenarios is a very useful tool for senior management as it enables the Bank’s resistance to stressed environments or scenarios to be tested, as well as put into effect measures to reduce the Bank’s risk profile to these scenarios. The objective is to maximise the stability of the income statement and the levels of capital and liquidity.
This forward looking vision has helped Santander to remain among the select group of international banks that throughout the crisis generated profits and maintained its dividend policy.
The robustness and consistency of the exercises of scenario analysis are based on three pillars:
• Developing mathematical models that estimate the future evolution of metrics (for example, credit losses), based on both historic information (internal of the Bank and external of the market), as well as simulation models.
• Including the expert judgement and know-how of portfolios, questioning and backtesting the result of the models.
• The backtesting of the result of the models against the observed data, ensuring that the results are adequate.
Uses of analysis of scenarios• Regulatory uses: scenario stress tests are performed using the
guidelines set by the European regulator or each one of the national regulators who oversee the Bank’s activity.
• Internal exercises of self-assessment of capital (ICAAP) or liquidity (ILAAP) in which while the regulator can impose certain requirements, the Bank develops its own methodology to assess its capital and liquidity levels in the face of different stress scenarios. These tools enable capital and liquidity management to be planned.
• Risk appetite. Contains stressed metrics on which maximum levels of losses (or minimum of liquidity) are established that the Bank does not want to exceed. These exercises are related to capital and liquidity exercises, although they have different frequencies and present different granularity levels. The Bank continues to work to improve the use of analysis of scenarios in risk appetite and ensure an adequate relation of these metrics with those used in daily risk management. For more detail see sections B.3.1. Risk appetite and structure of limits and D.3. Liquidity risk and funding of this Report.
• Daily risk management. Analysis of scenarios is used in processes for budgeting processes and strategic planning, in the generation of commercial policies of risk admission, in the global analysis of risks by senior management or in specific analysis on the profile of activities or portfolios. Further details are provided in the sections on credit risk (section D.1.5.2. Planning (Strategic commercial plan), market risk (D.2.2.1.6. and D.2.2.2.3. Analysis of scenarios) and liquidity risk (D.3.2.2. Balance sheet analysis and measurement of liquidity risk).

190
5. Risk management report2015 ANNUAL REPORT
Risk control and management model - Advanced Risk Management > Management processes and tools
Scenario analysis project in the Advanced Risk Management programmeThe scenario analysis project has been added to the other initiatives which form part of the Advanced Risk Management (ARM) programme, with the aim of improving management through metrics and advanced models. This project is divided into four core areas:
• Tool for analysing scenarios: installation of an advanced tool for estimating losses with greater soundness and computerisation of information handling, with the capacity to aggregate various types of risk and with an environment of multi user execution.
• Governance: review of the framework of governance of the exercises of scenario analysis in order to adjust to their growing importance, greater regulatory pressure and best market practices.
• Methodology: preparing plans to develop statistical stress models which have sufficient precision and granularity to meet requirements, not only of current regulation and supervision, but also to improve predictive risk capacity in accordance with advanced management.
• Processes and procedures: continuous self-assessment exercises and improvement plans to evolve processes in the context of advanced scenario analysis management.
B.3.4. Recovery and resolution plans
In 2015, the Bank prepared the sixth version of its corporate recovery plan, the most important part of which envisages the measures available to emerge on its own from a very severe crisis. This plan was initially prepared at the behest of the European Central Bank, which has become the main supervisor of Grupo Santander (mandate assigned under the Single Supervisory Mechanism, which came into force on 4 November, 2014), on the basis of regulations applicable in the European Union1. The Plan also considers the non-binding recommendations made in this area by international bodies such as the Financial Stability Board - FSB2).
As with the previous versions from 2010 to 2014, the Group presented the plan to the relevant authorities (for the first time, to the ECB in December, unlike in other years when it was submitted to the Bank of Spain) for it to be assessed in the first half of 2016.
This plan comprises of the corporate plan (covering to Banco Santander) and the individual plans for the main local units (United Kingdom, Brazil, Mexico, US, Germany, Argentina, Chile, Poland and Portugal), thereby meeting the commitment made by the Bank with the authorities in 2010. It is important to note the cases of the countries referred to above belonging to the European Union, where, apart from the fact that they are mandatory as the form part of the
corporate plan, they also need to be completely developed due to regulatory initiatives arising from the transposition of Directive 2014/59/EU (European Union Crisis Management Directive) to their local legislations.
During 2015 , the Group has adapted the plan structure and content to the new international guidelines, taking advantage to introduce improvements concerning potential crisis situation in the governance chapters (these improvements largely concern the indicators structure and the general crisis situation governance) and in strategic analysis.
The Group’s senior management is fully involved in preparing and regularly monitoring the content of the plans, through specific committees of a technical nature, as well as monitoring at the institutional level which guarantee that the content and structure of the documents are adapted to local and international regulations in crisis management, which have been in continuous development for the last years.
The board of directors is responsible for approving the corporate plan, once the plan’s content and data have been previously submitted and discussed in the bank’s main management and control committees (executive committee, board risk committee, executive risk committee, capital committee). The individual plans are approved by the local bodies and always in coordination with the Group, as these plans must be part of the corporate plan.
During 2016, the Group will continue to introduce improvements in the recovery plans, seeking to adopt developments in this domain which are observed in the market, as well as those necessary to fully adapt the local plans structure to the new European corporate framework, taking into account any restrictions arising from local authorities.
Regarding resolution plans, the authorities which take part in the Crisis Management Group (CMG) have adopted a common approach on the strategy to follow for the Group’s resolution plan that, given the legal and business structure with which Santander operates, corresponds to the so called multiple point of entry (MPE); they have signed the cooperation agreement on resolution (COAG); and have developed the first resolution plans. The corporate plan was analysed in a meeting of the Crisis Management Group held on 3 December. The Group continues to cooperate with the competent authorities in the preparation of resolution plans, providing all the information that the authorities might require.
As a case apart, in the US resolution plans are the responsibility of the banks themselves. The Group has presented the third version of the local resolution plans (one for all of the Group’s activities in the US, in line with the Federal Reserve’s regulations, and the other only covering Santander Bank, as the deposit-taking institution subject to the regulations of the Federal Deposit Insurance Corporation (FDIC).
1. Fundamentally, Directive 2014/59/UE (the ‘European Union Crisis Management Directive’); recovery regulatory implementations by the EBA in force (EBA/RTS/2014/11; EBA/GL/2014/06; EBA/GL/2015/02); EBA technical recommendation to the Commission regarding the identification of core business lines and critical functions (EBA/op/2015/05); EBA regulatory developments pending approval (EBA/CP/2015/01 on ITS resolution item templates); EBA regulatory developments which do not directly concern recovery but with important implications (EBA/GL/2015/03 on early warning triggers); local regulation of Spain: Credit entities and investment service firms recovery and resolution Act 11/2015.
2. FSB Key Attributes of Effective Resolution Regimes for Financial Institutions (15 October 2014, following the update of the first publication in October 2011).
191
5. Risk management report2015 ANNUAL REPORT
Risk control and management model - Advanced Risk Management > Management processes and tools
B.3.5. Risk Data Aggregation & Risk Reporting Framework (RDA/RRF)
In recent years, the Group has developed and implemented the necessary structural and operating improvements to reinforce and consolidate enterprise wide risk, based on complete, precise and regular data. This allows the Group’s senior management to assess risk and act accordingly.
Against this background, Santander believes that regulatory requirements are aligned with the strategic risk transformation plan, and hence at the current date the Group complies with the standards set forth in the BCBS 239 regulation. The core aim of this project, which was launched in early 2015 and which has been successfully completed in 2015, was to ensure that the risk data reported to senior management will include the basic principles of Risk Data Aggregation (RDA).
Risks reports contain appropriate balance between data, analysis and qualitative comments, include forward-looking measures, risk appetite data, limits and emerging risks, and are distributed in due time and form to the senior management.
In the field of governance, the risk data and information quality committee was set up, and will be responsible for applying measures decided by the board in this area; a common data management methodology was also implemented using the pertinent models, procedures and guidelines.
The Group is equipped with a common reporting taxonomy which covers all the significant risk areas within the organisation, and which is in keeping with the Group’s size, risk profile and activity.
The senior management receives the following reports to ensure adequate risk management and decision making:
• Group risks report
• Risk factor reports:• Credit risk.• Market and structural risks.• Operational risk.• Capital.• Commercialisation compliance.• Regulatory compliance.• Anti-money laundering (AML).• Non-prudential risk (SAC).
• Risk units of each unit
Important technological developments have been implemented, allowing the Group to improve data aggregation capacities in a complete, exact, reliable and traceable way. The data throughout the Group (enterprise wide) is limited to a defined data taxonomy which is registered in a single data dictionary which is accessed by authorised bank risks personnel.
One of Grupo Santander’s commitments is to introduce new technologies to enhance data use, management and analysis. All these questions are addressed in pluri-annual plans adapted to the real situation of the Corporation and the geographies in which we operate.
B.3.6. Control environment
The risk management model has a control environment that guarantees adequate control of all the risks, contributing a comprehensive vision of them. This control is carried out in all the Group’s units and for each type of risk in order to ensure that the Group’s exposures and risk profile are within the mandates established by both the board as well as regulators.
The main functions that ensure effective control are:
1. Clearly assigning responsibilities in risk generating units through decision making and control of their activities.
2. Specialised control of each risk factor.
3. Supervision and aggregated consolidation of all risks.
4. Assessment of control mechanisms.
5. Independent assessment by internal audit.

192
5. Risk management report2015 ANNUAL REPORT
Risk control and management model - Advanced Risk Management > Risk culture - Risk Pro
Our internal culture (The Santander Way) includes a Santander way of managing risks; a Santander risk culture which we call ‘risk pro’, which is one of our main competitive advantages on the market.
Grupo Santander’s robust risk culture is one of the key reasons why it has been able to cope with changes in economic cycles, customers’ new demands, increased competition, and to be considered as an entity which earns the trust of its employees, customers, shareholders and its communities.
Against a background of constant changes, with new types of risks and greater requirements by regulators, Grupo Santander wishes to maintain an excellent level of risk management in order to achieve sustainable growth.
Excellence in risk management is thus one of the strategic priorities that has most shaped the Group’s development. This involves consolidating a strong risk culture in the Group, a risk culture which all Grupo Santander employees are familiar with and which they apply.
This risk culture is defined through five principles which must necessarily form part of all the Group’s employees’ day-to-day activities:
Accountability, because all units and employees (no matter what function they perform) should know of and understand the risks incurred in their daily management and be responsible for identifying, assessing, managing and reporting.
Resilience, which is a combination of prudence and flexibility. All employees have to be prudent and steer clear of any risks they are not familiar with or which are in excess of the established risk appetite. They must also be flexible, because risk management has to quickly adapt to new environments and unexpected scenarios.
Challenge, because ongoing debate is encouraged throughout the Group. We always ask ourselves how to manage risks in a proactive, positive and open way, giving us an overview which allows us to anticipate future challenges.
Simplicity, because universal risk management needs clear processes and decisions which are documented and easily understood by employees and customers.
And, of course, customer focus. All risks actions are focused on the customer, on his or her long term interests. Our aim at Grupo Santander is to be the best retail and commercial bank that earns the lasting loyalty of our people, customers, shareholders and communities. We can achieve this goal by making a proactive contribution to help our customers prosper with excellent risk management.
B.4. Risk culture - Risk ProLong term
customer focusAccountability
Resilience
Challenge
Simplicity
The risk pro risk culture is being reinforced in all Grupo Santander units through three drivers:
• Development of a model for the Advanced Risk Management (ARM) programme. This is a solid and integrated programme which is designed to build towards the future using a forward-looking management and overview of all risks, which also safeguards our present with a strong control environment. For Grupo Santander, advanced risk management is a priority in its long-term objective of continuing to be a solid and sustainable bank.
• In the first phase of ARM, all the Group’s banks have been aligned with regulatory guidelines and have established the milestones for the roll-out of the programme’s initiatives. One of most important points is to have solid corporate governance of the risk function.
• Developing capacities and attitudes to achieve advanced risk management. A far-reaching plan has been set in motion for all Group units and employees to know about the risk culture, clearly understand its implications and for them to think carefully about how to improve their risk management attitudes and behaviour. This plan will continue its deployment in the coming years.
• Setting up and monitoring measures to determine the risk culture status throughout the Group. The Bank is collecting evidence, using systematic monitoring, of the culture initiatives which have been set in motion, to gauge the degree of knowledge of the risk culture and to be able to continuously identify areas for improvement and action plans.

193
5. Risk management report2015 ANNUAL REPORT
Risk control and management model - Advanced Risk Management > Risk culture - Risk Pro
Training activitiesTraining is one of the ways in which the Group builds upon the risk culture. Through the corporate risk school, Santander guarantees that all its risk professionals are trained and developed with uniform criteria. The corporate risk school has now been functional for ten years, since 2005. During these ten years, it has worked side by side with the 10 local schools to enhance Santander’s leadership in this sphere, continuously strengthening the skills of executives and employees.
In 2015, 24,499 hours of training hours were taught by 6.271 Group employees. The corporate risk school trains professionals from other business areas, particularly retail and commercial banking, so as to align the demanding risk management criteria to business goals.
Training hours
2010
26,665
2011
31,028
2012
29,960
2013
26,001
2014 2015
30,029
24,499
2009
21,479
In 2016, the goal is to extend this training to the entire Group, through launching new training activities and with the help of new digital technologies in order to achieve more effective and innovative training.
All the Santander team engaged in risk
It isSantanders Group’s Risk Culture (under the Santander Way: Simple Personal and Fair).
It isthe set of behaviours that each of the employees must develope to proactively manage the risks that affect our daily activities.
It isthe contribution from all of us to the bank’s sustainability and to the development of our future through the contruction of a solid present.

194
Background and upcoming challenges5. Risk management report
2015 ANNUAL REPORT
EXECUTIVE SUMMARYA. PILLARS OF THE RISK FUNCTIONB. RISK CONTROL AND MANAGEMENT MODEL - Advanced Risk ManagementC. BACKGROUND AND UPCOMING CHALLENGESD. RISK PROFILEAPPENDIX: EDTF TRANSPARENCY
C. Background and upcoming challenges
Growth in the global economy slowed in 2015 because the steady resurgence in developed countries, which has been more vigorous in the US and the United Kingdom but also in the Eurozone, was significantly offset by the downturn in emerging markets.
Growth has been lower than was expected at the start of the year. In developed economies, this has been the case due to specific circumstances which dragged on the US economy in early 2015, even though by December this did not stop the FED from implementing a slight rise in interest rates. In the Eurozone, the year saw moderate improvement until Greece’s third bail-out and the point at which the ECB began to apply a more active policy (quantitative earing). Emerging countries have been impacted by the slowdown in China (and the change in China’s growth mix), the fall in commodity prices, geopolitical problems and some measure of decline in financing conditions (lower capital outflows, rise in risk premiums, stock market falls).
Against this background, Banco Santander has a medium-low risk profile, with improved credit quality as evidenced by its core ratios: NPL ratio of 4.36% (- 83 b.p. vs. December 2014), cost of credit 1.25% (-18 b.p. vs. December 2014 ) and a coverage ratio of 73% (+6 p.p higher than in December 2014).
During 2015, the regulatory background has once again been shaped by highly demanding prudential requirements. These are some of the highlights which have happened this year:
• The BCBS’s review of the initial proposals for credit, market and operational risk prudential frameworks.
• Regulatory progress concerning loss absorption mechanisms in the event of resolution situations (MREL and TLAC).
• Publication by the European Banking Authority (EBA) of the results of the transparency exercise, a preliminary step before the stress tests to be held in 2016.
• Entities’ progress in projects designed to address regulatory changes regarding provisions, to come into force from 2018 on according to the IFRS 9 standard [refer to details in Table 1].
Regulatory compliance is a priority for Grupo Santander, and as such the Group constantly keeps track of new regulatory developments. Particularly worthy of note in 2015 were the steps forward taken in developments designed to satisfy the requirements of the Volcker rule (further details in section 3. Market regulations, section D.5.4. Regulatory compliance) and international standards on risk data aggregation (RDA) (further details in section B.3.5. Risk Data Aggregation & Risk Reporting Framework).
From the supervisory standpoint, 2015 marks one year since the coming into force of the Single Supervisory Mechanism (SSM). Supervisory activity by Eurozone banking entities has been conducted through the joint supervisory teams (JST) and through common ongoing supervision which includes the methodology known as the Supervisory Review and Evaluation Procedure (SREP3). This methodology is based on four key areas:
a. Analysis of business model;
b. Assessment of internal governance and global controls;
c. Assessment of capital risks; and
d. Assessment of liquidity risks.
3. According to the document published by the European Banking Authority (EBA): Guidelines on common procedures and methodologies for the supervisory review and evaluation process (SREP)

195
Background and upcoming challenges5. Risk management report
2015 ANNUAL REPORT
Regular supervision based on the SREP methodology is complemented with customised inspections by the supervisor, either jointly by several supervisory entities (in which case it is called a ‘thematic review’), or through individualised analysis of a particular topic within an entity (in situ inspection).
Emerging RisksThe banking sector currently has to face new a plethora of new risk of different nature and sizes. By identifying and monitoring these emerging risks, the Group can adopt a forward-looking approach to risk management, enabling the senior management to deploy action plans to address detected threats and also to adapt the Group’s risk appetite accordingly. The Group uses the Risk Identification and Assessment (RIA) exercise, referred to above, to pinpoint and assess these risks. The most important risks are as follows:
Macroeconomic environment: the main sources of macroeconomic uncertainty which could impact Banco Santander’s business activity in the coming year are as follows:
• The sustained low interest rate environment in Europe.
• The impact which divergent monetary policies could have on the different economies, with potential implications regarding exchange rates and financial stability due to:
• The increase in interest rates in the United States and how quickly the increases are applied (flight to quality).
• Extensions of the quantitative easing programme by the ECB, and
• Monetary expansion in China and Japan.
• Possible liquidity stresses on markets.
• The adjustment in the Chinese economy and its productive model.
• Changes in commodity prices and their impact on both emerging markets and developed economies.
• The decline in Brazil’s economic and fiscal situation
Banco Santander’s business model, based on geographic diversification and a customer-focused bank, leads to more stable results even in periods of macroeconomic uncertainty, ensuring a medium-low profile.
Competitive setting: the financial industry faces the challenge of adapting the way it does business to customers’ new needs. Digital transformation is a key factor for the future of the financial sector. New competitors have sprung up through this transformation: financial start-ups, large technological companies, etc., which are making inroads into different segments of the financial sector, Banco Santander has identified and assessed this risk in its business and so has managed to turn this threat into an opportunity. Innovation and digital transformation are one of the cornerstones of our business model: A number of different initiatives have been launched: investments through Santander InnoVentures in start-ups such as MyCheck, iZettle, Cyanogen, etc., alliances with business schools, progress in use of big date techniques, etc.
Another factor to be considered is that part of financial activity, and thus also its risks, has been shifted towards entities which are subject to less regulation: what is known as shadow banking. Supervision and regulation of this type of banking has to be reinforced in order to safeguard the solvency of the financial system and to allay possible knock-on effects to the rest of the sector, thereby ensuring a competitive environment with a level playing field.
Regulatory environment: the financial crisis is the root cause of the speedy action taken by authorities to implement regulatory proposals in recent years. Entities have had to cope with substantial implementation and compliance costs due to this shifting background and the increasingly more demanding requirements, and as a result ROE has been considerably reduced.
2016 is expected to be an important year in which the Basel Committee on Banking Supervision will complete its tasks aimed at creating a more simple, comparable and risk-sensitive prudential framework. Having already completed the treatment of market risks, we expect to have finished reviewing credit risk, operational risks and IRB models by the end of the year. A hybrid approach - in which internal models can be used, but with limitations - is expected.
In Europe, the final agreement regarding the structural reform proposal (segregation of wholesale and retail activities) is still to be resolved, due to a lack of consensus about the supervisor’s role and the degree of discretionality/automatism in applying this measure. In the area of retail financial services, the European Commission wants to analyse what restrictions are in place that would impede the development of a single common market. In 2016, we also expect to make progress in national transpositions of the Markets in Financial Instruments Directive (MIFID II) and the Payment Accounts Directive.
For the financial industry, it is crucial to have a stable and enduring regulatory framework, allowing banks to make valid mid-term strategies, and to constantly as the global impact of that framework so as to ensure a healthy balance between financial stability and economic growth. The regulatory proposals described above, together with recent proposals for new banking taxes (in the UK and Poland), some of which are still being discussed, such as the European Financial Transaction Tax, are causing further uncertainty.
Geopolitical backdrop: instability in international relationships, which a priori affects the volatility of financial variables and which can affect the real economy, gives rise to geopolitical risk. Evidently, the main sources of instability as we look towards the future are the debate in the UK on whether to remain in the EU (Brexit), the economic cycle in Spain, the Russia-Ukraine crisis, conflicts in the Middle East, the refugee crisis and international terrorism. Yet again, balanced geographical diversification between developed and emerging allays the possible impact of the stresses triggered by this kind of risk.
Lastly, concerning non-financial risks, the number of cybersecurity incidents which affect all sectors, including the financial sector, is steadily on the rise. In view of the importance and possible impact of this type of risk, the Bank continues to apply preventive measures so as to be ready to deal with any kinds of incidents of this nature. These types of measures are outlined in section D.4.4. Mitigation measures of Operational risk.

196
Background and upcoming challenges5. Risk management report
2015 ANNUAL REPORT
Table 1: New financial instruments classification and assessment model (IFRS 9)
1. IntroductionIn July 2014, the International Accounting Standards Board (IASB) approved International Financial Reporting Standard 9 - Financial Instruments (IFRS 9), to replace IAS39 – Financial instruments: recognition and assessment, in accordance with the guidelines which were prepared during the G-20 meeting in April 2009.
IFRS sets out the requirements for recognition and measurement of both financial instruments and certain types of contracts for the sale of non-financial items. It will be applicable from 1 January 2018 on, and will have to be previously approved by the European Union.
2. Model proposed by IFRS 9The main new developments of the standard are as follows:
2.a Classification of financial instrumentsThe criterion for classifying financial assets will depend both on their business management model and the features of the contractual flows. Consequently, the asset will be measured at amortised cost, at fair value with changes in equity, or at fair value with changes in profit/loss for the period. IFRS 9 also establishes the option of designating an instrument at fair value with changes in P/L under certain conditions.
2.b Credit risk impairment modelThe most important new development compared with the current model is that the new accounting standard introduces the concept of expected loss, whereas the current model (IAS 39) is based on incurred loss.
Scope of applicationThe IFRS 9 asset impairment model is applicable to financial assets valued at amortised cost, to debt instruments valued at fair value through other comprehensive income, to leasing receivables, and to contingent risks and commitments not valued at fair value.
Classification of financial instruments by phasesThe financial instruments portfolio for impairment purposes will be divided into three categories, depending on the phase each instrument has with regard to its credit risk:
• Phase 1: a financial instrument is in phase 1 when there has been no significant increase in its risk since it was initially
registered. If applicable, the valuation correction for losses will amount to the possible credit expected losses arising from possible defaults with ta period of 12 months following the reporting date.
• Phase 2: if there has been a significant increase in risk since the date in which the instrument was initially registered, but the impairment has not actually materialised, then the financial instrument will be included in this phase. In this case, the amount of the valuation correction for losses will be the expected losses owing to defaults throughout the residual life of the financial instrument.
• Phase 3: a financial instrument will be included in this phase when it is considered to be effectively impaired. In this case, the amount of the valuation correction for losses will be the expected losses for credit risk throughout the residual life of the financial instrument.
Impairment estimation methodologyIn these three phases of financial instruments, the value correction for losses indicated must be an amount equivalent to the expected loss for default within a period of 12 months following the reporting date, except for those cases in which there has been a significant increase in risk since the initial registration date. In the latter case, the valuation correction will be the same amount of the expected loss for credit events during the rest of the expected life of the financial instrument.
The required methodology for calculating expected loss for credit events will based on an unbiased consideration weighted for the probable occurrence of a range of future scenarios which could affect the receipt of the contractual cash flows, always taking into account the temporary value of money, and all the available and relevant information about past occurrences, current conditions and predictions regarding changes in macroeconomic factors which are proven to be important for the purpose of estimating this amount.
For financial assets, a credit loss is the current value of the difference between the contractual cash flows owed to the entity according to the contract and the cash flows which the entity expects to receive.

197
Background and upcoming challenges5. Risk management report
2015 ANNUAL REPORT
For undrawn loan commitments, a credit loss is the current value of the difference between the contractual cash flows owed to the entity if the holder of the loan commitment draws the loan and the cash flows which the entity expects to receive if the loan is drawn.
Expected loss is measured using the following factors:
• Exposure at Default (EAD): the amount of the transaction exposed to credit risk referring to the period in which the likelihood of the counterparty defaulting is considered. This amount will be estimated in cases in which the transaction repayment schedule may be modified, subject to the standard.
• Probability of Default (PD): is the likelihood that a counterparty will fail to meet its obligation to pay principal or interest. For the purposes of IFRS 9, this will consider both PD-12 months, which is the probability of the financial instrument entering default within the next 12 months, and also lifetime PD, which is the probability of the transaction entering into default between the reporting date and the transaction’s residual maturity date. Future information of relevance is considered to be needed to estimate these parameters, according to the standard.
• Loss Given Default (LGD): this reflects the percentage of exposure that could not be recovered in the event of a default. It depends mainly on the ability to demand additional collateral and the future cash flows that are expected to be recovered. According to the standard, future information will have to be taken into account to estimate it.
• Discount rate: the rate applied to the future cash flows estimated during the expected life of the asset, and which is equal to the net present value of the financial instrument at its carrying value. When calculating the discount rate, expected losses for default when estimating future cash flows are not generally taken into account, except in cases in which the asset is considered to be impaired, in which case the interest rate applied will take into account such losses, and it will be known as the effective interest rate adjusted for credit risk.
Impairment registrationThe main new development as against the current standard concerns assets measured at fair value with changes in other comprehensive income, where the part of the changes in fair value due to expected credit losses in the profit and loss account will be registered in the year in which the change occurs, and the rest will be entered in another comprehensive income.
2.c Accounting of hedgesIFRS 9 includes new hedge accounting requirements which have a twofold objective: to simplify current requirements, and to bring hedge accounting in line with risk management, so allowing there to be a greater variety of derivative financial instruments which may be considered to be hedging instruments.
Furthermore, additional breakdowns are required providing useful information regarding the effect which hedge accounting has on financial statements and also on the entity’s risk management strategy.
3. IFRS 9 implementation strategyThe Group has established a workstream with the aim of adapting its processes to the new classification standards for financial instruments, accounting of hedges and estimating credit risk impairment, so that such processes are applicable in a uniform way for all Group units, and, at the same time, can be adapted to each unit’s individual features.
Accordingly, the Group is working towards defining an objective internal model and analysing all the changes which are needed to adapt accounting classifications and credit risk impairment estimation models in force in each unit to the previous definitions.
In principle, the governance structure currently implemented at both corporate level and in each one of the units, complies with the requirements set out in the new standards.
The Group has set up a regular committee to manage the project governance structure, and a task force which is responsible for its tasks, and also assuring that the pertinent responsible teams take part.
Risks, Financial Accounting & Control and Technology and Operations are the main divisions involved in the project at the highest level, and which are thus represented in the project governance bodies indicated above.

198
Background and upcoming challenges5. Risk management report
2015 ANNUAL REPORT
The project’s main phases and milestones are as follows:
• Analysis / Diagnosis (2015 and first half of 2016): this phase consists mainly of analysing the standards and their impact on the Group’s processes.
• Design and development (2015 and 2016) this phase consists of the definition of functional requirements and transposition of requirements to the technological field, selection and development of necessary systems, identification of necessary data inputs, and construction of the new operational model to comply with regulatory requirements.
• Implementation (2016-2017): this phase consists of the model stabilisation, creation of stable and validated reports and the optimisation of execution times, in order to ensure that the model is effectively implemented.
• Parallel Execution (2017): this phase consists mainly of the transition to the new operational model by testing the model’s effective operation, simulation calculations, and generating comparable information and reporting in parallel with the current model, so as to verify the consistency of the models and the reporting systems, and to help management to understand the assumptions and sensitivities involved.
• Entry in force of standard: 1 January 2018.
4. Guidelines and complementary rulesIn addition to the standards issued by IASB, a number of regulatory and supervisory bodies have issued further considerations both in regard to the impairment model for financial instruments in IFRS 9, and items directly relating to it. These include the following documents and initiatives:
• Basel Committee on Banking Supervision - Guidelines concerning credit risk and accounting of expected credit losses (December 2015, definitive status): using 11 supervision principles and guidelines, the document issued by the Basel Committee on Banking Supervision provides a guide to good credit risk practices associated with the implementation and ongoing application of accounting frameworks for calculation of expected credit losses, and, in particular, for IFRS 9.
• European Banking Authority (EBA) – The EBA 2016 Annual Work Programme (September 2015): establishes a work plan which includes, inter alia: a quantitative and qualitative analysis of IFRS 9 as a result of the technical standards and guidelines which the European Banking Authority will develop to provide advise in accounting and auditing.
• European Banking Authority (EBA) – Draft Guidelines in the application of definition of default under article 178 of EU Regulation no. 575/2013 (September 2015, consultation status): the object of the document is to give the sector guidelines which can be used to harmonise the default definition used in internal models towards those existing for regulatory purposes.
• Enhanced Disclosure Task Force EDTF – Impact of expected loss models in breakdowns of risk (November 2015, definitive status): The EDTF, which the Group has been a member of since it was set up, is a task force made up of financial entities, fund managers, auditors and rating agencies which was promoted by the Financial Stability Board in 2012 with the main object of improving the quality, comparability and transparency in the disclosure of financial reporting. In 2015, the task force has reviewed the original principle and recommendations to include information for a provisions model based on expected credit losses (ECL). The publication of the recommended information is temporarily adapted to the provisional implementation schedule for the new standards, and includes transitional recommendations for the implementation phase, and other permanent recommendations.

199
Risk profile > Credit risk5. Risk management report
2015 ANNUAL REPORT
EXECUTIVE SUMMARYA. PILLARS OF THE RISK FUNCTIONB. RISK CONTROL AND MANAGEMENT MODEL - Advanced Risk Management C. BACKGROUND AND UPCOMING CHALLENGESD. D. RISK PROFILE 1. Credit risk 2. Trading market risk and structural risks 3. Liquidity risk and funding 4. Operational risk 5. Compliance and conduct risk 6. Model risk 7. Strategic risk 8. Capital riskAPPENDIX: EDTF TRANSPARENCY
D. Risk profile
D.1. Credit risk
Organisation of this section
After an introduction to the concept of credit risk and the segmentation that the Group uses for its treatment, the key figures of 2015 and change over time are presented [pag. 200-207].
This is followed by a look at the main geographies, setting out the main features from the credit risk standpoint [pag. 208-215].
The qualitative and quantitative aspects of other credit risk matters are then presented, including information on financial markets, risk concentration, country risk, sovereign risk and environmental risk [pag. 216-224].
Lastly, there is a description of the Group’s credit risk cycle, with a detailed explanation of the various stages that form part of the phases of pre-sale, sale, and post-sale, as well as the main credit risk metrics [pag. 224-229].
D.1.1. Introduction to credit risk treatment
Credit risk arises from the possibility of losses stemming from the failure of clients or counterparties to meet their financial obligations with the Group.
The Group’s risks function is organised on the basis of three types of customers:
• The segment of individuals includes all physical persons, except those with a business activity. This segment, in turn, is divided into sub segments by income levels, which enables risk management adjusted to the type of client.
• The segment of SMEs, companies and institutions includes companies and physical persons with business activity. It also includes public sector activities in general and non-profit making private sector entities.
• The segment of Santander Global Corporate Banking – SGCB – consists of corporate clients, financial institutions and sovereigns, who comprise a closed list revised annually. This list is determined on the basis of a full analysis of the company (business, countries where it operates, types of product used, volume of revenues it represents for the bank, length of relation with the client, etc.).
The following chart shows the distribution of credit risk on the basis of the management model.
Credit risk distribution
Individuals57%
SMEs, companies and institutions
27%
SGCB16%
The Group’s profile is mainly retail, accounting for 84% of total risk generated by the retail banking business.

200
Risk profile > Credit risk5. Risk management report
2015 ANNUAL REPORT
Credit risk exposure rose 7.5% in 2015, largely due to the combined impact of the increase in lending in the United Kingdom, the US, Spain and Portugal.
D.1.2. Key figures and change over time
D.1.2.1. Global map of credit risk, 2015The table below sets out the global credit risk exposure map in nominal amounts (except for derivatives and repos exposure which is expressed in credit risk equivalent) for the Group at 31 December 2015.
Gross credit risk exposure classified by legal entityMillion euros. Data at 31 December 2015
Customer loans Loans to entities2 Fixed income33Derivatives and Repos
Drawn1 Undrawn Drawn Undrawn Sovereign Private CRE4 TotalContinental Europe 327,556 77,739 30,890 288 55,387 12,772 24,397 529,030 Spain 208,341 63,381 21,432 125 42,694 7,263 21,836 365,071 Germany 31,488 830 2,396 - - 348 8 35,069 Portugal 32,792 4,591 3,489 104 6,803 3,771 2,073 53,622 Others 54,936 8,938 3,574 59 5,891 1,390 480 75,267 United Kingdom 277,225 48,144 23,625 - 6,153 8,248 18,971 382,366 Latin America 149,039 35,139 24,273 13 25,460 6,108 8,260 248,292 Brazil 69,182 21,316 14,820 12 16,226 4,826 5,291 131,673 Chile 34,836 8,363 1,725 0 1,665 976 1,469 49,034 Mexico 30,566 5,165 3,164 - 6,046 274 1,466 46,681 Others 14,455 297 4,565 - 1,523 32 34 20,905 United States 85,548 33,667 10,151 333 8,685 10,746 478 149,609 Rest of world 596 191 108 - - 1 - 896 Total Group 839,964 194,881 89,048 634 95,685 37,875 52,106 1,310,192 % of total 64.1% 14.9% 6.8% 0.0% 7.3% 2.9% 4.0% 100.0%% change/Dec 14 6.4% 8.0% 15.2% -74.0% 12.2% 13.9% 4.2% 7.5%
Gross credit risk exposure: change over timeMillion euros
2015 2014 2013 Change on 14 Change on 13Continental Europe 529,030 480,551 473,267 10.1% 11.8%Spain 365,071 333,227 327,900 9.6% 11.3%Germany 35,069 32,929 33,481 6.5% 4.7%Portugal 53,622 43,754 41,013 22.6% 30.7%Others 75,267 70,641 70,872 6.5% 6.2%United Kingdom 382,366 349,169 320,571 9.5% 19.3%Latin America 248,292 264,459 241,592 -6.1% 2.8%Brazil 131,673 160,532 141,119 -18.0% -6.7%Chile 49,034 46,084 44,147 6.4% 11.1%Mexico 46,681 43,639 39,066 7.0% 19.5%Others 20,905 14,204 17,260 47.2% 21.1%United States 149,609 123,758 73,945 20.9% 102.3%Rest of world 896 450 265 98.8% 237.8%Total Group 1,310,192 1,218,387 1,109,640 7.5% 18.1%
1. Balances drawn down by customers include contingent liabilities (see the auditor’s report and note 35 to the annual consolidated accounts) and exclude repos (EUR 6,272 million) and other customer credit financial assets (EUR 4,673 million).
2. Balances with credit entities and central banks include contingent liabilities and exclude repos, the trading portfolio and other financial assets.
3. Total fixed income excludes the trading portfolio.
4. CRE (credit risk equivalent): net replacement value plus the maximum potential value. Includes mitigants).
Gross exposure (lending to customers, entities, fixed income, derivative and repos) to credit risk in 2015 amounts to 1,310,192 million euros. The highest proportion, accounting for 86% of the total, is credit to customers and credit entities.
Risk is diversified among the main regions where the Group operates: Continental Europe (41%), United Kingdom (29%), Latin America (19%) and the US (11%).

201
Risk profile > Credit risk5. Risk management report
2015 ANNUAL REPORT
and thus helps in the efforts made to bring down the SCF NPL ratio overall in 2015. The new portfolio has a coverage ratio of 110%, similar to SCF. In 2016, an additional EUR 6,000 million is expected to be added in six European countries, continuing the strategy aimed at increasing the scope with similar risk profiles.
Other important transactions were the acquisitions of Retop, which consolidates the consumer finance business in Uruguay, and of Carfinco, allowing the auto finance business in Canada to be included in the scope of Santander Consumer Finance.
In December 2015, Santander Totta bought most of the assets and liabilities of Banco Internacional do Funchal (Banif) were acquired by Santander Totta in Portugal, further increasing market share in that country.
D.1.2.2. Performance of magnitudes in 2015The table below sets out the main items related to credit risk derived from our activity with customers:
Key figures of credit risk arising from activity with customersData at 31 December 2015
Credit risk with customers2
(million euros)Non-performing loans
(million euros)NPL ratio
(%)2015 2014 2013 2015 2014 2013 2015 2014 2013
Continental Europe 321,395 310,008 312,167 23,355 27,526 28,496 7.27 8.88 9.13
Spain 173,032 182,974 189,783 11,293 13,512 14,223 6.53 7.38 7.49Santander Consumer Finance1 76,688 63,654 58,628 2,625 3,067 2,351 3.42 4.82 4.01Portugal 31,922 25,588 26,810 2,380 2,275 2,177 7.46 8.89 8.12Poland 20,951 18,920 18,101 1,319 1,405 1,419 6.30 7.42 7.84United Kingdom 282,182 256,337 235,627 4,292 4,590 4,663 1.52 1.79 1.98Latin America 151,302 161,974 146,956 7,512 7,767 7,342 4.96 4.79 5.00Brazil 72,173 90,572 79,216 4,319 4,572 4,469 5.98 5.05 5.64Mexico 32,463 27,893 24,024 1,096 1,071 878 3.38 3.84 3.66Chile 35,213 33,514 31,645 1,980 1,999 1,872 5.62 5.97 5.91Argentina 6,328 5,703 5,283 73 92 75 1.15 1.61 1.42United States 90,727 76,014 44,372 1,935 1,838 1,151 2.13 2.42 2.60Puerto Rico 3,924 3,871 4,023 273 288 253 6.96 7.45 6.29Santander Bank 54,089 45,817 40,349 627 647 898 1.16 1.41 2.23SC USA 28,280 22,782 — 1,034 903 — 3.66 3.97 —Total Group 850,909 804,084 738,558 37,094 41,709 41,652 4.36 5.19 5.64
Coverage ratio Spec. provs. net of recovered Credit cost (%)
2015 2014write-offs3 (million euros) (% of risk)4
2013 2015 2014 2013 2015 2014 2013Continental Europe 64.2 57.2 57.3 1,975 2,880 3,603 0.68 1.01 1.23Spain 48.1 45.5 44.0 992 1,745 2,411 0.62 1.06 1.38Santander Consumer Finance1 109.1 100.1 105.3 537 544 565 0.77 0.90 0.96Portugal 99.0 51.8 50.0 72 124 192 0.29 0.50 0.73Poland 64.0 60.3 61.8 167 186 167 0.87 1.04 1.01United Kingdom 38.2 41.9 41.6 107 332 580 0.03 0.14 0.24Latin America 79.0 84.5 85.4 4,950 5,119 6,435 3.36 3.70 4.43Brazil 83.7 95.4 95.1 3,297 3,682 4,894 4.50 4.91 6.34Mexico 90.6 86.1 97.5 877 756 801 2.91 2.98 3.47Chile 53.9 52.4 51.1 567 521 597 1.65 1.75 1.92Argentina 194.2 143.3 140.4 148 121 119 2.15 2.54 2.12United States 225.0 193.6 86.6 3,103 2,233 43 3.66 3.31 (0.00)Puerto Rico 48.5 55.6 61.6 85 55 48 2.12 1.43 1.13Santander Bank 114.5 109.4 93.6 64 26 (5) 0.13 0.06 (0.01)SC USA 337.1 296.2 — 2,954 2,152 — 10.97 10.76 —Total Group 73.1 67.2 61.7 10,108 10,562 10,863 1.25 1.43 1.53
1. SCF includes PSA in the 2015 figures. 2. Includes gross lending to customers, guarantees and documentary credits. 3. Recovered Written-Off Assets (EUR 1,375 million). 4. Cost of credit = loan-loss provisions twelve months / average lending.NB: 2014 data have been reformulated due to the transfer of Banco Santander International units and the New York branch to the US.
Changes in scopeIn 2015, there were a number of different changes in the Group’s scope of gross credit exposure. The main programmes were:
Santander Consumer FinanceAgreement with PSA (50/50% Joint Venture between Banque PSA Finance and Santander Consumer Finance), in the consumer finance business. The main goal of this alliance is to finance vehicle acquisitions of the Peugeot, Citroën and DS brands by end customers, and second-hand vehicle transactions in auto dealers of these three brands. This agreement adds approximately EUR 15,000 million of exposure in 2015.
Through this alliance, SCF has been able to strengthen its position on the market, stepping up its presence in countries where it already has exposure such as Spain, the United Kingdom and Portugal, and moving into new markets such as France and Switzerland, in so doing increasing its scope in 2015.
The new portfolio has an NPL ratio of approximately 2.4% at year end,

202
Risk profile > Credit risk5. Risk management report
2015 ANNUAL REPORT
At the end of 2015, credit risk with customers was 6% higher. Growth in local currency is across the board except for Spain (although customer lending in isolation actually increased slightly). The lower lending in Brazil in euros is due to the BRL’s depreciation over the course of the year.
These levels of lending, together with lower non-performing loans (NPLs) of EUR 37,094 million (-11% vs. 2014) reduced the Group’s NPL ratio to 4.36% (-83 b.p. against 2014).
For coverage of these NPLs, the Group recorded net credit losses of EUR 10,108 million (-4% vs. 2014), after deducting write-off recoveries. This fall is materialised in a fall in the cost of credit to 1.25% (18 b.p. less than in 2014).
Total loan-loss provisions were EUR 27,121 million, bringing the Group’s coverage ratio to 73%. It is important to bear in mind that this ratio is affected downwards by the weight of mortgage portfolios (particularly in the United Kingdom and Spain), which require fewer provisions as they have collateral.
Conciliation of the main magnitudesThe consolidated financial report details the portfolio of customer loans, both gross and net of funds. Credit risk also includes off-balance sheet risk and derivatives. The following chart shows the relation between the concepts that comprise these magnitudes.
Figures in million euros
CREDIT RISK WITH CUSTOMERS
‘CREDIT RISK’ SECTION
BALANCE OF THE CHAPTER ‘CONSOLIDATED FINANCIAL REPORT’
LENDING (CUSTOMER CREDIT)
CUSTOMER LOANS (GROSS)
CREDIT TO CUSTOMERS (NET)
850.909*
812,833
817,365
790,848
Outstanding839,964**
Credit796,991
Funds(26,517)
Trading portfolio
6,081
6,081
Asset: Lending: credit to customers
770,474
Reasonable value
14,293
14,293
Breakdown 1
Breakdown 2
Repos, other fin. assets and derivatives
10,945 * ‘Main magnitudes’ table
** ‘Gross exposure to credit risk’ table
Contingent liability38,076
Others4,532
Lending (customer credit)812,833

203
Risk profile > Credit risk5. Risk management report
2015 ANNUAL REPORT
Geographic distribution and segmentationOn the basis of the aforementioned segmentation, the geographic distribution and situation of the portfolio is shown in the following charts:
813,815 Million euros Total 762,375
Other20%
Spain20% 696,906
Normal
NPLs
TotalUS
Brazil8%
11% 850,909Chile
4%
Portugal UK33%
37,094 41,709 41,652
4%Dec 15 2014 2013
Individuals 472,807
Other17%
Spain14%
436,612393,822
BrazilNormal
5% NPLs US
9%Total
489,011Chile4%
Portugal5% UK
46%16,204 17,482 16,688
Dec 15 2014 2013
SME+Comp+Inst 211,612199,657
Other25%
Spain24%
187,510
Normal
NPLs
Total
228,749Brazil9%
US14%
17,137 20,869 22,058
Chile5%
PortugalUK19% Dec 15 2014 2013
4% SGCB
Other20% Spain
35%129,397
126,107115,574
Normal
NPLs
US Total10%
133,149Chile
3%Portugal
2%
UK12%
Brazil18%
3,752
Dec 15
3,357
2014
2,906
2013

204
Risk profile > Credit risk5. Risk management report
2015 ANNUAL REPORT
The structure of the main magnitudes by geographic area:
• Continental Europe
• In Spain4, the NPL ratio amounted to 6.53% (-85 b.p. vs. 2014), despite the reduction in the denominator and due to the favourable evolution of NPLs, mainly at companies. The coverage ratio rose to 48% (+3 p.p. in the year).
• Portugal closed the year with a fall in the NPL ratio to 7.46%, (-143 b.p. in 2015), and an increase in the coverage ratio to 99% (+47 p.p. during the year). This performance is due to the lower with PNL in most segments and the addition of Banif.
• In Poland the downturn in the NPL ratio continued to 6.3% (-112 b.p. vs. 2014). The coverage ratio rose to 64%.
• Santander Consumer’s NPL ratio, after the increase in the perimeter, was 3.42% (-140 b.p. in 2015), with a good general performance of portfolios in all countries. The coverage ratio increased to 109%.
• The United Kingdom5 reduced its NPL ratio to 1.52% (-27 b.p.), due to the good performance in all segments, particularly retail and especially the mortgage portfolio. The coverage ratio was 38%.
• Brazil6, against an adverse macroeconomic background, the NPL ratio was contained to 5.98% (+93 b.p. in the year) using proactive risk management. The coverage ratio was 84%.
• Chile has reduced its NPL ratio to 5.62 % (-35 b.p. in the year), thanks to the good performance in non-performance loans across most segments. The coverage ratio was 54%.
• In Mexico the NPL ratio was down to 3.38% (-46 b.p. in the year), with increase in credit risk much higher than growth in the NPL portfolio. The coverage ratio was 91%.
• The United States’ NPL ratio declined to 2.13% (-29 b.p.) and the coverage ratio rose to 225% (+31 p.p. since 2014).
• The NPL ratio at Santander Bank was 1.16% (-25 b.p.), as a result of the good performance of the portfolios, while the coverage ratio was higher at 115%.
• In SCUSA, the high rotation of the portfolio and the unit’s active credit management brought the NPL ratio to 3.66% and the coverage ratio increased to 337%.
• Puerto Rico’s NPL ratio fell to 6.96% and the coverage ratio dropped to 49%.
Portfolio with normal status: amounts past dueThe amounts past due of three months or less represented 0.30% of total credit risk with customers. The following table shows the structure at 31 December 2015, classified on the basis of the age of the first maturity:
Matured amounts pendingMillion euros
Less than 1
month1-2
months2-3
months
Deposits in credit entities 5 - -
Customer loans 1,654 553 407
Public administrations 4 0 0
Other private sectors 1,650 553 407
Securities representing debt - - -
Total 1,659 553 407
Doubtful portfolio and provisions: change over time and mixDoubtful assets are divided into:
• Assets classified as doubtful due to counterparty arrears:Debt instruments, no matter what their holder or collateral might be, which have an amount in arrears for over 90 days, are allocated provisions in an individualised way, taking into account how long the unpaid amounts are outstanding, the collaterals offered and the economic situation of the counterparty and the guarantors.
• Assets classified as doubtful for reasons other than counterparty arrears:Debt instruments which cannot be classified as doubtful due to arrears but for which there are reasonable doubts as to the borrower’s ability to pay in accordance with the contractual terms are assessed individually, and an allowance is recognised equal to the difference between the carrying amount of the assets and the present value of their estimated future cash flows.
The table below shows the change over time in doubtful loans by constituent items:
Change over time in doubtful loans by constituent itemMillion euros. Data at 31 December 2015
NPLs 2014 Net entries
Perimeter & exchange rate
Write-offs NPLs 2015
(12,361)
7,705
37,08441,709
41
4. Does not include real estate activity. Further details in section D.1.3.2. Spain.
5. Further details in section D.1.3.1. United Kingdom.
6. Further details in section D.1.3.3. Brazil.

205
Risk profile > Credit risk5. Risk management report
2015 ANNUAL REPORT
2013-2015 EvolutionMillion euros
2013 2014 2015
NPLs (start of he period) 36,061 41,652 41,709
Entries 17,596 9,652 7,705
Perimeter 743 497 106
Exchange rate and other (2,122) 1,734 (65)
Write-offs (10,626) (11,827) (12,361)
NPLs (end of period) 41,652 41,709 37,094
Change over time in loan loss provisions, according to constituent itemMillion euros. Data at 31 December de 2015
Funds 2014
Gross pro-vision for impaired
assets and loan losses
Provision for other
assets
Exchange rate and
other
Write offs Funds 2015
From impaired assets 19,786
From impaired assets 17,707
From other assets 8,260
From other assets 9,414
81410,670 (12,361)
28,04627,121
(48)
Performance 2013-2015Million euros
2013 2014 2015
Funds (start of period) 26,111 25,681 28,046
From impaired assets 19,431 19,118 19,786
From other assets 6,681 6,563 8,260
Gross provision for impaired assets and loan losses 11,881 11,766 10,670
Allocation 11,686 11,766 10,670
Writedowns 195 - -
Provision for other assets 242 156 814
Exchange rate and other (1,928) 2,271 (48)
Write-offs (10,626) (11,827) (12,361)
Funds (end of period) 25,681 28,046 27,121
Forbearance portfolioThe term forbearance portfolio refers for the purposes of the Group’s risk management to operations in which the customer has shown, or is expected to show, financial difficulties which could have a material impact on its payment obligations in the prevailing contractual terms and, for this reason, steps have been taken to modify, cancel or even formalise a new transaction.
Grupo Santander has a detailed corporate policy for forbearance which acts as a reference in the various local transpositions of all the financial institutions that form part of the Group, and share the general principles established in Bank of Spain circular 6/2012 and the technical criteria published in 2014 by the European Banking Authority, developing them in a more granular way on the basis of the level of deterioration of clients.
This corporate policy sets rigorous criteria of prudence for assessing these risks:
• There must be restrictive use of restructuring, avoiding actions that delay recognising deterioration.
• The main aim must be to recover all the amounts owed, which entails recognising as soon as possible the amounts that it is estimated cannot be recovered.
• The restructuring must always envisage maintaining the existing guarantees and, if possible, improving them. Effective guarantees not only serve to mitigate the severity, but also can reduce the probability of default.
• This practice must not involve granting additional financing to the client, serve to refinance the debt of other banks, or be used as an instrument of cross-selling.
• It is necessary to assess all the forbearance alternatives and their effects, ensuring that the results would be better than those likely to be achieved in the event of not doing it.
• More severe criteria are applied for the classification of forbearance operations which prudently ensure the re-establishment of the client’s payment capacity from the moment of forbearance and for an adequate period of time.
• In addition, in the case of clients assigned a risk analyst, individualised analysis of each case is particularly important, both for their correct identification as well as subsequent classification, monitoring and adequate provisions.
The policy also establishes various criteria related to determining the perimeter of operations considered as forbearance, through defining a detailed series of objective indicators to help identify financial distress situations which could have a material impact on the customer’s meeting of its payment obligations.
In this way, operations not classified as doubtful at the date of forbearance are generally considered as being in financial difficulties if at this date non-payment exceeds a month. If there is no non-payment or if this does not exceed the month of maturity, other indicators to be assessed are taken into account including:
• Operations of clients who already have problems with other transactions.
• When the modification is made necessary prematurely, without there yet existing a previous and satisfactory experience with the client.

206
Risk profile > Credit risk5. Risk management report
2015 ANNUAL REPORT
• In the event that the necessary modifications involve granting special conditions such as the need to have to establish a temporary grace period in the payment or, when these new conditions are regarded as more favourable for the client than those granted in an ordinary admission.
• Request for successive modifications over an unreasonable period of time.
• In any case, once the modification is made, if any irregularity arises in the payment during an established period of observation, even if there are no other symptoms, the operation will be considered within the perimeter of forbearance (backtesting).
As soon as it is determined that the reasons giving rise to the modification are due to financial difficulties, two types of forbearance are distinguished for management purposes on the basis of the management situation of these operations in origin: ex ante forbearance when the original operation is considered a doubtful risk and ex post forbearance when arising from a doubtful situation.
In addition, within ex post forbearance treatments applicable for cases of advanced deterioration are distinguished, whose requirements and classification criteria are even more severe than for the rest of forbearance.
Once the forbearance is done, those operations that remain classified as doubtful risk for not meeting at the time of forbearance the requirements for their reclassification to another category, must fulfil a schedule of prudent payments in order to ensure with reasonable certainty that the client has recovered his payment capacity.
If there is any irregularity (non-technical) in payments during this period, the observation period is begun again.
Once this period is over, conditioned by the customer’s situation and by the operation’s features (maturity and guarantees granted), the operation is no longer considered doubtful, although it remains subject to a test period with special monitoring.
This tracking is maintained as long as a series of requirements are not met, including: a minimum period of observation, amortisation of a substantial percentage of the amounts pending and having met the unpaid amounts at the time of forbearance.
The forbearance of a doubtful operation, regardless of whether, as a result of it, the transaction remains current in payment, the original non-payment dates are considered for all purpose, including the determination of provisions.
Total forbearance volume at 31 December 2015 amounts to 55,362 million euros, with the following details7:
Forbearance volumeMillion euros
Non-doubtful Doubtful Total risk
Amount Amount Amount % spec. cov.
Total forebearance 34,189 21,173 55,362 20%
The Group’s forbearance volume fell 2.4% (- EUR 1,341 million), continuing the downturn begun in 2013 (-14.1% total fall over the last three years, considering an unchanged scope). Its proportion as part of the total credit risk with Group customers has also diminished (currently 6.5% vs. 7% in the previous year).
The credit quality of the portfolio has improved, with 62% in non-doubtful status (58% in 2014). Of note is the high level of guarantees (77% with real guarantees) and adequate coverage through specific provisions (20% of the total forbearance portfolio and 52% of the doubtful portfolio).
Management metrics8 Credit risk management uses other metrics to those already commented on, particularly management of non-performing loans variation plus net write-offs (known in Spanish as VMG) and expected loss. Both enable risk managers to form a complete idea of the portfolio’s evolution and future prospects.
Unlike non-performing loans, the VMG refers to the total portfolio deteriorated over a period of time, regardless of the situation in which it finds itself (doubtful loans and write-offs). This makes the metric a main driver when it comes to establishing measures to manage the portfolio.
7. Non-doubtful portfolio figures include the portfolio classified as normal and substandard in Circular 4/2004 of the Bank of Spain. For more detail on the real estate portfolio consult note 54 of the auditor’s report and the annual financial statements.
8. For further details of these metrics refer to section D.1.5.6. Measurement and control in this same chapter.

207
Risk profile > Credit risk5. Risk management report
2015 ANNUAL REPORT
The VMG is frequently considered in relation to the average loan that generated them, giving rise to what is known as the risk premium, whose change over time can be seen below.
Risk premium (VMG/average balances)%. Data with constant exchange rate
Group Brazil UK Spain
2013 2014 2015
0.16
3.51
0.28
-0.49
5.23
4.31
4.88
2.35
1.07 0.80
0.01
-0.04
The table below sets out the distribution by segments in terms of EAD, PD and LGD. For example, it can be seen how the consideration of the LGD in the metrics makes the portfolios with mortgage guarantee generally produce a lower expected loss, fruit of the recovery that occurs in the event of a default via the mortgaged property.
The expected loss with clients of the portfolio in normal situation is 1.00% (virtually unchanged vs. 2014 in which it was 1.01%) and 0.79% for the whole of the Group’s credit exposure (0.82% in 2014), maintaining the medium-low risk profile.
In 2015, the downturn in the Group’s risk premium continued, despite the increase in Brazil.
Unlike the loss incurred, used by the Group to estimate loan-loss provisions, the expected loss is the estimate of the economic loss which will occur during the following year in the existing portfolio at a given moment. Its forward-looking component complements the view provided by the VMG when analysing the portfolio and its evolution.
The expected loss reflects the portfolio’s features as regards the exposure at default (EaD), the probability of default (PD) and the severity or recovery once the default occurs (loss given default, LGD).
Credit risk exposure: segmentation
Segment EAD1 % Average PD Average LGD Expected loss
Sovereign debt 180,192 15.9% 0.13% 18.67% 0.02%
Banks and other fin. instit. 71,704 6.3% 0.29% 38.49% 0.11%
Public sector 3,794 0.3% 1.66% 21.25% 0.35%
Corporate 160,498 14.2% 0.65% 31.46% 0.21%
SMEs 161,934 14.3% 2.77% 40.12% 1.11%
Individual mortgages 343,213 30.4% 2.56% 7.38% 0.19%
Consumer credit (individuals) 145,001 12.8% 6.89% 48.13% 3.32%
Credit cards (individuals) 46,229 4.1% 3.25% 64.54% 2.10%
Other assets 17,209 1.5% 2.48% 41.30% 1.03%
Memorandum item2 860,669 76.2% 3.01% 33.11% 1.00%
Total 1,129,773 100.0% 2.37% 33.15% 0.79%
Data at December 2015.
1. Excludes doubtful loans.
2. Excludes sovereign debt, banks and other financial institutions and other assets.

208
Risk profile > Credit risk5. Risk management report
2015 ANNUAL REPORT
D.1.3. Details of main geographies
The portfolios of the geographies where Grupo Santander has the highest risk concentrations are set out below, based on the data in sections D.1.2.2 Performance in magnitudes in 2015.
D.1.3.1. United Kingdom
D.1.3.1.1. Overview of the portfolioCredit risk with customers in the United Kingdom amounts to EUR 282,182 million at the close of December 2015, accounting for 33% of the Group total.
The Santander UK portfolio is divided into the following segments:
Portfolio segmentation%
Individual mortgages85%
Other individual borrowers
3%SMEs and
companies12%
D.1.3.1.2. Mortgage portfolio Because of its importance not just for Santander UK but for all of the Group’s outstanding, it is worth highlighting the mortgage portfolio, which stood at EUR 207,309 million at the end of Deember 2015.
This portfolio consists of mortgages for acquisition or reforming homes, granted to new as well as existing clients and always constituting the first mortgage. There are no operations that entail second or successive charges on mortgaged properties.
The mortgaged property must always be located within United Kingdom territory, regardless of the destiny of the financing except in the case of some one-off operations in the Isle of Man. Mortgages can be granted for properties outside the United Kingdom, but the collateral for such mortgages must consists of a property in the United Kingdom.
Most of the credit exposure is in the south east of the United Kingdom, and particularly in the metropolitan area of London, where housing prices have risen over the last year.
Geographic concentration%
52%
5%
3%
8%3% 8% 3% 4%
5%3%
1%
5%
Scotland South East Inc London Yorks And Humber North North West Wales South West East Anglia East Midlands West Midlands Northern Ireland Other
All the properties are valued independently before each new operation is approved, in accordance with the Group’s risk management principles.
Mortgages that have already been granted are subject to a quarterly updating of the value of the property in guarantee, by an independent agency, using an automatic valuation system in accordance with the market’s usual practices and in compliance with prevailing legislation.
The distribution of the portfolio by type of borrowers is shown in the chart below:
First-time buyers1 Home movers2 Re-mortgagers3 Buy to let4
Stock New Business
19%
43%
35%
7,119 3,255
71,540 9,291
88,610 15,571
40,050 6,111
207,319 34,2283%
18%
45%
27%
10%
Mortgage portfolio loan typesMillion euros
1. First-Time Buyers: customers who purchase a home for the first time.
2. Home Movers: customers who change houses, with or without changing the bank granting the loan.
3. Re-mortgages: customers who switch the mortgage from another financial entity.
4. Buy to Let: houses bought for renting out.
There are many different types of products with different risk profiles, all of them subject to the limits inherent in the policies of a prime lender such as Santander UK. The features of some of them (in brackets the percentage of the portfolio of United Kingdom mortgages they represent):

209
Risk profile > Credit risk5. Risk management report
2015 ANNUAL REPORT
• Interest only loans (38.8%)9: the customer pays every month the interest and amortises the capital at maturity. An appropriate repayment vehicle such as a pension plan, mutual funds, etc is needed. This is a regular product in the United Kingdom market for which Santander UK applies restrictive policies in order to mitigate the risks inherent in it. For example, maximum LTV of 50%, higher cut-off in the admission score or the evaluation of the payment capacity simulating the amortization of capital and interest payments instead of just interest.
• Flexible loans (12.9%): This type of loan contractually enables the customer to modify the monthly payments or make additional provision of funds up to a pre-established limit, as well as having disbursements from previously paid amounts above that limit.
• Buy to Let (3.4%): Buy to let mortgages (purchase of a property to then rent it out) account for a small percentage of the total portfolio. Admission was halted between 2009 and 2013 when it was reactivated following the improvement in market conditions and approval with strict rick policies. In 2015, these mortgages represented around 10% of the total admission.
The evolution of the mortgage portfolio over the last three years is shown below:
Mortgage portfolio: change over timeMillion euros
2013 2014 Dec 15
7.4%*
177,617193,048
207,319200,000
150,000
100,000
50,000
0
* Real growth, discounting exchange rate effect, is 2%.
There was slight growth of 2.0% (discounting the exchange rate impact) at December 2015, accompanied by a favourable environment for the property market with rising prices.
In 2015, as can be seen in the chart below, the NPL ratio dropped from 1.64% in 2014 to 1.44% at December 2015, slightly above that of the United Kingdom banking industry as a whole, according to the Council of Mortgage Lenders (CML).
Mortgage portfolio NPL ratio: change over time
Dec 14 Mar 15
Santander UK1 CML2
Jun 15 Sep 15 Dec 15
1.33%1.30%
1.26%1.23%
1.46% 1.44%
1.54%1.62%1.64%
1. Santander UK data according to amount of cases.
2 CML data according to volume of cases.
The decline in the NPL ratio was sustained by the evolution of non- performing loans, which improved significantly thanks to a more favourable economic environment, as well as the increased NPL exits due to the improvements in the efficiency of the recovery teams. The amount of non-performing loans thus dropped by 10.2%, following the trend seen in 2014.
It is also necessary to point out the more conservative focus adopted in Santander UK’s definition of a NPL, in line with the criteria set by the Bank of Spain and Grupo Santander, with regard to the standard applied in the United Kingdom market. This focus includes the classification as doubtful of the following operations:
• Customers with payment delays of between 30 and 90 days and who have been declared publicly insolvent (via bankruptcy process) in the previous two years.
• Operations in which once the maturity date is reached there is still capital of the loan pending payment with a maturity of more than 90 days, although the client remains up to date with the monthly payments.
• Forbearance operations which, in accordance with the corporate policy, are considered as ‘payment agreements’ and thus classified as doubtful.
Excluding these concepts, which are not included for calculating the NPL ratio in the United Kingdom market, and under which EUR 445 million were classified as NPLs at the end of 2015, the ratio of the mortgage portfolio was 1.22%, well below the aforementioned 1.44% and close to that published by the Council of Mortgage Lenders.
The strict credit policies limit the maximum loan-to-value (LTV) to 90% for those loans that amortise interest payments and capital, and to 50% for those that amortize interest regularly and the capital at maturity. These policies were applied, bringing the simple arithmetic average LTV of the portfolio to 45.3% and the average weighted LTV to 41.1%. The proportion of the portfolio with a LTV of more than 100% was reduced to 1.7% from 2.4% in 2014.
9. Percentage calculated for loans with the total or an interest only component.

210
Risk profile > Credit risk5. Risk management report
2015 ANNUAL REPORT
The following charts show the LTV structure for the stock of residential mortgages and the distribution in terms of the income multiple of new loans in 2015:
< 75% < = 2.5 75-90% > 2.5-3 > 90% > 3.0
4.3%82.6% 17.5%
12.0%
70.5%
13.1%
Income multiple (average 3.1)2
Loan to value (average 45.3%)1
1. Loan to value: relation between the amount of the loan and the appraised value of the property. Based on indicess.
2. Income multiple: Income multiple: relation between the total original amount of the mortgage and the customer’s annual gross income declared in the loan request.
Credit risk policies currently used explicitly forbid loans regarded as high risk (subprime mortgages) and establish demanding requirements for credit quality, both for operations and for clients. For example, as of 2009 mortgages with a loan-to-value of more than 100% have not been allowed.
An additional indicator of the portfolio’s good performance is the reduced volume of foreclosed properties, which in December 2015 amounted to EUR 62 million, less than 0.03% of the total mortgage exposure. Efficient management of these cases and the existence of a dynamic market for this type of housing enables sales to take place in a short period of time (around 18 weeks on average), contributing to the good results.
D.1.3.1.3. SMEs and companiesAs shown in the chart on the segmentation of the portfolio at the beginning of this section, lending to SMEs and Companies (EUR 52,576 million) represented 12% of the total at Santander UK.
The following sub-segments are included in these portfolios:
SME and companies portfolio: segments
SMEs38.1%
Social housing
19.7%
SGCB24.9%
Companies17.3%
SMEs: this segment includes those small firms belonging to the business lines of small business banking and regional business centres. Total lending at December 2014 was EUR 20,036 million, with a NPL ratio of 3.8% (4.2% at the start of the year).
Companies: This includes companies who have a risk analyst assigned. It also includes portfolios considered as not strategic (legacy and non-core). Total lending at December was EUR 9,119 million, with a NPL ratio of 2% (2.2% at the start of the year).
SGCB: includes companies under the Santander Global Corporate Banking risk management model. Lending at December amounts to EUR 13,072 mn with an NPL ratio of 0.001%.
Social housing: this includes lending to companies that build, sell and rent social housing. This segment is supported by local governments and the central government and has no NPLs. Outstanding stood at EUR 10,349 million at the end of December.
In line with the objective of becoming the reference bank for SMEs and companies, the most representative portfolios of this segment had grown by around 3.6% at December 2015 in net terms.
D.1.3.2. Spain
D.1.3.2.1. Overview of the portfolioTotal credit risk (including guarantees and documentary credits) in Spain (excluding the real estate unit, commented on later) amounted to EUR 173,032 million (20% of the Group), with an adequate level of diversification by both product and customer segment.
Growth in new lending in main individual and business segment portfolios was consolidated in 2015, underpinned by the improved economic situation and the various strategies implemented by the Bank. In annual terms, total credit risk dropped 5% due mainly to lower lending to public authorities and the pace of repayment still being much higher than the growth of new lending in the other segments.
Credit risk by segmentMillion euros
2015 2014 2013Var
15/14Var
14/13
Total credit risk* 173,032 182,974 189,783 -5% -4%Home mortgages 47,924 49,894 52,016 -4% -4%Rest of loans to individuals 16,729 17,072 17,445 -2% -2%Companies 92,789 96,884 106,042 -4% -9%Public administrations 15,590 19,124 13,996 -18% 37%
* Including guarantees and documentary credits.

211
Risk profile > Credit risk5. Risk management report
2015 ANNUAL REPORT
The NPL ratio for the total portfolio was 6.53%, 85 b.p less than in 2014. The fall in lending (which increased the NPL ratio by 42 b.p.) was offset by the better NPL figure (which reduced the ratio by 127 b.p.). This improvement was mainly due to the gross NPL entries, 22% lower than 2014, and, to a lower degree, to the normalisation of several restructured positions and portfolio sales.
The coverage ratio rose 3 p.p. to levels of 48%, continuing with the increase reported in 2014.
NPL ratio and coverage ratio
2012 2013
NPL ratio Coverage ratio
2014 2015
50%
3.84%
7.49% 7.38%
44% 45%48%
6.53%
Below are the main portfolios.
D.1.3.2.2. Home mortgagesLending to households to acquire a home in Spain amounted to EUR 48,404 million at the end of 2015 (28% of total credit). 99% of those homes have a mortgage guarantee.
Lending to households to acquire homes*Million euros
2015 2014 2013
Gross amount 48,404 50,388 52,879
Without mortgage guarantee 480 493 863
With mortgage guarantee 47,924 49,894 52,016
Of which doubtful 2,477 2,964 3,956
Without mortgage guarantee 40 61 461
With mortgage guarantee 2,437 2,903 3,495
* Not including the Santander Consumer España mortgage portfolio (EUR 2,382 million in 2015, with EUR 90 million of doubtful loans).
The NPL ratio of mortgages to households to acquire a home was 5.09%, 73 b.p.less than in 2014, supported by steadily falling gross NPL entries.
NPL ratio of mortgages for homes in Spain
2013 2014 2015
5.82%
6.72%
5.09%
The portfolio of mortgages for homes in Spain kept its medium-low profile and with limited expectations of a further deterioration:
• All mortgages pay principle right from the start.
• Early amortization is usual and so the average life of the operation is well below that in the contract.
• The borrower responds with all his assets and not just the home.
• High quality of collateral concentrated almost exclusively in financing the first home.
• The average affordability rate was maintained at 28%.
• Some 69% of the portfolio has a loan-to-value of less than 80% (total risk/latest available valuation of the home).
TE< 30%
30% < TE< 40%
TE> 40%
LTV< 40%
LTV between 40% and 60%
LTV between 60% and 80%
LTV between 80% and 100%
LTV> 100%
Affordability ratio % Average 28.4%
Loan to value %
21.4%
12%
19%
26%
22%
21%53.4%
25.2%
Loan to value: percentage indicating the total risk/latest available valuation of the home.
Affordability ratio: relation between the annual instalments and the customer’s net income.

212
Risk profile > Credit risk5. Risk management report
2015 ANNUAL REPORT
In 2015, the vintages performance remained strong, underpinned by the quality measures deployed in 2008 since 2008 and also a shift in demand towards better profiles, which is shown in falling NPL entries.
7.0%
6.0%
5.0%
4.0%
3.0%
2.0%
1.0%
0.0%0 5 10 15 20 25 30 35 40 45 50 55 60 65 70 75 80 85 90 95 100
NPL
rat
e
Months
Maturity of vintages
20086.31%
20101.17%
20091.71%
20111.62%
20140.10%2015
0.01%20120.78%
20130.29%
D.1.3.2.3. Companies portfolioCredit risk assumed directly with SMEs and companies (EUR 92,889 million) is the main segment in lending in Spain (54% of the total).
Most of the portfolio (94%) corresponds to clients who have been assigned a analyst who monitors the borrower continuously throughout the risk cycle. In 2014, as part of the Santander Advanced project, the criteria of clients with an individual analyst was changed and the number of clients with continuous monitoring increased.
It is a highly diversified portfolio, with over 191,290 active customers and without significant concentrations in any one particular business segment.
Real estate activities7.8%
Manufacturing industry17.7%
Financial and insurance activities
8.4%
Professional activities, sc
ientific, technical7.2%
Supply of energy, electricity, gas, water9.8%
Information and communications
4.6%
Administrative activities
2.5%Agriculture, cattle,
forestry, fisheries2.2%
Transport and storage
5.5%
Hotel trade4.3%
Mining industries1.3%
Other social services1.1%
Construction11.6%
Other 2.0%
Commerce and repairs14.1%
Companies portfolio distribution
The NPL ratio of this portfolio was 7,64%, 127 b.p. lower than 2014, with gross entries in default 30% lower than the previous year.
D.1.3.2.4. Property activity in SpainThe Group manages, in a separate unit, run-off real estate activity in Spain10, which includes loans to clients mainly for real estate promotion, and has a specialised management model, stakes in real estate companies11 and foreclosed assets.
The Group’s strategy in the last few years has been to reduce the volume of these loans which at the end of 2015 stood at EUR 6,991 million in net terms (around 2% of loans in Spain and less than 1% of the Group’s loans). The portfolio’s composition is as follows:
• Net loans are EUR 2,596 million, EUR 1,191 million less than in December 2014 and with a coverage of 56%.
• Net foreclosed assets at year end were EUR 3,707 million, with coverage of 55%.
• The value of the stakes in real estate companies was EUR 688 million.
The gross exposure in loans and foreclosures continued the downward trend of previous years and fell 59% between 2008 and 2015.
10. For more detail on the real estate portfolio see note 54 of the Audit Report and the Annual Financial Statements.
11. As of December 2014, the stake in Metrovacesa was consolidated by global integration.

213
Risk profile > Credit risk5. Risk management report
2015 ANNUAL REPORT
The changes over time and the classification of the credit and foreclosed assets portfolios are shown in the table below:
Credits and foreclosed assets portfolioMillion euros
2015 2014
Gro
ss
bala
nce
%
cove
rage
Net
ba
lanc
e
Gro
ss
bala
nce
%
cove
rage
Net
ba
lanc
e
1. Credit 5,959 56% 2,596 8,276 54% 3,787
a. Normal 48 0% 48 102 0% 102
b. Substandard 387 30% 270 1,209 35% 784
c. Doubtful 5,524 59% 2,278 6,965 58% 2,901
2. Foreclosed 8,253 55% 3,707 7,904 55% 3,533
TOTAL 1+2 14,212 56% 6,303 16,180 55% 7,320
Under the perimeter of management of the real estate unit, net exposure was reduced by 14% in 2015.
2014 2015
3,787
2,596
3,707
6,303
7,320
3,533
-1,191
174
-1,017
Foreclosed properties Credit
Change in net exposure over time
By type of real estate that guarantees the loans and foreclosed assets, the coverage levels are as follows:
Coverage by guarantee typeMillion euros
Real estate loans
Foreclosed assets Total
Cove-Exposure rage
Cove-Exposure rage Exposure
Cove-rage
Completed buildings 2,735 43% 2,292 46% 5,027 44%
Promotions under construction 137 43% 832 49% 969 48%
Land 2,302 67% 5,081 60% 7,383 62%
Other guarantees 785 75% 48 60% 833 74%
TOTAL 5,959 56% 8,253 55% 14,212 56%
D.1.3.3. BrazilCredit risk in Brazil amounts to EUR 72,173 million, down 20.3% against 2014 and largely due to the depreciation of the Brazilian currency. Santander Brasil thus accounts for 8.5% of all Grupo Santander’s lending. It is adequately diversified and with a mainly retail profile (46.4% to individuals, consumer finance and SMEs).
* Santander Financiamentos: unit specialised in consumer finance (mainly auto finance).
Portfolio mix%
Others1.8%
SGCB33.9%
Companies16.6%
SMEs11.7%
Santander Finances*8.4%
Institutions1.3%
Retail26.3%
At the close of 2015, this unit reported 5.70% growth at an unchanged exchange rate, in line with the average growth rate for private banks in the country.
The strategy focused on the change of mix used in recent years was continued during 2015. Stronger growth was obtained in the segments with a more conservative profile, leading to greater weight in higher credit quality products. In the individuals segment, growth in particularly strong in the mortgage portfolio and in the payroll discount (‘consignado’ credit) loans portfolio created through the joint-venture between Santander Brasil and Banco Bonsucesso. Unsecured products such as special cheque and cards have fallen in both individuals and in SMEs. In companies (legal entities), the strongest growth was to be found in the business and corporate banking portfolios, with significant positions in dollars in both cases, thus benefiting from the BRL’s depreciation against the dollar.

214
Risk profile > Credit risk5. Risk management report
2015 ANNUAL REPORT
Below are the levels of lending and growth of the main segments at a constant exchange rate.
Lending: segmentationMillion euros. Fixed exchange rate at 31 December, 2015
2015 2014 2013 15 / 14 14 / 13
Individuals 18,964 18,399 17,549 3% 5%
Mortgages 6,107 5,168 3,823 18% 35%
Consumer 7,009 7,847 8,820 -11% -11%
Cards 4,403 4,265 3,993 3% 7%
Others 1,445 1,120 912 29% 23%
Santander Financiamentos 6,040 6,529 6,781 -7% -4%
SMEs and large companies 44,840 40,740 34,038 10% 20%
SMEs 8,440 7,976 8,413 6% -5%
Companies 11,959 10,766 9,020 11% 19%
Corporate 24,441 21,998 16,605 11% 32%
The leading indicators on the credit profile of new loans (vintages), which are continuously tracked, are shown below. These are transactions over 30 days in arrears at three and six months respectively from their origination date, in order to anticipate any possible impairment in portfolios. These allow the Entity to define corrective measures if deviations against the expected scenarios are detected. As we can see, these vintages were kept at comfortable levels through proactive risk management.
Vintages. Changes in the Over 30* ratio over time at three and six months from each vintage admissionAs a percentage
Mar
14
Jun
14
Sep
14
Dec
14
Mar
15
Apr
15
May
15
Jun
15
Jul 1
5
Aug
15
Sep
15
Mar
14
Jun
14
Sep
14
Dec
14
Mar
15
Apr
15
May
15
Jun
15
Jul 1
5
Aug
15
Sep
15
Individuals SMEs
1.7%1.5%
4.1%
2.4%
1.3%
1.4%
3.0%
2.8%
1.2% 0.7%
3.1%
1.7%
1.5%
1.4%
3.5%
3.1%
1.0%0.6%
2.8%
1.7%
1.2%1.0%
3.1%2.8%
2.6%2.4%
1.4% 0.7%
3.0% 1.9%
1.1%
1.2%1.5%
0.9%1.4% 1.3% 1.0%1.1%
* Ratio calculated as the total amount of operations that are more than 30 days overdue on the total amount of the vintage.
Over30 Mob3 Over30 Mob 6

215
Risk profile > Credit risk5. Risk management report
2015 ANNUAL REPORT
At the close of 2015, the NPL ratio stood at 5.98% (93 b.p. against the previous year). This increase was the result of the following factors: the country’s economic recession and additional problems in industries with the highest sensitivity to commodity prices, particularly in the energy and oil sectors. Consequently, NPL entries in the Business and Santander Global Corporate Banking segments have increased.
Faced with this situation, Santander Brazil has deployed a set of measures designed to reinforce risk management. These measures are geared towards improving the quality of new lending, and also allaying the effects of this challenging economic situation on the portfolio. This set of measures, which is known as the Defence Plan, is based on preventive management of arrears, thus enabling the Bank to anticipate possible further customer impairments. The defensive measures set out in this Plan include the following:
• Reduction of limits in products/medium-high risk clients.
• Implementing limits on maximum debt.
• Migration of revolving towards fixed instalment products.
• Higher collateralisation of portfolio.
• Improvements in admission models, which have to be more precise and predictive, and in collection channels.
• More individualised treatment in SMEs of a certain size (non-standardised model).
• Management of risk appetite by sectors and restriction of powers in critical sectors.
Santander Brazil is using this proactive risk management, based on the knowledge of our customers, to strengthen its position during the current economic cycle. This is shown by the change in the impairment rate (over 90 rate) of the loan portfolio, which stood at 3.24% at the close of 2015, and which was consistently lower than the average for Brazilian private banks in 2015 (4.20%).
The cost of credit fell during the year from 4.9% in 2014 to 4.5% in 2015 due to growth in provisions being lower than the growth in lending, and also through the strategy of changing the product mix.
The NPL coverage rate stood at 83.7% at 2015 year-end, indicating an 11.7 pp decrease on the previous year-end. This fall is the result of the previously mentioned NPL rate increase, and the change in the portfolio mix, where there was an increase in the weight of mortgage lending, which requires lower provisions since it is secured by collateral.
2012 2013 2014 2015 2012 2013 2014 2015 2012 2013 2014 2015
6.90%5.64% 5.05% 5.98%
90% 95% 95%84%
7.38%6.34%
4.84% 4.50%
NPL ratio Coverage ratio Cost of credit

216
Risk profile > Credit risk5. Risk management report
2015 ANNUAL REPORT
D.1.4. Other credit risk optics
D.1.4.1. Credit risk by activity in the financial marketsThis section covers credit risk generated in treasury activities with clients, mainly with credit institutions. This is developed through financing products in the money market with different financial institutions, as well as derivatives to provide service to Group clients.
According to chapter six of the CRR (EU regulation 575/2013), the credit risk of the counterparty is the risk that the client in an operation could enter into non-payment before the definitive settlement of the cash flows of this operation. It includes the following types of operations: derivative instruments, operations with repurchase commitment, stock lending commodities, operations with deferred settlement and financing of guarantees.
There are two methodologies for measuring the exposure, one is with the Mark to Market (MtM) methodology (replacement value of derivatives or drawn amount in committed credit lines) and the other, introduced in mid 2014 for some countries and products, which incorporates the calculation of the exposure by Monte Carlo simulation. The capital at risk or unexpected loss is also calculated, i.e. the loss which, once the expected loss has been subtracted, constitutes the economic capital, net of guarantees and recovery.
After markets close, exposures are re-calculated by adjusting all operations to their new time frame, adjusting the potential future exposure and applying mitigation measures (netting, collateral, etc), so that the exposures can be controlled directly against the limits approved by senior management. Risk control is done through an integrated system and in real time, enabling the exposure limit available with any counterparty, product and maturity and in any Group unit to be known at each moment.
Exposures in counterparty risk: over the counter (OTC) operations and organised marketsThe total exposure at the end of 2015 on the basis of management criteria in terms of positive market value after applying netting agreements and collateral by counterparty risk activities was EUR 18,761 million (net exposure of EUR 52,148 million) and was concentrated in high credit quality counterparties (78.3% of risk with counterparties has a rating equal to or more than A-).
In addition, at September 2015 credit valuation adjustments (CVA) of EUR 850.9 million were registered (+8.3% % vs. 2014 due mainly to the general decline in credit quality of the main Brazilian counterparties) and debt valuation adjustments (DVA) of EUR 530.8 million (+133%, largely due to the increase in spread of Banco Santander and to a lesser degree, as a result of changes in the corporate DVA calculation methodology)12.
Around 93% of the counterparty risk operations in nominal terms was with financial institutions and central counterparty institutions (CCP in English) with whom we operate almost entirely under netting and collateral agreements. The rest of operations with customers who are not financial institutions are, in general, operations whose purpose is hedging. Occasionally, operations are conducted for purposes other than hedging, always with specialised clients.
Distribution of counterparty risk by customer rating (in terms of nominals)*
AAA 1.06%
AA 2.52%
A 74.74%
BBB 18.69%
BB 2.95%
B 0.04%
REST 0.01%
* Ratings based on equivalences between internal ratings and credit agency ratings.
12. The definition and methodology for calculating the CVA and DVA are set out in D.2.2.2.6. Credit Valuation Adjustment (CVA) and Debt Valuation Adjustment (DVA) of this Report.

217
Risk profile > Credit risk5. Risk management report
2015 ANNUAL REPORT
Counterparty risk: distribution by nominal risk and gross market value*Million euros
2015 2014 2013
Market value Market value Market value
Nominal Positive Negative Nominal Positive Negative Nominal Positive Negative
CDS protection bought** 32,350 80 529 38,094 60 769 45,968 86 887
CDS protection sold 26,195 428 52 31,565 658 48 38,675 763 89
Total credit derivatives 58,545 508 581 69,659 717 817 84,642 849 976
Equity forwards 980 5 6 1,055 117 17 2,125 76 20
Equity options 23,564 959 1,383 36,616 1,403 2,192 58,964 1,686 2,420
Equity spot 20,643 794 - 19,947 421 - 10,041 1,103 -
Equity swaps 28 - 1,210 472 - 701 685 - 265
Equities - organised markets 6,480 - - 8,616 - - 9,117 - -
Total equity derivatives 51,695 1,758 2,598 66,705 1,941 2,910 80,931 2,865 2,705
Fixed-income forwards 11,340 39 66 3,905 3 124 3,089 1 0
Fixed-income options 789 8 - 423 4 0 - 0 -
Fixed-income spot 3,351 - - 5,055 - - 1,906 - -
Fixed income - organised markets 831 - - 1,636 - - 2,091 - -
Total fixed income derivatives 16,311 47 66 11,018 8 124 7,086 1 0
Forward and spot rates 148,537 5,520 3,315 151,172 3,633 2,828 101,216 2,594 1,504
Exchange-rate options 32,421 403 644 44,105 530 790 46,290 604 345
Other exchange rate derivatives 189 1 4 354 3 6 125 2 1
Exchange-rate swaps 522,287 20,096 21,753 458,555 14,771 15,549 411,603 9,738 8,530
Exchange rate - organised markets - - - - - - - - -
Total exchange rate derivatives 703,434 26,019 25,716 654,187 18,936 19,173 559,233 12,940 10,380
Asset swaps 22,532 950 1,500 22,617 999 1,749 22,594 901 1,634
Call money swaps 190,328 2,460 1,792 264,723 1,228 1,150 235,981 698 608
Interest rate structures 8,969 2,314 3,031 23,491 2,215 2,940 37,398 1,997 2,553
Forward interest rates- FRAs 178,428 19 78 171,207 13 63 117,011 16 18
IRS 3,013,490 85,047 85,196 2,899,760 95,654 94,624 2,711,552 58,164 54,774
Other interest-rate derivatives 194,111 3,838 3,208 218,167 4,357 3,728 230,735 3,870 3,456
Interest rate - organised markets 26,660 - - 38,989 - - 31,213 - -
Total interest-rate derivatives 3,634,518 94,628 94,806 3,638,955 104,466 104,253 3,386,485 65,648 63,043
Commodities 468 130 40 1,020 243 112 1,363 265 78
Commodities - organised markets 59 - - 208 - - 446 - -
Total commodity derivatives 526 130 40 1,228 243 112 1,809 265 78
Total gross derivatives 4,431,000 123,089 123,805 4,392,303 126,312 127,389 4,077,320 82,567 77,183
Total derivatives - organised markets *** 34,028 49,449 42,866
Repos 128,765 3,608 3,309 166,047 3,871 5,524 152,105 9,933 7,439
Securities lending 30,115 10,361 1,045 27,963 3,432 628 19,170 2,919 672
Total counterparty risk 4,623,908 137,058 128,159 4,635,762 133,615 133,541 4,291,461 95,419 85,294
* Figures with management criteria.
** Credit derivatives bought including hedging of loans.
*** Refers to listed derivatives transactions (proprietary portfolio). Listed derivatives have a market value of zero. No collaterals are received for these types of transactions.

218
Risk profile > Credit risk5. Risk management report
2015 ANNUAL REPORT
Counterparty risk: exposure in terms of market value and credit risk equivalent including mitigation effect1
Million euros
2015 2014 2013
Market value netting effect2 34,210 28,544 27,587
Collateral received 15,450 11,284 9,451
Exposure by market value3 18,761 17,260 18,136
Net CER4 52,148 50,077 58,485
1. Figures with management criteria. Listed derivatives have a market value of zero. No collaterals are received for these types of transactions.
2. Market value used to include the effects of mitigation agreements so as to calculate exposure for counterparty risk.
3. Considering the mitigation of the netting agreements and having deducted the collateral received.
4. CER/Credit risk equivalent: net value of replacement plus the maximum potential value, minus collateral received. Includes regulatory EAD for organised markets (EUR 41 million in December 2015, EUR 71 million in 2014 and EUR 60 million in 2013).
Counterparty risk: distribution of nominals by maturity*Million euros
1 year** 1-5 years 5-10 years Over 10 years TOTAL
CDS protection bought *** 31,583 767 0 0 32,350
CDS protection sold 23,817 2,159 219 0 26,195
Total credit derivatives 55,400 2,926 219 0 58,545
Equity forwards 822 158 0 0 980
Equity options 22,316 715 63 470 23,564
Equity spot 20,027 401 0 215 20,643
Equity swaps 27 1 0 0 28
Equities - organised markets 4,563 1,915 1 0 6,480
Total equity derivatives 47,756 3,190 64 685 51,695
Fixed-income forwards 11,001 313 12 14 11,340
Fixed-income options 262 527 0 0 789
Fixed-income spot 2,504 603 99 146 3,351
Fixed income - organised markets 831 0 0 0 831
Total fixed income derivatives 14,598 1,442 111 160 16,311
Forward and spot rates 136,304 10,169 929 1,136 148,537
Exchange-rate options 29,919 1,842 283 377 32,421
Other exchange rate derivatives 159 28 2 0 189
Exchange-rate swaps 491,960 21,691 4,985 3,652 522,287
Exchange rate - organised markets - - - - -
Total exchange rate derivatives 658,342 33,729 6,198 5,165 703,434
Asset swaps 6,483 15,585 243 220 22,532
Call money swaps 181,909 4,622 2,621 1,176 190,328
Interest rate structures 8,522 434 10 3 8,969
Forward interest rates- FRAs 178,240 47 141 0 178,428
IRS 2,871,123 94,584 35,985 11,798 3,013,490
Other interest-rate derivatives 176,529 11,752 4,815 1,016 194,111
Interest rate - organised markets 13,725 12,935 0 0 26,660
Total interest-rate derivatives 3,436,530 139,959 43,815 14,213 3,634,518
Commodities 422 45 0 1 468
Commodities - organised markets 35 24 0 0 59
Total commodity derivatives 457 68 0 1 526
Total gross derivatives 4,193,930 166,439 50,406 20,225 4,431,000
Total derivatives - organised markets **** 19,153 14,874 1 0 34,028
Repos 114,485 9,417 3,035 1,828 128,765
Securities lending 17,989 6,462 3,892 1,772 30,115
Total counterparty risk 4,345,557 197,192 57,334 23,825 4,623,908
* Figures with management criteria.
** The collateral replacement term is considered to be the maturity date in transactions with collateral agreements.
*** Credit derivatives acquired including hedging of loans.
**** Refers to listed bought transactions (proprietary). Listed derivatives have a market value of zero. No collaterals are received for these types of transactions.

219
Risk profile > Credit risk5. Risk management report
2015 ANNUAL REPORT
The distribution of the activity by type of counterparty in terms of notional amounts was concentrated mainly in financial institution (47%) and central clearing counterparties (46%).
Companies1%
Sovereign/Supranational
2%Corporate4%
Central clearing counterparties
46%
Financial institution47%
Counterparty risk by customer type
As regards to geographic distribution, 55% of the activity in terms of notional amounts was with UK counterparties (whose weight within the total is due to the increasing use of clearing houses), 15% with North American counterparties, 7% with French ones, 6% with Spanish counterparties, and of note among the rest is 11% with other European countries and 4% with Latin America.
Counterparty risk, organised markets and clearing housesThe Group’s policies seek to anticipate wherever possible the implementation of measures resulting from new regulations regarding operations of OTC derivatives, repos and stock lending, both if settled by clearing house or if remaining bilateral. In recent years, there has been a gradual standardisation of OTC operations in order to conduct clearing and settlement via houses of all new trading operations required by the new rules, as well as foster internal use of the electronic execution systems.
As regards the operations of organised markets, although counterparty risk management is not considered to include credit risk for this type of transaction13, since the coming into force of the new CRD IV (Capital Requirements Directive) and CRR (Capital Requirements Regulation) - which transpose the principles of Basel III - in 2014, regulatory credit exposure for these types of transactions form part of capital calculations.
The following table show the relative share in total derivatives of new operations settled by clearing house at close of 2015 and the significant evolution of operations settled by clearing house since 2013.
Spain6%
Latin America4%
Others2%
Rest of Europe11%
US15%
UK55%
Counterparty risk by geography
France7%
Distribution of counterparty risk in accordance with settlement channel and product type*Nominal in million euros
Bilateral CCP** Organised markets ***
Nominal % Nominal % Nominal % Total
Derivatives 56,767 97.0% 1,778 3.0% - 0.0% 58,545
Equity derivatives 45,174 87% 42 0.1% 6,479 12.5% 51,695
Fixed-income derivatives 15,415 94.5% 65 0.4% 831 5.1% 16,311
Exchange rate derivatives 691,679 98.3% 11,755 1.7% - 0.0% 703,434
Interest rate derivatives 1,564,716 43.1% 2,043,142 56.2% 26,660 0.7% 3,634,518
Commodities derivatives 468 88.9% - 0.0% 58.6 11.1% 526
Repos 84,086 65.3% 44,679 34.7% - 0.0% 128,765
Securities lending 30,115 100.0% - 0.0% - 0.0% 30,115
Total general 2,488,419 53.8% 2,101,460 45.4% 34,028 0.7% 4,623,908
*
**
***
Figures with management criteria.
Central counterparties (CCP).
Refers to listed derivatives transactions (proprietary portfolio). Listed derivatives have a market value of zero. No collaterals are received for these types of transactions.
13. Credit risk is eliminated by the organised markets acting as counterparty in the transactions, as they are equipped with mechanisms to safeguard their financial position using deposit and collateral replacement systems and processes to ensure liquidity and transparency in transactions.
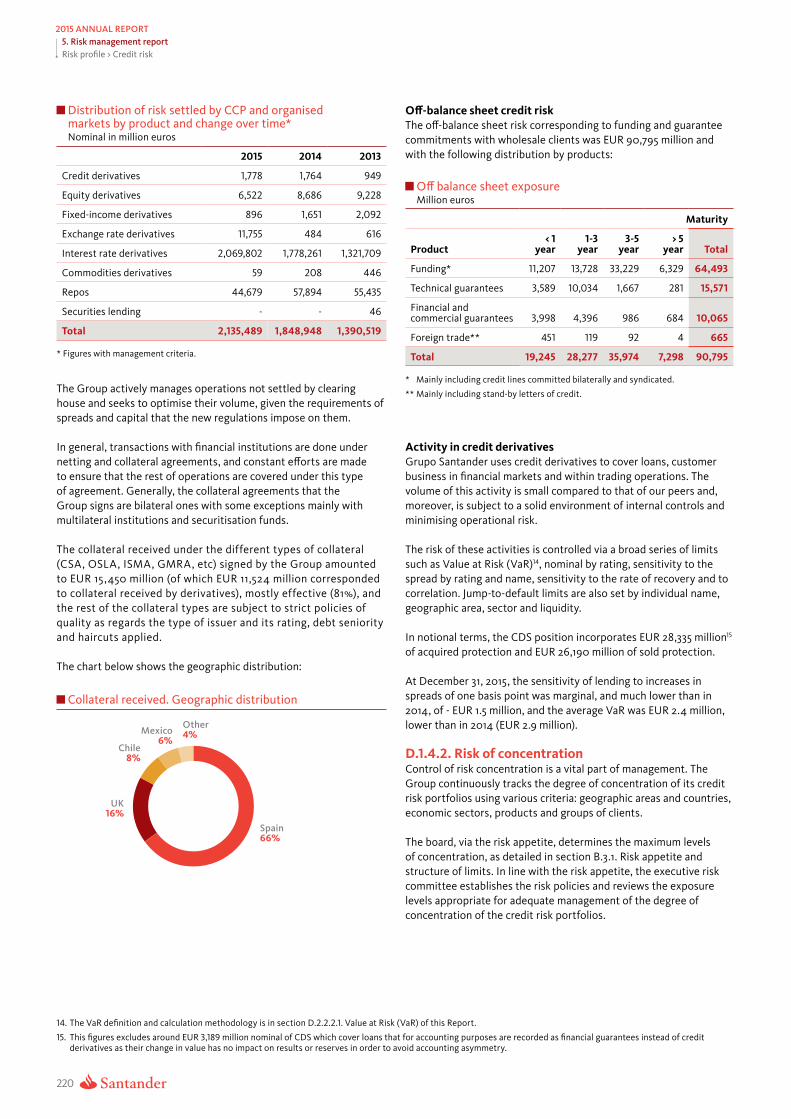
220
Risk profile > Credit risk5. Risk management report
2015 ANNUAL REPORT
Distribution of risk settled by CCP and organised markets by product and change over time*Nominal in million euros
2015 2014 2013
Credit derivatives 1,778 1,764 949
Equity derivatives 6,522 8,686 9,228
Fixed-income derivatives 896 1,651 2,092
Exchange rate derivatives 11,755 484 616
Interest rate derivatives 2,069,802 1,778,261 1,321,709
Commodities derivatives 59 208 446
Repos 44,679 57,894 55,435
Securities lending - - 46
Total 2,135,489 1,848,948 1,390,519
* Figures with management criteria.
The Group actively manages operations not settled by clearing house and seeks to optimise their volume, given the requirements of spreads and capital that the new regulations impose on them.
In general, transactions with financial institutions are done under netting and collateral agreements, and constant efforts are made to ensure that the rest of operations are covered under this type of agreement. Generally, the collateral agreements that the Group signs are bilateral ones with some exceptions mainly with multilateral institutions and securitisation funds.
The collateral received under the different types of collateral (CSA, OSLA, ISMA, GMRA, etc) signed by the Group amounted to EUR 15,450 million (of which EUR 11,524 million corresponded to collateral received by derivatives), mostly effective (81%), and the rest of the collateral types are subject to strict policies of quality as regards the type of issuer and its rating, debt seniority and haircuts applied.
The chart below shows the geographic distribution:
Mexico6%
Chile8%
UK16%
Spain66%
Other4%
Collateral received. Geographic distribution
Off-balance sheet credit risk The off-balance sheet risk corresponding to funding and guarantee commitments with wholesale clients was EUR 90,795 million and with the following distribution by products:
Off balance sheet exposureMillion euros
Maturity
Product< 1
year1-3
year3-5
year> 5
year Total
Funding* 11,207 13,728 33,229 6,329 64,493
Technical guarantees 3,589 10,034 1,667 281 15,571
Financial and commercial guarantees 3,998 4,396 986 684 10,065
Foreign trade** 451 119 92 4 665
Total 19,245 28,277 35,974 7,298 90,795
* Mainly including credit lines committed bilaterally and syndicated.
** Mainly including stand-by letters of credit.
Activity in credit derivativesGrupo Santander uses credit derivatives to cover loans, customer business in financial markets and within trading operations. The volume of this activity is small compared to that of our peers and, moreover, is subject to a solid environment of internal controls and minimising operational risk.
The risk of these activities is controlled via a broad series of limits such as Value at Risk (VaR)14, nominal by rating, sensitivity to the spread by rating and name, sensitivity to the rate of recovery and to correlation. Jump-to-default limits are also set by individual name, geographic area, sector and liquidity.
In notional terms, the CDS position incorporates EUR 28,335 million15 of acquired protection and EUR 26,190 million of sold protection.
At December 31, 2015, the sensitivity of lending to increases in spreads of one basis point was marginal, and much lower than in 2014, of - EUR 1.5 million, and the average VaR was EUR 2.4 million, lower than in 2014 (EUR 2.9 million).
D.1.4.2. Risk of concentrationControl of risk concentration is a vital part of management. The Group continuously tracks the degree of concentration of its credit risk portfolios using various criteria: geographic areas and countries, economic sectors, products and groups of clients.
The board, via the risk appetite, determines the maximum levels of concentration, as detailed in section B.3.1. Risk appetite and structure of limits. In line with the risk appetite, the executive risk committee establishes the risk policies and reviews the exposure levels appropriate for adequate management of the degree of concentration of the credit risk portfolios.
14. The VaR definition and calculation methodology is in section D.2.2.2.1. Value at Risk (VaR) of this Report.
15. This figures excludes around EUR 3,189 million nominal of CDS which cover loans that for accounting purposes are recorded as financial guarantees instead of credit derivatives as their change in value has no impact on results or reserves in order to avoid accounting asymmetry.

221
Risk profile > Credit risk5. Risk management report
2015 ANNUAL REPORT
In geographic terms, credit risk with customers is diversified in the main markets in which the Group operates, as shown in the chart below.
US11%
Other20%
Chile4%
Portugal4%
UK33%
Spain20%
Brazil8%
Credit risk with customers
Some 57% of the Group’s credit risk corresponds to individual customers, who, due to their inherent nature, are highly diversified. In addition, the portfolio is also well distributed by sectors, with no significant concentrations in specific sectors. The following chart shows the distribution at the end of the year.
Transport and communications 3%
Other business services 3%
Hotels 1%
Real estate activity6%
Commerce and repairs 5%
Construction 3%
Metallurgy 1%
Other social services 1%
Refined oil 1%
Other financial intermediaries 2%
Food, drink and tobacco 1%
Civil engineering 2%
Other manufacturing industries 3%
Prod. & distrib. of elect., gas & water 2%
Other <1% 8%
Individuals 57%
Sector diversification
The Group is subject to the regulation on large risks contained in the fourth part of the CRR (EU regulations 575/2013), according to which the exposure contracted by an entity with a client or group of clients linked among themselves will be considered a ‘large exposure’ when its value is equal to or more than 10% of the eligible capital. In addition, in order to limit the large exposures no entity can assume with a client or group of linked clients an exposure whose value exceeds 25% of its eligible capital, after taking into account the impact of the reduction of credit risk contained in the regulation.
At December 2015, after applying risk mitigation techniques and regulations applicable to large risks, all the declared groups were below 4.9% of eligible equity except for two entities: a central EU counterparty entity which was 7.3%, and an EU corporate group with 6.8%.
The regulatory credit exposure with the 20 largest groups within the sphere of large risks represented 5.8% of outstanding credit risk with clients (lending plus balance sheet risks). As for regulatory credit exposure with financial institutions, the top 10 represented EUR 19,119 million.
The Group’s risks division works closely with the financial division to actively manage credit portfolios. Its activities include reducing the concentration of exposures through various techniques such as using credit derivatives and securitisation to optimise the risk- return relation of the whole portfolio.
D.1.4.3. Country riskCountry risk is a component of credit risk in all cross-border credit operations for circumstances different to the usual commercial risk. Its main elements are sovereign risk, the risk of transfer and other risks that could affect international financial activity (wars, natural disasters, balance of payments crisis, etc).
At 31 December 2015 , exposure to potential country-risk provisions was EUR 193 million (EUR 176 million in December 2014). At the close of 2015, total provisions stood at EUR 25 million compared with EUR 22 million at the end of the previous year.
The principles of country risk management continued to follow criteria of maximum prudence; country risk is assumed very selectively in operations that are clearly profitable for the bank, and which enhance the global relationship with customers.

222
Risk profile > Credit risk5. Risk management report
2015 ANNUAL REPORT
D.1.4.4. Sovereign risk and vis-á-vis the rest of public administrations As a general criterion, sovereign risk is that contracted in transactions with a central bank (including the regulatory cash reserve requirement), the issuer risk of the Treasury or similar entity (portfolio of public debt) and that arising from operations with public institutions with the following features: their funds only come from the state’s budgeted income and the activities are of a non-commercial nature.
This criterion, historically used by Grupo Santander, has some differences with that of the European Banking Authority (EBA) used for its regular stress exercises. The main ones are that the EBA’s criterion does not include risk with central banks, exposures with insurance companies, indirect exposures via guarantees and other instruments. On the other hand, it includes public administrations in general (including regional and local ones) and not only the state sector.
Exposure to sovereign risk (according to the criteria applied in the Group) mainly emanates from the obligations to which our subsidiary banks are subject regarding the establishment of certain deposits in central banks, the establishment of deposits with the excess of liquidity and of fixed-income portfolios maintained within the risk management strategy for structural interest of the balance sheet and in trading books in treasuries. The great majority of these exposures are in local currency and are funded on the basis of customer deposits captured locally, and also in local currency.
Exposures in the local sovereign but in currencies different to the official one of the country of issuance is not very significant (EUR 11,116 million, 5.6% of the total sovereign risk), and less so the exposure in non-local sovereign issuers, which means cross- border risk (EUR 2,719 million, 1.38% of total sovereign risk).
In general, the total exposure to sovereign risk has remaimed at adequate levels to support the regulatory and strategic motives of this portfolio.
The investment strategy for sovereign risk also takes into account the credit quality of each country when setting the maximum exposure limits. The following table shows the percentage of exposure by rating levels16.
Exposure by level of rating %
30 Sep. 2015 31 Dec. 2014 31 Dec. 2013
AAA 34% 29% 36%
AA 4% 4% 6%
A 22% 28% 27%
BBB 33% 32% 26%
Lower than BBB 7% 7% 5%
Exposure to sovereign risk (EBA criteria)Million euros
31 Dec 2015 PortfolioTrading
and Held to Total net Others Available Loan maturity direct
at FV for sale portfolio portfolio exposureSpain 8,954 26,443 11,272 2,025 48,694Portugal 104 7,916 1,987 0 10,007Italy 2,717 0 0 0 2,717Greece 0 0 0 0 0Ireland 0 0 0 0 0Rest Eurozone (211) 143 69 0 1UK (786) 5,808 141 0 5,163Poland 13 5,346 42 0 5,401Rest of Europe 120 312 238 0 670US 280 4,338 475 0 5,093Brazil 7,274 13,522 947 2,186 23,929Mexico 6,617 3,630 272 0 10,519Chile 193 1,601 3,568 0 5,362Rest of America 155 1,204 443 0 1,802Rest of the world 3,657 1,687 546 0 5,890Total 29,087 71,950 20,000 4,211 125,248
31 Dec 2014 Portfolio Total net
Trading and Available Loan direct Others at FV for sale portfolio exposure
Spain 5,778 23,893 15,098 44,769Portugal 104 7,811 589 8,504Italy 1,725 0 0 1,725Greece 0 0 0 0Ireland 0 0 0 0Rest Eurozone (1,070) 3 1 (1,066)UK (613) 6,669 144 6,200Poland 5 5,831 30 5,866Rest of Europe 1,165 444 46 1,655US 88 2,897 664 3,649Brazil 11,144 17,685 783 29,612Mexico 2,344 2,467 3,464 8,275Chile 593 1,340 248 2,181Rest of America 181 1,248 520 1,949Rest of the world 4,840 906 618 6,364Total 26,284 71,194 22,205 119,683
16. Based on internal ratings.

223
Risk profile > Credit risk5. Risk management report
2015 ANNUAL REPORT
The sovereign risk distribution by rating level was affected in the last few years by many rating revisions of the sovereign issuers of the countries where the Group operates.
On the basis of the EBA criteria already mentioned, the exposure to public administrations at the end of each of the last three years was as follows (figures in million euros)17.
Exposure is moderate and the levels are similar to those in 2014. The sovereign risk exposure of Spain (where the Group has its headquarters) is not high in terms of total assets (3.6% at the end of December 2015), compared to its peers.
The sovereign exposure in Latin America is almost all in local currency, recorded in local books and concentrated in short-term maturities of lower interest rate risk and greater liquidity.
31 Dec 2013 Portfolio Total net
Trading and Available Loan direct Others at FV for sale portfolio exposure
Spain 4,359 21,144 12,864 38,367Portugal 149 2,076 583 2,807Italy 1,310 77 0 1,386Greece 0 0 0 0Ireland 0 0 0 0Rest Eurozone (1,229) 67 0 (1,161)UK (1,375) 3,777 0 2,402Poland 216 4,770 43 5,030Rest of Europe 5 117 0 122US 519 2,089 63 2,671Brazil 8,618 8,901 223 17,743Mexico 3,188 2,362 2,145 7,695Chile (485) 1,037 534 1,086Rest of America 268 619 663 1,550Rest of the world 5,219 596 148 5,964Total 20,762 47,632 17,268 85,661
Exposure to sovereign risk (EBA criteria)Million euros
Sovereign and rest of public administrations risk: Net direct exposure (EBA criterion)Million euros
120,000
100,000
80,000
60,000
40,000
20,000
0
Dec 13 Dec 14 Dec 15
Other Latin America Rest of Europe Spain
D.1.4.5. Social and environmental risk Banco Santander considers social and environmental issues to be a crucial part of risk analysis and decision making processes in its financing transactions. The Bank has applied process to identify, analyse and assess credit transactions subject to Group policy, policies based on the Equator Principle criteria, which the Bank signed up to 2009. In accordance with these principles, the social and environmental impact of project finance operations and corporate loans with a known purpose (bridging loans with forbearance envisaged via project finance and corporate financing to construct or increase a specific project) is analysed.
The methodology used is set out below.
• For project finance operations with an amount equal to or more than $10 million, corporate loans with known destiny for a project with an amount equal to more than $100 million, with Santander’s share equal to or more than $50 million, an initial questionnaire is filled out, of a generic nature, designed to establish the project’s risk in the socio-environmental sphere (according to categories A, B and C, from greater to lower risk, respectively) and the operation’s degree of compliance with the Equator Principles.
• For those projects classified within the categories of greater risk (categories A and B), a more detailed questionnaire has to be filled out, adapted according to the sector of activity.
• According to the category and location of the projects a social and environmental audit is carried out (by independent external auditors). The Bank also gives training courses in social and
17. In addition at December 31, 2015, the Group maintained direct net exposures in derivatives whose reasonable value was EUR 2,070 million, as well as indirect net exposures in derivatives whose reasonable value was EUR 25 million.

224
Risk profile > Credit risk5. Risk management report
2015 ANNUAL REPORT
environmental matters to risk teams as well as to those responsible for business of all the areas involved.
In 2015, the Group took part in funding 55 projects under the Equator principles. The total amount of debt in these 55 projects amounts to EUR 29,953 million.
During the second half of 2015, the Bank’s social-environmental task force, led by the Chief Compliance Officer, with representatives of the Compliance, Corporate Communications, Marketing and Research, Risks, Business, Internal Governance and Legal Counsel corporate areas, has carried out a project to analyse and improve the status of social-environmental policies. The analysis has been based on a benchmarking exercise with six of Santander’s peers who have a similar size and geographical location, including the most important NGO (Non-Governmental Organisations) trends in this field.
As a result of this analysis, improvements to socio-environmental policies were proposed and were approved by the Bank’s board of directors on 22 December 2015. The proposals will now be gradually applied in the different Santander geographies.
Sector wide policies establish the criteria used to limit financial activities relating to the defence, energy and soft commodities (e.g. products such as palm oil, soy and timber) sectors. These policies prohibit banks from funding certain activities, and place restrictions on others (transactions which will be closely monitored due to their social and environmental risk, and which will only be approved if they meet certain requirements). The review of policies not only includes new activities and sectors, but also defines a broader scope of application compared to those applied until 2015, given that the restricted transactions are applied across the board in wholesale banking, and the bans are applied to all transactions.
D.1.5. Credit risk cycle
The process of credit risk management consists of identifying, analysing, controlling and deciding on the risks incurred by the Group’s operations. The business areas, senior management and the risk areas are all involved.
The board and the executive risk committee take part in the process, to set the risk policies and procedures, the limits and delegation of powers, and approve and supervise the framework of the risk function.
The risk cycle has three phases: pre-sale, sale and post-sale. The process is constantly revised, incorporating the results and conclusions of the after-sale phase to the study of risk and presale planning.
1. Study of risk and credit classification process
2. Planning (Commercial strategic plan - CSP)• Analysis of scenarios
3. Establishing limits / pre-approved limits
4. Decision on operations• Mitigants
5. Monitoring6. Measurement and control7. Recovery management
• Impaired and restructured portfolio
CONTROL
Pre-sale Sale Post-sale
RISK CYCLE
D.1.5.1. Study of risk and credit rating processGenerally speaking, risk study consists of analysing a customer’s capacity to meet his contractual commitments with the Bank and other creditors. This entails analysing the customer’s credit quality, risk operations, solvency and profitability to be obtained on the basis of the risk assumed.
With this objective, since 1993 the Group has made use of models to allocate customer solvency classifications, which are known as ratings. These mechanisms are used in the wholesale segment (sovereign, financial institutions and corporate banking), as well as the rest of companies and institutions in this category.
The rating is the result of a quantitative model based on balance sheet ratios or macroeconomic variables, which is supplemented by the expert advice of the analyst.
The ratings given to customers are regularly reviewed, incorporating the latest available financial information and experience in the development of banking relations. The regularity of the reviews increases in the case of customers who reach certain levels in the automatic warning systems and in those classified as special watch. The rating tools are also revised in order to adjust the accuracy of the rating granted.
While ratings are used for wholesale and other companies and institutions, scoring techniques are used more commonly for the individuals and SMEs segment. In the latter type, a score is assigned to the customer for decision making, as set out in the ‘Decisions on operations’ section.

225
Risk profile > Credit risk5. Risk management report
2015 ANNUAL REPORT
1. Study of risk and credit classification process
2. Planning (Commercial strategic plan - CSP)• Analysis of scenarios
3. Establishing limits / pre-approved limits
4. Decision on operations• Mitigants
5. Monitoring6. Measurement and control7. Recovery management
• Impaired and restructured portfolio
CONTROL
Pre-sale Sale Post-sale
RISK CYCLE
D.1.5.2. Planning (Strategic Commercial Plan)The purpose of this phase is to limit efficiently and comprehensively the risk levels assumed by the Group.
The credit risk planning process serves to set the budgets and limits at portfolio level. Planning is articulated via the strategic commercial plan, ensuring the conjunction of the business plan, the credit policy on the basis of the risk appetite and of the necessary resources to achieve it. It has come about, therefore, as a joint initiative between the commercial area and risks, and is meant to be not only a management tool but also a form of teamwork.
The highest executive risk committee of each entity is responsible for authorising the monitoring the plan. It is validated and monitored at corporate level.
The SCPs are used to arrange the map of all the Group’s lending portfolios.
Analysis of scenariosIn line with what is described in section B.3.3. Analysis of scenarios of this Report, credit risk scenario analysis enables senior management to better understand the portfolio’s evolution in the face of market conditions and changes in the environment. It is a key tool for assessing the sufficiency of the provisions made and the capital to stress scenarios.
These exercises are carried out for all the Group’s relevant portfolios and are articulated as follows:
• Definition of reference scenarios (at both the global level as well as for each of the Group’s units).
• Determining the value of the risk parameters and metrics (probability of default, loss at default, etc) to different scenarios.
• Estimated expected loss associated with each one of the scenarios put forward and the other important credit risk metrics deriving from the parameters obtained (NPLs, provisions, ratios, etc.).
• Analysis of the evolution of the credit risk profile at the portfolio, segment, unit and Group levels in the face of different scenarios and compared to previous years.
The simulation models employed by the Group use data from a complete economic cycle in order to calibrate the performance of risk factors in the face of changes in macroeconomic variables. These models are submitted to backtesting processes and regular fine tuning in order to guarantee they reflect correctly the relationship between macroeconomic variables and risk parameters.
A series of controls and comparisons are run to ensure that the metrics and calculations are adequate, thus completing the process.
The projections of the risk and loss parameters, normally with a time frame of three years, are executed under various economic scenarios which include the main macroeconomic variables (GDP, unemployment rate, house prices, inflation, etc).
The economic scenarios defined are backed by different levels of stress, from the baseline scenario or the most probable one to stress scenarios which, although unlikely, are possible.
These scenarios are defined by Grupo Santander’s research department in coordination with the counterparts of each unit and using as a reference the figures published by the main international institutions.
A global stress scenario is defined describing a world crisis situation and the way it would affect each of the countries in which the Grupo Santander operates. In addition, a local stress scenario is defined which affects in an isolated way some of the main units and with a greater degree of stress than the global stress scenario.
The entire process takes place within a corporate governance framework, and is thus adapted to the growing importance of this framework and to best market practices, assisting the Group’s senior management in obtaining knowledge and decision making.
1. Study of risk and credit classification process
2. Planning (Commercial strategic plan - CSP)• Analysis of scenarios
3. Establishing limits/ pre-approved limits
4. Decision on operations• Mitigants
5. Monitoring6. Measurement and control7. Recovery management
• Impaired and restructured portfolio
CONTROL
Pre-sale Sale Post-sale
RISK CYCLE
D.1.5.3. Establishing limits / pre-approved limitsLimits are planned and established using documents agreed between the business and risk areas and approved by the executive risk committee or committees delegated by it, and in which the expected results of business, in terms of risk and return are set out, as well as the limits to which this activity is subject and management of the associated risks by group / customer.
At the same time, in the wholesale sphere and the rest of companies and institutions analysis is conducted at the client level. When certain circumstances concur, the client is assigned an individual limit (pre-approved limit).
In this way, a pre-classification model based on a system for measuring and monitoring economic capital is used for large corporate groups. The result of pre-classification is the maximum
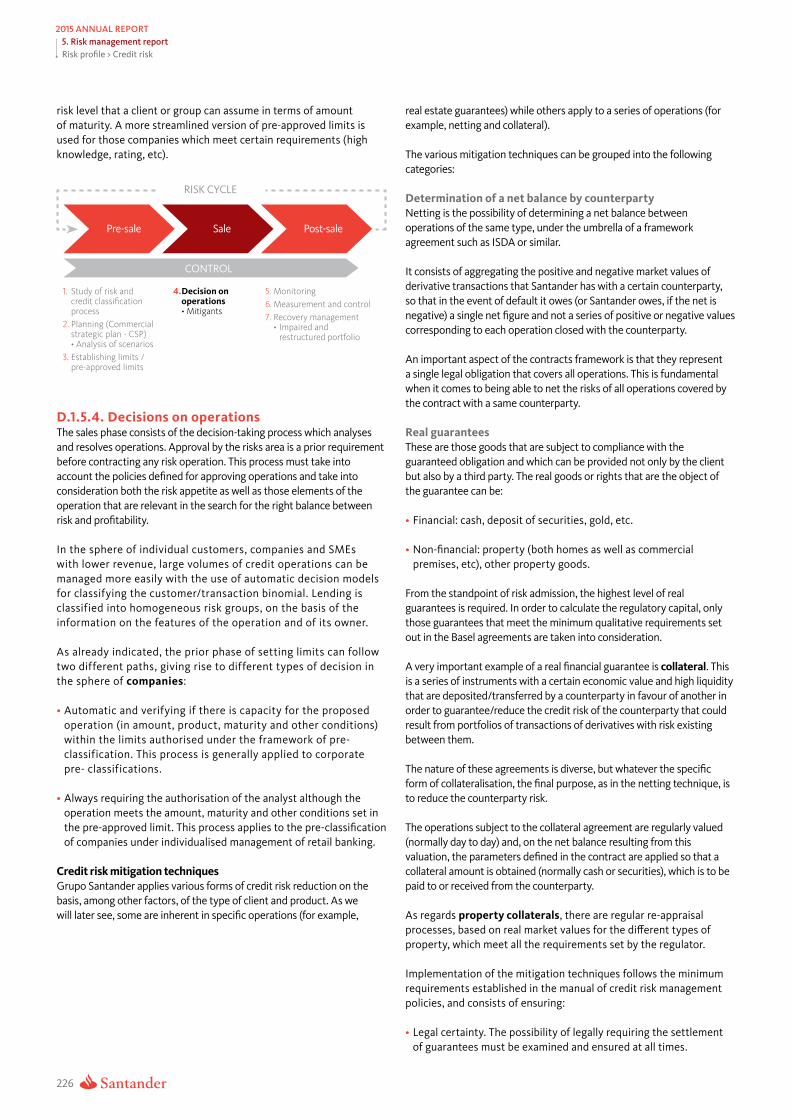
226
Risk profile > Credit risk5. Risk management report
2015 ANNUAL REPORT
risk level that a client or group can assume in terms of amount of maturity. A more streamlined version of pre-approved limits is used for those companies which meet certain requirements (high knowledge, rating, etc).
1. Study of risk and credit classification process
2. Planning (Commercial strategic plan - CSP)• Analysis of scenarios
3. Establishing limits / pre-approved limits
4. Decision on operations• Mitigants
5. Monitoring6. Measurement and control7. Recovery management
• Impaired and restructured portfolio
CONTROL
Pre-sale Sale Post-sale
RISK CYCLE
D.1.5.4. Decisions on operationsThe sales phase consists of the decision-taking process which analyses and resolves operations. Approval by the risks area is a prior requirement before contracting any risk operation. This process must take into account the policies defined for approving operations and take into consideration both the risk appetite as well as those elements of the operation that are relevant in the search for the right balance between risk and profitability.
In the sphere of individual customers, companies and SMEs with lower revenue, large volumes of credit operations can be managed more easily with the use of automatic decision models for classifying the customer/transaction binomial. Lending is classified into homogeneous risk groups, on the basis of the information on the features of the operation and of its owner.
As already indicated, the prior phase of setting limits can follow two different paths, giving rise to different types of decision in the sphere of companies:
• Automatic and verifying if there is capacity for the proposed operation (in amount, product, maturity and other conditions) within the limits authorised under the framework of pre- classification. This process is generally applied to corporate pre- classifications.
• Always requiring the authorisation of the analyst although the operation meets the amount, maturity and other conditions set in the pre-approved limit. This process applies to the pre-classification of companies under individualised management of retail banking.
Credit risk mitigation techniquesGrupo Santander applies various forms of credit risk reduction on the basis, among other factors, of the type of client and product. As we will later see, some are inherent in specific operations (for example,
real estate guarantees) while others apply to a series of operations (for example, netting and collateral).
The various mitigation techniques can be grouped into the following categories:
Determination of a net balance by counterpartyNetting is the possibility of determining a net balance between operations of the same type, under the umbrella of a framework agreement such as ISDA or similar.
It consists of aggregating the positive and negative market values of derivative transactions that Santander has with a certain counterparty, so that in the event of default it owes (or Santander owes, if the net is negative) a single net figure and not a series of positive or negative values corresponding to each operation closed with the counterparty.
An important aspect of the contracts framework is that they represent a single legal obligation that covers all operations. This is fundamental when it comes to being able to net the risks of all operations covered by the contract with a same counterparty.
Real guaranteesThese are those goods that are subject to compliance with the guaranteed obligation and which can be provided not only by the client but also by a third party. The real goods or rights that are the object of the guarantee can be:
• Financial: cash, deposit of securities, gold, etc.
• Non-financial: property (both homes as well as commercial premises, etc), other property goods.
From the standpoint of risk admission, the highest level of real guarantees is required. In order to calculate the regulatory capital, only those guarantees that meet the minimum qualitative requirements set out in the Basel agreements are taken into consideration.
A very important example of a real financial guarantee is collateral. This is a series of instruments with a certain economic value and high liquidity that are deposited/transferred by a counterparty in favour of another in order to guarantee/reduce the credit risk of the counterparty that could result from portfolios of transactions of derivatives with risk existing between them.
The nature of these agreements is diverse, but whatever the specific form of collateralisation, the final purpose, as in the netting technique, is to reduce the counterparty risk.
The operations subject to the collateral agreement are regularly valued (normally day to day) and, on the net balance resulting from this valuation, the parameters defined in the contract are applied so that a collateral amount is obtained (normally cash or securities), which is to be paid to or received from the counterparty.
As regards property collaterals, there are regular re-appraisal processes, based on real market values for the different types of property, which meet all the requirements set by the regulator.
Implementation of the mitigation techniques follows the minimum requirements established in the manual of credit risk management policies, and consists of ensuring:
• Legal certainty. The possibility of legally requiring the settlement of guarantees must be examined and ensured at all times.

227
Risk profile > Credit risk5. Risk management report
2015 ANNUAL REPORT
• The lack of substantial positive correlation between the counterparty and the value of the collateral.
• The correct documentation of all guarantees.
• The availability of documentation of the methodologies used for each mitigation technique.
• Adequate monitoring and regular control.
Personal guarantees and credit derivativesThis type of guarantees corresponds to those that place a third party in a position of having to respond to obligations acquired by another to the Group. It includes, for example, sureties, guarantees, stand-by letters of credit, etc. The only ones that can be recognised, for the purposes of calculating capital, are those provided by third parties that meet the minimum requirements set by the supervisor.
Credit derivatives are financial instruments whose main objective is to cover the credit risk by acquiring protection from a third party, through which the bank transfers the issuer risk of the underlying asset. Credit derivatives are over the counter (OTC) instruments that are traded in non-organised markets. The coverage with credit derivatives, mainly through credit default swaps, is contracted with front line banks.
The information on mitigation techniques is in ‘Credit risk reduction techniques of the Prudential Relevance Report (Pillar III)’. There is also more information on credit derivatives in the section ‘Activity in credit derivatives’ in section D.1.4.1. Credit risk by activity in financial markets of this Report.
1. Study of risk and credit classification process
2. Planning (Commercial strategic plan - CSP)• Analysis of scenarios
3. Establishing limits / pre-approved limits
4. Decision on operations• Mitigants
5. Monitoring6. Measurement and control7. Recovery management
• Impaired and restructured portfolio
CONTROL
Pre-sale Sale Post-sale
RISK CYCLE
D.1.5.5. Monitoring / AnticipationMonitoring is a continuous process of constant observation, which allows changes that could affect the credit quality of clients to be detected early on, in order to take measures to correct the deviations that impact negatively.
Monitoring is based on segmentation of customers, and is carried out by local and global risk dedicated teams, supplemented by internal audit. In the individuals model, this function is carried out through customer behaviour assessment models.
The function consists, among other things, of identifying and tracking clients under special monitoring, reviewing ratings and continuous monitoring of indicators of standardised clients.
The system called companies in special monitoring (FEVE) identifies four levels on the basis of the degree of concern arising from the circumstances observed (extinguish, secure, reduce, monitor). The inclusion of a company in FEVE does not mean there have been defaults, but rather the advisability of adopting a specific policy toward that company and establishing the person and time frame for it. Clients in FEVE are reviewed at least every six months, and every quarter for the most serious cases. A company can end up in special watch as a result of monitoring, a review conducted by internal audit, a decision of the person responsible for the company or the entry into functioning of the system established for automatic warnings.
Ratings are reviewed at least every year, but if weaknesses are detected, or on the basis of the rating, it is done more regularly.
As regards the risks of individual clients, businesses and SMEs with a low turnover, the main indicators are monitored in order to detect shifts in the performance of the loan portfolio with respect to the forecasts made in the credit management programmes.
1. Study of risk and credit classification process
2. Planning (Commercial strategic plan - CSP)• Analysis of scenarios
3. Establishing limits / pre-approved limits
4. Decision on operations• Mitigants
5. Monitoring6. Measurement
and control7. Recovery management
• Impaired and restructured portfolio
CONTROL
Pre-sale Sale Post-sale
RISK CYCLE
D.1.5.6. Measurement and controlAs well as monitoring clients’ credit quality, Grupo Santander establishes the control procedures needed to analyse the current credit risk profile and its evolution, through different credit risk phases.
The function is developed by assessing the risks from various perspectives that complement one another, establishing as the main elements control by countries, business areas, management models, products, etc, facilitating early detection of points of specific attention, as well as preparing action plans to correct any deteriorations.
Each element of control admits two types of analysis:
1. Quantitative and qualitative analysis of the portfolio Analysis of the portfolio controls, permanently and systematically, the evolution of risk with respect to budgets, limits and standards of reference, assessing the impacts of future situations, exogenous as well as those resulting from strategic decisions, in order to establish

228
Risk profile > Credit risk5. Risk management report
2015 ANNUAL REPORT
measures that put the profile and volume of the risks portfolio within the parameters set by the Group.
The credit risk control phase uses, among others and in addition to traditional metrics, the following metrics:
• CMN (Change in Managed NPLs plus net write-offs)
The CMN measures how NPLs change during a period, discounting write-offs and taking loan loss recoveries into account.
It is an aggregate measure at portfolio level that allows a response to deteriorations observed in the evolution of NPLs.
It is the result of the final balance less the initial balance of non- performing loans of the period under consideration, plus the write-offs in this period less loan loss recoveries in the same period.
The VMG and its components play a key role as variables of monitoring.
• Expected loss (EL) and capital
Expected loss is the estimate of the economic loss that would occur during the next year of the portfolio existing at a given moment.
It is one more cost of activity, and must impact on the price of operations. Its calculation is mainly based on three parameters:
• Exposure at Default (EaD): maximum amount that could be lost as a result of a default.
• Probability of Default (PD): the probability of a client’s default during the year.
• Loss Given Default (LGD): this reflects the percentage of exposure that could not be recovered in the event of a default. It is calculated by discounting at the time of the default the amounts recovered during the whole recovery process and this figure is then compared in percentage terms with the amount owed by the client at that moment.
Other relevant aspects regarding the risk of operations are covered, such as quantification of off-balance sheet exposures or the expected percentage of recoveries, related to the guarantees associated with the operation, as well as other issues such as the type of product, maturity, etc.
The risk parameters also enable economic and regulatory capital to be calculated. The integration in management of the metrics of capital is vital for rationalising its use. More detail is available in chapter D.8. Capital risk.
2.- Evaluation of the control processesEvaluation of the control processes includes systematic and regular revision of the procedures and methodology, developed throughout the credit risk cycle, in order to guarantees their effectiveness and validity.
In 2006, within the corporate framework established in the Group for compliance with the Sarbanes Oxley law, a corporate tool was established in the Group’s intranet to document and certificate
all the sub processes, operational risks and controls that mitigate them. The risks division assesses every year the efficiency of internal control of its activities.
1. Study of risk and credit classification process
2. Planning (Commercial strategic plan - CSP)• Analysis of scenarios
3. Establishing limits / pre-approved limits
4. Decision on operations• Mitigants
5. Monitoring6. Measurement and control7. Recovery management • Impaired and
restructured portfolio
CONTROL
Pre-sale Sale Post-sale
RISK CYCLE
D.1.5.7. Recovery managementRecovery activity is a significant element in the Bank’s risk management. This function is carried out by the recovery area, which defines a global strategy and an enterprise wide focus on recovery management.
The Group has a corporate management model which sets the guidelines and general lines of action to be applied in the various countries, always taking into account the local particularities that the recovery activity requires (economic environment, business model or a mixture of both). The recovery areas are business areas that directly manage clients; the corporate model thus has a business focus, whose creation of value on a sustained basis is based on effective and efficient collection management, whether by regularisation of balances pending payment or by total recovery.
The recovery management model requires adequate co-ordination of all the management areas (business of recoveries, commercial, technology and operations, human resources and risks). It is subject to constant review and continuous improvement in the processes and management methodology that sustain it, through applying the best practices developed in the various countries.
In order to conduct recovery management adequately, it is done in four phases: irregularity or early non-payment, recovery of non-performing loans, recovery of write-offs and management of foreclosed assets. Indeed, the recovery function begins before the first non-payment when the client shows signs of deterioration and ends when the debt has been paid or regularised. The function aims to anticipate non-compliance and is focused on Pre-saletive management.
The current macroeconomic environment directly impacts the non-payment index and customers’ bad loans. The quality of portfolios is thus fundamental for the development and growth of our businesses in different countries. Debt reimbursement and recovery functions are given a special and continuous focus, in order to ensure that this quality always remains within the expected levels.
The diverse features of our clients makes segmentation necessary in order to manage recoveries adequately. Massive management of large collectives of clients with similar profiles and products is conducted through processes with a high technological component, while personalised management focuses on customers that, because

229
Risk profile > Credit risk5. Risk management report
2015 ANNUAL REPORT
are given a special and continuous focus, in order to ensure that this quality always remains within the expected levels.
The diverse features of our clients makes segmentation necessary in order to manage recoveries adequately. Massive management of large collectives of clients with similar profiles and products is conducted through processes with a high technological component, while personalised management focuses on customers that, because of their profile, require a specific manager and more individualised management.
Recovery activity has been aligned with the socio-economic reality of various countries and different risk management mechanisms, with adequate criteria of prudence, have been used on the basis of their age, guarantees and conditions, always ensuring, as a minimum, the required classification and provisions.
Particular emphasis in the recovery function is placed on management of the aforementioned mechanisms for early management, in line with corporate policies, taking account of the various local realities and closely tracking vintages, stocks and performance. These policies are renewed and regularly adopted in order to reflect both the better management practices as well as the regulatory changes applied.
As well as measures focused on adapting operations to the client’s payment capacity, also noteworthy is recovery management seeking solutions other than judicial ones for advance payment of debts.
One of the ways to recover debt from clients, who have suffered a severe deterioration in their repayment capacity, is repossession (judicial or in lieu of payment) of the real estate assets that serve as guarantees of the loans. In countries with a high exposure to real estate risk, such as Spain, there are very efficient sales management instruments which enable the capital to be returned to the bank and reduce the stock in the balance sheet at a much faster speed than the rest of banks.

230
2015 ANNUAL REPORT
Risk profile > Trading market risk and structural risks5. Risk management report
D.2. Trading market risk and structural risks
Organisation of this section
We will first describe the activities subject to market risk, setting out the different types and risk factors.
Then we will look at each one of the market risks on the basis of the finality of the risk, distinguishing the risk of market trading and structural risks, and, within the latter, structural risks of the balance sheet and pension and actuarial risks.
The most relevant aspects to take into account such as the principal magnitudes and their evolution are set out for each type of risk, the methodologies and metrics employed in Santander and the limits used for their control.
D.2.1. Activities subject to market risk and types of market risk
The scope of activities subject to market risk includes transactions in which net worth risk is borne due to changes in market factors. Thus they include trading risks and also structural risks which are also affected by market shifts.
This risk comes from the change in risk factors—interest rates, inflation rates, exchange rates, share prices, the spread on loans, commodity prices and the volatility of each of these elements— as well as from the liquidity risk of the various products and markets in which the Group operates.
• Interest rate risk is the possibility that changes in interest rates could adversely affect the value of a financial instrument, a portfolio or the Group as a whole. It affects loans, deposits, debt securities, most assets and liabilities in the trading books and derivatives, among others.
• Inflation rate risk is the possibility that changes in inflation rates could adversely affect the value of a financial instrument, a portfolio or the Group as a whole. It affects instruments such as loans, debt securities and derivatives, whose return is linked to inflation or to an actual change in the rate.
• Exchange rate risk is the sensitivity of the value of a position in a currency different to the base currency to a potential movement in exchange rates. Hence, a long or open position in a foreign currency will produce a loss if that currency depreciates against the base currency. Among the positions affected by this

231
2015 ANNUAL REPORT
Risk profile > Trading market risk and structural risks5. Risk management report
risk are the Group’s investments in subsidiaries in non-euro currencies, as well as any foreign currency transactions.
• Equity risk is the sensitivity of the value of positions opened in equities to adverse movements in the market prices or in expectations of future dividends. Among other instruments, this affects positions in shares, stock market indices, convertible bonds and derivatives using shares as the underlying asset (put, call, and equity swaps).
• Credit spread risk is the risk or sensitivity of the value of positions opened in fixed income securities or in credit derivatives to movements in credit spread curves or in recovery rates associated with issuers and specific types of debt. Spread is the difference between financial instruments that quote with a margin over other benchmark instruments, mainly the IRR of Government bonds and interbank interest rates.
• Commodities price risk is the risk derived from the effect of potential changes in prices. The Group’s exposure to this risk is not significant and is concentrated in derivative operations on commodities with clients.
• Volatility risk is the risk or sensitivity of the value of a portfolio to changes in the volatility of risk factors: interest rates, exchange rates, shares, credit spreads and commodities. This risk is incurred by all financial instruments whose valuation model has volatility as a variable. The most significant case are financial options portfolios.
All these market risks can be partly or fully mitigated by using options, futures, forwards and swaps.
There are other types of market risk, whose coverage is more complex. They are as follows:
• Correlation risk. Correlation risk is the sensitivity of the portfolio to changes in the relationship between risk factors (correlation), either of the same type (for example, two exchange rates) or different types (for example, an interest rate and the price of a commodity).
• Market liquidity risk. Risk when a Group entity or the Group as a whole cannot reverse or close a position in time without having an impact on the market price or the cost of the transaction. Market liquidity risk can be caused by the reduction in the number of market makers or institutional investors, the execution of a large volume of transactions, or the instability of the markets. It increases as a result of the concentration of certain products and currencies.
• Prepayment or cancellation risk. When the contractual relationship in certain transactions explicitly or implicitly permits the possibility of early cancellation without negotiation before maturity, there is a risk that the cash flows may have to be reinvested at a potentially lower interest rate. It affects mainly mortgage loans or mortgage securities.
• Underwriting risk. This occurs as a result of an entity’s participation in underwriting a placement of securities or another type of debt, assuming the risk of partially owning the issue or the loan due to non-placement of all of it among potential buyers.
Pension and actuarial risks, which are described later on, also depend on shifts in market factors.
On the basis of the finality of the risk, activities are segmented in the following way:
a) Trading: financial services to customers and purchase-sale and positioning mainly in fixed-income, equity and currency products. The SGCB (Santander Global Corporate Banking) division is mainly responsible for managing it.
b) Structural risks: we distinguish between balance sheet risks and pension and actuarial risks:
b.1) Structural balance sheet risks: market risks inherent in the balance sheet excluding the trading portfolio. Management decisions on these risks are taken by the ALCO committees of each country in coordination with the Group’s ALCO committee and are executed by the financial management division. This management seeks to inject stability and recurrence into the financial margin of commercial activity and to the Group’s economic value, maintaining adequate levels of liquidity and solvency. The risks are:
• Structural interest rate risk: this arises from mismatches in the maturities and repricing of all assets and liabilities.
• Structural exchange rate risk/hedging: Exchange rate risk occurs when the currency in which the investment is made is different from the euro in companies that consolidate and those that do not (structural exchange rate). In addition, this item also includes positions of exchange rate hedging of future results generated in currencies other than the euro (hedging of results).
• Structural equity risk: this involves investments via stakes in financial or non-financial companies that are not consolidated, as well as portfolios available for sale formed by equity positions.
b.2) Pension and actuarial risk
• Pension risk: the risk assumed by the Bank in relation to the pension commitments with its employees. The risk lies in the possibility that the fund does not cover these commitments in the period of accrual of the provision and the profitability obtained by the portfolio is not sufficient and obliges the Group to increase the level of contributions.
• Actuarial risk: unexpected losses produced as a result of an increase in the commitments with the insurance takers, as well as losses from an unforeseen rise in costs.

232
Risk profile > Trading market risk and structural risks
2015 ANNUAL REPORT5. Risk management report
D.2.2. Trading market risk
D.2.2.1. Key figures and change over timeGrupo Santander’s trading risk profile remained relatively low in 2015, in line with previous years, due to the fact that traditionally the Group's activity has been focused on providing services to its customers, with limited exposure to complex structured products and diversification by geographic area and risk factor.
D.2.2.1.1. VaR analysis18
During the 2015 year, Grupo Santander maintained its strategy of concentrating its trading activity on customer business, minimising where possible exposures of directional risk opened in net terms. This was seen in the VaR evolution of the SGCB trading portfolio, which was around the average of the last three years and ended 2015 at EUR 13.6 million29.
MIN (8.2)
JAN
20
13
MA
R 2
013
MA
Y 20
13
JUL
2013
SEP
2013
NO
V 2
013
JAN
20
14
MA
R 2
014
MA
Y 20
14
JUL
2014
SEP
2014
NO
V 2
014
JAN
20
15
MA
R 2
015
MA
Y 20
15
JUL
2015
SEP
2015
NO
V 2
015
DEC
20
15
35
30
25
20
15
10
5
VaR 2013-2015: change over timeMillion euros. VaR at a 99% over a one day horizon.
— VaR— 15-day moving average — 3-year average VaR
MAX (31.0)
VaR during 2015 fluctuated between EUR 10.3 million and EUR 31 million. The most significant changes were related to changes in exchange rate and interest rate exposure and also market volatility.
The average VaR in 2015 was EUR 15.6 million, very similar to the two previous years (EUR 16.9 million in 2014 and EUR 17.4 million in 2013).
The following chart shows a frequency histogram of risk measured in terms of VaR between 2013 and 2015. The accumulation of days with levels of between EUR 9.5 and 23 million (96%) is shown. Values of higher than EUR 23 million (3.2%) largely occur in periods mainly affected by temporary spikes in volatility mainly in the Brazilian real against the dollar and also interest rates during the Greek bail-out period.
VaR risk histogramVaR at a 99% over a one day horizon. Number of days (%) in each range.
Num
ber o
f day
s (%
)
<9.5
0.8%
11
2.6%
12.5
10.0%
14
11.5%
15.5
16.3%
17
14.7%
18.5
12.5%
20
15.1%21
.5
8.4%
23
5.0%
> 23
3.2%
VaR in million euros
18. Value at Risk. The VaR definition and calculation methodology is in section D.2.2.2.1. Value at Risk (VaR)
19. Regarding trading activity in financial markets of SGCB (Santander Global Corporate Banking). As well as the trading activity of SGCB, there are other positions catalogued for accounting purposes. The total VaR of trading of this accounting perimeter was EUR 14.5 million.

233
Risk profile > Trading market risk and structural risks
2015 ANNUAL REPORT5. Risk management report
Risk per factor The following table displays the average and latest VaR values at 99% by risk factor over the last three years, and the lowest and highest values in 2015 and the Expected Shortfall (ES) at 97.5%20 at the close of 2015:
VaR statistics and Expected Shortfall by risk factor 21, 22 Million euros, VaR at 99% and ES at 97.5% with one day time horizon.
Total
2015 2014 2013
VaR (99%)ES
(97.5%)
Latest
VaR VaR
Minimum Average Maximum Latest Average Latest Average Latest
10.3 15.6 31.0 13.6 14.0 16.9 10.5 17.4 13.1
Diversification effect (5.0) (11.1) (21.3) (5.8) (5.7) (13.0) (9.3) (16.2) (12.3)
trad
ing
Interest rate 9.7 14.9 28.3 12.7 12.7 14.2 10.5 12.7 8.5
Equities 1.0 1.9 3.8 1.1 1.1 2.7 1.8 5.6 4.7
aTo
tl
Exchange rates 1.6 4.5 15.2 2.6 2.4 3.5 2.9 5.4 4.7
Credit spread 1.9 5.2 13.7 2.9 3.4 9.3 4.6 9.6 7.2
Commodities 0.0 0.2 0.6 0.1 0.1 0.3 0.1 0.3 0.3
Total 7.4 11.6 24.8 11.1 11.2 12.2 7.3 13.9 9.9
Diversification effect (1.1) (8.3) (17.2) (5.6) (5.8) (9.2) (5.5) (14.1) (9.0)
Euro
pe
Interest rate 6.1 10.6 25.1 10.9 10.7 8.9 6.2 9.3 6.6
Equities 0.8 1.4 2.9 1.0 1.0 1.7 1.0 4.3 2.6
Exchange rates 0.7 3.3 10.7 1.9 1.8 2.9 1.5 5.2 3.7
Credit spread 1.6 4.4 11.5 2.8 3.4 7.6 3.9 9.0 5.8
Commodities 0.0 0.2 0.6 0.1 0.1 0.3 0.1 0.3 0.3
Total 5.4 10.6 27.4 9.7 6.7 12.3 9.8 11.1 6.9
eric
a
Diversification effect (0.5) (4.8) (10.6) (4.4) (1.5) (3.5) (12.2) (5.3) (6.7)
n A
m Interest rate 5.7 10.7 27.2 9.3 6.4 11.8 9.8 9.6 5.9
Equities 0.5 1.5 3.2 0.5 0.6 2.1 3.0 3.2 2.9
Lati
Exchange rates 0.7 3.2 8.2 4.3 1.3 2.0 9.2 3.5 4.7
Total 0.3 0.9 2.0 0.9 0.8 0.7 0.7 0.8 0.5
d si
a
Diversification effect (0.1) (0.5) (1.4) (0.4) (0.3) (0.3) (0.2) (0.4) (0.2)
S n
AU
a
Interest rate 0.2 0.8 1.6 0.8 0.8 0.7 0.7 0.7 0.5
Equities 0.0 0.1 1.8 0.0 0.0 0,1 0.0 0.1 0.0
Exchange rates 0.2 0.4 1.1 0.4 0.3 0.3 0.2 0.4 0.2
Total 0.3 1.6 3.0 0.4 0.3 2.3 1.9 1.5 2.0
tivi
ties
Diversification effect 0.1 (0.6) (2.7) (0.2) (0.1) (0.6) (0.6) (0.3) (0.5)
al a
c Interest rate 0.0 0.5 3.0 0.1 0.0 0.6 0.4 0.3 0.4
Credit spread 0.3 1.6 2.8 0.4 0.0 2.2 1.9 1.5 2.1
Glo
b
Exchange rates 0.0 0.0 0.2 0.0 0.3 0.0 0.2 0.1 0.0
20. These types of measures are outlined in section D.2.2.2.2. Stressed VaR (sVaR) and Expected Shortfall (ES). Following the recommendation of the BCBS in its Fundamental review of the trading book: a revised market risk framework (October 2013), the confidence level of 97.5% means approximately a risk level similar to that which the VaR captures with a 99% confidence level.
21. The VaR of global activities includes operations that are not assigned to any particular country.
22. In Latin America, United States and Asia, the VaR levels of the credit spread and commodity factors are not shown separately because of their scant or zero materiality.

234
Risk profile > Trading market risk and structural risks
2015 ANNUAL REPORT5. Risk management report
At the end of 2015, VaR had increased by EUR 3 million against 2014, although average VaR was down by EUR 1.4 million. By risk factor, the average VaR increased in interest rates and in exchange rates, while it fell in equities and credit spread. By geographies, it slightly increased in the United States/Asia, while it was down in the other geographies.
The VaR evolution by risk factor in general was stable in the last few years. The transitory rises in VaR of various factors is explained more by transitory increases in the volatility of market prices than by significant changes in positions.
25
20
15
10
5
0
— VaR interest rate— VaR equities — VaR exchange rate
— VaR credit spread — VaR commodities
Jan
2013
Mar
20
13
May
20
13
Jul 2
013
Sep
2013
Nov
20
13
Jan
2014
Mar
20
14
May
20
14
Jul 2
014
Sep
2014
Nov
20
14
Jan
2015
Mar
20
15
May
20
15
Jul 2
015
Sep
2015
Nov
20
15
Dec
20
15
VaR by risk factor: change over timeMillion euros. VaR at a 99% with one day time horizon (15 day moving average).
Lastly, the table below compares the VaR figures with stressed VaR25 figures for trading activity of the two portfolios with highest average VaR in 2015.
Stressed VaR vs. VaR in 2015: main portfoliosMillion euros. Stresses VaR and VaR at 99% with one-day time horizon.
Min Average Max Latest
VaR (99%) 4.0 8.9 15.9 8.8Spain-G10
Stressed VaR (99%) 11.4 19.4 26.8 13.5
VaR (99%) 4.5 9.5 25.6 9.4Brazil
Stressed VaR (99%) 8.1 16.6 39.9 14.2
D.2.2.1.2. Gauging and backtesting measuresThe real losses can differ from the forecasts by the VaR for various reasons related to the limitations of this metric, which are set out in detail later in the section on the methodologies. The Group regularly analyses and contrasts the accuracy of the VaR calculation model in order to confirm its reliability.
The most important test consists of backtesting exercises, analysed at the local and global levels and in all cases with the same methodology. Backtesting consists of comparing the forecast VaR measurements, with a certain level of confidence and time frame, with the real results of losses obtained in a same time frame. This can detect anomalies in the VaR model of the portfolio in question to be detected (for example, shortcomings in the parameterisation of the valuation models of certain instruments, not very adequate proxies, etc).
Santander calculates and evaluates three types of backtesting:
• 'Clean' backtesting: the daily VaR is compared with the results obtained without taking into account the intraday results or the changes in the portfolio’s positions. This method contrasts the effectiveness of the individual models used to assess and measure the risks of the different positions.
• Backtesting on complete results: the daily VaR is compared with the day’s net results, including the results of the intraday operations and those generated by commissions.
• Backtesting on complete results without mark-ups or fees: the daily VaR is compared with the day’s net results from intraday operations but excluding those generated by mark-ups and commissions. This method aims to give an idea of the intraday risk assumed by the Group’s treasuries.
For the first case and for the total portfolio, there were four exceptions of Value at Earnings (VaE)24 at 99% in 2015 (days on which daily profit was higher than VaE) on 15 January, 23 January, 19 May and 3 December. These were primarily caused by strong shifts in the euro’s exchange rates against the Swiss franc and the pound, and of the euro and dollar against the Brazilian real. The high VaE levels at the end of the year were due to the depreciation of the Argentinian peso after exchange restrictions in the country were lifted.
There was also an exception of VaR at 99% (days on which the daily loss was higher than the VaR) on 24 September, caused mainly, as in the above cases, by high volatility in exchange rates, in this case of the euro and dollar against the Brazilian real.
The number of exceptions responded to the expected performance of the VaR calculation model, which works with a confidence level of 99% and an analysis period of one year (over a longer period of time, an average of two or three exceptions a year is expected).
23. Described in section D.2.2.2.2. Stressed VaR (sVaR) and Expected Shortfall (ES).
24. The VaE definition and calculation methodology is in section D.2.2.2.1. Value at Risk (VaR).

235
Risk profile > Trading market risk and structural risks
2015 ANNUAL REPORT5. Risk management report
2 Ja
n 20
13
19 F
eb 2
013
8 A
pr 2
013
26 M
ay 2
013
13 Ju
l 20
13
30 A
ug 2
013
17 O
ct 2
013
4 D
ec 2
013
21 Ja
n 20
14
10 M
ar 2
014
27 A
pr 2
014
14 Ju
n 20
14
1 aU
G 2
014
18 S
ep 2
014
5 N
ov 2
014
23 D
ec 2
014
9 Fe
b 20
15
29 M
ar 2
015
19 M
ay 2
015
3 Ju
l 20
15
20 A
ug 2
015
7 O
ct 2
015
24 N
ov 2
015
31 D
ec 2
015
60
45
30
15
0
-15
-30
-45
Backtesting of trading portfolios: daily results vs. previous day’s VaR Million euros
— Clean P&L
— VaE 99%
— VaE 95%
— VaR 99%
— VaR 95%
D.2.2.1.3. Distribution of risks and management results25
Geographic distributionIn trading activity, the average contribution of Latin America to the Group’s total VaR in 2015 was 45.1% compared with a contribution of 39.7% in economic results. Europe, with 53.6% of global risk, contributed 54% of results. In relation to prior years, there was a gradual homogenisation in the profile of activity in the Group’s different units, focused generally on providing service to professional and institutional clients.
Below is the geographic contribution (by percentage) to the Group total, both in risks, measured in VaR terms, as well as in results, measured in economic terms.
70%
60%
50%
40%
30%
20%
10%
0%
Binomial VaR - Management results: Geographic distributionAverage VaR (at 99% with a 1 day time horizon) and Annual cumulative management P&L (EUR mn), % of annual totals.
Latin America
Ann
ual
man
agem
ent
P&L
Ann
ual
man
agem
ent
P&L
Ann
ual
man
agem
ent
P&L
Ann
ual
man
agem
ent
P&L
Ave
rage
an
nual
VaR
Ave
rage
an
nual
VaR
Ave
rage
an
nual
VaR
Ave
rage
an
nual
VaR
2013
2013
2013
2013
2013
2013
2013
2013
2014
2014
2014
2014
2014
2014
2014
2014
2015
2015
2015
2015
2015
2015
2015
2015
Europe US and Asia Global Activities
Annual management P&L
2013 2014 2015
Average annual VaR
2013 2014 2015
25. Results in terms similar to Gross Margin (excluding operating costs, the financial would be the only cost).

236
Risk profile > Trading market risk and structural risks
2015 ANNUAL REPORT5. Risk management report
Distribution of risk by timeThe following chart shows the risk assumption profile, in terms of VaR, compared to results in 2015. The average VaR remained relatively stable, albeit with higher values in the second quarter, while results evolved in a more regular way during the first half of the year, and were lower in the second half.
January February March April May June July August September October November December
15%
10%
5%
0%
Temporary distribution of risks and P/L in 2015: percentages of annual totalsVaR (at 99% with a 1 day time horizon) and annual cumulative management P&L (EUR mn), % of annual totals.
Monthly management P&L Monthly average VaR
The following frequency histogram shows the distribution of daily economic results on the basis of their size between 2013 and 2015. It shows that on over 97.4% of days on which the markets were open daily returns28 were in a range of between -EUR 15 and +15 million.
2.4
16.2
27.9
9.2
5.0
1.0 1.0
36.7
<-20
.0
-15.
0
-10
.0
-5.0
0.0 5.0
10.0
15.0
20.0
> 20
.0
Num
ber o
f day
s (%
)
Daily (MtM) management P&L frequency histogram Daily management P&L ‘clean’ of fees and intraday operations (EUR mn). Number of days (%) in each range.
0.1 0.4
26. Yields ‘clean’ of fees and results of intraday derivative operations.

237
Risk profile > Trading market risk and structural risks
2015 ANNUAL REPORT5. Risk management report
D.2.2.1.4. Risk management of derivativesDerivatives activity is mainly focused on marketing investment products and hedging risks for clients. Management is focused on ensuring that the net risk opened is the lowest possible.
These transactions include options on equities, fixed-income and exchange rates. The units where this activity mainly takes place are: Spain, Santander UK, and, to a lesser extent, Brazil and Mexico.
The chart below shows the VaR Vega27 performance of structured derivatives business over the last three years. It fluctuated at around an average of EUR 6 million. In general, the periods with higher
VaR levels related to episodes of significant rises in volatility in the markets. The evolution of VaR Vega in the second quarter of 2013 was the result of the increased volatility of euro and US dollar interest rate curves, coinciding with a strategy of hedging client operations of significant amounts.
Although in 2015, VaR Vega was similar to the previous year in the first quarter of the year, in the two next quarters it was affected by high market volatility due to events such as Greece’s bail-out, high stock market volatility in China or Brazil’s currency depreciation and rating downgrade, as well as the BRL’s strong depreciation against the euro and the dollar.
24
22
20
18
16
14
12
10
8
6
4
2
— VaR Vega— 15-day moving average
Change in risk over time (VaR) of the derivatives businessMillion euros. VaR vega at a 99% over a one day horizon.
Jan
2013
Mar
20
13
May
20
13
Jul 2
013
Sep
2013
Nov
20
13
Jan
2014
Mar
20
14
May
20
14
Jul 2
014
Sep
2014
Nov
20
14
Jan
2015
Mar
20
15
May
20
15
Jul 2
015
Sep
2015
Nov
20
15
Dec
20
15As regards the VaR by risk factor, on average, the exposure was concentrated, in this order, in interest rates, equities, exchange rates and commodities. This is shown in the table below:
Financial derivatives. Risk (VaR) by risk factorMillion euros. VaR at a 99% over a one day horizon.
2015 2014 2013
Minimum Average Maximum Latest Average Latest Average Latest
Total VaR Vega 2.6 6.8 12.8 7.0 3.3 2.7 8.0 4.5
Diversification effect (0.0) (2.3) (3.9) (1.7) (2.1) (2.6) (3.8) (2.7)
VaR Interest rate 1.7 6.5 12.6 7.3 2.4 1.7 6.6 4.1
VaR equities 0.7 1.5 2.4 0.8 1.8 2.0 3.4 1.8
VaR exchange rate 0.4 1.1 2.1 0.6 1.2 1.6 1.7 1.3
VaR commodities 0.0 0.1 0.4 0.0 0.0 0.1 0.1 0.1
27. Vega, a Greek term, means here the sensitivity of the value of a portfolio to changes in the price of market volatility.

238
Risk profile > Trading market risk and structural risks
2015 ANNUAL REPORT5. Risk management report
Exposure by business unit was concentrated in Spain, Santander UK, Mexico and Brazil (in that order).
Financial derivatives. Risk (VaR) by unitMillion euros. VaR at a 99% over a one day horizon.
2015 2014 2013
Minimum Average Maximum Latest Average Latest Average Latest
Total VaR Vega 2.6 6.8 12.8 7.0 3.3 2.7 8.0 4.5
Spain 1.3 6.6 12.6 6.9 2.4 1.5 7.0 3.8
Santander UK 0.6 0.9 1.3 0.9 1.4 0.9 2.2 1.6
Brazil 0.3 0.7 1.5 0.4 0.8 0.7 1.2 0.9
Mexico 0.2 0.8 1.8 0.3 0.9 1.3 1.2 1.2
The average risk in 2015 (EUR 6.8 million) is slightly lower compared to 2013 and higher than in 2014, for the reasons explained above.
Grupo Santander continues to have a very limited exposure to instruments or complex structured vehicles, reflecting a management culture one of whose hallmarks is prudence in risk management. At the end of 2015, the Group had:
• Hedge funds: the total exposure is not significant (EUR 219.8 million at close of December 2015) and most of it is indirect, largely acting as counterparty in derivatives transactions, and also in financing transactions for those funds. This exposure has low loan-to-value levels of around 16.7% (collateral of EUR 1,225.1 million at the close of December). The risk with this type of counterparty is analysed case by case, establishing percentages of collateralisation on the basis of the features and assets of each fund.
• Monolines: Santander’s exposure to bond insurance companies (monolines) was, EUR 137.9 million as of December 2015 , mainly indirect exposure, EUR 136.1 million28 by virtue of the guarantee provided by this type of entity to various financing or traditional securitisation operations. The exposure in this case is to double default, with the primary underlying assets are of high credit quality. The small remaining amount is direct exposure (for example, via purchase of protection from the risk of non- payment by any of these insurance companies through a credit default swap). Exposure was virtually unchanged vs. 2014.
In short, the exposure to this type of instrument, as the result of the Group’s usual operations, continued to decline in 2015. This was mainly due to the integration of positions of institutions acquired by the Group, as Sovereign in 2009. All these positions were known at the time of purchase, having been duly provisioned. These positions, since their integration in the Group, have been notably reduced, with the ultimate goal of eliminating them from the balance sheet.
Santander’s policy for approving new transactions related to these products remains very prudent and conservative. It is subject to strict supervision by the Group’s senior management. Before approving a new transaction, product or underlying asset, the risks division verifies:
• The existence of an appropriate valuation model to monitor the value of each exposure: Mark-to-Market, Mark-to-Model or Mark-to-Liquidity.
• The availability in the market of observable data (inputs) needed to be able to apply this valuation model.
And provided these two points are always met:
• The availability of appropriate systems, duly adapted to calculate and monitor every day the results, positions and risks of new operations.
• The degree of liquidity of the product or underlying asset, in order to make possible their coverage when deemed appropriate.
D.2.2.1.5. Issuer risk in trading portfoliosTrading activity in credit risk is mainly conducted in the Treasury Units in Spain. It is done by taking positions in bonds and credit default swaps (CDS) at different maturities on corporate and financial references, as well as indexes (Itraxx, CDX).
The accompanying table shows the major positions at year-end in Spain, distinguishing between long (purchases of bonds and sales of CDS protection) and short (sales of bonds and purchases of CDS protection) positions.
28. Collateral provided by monoline in bonds issued by US states (Municipal Bonds), which amounted to EUR 19.1 million at December 2015, are not considered to be exposure.

239
Risk profile > Trading market risk and structural risks
2015 ANNUAL REPORT5. Risk management report
Million euros. Data at 31 December 2015
Largest ‘long’ positions (sale of protection)
Largest ‘short’ positions (purchase of protection)
Exposure at default (EAD) % total EAD
Exposure at default (EAD) % total EAD
1st reference 131 5.09% (32) 4.30%
2nd reference 124 4.82% (25) 3.36%
3rd reference 59 2.29% (23) 3.09%
4th reference 56 2.10% (23) 3.09%
5th reference 51 1.98% (20) 2.68%
Sub-total top 5 419 16.29% (124) 16.64%
Total 2.572 100.00% (745) 100.00%
Note: zero recoveries are supposed (LCR=0) in the EaD calculation
D.2.2.1.6. Analysis of scenariosVarious stress scenarios were calculated and analysed regularly in 2015 (at least monthly) at the local and global levels for all the trading portfolios and using the same risk factor assumptions.
Maximum volatility scenario (worst case)This scenario is given particular attention as it combines historic movements of risk factors with an ad-hoc analysis in order to reject very unlikely combinations of variations (for example, sharp falls in stock markets together with a decline in volatility). A historic volatility equivalent to six standard deviations is
applied. The scenario is defined by taking for each risk factor the movement which represents the greatest potential loss in the portfolio, rejecting the most unlikely combinations in economic-financial terms. At year-end, that scenario implied, for the global portfolio, rising interest rates in Latin American markets and low interest rates in core markets, falls in stock markets, depreciation of all currencies against the euro, and widening credit spreads and volatility. The results for this scenario at 31 December 2015 are shown in the following table.
Stress scenario: Maximum volatility (worst case) Million euros. Data at 31 December 2015
Interest rates Equities Exchange rates Credit spread Commodities Total
Total Trading (130.1) (3.3) (10.4) (20.2) (0.1) (164.2)
Europe (119.7) (1.5) (0.3) (19.8) (0.1) (141.4)
Latin America (10.2) (1.8) (10.1) 0.0 0.0 (22.1)
US 0.0 0.0 0.0 0.0 0.0 0.0
Global Activities (0.3) 0.0 0.0 (0.4) 0.0 (0.7)
Asia 0.0 0.0 0.0 0.0 0.0 0.0
The stress test shows that the economic loss suffered by the Group in its trading portfolios, in terms of the mark to market (MtM) result, would be, if the stress movements defined in the scenario materialised in the market, EUR 164.2 million. This loss would be concentrated in Europe (in the following order: interest rates, credit spread and equities) and Latin America (in the following order: interest rates, exchange rates and equities).
Other global stress scenariosAbrupt crisis: an ad hoc scenario with sharp market movements. Rise in interest rate curves, sharp falls in stock markets, large appreciation of the dollar against other currencies, rise in volatility and in credit spreads.
11 September crisis: historic scenario of the 11 September 2001 attacks with a significant impact on the US and global markets. This is sub-divided into two scenarios: I) maximum accumulated loss until the worst moment of the crisis; and II) the maximum loss in a day. In both cases, there are drops in stock markets and in interest rates in core markets and rises in emerging markets, and the dollar appreciates against other currencies.
‘Subprime’ crisis: historic scenario of the US mortgage crisis. The objective of the analysis is to capture the impact on results of the reduction in liquidity in the markets. Two time horizons were used (one day and 10 days), in both cases there are falls in stock markets and in interest rates in core markets and rises in emerging markets, and the dollar appreciates against other currencies.

240
Risk profile > Trading market risk and structural risks
2015 ANNUAL REPORT5. Risk management report
EBA adverse scenario: the scenario proposed by the European Banking Authority (EBA) in April 2014 as part of the EBA 2014 EU-Wide Stress Test. This involves an adverse scenario for European banks over a time horizon from 2014 to 2016. The scenario reflects the systemic risks considered the most serious threats to the stability of the European Union’s banking sector. These include: an increase in bond yields worldwide; incremental deterioration of credit quality in countries with weak demand; political reforms grinding to a halt, endangering the sustainability of public finances; and insufficient adjustments to balance sheets to maintain reasonable market finance.
This latter scenario replaced the sovereign debt crisis scenario in November 2014. This historic scenario identified four geographic zones (the US, Europe, Latin America and Asia) and included interest rate rises, falls in stock markets and volatilities, widening credit spreads, and depreciation of the euro and Latin American currencies, and appreciation of Asian currencies, against the dollar.
Every month a consolidated stress test report is drawn up with explanations of the main changes in results for the various scenarios and units. An early warning mechanism has also been established so that when the loss for a scenario is high in historic terms and/or in terms of the capital consumed by the portfolio in question, the relevant business executive is informed.
The results of these global scenarios for the last three years are shown in the following table:
2013 2014 2015200
100
0
-100
-200
-300
-400
-500
-600
Worst case
Abrupt crisis
Historic 11S I
Historic 11S II
Crisis 0708 1d
Crisis 07 08 10d
EBA Adverse
Stress test results. Comparison of the 2013-2015 scenarios (annual averages)Million euros

241
Risk profile > Trading market risk and structural risks
2015 ANNUAL REPORT5. Risk management report
D.2.2.1.7. Linkage with balance sheet items. Other alternative risk measuresBelow are the balance sheet items in the Group’s consolidated position that are subject to market risk, distinguishing the positions whose main risk metric is VaR from those where monitoring is carried out with other metrics. The items subject to market trading risk are highlighted.
Relation of risk metrics with balances in group’s consolidated position Million euros. Data at 31 December 2015.
Balance sheet
amount
Main market risk metric
Main risk factor for ‘Other’ balanceVaR Other
Assets subject to market risk 1,340,260 198,357 1,141,903 Cash and deposits at central banks 81,329 - 81,329 Interest rateTrading portfolio 147,287 146,102 1,185 Interest rate, credit spreadOther financial assets at fair value 45,043 44,528 515 Interest rate, credit spreadAvailable-for-sale financial assets 122,036 - 122,036 Interest rate, equitiesInvestments 3,251 - 3,251 EquitiesHedging derivatives 7,727 7,727 - Interest rate, exchange rateLoans 835,992 - 835,992 Interest rateOther financial assets1 35,469 - 35,469 Interest rateOther non-financial assets2 62,126 - 62,126 Liabilities subject to market risk 1,340,260 168,582 1,171,678 Trading portfolio 105,218 104,888 330 Interest rate, credit spreadOther financial liabilities at fair value 54,768 54,757 11 Interest rate, credit spreadHedging derivatives 8,937 8,937 - Interest rate, exchange rateFinancial liabilities at amortised cost3 1,039,517 - 1,039,517 Interest rateProvisions 14,494 - 14,494 Interest rateOther financial liabilities 8,352 - 8,352 Interest rateEquity 98,753 - 98,753 Other non-financial liabilities 10,221 - 10,221
1. Includes adjustments to macro hedging, non-current assets held for sale, reinsurance assets, and insurance contracts linked to pensions and fiscal assets.
2. Includes intangible assets, material assets and other assets.
3. Macro-hedging adjustment.
For activity managed with metrics other than VaR, alternative measures are used, mainly: sensitivity to different risk factors (interest rate, credit spread, etc).
In the case of the trading portfolio, the securitisations and 'level III' exposures (those in which non-observable market data constitutes a significant input in the corresponding internal valuation models) are excluded from the VaR measurement.
Securitisations are mainly treated as if they were part of the credit risk portfolio (in terms of default, recovery rate, etc). For 'level III' exposures, which are not very significant in Grupo Santander (basically derivatives linked to the home price index —HPI— in market activity in Santander UK, and interest rate and correlation derivatives for share prices in the parent bank’s market activity), as well as in general for inputs that cannot be observed in the market (correlation, dividends, etc), a very conservative policy is followed: this is reflected in valuation adjustments as well as sensitivity.
D.2.2.2. Methodologies
D.2.2.2.1. Value at Risk (VaR)The standard methodology that Grupo Santander applies to trading activities is Value at Risk (VaR), which measures the maximum expected loss with a certain confidence level and time frame. The standard for historic simulation is a confidence level of 99% and a time frame of one day. Statistical adjustments are applied enabling the most recent developments affecting the levels of risk assumed to be incorporated efficiently and quickly. A time frame of two years or at least 520 days from the reference date of the VaR calculation is used. Two figures are calculated every day: one applying an exponential decay factor that accords less weight to the observations furthest away in time and another with the same weight for all observations. The higher of the two is reported as the VaR.
Value at Earnings (VaE) is also calculated. This measures the maximum potential gain with a certain level of confidence and time frame, applying the same methodology as for VaR.

242
Risk profile > Trading market risk and structural risks
2015 ANNUAL REPORT5. Risk management report
VaR by historic simulation has many advantages as a risk metric (it sums up in a single number the market risk of a portfolio; it is based on market movements that really occurred without the need to make assumptions of functions forms or correlations between market factors, etc), but also has limitations.
Some limitations are intrinsic to the VaR metrics, regardless of the methodology used in their calculation, including:
• The VaR calculation is calibrated at a certain level of confidence, which does not indicate the levels of possible losses beyond it.
• There are some products in the portfolio with a liquidity horizon greater than that specified in the VaR model.
• VaR is a static analysis of the risk of the portfolio, and the situation could change significantly during the following day, although the likelihood of this occurring is very low.
Using the historic simulation methodology also has its limitations:
• High sensitivity to the historic window used.
• Inability to capture plausible events that would have significant impact, if these do not occur in the historic window used.
• The existence of valuation parameters with no market input (such as correlations, dividend and recovery rate).
• Slow adjustment to new volatilities and correlations, if the most recent data receives the same weight as the oldest data.
Some of these limitations are overcome by using Stressed VaR and Expected Shortfall, calculating VaR with exponential decay and applying conservative valuation adjustments. Furthermore, as previously stated, the Group regularly conducts analysis and backtesting of the accuracy of the VaR calculation model.
D.2.2.2.2. Stressed VaR (sVaR) and Expected Shortfall (ES)In addition to standard VaR, Stressed VaR is calculated daily for the main portfolios. The calculation methodology is the same as for VaR, with the two following exceptions:
• The historical observation period for the factors: when calculating Stressed VaR a window of 260 observations is used, rather than 520 for VaR. However, this is not the most recent data: rather, the data used is from a continuous period of stress for the portfolio in question. This is determined for each major portfolio by analysing the history of a subset of market risk factors selected based on expert judgement and the most significant positions in the books.
• Unlike VaR, Stressed VaR is obtained using the percentile with uniform weighting, not the higher of the percentiles with exponential and uniform weightings.
Moreover, the Expected Shortfall (ES) is also calculated, estimating the expected value of the potential loss when this is higher than that returned by VaR. Unlike VaR, ES has the advantages of capturing the risk of large losses with low probability (tail risk) and being a subadditive metric29. Going forward, in the near term the Basel Committee has recommended replacing VaR with Expected Shortfall as the baseline metric for calculating regulatory capital for trading portfolios30. The Committee considers that ES with a 97.5% confidence interval delivers a similar level of risk to VaR at a 99% confidence interval. Equal weights are applied to all observations when calculating ES.
D.2.2.2.3. Analysis of scenariosThe Group uses other metrics in addition to VaR, giving it greater control over the risks it faces in the markets where it is active. These measures include scenario analysis. This consists of defining alternative behaviours for various financial variables and obtaining the impact on results of applying these to activities. These scenarios may replicate events that occurred in the past (such as a crisis) or determine plausible alternatives that are unrelated to past events.
The potential impact on earnings of applying different stress scenarios is regularly calculated and analysed, particularly for trading portfolios, considering the same risk factor assumptions. Three scenarios are defined, as a minimum: plausible, severe and extreme. Taken together with VaR, these reveal a much more complete spectrum of the risk profile.
A number of trigger thresholds have also been established for global scenarios, based on their historical results and the capital associated with the portfolio in question. When these triggers are activated, the portfolio managers are notified so they can take appropriate action. The results of the global stress exercises, and any breaches of the trigger thresholds, are reviewed regularly, and reported to senior management, when this is considered appropriate.
D.2.2.2.4. Analysis of positions, sensitivities and resultsPositions are used to quantify the net volume of the market securities for the transactions in the portfolio, grouped by main risk factor, considering the delta value of any futures or options. All risk positions can be expressed in the base currency of the unit and the currency used for standardising information. Changes in positions are monitored on a daily basis to detect any incidents, so they can be corrected immediately.
Measurements of market risk sensitivity estimate the variation (sensitivity) of the market value of an instrument or portfolio to any change in a risk factor. The sensitivity of the value of an instrument to changes in market factors can be obtained using
29. According to the financial literature, subaddivity is a desirable property for a coherent risk metric. This property establishes that f(a+b) is less than or equal to f(a)+f(b). Intuitively, it assumes that the more instruments and risk factors there are in a portfolio, the lower the risks, because of the benefits of diversification. Whilst VaR only offers this property for some distributions, ES always does so.Fundamental review of the trading book: a revised market risk framework (Basel Committee consultation document on banking supervision, October 2013).
30. Fundamental review of the trading book: a revised market risk framework (Consultative document of the Basel Committee on banking supervision, October 2013).

243
Risk profile > Trading market risk and structural risks
2015 ANNUAL REPORT5. Risk management report
analytical approximations by partial derivatives or by complete revaluation of the portfolio.
In addition, the statement of income is also drawn up every day, providing an excellent indicator of risk, enabling us to identify the impact of changes in financial variables on the portfolios.
D.2.2.2.5. Derivatives activities and credit managementAlso noteworthy is the control of derivative activities and credit management which, because of its atypical nature, is conducted daily with specific measures. First, the sensitivities to price movements of the underlying asset (delta and gamma), volatility (vega) and time (theta) are controlled. Second, measures such as the sensitivity to the spread, jump-to-default, concentrations of positions by level of rating, etc, are reviewed systematically.
With regard to the credit risk inherent to trading portfolios, and in line with the recommendations of the Basel Committee on Banking Supervision and prevailing regulations, a further metric is also calculated: the Incremental Risk Charge (IRC). This seeks to cover the risks of non-compliance and ratings migration that are not adequately captured in VaR, through changes in the corresponding credit spreads. This metric is basically applied to fixed-income bonds, both public and private, derivatives on bonds (forwards, options, etc.) and credit derivatives (credit default swaps, asset backed securities, etc.). IRC is calculated using direct measurements of loss distribution tails at an appropriate percentile (99.9%), over a one year horizon. The Monte Carlo methodology is used, applying one million simulations.
D.2.2.2.6. Credit Valuation Adjustment (CVA) and Debt Valuation Adjustment (DVA)Grupo Santander incorporates credit valuation adjustment (CVA) and debt valuation adjustment (DVA) when calculating the results of trading portfolios. The CVA is a valuation adjustment of over the-counter (OTC) derivatives, as a result of the risk associated with the credit exposure assumed by each counterparty.
The CVA is calculated by taking into account the potential exposure with each counterparty in each future maturity. The CVA for a particular counterparty is therefore the sum of the CVAs over all such future terms. The following inputs are used:
• Expected exposure: including, for each operation the current market value (MtM) as well as the potential future risk (add-on) to each maturity. CVA also considers mitigating factors such as collateral and netting agreements, together with a decay factor for derivatives with interim payments.
• Severity: the percentage of final loss assumed in case of credit/ non-payment of the counterparty.
• Probability of default: for cases in which there is no market information (spread curve traded through CDS, etc.), general proxies generated on the basis of companies with listed CDS of the same sector and external rating as the counterparty are used.
• Discount factor curve.
The Debt Valuation Adjustment (DVA) is a valuation adjustment similar to the CVA, but in this case as a result of Grupo Santander’s risk that counterparties assume in OTC derivatives.
D.2.2.3. System for controlling limitsSetting market risk and liquidity limits is designed as a dynamic process which responds to the Group’s risk appetite level (described in section B.3.1. Risk appetite and structure of limits). This process is part of an annual limits plan drawn up by the Group’s senior management, involving every Group entity.
The market risk limits used in Grupo Santander are established based on different metrics and try to cover all activity subject to market risk from many perspectives, applying a conservative approach. The main ones are:
• VaR limits.
• Limits of equivalent and/or nominal positions.
• Interest rate sensitivity limits
• Vega limits.
• Delivery risk limits for short positions in securities (fixed income and securities).
• Limits to constrain the volume of effective losses, and protect results generated during the period:
• Loss trigger.
• Stop loss.
• Credit limits:
• Total exposure limit.
• Jump to default by issuer limit.
• Others.
• Limits for origination transactions.
These general limits are complemented by other sub-limits to establish a sufficiently granular limits framework for effective control of the market risk factors to which the Group is exposed in its trading activities. Positions are monitored on a daily basis, at both the unit and global levels, with exhaustive control of changes to portfolios, so as to identify any incidents that might need immediate correction. Meanwhile, the daily drawing up of the income statement by the risks area is an excellent indicator of risks, as it allows the impact that changes in financial variables have had on portfolios to be identified.

244
Risk profile > Trading market risk and structural risks
2015 ANNUAL REPORT5. Risk management report
Implementation of the Volcker Rule throughout the Group in July 2015 required activities to be reorganised to ensure compliance with this new regulation, the preparation of new metrics and the definition of limits at the desk level.
Three categories of limits were established based on the scope of approval and control: global approval and control limits, global approval limits with local control, and local approval and control limits. The limits are requested by the business executive of each country/entity, considering the particular nature of the business and so as to achieve the budget established, seeking consistency between the limits and the risk/return ratio. The limits are approved by the corresponding risk bodies.
Business units must comply with the approved limits at all times. In the event of a limit being exceeded, the local business executives have to explain, in writing and on the day, the reasons for the excess and the action plan to correct the situation, which in general might consist of reducing the position until it reaches the prevailing limits or setting out the strategy that justifies an increase in the limits.
If the business unit fails to respond to the excess within three days, the global business executives will be asked to set out the measures to be taken in order to make the adjustment to the existing limits. If this situation lasts for 10 days as of the first excess, senior risk management will be informed so that a decision can be taken: the risk takers could be made to reduce the levels of risk assumed.
D.2.3. Structural balance sheet risks31
D.2.3.1. Main figures and trendsThe market risk profile inherent in Grupo Santander’s balance sheet, in relation to its asset volumes and shareholders’ funds, as well as the budgeted financial margin, remained moderate in 2015, in line with previous years.
D.2.3.1.1. Structural interest rate riskEurope and the United StatesAgainst a backdrop of low interest rates, the main balance sheets in mature markets - the parent bank, the UK and the US - show positive economic value and net interest income sensitivities to interest rate rises.
Exposure levels in all countries are moderate in relation to the annual budget and equity levels.
At December 2015 , net interest income risk at one year, measured as sensitivity to parallel changes of ±100 basis points, was concentrated in the yield curve for the euro, at EUR 257 million, the Polish zloty, at EUR 83 million, and the US dollar, at EUR 78 million, all relating to risks of rate cuts.
Net interest income (NII) sensitivity32
% of total
Poland18.7%
US17.8%
United Kingdom4.5%
Other4.4%
Parent bank54.6%
Other: Portugal and SCF.
At the same date, the most relevant risk to the economic value of equity, measured as its sensitivity to parallel changes in the yield curve of ±100 basis points was in the euro interest rate curve, at EUR 3,897 million, for the risk of rate cuts. The amounts at risk for the dollar and sterling curves were EUR 691 million and EUR 488 million, respectively, also for rate cuts. These scenarios are extremely unlikely in practice at present.
Economic value of equity (EVE) sensitivity33
% of total
United Kingdom10.2%
Parent bank76.5%
Other2.1%US
11.2%
Other: Poland, Portugal and SCF.
The following tables set out the interest-rate risk of the balance sheets of the parent bank and Santander UK by maturity, at the end of 2015.
31. This includes the whole balance sheet with the exception of trading portfolios.
32. Sensitivity to the worst-case scenario between +100 and -100 basis points.
33. Sensitivity to the worst-case scenario between +100 and -100 basis points.

245
Risk profile > Trading market risk and structural risks
2015 ANNUAL REPORT5. Risk management report
Parent bank: Interest rate repricing gap34
Million euros. 31 December 2015
Total 3 months 1 year 3 years 5 years >5 years Not sensitive
Assets 406,911 163,194 74,166 15,330 16,622 24,750 112,849
Liabilities 433,522 151,763 51,924 78,622 24,389 49,350 77,473
Off balance sheet 26,611 29,194 (1,607) 6,857 1,291 (9,124) 0
Net gap 0 40,626 20,635 (56,435) (6,477) (33,725) 35,376
Santander UK: Interest rate repricing gap35
Million euros. 31 December 2015
Total 3 months 1 year 3 years 5 years >5 years Not sensitive
Assets 354,986 189,895 35,303 67,239 26,452 13,757 22,340
Liabilities 353,850 203,616 31,591 29,027 19,161 33,939 36,516
Off balance sheet (1,137) (25,363) 1,736 14,713 (1,653) 9,430 0
Net gap 0 (39,083) 5,448 52,925 5,638 (10,752) (14,176)
In general, the gaps by maturities are kept at reasonable levels in relation to the size of the balance sheet.
Latin AmericaLatin American balance sheets are positioned for interest rate cuts for both economic value and net interest income, except for net interest income in Mexico, where excess liquidity is invested in the short term in the local currency.
In 2015, exposure levels in all countries were moderate in relation to the annual budget and capital levels.
At the end of the year, net interest income risk over one year, measured as sensitivity to parallel ± 100 basis point movements, was concentrated in three countries, Brazil (EUR 124 million), Mexico (EUR 37 million) and Chile (EUR 23 million), as shown in the chart below.
Net interest income (NII) sensitivity36
% of total
Other8.7%
Brazil61.7%
Chile11.2%
Mexico18.4%
Other: Argentina, Uruguay and Peru.
Risk to the value of equity over one year, measured as sensitivity to parallel ± 100 basis point movements, was also concentrated in Brazil (EUR 425 million), Mexico (EUR 180 million) and Chile (EUR 132 million).
Economic value of equity (EVE) sensitivity37
% of total
Other5.2%
Brazil54.6%
Chile17.0%
Mexico23.2%
Other: Argentina, Uruguay and Peru.
34. Aggregate gap for all currencies on the balance sheet of the parent bank unit, in euros.
35. Aggregate gap for all currencies on the balance sheet of the Santander UK unit, in euros.
36. Sensitivity to the worst-case scenario between +100 and -100 basis points.
37. Sensitivity to the worst-case scenario between +100 and -100 basis points.

246
Risk profile > Trading market risk and structural risks
2015 ANNUAL REPORT5. Risk management report
The table below shows the interest-rate risk maturity structure of the Brazil balance sheet in December 2015.
Brazil: Interest rate repricing gap38
Million euros. 31 December 2015
Total 3 months 1 year 3 years 5 years >5 years Not sensitive
Assets 160,088 79,089 21,096 17,908 4,510 12,731 24,754
Liabilities 160,088 108,719 7,818 7,526 4,257 4,303 27,464
Off balance sheet 0 (20,886) 14,613 2,863 783 1,679 948
Net gap 0 (50,516) 27,890 13,246 1,036 10,106 (1,762)
Balance sheet structural interest rate VaRIn addition to sensitivities to interest rate movements (in which, assessments of ±100 bp movements are supplemented by assessments of ±25 bp, ±50 bp and ±75 bp movements to give a fuller understanding of risk in countries with very low rates), Santander also uses other methods to monitor structural balance sheet risk from interest rates: these include scenario analysis and VaR calculations, applying a similar methodology to that for trading portfolios.
The table below shows the average, minimum, maximum and year-end values of the VaR of structural interest rate risk over the last three years:
Balance sheet structural interest rate risk (VaR) Million euros. VaR at a 99% confidence interval over a one day horizon.
Minimum
2015
Average Maximum Latest
Structural interest rate VaR* 250.5 350.0 775.7 264.2
Diversification effect (90.8) (181.1) (310.7) (189.1)
Europe and US 171.2 275.2 777.0 210.8
Latin America 170.1 255.9 309.3 242.6
* Includes credit spread VaR on ALCO portfolios.
2014
Minimum Average Maximum Latest
Structural interest rate VaR* 411.3 539.0 698.0 493.6
Diversification effect (109.2) (160.4) (236.2) (148.7)
Europe and US 412.9 523.0 704.9 412.9
Latin America 107.6 176.4 229.4 229.4
* Includes credit spread VaR on ALCO portfolios.
2013
Minimum Average Maximum Latest
Structural interest rate VaR* 580.6 782.5 931.0 681.0
Diversification effect (142.3) (164.7) (182.0) (150.3)
Europe and US 607.7 792.5 922.0 670.0
Latin America 115.2 154.6 191.0 161.3
* Includes credit spread VaR on ALCO portfolios.
Structural interest rate risk measured in terms of VaR at a 99% confidence interval over a one year horizon averaged EUR 350 million in 2015. Of note is the wide diversification between the balance sheets in Europe and the United States on the one hand and those in Latin America on the other, as is the reduction in VaR in Europe and the USA.
D.2.3.1.2. Structural exchange-rate risk/Hedging of resultsStructural exchange rate risk arises from Group operations in currencies, mainly related to permanent financial investments, and the results and hedging of these investments.
This management is dynamic and seeks to limit the impact on the core capital ratio of movements in exchange rates39. In 2015, hedging levels of the core capital ratio for exchange rate risk were maintained at around 100%.
At the end of 2015, the largest exposures of permanent investments (with their potential impact on equity) were, in order, in pounds sterling, US dollars, Brazilian reais, Chilean pesos, Mexican pesos and Polish zlotys. The Group hedges some of these positions of a permanent nature with exchange-rate derivatives.
In addition, the Financial Management area is responsible for managing exchange-rate risk for the Group’s expected results and dividends in units where the base currency is not the euro.
D.2.3.1.3. Structural equity riskSantander maintains equity positions in its banking book in addition to those of the trading portfolio. These positions are maintained as available for sale portfolios (capital instruments) or as equity stakes, depending on their envisaged time in the portfolio.
The equity portfolio of the banking book at the end of 2015 was diversified in securities in various countries, mainly Spain, the USA, China, Brazil and the Netherlands. Most of the portfolio is invested in the financial and insurance sectors; other sectors, to a lesser extent, are professional, scientific and technical activities, public administrations (stake in Sareb), manufacturing industry, the transport sector and warehousing.
Structural equity positions are exposed to market risk. VaR is calculated for these positions using market price data series or proxies. At the end of December 2015, the VaR at 99% with a one day time frame was EUR 208.1 million (EUR 208.5 and EUR 235.3 million at the end of December 2014 and 2013, respectively).
38. Aggregate gap for all currencies on the balance sheet of the Brazil unit, in euros.
39. In early 2015, the criteria for coverage of the core capital ratio was changed from phase-in to fully loaded.

247
Risk profile > Trading market risk and structural risks
2015 ANNUAL REPORT5. Risk management report
D.2.3.1.4. Structural VaRA standardised metric such as VaR can be used for monitoring total market risk for the banking book, excluding the trading activity of Santander Global Corporate Banking (the VaR for this activity is described in section D.2.2.1.1. VaR analysis) distinguishing between fixed income (considering both interest rates and credit spreads on ALCO portfolios), exchange rates and equities.
In general, structural VaR is not high in terms of the Group’s volume of assets or equity.
Structural VaRMillion euros. VaR at a 99% confidence interval over a one day horizon
2015 2014 2013
Minimum Average Maximum Latest Average Latest Average Latest
VaR estructural 561.6 698.5 883.5 710.2 718.6 809.8 857.6 733.9
Diversification effect (325.7) (509.3) (1.042.6) (419.2) (364.1) (426.1) (448.3) (380.2)
VaR Interest rate* 250.5 350.0 775.7 264.2 539.0 493.6 782.5 681.0
VaR exchange rate 428.7 634.7 908.6 657.1 315.3 533.8 254.5 197.8
VaR equities 208.1 223.2 241.8 208.1 228.4 208.5 269.0 235.3
* Includes credit spread VaR on ALCO portfolios.
D.2.3.2. Methodologies
D.2.3.2.1. Structural interest rate riskThe Group analyses the sensitivity of its net interest income and equity value to changes in interest rates. This sensitivity arises from gaps in maturity dates and the review of interest rates in the different asset and liability items.
The financial measures to adjust the positioning to that desired by the Group are agreed on the basis of the positioning of balance sheet interest rates, as well as the situation and outlook for the market. These measures range from taking positions in markets to defining the interest rate features of commercial products.
The metrics used by the Group to control interest rate risk in these activities are the repricing gap, the sensitivity of net interest income and of equity value to changes in interest rate levels, the duration of equity and Value at Risk (VaR), for the purposes of calculating economic capital.
Interest rate gap of assets and liabilitiesThis is the basic concept for identifying the entity's interest rate risk profile and measuring the difference between the volume of sensitive assets and liabilities on and off the balance sheet that
reprice (i.e. that mature or are subject to rate revisions) at certain times (buckets). This provides an immediate approximation of the sensitivity of the entity's balance sheet and its net interest income and equity value to changes in interest rates.
Net interest income (NII) sensitivityThis is a key measure of the profitability of balance sheet management. It is calculated as the difference in the net interest income resulting from a parallel movement in interest rates over a particular period. The standard period for measuring net interest income sensitivity is one year.
Economic value of equity (EVE) sensitivityThis measures the interest rate risk implicit in equity value - which for the purposes of interest rate risk is defined as the difference between the net current value of assets and the net current value of liabilities outstanding - based on the impact that a change in interest rates would have on these values.
Treatment of liabilities without defined maturityIn the corporate model, the total volume of the balances of accounts without maturity is divided between stable and unstable balances. This separation between stable and unstable balances is obtained from a model that is based on the relation between balances and their own moving averages.

248
2015 ANNUAL REPORT
Risk profile > Trading market risk and structural risks5. Risk management report
From this simplified model, the monthly cash flows are obtained and used to calculate NII and EVE sensitivities.
This model requires a variety of inputs:
• Parameters inherent in the product.
• Performance parameters of the client (in this case analysis of historic data is combined with the expert business view)
• Market data
• Historic data of the portfolio.
Pre-payment treatment for certain assetsThe pre-payment issue mainly affects fixed-rate mortgages in units where the relevant interest rate curves for the balance sheet are at low levels. This risk is modelled in these units, and this can also be applied, with some modifications, to assets without defined maturity (credit card businesses and similar).
The usual techniques used to value options cannot be applied directly because of the complexity of the factors that determine borrower pre-payments. As a result, the models for assessing options must be combined with empirical statistical models that seek to capture pre-payment performance. Some of the factors conditioning this performance are:
• Interest rate: the differential between the fixed rate on the mortgage and the market rate at which it could be refinanced, net of cancellation and opening costs.
• Seasoning: pre-payment tends to be low at the start of the instruments life cycle (signing of the contract) and grow and stabilize as time passes.
• Seasonality: redemptions or early cancellations tend to take place at specific dates.
• Burnout: decreasing trend in the speed of pre-payment as the instrument’s maturity approaches, which includes:
a) Age: defines low rates of pre-payment.
b) Cash pooling, defines as more stable those loans that have already overcome various waves of interest rate falls. In other words, when a portfolio of loans has passed one or more cycles of downward rates and thus high levels of pre-payment, the 'surviving' loans have a significantly lower pre-payment probability.
c) Others: geographic mobility, demographic, social and available income factors, etc.
The series of econometric relations that seek to capture the impact of all these factors is the probability of pre-payment of a loan or pool of loans and is denominated the pre-payment model.
Value at Risk (VaR)For balance sheet activity and investment portfolios, this is defined as the 99% percentile of the distribution function of losses in equity value, calculated based on the current market value of positions and returns over the last two years, at a particular level of
statistical confidence over a certain time horizon. As with trading portfolios, a time frame of two years or at least 520 days from the reference date of the VaR calculation is used.
D.2.3.2.2. Structural exchange-rate risk/Hedging of resultsThese activities are monitored via position measurements, VaR and results, on a daily basis.
D.2.3.2.3. Structural equity riskThese activities are monitored via position measurements, VaR and results, on a monthly basis.
D.2.3.3. System for controlling limitsAs already stated for the market risk of trading, under the framework of the annual limits plan, limits are set for balance sheet structural risks, responding to Grupo Santander’s risk appetite level.
The main ones are:
• Balance sheet structural interest rate risk
• Limit on the sensitivity of net interest income to one year.
• Limit of the sensitivity of equity value.
• Structural exchange rate risk:
• Net position in each currency (for hedging positions of results).
In the event of exceeding one of these limits or their sub limits, the relevant risk management executives must explain the reasons and facilitate the measures to correct it.
D.2.4. Pension and actuarial risks
D.2.4.1. Pension riskWhen managing the pension fund risks of employees (defined benefit), the Group assumes the financial, market, credit and liquidity risks it incurs for the assets and investment of the fund, as well as the actuarial risks derived from the liabilities, and the responsibilities for pensions to its employees.
The Group’s objective in the sphere of controlling and managing pension risk focuses on identifying, measuring, monitoring, mitigating and communicating this risk. The Group’s priority is thus to identify and mitigate all the focuses of risk.
This is why the methodology used by Grupo Santander estimates every year the combined losses in assets and liabilities in a defined stress scenario from changes in interest rates, inflation, stocks markets and properties, as well as credit and operational risk.
Main figures The main figures for the pension funds of employees with defined contribution plans are set out in note 25 of the Group’s auditor’s report and annual consolidated financial statements, which report the details and movements of provisions for pensions, as well as the main hypotheses used to calculate the actuarial risk and the risk of the fund, including changes in the value of assets and liabilities and details of the investment portfolios assigned to them.

249
2015 ANNUAL REPORT
Risk profile > Trading market risk and structural risks5. Risk management report
The investor profile of the aggregated portfolio of employees’ pension funds is medium-low risk, as around 65% of the total portfolio is invested in fixed-income assets, as set out in the following chart:
Other*8%
Fixed income65%
Monetary1%
Equities15%
Real estate11%
* Includes positions in hedge funds, private equity and derivatives
Figures as of 31 December 2015
D.2.4.2. Actuarial riskActuarial risk is produced by biometric changes in the life expectancy of those with life assurance, from the unexpected increase in the indemnity envisaged in non-life insurance and, in any case, from unexpected changes in the performance of insurance takers in the exercise of the options envisaged in the contracts.
The following are actuarial risks:
Risk of life liability: risk of loss in the value of life assurance liabilities caused by fluctuations in risk factors that affect these liabilities:
• Mortality/longevity risk: risk of loss from movements in the value of the liabilities deriving from changes in the estimation of the probability of death/survival of those insured.
• Morbidity risk: risk of the loss from movements in the value of the liabilities deriving from changes in estimating the probability of disability/incapacity of those insured.
• Redemption/fall risk: risk of loss from movements in the value of the liabilities as a result of the early cancellation of the contract, of changes in the exercise of the right of redemption by the insurance holders, as well as options of extraordinary contribution and/or suspending contributions.
• Risk of costs: risk of loss from changes in the value of the liabilities derived from negative variances in envisaged costs.
• Catastrophe risk: losses caused by catastrophic events that increase the entity’s life liability.
Risk of non-life liability: risk of loss from the change in the value of the non-life insurance liability caused by fluctuations in risk factors that affect these liabilities:
• Premium risk: loss derived from the insufficiency of premiums to cover the disasters that might occur.
• Reserve risk: loss derived from the insufficiency of reserves for disasters, already incurred but not settled, including costs from management of these disasters.
• Catastrophe risk: losses caused by catastrophic events that increase the entity’s non-life liability.
Main figures In the case of Grupo Santander, actuarial risk embraces the activity of the Group’s fully-owned subsidiaries, which are subject not only to risk of an actuarial nature, but whose activity is also impacted by the other financial, non-financial and transversal risks defined by the Group.
As of 31 December 2015, the volume of assets managed by the companies in Spain and Portugal that belong 100% to Grupo Santander amounted to EUR 25,956 million, of which EUR 21,444 million relates directly to commitments with insurance holders, as follows:
• EUR 14,663 million are commitments guaranteed (wholly or partly) by the companies themselves.
• EUR 6,781 million are commitments where the risks are assumed by the insurance holders.

250
Risk profile > Liquidity risk and funding5. Risk management report
2015 ANNUAL REPORT
D.3. Liquidity risk and funding
Structure of this section
Following an introduction to the concept of liquidity risk and funding in Grupo Santander [pag. 250], we present the liquidity management framework put in place by the Group, including monitoring and control of liquidity risk [pag. 250-254].
We then look at the funding strategy developed by the Group and its subsidiaries over the last few years [pag. 254-256], with particular attention to the evolution of liquidity in 2015. For the last year, we examine changes in the liquidity management ratios and the business and market trends that gave rise to these [pag. 256-260].
The section ends with a qualitative description of the prospects for funding for the next year for the Group and its main countries [pag. 260].
D.3.1. Introduction to the treatment of liquidity risk and funding
• Santander has developed a funding model based on autonomous subsidiaries responsible for covering their own liquidity needs.
• This structure makes it possible for Santander to take advantage of its solid retail banking business model in order to maintain comfortable liquidity positions at Group level and in its main units, even during stress in the markets.
• In the last few years, as a result of the economic and regulatory changes arising from the global economic and financial crisis, it has been necessary to adapt the funding strategies to new commercial business trends, market conditions and new regulatory requirements.
• In 2015, Santander continued to improve in specific aspects based on a very comfortable liquidity position at the level of the Group and in the subsidiaries, with no significant changes in liquidity management or funding policies or practices. All of this enables us to face 2016 from a good starting point, with no restrictions on growth.
Liquidity management and funding have always been basic elements in Banco Santander’s business strategy and a fundamental pillar, together with capital, in supporting its balance sheet strength.
The Group adopts a decentralised funding model, based on autonomous subsidiaries that are self-sufficient in their liquidity needs. Each subsidiary is responsible for covering the liquidity needs of its current and future activity, either through deposits captured from its customers in its area of influence or through recourse to the wholesale markets in which it operates, within a management and supervision framework coordinated at the Group level.
The funding structure has shown its great effectiveness in situations of high levels of market stress, as it prevents the difficulties of one area from affecting the funding capacity of other areas, and thus of the Group as a whole, as could happen in the case of a centralised funding model.
Moreover, at Grupo Santander this funding structure benefits from the advantages of a solid retail banking model with a significant presence in ten high potential markets, focused on retail clients and high efficiency. All of this gives our subsidiaries substantial capacity to attract stable deposits, as well as a strong issuance capacity in the wholesale markets of these countries, generally in their own currency, backed by the strength of their franchise and belonging to a leading group.
D.3.2. Liquidity management
Management of structural liquidity aims to fund the Group’s recurring activity in optimum conditions of maturity and cost, avoiding the assumption of undesired liquidity risks.
Santander’s liquidity management is based on the following principles:
• Decentralised liquidity model.
• Needs derived from medium- and long-term activity must be financed by medium- and long -term instruments.
• High contribution from customer deposits, derived from the retail nature of the balance sheet.
• Diversification of wholesale funding sources by instruments/investors, markets/currencies and terms.
• Limited recourse to wholesale short-term funding.

251
Risk profile > Liquidity risk and funding5. Risk management report
2015 ANNUAL REPORT
• Availability of sufficient liquidity reserves, including the discounting capacity in central banks to be used in adverse situations.
• Compliance with regulatory liquidity requirements required at Group and subsidiary level, as a new conditioning factor in management.
The effective application of these principles by all the institutions that comprise the Group required the development of a unique management framework built upon three essential pillars:
• A solid organisational and governance model that ensures the involvement of the senior management of subsidiaries in decision-taking and its integration into the Group’s global strategy.
• In-depth balance sheet analysis and measurement of liquidity risk, supporting decision-taking and its control.
• Management adapted in practice to the liquidity needs of each business.
D.3.2.1. Organisational model and governanceThe decision-making process for all structural risks, including liquidity and funding risk, is carried out by local asset and liability committees (ALCO) in coordination with the global ALCO.
The global ALCO is the body empowered by Banco Santander’s board to coordinate asset and liability management (ALM) throughout the Group, including liquidity and funding management, which is conducted via the local ALCOs and in accordance with the corporate ALM framework.
This body is chaired by the Bank’s executive chairman and comprises an executive vice-chairman (who is, in turn, chairman of the executive risk committee), the chief executive officer, the chief financial officer, the senior executive vice president for risk and other senior executives responsible for the business and analysis units who provide advice.
In line with these principles and the ALM corporate framework, the function of liquidity and funding management is supported by:
• The board of directors, as the highest body responsible for management of the Group.
• The local ALCO committees, which define at each moment the objective liquidity positioning and strategies to ensure and/or anticipate the funding needs of their business, always within the risk appetite set by the board and regulatory requirements.
• The global ALCO committee, which conducts the parent bank’s ALM management, as well as coordinating and monitoring the function in the Group’s other units.
• The Financial Management area, which manages on a day to day basis, conducting analysis, proposing strategies and carrying out the measures adopted within the positioning defined by the ALCOs.
• The Market Risk area, responsible for on-going monitoring and control of compliance with the limits established. This independent control function is completed a posteriori by regular reviews conducted by Internal Audit.
• All of this supported by an independent Operations area that guarantees the integrity and quality of the information used for managing and controlling liquidity.
Governance-Grupo Santander: liquidity and funding risk Decision making structure and functions
Finance DivisionAnalysisActive senior
management participationFinance Division
ProposalsBoard of directors Global and
Decision local ALCOs
ALCO globalFinance DivisionExecution
ALCO local ALCO localMonitoring and Market and structural
ALCO local control risks area
The Global ALCO is tasked by the board with coordinating the ALM function throughout the Group, including liquidity and funding management

252
Risk profile > Liquidity risk and funding5. Risk management report
2015 ANNUAL REPORT
This governance model has been strengthened over the last few years by being integrated into a more global vision of the Group’s risks: Santander’s risk appetite framework. This framework meets the demands of regulators and market players emanating from the financial crisis to strengthen banks’ risk management and control systems.
The liquidity risk profile and appetite aims to reflect the Group’s strategy for developing its businesses, which consists of structuring the balance sheet in the most resistant way possible to potential liquidity stress scenarios Liquidity appetite metrics have been put in place that reflect the application of the principles of the Group’s liquidity management model at the individual level, with specific levels for the structural funding ratio and minimum liquidity horizons under various stress scenarios, as indicated in the following sections.
In parallel, analysis is being carried out of a range of scenarios to consider the additional needs that might arise in the face of various events with very serious features, even if their probability of occurrence is very low. These could affect various balance sheet items and sources of funding in different ways (renewal of wholesale funding, outflows of deposits, impairment of liquid assets, etc), whether through conditions in global markets or specific to the Group.
Over the next few years, the metrics used in the liquidity risk appetite framework will be enhanced with the incorporation of those monitored and controlled by the financial management area at Group level and the main units, be they regulatory metrics or of any other type.
The new metrics used in 2015 were the Net Stable Funding Ratio (NSFR) and the Liquidity Coverage Ratio (LCR). The former measures the relationship between structural funding sources and needs, whilst the latter is a regulatory ratio that measures the strength of a bank in the face of a short-term (30 day) liquidity crisis, through its high-quality liquid assets.
D.3.2.2. Balance sheet analysis and measurement of liquidity riskDecision-making on liquidity and funding is based on a deep understanding of the Group’s current situation (environment, strategy, balance sheet and state of liquidity), of the future liquidity needs of the various units and businesses (projection of liquidity), as well as access to and the situation of funding sources in the wholesale markets.
The objective is to ensure the Group maintains optimum levels of liquidity to cover its short and long-term needs with stable funding sources, optimising the impact of its cost on the income statement.
This requires monitoring of the structure of balance sheets, forecasting short and medium-term liquidity and establishing the basic metrics.
1. Group strategy
5. Stressed funding markets
2. Current liquidity situation
3. Balance sheet and liquidity requirements projections
4. Balance sheet under stress
Liquidity analysis
Balance sheet analysis and measurement of liquidity risk
The inputs for drawing up the Group’s various contingency plans are obtained from the results of the analysis of balance sheets, forecasts and scenarios, which, in turn, enable a whole spectrum of potential adverse circumstances to be anticipated.
All these actions are in line with the practices being fostered by the Basel Committee and the various regulators (in the European Union, the European Banking Authority) to strengthen the liquidity of banks. Their objective is to define a framework of principles and metrics that, in some cases, are close to being implemented and, in others, still being developed.
The first ILAAP (Internal Liquidity Adequacy Assessment Process) was carried out in 2015. This comprises an internal self-assessment process of the adequacy of liquidity, which must be integrated into the Group’s other risk management and strategic processes. The ILAAP addresses both quantitative and qualitative aspects. All of the Group’s units have maintained robust liquidity levels, in both the baseline scenario and under potential stress scenarios. Although our supervisor (SSM) did not require us to undertake this exercise in 2015, it did use it as in input in the SREP (Supervisory Review and Evaluation Process) and for Pillar II requirements.
The content of the ILAAP largely shares the liquidity management structure we have been developing over recent years. It includes a qualitative block, which describes our business model, the organisation of our subsidiaries, the organisation of our liquidity management, the controls put in place, and governance and reporting to the governance bodies. The qualitative block analyses liquidity through metrics criteria and stress scenarios, at both the group and subsidiary level. The methodology used by the Group in this analysis over recent years is set out in the following sections.
Fuller details on the measures, metrics and analysis used by the Group and its subsidiaries to manage and control liquidity risk are set out below:
Methodology for monitoring and controlling liquidity risk. The Group’s liquidity risk metrics aim to:
• Achieve greater efficiency in measuring and controlling liquidity risk.
• Support financial management, with measures adapted to the form of managing the Group’s liquidity.

253
Risk profile > Liquidity risk and funding5. Risk management report
2015 ANNUAL REPORT
• Alignment with the regulatory requirements derived from the transposition of Basel III in the European Union, in order to avoid conflicts between limits and facilitate management.
• Serve as an early warning system, anticipating potential risk situations by monitoring certain indicators.
• Achieve the involvement of countries. The metrics are developed on the basis of common and homogeneous concepts that affect liquidity, but they require analysis and adaptation by each unit.
There are two types of basic metrics used to control liquidity risk: short term and structural. The first category basically includes the liquidity gap and the second one the balance sheet’s net structural position. As an additional element, the Group develops various stress scenarios. Further details of three of these metrics are as follows:
a) Liquidity gapThe liquidity gap provides information on the potential cash inflows and outflows, both contractual and estimated, over a certain period of time by applying certain hypotheses. The liquidity gap is drawn up for each of the main entities and each of the main currencies in which the Group operates.
In practice, and given the different performances of a particular item in the Group’s subsidiaries, there are common standards and methodologies to homogenize the construction of the liquidity risk profiles for each unit, so they can be presented in a comparable way to the Bank’s senior management.
As a result, and given that this analysis must be conducted at the individual level of each subsidiary for its autonomous management, a consolidated view of the Group’s liquidity gaps is of very limited use for managing and understanding liquidity risk. Of note in the various analyses made using the liquidity gap is that for wholesale funding. On the basis of this analysis, a metric has been defined to guarantee that sufficient liquid assets are maintained in order to attain a minimum liquidity horizon, under the assumption of non-renewal of wholesale funding at maturity.
The minimum liquidity horizons are determined in a corporate and homogeneous way for all units/countries, which must calculate their wholesale liquidity metric in the main currencies in which they operate.
Bearing in mind the market tensions in the last few years of global crisis, this wholesale liquidity gap has been closely monitored in the parent bank and in the euro zone units.
At the end of 2015, all units were in a comfortable position in the horizons established at the corporate level for this scenario.
b) Net structural positionThe objective of this metric is to determine the reasonableness of the funding structure of the balance sheet. The Group’s criterion is to ensure that the structural needs (lending, fixed assets, etc) are covered by an adequate combination of wholesale sources and a stable base of retail deposits, to which is added capital and other permanent liabilities.
Each unit draws up its liquidity balance sheet in accordance with the features of their businesses and compares them with the various funding sources they have. This determines the funding structure that must be met at all times with a key premise: basic businesses must be financed with stable funds and medium- and long-term funding. All of this guarantees the Bank’s sound financial structure and the sustainability of its business plans.
At the end of 2015, the Group had a structural liquidity surplus of more than EUR 149,000 million, equivalent to 14% of net liabilities (vs. 15% of net liabilities in 2014).
c) Analysis of scenariosAs an additional element to these metrics, the Group develops various stress scenarios. The main objective of these is to identify the critical aspects of potential crises and define the most appropriate management measures to tackle each of these situations.
Generally speaking, the units take into account three scenarios in their liquidity analysis: idiosyncratic, local systemic and global systemic. These scenarios are the minimum standard analysis established for all the Group’s units for reporting to senior management. Each of the units also develops ad hoc scenarios that replicate significant historic crises or specific liquidity risks in their environment.
• Idiosyncratic crisis: only affects the Bank but not its environment. This is basically reflected in wholesale funds and in retail deposits, with various percentages of outflows depending on the severity defined.
This category includes studying a specific crisis scenario affecting a local unit as a result of a crisis in the parent bank, Banco Santander. This scenario was particularly relevant in 2012 because of significant tension in the markets with regard to Spain and other countries on the periphery of the euro zone, a situation amply overcome since then.
• Local systemic crisis: an attack by the international financial markets on the country where the unit is located. Each unit would be affected to varying degrees, depending on its relative position in the local market and the image of soundness it transmits. The factors that would be affected in such a scenario include, for example, wholesale funding because of closure of markets, and liquid assets linked to the country, which would suffer significant falls in their value.
• Global systemic crisis: In this scenario some of the factors mentioned in the scenarios above are stressed, paying particular attention to the most sensitive aspects from the standpoint of the unit’s liquidity risk.
An additional combined scenario is also prepared for the parent. This considers extremely severe impacts on both solvency and liquidity, such as, for example, Banco Santander having to face reputational problems caused by mismanagement, powerfully impacting its ability to access liquidity in the market, and assuming these problems occur against a backdrop of a local (i.e. Spain) macroeconomic crisis, further penalising the assets available to the Bank to meet its needs. Consequently, the impacts on assets and liabilities are the result of the most severe combination of the idiosyncratic and local-systemic (Spain) scenarios.

254
Risk profile > Liquidity risk and funding5. Risk management report
2015 ANNUAL REPORT
Defining scenarios and calculating metrics under each of them is directly linked to the process of drawing up and executing the liquidity contingency plan, which is the responsibility of the financial management area.
At the end of 2015, and in a scenario of a potential systemic crisis affecting the wholesale funding of units in Spain (following the previously mentioned 2012 scenario), Grupo Santander maintained an adequate liquidity position. The wholesale liquidity metric horizon in Spain (included within the liquidity gap measures) showed levels higher than the minimums established, during which the liquidity reserve would cover all wholesale funding maturities, in the event of them not being renewed.
As well as these three metrics, several other internal and market variables were defined as early warning indicators of possible crises, revealing their nature and severity. Their integration into daily liquidity management enables anticipation of situations that could affect the Group’s liquidity risk. Although these alerts vary from country to country and from bank to bank on the basis of specific determinants, some of the parameters used are common to the Group, such as Banco Santander’s CDS level, the evolution of customer deposits and trends in official central bank interest rates.
D.3.2.3. Management adapted to business needsAs already pointed out, Grupo Santander’s liquidity management is carried out at the level of subsidiaries and/or business units in order to finance their recurring activities at appropriate prices and maturities. The main balance sheet items related to the Group’s business and funding its major business units are as follows:
Main units and balance sheet itemsBillion euros. December 2015
Total assets
Net loans Deposits
M/LT funding
Spain 327 155 175 57
Portugal 50 28 29 5
Santander Consumer Finance 89 74 33 18
Poland 29 19 21 0
UK 383 283 232 70
Brazil 139 60 57 20
Mexico 65 30 28 2
Chile 46 32 24 7
Argentina 11 6 8 0
US 131 84 60 37
Group Total 1,340 787 678 217
*
**
***
Customer loans excluding loan-loss provisions.
Including retail commercial paper in Spain.
M/LT issues in markets, securitisations and other collateralised funding in the market and funds taken from FHLB lines. All in their nominal value.
In practice, and in line with the funding principles set out, liquidity management in these units consists of:
• Drawing up a liquidity plan every year, based on the funding needs derived from the budgets of each business and the methodology already described. On the basis of these liquidity needs and taking into account prudent limits on recourse to short-term markets, the Financial Management area establishes an issuance and securitisation plan for the year for each subsidiary/global business.
• Monitoring, throughout the year, the evolution of the balance sheet and of the funding needs of the subsidiaries/businesses that gives rise to updating the plan.
• Monitoring and managing compliance by units with regulatory ratios, as well as overseeing the level of asset encumbrance in each unit’s funding, from both the structural standpoint and the component with the shortest maturity.
• Maintaining an active presence in a large number of wholesale funding markets that enables an appropriate structure of issues to be sustained, diversified by products and with a conservative average maturity.
The effectiveness of this management at Group level is based on implementation in all subsidiaries. Each subsidiary budgets its liquidity needs based on their intermediation activity and assesses its capacity to access wholesale markets in order to establish an issuance and securitisation plan, in coordination with the Group.
Traditionally, the Group’s main subsidiaries have been self-sufficient as regards their structural financing. The exception is Santander Consumer Finance (SCF) which needs the support of other Group units, particularly that of Banco Santander, S.A., given its nature as a consumer finance specialist operating mainly via dealers.
This support –always at market prices based on maturity and the internal rating of the borrowing unit– has been on a sustained downward trend and currently relates almost entirely to the needs of new portfolios and business units incorporated in the context of the agreement with Banque PSA Finance. In 2016, this requirement for greater financial support from the Group will continue, as there are no more units to incorporate. Over the medium term, the development of wholesale funding capacity in the new units, as required by the Santander model, will enable this support to be reduced.
D.3.3. Funding strategy and evolution of liquidity in 2015
D.3.3.1. Funding strategySantander’s funding activity over the last few years has focused on extending its management model to all Group subsidiaries, including new incorporations, and, in particular, adapting the strategies of the subsidiaries to the increasingly demanding requirements of both markets and regulators. These requirements have not been the same for all markets and reached much higher levels of difficulty and pressure in some areas, such as on the periphery of Europe.

255
Risk profile > Liquidity risk and funding5. Risk management report
2015 ANNUAL REPORT
It is possible, however, to extract a series of general trends implemented by Santander’s subsidiaries in their funding and liquidity management strategies since the beginning of the crisis. These are the following:
• Maintaining adequate and stable medium and long-term wholesale funding levels at the Group level. This funding represented 21% of the liquidity balance at the end of 2015, similar to the level over recent years, but well below the 28% at the end of 2008, when wholesale liquidity, then more abundant and at lower cost, was yet to suffer the tensions of the crisis.
In general, this wholesale activity has been modulated in each unit on the basis of regulatory requirements, the generation of internal funds in the business and decisions to hold sufficient liquidity reserves.
• Ensuring a sufficient volume of assets that can be discounted in central banks as part of the liquidity reserve (as defined on page 258 of this section) to cater for stress situations in wholesale markets.
The Group has significantly increased its total discounting capacity in the last few years, from EUR 85,000 million at the end of 2008 to more than EUR 195,000 million at present.
• Strong liquidity generation from the commercial business through lower credit growth and increased emphasis on attracting customer deposits
The changes in the Group’s lending over recent years have been the result of reductions in the Spain and Portugal units, caused by rapid deleveraging in those countries, coupled with growth in the bank’s other markets, through both expansion of developing units and businesses (the US, Germany, Poland and UK Companies) and sustained business growth in emerging economies (Latin America). Overall, the Group’s net loans have increased by EUR 146,000 million since December 2008, an increase of 26%.
In parallel, the volume of customer deposits has increased by EUR 262,495 million, due to the focus on liquidity during the crisis and the Group’s capacity to attract retail deposits through its branches. This represents a 62% increase since December 2008, more than double the increase in net loans over the same period. Deposits have increased in all commercial units, both in deleveraging and growing economies, where they are growing in line with loans.
As in 2014, in 2015 these trends for loans and deposits were interrupted at the Group level. This was caused by, on the one hand, lower deleveraging and recovering production in the economies most affected by the crisis, and, on the other, the focus on reducing liability costs in mature economies with historically low interest rates. As a result the gap between loan and deposit balances has stopped shrinking, and even started to edge upwards slightly over the last two years.
All these developments in businesses and markets, built on the foundations of a solid liquidity management model, enable Santander to enjoy a very robust funding structure today. The basic features of this are:
• High share of customer deposits in a retail banking balance sheet. Customer deposits are the main source of the Group’s funding, representing around two-thirds of the Group’s net liabilities (i.e. of the liquidity balance) and 86% of net loans at the end of 2015.
They are also very stable funds given their origin mainly in business with retail customers (89% of the Group’s deposits come from retail and private banks, whilst the remaining 11% come from large corporate and institutional clients).
* Balance sheet for the purposes of liquidity management: total balance sheet net of trading derivatives and interbank balances.
LiabilitiesAssets
Grupo Santander liquidity balance sheet*% December 2015
65%75%
8%
17%
21%
12%2% Short-term funding
Shareholders’ funds and other liabilities
Medium and long-term funding
DepositsCustomer net loans
Fixed assets and others
Financial assets
• Diversified wholesale funding focused on the medium and long term, with a very small relative short-term component Medium and long term wholesale funding accounts for 21% of the Group’s net funding and comfortably covers the lending not financed by customer deposits (commercial gap).
This funding is well balanced by instruments (approximately 40% senior debt, 30% securitisations and structured products with guarantees, 20% covered bonds, and the rest preferred shares and subordinated debt) and also by markets so that those with the highest weight in issues are those where investor activity is the strongest.
The following charts show the geographic distribution of customer loans in the Group, and its medium and long-term wholesale funding, so that their similarity can be appreciated.
Net customer loansDecember 2015
Euro zone34%
Euro zone37%
UK 36%UK
32%
Rest of Europe
2%
US11%
US17%
Brazil8%
Brazil9%
Rest of Latam
9%
Rest of Latam
5%
M/LT wholesale funding December 2015

256
Risk profile > Liquidity risk and funding5. Risk management report
2015 ANNUAL REPORT
The bulk of medium and long-term wholesale funding consists of debt issues. Their outstanding balance at the end of 2015 was EUR 149,393 million in nominal terms, with an adequate maturity profile and average maturity of 3.9 years).
The distribution of this by instrument, evolution over the last three years and maturity profile was as follows:
Medium and long-term debt issuances. Grupo SantanderMillion euros
Outstanding balance at nominal value
December 2015 December 2014 December 2013
Preferred shares 8,491 7,340 4,376
Subordinated debt 12,262 8,360 10,030
Senior debt 83,630 68,457 60,195
Covered bonds 45,010 56,189 57,188
Total 149,393 140,346 132,789
Distribution by contractual maturity. December 2015*
0-1 1-3 3-6 6-9 9-12 12-24 2-5 over 5 month months months months months months years years Total
Preferred shares 0 0 0 0 0 0 0 8,491 8,491
Subordinated debt 0 7 224 1,058 84 1,079 2,178 7,633 12,262
Senior debt 3,337 4,994 4,327 2,902 5,305 21,617 30,636 10,512 83,630
Covered bonds 2,627 1,444 1,458 1,477 1,669 8,714 10,170 17,452 45,010
Total* 5,964 6,444 6,008 5,438 7,058 31,410 42,984 44,087 149,393
* In the case of issues with a put option in favour of the holder, the maturity of the put option is considered instead of the contractual maturity.
Note: there are no additional guarantees for any of the senior debt issued by the Group’s subsidiaries.
In addition to debt issues, medium and long-term wholesale funding is completed by securitised bonds placed on the market, and collateralised and other specialist financing amounting to close to EUR 67,508 million, with a maturity of less than two years.
The wholesale funding of short-term issuance programmes is a residual part of the Group’s financial structure, accounting for around 2% of net funding, which is related to treasury activities and is comfortably covered by liquid financial assets.
The outstanding balance at the end of 2015 was EUR 24.448 million, mainly captured by the UK unit and the parent bank through existing issuance programmes: various certificate of deposit and commercial paper programmes in the UK, 39%; European commercial paper and US commercial paper and the domestic programmes of the parent bank, 22%, and programmes in other units, 39%.
In short, Santander enjoys a solid financing structure based on an essentially retail banking balance sheet that enables the Grupo Santander to comfortably cover its structural liquidity needs (loans and fixed assets) with permanent structural funds (deposits, medium and long-term funding and equity), giving rise to a large surplus in structural liquidity.
D.3.3.2. Evolution of liquidity in 2015The key aspects at the level of Group liquidity in 2015 were:
• Comfortable liquidity ratios, backed by balanced commercial activity and greater capturing of medium and long-term wholesale finance, absorbing the growth in lending.
• Compliance with regulatory ratios: the requirement to comply with the LCR ratio (Liquidity Coverage Ratio) came into effect in 2015. At the end of 2015, the Group’s LCR stood at 146%, well in excess of the minimum required (60% in 2015 - the percentage should increase steadily to 100% in 2018).
• Large liquidity reserve, stronger than 2014 in quantity (EUR 257,740 million) and quality (52% of the total are high quality liquid assets).
• Reduced weight of encumbered assets in structural medium and long-term funding operations: around 14% of the Group’s extended balance sheet (under European Banking Authority —EBA— criteria) at the end of 2015.

257
Risk profile > Liquidity risk and funding5. Risk management report
2015 ANNUAL REPORT
i. Basic liquidity ratios at comfortable levelsThe table shows the evolution of the basic metrics for monitoring liquidity at the Group level over the last few years:
Grupo Santander monitoring metrics
2008 2012 2013 2014 2015
Net loans/net assets 79% 75% 74% 74% 75%
Net loan-to-deposit ratio (LTD ratio) 150% 113% 112% 113% 116%
Customer deposits and medium and long-term funding/net loans 104% 117% 118% 116% 114%
Short-term wholesale funding/net liabilities* 7% 2% 2% 2% 2%
Structural liquidity surplus (% net liabilities*) 4% 16% 16% 15% 14%
* Balance sheet for liquidity management purposes.
Note: in 2012 and 2013 customer deposits include retail commercial paper in Spain (excluding short term wholesale funding). The 2012 and 2013 ratios include SCUSA by global integration, the same as in 2014.
At the end of 2015, and compared to 2014, Grupo Santander recorded:
• A stable ratio of net loans/net assets (total assets less trading derivatives and interbank balances) at 75%, as a result of improved credit conditions following ending of deleveraging in mature markets. This high level in comparison with European competitors reflects the retail nature of Grupo Santander’s balance sheet.
• Net loan-to-deposit ratio (LTD ratio) at 116%, within a very comfortable range (below 120%). This evolution shows the recovery of credit in mature markets, both organic as well as inorganic (incorporation of consumer businesses in Europe), and the greater focus on optimising the cost of retail deposits in countries with low interest rates.
• There was a decline in the ratio of customer deposits and medium and long-term financing/lending, for similar reasons to the LTD ratio, given that the rise in the Group’s capture of wholesale funds was also lower than the rise in lending. This ratio stood at 114% in 2015 (116% in 2014).
• The Group’s reduced recourse to short-term wholesale funding was maintained. The ratio was around 2%, in line with previous years.
• Lastly, the Group’s structural surplus (i.e. the excess of structural funding resources - deposits, medium and long-term funding and capital - over structural liquidity needs - fixed assets and loans) increased in 2015, to an average of EUR 159,000 million, around 4% higher than at the end of 2014.
At 31 December 2015, the consolidated structural surplus stood at EUR 149,109 million. This consists of fixed-income assets (EUR 158,818 million) and equities (EUR 19,617 million), partly offset by short-term wholesale funding (EUR -24,448 million) and net interbank and central bank deposits (EUR -4,878 million). In relative terms, the total volume was equivalent to 14% of the Group’s net liabilities, a similar level to the end of 2014.
In summary, Grupo Santander had a comfortable liquidity position at the end of 2015, as a result of the performance of its subsidiaries.
The table below sets out the most frequently used liquidity ratios for Santander’s main units at the end of December 2015:
Liquidity ratios for the main units% December 2015
Net loan-to-deposit ratio
Deposits+M & LT funding/net loans
Spain 89% 149%
Portugal 97% 121%
Santander Consumer Finance 226% 69%
Poland 88% 115%
UK 122% 107%
Brazil 106% 128%
Mexico 107% 101%
Chile 133% 98%
Argentina 78% 130%
US 140% 115%
Group Total 116% 114%
Note: in Spain, including retail commercial paper in deposits.
Generally speaking, there were two drivers behind the evolution of the Group’s liquidity and that of its subsidiaries in 2015:
1. Widening of the commercial gap, continuing the change of trend that began in 2014, reinforced by non-organic components (SCF).
2. Continuing intensity of issuance activity, particularly by the European and US units, against a backdrop of more favourable conditions in wholesale markets.
In 2015, the Group as a whole attracted EUR 56,000 million in medium and long-term funding.
In terms of instruments, the biggest increase was in issuances of medium and long-term fixed-income instruments (senior debt, covered bonds, subordinated debt and preferred shares), up 16% to more than EUR 42,000 million, with a larger weight of senior debts than covered bonds. Spain was the largest issuer, followed by the UK and Santander Consumer Finance units, the three of which accounted for 87% of the issuances.
The remaining EUR 14,400 million of medium and long-term finance related to securitisations and finance with guarantees, which remained stable compared to 2014. US and European units specialising in the consumer segment accounted for 85% of the total.
By geographic area, Santander Consumer Finance, Brazil and the US recorded the largest increases, supported by increased senior debt issuances.
In the United States, Santander Consumer Finance USA continued to increase its securitisation activity and its recourse to warehouse lines to fund strong growth in new lending and the portfolio. Santander Consumer Finance notched up EUR 4,200

258
Risk profile > Liquidity risk and funding5. Risk management report
2015 ANNUAL REPORT
million in securitisations, considerably lower than in 2014, but offset by the increased issuances of senior debt mentioned above.
The chart below sets out in greater detail their distribution by instruments and geographic areas:
Distribution by instrument
Senior debt60%
Spain18%
UK24%
Rest of Latam3%
US22%
Rest of Europe2%
Santander Consumer
Finance17%
Preferred shares
2%
Covered bonds
5%
Brazil14%
Geographic distribution
Medium and long-term funding placed in the market (issuances and securitisations)January-December 2015
Subordinated debt8%
Securitisations and others
25%
In summary, Grupo Santander maintained comfortable access to the markets in which it operates, strengthened by the incorporation of new issuing units. It was involved in issuances and securitisations in 14 currencies in 2015, in which 18 issuers from 15 countries participated, with an average maturity of around 4 years, slightly up on the previous year.
ii. Compliance ahead of schedule with regulatory ratiosUnder its liquidity management model, over the last few years Grupo Santander has been managing the implementation, monitoring and compliance - ahead of schedule - with the new liquidity requirements established under international financial regulations.
LCR (Liquidity Coverage Ratio)In 2014, and after approval by the Basel Committee of the final definition of the liquidity coverage ratio (LCR), a delegated act of the European Commission was adopted defining the criteria for calculating and implementing this metric in the European Union in the CRD IV sphere. Implementation was delayed until October 2015, although the initial compliance level of 60% was maintained. This percentage will be gradually increased to 100% in 2018.
The Group’s strong short-term liquidity starting position, combined with autonomous management of the ratio in all major units, enabled compliance levels of more than 100% to be maintained throughout the year, at both the consolidated and individual levels. As of December 2015, the Group’s LCR ratio stood at 146%, comfortably exceeding the regulatory requirement. Although this requirement has only been set at the Group level, the other subsidiaries also comfortably exceed this minimum ratio.
NSFR (Net Stable Funding Ratio)The final definition of the net stable funding ratio was approved by the Basel Committee in October 2014, and is pending transposition to local regulations.
As regards this ratio, Santander benefits from a high weight of customer deposits, which are more stable, permanent liquidity needs
deriving from commercial activity funded by medium and long-term instruments and limited recourse to short-term funds. All of this enables it to maintain a balanced liquidity structure, which is reflected in NSFR levels at Group level and for most subsidiaries exceeding 100% at the end of 2015, even though this is not required until 2018.
In short, the liquidity models and management of the Group and its main subsidiaries have enabled them to meet both regulatory metrics ahead of schedule.
iii. High liquidity reserveThis is the third major aspect reflecting the Group’s comfortable liquidity position during 2015.
The liquidity reserve is the total volume of highly liquid assets for the Group and its subsidiaries. This serves as a last resort recourse at times of maximum stress in the markets, when it is impossible to obtain funding with adequate maturities and prices.
As a result, this reserve includes deposits in central banks and cash, unencumbered sovereign debt, discounting capacity with central banks, assets eligible as collateral and undrawn credit lines in official institutions (Federal Home Loans Banks in the US).
All of this reinforces the solid liquidity position that Santander’s business model (diversified, retail banking focus, autonomous subsidiaries, etc.) confers on the Group and its subsidiaries.
At the end of 2015, Grupo Santander’s liquidity reserve amounted to EUR 257,740 million, 12% higher than at year-end 2014 and 3% above the average for the year. The structure of this volume by asset type according to cash value (net of haircuts) was as follows:
Liquidity reserveCash value (net of haircuts) in million euros
20152015
average 2014
Cash and deposits at central banks 48,051 46,703 47,654
Unencumbered sovereign debt 85,454 75,035 52,884
Undrawn credit lines granted by central banks 110,033 112,725 115,105
Assets eligible as collateral and undrawn credit lines 14,202 15,703 14,314
Liquidity reserve 257,740 250,165 229,957
Note: the reserve excludes other assets of high liquidity such as listed fixed income and equity portfolios.
This increase was accompanied by a qualitative rise in the Group’s liquidity reserve, deriving from the varied evolution of its assets. The first two categories (cash and deposits in central banks + unencumbered sovereign debt), the most liquid (or high quality liquidity assets in Basel’s terminology, as first line of liquidity), increased by more than the average. They rose by EUR 32,967 million, increasing their share of total reserves at the end of the year to 52% (44% in 2014).
Under the autonomy conferred by the funding model, each subsidiary maintains a suitable composition of assets in its liquidity reserve for its business and market conditions (for example, capacity to mobilise their assets or recourse to additional discounting lines, such as in the US).

259
Risk profile > Liquidity risk and funding5. Risk management report
2015 ANNUAL REPORT
Most of the assets are denominated in the currency of the country, and so there are no restrictions on their use. There are however regulatory restrictions in most countries limiting activity between related parties.
The geographic distribution of the liquidity reserve is: 51% in the UK, 27% in the Eurozone, 9% in the US, and the remaining 9% in Poland and Latin America.
Location of liquidity reserveMillion euros
UK 130,309 51%
Eurozone 69,719 27%
US 23,234 9%
Brazil 10,384 4%
Rest 24,094 9%
Total 257,740
iv. Asset encumbrance in financing transactionsLastly, it is worth pointing out Grupo Santander’s moderate use of assets as collateral in the structural funding sources of the balance sheet.
In line with the guidelines established by the European Banking Authority (EBA) in 2014, the concept of asset encumbrance includes both assets on the balance sheet contributed as collateral in operations to obtain liquidity as well as those off-balance sheet assets received and re-used for a similar purpose, as well as other assets associated with liabilities for different funding reasons.
The report on the Grupo Santander information required by the EBA at the end of 2015 is given below.
Grupo Santander Encumbered assets on balance sheet
Billion eurosCarrying value of
encumbered assetsFair value of
encumbered assets
Carrying value of unencumbered
assets
Fair value of unencumbered
assets
Assets 323.3 1,017.0
Credit and loans 217.8 725.9
Equities 13.2 13.2 10.5 10.5
Debt instruments 74.6 74.5 105.5 105.4
Other assets 17.7 175.1
Grupo Santander Encumbrance of collateral received
Billion euros
Fair value of encumbered collateral received
and debt issued by the encumbered entity
Fair value of collateral received and debt issued
by the entity available for encumbrance
Collateral received 44.9 52.0
Credit and loans 1.2 0.0
Equities 0.9 1.7
Debt instruments 42.8 45.1
Other collateral received 0.0 5.2
Debt instruments issued by the entity other than covered loans and securitisations 0.0 5.6
Grupo Santander Encumbered assets and collateral received, and related liabilities
Billion euros
Liabilities, contingent liabilities and securities lending associated with the encumbered assets
Assets encumbered and collateral received, including
debt instruments issued by the entity other than
guaranteed bonds and securitisations, encumbered
Total sources of encumbrances (carrying value) 302.6 368.3

260
Risk profile > Liquidity risk and funding5. Risk management report
2015 ANNUAL REPORT
On-balance sheet asset encumbrance amounted to EUR 323,300 million, over two-thirds of which is accounted for by loans (mortgages, corporate, etc.). Off-balance sheet asset encumbrance stood at EUR 44,900 million, mainly relating to debt securities received as collateral in operations to acquire assets which were re-used. The total for the two categories was EUR 368,300 million, giving rise to a volume of associated liabilities of EUR 302,600 million.
At the end of 2015, total asset encumbrance in financing operations represented 26% of the Group’s extended balance sheet under EBA criteria (total assets plus guarantees received: EUR 1,437 million as of December 2015). This ratio stands at levels in the preceding year. The Group’s recourse to TLTRO during 2015 has been offset by maturities of secured debt (mainly mortgage covered bonds) which have been replaced with unsecured funding
Lastly, it is important to note the different natures of the sources of encumbrance within these, as well as their role in funding the Group:
• 44% of total asset encumbrance corresponds to collateral contributed in medium and long-term funding operations (with a residual maturity of over 1 year) to finance the commercial activity on the balance sheet. This puts the level of asset encumbrance in funding transactions understood as ‘structural’ at 11% of the extended balance sheet, using EBA criteria.
• The other 56% corresponds to short-term market transactions (with a residual maturity of less than 1 year) or collateral contributed in operations with derivatives and whose purpose is not to finance the ordinary activity of businesses but efficient short-term liquidity management.
D.3.4. Funding outlook for 2016
Grupo Santander starts 2016 with a comfortable liquidity position, with a good outlook for financing over the coming year. However, there are risks to this rosier picture, including instability in financial markets, adjustments in China’s economy and changes in monetary policy at major central banks.
With maturities which can be assumed in the coming quarters, due to the reduced weight of short-term maturities and a dynamic of medium and long-term issues similar to that of a year ago, the Group will manage these needs in each country together with the specific needs of each business, including the envisaged incorporation of new portfolios and businesses, particularly consumer business in Europe.
The expected scenario of increased growth and new incorporations will generate moderate liquidity requirements in our units, in both mature and emerging economies.
In most cases, the Group’s business units can draw on surpluses from the end of 2015. There is also ample access to wholesale markets, particularly in Europe because of the European Central Bank’s quantitative easing programme. Taken together, these factors will enable the Group’s subsidiaries to maintain adequate liquidity structures for their balance sheets.
In Spain, where there is a surplus of deposits over loans, a moderate recovery in lending is envisaged after a long period of deleveraging, with a continuing focus on optimising the cost of funds. Liquidity ratios will be strengthened with an eye to the forthcoming returns of LTRO funds.
Of note in the other European units will be increasing issuance and securitisation activity in Santander Consumer Finance, backed by the strength of its business and the quality of its assets. As already discussed, in 2016 the consolidation of new portfolios will require a greater dependence on short-term funds in the rest of the Group.
In the UK, the strong performance of commercial activity and the capturing of clients will strengthen the deposit base as the basic source of credit growth. The expected favourable situation in the markets will enable the unit to optimise its medium and long-term sources of finance. The United States, also with balanced growth in loans and deposits, will focus on diversifying its wholesale financing sources, both in Santander Bank as well as Santander Consumer USA, which will contribute to reducing its leverage with respect to the funds guaranteed.
In Latin America, as in the previous year, the emphasis will remain on financing business activities from deposits, while fostering issuances in the wholesale markets open to the Group’s major units.
In addition, and at Group level, Santander is continuing its long-term plan to issue funds eligible as capital. This plan seeks to enhance the Group s current regulatory ratios efficiently, and also takes into account future regulatory requirements. Specifically, this includes fulfilment of TLAC (total loss-absorbing capacity) requirements, which come into effect in 2019 for systemically-important financial institutions. Although this is currently just an international agreement and awaits transposition into European regulations, the Group is already incorporating it into its issuance plans to meet potential requirements. The pace of issues over recent years are estimated to be sufficient to meet future needs.
Within this general picture, the Group’s various units took advantage of good conditions in the markets at the beginning of 2016 to make issues and securitisations at very tight spreads, capturing more than EUR 4,000 million in January.

261
Risk Profile > Operational risk5. Risk management report
2015 ANNUAL REPORT
D.4. Operational risk
D.4.1. Definition and objectives
Following the Basel framework, Grupo Santander defines operational risk (OR) as the risk of losses from defects or failures in its internal processes, employees or systems, or external events.
Operational risk is inherent to all products, activities, processes and systems and is generated in all business and support areas. For this reason, all employees are responsible for managing and controlling the operational risks generated in their sphere of action.
The Group’s objective in controlling and managing operational risk is to identify, measure, evaluate, monitor, control, mitigate and communicate this risk.
The Group’s priority is to identify and mitigate risk focuses, regardless of whether they produce losses or not. Measurement also helps to establish priorities for operational risk management.
In 2015, the Group continued to drive the improvement of its operational risk management model through a range of initiatives fostered through the Risks area. Some of the most significant of these include completion of the document tree for operational risk management policies as part of the ‘Documenta’ project, progress with the AORM (Advanced Operational Risk Management) transformation project as part of the Group’s ARM (Advanced Risk Management) strategy. This programme seeks to enhance operational risk management capacity through an advanced risk measurement approach, helping to reduce future exposure and losses impacting the income statement.
Grupo Santander has been calculating regulatory capital using the standardised approach set down in the EU Capital Requirements Directive. The AORM programme will help Grupo Santander develop internal models for estimating capital in its main geographic areas, both for economic capital and stress testing, and for potential application as regulatory capital.
The report on Prudential Significance/Pillar III in section 4 includes information on the calculation of capital requirements for operational risk.
D.4.2. Operational risk management and control model
D.4.2.1. Operational risk management cycleThe Group’s operational risk management incorporates the following elements:
Planning
OR profi
le
monitorin
g
Miti
gatio
n
Communication
OR management and control
Measurement
Identifi cation
Assessment

262
Risk Profile > Operational risk5. Risk management report
2015 ANNUAL REPORT
The various phases of the operational risk management and control model are:
• Identify the operational risk inherent in all the Group’s activities, products, processes and systems.
• Define the target profile of operational risk, specifying the strategies by unit and time frame, by establishing the OR appetite and tolerance for the budget of annual losses and monitoring thereof.
• Promote the involvement of all employees in the operational risk culture, through adequate training in all spheres and at all levels.
• Measure and assess operational risk objectively, continuously and consistently with regulatory standards (Basel, Bank of Spain) and the sector.
• Continuously monitor operational risk exposure, and implement control procedures, improve internal knowledge and mitigate losses.
• Establish mitigation measures that eliminate or minimise operational risk.
• Produce regular reports on operational risk exposure and the level of control for senior management and the Group’s areas and units, and inform the market and regulatory bodies.
• Define and implement the methodology needed to calculate internal capital in terms of expected and unexpected loss.
The following are needed for each of the aforementioned processes:
• Define and implement systems that enable operational risk exposure to be monitored and controlled in the Group’s day-to-day management activity, taking advantage of existing technology and achieving the maximum automation of applications.
• Define and document policies for managing and controlling operational risk, and implement methodologies and management tools for this risk in accordance with regulations and best practices.
The advantages of Grupo Santander’s operational risk management model include:
• It fosters development of an operational risk culture.
• It allows comprehensive and effective operational risk management (identification, measurement and assessment, control and mitigation, and information).
• It improves knowledge of existing and potential operational risks and assigns them to business and support lines.
• Operational risk information helps to improve processes and controls, and reduces losses and the volatility of revenues.
• It facilitates the establishment of operational risk appetite limits.
D.4.2.2. Risk identification, measurement and assessment modelA series of quantitative and qualitative corporate techniques and tools has been defined to identify, measure and assess operational risk. These are combined to produce a diagnosis on the basis of the risks identified and an assessment of the area or unit through their measurement and evaluation.
The quantitative analysis of this risk is carried out mainly with tools that register and quantify the potential level of losses associated with operational risk events:
• An internal database of events, the objective of which is to capture all of the Group’s operational risk events. The capture of operational risk events is not restricted by thresholds (i.e. there are no exclusions for reasons of amount), and events with both accounting (including positive effects) and non-accounting impact are captured.
Accounting reconciliation processes have been put in place to guarantee the quality of the information in the databases. The main events for the Group and each operational risk unit are especially documented and reviewed.
• An external database of events, as the Grupo Santander participates in international consortiums, such as the Operational Risk Exchange (ORX). The use of external databases has been stepped up, providing quantitative and qualitative information leading to a more detailed and structured analysis of events in the sector and enabling adequate preparation of the scenario analysis exercises described below.
• Analysis of OR scenarios. An expert opinion is obtained from the business lines and from risk and control managers to identify potential events with a very low probability of occurrence, but which could result in a very high loss for an institution. The possible effects of these are assessed and extra controls and mitigating measures are identified to reduce the likelihood of high economic impact.
In 2015 a corporate scenarios methodology was implemented in the Group’s main geographic areas.
• Capital calculation through the standard approach (see the corresponding section in the report on Prudential Relevance Report/Pillar III).
The tools defined for qualitative analysis seek to assess aspects (coverage/exposure) linked to the risk profile, enabling the existing control environment to be captured. These tools are mainly:
• Operational risk control self-assessment (RCSA). Self-assessment of operational risk is a qualitative process that seeks to determine the main operational risks for a unit, assigning these to the relevant function based on the judgement and experience of a group of experts in each function.

263
Risk Profile > Operational risk5. Risk management report
2015 ANNUAL REPORT
The RCSA process identifies and assesses the material operational risks that could stop a business or support unit achieving its objectives. It seeks to identify these operational risks, assessing them in inherent and residual terms, evaluating the design and operation of the controls and identifying mitigation measures whenever the associated risk levels are unacceptable to risk managers.
The Group has put in place an on-going operational risk self-assessment process: this ensures that material risks are assessed at least once a year. This process combines expert judgement and participation in workshops involving all interested parties, particularly the first-line of defence responsible for the risks and their control. These workshops are run by a facilitator, who is neutral and has no decision-making authority, helping the Group achieve its desired results.
The Group also produces focused assessments of specific operational risk sources, enabling transversal identification of risk levels at a greater degree of granularity. These are applied in particular to technological risks and factors that could lead to regulatory non-compliance, and areas that are exposed to money laundering and terrorism financing risks. The two latter areas, together with related plans for 2016, are set out in greater detail in the section D.5. Compliance and conduct risk.
• Corporate indicators system. These are various types of statistics and parameters that provide information on an institution’s risk exposure and control environment. These indicators are regularly reviewed in order to flag up any changes that could reveal risk problems.
In 2015, the Group evolved its corporate indicators to monitor the main risk concentrations in the Group and the industry. It has also fostered the use of indicators in all spheres of the organisation, from front-line risk managers down. The objective is to incorporate the most relevant risk indicators into the metrics that form the basis for constructing the operational risk appetite.
• Audit and regulatory recommendations. These provide relevant information on inherent risk due to internal and external factors, enabling weaknesses in the controls to be identified.
• Customer complaints. The Group’s increasing systemisation of the monitoring of complaints and their root causes also provides relevant information for identifying and measuring risk levels.
• Other specific instruments that enable more detailed analysis of technology risk, such as control of critical system incidents and cyber-security events. The capture of this information was incorporated into the corporate operational risk tool in 2015.
• Specific assessment of risks related to technological infrastructure management processes, the acquisition and development of solutions, control of information security and IT governance.
D.4.2.3. Implementation of the model and initiativesAlmost all the Group’s units are now incorporated into the model with a high degree of uniformity. However, the different pace of implementation and historical depth of the respective databases means that the degree of progress varies from country to country.
As set out in section D.4.1. Definition and objectives, the Group accelerated its transformation to an advanced operational risk management (AORM) approach in 2015. This programme seeks both to consolidate the current operational risk management framework and to adopt best practices in the market, based on monitoring of an integrated and consolidated operational risk profile, for proactive management of business strategy and tactical decisions.
This programme involves a number of key areas (risk appetite, self-assessment, scenarios, metrics, etc.) that enable the Group to refine the improvements it is implementing: these will mostly be completed in 2016, covering the ten main geographic areas. A monitoring structure has been set up at the highest organisational levels, both at the corporate centre and in the local units, to ensure adequate monitoring of progress.
This programme is supported by the development of a customised and integrated operational risk solution (Heracles, based on the external SAP GRC platform). This tool and the transformation plan will be fully implemented in all of the Group’s geographic areas in 2016.
The main activities and global initiatives adopted to ensure effective operational risk management are:
• Development and implementation of the operational risk framework, policies and procedures, both at the corporate level and in the geographic areas.
• Creation of operational risk control units in the Risks areas (second line of defence) and designation of coordinators responsible for OR in the various spheres of the first lines of defence.
• A new definition of a complete group of operational risk taxonomies (risks, controls, root causes, etc.), enabling more granular, thorough and consistent management of operational risk throughout the Group.
• Development of a new operational risk appetite structure, enabling increased granularity in risk tolerance for the Group’s most significant risk concentrations.
• Establishment of a process for escalating incidents, setting down the criteria for communication and escalation of operational risk events based on their relevance. The relevance of operational risk is defined based on thresholds set for each type of impact.

264
Risk Profile > Operational risk5. Risk management report
2015 ANNUAL REPORT
• Implementation of training programme at all levels of the organisation (from the board to the employees most exposed to risk in the first line of the business) and initiatives for the sharing of experiences (best practice sessions, launch of a monthly newsletter, etc.).
• Fostering of mitigation plans for aspects of particular relevance (information security and cyber-security in the widest sense, control of suppliers, etc.): monitoring of the implementation of corrective measures and projects under development.
• Improvements to the quality and granularity of the information on such risks analysed and presented to the main decision making forums.
• Improvements to contingency and business-continuity plans, and, in general, crisis-management (this initiative is linked to the viability and resolution plans).
• Fostering the control of risk associated with technology (application development and maintenance, design, implementation and maintenance or technological platforms, output of IT processes, etc.).
In the particular case of controlling suppliers mentioned above, following the development and approval of the corporate framework for agreements with third parties and control of suppliers in 2014, work continued throughout 2015 to define and develop the procedures, processes and tools needed for implementation. To this end, Group entities have been working on defining, implementing and monitoring action plans so as to adapt current processes to the new requirements of the model, paying particular attention to:
• Identification, assignment and communication of roles and responsibilities.
• Creation of specific committees for each geographic area to deal with issues relating to suppliers.
• Definition and monitoring of indicators.
• Preparation and maintenance of up-to-date inventories of suppliers of critical services.
• Training and awareness raising of risks associated with suppliers and other third parties.
The Group is continuing to work on the implementation of the model, reinforcing and standardising the activities to be carried out throughout the management lifecycle for suppliers and other third parties.
D.4.2.4. Operational risk information systemThe Group has a corporate information system that supports the operational risk management tools and facilitates information and reporting functions and needs at both the local and corporate levels.
This system includes modules for registering events, mapping and assessing risks, indicators, and mitigation and reporting systems, and applies to all Group entities.
As part of the implementation of the advanced operational risk management approach, and taking into account the synergies that will be produced in the control sphere (integration of operational risk control functions in the widest sense and compliance, documentation and certification process particularities for the internal model into a single tool), the Group is in the process of installing a new GRC (governance, risk and compliance) tool based on the SAP system, known as Heracles. The objective of Heracles is to improve decision making for operational risk management throughout the organisation.
This objective will be achieved by ensuring that those responsible for risks in every part of the organisation have a comprehensive vision of their risk, and the supporting information they need, when they need it. This comprehensive and timely vision of risk is facilitated by the integration of various risk and control programs, such as risk assessment, scenarios, events, assessment of control activities and metrics using a common taxonomy, and methodological standards. This integration provides a more accurate risk profile and significantly improves efficiency by cutting out redundant and duplicated effort.
Heracles also enables the interaction of everybody involved in operational risk management with the information in the system, but subject to their specific needs or limited to a particular sphere. However, it is always draws on a single source of information for all of the functions involved.
In 2015, the Group worked on automating the loading of information into operational risk management systems, and on improving reporting capabilities in the context of the project to comply with regulations on effective aggregation and reporting principles (Risk Data Aggregation/Risk Reporting Framework - RDA/RRF).
In order to achieve the objectives for this project, a reference technological architecture has been developed, providing solutions for information capture and feeding an integrated and reliable database (Golden Source) that is used for the generation of operational risk reports.
D.4.2.5. TrainingThe Group fosters awareness and knowledge of operational risk at all levels of the organisation. In 2014, a range of training initiatives were carried out, including e-learning programmes for all Group employees (general, computer security, business continuity plan) and training activities for groups requiring specific knowledge. These activities included training for employees in wholesale businesses, e-learning for executives and directors, and courses for operational risk coordinators on the first line of defence.

265
Risk Profile > Operational risk5. Risk management report
2015 ANNUAL REPORT
D.4.3. Evolution of the main metrics
As regards the databases of events, and after consolidating the information received, the evolution of net losses (including both losses incurred and net provisions) by Basel40 risk category over the last three years is set out in the chart below:
2013 2014 2015
I - Internal fraud VII - Execution, delivery
and process management
V - Damage to physical assets
III - Employment practices and
workplace health and safety
VI -Business interruption and systems failures
IV - Customer, product and
business practices
II - External fraud
2.4%
11.8%
1.2%
66.4%
1.2% 0.1%
16.9%
80%
70%
60%
50%
40%
30%
20%
10%
0%
Distribution of net losses by operational risk category41
% of total
The evolution of losses by category shows a slight reduction in relative terms for practices with clients, products and business, although these continue to be the largest item.
The most relevant losses by type and geographic region in 2015 related to judicial cases in Brazil and customer compensation in the UK.
In Brazil, the roll out of a set of measures to improve customer service (the Trabalhar Bem42 programme) has enabled us to reduce losses from judicial cases.
The increase in compensation for customers in the UK is due mainly to sales of Payment Protection Insurance. The claims received relate to a widespread practice in the UK banking sector. Provisions for possible future claims were increased in 2015, according to the Bank’s best estimates after having analysed the decision of the local authority to limit the deadline on claims.
The most noteworthy factors in the other operational risk categories include a decrease of fraud, in relative terms, and an increase in losses on process execution, delivery and management, mainly relating to provisions for process errors in the UK.
40. The Basel categories include the risks set out in chapter D.5. Compliance and conduct risk.
41. In accordance with local practices, the remuneration of employees in Brazil is managed as personnel expenses for the entity, without prejudice to its treatment under the Basel operational risk framework, and is therefore not included.
42. Refer to section D.4.4., Mitigation measures, for further details.

266
Risk Profile > Operational risk5. Risk management report
2015 ANNUAL REPORT
The chart below shows the evolution of the number of operational risk events by Basel category over the last three years:
2013 2014 2015
I - Internal fraud VII - Execution, delivery and management of processes
V - Damage in physical assets
III - Employment, health and
security practices at work
VI - Interruption of business and
failures in systems
IV - Practices with clients, products
and business
II - External fraud
0.1%
32.7%
0.1%
11.8%
1.7% 1.8%
51.8%
70%
60%
50%
40%
30%
20%
10%
0%
Distribution of number of events by operational risk category43
% of total
In 2015, the Group analysed the number of internal events and put a new procedure in place for escalation of relevant events (in terms of both financial impact and number of customers affected), enabling us to process these with more effective corrective measures. The concentration of relevant events compared to total events remained at very low levels, and was lower than in the previous year.
D.4.4. Mitigation measures
The model requires the Group to monitor the mitigation measures put in place for the main sources of risk identified through operational risk management tools and the organisational and development model, and by preventative implementation of policies and procedures for managing and controlling operational risk.
The Group model combines these measures in a shared database, enabling us to assign each mitigation measure and the various tools used (events, indicators, self-assessment, scenarios, recommendations and prevention policies).
The percentage of measures distributed by type was as follows:
Training and communication
6.0%
Organisation7.2%
Risk transfer0.2%
Technology34.2%
Processes52.4%
2015 mitigation – type of measure%
The main mitigation measures centred on improving the security of customers in their usual operations, the management of external fraud, continued improvements in processes and technology, and management of the sale of products and adequate provision of services.
Regarding the reduction of fraud, the main specific measures were:
Card fraud:• Roll out of chip cards:
• Implementation of the standard in all the Group’s geographic areas in line with the timeframe set down by the payment media industry.
43. In accordance with local practices, the remuneration of employees in Brazil is managed as personnel expenses for the entity, without prejudice to its treatment under the Basel operational risk framework, and is therefore not included.

267
Risk Profile > Operational risk5. Risk management report
2015 ANNUAL REPORT
• Replacement of vulnerable cards with new cards based on advanced authentication CDA technology, reducing the risk of cloning through more robust and complete encryption algorithms.
• Robust (Full Grade) validation of card transactions, including more checks, always carried out online.
• Implementation of the secure ecommerce standard (3DSecure) for internet purchases and requiring additional security codes for transactions, including the use of one-time passwords (OTP-SMS).
• Incorporation of anti-skimming detectors and passive elements in ATMs to stop card cloning.
• Review of card limits based on the product and customer segment, to adjust these for risk levels.
• Application of specific fraud monitoring rules and detection tools to block suspicious transactions abroad.
Electronic fraud:• Implementation of specific protection measures for mobile
banking, such as identification and registration of customer devices (Device Id).
• An improved Internet banking authentication system, with additional checks depending on the risk level for the customer or transaction.
• Checks of online banking transactions through a second factor based on one-time use passwords. Evolution of technology, depending on the geographic area (for example, based on image codes (QR) generated from data for the transaction).
Cyber-Security Program and information security plan
The Group has put in place the Santander Cyber-Security Program to foster and complement the actions already underway. This covers:
• governance, integrating the three lines of defence;
• an approach based on cyber-resilience, including identification, prevention, protection, detection and reaction activities;
• aspects of cyber-security relating to training, access control, segregation of functions and secure software development;
• initiatives to enhance organisation.
In 2015 the Group also continued paying full attention to cyber-security risks, which affect all companies and institutions, including those in the financial sector. This situation is a cause of concern for all entities and regulators, prompting the implementation of preventative measures to be prepared for any attack of this kind.
The Group has put in place the Santander Cyber-Security Program to foster and complement the actions already underway. The global aim is for this programme to be implemented in all Group banks, and covers: i) governance, integrating the three lines of defence; ii) an approach based on cyber-resilience, including identification, prevention, protection, detection and reaction activities; iii) aspects of cyber-security relating to training, access control, segregation of functions and secure software development; and iv) initiatives to enhance organisation.
The Group has evolved its internal cyber-security model to reflect international standards (including, the US NIST —National Institute of Standards and Technology— framework) and incorporate mature concepts. It has also continued its implementation of its cyber-security master plans in Group entities, including:
• Provision of specific budgets to improve cyber-security protection mechanisms against threats in the Group’s entities and geographic areas.
• Contracting of cyber-security insurance at the corporate level.
• Improvement of the Security Operations Centre (SOC), increasing its sphere of activity.
• Participation in cyber-security exercises in various Group geographies, to assess responses to such incidents.
• Cooperation with international forums to identify best practices and share information on threats.
The Group has also launched a training programme in this area, with a new course being implemented on the e-learning platform. This course will give precise guidelines for action, as well as examples of the main current patterns of cyber attacks and electronic fraud.
In addition, observation and analytical assessment of the events in the sector and in other industries enables us to update and adapt our models for emerging threats.
Other relevant mitigation measures: A number of local initiatives have been put in place to tackle external fraud involving identity theft and loan applications, given the significance of this for the Group and the industry. These include, enhancing quality controls for verifying customer identification alerts, evidence of income and applicant documentation (in the US) and plans to improve analysis of proposals (in Brazil).
With regard to mitigation measures relating to customer practices, products and business, Grupo Santander is involved in continuous improvement and implementation of corporate policies on aspects such as the selling of products and services and prevention of money laundering and terrorism financing. Detailed information on these areas can be found in section D.5.2. Compliance risk control and supervision.

268
Risk Profile > Operational risk5. Risk management report
2015 ANNUAL REPORT
The ‘Working Well’ (Trabalhar Bem) project in Brazil is also relevant to this category of operational risk, seeking to provide the Bank’s customers with a better service, with fewer incidents and complaints. This project includes various lines of action to improve selling practices and customer protection, including: influencing design decisions for products and services, analysis and solution of the root causes of customer complaints, development of a complaints management and monitoring structure, and improvement of protection networks at contact points.
D.4.5. Business continuity plan
The Group has a business continuity management system (BCMS), which ensures that the business processes of our entities continue to operate in the event of a disaster or serious incident.
Measurem
ent - continuous improvement in the business continuity m
anag
emen
t mod
el
Mea
sure
men
t - co
ntinuous im
provement in the business continuity management m
odelImpact analysis
Strategic definition of
continuity
Training, and maintenance
testing
Design of crisis management procedures
Governance
Policy
Organisation
The basic objective is to:
• Minimise the possible damage from an interruption to normal business operations on people, and adverse financial and business impacts for the Group.
• Reduce the operational effects of a disaster, providing predefined and flexible guidelines and procedures to be used to re-launch and recover processes.
• Restart time-sensitive business operations and associated support functions, in order to achieve business continuity, stable profits and planned growth.
• Protect the public image of, and confidence in, Grupo Santander.
• Meet the Group’s obligations to its employees, customers, shareholders and other stakeholders.
During 2015, the Group continued to advance in implementing and continuously improving its business continuity management system. This included consolidating the implementation of the three lines of defence in relation to business continuity, including newly created businesses and divisions in the management scope.
Furthermore, and based on the improvements made to the viability and resolution plans (for more details see section B.3.4. Recovery and resolution plans), a new comprehensive crisis-management model has been defined for operational and reputational crises. This refines the communication protocols for the functions involved in the decision to escalate a situation involving calling a new meeting of the crisis management committee. This also involves a redefinition of the current business continuity committee to provide adequate support to the head of operational risk Crisis Management Director in escalating issues to, and supporting, the CFO (the Crisis Management Director).
D.4.6. Other aspects of control and monitoring of operational risk
Analysis and monitoring of controls in market operations Due to the specific nature and complexity of financial markets, the Group considers it necessary to continuously improve operational control procedures to keep them in line with new regulations and best practices in the market. Thus, during the year, it continued to improve the control model for this business, attaching particular importance to the following points:
• Analysis of the individual operations of each Treasury operator in order to detect possible anomalous behaviour. During the year all the thresholds applied to each of the controls were reviewed with the other control areas, implementing specific limits for each desk.
• Implementation of a new tool that enables compliance with new record keeping requirements for monitoring communication channels.
• Strengthening of controls on cancelling and modifying operations and calculation of the actual cost thereof, where these are due to operational errors.
• Strengthening of controls on contributions of prices to market indexes.
• Development of additional controls to detect and prevent irregular operations (such as controls on triangular sales).
• Development of extra controls for access to systems registering front office operations (for example, to detect shared usernames).
• Adaptation of existing controls and development of new controls to comply with the new Volcker requirements.
• Formalisation of IT procedures, tools and systems for cyber-security protection, prevention and training.
• Development of the Keeping in B project. This involves a range of inter-disciplinary teams seeking to reinforce aspects relating to corporate governance, compliance with money laundering and credit risk controls and procedures, financial and operational architecture, technological platforms, regulatory and organisational aspects and sufficiency of resources.
For more information on issues relating to regulatory compliance in markets, refer to section D.5.4. Regulatory compliance.

269
Risk Profile > Operational risk5. Risk management report
2015 ANNUAL REPORT
The business is also undertaking a global transformation and evolution of its operational risk management model. This involves modernising its technology platforms and operational processes to incorporate a robust control model, enabling a reduction of the operational risk associated with its business.
Corporate informationThe operational risk function has an operational risk management information system that provides data on the Group’s main elements of risk. The information available for each country and unit in the operational risk sphere is consolidated to give a global vision with the following features:
• Two levels of information: corporate with consolidated information, and individual for each country or unit.
• Dissemination among Grupo Santander’s countries and units of the best practices identified through a combined study of the results of qualitative and quantitative analysis of operational risk.
Information on the following aspects is drawn up:
• Grupo Santander’s operational risk management model and the Group’s main units and countries.
• The perimeter of operational risk management.
• Monitoring of risk appetite metrics.
• The risk profile by country and risk category, and the main operational risk concentrations.
• Operational risk capital.
• The action plans associated with each risk source.
• Distribution of losses by geographic area and risk category.
• Evolution of losses (accumulated annual, deviation on previous year and against budget) and provisions by detection and accounting dates.
• Analysis of the database of relevant internal and external events.
• Analysis of the most relevant risks detected from different information sources, such as the self-assessment exercises for operational and technological risk and operational risk scenarios.
• Assessment and analysis of risk indicators.
• Mitigating and active management measures.
• Business continuity and contingency plans.
This information forms the basis for complying with reporting requirements to the executive risk committee, the board risk committee, the operational risk committee, senior management, regulators, rating agencies, etc.
Insurance in the management of operational riskGrupo Santander regards insurance as a key element in the management of operational risk. Common guidelines for co-ordination among the various functions involved in the insurance management cycle to mitigate operational risk were promoted in 2015. These mainly involved the insurance areas themselves and operational risk control areas, but also the first line risk management areas, pursuant to the procedure designed in 2014.
These guidelines incorporate the following activities:
• Identification of all risks in the Group that can be covered by insurance, including identification of new insurance coverage for risks already identified in the market.
• Establishment and implementation of criteria to quantify the insurable risk, backed by analysis of losses and loss scenarios that enable the Group’s level of exposure to each risk to be determined.
• Analysis of coverage available in the insurance market, as well as preliminary design of the conditions that best suit the identified and assessed needs.
• Technical assessment of the protection provided by the policy, its costs and the elements retained in the Group (franchises and other elements at the responsibility of the insured) in order to make contracting decisions.
• Negotiating with suppliers and award of contracts in accordance with the procedures established by the Group.
• Monitoring of incidents declared in the policies, as well as of those not declared or not recovered due to an incorrect declaration, establishing protocols for action and specific monitoring forums.
• Analysis of the adequacy of the Group’s policies for the risks covered, taking appropriate corrective measures for any shortcomings detected.
• Close cooperation between local operational risk executives and local insurance coordinators to strengthen mitigation of operational risk.
• Active involvement of both areas in the global insurance sourcing unit, the Group’s highest technical body for defining coverage strategies and contracting insurance, the forum for monitoring the risk insured (created specifically in each geography to monitor the activities mentioned in this section) and the corporate operational risk committee.
This year, the Group has also contracted a cyber-insurance policy to cover the possible consequences of cyber-attacks.
Finally, it has adapted its in-house insurance model to improve the definition of functions and the coordination of the internal and external parties involved, so as to optimise protection of the income statement.

270
Risk Profile > Compliance and behavioural risk5. Risk management report
2015 ANNUAL REPORT
D.5. Compliance and conduct risk
D.5.1. Scope, aim, definitions and objective
The Compliance function comprises all matters related to regulatory compliance, prevention of money laundering and terrorism financing, governance of products and consumer protection, and reputational risk.
To achieve this, the Compliance function fosters the adherence of the Santander Group to the rules, supervisory requirements, principles and values of good conduct by setting standards, debating, advising and informing in the interest of employees, customers, shareholders and the wide community.
In the Grupo Santander’s current corporate configuration of three lines of defence, Compliance is an independent second-line control function that reports directly to the board of directors and the committees thereof, through the GCCO, who does so periodically and independently. The Compliance function reports to the CEO. This configuration is aligned with the requirements of banking regulation and with the expectations of supervisors.
In line with what is described in section B.1. Map of risks and in accordance with the current General Risk Framework of the Grupo Santander approved by the Board of Directors of Banco Santander, the following are described as compliance risks:
• Compliance risk: risk due to not complying with the legal framework, the internal rules or the requirements of regulators and supervisors.
• Conduct risk: risk caused by inadequate practices in the Bank’s relationships with its customers, the treatment and products offered to them and their suitability and appropiateness for each specific customer.
• Reputational risk: risk arising from damage to the perception of the Bank by public opinion, its customers, investors or any other interested party.
The Group’s objective in the sphere of compliance and conduct is to minimise the probability that irregularities occur; and that any irregularities that should occur are identified, assessed, reported and quickly resolved.
Other control functions (risks) and support functions (legal, T&O, etc) also take part in controlling these risks.
D.5.2. Compliance risk control and supervision
According to the configuration of lines of defence in the Grupo Santander and, in particular, within the Compliance function, primary responsibility for the management of such function’s risks lies in the first line of defence, jointly with the business units that directly originate such risks and the Compliance function. This is performed either directly or through allocation of compliance activities or tasks to this first line.

271
Risk Profile > Compliance and behavioural risk5. Risk management report
2015 ANNUAL REPORT
Further, setting, promoting and achieving units’ adherence to corporate frameworks, policies and standards across the Group is the responsibility of the Compliance function in its task of control and supervision as the second line of defence. To do so, controls are put in place and their application is monitored and verified. Reporting to governance and administrative bodies is the responsibility of the Compliance function, which is also responsible for advising and informing to senior management in these matters and fostering a culture of compliance, all of these within the framework of an annual programme whose effectiveness is periodically reviewed.
In compliance, the GCCO is responsible for reporting to governance and administrative bodies; who is also responsible for advising and informing senior management in these matters and fostering a culture of compliance, all of these within the framework of an annual programme whose effectiveness is periodically reviewed. This is independently of the reporting on all the Group’s risks (also including compliance risks) performed by the vice chairman of Risks and the CRO to the governance and administration bodies.
The Compliance function provides the basic components for managing these risks (frameworks and policies for combating money-laundering, codes of conduct, marketing of products, reputational risks, etc.) and ensures that the rest are duly tended to by the corresponding units of the Group (responsible financing, data protection, customers’ complaints, etc.), having established the opportune control and verification systems, in the second line of defence of Compliance.
Internal audit - as part of its third-line functions - performs tests and reviews necessary to verify that adequate controls and oversight mechanisms are being applied, and that the Group’s rules and procedures are being followed.
The essential elements of Compliance risk management are based on resolutions adopted by the board of directors, as the highest responsible body, by means of the approval of corporate frameworks that regulate significant matters, and the Santander Group’s General Code of Conduct. Such frameworks are approved at corporate level by the Banco Santander, S.A. as the Group parent, and subsequently approved by the units by means of the latter’s adhesion to the same, in order to carry out transposition in a manner that takes into account applicable local requirements.
The corporate frameworks of the Compliance function are as follows:
• General compliance framework.
• Products and services marketing framework.
• Complaint management framework.
• Anti-money laundering and terrorist financing framework.
These corporate frameworks are developed following Grupo Santander’s internal governance and are consistent with the Parent-subsidiary relationship model.
The General Code of Conduct sets out the ethical principles and rules of conduct that must govern the actions of all Grupo Santander’s employees and it is being supplemented in certain matters by the rules found in other codes and internal rules and regulations.
The Code also lays down the following:
• the Compliance functions and responsibilities set out in the same.
• the rules governing the consequences of non-compliance
• a whistleblowing channel for the submission and processing of reports of allegedly irregular conduct.
Regulatory compliance, under the Board Risk Committee and of the regulatory compliance committee, is responsible for the effective implementation and monitoring of the General Code of Conduct.
D.5.3. Governance and the organisational model
In the exercise of its general function of supervision, the board of directors of the Banco Santander, S.A. is responsible for approving the appointment of the head of Compliance (the Group Chief Compliance Officer – GCCO), and the framework for this function and its implementing policies. In addition, the board is the holder of the Group’s General Code of Conduct and of the corporate structures that implement this function.
In order to strengthen the independence of the compliance function as a function of internal control and provided it with sufficient relevance, the executive committee, at its meeting on February 2, 2015, agreed to appoint an executive vice-president as chief compliance officer (GCCO). For these purposes, in 2015 and pursuant to its mandate, a programme for the transformation of the compliance function at global level is being carried out (Target Operating Model for Compliance, TOM) and will be implemented over a period of three years, with the aim of elevating and bringing this function in line with the best standards in the financial industry.
Reporting on the compliance function to the board is done monthly.
Mention must also be made of the adequate coordination with the operational risk function, which collects different loss events deriving from compliance and conduct risks, and which, through risk governance - which includes a common overview of all the group risks - also reports to the board of directors and to its committees.
D.5.3.1. Governance The following corporate committees, each with their corresponding local replicas, are collegiate bodies with competencies in Compliance:
The regulatory compliance committee is the collegiate body that has powers in all matters inherent in regulatory compliance, without detriment to those assigned to the two specialised bodies in the area (corporate committee of marketing as regards the commercialisation of products and services, the monitoring committee and the anti-money laundering and terrorist financing committee.
The regulatory compliance committee held five meetings in 2015.

272
Risk Profile > Compliance and behavioural risk5. Risk management report
2015 ANNUAL REPORT
The products and services commercialisation committee is the collegiate body of governance for the validation of products and services. The initial proposal and authorisation of new products and services is the responsibility of units, while such proposals and their alignment with corporate policies must be subject to corporate validation. Its objectives and functions are based on the minimisation of inappropriate commercialisation of products and services to customers, taking into account consumer protection. Its functions are performed at both corporate and local level.
The committee assesses the appropriateness of adjusting products and services to the framework where they are going to be marketed, paying special attention to ensuring:
• That the stipulations set out in the corporate commercialisation frameworks and policies, and in general, the internal or external laws (for example, not granting loans for investment products, limiting the bank’s roles as underlying in commercialised structures, etc.) are fulfilled.
• That the target audience is clearly established, in accordance with its features and needs, clearly stating which customers it is not considered suitable for (e.g. aspects such as the customer’s commercial segment, customer’s age, geographical jurisdiction, etc.).
• That the criteria and controls are in place to assess how suitable the products is for the customer are defined at the time of the sale. This will include, depending on the type of product and the commercial treatment applied in each case, an assessment of the customer’s financial capacity to meet the payments associated with the product/service, the appropriateness of the customer’s knowledge and previous investment experience, and the adequate diversification of his investment portfolio, as the case may be.
• That the suitable documentation (advertising, commercial, pre-contractual, contractual and post-contractual) for each product/service, customer and commercialisation type be determined, and in each case, that the information be conveyed to customers clearly and transparently. This information can refer to:
• Explaining how the product or service works, presenting, in an objective and transparent way, the information on the product/service’s characteristics, terms and conditions, costs, risks and the calculation methodology, and not giving rise to unreasonable expectations or causing the customer to choose an inappropriate product/service.
• Frequency and content of the post-contractual information sent to customers, including details of the effective costs incurred and information on the product’s profitability and assessment, as the case may be.
• That training/certification plans, and checks on such plans, are in place to ensure that sales employees in the different channels have the required training and have sufficient information about the characteristics of the product/service, in order to be able to sell it appropriately.
The products and services commercialisation committee met 13 times in 2015 and analysed 104 new products/services, not having validated three of them.
The corporate monitoring committee is the Group’s collegiate governance body in monitoring of products and services, and for the assessment of customer claims in all Group units. Approved products and services are monitored locally through local monitoring committees or similar bodies, and their conclusions are reported directly to the corporate monitoring committee.
The monitoring committee held 34 meetings in 2015 at which incidents were resolved and information was analysed on the monitoring of products and services of the Group’s units.
The anti-money laundering and terrorist financing committee (formerly called the Analysis and Resolution Committee, CAR) is the collegiate body in this area, setting frameworks, policies and general objectives. It also validates the rules and regulations of other Group collegiate bodies and units in relation to prevention and coordination.
In order to strengthen governance of the function and to preserve its independence, the objectives and functions of the aforementioned committees have been reviewed in order to adjust them to the Group’s governance model, in the adaptation of the TOM.
D.5.3.2. Organisational modelDerived from the aforementioned transformation programme (TOM) and with the objective of attaining an integrated view and management of Compliance risks, the organisational structure of the function has been modified in accordance with a hybrid approach, in order to converge specialised Compliance risks (vertical functions) with an aggregate and standardised view of them (cross-cutting functions).
Hence, the Compliance structure is organised as follows to contribute to the Group’s mission in this field:
Cross-cutting functions
• Coordination with units.
• Governance, planning and consolidation.
• Compliance processes and information systems.
Vertical functions
• Regulatory compliance.
• Governance of products and consumer protection.
• Anti-money laundering and combating terrorist financing.
• Reputational risk.
D.5.4. Regulatory compliance
The following functions are in place for adequate control and supervision of regulatory compliance risks:
• Implement the Group’s General Code of Conduct and other codes and rules developing the same. Advise on resolving doubts that arise from such implementation.

273
Risk Profile > Compliance and behavioural risk5. Risk management report
2015 ANNUAL REPORT
• Cooperate with Internal Audit in the regular reviews of compliance with the general code and with the codes and other rules developing it, without detriment to the regular reviews which, on matters of regulatory compliance, are to be conducted directly.
• Prepare compliance programmes in relation with specific rules, or modifications thereof, for submission to the regulatory compliance committee and, as the case may be, subsequent approval by the board of directors or the committees thereof.
• Regularly report to the RSRCC and the board of directors on the development of the framework and the implementation of the compliance programme.
• Assess changes that need to be introduced into the compliance programme, particularly in the event of detecting unregulated risk situations and procedures susceptible to improvement, and propose the changes to the committee of regulatory compliance or the RSRCC.
• Receive and handle the accusations made by employees or third parties via the whistle blowing channel.
• Direct and coordinate investigations into the possible committing of acts of non-compliance, being able to request support from Internal Audit and propose to the Irregularities Committee the sanctions that might be applicable in each case.
• Supervise mandatory training activity on Compliance programme.
The Compliance TOM orients the focus of the regulatory Compliance function in the following areas:
1. Compliance in employee matters.
2. Compliance in organisational aspects.
3. Compliance of market regulations.
4. Conduct in the securities markets.
1. EmployeesThe objective of regulatory compliance with respect to employees –on the basis of the General Code of Conduct – is to establish standards in corporate defence and conflicts of interest and, from a regulatory perspective, set guidelines for remuneration and in dealings with suppliers.
In corporate defence, the responsibility is undertaken of minimising the impact of the penal responsibility of companies for any crimes committed on account of and for the benefit of them by administrators or representatives and by employees as a result of a lack of control.
The system of managing risks for the prevention of penal crimes, which was audited in 2015, obtained the AENOR certification in 2014.
A key element in this system is the whistle blowing channel. There are five main whistle blowing channels in the Group, which registered some 400 communications in 2015.
2. Organisational aspectsThis is a new aspect for regulatory compliance. The aim is to set standards, from a regulatory perspective, in record keeping, and in safeguarding the right to the protection of personal data, specifically, those of our customers.
Second-line work is also performed for the general Group compliance of US FATCA tax regulation.
3. Market regulationsIn 2015, a contribution was made to the corporate project of adjustment to the US Volcker Rule, which limits proprietary trading to very specific cases that the group controls by means of a compliance programme. Compliance of other specific security markets regulations are also monitored: as in the field of derivatives, that which is established by Title VII of the US Dodd Frank Act or its European counterpart, EMIR (European Market Infrastructure Regulation).
Regulatory compliance is also responsible for disclosing relevant Group information to the markets. Banco Santander made public 98 relevant facts in 2015, which are available on the Group’s web site and that of the National Securities Market Commission (CNMV).
4. Code of Conduct in Securities Markets (CCSM)The Code of Conduct in Securities Markets (CCSM), supplemented by the Code of Conduct for Analysis Activity, and other implementing rules, contains Group policies in this field and defines, inter alia, the following responsibilities for regulatory compliance:
• Register and control sensitive information known and generated by the Group.
• Maintain the lists of securities affected and related personnel, and watch the transactions conducted with these securities.
• Monitor transactions with restricted securities according to the type of activity, portfolios or collectives to whom the restriction is applicable.
• Receive and deal with communications and requests to carry out own account trading.
• Control own account trading of the relevant personnel and manage possible non-compliance of CCSM.
• Identify, register and resolve conflicts of interest and situations that could give rise to them.
• Analyse activities suspicious of constituting market abuse and, where appropriate, report them to the supervisory authorities.
• Resolve doubts on the CCSM.
At present, 13,000 people are considered relevant persons under the CCSM in the Group.

274
Risk Profile > Compliance and behavioural risk5. Risk management report
2015 ANNUAL REPORT
D.5.5. Governance of products and consumer protection
As a result of the transformation of the compliance function into the new TOM model, the old reputational risk office has been renamed as governance of products and consumer protection, and broadens its authority to strengthen adequate control and supervision of the marketing risks of products and services, promotion of transparency and a simple, personal and fair approach to customers to protect their rights and ensure that policies and procedures take consumers’ perspective into account. To do so, the following functions have been established, and organised on the basis of two corporate frameworks and a set of policies that lay down basic principles and guidelines in this field:
Frameworks• Corporate commercialisation framework: uniform system for
the marketing of products and services, with the aim of minimising exposure to risks and possible claims arising from such fields in all phases (validation, pre-sales, sales, post-sales following).
• Complaint management framework: uniform system for the systematised management of registration, control, management and analysis of the cause of complaints by different categories, thus allowing for identifying reasons for customer dissatisfaction, offering appropriate solutions in each case and improving, as necessary, the processes giving rise to them.
Functions• Foster units’ adherence to aforementioned corporate frameworks.
• Facilitate the functions of the corporate commercialisation committee, ensuring correct validation of any new product or service proposed by any Group subsidiary or the parent prior to the launch thereof.
• Preserve internal consumer protection, with the objective of improving relations with the Group, effectively promoting their rights, facilitating a solution to any controversies, in accordance with best practices through any channel, and fostering financial knowledge. The objective is to contribute to lasting relationships with customers.
• Identify, analyse and control fiduciary risk generated by private banking, asset management, insurance and outsourced activity of custody services for customers’ financial instruments. Fiduciary risk is the risk that arises from the administration of financial instruments on customers’ behalf. This process of fiduciary risk management requires the following activities, in addition to an admission process:
• regular assessment of compliance of products’ mandates, such that the risk associated to customers’ position is always handled in the customer’s best interest.
• monitoring the final performance of the investments both with regard to the fiduciary relations with the client who expects the best performance as well as with regard to competitors.
• regular monitoring of third-party custody providers.
• collect, analyse and report to Group governance bodies the information necessary to carry out an adequate analysis of the marketing risk of products, services and claims, with a twofold view: the possible impact on customers and on the Group, and on the monitoring of products and services throughout their life cycle.
• supervise subsidiaries’ processes of marketing and of customer complaint management, making proposals for improvement and following up on actions plans to mitigate risks.
The following were the main activities carried out by this function in 2015:
• In addition to the aforementioned analysis, of the 104 products and services submitted to the corporate commercialisation committee:
i. analysis and validation of 27 products or services considered to be not new.
ii. reviewing compliance of agreements in 63 structured notes issued by Santander International Products Plc. (subsidiary fully owned by Banco Santander S.A.) and
iii. resolution of 182 consultations by different areas and countries.
• Updating of the contents and formats of documents that regulate the validation and monitoring of products and services in order to incorporate the best practices identified in the Group in this areas. These documents were validated by the committee (July 2015) and then communicated to the subsidiaries, as they are considered benchmark documents that Group units must use as the basis for developing or adapting their own procedures in these areas. The main innovations are:
i. checklist which includes an assessment of the degree to which the proposal is aligned with the simple, personal and fair values of the corporate culture.
ii. update of the draft memorandum provided to Group units as guidelines for submitting initiatives to the pertinent commercialisation committee.
iii. update of the monitoring report submitted to Group units to assist in setting minimum and homogeneous contents for tracking and reporting on marketed products and services and
iv. extending the monitoring scope to all products and services, regardless of the date on which they were validated.
• supervise local monitoring of marketed products and services, with special attention focused on some units that require it due to the type of products and customers they have.
• Monitor the the fiduciary risk of customers’ equity in real estate investment funds and pension funds all managed by Santander Asset Management, the holding company owned by the group.
• Analyse and consolidate complaint information and management thereof from 25 local units and 36 business units and 10 branch offices of Santander Global Corporate Banking.

275
Risk Profile > Compliance and behavioural risk5. Risk management report
2015 ANNUAL REPORT
Corporate projects• Darwin Project: development of corporate tools to improve
safeguarding of customers’ rights:
i. MRF claim management tool, used in the registration, management and traceability of customer cases in order to comply with regulators’ and consumers’ expectations;
ii. tool based on Text & Speech Analytics ARCA (Application for Root Cause Analysis), complying with the Joint Committee guidelines of the European regulators. The tool processes all complaints cases in order to create uniform groups of information or clusters, and identify the cause of customers’ problems in order to mitigate them.
• Classification of financial products under a corporate methodology (rating of one to five): during the year, monitoring of implementation of technology developments in subsidiaries that will allow for maintaining this classification in systems and apply pertinent marketing criteria, with implementation estimated for the first half of 2016.
• Conduct costs arising from marketing (pilot Spain with the idea of spreading conclusions and synergies throughout the rest of the Group): the Corporation has led a collecting of processes and data of Santander España, in order to prepare and action plain aimed at setting up a procedure for identifying and recording, in a centralised, comprehensive, complete and reliable manner, all costs relating to conduct risks arising from marketing.
D.5.6. Anti-money laundering and terrorist financing
The following functions are in place for the adequate control and supervision of money laundering and terrorist financing risks:
• For Grupo Santander, it is a strategic objective to have an advanced and efficient anti-money laundering and terrorist financing system, constantly adapted to the latest international regulations and with the capacity to confront the appearance of new techniques by criminal organisations.
• Its action is structured based on the corporate framework which establishes the principles and basic action guidelines to set minimum standards that Grupo Santander’s units must observe. It is formulated in accordance with the principles contained in the 40 recommendations of the Financial Action Task Force (FATF) and the obligations and provisions of European directives concerning the prevention of the financial system being used for money laundering and for combating terrorist financing.
• The local units, in their role as first line of defence, are responsible for managing and coordinating the systems and procedures for anti-money laundering and terrorist financing in the countries where the Group operates, as well as the investigation and treatment of communications of suspicious transactions and of the information requirements of the corresponding authorities. Each of these local units has persons responsible for this function.
• Corporate systems and processes have been established in all units, based on decentralised operational technology systems, which can provide the corporate function with local management information and data, and also reporting, monitoring and control. These systems are used to apply an active and preventive management in the analysis, identification and monitoring of transactions suspected to be involved in money laundering or terrorist financing.
• Grupo Santander is a founding member of the Wolfsberg Group, with other major international financial entities. The Wolfsberg Group aims to establish international standards to increase the effectiveness of the anti-money laundering and combating terrorism financing programmes in the financial community. A number of initiatives have been launched to address different areas of concern. Supervisory authorities and experts in this area believe that the principles and guidelines set by the Wolfsberg Group represent an important step in the fight against money laundering, corruption, terrorism and other serious crimes.
The prevention organisation assists 168 different Group units established in 31 countries. There are 900 professionals in the Group performing the anti-money laundering and combating of terrorism financing function, and 81% of them are exclusively engaged on this task.
The main activity indicators for 2015 are as follows:
• Subsidiaries reviewed: 109
• Cases investigated: 84,748
• Communications to authorities: 21,485
• Training for employees: 129,233
The Group has both local and corporate training plans, with the aim of covering all employees. There are also specific training plans for the most sensitive areas related to anti-money laundering and terrorist financing.
D.5.7. Reputational risk
As a result of the transformation of the compliance function through the implementation of the TOM model, very significant progress has been made in the specification of the details of the reputational risk model.
The specific characteristic of reputational risk, originating in a wide variety of sources which, when combined with the stakeholder’s view,requires a unique approach, control and management model, different from other risks.
The reputational risk model is based on an eminently preventative approach, but it is also based on efficient crisis management processes.
Reputational risk management is to be incorporated into both business and support activities, and in internal processes. It should, therefore, allow for integrating functions of risk control and supervision in its activities.

276
Risk Profile > Compliance and behavioural risk5. Risk management report
2015 ANNUAL REPORT
The reputational risk model also involves an integrated understanding not only of the bank’s activities and processes in the performance of its activity, but also of how it is perceived by stakeholders (employees, customers, shareholders and investors, and society at large) in different environments. This approach requires close coordination between the management, support and control functions with the different stakeholders.
Reputational risk governance is thus included as a part of compliance governance, as indicated. The compliance function reports to the senior management about reputational risk questions, once the data regarding the sources of reputational risk has been consolidated.
D.5.8. Risk assessment model of compliance and risk appetite
The Group risk appetite for compliance risks stems from a non appetite declaration for risks of this type, in order to clearly reduce the probability of any economic, regulatory or reputational impact occurring within the Group. Compliance risk is organised in a homogeneous way in units, by establishing a common methodology, which consists of setting a series of compliance risk indicators and assessment matrices which are prepared for each local unit.
The corporate compliance function has assessed the regulatory risk (risk assessment) in 2015, focusing on the Group’s main countries. Actions plans designed to allay high risks which derive from risk assessment are monitored on a quarterly basis, country by country.
In accordance with the new compliance TOM, in 2015 the Group launched new indicators and established an initial risk assessment in regulatory consumer protection and products governance, anti-money laundering and funding of terrorism, and reputational risk functions.
From 2015 on, risk assessment is going to be consolidated in order to have a comprehensive overview of all compliance risks, so that such risks can be integrated with all the Group’s other risks, and so the board of directors may have a holistic vision of these risks. This will allow the Group to have a single overview of how compliance risk appetite is established, how it is monitored and what corrective measures need to be deployed, if necessary. This task is performed in accordance with the same methodologies and indicators as in the risk function, so that they are integrated in the Group’s risk appetite framework. Incurred losses resulting from compliance risks are added to the common event data base that is managed by the Risk function, in order to have a complete oversight, and also to provide an integrated control and management of non-financial risks.
The TOM model implementation is expected to include a revised taxonomy of the different types of compliance risks, as first level risks. The aim of this taxonomy is to clearly identify the compliance risks and so be able to ready for possible stress tests in the future.
D.5.9. Transversal corporate projects
In Risk Assessment, a methodology has been established for assessing compliance risks, training of all Group units, and in coordination with the operational risk function, the launching of an assessment exercise.
Lastly, the Risk Data Aggregation (RDA) project, in collaboration with the risk function, consists of a risk indicators models, which have been identified by the vertical functions, and which are required in a corporate tool in order to provide management information.

277
Risk Profile > Model risk5. Risk management report
2015 ANNUAL REPORT
D.6. Model risk
Grupo Santander has far-reaching experience in the use of models to help make all kinds of decisions, and risk management decisions in particular.
A model is taken to be a any metric based on a quantitative method, system or estimate which provides a simplified representation of reality, using statistical, economic, financial or mathematical techniques for processing information and obtaining a result based on a series of assumptions and subject to a certain degree of uncertainty. The use of models helps decisions to be taken more rapidly and objectively, generally justified by analysis of large amounts of information.
When models are used extensively, so-called Model Risk emerges, which is defined as a number of possible adverse impacts, including losses, produced by decisions based on erroneous models or models that have been misused.
According to this definition, the sources of Model Risk are as follows:
• the model itself, due to the utilisation of incorrect or incomplete data, or due to the modelling method used and its implementation in systems
• improper use of the model
Grupo Santander has been working on the definition, management and control of Model Risk in recent years, and took a major step forward in 2015 by creating a specific area within its Risk division to control this type of contingency. The area encompasses the old model validation unit and a specific control team.
The function is deployed at the corporation and also at each of the Group’s main entities. In order to carry out this function, a control framework has been defined with details concerning questions such as organisation, governance, model management and model validation.

278
Risk Profile > Model risk5. Risk management report
2015 ANNUAL REPORT
Management and control of Model Risk is based on the life cycle of a model as defined by Grupo Santander, shown below:
3. Planning
epo
ting
r
11. Monitoring 4. Compilation of information
ards
10. Implementation 5. Development
oan
df s
t
gem
Man
aen
t r
2. Inventory
finit
ion
12. 9. Approval
6. Pre-implementation
testing 1. D
e
8. Independent validation 7. Materiality
Governance
1.- Definition of standardsThe Group has defined a set of standards to develop, monitor and validate its models. Any models used by the Group must meet these standards, regardless of whether they are developed internally or are acquired from third parties. The standards provide a guarantee of quality for the models used by the Group for decision-making purposes.
2.- InventoryOne key feature of proper management of Model Risk is a complete exhaustive inventory of the models used.
Grupo Santander has a centralised inventory, created on the basis of a uniform taxonomy for all models used at the various business units. The inventory contains all relevant information on each of the models, enabling all of them to be properly monitored according to their relevance. The inventory enables transversal analyses to conducted on the information (by geographic area, types of model, importance etc.), thereby easing the task of strategic decision-making in connection with models.
3.- PlanningThis phase involves all those affected by the model life cycle –users, developers, validators, data providers, IT etc.– and draws up and establishes priorities.
This planning takes place once a year at each of the Group’s largest entities, and is approved by local governance bodies, and validated by the corporation.
4.- Compilation of informationAs already mentioned, the data used to create models are a main source of Model Risk. Data must be reliable and complete, and must have sufficient historic depth to ensure that the model developed is suitable.
Grupo Santander has specialist teams to provide the information used to build models, information which has previously been certified by the owners.
5.- DevelopmentThis is the model’s construction phase, based on the needs laid down in the Models Plan and the information furnished to this end by the specialists.
Most of the models used by the Santander Group are developed by internal methodology teams, though some models are also outsourced from external providers. Development must meet the standards established in either case.
6.- Pre-implementation testingWhen the models have been built, the developers and their owners subject them to a battery of tests to ensure that they are functioning as expected, and make any adjustments necessary to this end.
7.- MaterialityEach Group model must be associated with a level of materiality or importance, which is established by an agreement among the parties involved.

279
Risk Profile > Model risk5. Risk management report
2015 ANNUAL REPORT
The criteria for establishing materiality are documented in a corporate policy, which is transposed and approved at each of the Group’ s major entities.
Materiality determines the depth, frequency and scope of the validations and monitoring of the model, in addition to the governance bodies that must take decisions concerning the model.
Materiality constitutes basic information for proper model risk management, and constitutes a field in the corporate inventory.
8.- Independent validationInternal validation of models is not only a regulatory requirement in certain cases, but it is also a key feature for proper management and control of Grupo Santander’s model risk.
Hence, as indicated above, a specialist unit is in place which is totally independently of both developers and users, draws up a technical opinion of the suitability of internal models to their purposes, and sets out conclusions concerning their robustness, utility and effectiveness.
At the present time internal validation covers any models used in the risk function, be they models for credit risk, market risk, structural or operational risk, economic or regulatory capital risk, models for provisions and stress test models including, in the latter case, models to estimate items on the institution’s balance sheet and income statement.
The scope of validation includes not only the more theoretical or methodological aspects, but also IT systems and the data quality they allow, which determines their effectiveness. In general, it includes all relevant aspects of management in general (controls, reporting, uses, senior management involvement etc.).
After each model has been revised, the validation opinion is converted into a score on a scale of one to five as the model risk appraised by the internal validation team.
This corporate internal validation environment at Grupo Santander is fully aligned with the internal validation criteria of advanced models produced by the financial regulators to which the Group is subject. This maintains the criterion of a separation of functions for units developing and using the models (first line of defence), internal validation units (second line of defence) and internal audit (third line of defence) as the ultimate layer of control, checking the effectiveness of the function and its compliance with internal and external policies and procedures, and commenting on its level of effective independence.
9.- ApprovalBefore they are rolled out and actually used, models must be submitted for approval by the proper body, in accordance with their materiality.
10.- ImplementationThis is the phase during which the newly developed model is implemented in the system in which it will be used. As already mentioned, the implementation phase is another possible source of model risk, and it is therefore essential that tests be conducted by technical units and the owners of the model to certify that it has been implemented pursuant to the methodological definition.
11.- MonitoringA model is designed and built on the basis of certain information and circumstances, which may change with the passage of time. Models must therefore be regularly checked to ensure that they are still working properly, and adapted or redesigned if this is not the case.
The frequency and depth of monitoring is established on the basis of the models’ materiality.
12.- Management reportingSenior management at Grupo Santander, in the various units and also at the Corporation itself, regularly monitors model risk in a set of reports that provide a consolidated view of the Group’s model risk and enable decisions to be taken in this regard.
13.- GovernanceThe Model Risk Management Framework stipulates that the body taking responsibility for authorising risk management models to be used is the Models Committee. Each business unit has a models committee which takes responsibility for decisions concerning approval of the local usage of these models when the approval of the corporate models committee has been secured. Under the current policy, all models submitted to a models committee must have an internal validation report.

280
Risk Profile > Strategic risk5. Risk management report
2015 ANNUAL REPORT
D.7. Strategic risk
Grupo Santander considers strategic risk to be what it calls a transversal risk. During 2015, a strategic risk control and management model has been designed, and will be used as a reference for Group subsidiaries. This model includes the risk definition, the functional aspects and the description of the main processes associated with strategic management and control.
Strategic risk is the risk which is associated with strategic decisions and with changes in the entity’s general conditions, which have an important impact on its business model in both the mid and long term.
The entity’s business model is a key factor for strategic risk. The business model should be feasible and sustainable, deliver acceptable results each year and for at least the next three years.
There are three categories or types of strategic risk:
• Business model risk: the risk associated with the entity’s business model. This includes the risk of the business model being obsolescent, of it being irrelevant, and/or losing value, and so not be able to deliver the expected results. This risk is caused both by external factors (macroeconomic, regulatory, social and political questions, changes in the banking industry, etc.) and also internal ones (strength and stability of the income statement, distribution model/channels, revenue and expenses structure, operational efficiency, adequacy of human resources and systems, etc).
• Strategy design risk: the risk associated with the strategy set out in the entity’s five-year strategic plan. Specifically, it includes the risk that the strategic plan may not be adequate per se, or due to its assumptions, and thus the Bank will not be able to deliver on its expected results. It is also important to consider the opportunity cost of designing another more adequate strategy or the lack of action through not designing it.
• Strategy execution risk: the risk associated with the process of implementing five-year strategic plans and three-year plans. As the strategy is implemented in the mid and long term, it often has execution risk due to the complexity and many variables involved in it. Other risk area to be borne in mind are possibly inadequate resources, change management, and, lastly, lack of capacity to cope with changes in the business environment.
As far as strategic risk management and control are concerned, transversal risks associated with corporate development should also be taken into account, as they can pose an important risk to the
business model. Such risks are: those which entail a change in the entity’s scope and activity, acquisitions or disposals of significant holdings and assets, joint ventures, strategic alliances, shareholder agreements and capital transactions.
Lastly, there is another type of risks which may not have a strategic origin (credit, market, operational, compliance risks, etc.). Such risks can have a significant impact on the entity’s financial strength, and may in turn affect the entity’s strategy and business model. Hence, it is important to identify, assess, manage and control them.
Thus, Top Risks: they are risks with a significant impact on the entity’s results, liquidity or capital or risks which could entail undesirable considerations. These risks can bring the entity nearer to default.
While Emerging and Evolving Risks: are risks which have not previously appeared or which have been presented in a different way. These risks often involve a certain degree of uncertainty and are difficult to quantify, but they can have a significant impact during a mid-long term time frame.
The chart below shows how the above risks impact the Group’s business model and strategy.
Top and emerging risks
Financial health
Business model and strategy (Design and execution)
Corporate development transactions

281
Risk Profile > Capital risk5. Risk management report
2015 ANNUAL REPORT
D.8. Capital risk
Organisation of this section
After an introduction to the concept of capital risk and solvency levels at the close of 2015, the key capital figures are outline (pag. pag.281-282].
Next we describe the regulatory framework from a capital standpoint [pag. 282-283].
After that, the regulatory capital and economic capital figures are presented [pag. 283-287].
Lastly, we describe the capital planning process and stress tests in Grupo Santander [pag. 287-289].
For further details, refer to the Prudential Risk Report of Grupo Santander (Pillar III).
D.8.1. Introduction
Santander defines capital risk as the risk that the Group or some of its companies do not have the amount and/or quality of sufficient equity to meet the minimum regulatory requirements set for operating as a bank, to fulfil on the market’s expectations about its/their credit solvency and support business growth and the strategic possibilities they present, in accordance with the strategic plan. Of note are the following objectives:
• complying with the internal objectives for capital and solvency.
• meeting regulatory requirements.
• aligning the Bank’s strategic plan with the capital expectations of outside agents (rating agencies, shareholders and investors, customers, supervisors, etc.)
• supporting the growth of the businesses and exploit the strategic opportunities that arise.
Grupo Santander has a comfortable solvency position, above the levels required by regulators and by the European Central bank, our supervisor. In 2015, the Group continued to bolster its capital ratios in view of the adverse economic setting and to comply with new regulatory requirements. In early 2015, it carried out a EUR 7.5 billion accelerated book building operation, and established a dividend policy which assures organic capital generation.
At 31 December 2015, the Group’s main capital ratios are as follows:
Fully loaded Phase-in
Common Equity (CET1) 10.05% 12.55%
Tier1 11.00% 12.55%
Total Ratio 13.05% 14.40%
Leverage ratio 4.73% 5.38%
Phase-in ratios are calculated applying the transitional Basel III implementation schedules, while Fully loaded ratios are calculated using the final standard.
On 3 February, 2016, the European Central Bank authorised the use of the Alternative Standard Method to calculate capital requirements at consolidated level for operational risk in Banco Santander (Brasil) S.A. The impact of this authorization on the Group’s risk-weighted assets (-EUR 7,836 million), and, consequently, on its capital ratios, has not been taken into account in the data published on 27 January and which are presented in this report.
At the end of 2015, the ECB sent every entity a notification setting out the minimum prudential capital requirements for the following year. For 2016, Grupo Santander must maintain a minimum phase-in CET1 capital ratio at the consolidated level of 9.75% (9.5% being the Pillar I, Pillar II and capital buffer requirements and 0.25% the requirement for being a Systemically Important Financial Institution). As can be seen from the table above, the Group’s capital exceeds the ECB’s minimum requirement.
14.4%
9.75%
Regulatory capital%
Regulatory requirement1 2016 CET1
Regulatory ratios Dec 15
1. Minimum prudential requirements established by the ECB based on the supervisory review and assessment process (SREP)
Capital ratio
CET1
CET1
Systemic buffer
Minimum Pillar I4.50
5.00
0.25
Pillar II requirement (including capital conservation buffer)
12.55
The Group is working towards its goal of having a CET1 fully loaded of more than 11% by 2018.

282
Risk Profile > Capital risk5. Risk management report
2015 ANNUAL REPORT
CapitalThe Group considers the following capital concepts:
Regulatory capital
• Capital requirements: the minimum volume of own funds required by the regulator to ensure the solvency of the entity, depending on its credit, market and operational risks.
• Eligible capital: the volume of own funds considered eligible by the regulator to meet capital requirements. The main elements are accounting capital and reserves.
Economic capital
• Self-imposed capital requirement: the minimum volume of own funds required by the Group to absorb unexpected losses resulting from current exposure to the risks assumed by the entity at a particular level of probability (this may include other risks in addition to those considered in regulatory capital).
• Available capital: the volume of own funds considered eligible by the entity under its management criteria to meet its capital requirements.
Cost of capital
The minimum return required by investors (shareholders) as remuneration for the opportunity cost and risk assumed by investing in the entity’s capital. The cost of capital represents a ‘cut-off rate’ or ‘minimum return’ to be achieved, enabling us to analyse the activity of our business units and assess their efficiency.
Return on risk adjusted capital (RORAC)
This is the return (net of tax) on economic capital required internally. Therefore, an increase in economic capital decreases the RORAC. For this reason, the Bank requires transactions or business units involving higher capital consumption to deliver higher returns.
This considers the risk of the investment, and is therefore a risk-adjusted measurement of returns.
Using the RORAC enables the Bank to manage its business more effectively, assess the real returns on its business - adjusted for the risk assumed - and to be more efficient in its business decisions.
Value creation
The profit generated in excess of the cost of economic capital. The Bank creates value when risk adjusted returns (measured by RORAC) exceed its cost of capital, and destroys value when the reverse occurs. This measures risk adjusted returns in absolute terms (monetary units), complementing the RORAC approach.
Expected loss
This is the loss due to insolvency that the entity will suffer over an economic cycle, on average. Expected loss considers insolvencies to be a cost that can be reduced by appropriate selection of loans.
Leverage ratio
This is a regulatory metric that monitors the solidity and robustness of a financial institution by comparing the size of the entity to its capital.
It is calculated as the ratio between Tier1 capital and leverage exposure, which considers the size of the balance sheet with certain adjustments for derivatives, security funding transactions and contingency accounts.
Control of capital risks is not just a question of complying with current regulatory ratios. The regulatory changes affecting the Group, our key regulatory capital figures and leverage ratio, economic capital, return on risk adjusted capital) and capital planning and stress tests performed by the Group to assure our solvency, are explained in the following sections.
D.8.2. Regulatory framework
The standards known as Basel III came into force in 2014, setting new global standards for banks’ capital and liquidity.
From the standpoint of capital, Basel III redefines what is considered as available capital in financial institutions (including new deductions and raising the requirements of eligible capital instruments), increases the minimum capital required, demands that institutions operate permanently with capital buffers and adds new requirements in the risks considered.
In Europe, the new standards have been implemented via EU directive 2013/36, known as CRD IV, and its regulations 575/2013 (CRR), which is directly, applied in all EU countries (Single Rule Book). These standards are also subject to regulatory developments entrusted to the European Banking Authority (EBA).
CRD IV was introduced into Spanish law through Act 10/2014 on the ordering, supervision and solvency of credit institutions, and its subsequent regulatory implementation through Royal Decree Act 84/2015. The CRR is directly applicable in Member States from 1 January 2014 and repeals those lower-ranking standards that entail additional capital requirements.
The CRR provides for a phase-in period that will allow institutions to adapt gradually to the new requirements in the European Union. The phase-in arrangements have been introduced into Spanish law through Bank of Spain Circular 2/2014. The phase-in affects both the new deductions from capital and the instruments and elements of capital that cease to be eligible as capital under the new regulations. The capital conservation buffers provided for in CRD IV will also be phased in gradually, starting in 2016 and reaching full implementation in 2019.

283
Risk Profile > Capital risk5. Risk management report
2015 ANNUAL REPORT
After it was implemented, the Basel Committee on Banking Supervision has said that it intends to amend the capital regulations in the following sections:
• Standard credit risk method (open for public consultation until March 2016).
• Standard market risk method (Fundamental review of trading book).
• Standard operational risk method (there will be a public consultation in early 2016).
• IRB Internal Models: reducing the eligible options in design of models, particularly in certain portfolios.
• Internal market models: allow supervisors to withdraw authorisation to use this on the trading desk, reduce hedge mitigation and reduce diversification mitigation.
• Operational risk internal models: a consultation will be made on whether to eliminate them.
• Securitisations: the treatment of securitisations which fit the definition of ‘simple, transparent and comparable’ will be modified.
• Minimum requirements ( floors): the BCBS has said that it intends to replace the current floor of 80% of RWA calculated under Basel I with floors consisting of one for each risk type, defined based on the new revised standard methods.
• Structural interest rate risk: the Committee has said that it intends to establish a capital requirement for the structural interest rate risk on banks’ balance sheets.
• Calibration of leverage ratio: a minimum benchmark of 3% has been established, and will be reviewed in 2017. In recent publications, both the BCBS and the EVA have recommended a ratio of between 4% and 5%. Its calibration is expected to be completed in 2016 and it should be implemented in 2018.
Most of these regulatory modifications will be defined in 2016.
Grupo Santander shares the ultimate objective that the regulator pursues with this new framework, which is to make the international financial system more stable and solid. For years Grupo Santander has collaborated by supporting regulators and taking part in the studies promoted by the Basel Committee and the European Banking Authority (EBA), and coordinated at the local level by the Bank of Spain to calibrate the regulations.
Lastly, the TLAC (Total Loss Absorption Capacity) required of Global Systemically Important Entities (G-SIBs) was approved in the last G-20 meeting held in Antalya in November 2015. This is a very important milestone in terms of regulation. The TLAC means that banks must have a sufficient buffer of liabilities (capital and convertible debt) to be able to absorb losses, either through conversion to capital or by accepting a ‘haircut’. The objective is that when facing a risk of insolvency, a bank should be able to recover its solvency without needing to be bailed out by national governments. This regulation is pending incorporation into the prevailing regulatory framework. However, the Financial Stability Board (FSB)
has set a 3-year implementation schedule, such that it comes into effect in 2019. This proposes a minimum requirement for January 2019 equivalent to the higher of 16% of risk-weighted assets or 6% of leverage exposure; and for January 2022, the higher of either 18% of risk-weighted assets or 6.75% of leverage exposure.
The regulation requires that liabilities eligible for computation in this requirement must be subordinate to other non-eligible liabilities, and may include common equity, preferred issues eligible as Tier1 capital, subordinated debt eligible as Tier2 capital and at least 33% in the form of senior and junior debt.
The regulation stipulates that this requirement should be met at the consolidated level and at the level of each resolution group, as defined in the living wills. It also sets down certain restrictions on the financial support that a parent can provide to a subsidiary to comply with these requirements.
In Europe, Directive 2014/59/EU, known as the ‘BRRD’, was implemented. The BRRD has similar goals to the TLAC regulation.
This Directive also includes the concept of loss absorption and a minimum required eligible liability (MREL) requirement, which is similar to the TLAC. However, there are some differences in the ratios established, the scope of application and certain other definitions. The MREL applies to all entities operating in Europe, and is not limited solely to systemically important institutions. This began to apply on 1 January 2016, based on an ‘bank by bank’ calibration, with a 48-month transition period. It only applies to EU territory.
The MREL will be reviewed at the end of 2016, following the EBA submitting a report to the European Commission.
Furthermore, in 2015 the European Banking Authority has conducted the 2015 transparency exercise, in which it published information on risk-weighted assets, capital, solvency, and the details of sovereign positions at December 2014 and 2015 for 105 banks from 21 European countries, covering 67% of total assets in the European banking system. This exercise was aimed to promote transparency and to provide information on European banks’ capital and solvency, encouraging market discipline and the Union’s financial stability. The results underscore Grupo Santander’s comfortable capital and solvency position, ahead of its peers in many core metrics.
D.8.3. Regulatory capital
The regulatory capital framework is based on three pillars:
• Pillar I sets the minimum capital requirement for credit, market and operational risk, allowing the possibility of using internal ratings and internal models (IRB approach) for calculating credit-risk-weighted exposures, internal models (VaR) for market risk and internal models for operational risk. The aim is to make the regulatory requirements more sensitive to the risks actually incurred by financial institutions in carrying on their business activities.
• Pillar II establishes a system of supervisory review, aimed at improving banks’ internal risk management and capital adequacy assessment in line with their risk profile.

284
Risk Profile > Capital risk5. Risk management report
2015 ANNUAL REPORT
• Lastly, Pillar III deals with financial information transparency and market discipline.
In 2015, the solvency target set was reached, despite negative one-off impacts. Our CET1 ratio fully loaded stands at 10.05% at the close of 2015, proving our organic capital generation capacity, which is of 10 b.p. a quarter. The key regulatory capital figures are indicated below:
Fully loaded Phase-in
Dec 15 Dec 14 Dec 15 Dec 14
Common equity (CET1) 58,705 48,129 73,478 64,250
Tier1 64,209 52,857 73,478 64,250
Capital total 76,205 60,394 84,346 70,483
Risk-weighted assets 583,893 582,207 585,633 585,621
CET1 Ratio 10.05% 8.27% 12.55% 10.97%
Tier1 Ratio 11.00% 9.08% 12.55% 10.97%
Total capital ratio 13.05% 10.37% 14.40% 12.03%
12.55
1.85
11.0
1.1
8.3
1.30.8
10.05
2.05
0.95
Capital%
Tier1 CET1 Tier2
Capital ratio
Capital ratio
Capital ratio
Capital ratio
Tier2
Tier2Tier2
Tier2
Tier1
Tier1
CET1
CET1CET1
CET1
10.4
12.013.05
14.4
Dec 14
Fully Loaded Phase In
Dec 14Dec 15 Dec 15
The table below shows risk-weighted assets (RWAs) in the main geographic areas and type of risk.
Grupo SantanderTotal RWAs: 583,893
Cifras en millones de euros
RestContinental Europe UK Latin America USTotal: 230,585 Total: 115,752 Total: 154,357 Total: 82,406 Total: 794
Total risks: Total risks: Total risks: Total risks: Total risks: Credit: 86% Credit: 85% Credit: 80% Credit: 86% Credit: 84% Operational: 8% Operational: 8% Operational: 17% Operational: 14% Operational: 7% Market: 6% Market: 7% Market: 3% Market: 0% Market: 9%
Deployment of modelsAs regards credit risk, Grupo Santander continued its plan to implement Basel’s advanced internal rating-based (AIRB) approach for almost all the Group’s banks (up to covering more than 90% of net exposure of the credit portfolio under these models). Meeting this objective in the short term will also be conditioned by the acquisition of new entities, as well as by the need for coordination between supervisors of the validation processes of internal models.
The Group operates in countries where the legal framework among supervisors is the same, as is the case in Europe via the Capital Directive. However, in other jurisdictions, the same process is subject to the cooperation framework between the supervisor in the home country and that in the host country with different legislations. This means, in practice, adapting to different criteria and calendars in order to attain authorisation for the use of advanced models on a consolidated basis.
Santander continued to pursue this objective during 2015 through its plan to gradually implement the necessary technology platforms and methodological improvements to be able to gradually apply the advanced IRB approach for the calculation of regulatory capital in the rest of the Group’s units.
Grupo Santander currently has the supervisory authorisation to use advanced approaches for calculating the regulatory capital requirements by credit risk for the parent bank and the main subsidiaries in Spain, United Kingdom, Portugal, and certain portfolios in Mexico, Brazil, Chile, Santander Consumer Finance Spain and the US. The strategy of implementing Basel in the Group is focused on achieving use of advanced models in the main institutions in the Americas and Europe. In 2015, authorisation was received for the vehicle portfolio of Santander Consumer Nordics, maintaining the IRB approach for the companies and retail portfolios of the joint venture with PSA Francia.

285
Risk Profile > Capital risk5. Risk management report
2015 ANNUAL REPORT
The current proportion of use of IRB and standard methods is as follows:
Exposure at default (EAD) %
Standard40%
Standard Permanent36%
IRB60%
Future Roll Out64%
With regard to operational risk, Grupo Santander currently applies the standard approach to calculating regulatory capital, as set out in the European Capital Directive. During 2015, the Group increased the pace of transformation towards an advanced operational risk management (AORM) approach. The AORM programme will help Grupo Santander to develop internal models for estimating capital in its main geographic areas, both for economic capital and stress testing, and for potential application as regulatory capital.
As regards the other risks explicitly addressed in Pillar I of the Basel Capital Accord, in terms of market risk the Santander Group has permission to use its internal model for the treasury trading activity in Spain, Chile, Portugal and Mexico, thus continuing the plan of gradual implementation for the rest of the units presented to the Bank of Spain.
Leverage ratioThe leverage ratio has been defined within the regulatory framework of Basel III as a measure of the capital required by financial institutions not sensitive to risk. The CRD IV was amended on 17 January 2015 by modifying Regulation (EU) no. 575/2013 to harmonise the calculation criteria with those set forth in the Basel III leverage ratio framework and disclosure requirements document by the BCBS.
This ratio is calculated as the ratio between Tier1 divided by the leverage exposure. This exposure is calculated as the sum of the following items:
• Accounting assets, without derivatives and not including items considered to be deductions in Tier1 (for example, it include the balance of loans but not the goodwill).
• Off-balance sheet items (guarantees, unused credit limits granted, documentary credits, in the main) weighted by the credit limits.
• Inclusion of the net value of derivatives (gains and losses are netted with the same counterparty, minus collaterals if they comply with certain criteria) plus a charge for the future potential exposure.
• A charge for the potential risk of security funding transactions.
• Lastly, it includes a charge for the risk of credit derivative swaps.
The ratios published by the Group since 2014 are indicated below:
4,5%
3,7%
5,2%
4,6%
5,5%
4,8%
5,4%
4,7%
5,4%
4,7%
Dec 14 Mar 15 Jun 15 Sep 15 Dec 15
Fully loaded leverage ratio
phase-in leverage
6,0
5,5
5,0
4,5
4,0
3,5
3,0
The leverage ratio is still undergoing calibration and it is not compulsory until 2018. For the time being, a reference of 3% has been set (the Bank’s ratio is higher). During this period, the only obligation is to disclose the data to the market. More details are available in the Prudential Relevance Report (Pillar III) which is published on the Group website.
Global systemically important financial institutionsGrupo Santander is one of the 30 entities which have been classified as global systematically importance banks (G-SIB).
The designation as a systemically important entity is based on a measurement established by the regulators (the FSB and BCBS) based on 5 criteria (size, cross-jurisdictional activity, interconnectedness with other financial institutions, substitutability and complexity). This information is requested annually from banks with leverage exposure in excess of EUR 200,000 million (76 banks in December 2014), which are required to disclose it (refer to the information on www.gruposantander.com).
Based on this information, Banco Santander scored 208.4 points.
The fact that Santander is considered as a G-SIB means it has to fulfil certain additional requirements, which consist mainly of a capital buffer (we are included in the group of banks with the smallest capital buffer, 1%), in TLAC requirements (total loss absorbing capacity), that we have to publish relevant information more frequently than other banks, greater regulatory requirements for internal control bodies, special supervision and drawing up of special reports to be submitted to supervisors.
The fact that Grupo Santander has to comply with these requirements makes it a more solid bank than its domestic rivals.
Refer to the Prudential Relevance Report (Pillar III) for more information.

286
Risk Profile > Capital risk5. Risk management report
2015 ANNUAL REPORT
D.8.4. Economic capital
Economic capital is the capital needed, in accordance with an internally developed model, to support all the risks of business with a certain level of solvency. In the case of Santander, the solvency level is determined by the long term rating objective of ‘A’ (two notches above Spain’s rating), which means a confidence level of 99.95% (above the regulatory 99.90%) to calculate the necessary capital.
Santander’s economic capital model includes in its measurement all significant risks incurred by the Group in its operations (risk of concentration, structural interest rate, business, pensions and others beyond the sphere of Pillar I regulatory capital). Moreover, economic capital incorporates the diversification impact, which in the case of Grupo Santander is vital, because of its multinational and business nature, in order to determine the global risk profile and solvency.
Economic capital is a key tool for the internal management and development of the Group’s strategy, both from the standpoint of assessing solvency, as well as risk management of portfolios and businesses.
From the solvency standpoint, the Group uses, in the context of Basel Pillar II, its economic model for the capital self-assessment process (ICAAP). For this, the business evolution and capital needs are planned under a central scenario and alternative stress scenarios. The Group is assured in this planning of maintaining its solvency objectives even in adverse scenarios.
The economic capital metrics also enable risk-return objectives to be assessed, setting the prices of operations on the basis of risk, evaluating the economic viability of projects, units and lines of business, with the overriding objective of maximising the generation of shareholder value.
As a homogeneous measurement of risk, economic capital can be used to explain the risk distribution throughout the Group, putting in a metric comparable activities and different types of risk.
The economic capital requirement at the end of December 2015 was EUR 71,671 million, EUR 20,706 million below the EUR 92,377 million available economic capital.
The table below sets out the available economic capital:
Million euros
Dec 15 Dec 14
Net capital and issue premiums 52,004 44,851
Reserves and retained profits 49,673 46,227
Valuation adjustments (15,448) (11,429)
Minority interests 6,148 4,131
Base economic capital available 92,377 83,780
Required economic capital 71,671 69,278
Excess Capital 20,706 14,502
The main difference with the regulatory CET1 comes from the treatment of goodwill and other intangibles, which we consider as one more requirement of capital instead of as a deduction from the available capital.
The distribution of economic capital needs by type of risk at the end of December 2015 is shown in the following chart:
Credit 26,893Goodwill 19,178Market 8,227Interest (ALM) 2,550Operational 3,233Business 3,226Material assets 1,838Other 6,527
TOTAL ECONOMIC CAPITAL 71,671
Credit38%
Goodwill27%
Market 11%
Interest (ALM)
4%
Operational4%
Business4%
Material assets3% Other
9%
Million euros
The table below sets out Grupo Santander’s distribution by types of risk and geographic area at the end of December 2015:
Grupo SantanderTotal requirements:
Cifras en millones de euros
Corporate centre Continental Europe
71,671
UK Latin America US25,503 19,265 8,159 10,840 7,904
Total risks: Total risks: Total risks: Total risks: Total risks:
Goodwill: 75% Credit: 54% Credit: 61% Credit: 58% Credit: 64% Market: 20% Market: 10% Structural (pensions): 15% Structural (interest): 10% Operational: 9% DTAs: 4% DTAs: 10% Operational: 9% DTAs: 9% Material assets: 7% Other: 1% Business: 7% Business: 7% Business: 8% Intangible assets: 6%
Other: 19% Other: 8% Other: 15% Business: 6% Other: 9%

287
Risk Profile > Capital risk5. Risk management report
2015 ANNUAL REPORT
The distribution of economic capital among the main business areas reflects the diversified nature of the Group’s business and risk. Continental Europe represents 42% of the capital, Latin America including Brazil 23%, the United Kingdom 18% and the United States 17%.
Outside the operating areas, the corporate centre assumes, principally, the risk from goodwill and the risk derived from the exposure to structural exchange rate risk (risk derived from maintaining stakes in subsidiaries abroad denominated in currencies other than the euro).
The benefit of diversification contemplated in the economic capital model, including both the intra-risk diversification (equivalent to geographic) as well as inter-risks amounted to approximately 30%.
Return on risk adjusted capital (RORAC) and creation of valueGrupo Santander has been using RORAC methodology in its credit risk management since 1993 in order to:
• Calculate the consumption of economic capital and the return on it of the Group’s business units, as well as segments, portfolios and customers, in order to facilitate optimum assigning of economic capital.
• Measurement of the Group units’ management, using budgetary tracking of capital consumption and RORAC.
• Analyse and set prices in the decision-taking process for operations (admission) and clients (monitoring).
RORAC methodology enables one to compare, on a like-for- like basis, the return on operations, customers, portfolios and businesses, identifying those that obtain a risk- adjusted return higher than the cost of the Group’s capital, aligning risk and business management with the intention of maximising the creation of value, the ultimate aim of the Group’s senior management.
The Group regularly assesses the level and evolution of value creation (VC) and the risk-adjusted return (RORAC) of its main business units. The VC is the profit generated above the cost of the economic capital (EC) employed, and is calculated as follows:
Value creation =profit – (average EC x cost of capital).
The profit used is obtained by making the necessary adjustments to the accounting profit so as to extract just the recurrent profit that each unit generates in the year of its activity.
The minimum return on capital that an operation must attain is determined by the cost of capital, which is the minimum required by shareholders. It is calculated objectively by adding to the free return of risk the premium that shareholders demand to invest in our Group. This premium depends essentially on the degree of volatility in the price of the Banco Santander share in relation to the market’s performance. The Group’s cost of capital for 2015 was 9.31% (vs. 11.59% the previous year, in which there was greater market volatility).
The Group’s internal management includes an annual revision of the cost of capital and also an estimated cost of capital for each business unit, taking into account the specific features of each
market, under the philosophy of subsidiaries autonomous in capital and liquidity, in order to assess if each business is capable of generating value individually.
A positive return from an operation or portfolio means it is contributing to the Group’s profits, but it is only creating shareholder value when that return exceeds the cost of capital.
The performance of the business units in 2015 in value creation varied. The Group’s results, and thus the RORAC figures and value creation, are conditioned by the different evolution of the economic cycle in the Group’s units.
The creation of value and the RORAC for the Group’s main business areas at December 2015 are shown below:
Dec 15 Dec 14
Value Value Main segments RORAC creation RORAC creation
Continental Europe 13.9% 883 13.6% 358
UK 22.5% 1,065 20.4% 634
Latin America 33.8% 2,746 29.7% 2,401
US 13.4% 308 19.5% 412
Total business units 20.2% 5,001 20.4% 3,805
D.8.5. Planning of capital and stress exercisesStress tests on capital have become particularly important as a dynamic evaluation tool of the risks and solvency of banks. A new model of evaluation, based on a dynamic (forward-looking) approach, is becoming a key element for analysing the solvency of banks.
It is a forward-looking assessment, based on macroeconomic as well as idiosyncratic scenarios of little probability but plausible. It is necessary to have for it robust planning models, capable of transferring the impact defined in projected scenarios to the different elements that influence the bank’s solvency.
The ultimate objective of the stress exercises is to carry out a full assessment of the risks and solvency of banks, which enables possible capital requirements to be calculated in the event that they are needed because of banks’ failure to meet the capital objectives set, both regulatory and internal.
Internally, Grupo Santander has defined a process of stress and capital planning not only to respond to the various regulatory exercises, but also as a key tool integrated in the Bank’s management and strategy.
The goal of the internal process of stress and capital planning is to ensure sufficient current and future capital, including for adverse though plausible economic scenarios. Starting from the Group’s initial situation (defined by its financial statements, capital base, risk parameters and regulatory ratios), the envisaged results are estimated for different business environments (including severe recessions as well as ‘normal’ macroeconomic situations), and the Group’s solvency ratios are obtained for a period usually of three years.

288
Risk Profile > Capital risk5. Risk management report
2015 ANNUAL REPORT
This process provides a comprehensive view of the Group’s capital for the time frame analysed and in each of the scenarios defined. It incorporates the metrics of regulatory capital, economic capital and available capital.
The structure of the process is shown below:
1
2
3
4
5
Macroeconomic scenarios
Projection of the balance sheet and income statement
Projection of capital requirements
Solvency analysis
Action plan
Central and of recession Idiosyncratic: based on specific risks Multiannual time frame
Projection of volumes. Business strategy Spreads and cost of funding Commissions and operating costs Market shocks and operational losses Credit losses and provisions. PD and LGD PIT models
Consistent with the projected balance sheet Risk parameters (PD, LGD and EaD)
Capital base available. Profit and dividends Impact of regulations and regulatory requirements Capital and solvency ratios Compliance with capital objectives
In the event of not meeting objectives or regulatory requirements
The structure facilitates achieving the ultimate objective which is capital planning, by turning it into an element of strategic importance for the Group which:
• Ensures the solvency of current and future capital, including in adverse economic scenarios.
• Enables comprehensive management of capital and incorporates an analysis of the specific impacts, facilitating their integration into the Group’s strategic planning.
• Enables a more efficient use of capital.
• Supports the design of the Group’s capital management strategy.
• Facilitates communication with the market and supervisors.
In addition, the whole process is developed with the maximum involvement of senior management and its close supervision, as well as under a framework that ensures that the governance is the suitable one and that all elements that configure it are subject to adequate levels of challenge, review and analysis.
One of the key elements in capital planning and stress analysis exercises, due to its particular importance in forecasting the income statement under defined stress scenarios, consists of calculating the provisions needed under these scenarios, mainly those to cover losses in the credit portfolio. Specifically, to calculate credit portfolio loan loss provisions, Grupo Santander uses a methodology that ensures that at all times there is a level of provisions that covers all the projected credit losses for its internal models of expected loss, based on the parameters of Exposure at Default (EaD), Probability of Default (PD) and Loss Given Default (LGD).
This methodology is widely accepted and it similar to that used in previous stress exercises (for example, the EBA stress exercises in 2011 and 2014 or the health check on the Spanish banking sector in 2012).
Lastly, the capital planning and stress analysis process culminates with analysis of solvency under the various scenarios designed and over a defined time frame, in order to assess the sufficiency of capital and ensure the Group fulfils both the capital objectives defined internally as well as all the regulatory requirements.

289
Risk Profile > Capital risk5. Risk management report
2015 ANNUAL REPORT
Quantification of capital sufficiency
Initial capital base
++
Retained earnings 1
Changes in regulations 21 Dividend
policies
Final capital base 2 Regulatory changes arising from Basel III that may modify both the capital
Stress capital requirements base and the requirements
+ Changes in regulations 2
Final capital requirements
As already mentioned, as well as the regulatory exercises of stress, Grupo Santander annually conducts since 2008 internal exercises of resilience within its self-assessment process of capital (Pillar II). All of them showed, in the same way, Grupo Santander’s capacity to face the most difficult scenarios, both globally as well as in the main countries in which it operates.
In the event of not meeting the capital objectives set, an action plan will be prepared which envisages the measures needed to be able to attain the desired minimum capital. These measures are analysed and quantified as part of the internal exercises, although it is not necessary to put them into force as Santander exceeds the minimum capital thresholds.
This internal process of stress and capital planning is conducted in a transversal way throughout Grupo Santander, not only at the consolidated level, but also locally in the Group’s units as they use the process of stress and capital planning as an internal management tool and to respond to their local regulatory requirements.
Throughout the recent economic crisis, Grupo Santander was submitted to five stress tests which demonstrated its strength and solvency in the most extreme and severe macroeconomic scenarios. All of them, thanks mainly to the business model and geographic diversification in the Group, showed that Banco Santander will continue to generate profits for its shareholders and comply with the most demanding regulatory requirements.
In the first (CEBS 2010), the Group was the entity with a low impact on its solvency ratio, except for those banks that benefited from not distributing a dividend. In the second, carried out by the EBA in 2011, Santander was not only among the small group of banks that improved their solvency in the stress scenario, but also the bank with the highest profits.
In the stress exercises conducted by Oliver Wyman on Spanish banks in 2012 (top-down and then bottom-up), Banco Santander again showed its strength to give with full solvency the most extreme economic scenarios. It was the only bank that improved its core capital ratio, with a surplus of more than EUR 25,000 million over the minimum requirement.
Lastly, in the recent stress test carried out in 2014 by the European Central Bank, in conjunction with the European Banking Authority, Grupo Santander was the bank with the smallest impact from the adverse scenario among its international peers (EUR 20,000 million capital surplus above the minimum requirement). These results show, once again, that Grupo Santander’s business model enables it to face with greater robustness the most severe international crises.

290
Appendix: Edtf transparency5. Risk management report
2015 ANNUAL REPORT
EXECUTIVE SUMMARYA. PILLARS OF THE RISK FUNCTIONB. RISK CONTROL AND MANAGEMENT MODEL C. BACKGROUND AND UPCOMING CHALLENGESD. RISK PROFILEAPPENDIX: EDTF TRANSPARENCY
Appendix: EDTF transparencyBanco Santander has traditionally maintained a clear commitment to transparency. By virtue of this transparency, it has played an active role in the Enchanced Disclosure Task Force (EDTF) promoted by the Financial Stability Board (FSB) in order to improve the quality and comparability of the risk information that banks provide to the market. Several studies have analysed the degree of adoption of
the 32 recommendations formulated by the EDTF in October 2012, in which Santander stands out as one of the banks that is leading globally the practical application of this initiative.
The table below sets out where the EDTF recommendations can be found in the information published by Grupo Santander.
EDTF recommendations Annual report*
Audit report and annual accounts * IRP (Pillar III) *
General
1 Index with risk information Executive summary Appendix V; Appendix VI; 3.4
2 Terminology and risk measures B.1.; D.1.5.; D.2.1.-D.2.4.; D.3.2.
Notes 54b, 54c, 54d, 54e Appendix IV
3 Top and emerging risk C 5.2; 5.3.7
4 New regulatory ratios and compliance plans D.1.; D.3.; D.8. Notes 54c, 54e, 54j 1; 4.6.3.2- 6.5.3.3
Risk governance and risk management and business model
5 Organisation of risk management, processes and functions B; D.3.2. Notes 54b, 54e 5; 4.2; 4.3; 4.46 Risk culture and internal measures A; B.4. Notes 54a, 54b 57 Business model risks, risk management and appetite B; D.8. Notes 54b, 54j 5.1; 5.3; 11.8;
8 Stress test uses and processB.3.1.-B.3.3.; D.1.5.; D.2.2.-D.2.3.; D.3.2.; D.8.4.
Notes 54b, 54c, 54d, 54e, 54j 4.7.1
Capital adequacy and risk-weighted assets
9 Minimum capital requirements (Pillar I) D.8. Note 54j Executive summary; 4.6.1: 4.6.3; 4.6.4
10 Composition of regulatory capital and reconciliation to the balance sheet
3.6; 4.6.1Anexo III.a y III.c
11 Flow statement of movements in regulatory capital 4.6; 4.6.1; Appendix III.b; Appendix III.c
12 Capital planning D.8.4. Note 54j 4.7.113 Business activities and RWAs D.8. Note 54j 4.6.314 Capital requirements by method of calculation and portfolio 4.6; 4.6.3;6.415 Credit risk by Basel portfolios 4.6.3.1.1; 6.2-6.4
16 RWA flow statement by type of risk Executive summary; 4.6.3.1; 4.6.3.3; 4.6.3.4
17 Backtesting of models (Pillar III) 6.7; 6.9; 8.2.5Liquidity 18 Liquidity needs, management and liquidity reserve D.3.2.; D.3.3. Note 54e 9
Funding
19 Encumbered and unencumbered assets D.3.3. Note 54e 9.3.2 (IV.)
20 Contractual maturities of assets, liabilities and off-balance sheet balances D.3.3. Note 54e -
21 Funding plan D.3.3.; D.3.4 Note 54e 9.3
Market risk
22 Balance sheet reconciliation to trading and non-trading positions D.2.2. Note 54d - 23 Significant market risk factors D.2.1.-D.2.3. Note 54d 8.1; 8.224 Market risk measurement model limitations D.2.2. Note 54d 8.2; 8.2.6
25 Management techniques for measuring and assessing the risk of loss D.2.2. Note 54d 8.2.1; 8.2.2; 8.2.3; 8.2.4; 8.2.5
Credit risk
26 Credit risk profile and reconciliation to balance sheet items D.1.2. Note 54c 6.2
27 Policies for impaired or non-performing loans and forbearance portfolio D.1.2. Note 54c -
28 Conciliation of non-performing loans and provisions D.1.2. Note 54c 6.229 Counterparty risk resulting from derivative transactions D.1.4. Note 54c 6.1030 Credit risk mitigation D.1.5. Note 54c 6.11
Other risks31 Other risks D.4.; D.6.; D.7. Notes 54f, 54h, 54i 10; 11; 1232 Discussion of risk events in the public domain D.5. Note 54g 11
IFRS 9
The recommendations regarding the adoption of IFRS 9 which transversally affect the various EDTF recommendations can be consulted in table 1 (pg. 194-196) which outlines the proposed model and the implementation strategy as well as the regulatory and complementary guidelines
C (Table 1)
* The location refers to chapters or sections of this Annual report. In the case of capital recommendations and risk-weighted assets, they also refer to sections of the information of Prudential Relevance (Pillar III). In addition, the navigation map has the cross-references of the information published by the Group (Annual report, Pillar III, Auditor’s report and annual consolidated accounts).

Annex

292
2015 AnnUAl rEportAnnex
Annex
Historical data. 2005 - 2015
2015 2014 2013 2012 2011
Balance sheet Mill. US$ € Million € Million € Million € Million € Million
Total assets 1,459,141 1,340,260 1,266,296 1,134,128 1,282,880 1,251,008
Net customer loans 860,996 790,848 734,711 684,690 731,572 748,541
Customer deposits 743,715 683,122 647,628 607,836 626,639 632,533
Customer funds under management 1,170,967 1,075,565 1,023,437 946,210 990,096 984,353
Stockholders' equity 95,849 88,040 80,806 70,327 71,797 74,459
Total managed funds 1,640,149 1,506,520 1,428,083 1,270,042 1,412,617 1,382,464
Income statement
Net interest income 35,688 32,189 29,548 28,419 31,914 28,883
Gross income 50,192 45,272 42,612 41,920 44,989 42,466
Net operating income 26,278 23,702 22,574 21,762 24,753 23,055
Profit before taxes 10,584 9,547 10,679 7,378 3,565 7,858
Attributable profit to the Group 6,614 5,966 5,816 4,175 2,283 5,330
2015 2014 2013 2012 2011
Per share data (1) US$ Euros Euros Euros Euros EurosAttributable profit to the Group 0.45 0.40 0.48 0.39 0.23 0.60
Dividend 0.22 0.20 0.60 0.60 0.60 0.60
Share price 4.962 4.558 6.996 6.506 6.100 5.870
Market capitalisation (million) 71,628 65,792 88,041 73,735 62,959 50,290
Euro / US$ = 1.089 (balance sheet) and 1.109 (income statement)(1) Figures adjusted to capital increase in 2008.

293
2015 AnnUAl rEportAnnex
Historical data. 2005 - 2015
2010 2009 2008 2007 2006 2005
€ Million € Million € Million € Million € Million € Million
1,217,501 1,110,529 1,049,632 912,915 833,873 809,107
724,154 682,551 626,888 571,099 523,346 435,829
616,376 506,976 420,229 355,407 331,223 305,765
985,269 900,057 826,567 784,872 739,223 651,360
75,018 69,678 57,587 55,200 44,852 39,778
1,362,289 1,245,420 1,168,355 1,063,892 1,000,996 961,953
27,728 25,140 20,019 14,443 12,480 10,659
40,586 38,238 32,624 26,441 22,333 19,076
22,682 22,029 17,807 14,417 11,218 8,765
12,052 10,588 10,849 10,970 8,995 7,661
8,181 8,943 8,876 9,060 7,596 6,220
2010 2009 2008 2007 2006 2005
Euros Euros Euros Euros Euros Euros
0.94 1.05 1.22 1.33 1.13 0.93
0.60 0.60 0.63 0.61 0.49 0.39
7.928 11.550 6.750 13.790 13.183 10.396
66,033 95,043 53,960 92,501 88,436 69,735

294
2015 ANNUAL REPORT
General information
Banco Santander, S.A.The parent group of Grupo Santander was established on 21 March 1857 and incorporated in its present form by a public deed executed in Santan-der, Spain, on 14 January 1875, recorded in the Mercantile Registry of the Finance Section of the Government of the Province of Santander, on folio 157 and following, entry number 859. The Bank’s By-laws were amended to conform with current legislation regarding limited liability companies. The amendment was registered on 8 June 1992 and entered into the Mer-cantile Registry of Santander (volume 448, general section, folio 1, page 1,960, first inscription of adaptation).
The Bank is also recorded in the Special Registry of Banks and Bankers 0049, and its fiscal identification number is A-390000013. It is a member of the Bank Deposit Guarantee Fund.
Registered officeThe Corporate By-laws and additional public information regarding the Company may be inspected at its registered office at Paseo de la Pereda, numbers 9 to 12, Santander.
Corporate centerSantander Group CityAvda. de Cantabria s/n28660 Boadilla del MonteMadridSpain
General informationTelephone: 902 11 22 11 (Central Services)Telephone: 91 289 00 00 (Customer support central services)
www.santander.com
Investors and Shareholder RelationsSantander Group CityEdificio Marisma, Planta BajaAvenida de Cantabria, s/n.28660 Boadilla del MonteMadridSpainTelephone: +34 91 276 92 90
Relations with investors and analystsSantander Group CityEdificio Pereda, 1ª plantaAvda. de Cantabria s/n28660 Boadilla del MonteMadrid SpainTelephone: +34 91 259 65 14
Customer attention departmentSantander Group CityAvda. de Cantabria s/n28660 Boadilla del MonteMadridSpainTelephone: 91 257 30 80Fax: 91 254 10 [email protected]
OmbudsmanMr José Luis Gómez-Dégano,Apartado de Correos 1401928080 MadridSpain
This report was printed on ecologically
friendly paper and has been produced using
environmentally friendly processes.
© February 2016, Grupo Santander
Photographs:
Miguel Sánchez Moñita, Lucía M. Diz,
Stephen Hyde, Javier Vázquez, Beto Adame
Production:
MRM Worldwide
All customers, shareholders and the general public
can use Santander’s official social network channels
in all the countries in which the Bank operates.


www.santander.com