20140109 Energy Northwest Losses 16 RA · 1/25/2014 · 3. The losses are partially offset by a...
23
MCCULLOUGH RESEARCH ROBERT F. MCCULLOUGH, JR. PRINCIPAL 6123 REED COLLEGE PLACE ● PORTLAND ● OREGON ● 97202 ● 503-777-4616 ● ROBERT@MRESEARCH.COM Date: January 25, 2014 To: McCullough Research Clients From: Robert McCullough Subject: Energy Northwest Losses in the 2013 Forward Purchase of Nuclear Fuel On May 15 and May 16, 2012, Energy Northwest signed contracts with the U.S. De- partment of Energy (DOE), the United States Enrichment Corporation (USEC), and the Tennessee Valley Authority (TVA) as part of a politically motivated transaction to subsidize the ailing owner of the Paducah Gaseous Diffusion Enrichment Facility at Paducah, Kentucky. A condition set by the Energy Northwest board was that the transaction should show at least a $50 million net present value: Financial Requirements • At least $50 million in Net-Present Value at a 12 percent discount rate needs to be assumed 1 There is a serious question whether the transaction ever did meet that condition. At the time of the March 26, 2012 and April 10, 2012 board meetings, the net present value of the transaction was -$150 million in Energy Northwest’s own calculations. 2 Actually, the transaction was even less attractive since the market prices had fallen from the assumed levels and the choice of discount rate was questionable. The most direct way to understand the potential losses is: 1 Energy Northwest. 2012 Uranium Enrichment Program. 26 Apr. 2012. Page 7. 2 Energy Northwest. Pre-Meeting Materials Package. 26 Apr. 2012. Page 37.
Transcript of 20140109 Energy Northwest Losses 16 RA · 1/25/2014 · 3. The losses are partially offset by a...

MCCULLOUGH RESEARCH ROBERT F. MCCULLOUGH, JR. PRINCIPAL
6123 REED COLLEGE PLACE ● PORTLAND ● OREGON ● 97202 ● 503-777-4616 ● [email protected]
Date: January 25, 2014 To: McCullough Research Clients From: Robert McCullough Subject: Energy Northwest Losses in the 2013 Forward Purchase of Nuclear Fuel On May 15 and May 16, 2012, Energy Northwest signed contracts with the U.S. De-partment of Energy (DOE), the United States Enrichment Corporation (USEC), and the Tennessee Valley Authority (TVA) as part of a politically motivated transaction to subsidize the ailing owner of the Paducah Gaseous Diffusion Enrichment Facility at Paducah, Kentucky. A condition set by the Energy Northwest board was that the transaction should show at least a $50 million net present value:
Financial Requirements • At least $50 million in Net-Present Value at a 12 percent discount rate needs to be assumed1
There is a serious question whether the transaction ever did meet that condition. At the time of the March 26, 2012 and April 10, 2012 board meetings, the net present value of the transaction was -$150 million in Energy Northwest’s own calculations.2 Actually, the transaction was even less attractive since the market prices had fallen from the assumed levels and the choice of discount rate was questionable. The most direct way to understand the potential losses is:
1 Energy Northwest. 2012 Uranium Enrichment Program. 26 Apr. 2012. Page 7. 2 Energy Northwest. Pre-Meeting Materials Package. 26 Apr. 2012. Page 37.
MCCULLOUGH RESEARCH
Energy Northwest Losses in the 2013 Forward Purchase of Nuclear Fuel January 25, 2014 Page 2 ________________
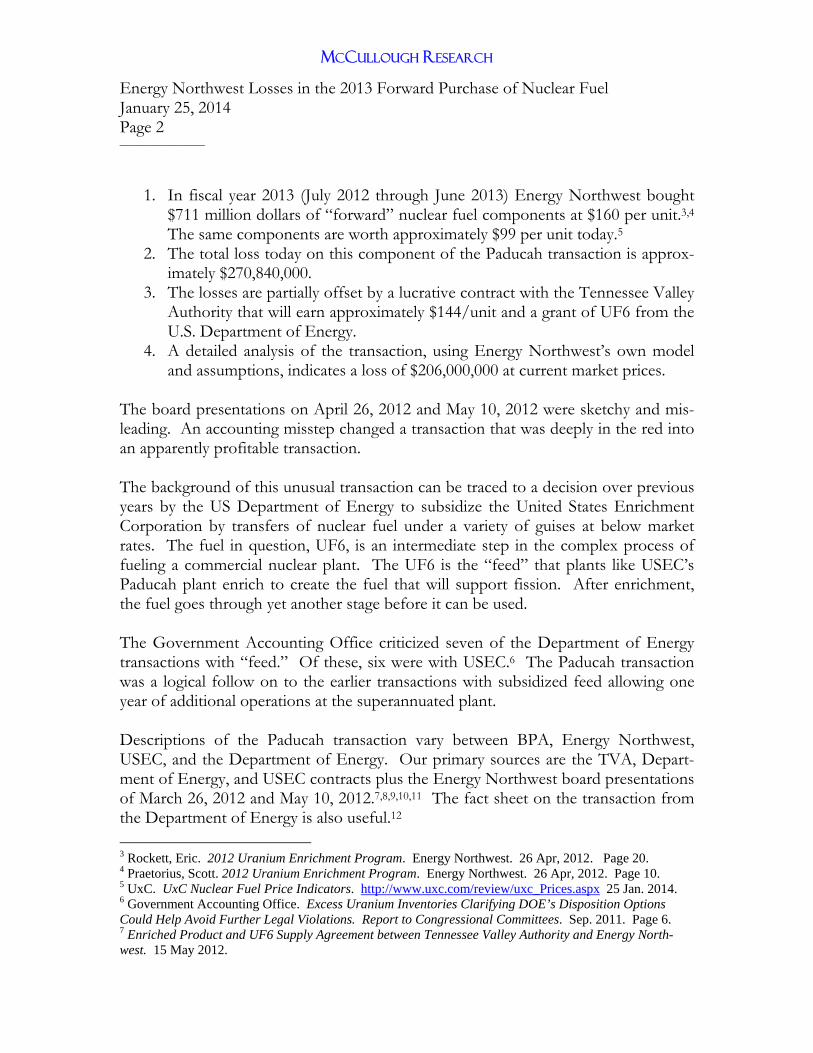
1. In fiscal year 2013 (July 2012 through June 2013) Energy Northwest bought $711 million dollars of “forward” nuclear fuel components at $160 per unit.3,4 The same components are worth approximately $99 per unit today.5
2. The total loss today on this component of the Paducah transaction is approx-imately $270,840,000.
3. The losses are partially offset by a lucrative contract with the Tennessee Valley Authority that will earn approximately $144/unit and a grant of UF6 from the U.S. Department of Energy.
4. A detailed analysis of the transaction, using Energy Northwest’s own model and assumptions, indicates a loss of $206,000,000 at current market prices.
The board presentations on April 26, 2012 and May 10, 2012 were sketchy and mis-leading. An accounting misstep changed a transaction that was deeply in the red into an apparently profitable transaction. The background of this unusual transaction can be traced to a decision over previous years by the US Department of Energy to subsidize the United States Enrichment Corporation by transfers of nuclear fuel under a variety of guises at below market rates. The fuel in question, UF6, is an intermediate step in the complex process of fueling a commercial nuclear plant. The UF6 is the “feed” that plants like USEC’s Paducah plant enrich to create the fuel that will support fission. After enrichment, the fuel goes through yet another stage before it can be used. The Government Accounting Office criticized seven of the Department of Energy transactions with “feed.” Of these, six were with USEC.6 The Paducah transaction was a logical follow on to the earlier transactions with subsidized feed allowing one year of additional operations at the superannuated plant. Descriptions of the Paducah transaction vary between BPA, Energy Northwest, USEC, and the Department of Energy. Our primary sources are the TVA, Depart-ment of Energy, and USEC contracts plus the Energy Northwest board presentations of March 26, 2012 and May 10, 2012.7,8,9,10,11 The fact sheet on the transaction from the Department of Energy is also useful.12 3 Rockett, Eric. 2012 Uranium Enrichment Program. Energy Northwest. 26 Apr, 2012. Page 20. 4 Praetorius, Scott. 2012 Uranium Enrichment Program. Energy Northwest. 26 Apr, 2012. Page 10. 5 UxC. UxC Nuclear Fuel Price Indicators. http://www.uxc.com/review/uxc_Prices.aspx 25 Jan. 2014. 6 Government Accounting Office. Excess Uranium Inventories Clarifying DOE’s Disposition Options Could Help Avoid Further Legal Violations. Report to Congressional Committees. Sep. 2011. Page 6. 7 Enriched Product and UF6 Supply Agreement between Tennessee Valley Authority and Energy North-west. 15 May 2012.
MCCULLOUGH RESEARCH
Energy Northwest Losses in the 2013 Forward Purchase of Nuclear Fuel January 25, 2014 Page 3 ________________
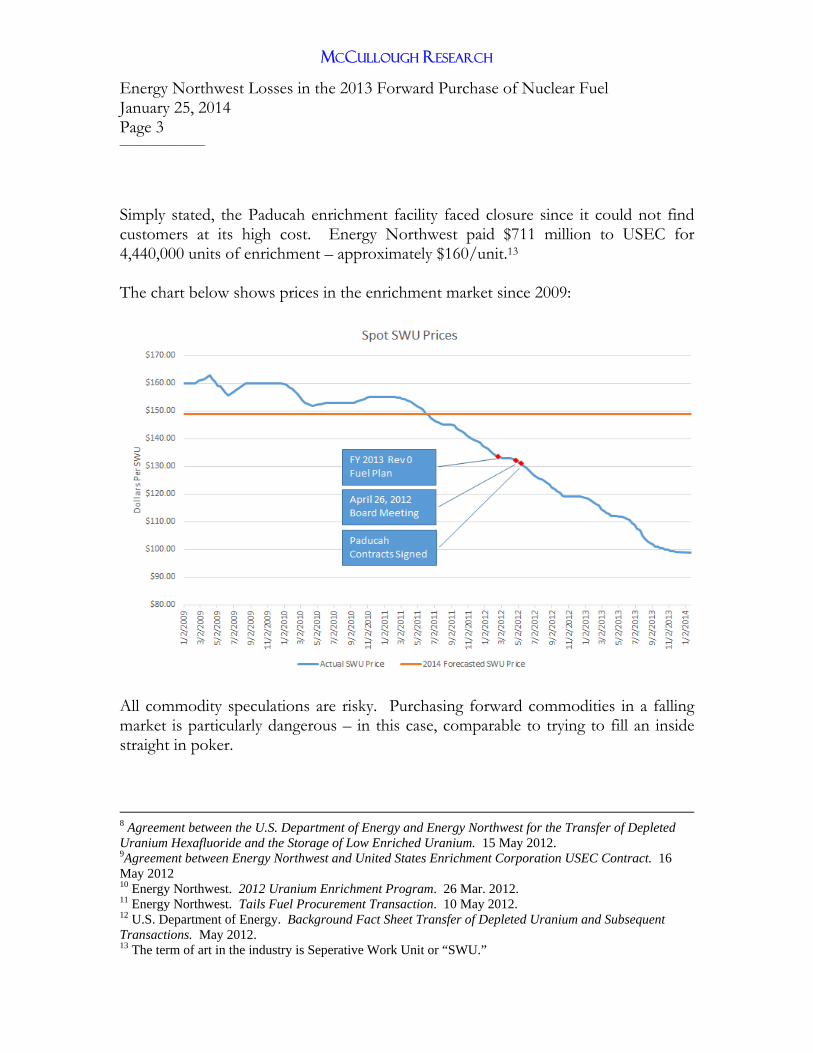
Simply stated, the Paducah enrichment facility faced closure since it could not find customers at its high cost. Energy Northwest paid $711 million to USEC for 4,440,000 units of enrichment – approximately $160/unit.13 The chart below shows prices in the enrichment market since 2009:
All commodity speculations are risky. Purchasing forward commodities in a falling market is particularly dangerous – in this case, comparable to trying to fill an inside straight in poker.
8 Agreement between the U.S. Department of Energy and Energy Northwest for the Transfer of Depleted Uranium Hexafluoride and the Storage of Low Enriched Uranium. 15 May 2012. 9Agreement between Energy Northwest and United States Enrichment Corporation USEC Contract. 16 May 2012 10 Energy Northwest. 2012 Uranium Enrichment Program. 26 Mar. 2012. 11 Energy Northwest. Tails Fuel Procurement Transaction. 10 May 2012. 12 U.S. Department of Energy. Background Fact Sheet Transfer of Depleted Uranium and Subsequent Transactions. May 2012. 13 The term of art in the industry is Seperative Work Unit or “SWU.”

MCCULLOUGH RESEARCH
Energy Northwest Losses in the 2013 Forward Purchase of Nuclear Fuel January 25, 2014 Page 4 ________________
USEC received the Paducah plant from the U.S. Department of Energy in 2000. The plant is a sixty year old enrichment facility using gaseous diffusion technology from the Manhattan Project. Modern enrichment facilities are significantly more cost ef-fective and energy efficient. The new Eunice enrichment facility in New Mexico, for example, uses only a fraction of the electricity (6%) required to enrich nuclear fuel at Paducah. The introduction of the new technology has reduced prices markedly in the world market for nuclear fuel enrichment. It has also caused the closure of nearly all plants using the older technology. Like many other commodities, nuclear fuel enrichment has fallen dramatically since 2009 when it reached the price of $162.40/unit. Since then the price has fallen continuously. Today, the spot price is approximately $99/unit. In this specific case, the fall in price was predictable. The new technology allows en-richment at a dramatically lower cost. As the older plants like Paducah have faced the falling costs, they have gradually been removed from service. Starting 2015 and ending in 2022, the Tennessee Valley Authority will pay $732,000,000 million for most of the transaction.14 Unfortunately, the delay in their payments reduces the value considerably. Since enriched nuclear fuel is storable at lit-tle or no cost, TVA could have purchased all of their share immediately – as did En-ergy Northwest for their share. The delay in delivering enriched fuel components to TVA has no operational meaning except as a method to reduce the effective cost of TVA’s purchases. The table below is taken from the March 26, 2012 board presentation. It represents a simple spreadsheet evaluation of the transaction. It is a bit difficult to read since the flow of calculations is not obvious. It can also prove challenging since several of the cells in the “subtotal” column would appear to be in error.15
14 TVA’s share is different for “feed” and enrichment. They will receive 2,900,000 SWUs of the 4,440,000 processed at USEC, for example. 15 The column entitled “subtotal” is the simple total of the values to the right on the same row. The Energy Northwest subtotals for the “10yr Fuel Plan Purchases – Project” should be -357, not -912. The subtotal for “10yr Fuel Plan Purchases - No Project” should be 760, not 1,314. Curiously, the materials from Bank of America corrected the error, but inserted fuel costs for FY 2012, which was also in error. See page 17 of the Pre-Meeting Materials Package.

MCCULLOUGH RESEARCH
Energy Northwest Losses in the 2013 Forward Purchase of Nuclear Fuel January 25, 2014 Page 5 ________________
16
The net present value benefit of the transaction at a 12% discount rate is the number outlined in yellow at the bottom. This is the present value of the “EN Budget” row. The EN Budget row is the sum of the rows entitled “Interest Payments”, “Principal Payments”, “Forward Sales,” “10yr Fuel Plan Purchases – Project,” and “10yr Fuel Plan Purchases – No Project.” The first column, “subtotal”, is not actually used in the calculation and poses some difficulties. The column is generally the simple sum of the values to its right. In two cases, “10yr Fuel Plan Purchases – Project” and “10yr Fuel Plan Purchases – No Pro-ject,” it reports erroneous totals. The errors do not affect the conclusions of the model. The “Interest Payments” and “Principal Payments” reflect the bonds issued to pay for the fuel and these values are not calculated in this spreadsheet. The forward sales are the proceeds from the TVA contract assuming that no delays have been elected by TVA.17 The last two rows are the most important -- “10yr Fuel Plan Purchases – Project” and “10yr Fuel Plan Purchases – No Project.” These values are taken from the 2013 16 Praetorius, Scott. 2012 Uranium Enrichment Program. Energy Northwest. 26 Apr, 2012. Page 12. 17 Enriched Product and UF6 Supply Agreement between Tennessee Valley Authority and Energy North-west. 15 May 2012. Pages 8 And 16.

MCCULLOUGH RESEARCH
Energy Northwest Losses in the 2013 Forward Purchase of Nuclear Fuel January 25, 2014 Page 6 ________________
Fuel Plan Revision 0 and Revision 1.18,19 Since Energy Northwest has not posted these documents for the past five years, I have attached the relevant pages as At-tachment A. The basic logic of the Energy Northwest spreadsheet is that the final NPV benefit or loss is equal to the amount of financing savings, the forward sales proceeds, and the fuel savings minus the $711 million capital cost. Given the difficulty of reading the Energy Northwest spreadsheet, it is easier to un-derstand when the calculations are conducted in the more common top-down and left to right format. The following spreadsheet restates the Energy Northwest calcu-lations in a more user-friendly fashion:
18 Praetorius, Scott. FY 2013 Fuel Management Plan Rev. 0. Energy Northwest. Mar. 2012. 19 Praetorius, Scott. FY 2013 Fuel Management Plan Rev. 1. Energy Northwest. July 2013.
Year InvestmentTVA
Revenues
Net Fuel
SavingsTotal Year
Bond
ProceedsInterest Principal Total
Source
April 26,
2012 Board
Briefing
TVA
Contract
2013 Fuel
Plan Rev. 0
and 2013
Fuel Plan
Rev. 1
April 26,
2012
Board
Briefing
April 26,
2012
Board
Briefing
FY 2013 (711)$ ‐$ ‐$ (711)$ FY 2013 711$ (17)$ ‐$ 694$
FY 2014 ‐$ 4$ 4$ FY 2014 (17)$ ‐$ (17)$
FY 2015 70$ 3$ 73$ FY 2015 (17)$ (70)$ (87)$
FY 2016 24$ 53$ 77$ FY 2016 (16)$ (24)$ (40)$
FY 2017 25$ (7)$ 18$ FY 2017 (16)$ (25)$ (41)$
FY 2018 110$ 37$ 147$ FY 2018 (16)$ (109)$ (125)$
FY 2019 281$ ‐$ 281$ FY 2019 (13)$ (279)$ (292)$
FY 2020 26$ 68$ 94$ FY 2020 (6)$ (26)$ (32)$
FY 2021 129$ 32$ 161$ FY 2021 (6)$ (129)$ (135)$
FY 2022 66$ 29$ 95$ FY 2022 (2)$ (51)$ (53)$
FY 2023 33$ 33$ FY 2023 ‐$
FY 2024 35$ 35$ FY 2024 ‐$
FY 2025 35$ 35$ FY 2025 ‐$
FY 2026 37$ 37$ FY 2026 ‐$
FY 2027 36$ 36$ FY 2027 ‐$
FY 2028 8$ 8$ FY 2028 ‐$
FY 2012 NPV
@ 12% (635)$ 340$ 144$ (150)$ 635$ (79)$ (334)$ 221$
* in millions of dollars
Commodity Transaction* Financial Transaction*

MCCULLOUGH RESEARCH
Energy Northwest Losses in the 2013 Forward Purchase of Nuclear Fuel January 25, 2014 Page 7 ________________
The basic analysis of the Paducah transaction reveals that on the date of the board presentations, using Energy Northwest’s own model and assumptions, Energy Northwest would lose $150 million from buying overpriced fuel components that it could not use for many years. The reason why Energy Northwest reported that they would lose on the commodity transaction is clear from the examination of the Fuel Plans before and after the transaction. Energy Northwest had already committed to most of their fuel requirements in upcoming years. The purchases from Paducah were at higher costs than those forecasted in their Fuel Plans and, to a significant de-gree, not useful until existing inventories and purchases had been utilized. The board presentations reported a $71 million “gain” because their savings from the financial transaction gave the mistaken impression that they offset the commodity loss. The term “financial transaction” does not appear in their spreadsheet. It does not appear in either of the two board presentations, nor in the minutes of the board meetings.20,21
As it happens, only the keenest eye would have noticed that without the “financial transaction” the plan was expected to lose $150,000,000. This value can be found in Brent Ridge’s model sensitivities table on page 11 of the May 10, 2012 presentation as well as the pre-meeting materials.22 How did Energy Northwest plan to make $220 million from financing the fuel trans-action in order to offset the loss on the commodity transaction? Energy Northwest borrowed $711 million dollars at approximately 5% interest.23 The model discounts the repayment and interest at 12%. Any investment will appear profitable if the discount rate is sufficiently higher than the interest rate. This is what has occurred here. Even worse, given the assumptions in the model, the net present value would have increased markedly if Energy Northwest had borrowed even more money – even if it didn’t need or use it.
20 Barwick, Susan. Minutes of Energy Northwest Special Executive Board Meeting. Energy Northwest. 26 Apr. 2012. 21 Pattie, Lilly. Minutes of the Special Meeting of the Executive Board of Energy Northwest. Energy Northwest 10 May 2012. 22 Ridge, Brent. Tails Fuel Procurement Transaction. Energy Northwest. 10 May 2012. Page 11. 23 The actual interest rate varied by issue.

MCCULLOUGH RESEARCH
Energy Northwest Losses in the 2013 Forward Purchase of Nuclear Fuel January 25, 2014 Page 8 ________________
The perverse result at Energy Northwest comes from an unusual definition of “bene-fits.” If there was a possible investment with a yield of 12%, borrowing at 5% would have conferred an enormous profit -- $221 million in this case. However there were no 12% investments available to Energy Northwest to recoup these costs. Therefore any estimate of profits from borrowing at 5% and discounting at 12% should simply be dismissed. This is a common ploy among real estate promoters who will “pump” spreadsheet results by assuming that the real estate purchaser can invest proceeds at a higher rate than he can borrow them. Obviously, if this was true, you would simply borrow money and reinvest it at the higher return – there would be no reason to pursue a risky investment. For example, suppose that you developed a new theory for playing slot machines at a local casino. You borrow $1,000 from your bank at 5% to be paid off in equal in-stallments over the next decade. With your thousand dollars you insert 4,000 quarters into the slot machine. At the end of a long day, you have $940 dollars.24 Since gam-bling is a risky operation, you discount the cash flows by 12%. Surprisingly, the net present value of the project is positive – very positive:
Year Proceeds Costs Profit2014 $ 940.00 ($129.50) $810.50 2015 ($129.50) ($129.50) 2016 ($129.50) ($129.50) 2017 ($129.50) ($129.50) 2018 ($129.50) ($129.50) 2019 ($129.50) ($129.50) 2020 ($129.50) ($129.50) 2021 ($129.50) ($129.50) 2022 ($129.50) ($129.50) NPV@12% $ 940.00 ($772.84) $167.16
The result, a profit of $167.16, is illusory. Since the discount rate is higher than the interest rate, future payments are devalued as if they were at risk. In the real world, the interest and principal owed to a bank are utterly certain – it is the earnings from gambling that are uncertain. A standard cash flow analysis would show the net pre-sent value of the financing equal to the face value at issue.
24 Slot machines have an expected loss of 6%. The invested $1,000 would return only $940.

MCCULLOUGH RESEARCH
Energy Northwest Losses in the 2013 Forward Purchase of Nuclear Fuel January 25, 2014 Page 9 ________________
A very careful Energy Northwest board member could have found this on page 37 of the pre-meeting materials:
25 This version of the model was contained in the hundred plus pages sent to the Ener-gy Northwest board in preparation for the meeting on April 26, 2012. This page de-rives the sensitivity result that Mr. Ridge reported on page 11 of the May board presentation:
25 Energy Northwest. Pre-Meeting Materials Package. 26 Apr. 2012. Page 37.
MCCULLOUGH RESEARCH
Energy Northwest Losses in the 2013 Forward Purchase of Nuclear Fuel January 25, 2014 Page 10 ________________
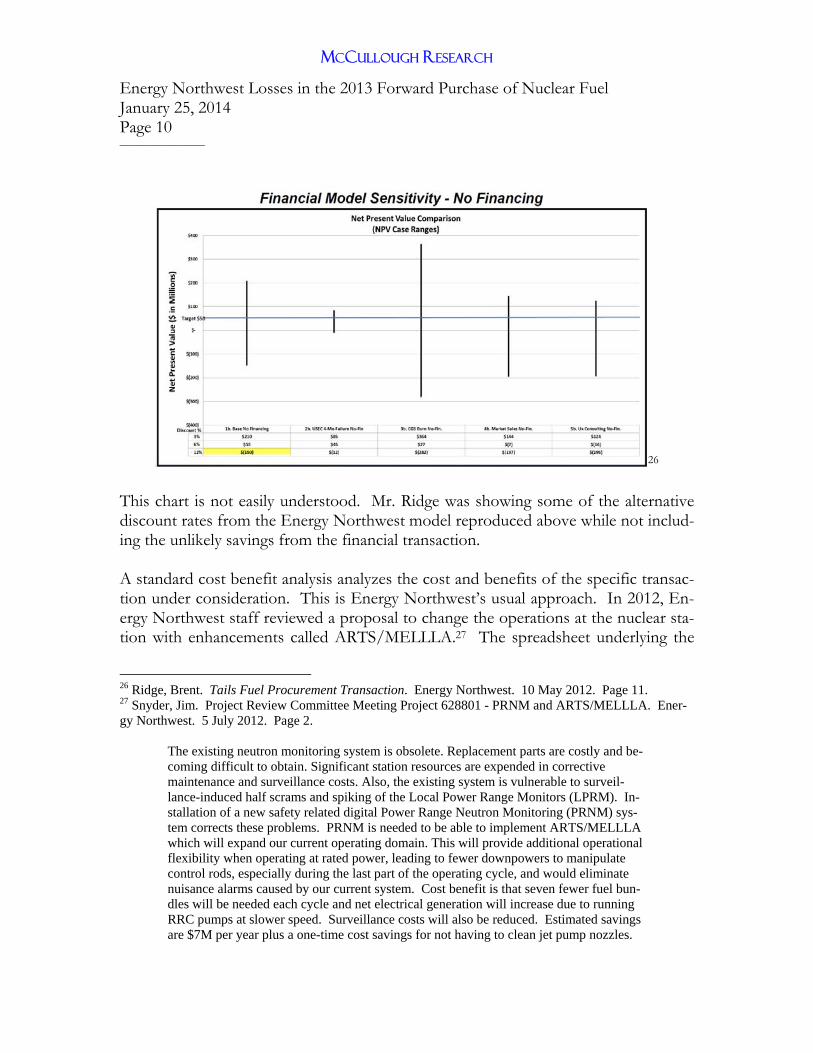
26 This chart is not easily understood. Mr. Ridge was showing some of the alternative discount rates from the Energy Northwest model reproduced above while not includ-ing the unlikely savings from the financial transaction. A standard cost benefit analysis analyzes the cost and benefits of the specific transac-tion under consideration. This is Energy Northwest’s usual approach. In 2012, En-ergy Northwest staff reviewed a proposal to change the operations at the nuclear sta-tion with enhancements called ARTS/MELLLA.27 The spreadsheet underlying the
26 Ridge, Brent. Tails Fuel Procurement Transaction. Energy Northwest. 10 May 2012. Page 11. 27 Snyder, Jim. Project Review Committee Meeting Project 628801 - PRNM and ARTS/MELLLA. Ener-gy Northwest. 5 July 2012. Page 2.
The existing neutron monitoring system is obsolete. Replacement parts are costly and be-coming difficult to obtain. Significant station resources are expended in corrective maintenance and surveillance costs. Also, the existing system is vulnerable to surveil-lance-induced half scrams and spiking of the Local Power Range Monitors (LPRM). In-stallation of a new safety related digital Power Range Neutron Monitoring (PRNM) sys-tem corrects these problems. PRNM is needed to be able to implement ARTS/MELLLA which will expand our current operating domain. This will provide additional operational flexibility when operating at rated power, leading to fewer downpowers to manipulate control rods, especially during the last part of the operating cycle, and would eliminate nuisance alarms caused by our current system. Cost benefit is that seven fewer fuel bun-dles will be needed each cycle and net electrical generation will increase due to running RRC pumps at slower speed. Surveillance costs will also be reduced. Estimated savings are $7M per year plus a one-time cost savings for not having to clean jet pump nozzles.
MCCULLOUGH RESEARCH
Energy Northwest Losses in the 2013 Forward Purchase of Nuclear Fuel January 25, 2014 Page 11 ________________
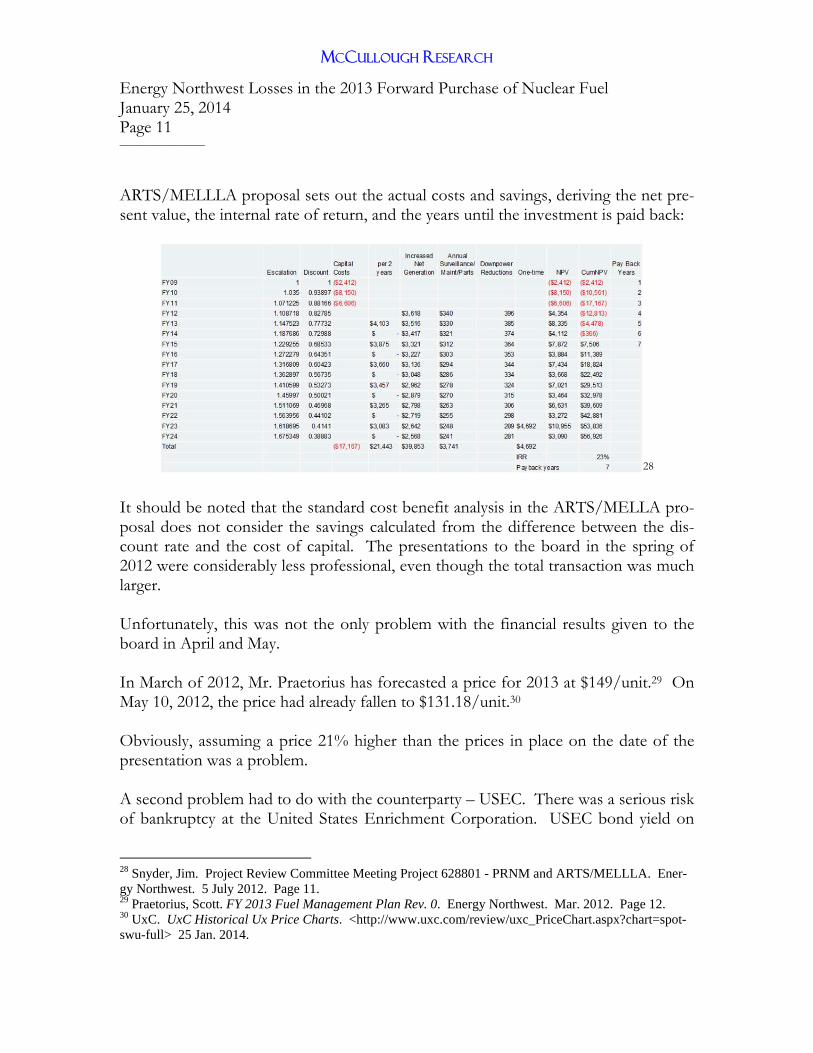
ARTS/MELLLA proposal sets out the actual costs and savings, deriving the net pre-sent value, the internal rate of return, and the years until the investment is paid back:
28 It should be noted that the standard cost benefit analysis in the ARTS/MELLA pro-posal does not consider the savings calculated from the difference between the dis-count rate and the cost of capital. The presentations to the board in the spring of 2012 were considerably less professional, even though the total transaction was much larger. Unfortunately, this was not the only problem with the financial results given to the board in April and May. In March of 2012, Mr. Praetorius has forecasted a price for 2013 at $149/unit.29 On May 10, 2012, the price had already fallen to $131.18/unit.30 Obviously, assuming a price 21% higher than the prices in place on the date of the presentation was a problem. A second problem had to do with the counterparty – USEC. There was a serious risk of bankruptcy at the United States Enrichment Corporation. USEC bond yield on
28 Snyder, Jim. Project Review Committee Meeting Project 628801 - PRNM and ARTS/MELLLA. Ener-gy Northwest. 5 July 2012. Page 11. 29 Praetorius, Scott. FY 2013 Fuel Management Plan Rev. 0. Energy Northwest. Mar. 2012. Page 12. 30 UxC. UxC Historical Ux Price Charts. <http://www.uxc.com/review/uxc_PriceChart.aspx?chart=spot-swu-full> 25 Jan. 2014.

MCCULLOUGH RESEARCH
Energy Northwest Losses in the 2013 Forward Purchase of Nuclear Fuel January 25, 2014 Page 12 ________________
the day of the presentation was 38%. This represented investor’s risk premium in lending money to USEC. The USEC faced many challenges during this period:
1. Proposed delisting of its equity from the New York Stock Exchange
2. Down rating of USEC bonds to junk bond status.
3. Severe doubt about its proposed new enrichment technology.
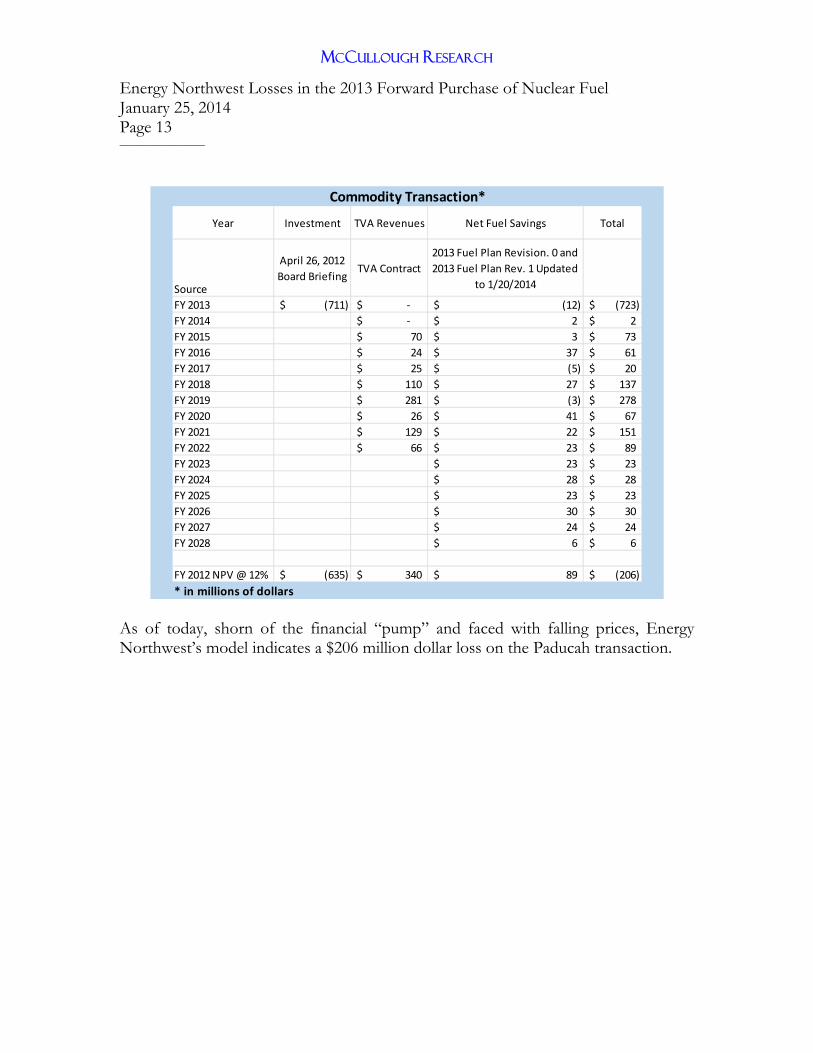
4. The imminent closure of the Paducah facility. Investors had deeply discounted the company’s bonds. The premium for trusting USEC for one year had risen to 38% which made the assumed 12% discount rate used in the model terribly low from the viewpoint of other investors. Imputing the actual prices for nuclear fuel components and the correct discount rate into Energy Northwest’s model yields a massive expected commodity loss -- $384 million. Fortunately, the gamble that USEC did not declare bankruptcy and the nuclear fuel components were delivered was successful. At the end of the Paducah transaction USEC closed the plant and recently announced that it will be entering bankruptcy in the near future. Today, Energy Northwest owns the nuclear fuel components and has a commitment to deliver the majority to TVA. The contract between Energy Northwest and TVA is very unusual for a contract for forward commodities, without many of the protec-tions universal in the industry. Since, from TVA’s point of view, the contract is se-verely out of the money, buyer’s remorse may well set in before 2022. If so, Energy Northwest has proceeded without the protections of a standard forward commodity contract. This means that the discount rate is no longer 38%, but would be the dis-count rate of any long term commodity trade for a commodity with volatile prices. The following calculation uses Energy Northwest’s model, fuel plans, and assump-tions. The primary change is a reduction in 2014 prices to current levels and the elimination of the “earnings” from financing transaction:
MCCULLOUGH RESEARCH
Energy Northwest Losses in the 2013 Forward Purchase of Nuclear Fuel January 25, 2014 Page 13 ________________
As of today, shorn of the financial “pump” and faced with falling prices, Energy Northwest’s model indicates a $206 million dollar loss on the Paducah transaction.
Year Investment TVA Revenues Net Fuel Savings Total
Source
April 26, 2012
Board BriefingTVA Contract
2013 Fuel Plan Revision. 0 and
2013 Fuel Plan Rev. 1 Updated
to 1/20/2014
FY 2013 (711)$ ‐$ (12)$ (723)$
FY 2014 ‐$ 2$ 2$
FY 2015 70$ 3$ 73$
FY 2016 24$ 37$ 61$
FY 2017 25$ (5)$ 20$
FY 2018 110$ 27$ 137$
FY 2019 281$ (3)$ 278$
FY 2020 26$ 41$ 67$
FY 2021 129$ 22$ 151$
FY 2022 66$ 23$ 89$
FY 2023 23$ 23$
FY 2024 28$ 28$
FY 2025 23$ 23$
FY 2026 30$ 30$
FY 2027 24$ 24$
FY 2028 6$ 6$
FY 2012 NPV @ 12% (635)$ 340$ 89$ (206)$
* in millions of dollars
Commodity Transaction*
MCCULLOUGH RESEARCH
Energy Northwest Losses in the 2013 Forward Purchase of Nuclear Fuel January 25, 2014 Page 14 ________________
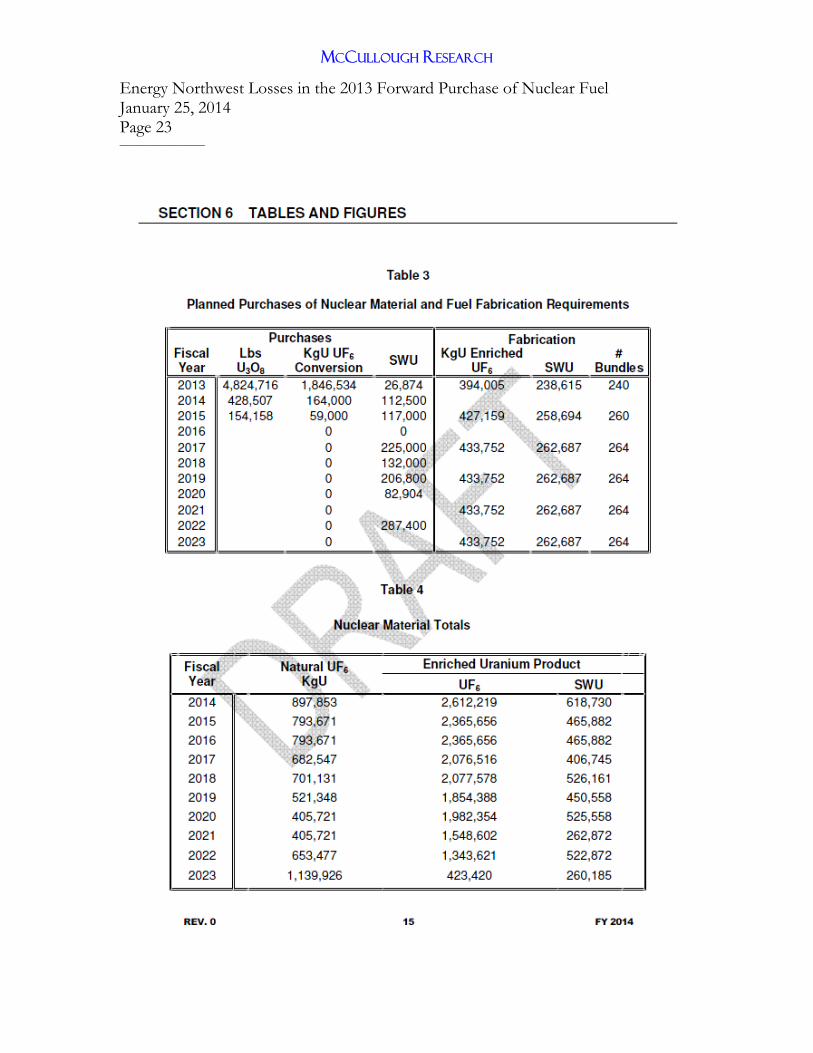
Attachment A:
Tables from the 2013 and 2014 Fuel Plans

MCCULLOUGH RESEARCH
Energy Northwest Losses in the 2013 Forward Purchase of Nuclear Fuel January 25, 2014 Page 15 ________________

MCCULLOUGH RESEARCH
Energy Northwest Losses in the 2013 Forward Purchase of Nuclear Fuel January 25, 2014 Page 16 ________________

MCCULLOUGH RESEARCH
Energy Northwest Losses in the 2013 Forward Purchase of Nuclear Fuel January 25, 2014 Page 17 ________________

MCCULLOUGH RESEARCH
Energy Northwest Losses in the 2013 Forward Purchase of Nuclear Fuel January 25, 2014 Page 18 ________________

MCCULLOUGH RESEARCH
Energy Northwest Losses in the 2013 Forward Purchase of Nuclear Fuel January 25, 2014 Page 19 ________________

MCCULLOUGH RESEARCH
Energy Northwest Losses in the 2013 Forward Purchase of Nuclear Fuel January 25, 2014 Page 20 ________________
MCCULLOUGH RESEARCH
Energy Northwest Losses in the 2013 Forward Purchase of Nuclear Fuel January 25, 2014 Page 21 ________________
MCCULLOUGH RESEARCH
Energy Northwest Losses in the 2013 Forward Purchase of Nuclear Fuel January 25, 2014 Page 22 ________________
MCCULLOUGH RESEARCH
Energy Northwest Losses in the 2013 Forward Purchase of Nuclear Fuel January 25, 2014 Page 23 ________________