2014 Winter Texan
48
-
Upload
the-university-of-texas-pan-american -
Category
Documents
-
view
218 -
download
0
description
UTPA 2014 Winter Texan Magazine
Transcript of 2014 Winter Texan


2013 - 2014
July 2014
The University of Texas-Pan American
Penny M. Simpson, D.B.A.
Published by: Business and Tourism Research Center College of Business Administration The University of Texas-Pan American
Reproduction of any of the contents of this publication will be regarded as a breach of copyright. This material is provided as a service by the Business and Tourism Research Center and is prepared for informational uses only. To the extent permitted by law, the Business and Tourism Research Center disclaims liability or responsibility to any person for direct or indirect loss or damage that may result from any act or omission by any person in relation to the information provided in this report. © 2014. All rights reserved.
2013-2014 REPORT
i WT
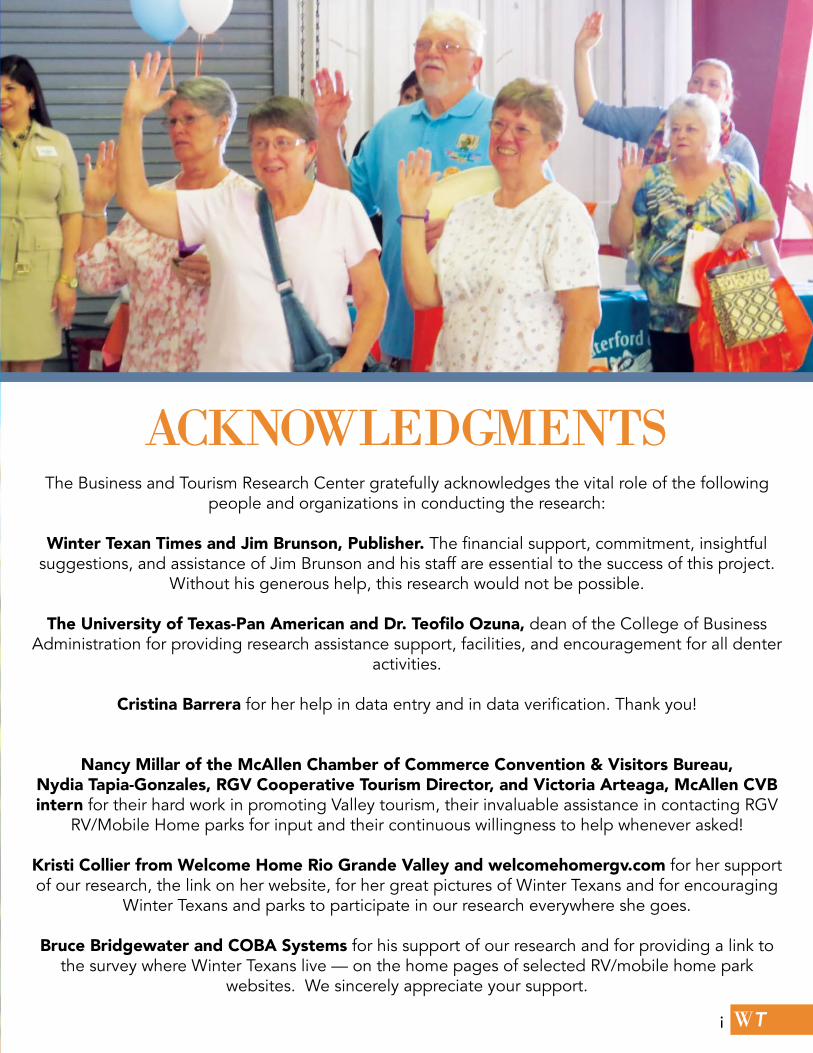
ACKNOWLEDGMENTSThe Business and Tourism Research Center gratefully acknowledges the vital role of the following
people and organizations in conducting the research:
Winter Texan Times and Jim Brunson, Publisher. The financial support, commitment, insightful suggestions, and assistance of Jim Brunson and his staff are essential to the success of this project.
Without his generous help, this research would not be possible.
The University of Texas-Pan American and Dr. Teofilo Ozuna, dean of the College of Business Administration for providing research assistance support, facilities, and encouragement for all denter
activities.
Cristina Barrera for her help in data entry and in data verification. Thank you!
Nancy Millar of the McAllen Chamber of Commerce Convention & Visitors Bureau, Nydia Tapia-Gonzales, RGV Cooperative Tourism Director, and Victoria Arteaga, McAllen CVB intern for their hard work in promoting Valley tourism, their invaluable assistance in contacting RGV
RV/Mobile Home parks for input and their continuous willingness to help whenever asked!
Kristi Collier from Welcome Home Rio Grande Valley and welcomehomergv.com for her support of our research, the link on her website, for her great pictures of Winter Texans and for encouraging
Winter Texans and parks to participate in our research everywhere she goes.
Bruce Bridgewater and COBA Systems for his support of our research and for providing a link to the survey where Winter Texans live — on the home pages of selected RV/mobile home park
websites. We sincerely appreciate your support.
iiWT
EXECUTIVE SUMMARYEach year, retirees from all over the U.S and Canada venture to the Rio Grande Valley area to spend the winter. These retirees, known as Winter Texans, provide a substantial boost to the region’s economy. In an effort to better understand their activities, interests and impact on the region, the Business and Tourism Research Center in the College of Business Administration at The University of Texas-Pan American has conducted research on this market over the past 25 years.
This year’s study included 1,394 Winter Texans respondents and 88 RV and mobile home park man-ager/owner respondents. Most of the Winter Texan participants submitted their response to the study questionnaire by mail (53.8%) while the remainder (46.2%) completed a very similar survey online. The results of both the Winter Texan and the park surveys are summarized here in six sec-tions: demographic characteristics, stay characteristics, health care, expenditures in Mexico, expen-ditures in the Valley, and the Park Study.
Demographic Characteristics
The average Winter Texan participating in this year’s study: • is female (57.2%), • is 71.7 years of age, • is married (85.9%), • is white (99.3%), • has been retired for more than a year (89.2%), • has some college (35.9%) or a bachelor’s, graduate or professional degree (31.5%), • is in a 2-person household (87.6%), • has an annual household income of $59,000 with 63.0% of Winter Texans having an income between $30,000 to $70,000, and • comes from Minnesota (16.9%), Canada (14.4%), Iowa (13.1%), Wisconsin (7.5%), Illinois (6.9%), Missouri (6.6%) or Michigan (5.6%).
Further, Winter Texans 65 years of age and older participating in this study are, on average, young-er, more educated and have a higher household income level than their counterparts in the U.S. population in general.
Stay Characteristics
Knowing where Winter Texans live while in the Valley, how long they stay, why they come and what they do while in the Valley is crucial to providing for their needs so they will continue to come and significantly impact the region’s economy. During their stay in the Rio Grande Valley, the typical Winter Texan in this study: • has come to the Valley for 11.2 years, • stayed in the Valley for 133 days, and • owns a Valley residence (91.0%) • 50.7% own a mobile home/park model • 34.0% own an RV • 6.3% own a house or condo.
As in past years, most Winter Texans come to the Valley because of: • the climate (92.3%), • friendly people (66.4%), • the social activities (55.7%), and • a winter vacation (51.9%).
The most popular Valley activities for this year’s study participants include: • visiting flea markets, • attending festivals, • visiting historical sites , • attending music or jam sessions, and • going to the beach.
Overwhelmingly, the Winter Texan study participants plan to return to the Valley next year (96.6%), suggesting their satisfaction with the area. They reported that poor health (62.7%) or family reasons (37.0%) would be the most likely reasons to prevent them from returning.
HealthThis year’s Winter Texan study respondents were asked a question about their health and the number of visits they made to doctors in the past year. Most rated their health as good to excellent (93%) and the average number of doctors’ visits in the past year was six.
Economic ImpactIncluded in this year’s report is a study of RV and mobile home parks where most Winter Texans typically stay. Using a listing of parks and information from questionnaires completed by park managers or owners, an estimated 99,500 Winter Texans or 53,000 households were in the Valley during the 2013-2014 winter season.
On average, Winter Texans visited Mexico (86.8%) for an average of 5.3 trips during their stay in the Valley. They spent an average of $92 to $170 per trip, depending on the method used for estima-tion. With about 53,000 Winter Texan households in the Valley, the average, direct economic impact of Winter Texans on Mexico bor-der towns is about $31.4 million.
On the U.S. side, Winter Texan households spent an average of approximately $9,640 on routine, monthly purchases and about $3,730 on major, one-time purchases. This represents an average expenditure in the Valley of about $13,400 per household. Com-bining household expenditures with the approximate 53,000 Win-ter Texan households in the Valley, the estimated direct economic impact of Winter Texans on the Valley economy for 2013-2014 is $710 million.

WT
Table of ContentsAcknowledgments .................................................................................................. iTable of Contents .................................................................................................... ivTable of Figures and Tables ..................................................................................... vThe Winter Texan 2014 Study ................................................................................. 1Winter Texan Study: Methodology ......................................................................... 2 Research Design .......................................................................................... 2 Study Limitations ......................................................................................... 2Study Results ........................................................................................................... 3 Survey Returns and Return Method ............................................................ 3 Results: Demographic Characteristics ....................................................... 3 Age .................................................................................................. 4 Gender ............................................................................................ 6 Race ................................................................................................. 7 Marital status ................................................................................... 7 Education ........................................................................................ 8 Income ............................................................................................ 10 Employment status ......................................................................... 11 Home state ...................................................................................... 12 Results: Stay Characteristics ...................................................................... 14 Days Spent in the Valley .................................................................. 14 Years Coming to the Valley .............................................................. 14 Housing type ................................................................................... 15 Attractions ....................................................................................... 16 Why not return ................................................................................ 17 Results: Health ............................................................................................ 18 Results: Expenditure Patterns in Mexico ................................................... 19 Results: Expenditure Patterns in the Rio Grande Valley ............................ 21The 2014 Park Study ................................................................................................ 24 Introduction ................................................................................................ 24 Park Study Methodology ............................................................................ 25 Results: Park Population ............................................................................ 26 Results: Park Survey ................................................................................... 26 Results: Estimating the Number of Winter Texans in the Valley ............... 30Direct Impact of Winter Texans on the Valley Economy ....................................... 31Conclusion .............................................................................................................. 33APPENDIX A: Survey Instruments .......................................................................... 35APPENDIX B: Park Manager/Owner Comments .................................................... 38
v
WT
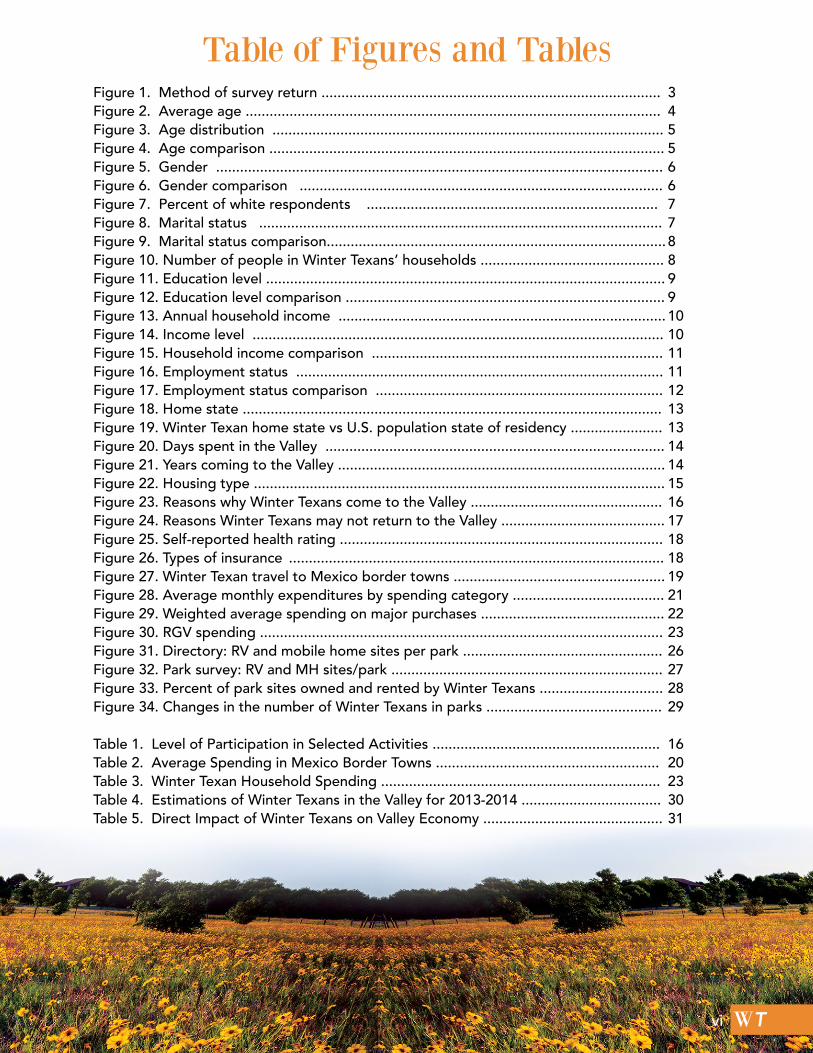
Table of Figures and TablesFigure 1. Method of survey return ..................................................................................... 3Figure 2. Average age ........................................................................................................ 4Figure 3. Age distribution .................................................................................................. 5Figure 4. Age comparison ................................................................................................... 5Figure 5. Gender ................................................................................................................ 6Figure 6. Gender comparison ........................................................................................... 6Figure 7. Percent of white respondents ......................................................................... 7Figure 8. Marital status ..................................................................................................... 7Figure 9. Marital status comparison..................................................................................... 8Figure 10. Number of people in Winter Texans’ households .............................................. 8Figure 11. Education level .................................................................................................... 9Figure 12. Education level comparison ................................................................................ 9Figure 13. Annual household income .................................................................................. 10Figure 14. Income level ....................................................................................................... 10Figure 15. Household income comparison ......................................................................... 11Figure 16. Employment status ............................................................................................ 11Figure 17. Employment status comparison ........................................................................ 12Figure 18. Home state ......................................................................................................... 13 Figure 19. Winter Texan home state vs U.S. population state of residency ....................... 13Figure 20. Days spent in the Valley ..................................................................................... 14Figure 21. Years coming to the Valley .................................................................................. 14Figure 22. Housing type ....................................................................................................... 15Figure 23. Reasons why Winter Texans come to the Valley ................................................ 16Figure 24. Reasons Winter Texans may not return to the Valley ......................................... 17Figure 25. Self-reported health rating ................................................................................. 18Figure 26. Types of insurance .............................................................................................. 18Figure 27. Winter Texan travel to Mexico border towns ..................................................... 19Figure 28. Average monthly expenditures by spending category ...................................... 21Figure 29. Weighted average spending on major purchases .............................................. 22Figure 30. RGV spending ..................................................................................................... 23Figure 31. Directory: RV and mobile home sites per park .................................................. 26Figure 32. Park survey: RV and MH sites/park .................................................................... 27Figure 33. Percent of park sites owned and rented by Winter Texans ............................... 28Figure 34. Changes in the number of Winter Texans in parks ............................................ 29
Table 1. Level of Participation in Selected Activities ......................................................... 16Table 2. Average Spending in Mexico Border Towns ........................................................ 20Table 3. Winter Texan Household Spending ...................................................................... 23Table 4. Estimations of Winter Texans in the Valley for 2013-2014 ................................... 30Table 5. Direct Impact of Winter Texans on Valley Economy ............................................. 31
vi

WT
THE WINTER TEXAN 2014 STUDY
For more than 40 years, retirees from the northern parts of the United States and Canada have traveled to the Rio Grande Valley (RGV) to spend their winters in the temperate climate of South Texas. The RGV or “Valley” region spans the area from South Padre Island to Rio Grande City. This 110-mile region borders on Mexico and the Gulf of Mexico and offers visitors of all ages a wide variety of activities throughout the year.
The combination of warm winter weather, numerous outdoor activities, numerous RV and mobile home parks, friendly people, and a low cost of living are powerful incentives in attracting wintering visitors. Since 1987, the Business and Tourism Research Center in the College of Business Administration at The University of Texas-Pan American (UTPA) has conducted research on these winter visitors to the Valley to examine their opinions, activities, expenditure patterns, and especially, their economic impact on the region. Prior studies indicated the retired winter visitors to the Valley, dubbed “Winter Texans,” typically stay anywhere from 3 weeks to 6 months and have had a direct impact on the regional economy of $92 million in 1987 to more than $803 million in 2010.
This report presents the results of two different studies, both studies essential to estimating the number of Winter Texans Times in the RGV region. The first study was conducted among Winter Texans whereby a questionnaire was distributed to Winter Texans via an insert in a Winter Texan newspaper and made available online. The results from this study are presented in this report in five sections. The first section details the demographic characteristics of the Winter Texan study respondents. The second section presents respondents’ stay characteristics (length of stay, type of housing, etc.), activities engaged in while in the RGV and the likelihood of returning to the RGV next year. The third section reveals the self-reported health condition of the study respondents, reported doctor visits and the type of health insurance held. The last two sections itemize Winter Texan expenditures by spending category first in Mexico border towns and then in the RGV. Most of the results are shown along with results from past Winter Texan reports since 2006 to better understand changes in the Winter Texan market over the time period.
The second section of the report presents the results of the Winter Texan Park Study. Because most Winter Texans live in RV/mobile home parks, the RGV park managers/owners were sent a questionnaire designed to determine the number of Winter Tex-ans living in the parks during the Winter Texan season. An estimate of the number of Winter Texans in the RGV may then be drawn by generalizing responding park Winter Texan numbers to the population of Winter Texan parks. Results from both studies are then used to estimate the number of Winter Texans in the RGV during 2013-2014 and their economic impact on the region’s economy. The next section explains the meth-odology used in the Winter Texan study.
11
WT
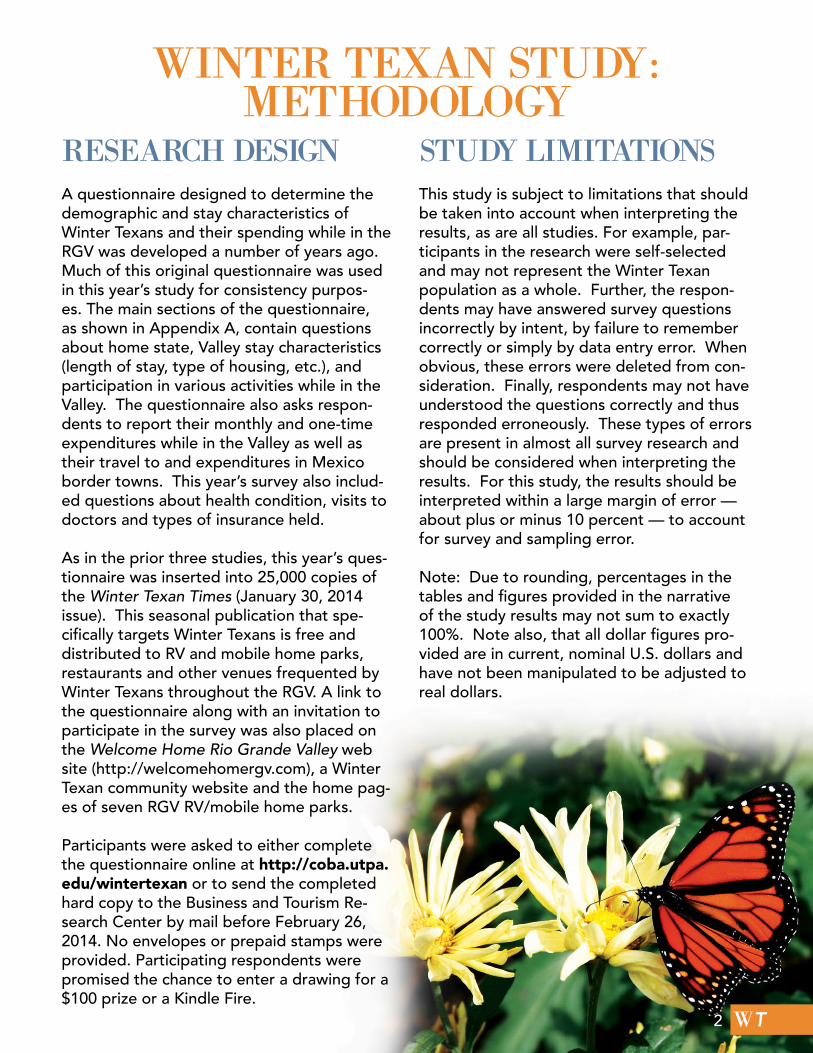
WINTER TEXAN STUDY: METHODOLOGY
RESEARCH DESIGNA questionnaire designed to determine the demographic and stay characteristics of Winter Texans and their spending while in the RGV was developed a number of years ago. Much of this original questionnaire was used in this year’s study for consistency purpos-es. The main sections of the questionnaire, as shown in Appendix A, contain questions about home state, Valley stay characteristics (length of stay, type of housing, etc.), and participation in various activities while in the Valley. The questionnaire also asks respon-dents to report their monthly and one-time expenditures while in the Valley as well as their travel to and expenditures in Mexico border towns. This year’s survey also includ-ed questions about health condition, visits to doctors and types of insurance held.
As in the prior three studies, this year’s ques-tionnaire was inserted into 25,000 copies of the Winter Texan Times (January 30, 2014 issue). This seasonal publication that spe-cifically targets Winter Texans is free and distributed to RV and mobile home parks, restaurants and other venues frequented by Winter Texans throughout the RGV. A link to the questionnaire along with an invitation to participate in the survey was also placed on the Welcome Home Rio Grande Valley web site (http://welcomehomergv.com), a Winter Texan community website and the home pag-es of seven RGV RV/mobile home parks.
Participants were asked to either complete the questionnaire online at http://coba.utpa.edu/wintertexan or to send the completed hard copy to the Business and Tourism Re-search Center by mail before February 26, 2014. No envelopes or prepaid stamps were provided. Participating respondents were promised the chance to enter a drawing for a $100 prize or a Kindle Fire.
STUDY LIMITATIONSThis study is subject to limitations that should be taken into account when interpreting the results, as are all studies. For example, par-ticipants in the research were self-selected and may not represent the Winter Texan population as a whole. Further, the respon-dents may have answered survey questions incorrectly by intent, by failure to remember correctly or simply by data entry error. When obvious, these errors were deleted from con-sideration. Finally, respondents may not have understood the questions correctly and thus responded erroneously. These types of errors are present in almost all survey research and should be considered when interpreting the results. For this study, the results should be interpreted within a large margin of error —about plus or minus 10 percent — to account for survey and sampling error.
Note: Due to rounding, percentages in the tables and figures provided in the narrative of the study results may not sum to exactly 100%. Note also, that all dollar figures pro-vided are in current, nominal U.S. dollars and have not been manipulated to be adjusted to real dollars.
2
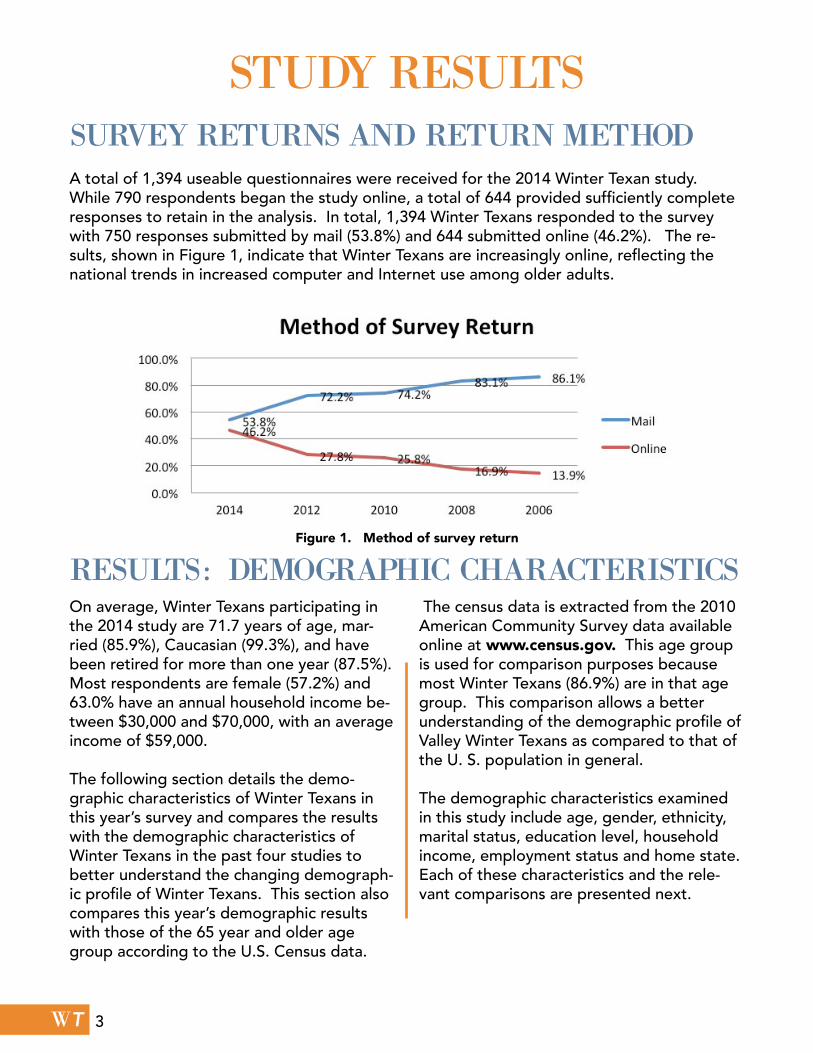
Figure 1. Method of survey return
WT
STUDY RESULTSSURVEY RETURNS AND RETURN METHODA total of 1,394 useable questionnaires were received for the 2014 Winter Texan study. While 790 respondents began the study online, a total of 644 provided sufficiently complete responses to retain in the analysis. In total, 1,394 Winter Texans responded to the survey with 750 responses submitted by mail (53.8%) and 644 submitted online (46.2%). The re-sults, shown in Figure 1, indicate that Winter Texans are increasingly online, reflecting the national trends in increased computer and Internet use among older adults.
RESULTS: DEMOGRAPHIC CHARACTERISTICSOn average, Winter Texans participating in the 2014 study are 71.7 years of age, mar-ried (85.9%), Caucasian (99.3%), and have been retired for more than one year (87.5%). Most respondents are female (57.2%) and 63.0% have an annual household income be-tween $30,000 and $70,000, with an average income of $59,000.
The following section details the demo-graphic characteristics of Winter Texans in this year’s survey and compares the results with the demographic characteristics of Winter Texans in the past four studies to better understand the changing demograph-ic profile of Winter Texans. This section also compares this year’s demographic results with those of the 65 year and older age group according to the U.S. Census data.
The census data is extracted from the 2010 American Community Survey data available online at www.census.gov. This age group is used for comparison purposes because most Winter Texans (86.9%) are in that age group. This comparison allows a better understanding of the demographic profile of Valley Winter Texans as compared to that of the U. S. population in general.
The demographic characteristics examined in this study include age, gender, ethnicity, marital status, education level, household income, employment status and home state. Each of these characteristics and the rele-vant comparisons are presented next.
3
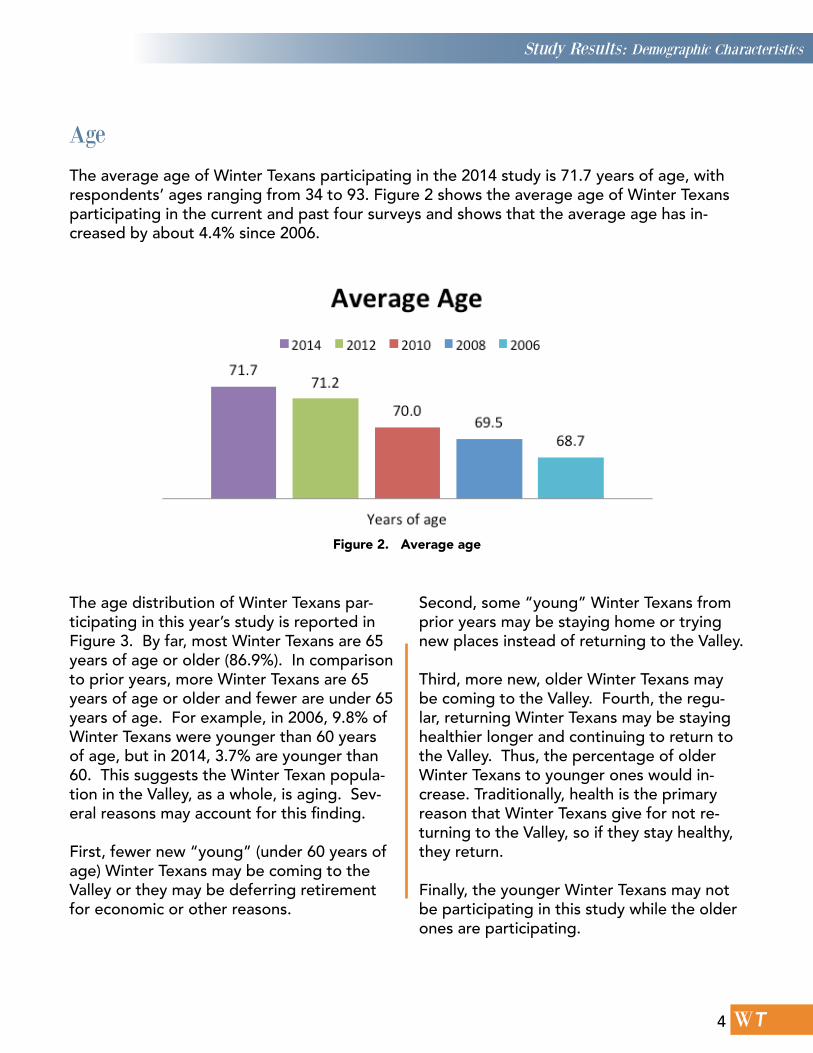
Figure 2. Average age
WT
Age
The average age of Winter Texans participating in the 2014 study is 71.7 years of age, with respondents’ ages ranging from 34 to 93. Figure 2 shows the average age of Winter Texans participating in the current and past four surveys and shows that the average age has in-creased by about 4.4% since 2006.
The age distribution of Winter Texans par-ticipating in this year’s study is reported in Figure 3. By far, most Winter Texans are 65 years of age or older (86.9%). In comparison to prior years, more Winter Texans are 65 years of age or older and fewer are under 65 years of age. For example, in 2006, 9.8% of Winter Texans were younger than 60 years of age, but in 2014, 3.7% are younger than 60. This suggests the Winter Texan popula-tion in the Valley, as a whole, is aging. Sev-eral reasons may account for this finding.
First, fewer new “young” (under 60 years of age) Winter Texans may be coming to the Valley or they may be deferring retirement for economic or other reasons.
Second, some “young” Winter Texans from prior years may be staying home or trying new places instead of returning to the Valley.
Third, more new, older Winter Texans may be coming to the Valley. Fourth, the regu-lar, returning Winter Texans may be staying healthier longer and continuing to return to the Valley. Thus, the percentage of older Winter Texans to younger ones would in-crease. Traditionally, health is the primary reason that Winter Texans give for not re-turning to the Valley, so if they stay healthy, they return.
Finally, the younger Winter Texans may not be participating in this study while the older ones are participating.
Study Results: Demographic Characteristics
4
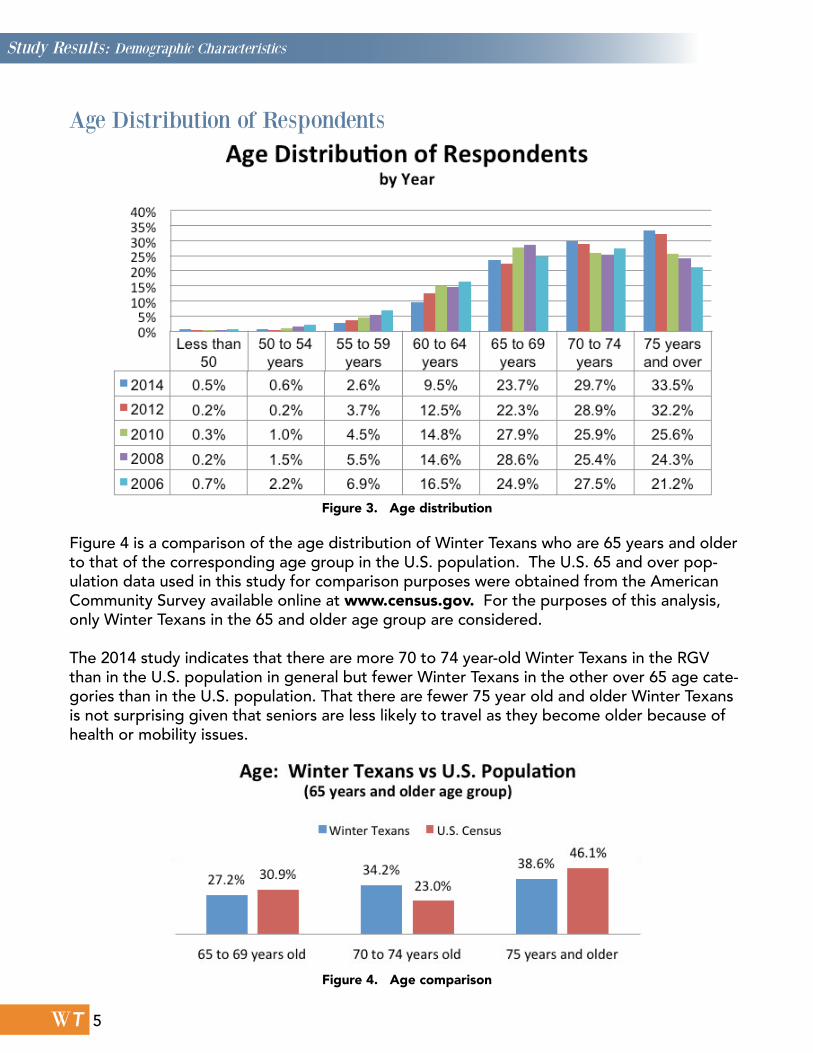
Figure 3. Age distribution
Figure 4. Age comparison
WT
Age Distribution of Respondents
Figure 4 is a comparison of the age distribution of Winter Texans who are 65 years and older to that of the corresponding age group in the U.S. population. The U.S. 65 and over pop-ulation data used in this study for comparison purposes were obtained from the American Community Survey available online at www.census.gov. For the purposes of this analysis, only Winter Texans in the 65 and older age group are considered.
The 2014 study indicates that there are more 70 to 74 year-old Winter Texans in the RGV than in the U.S. population in general but fewer Winter Texans in the other over 65 age cate-gories than in the U.S. population. That there are fewer 75 year old and older Winter Texans is not surprising given that seniors are less likely to travel as they become older because of health or mobility issues.
Study Results: Demographic Characteristics
5

Figure 6. Gender comparison
Figure 5. Gender
WT
Gender
Figure 5 shows that most 2014 Winter Texan study respondents are female (57.2%). Females continuously participate in the survey in greater proportion than males throughout the years of the study.
The higher representation of females in the study sample, however, mirrors the U.S. popula-tion where 56.9% of the 65 and older group are female, as illustrated in Figure 6.
Study Results: Demographic Characteristics
6

Figure 7. Percent of white respondents
Figure 8. Marital status
WT
Race
As Figure 7 shows, Winter Texans almost exclusively consider themselves white. The figure also shows that Winter Texans have been predominantly white over the past years of study. In the general U.S. 65 and over population, 85.1% are considered white, according to U.S. census data.
Marital status
As in prior years, most Winter Texans are married as seen in Figure 8. The trends for the marital status of Winter Texans have stayed relatively consistent with prior years’ studies al-though more respondents in 2014 are widowed than in prior years. This finding is consistent with the finding that Winter Texans are increasingly older.
Figure 9 compares the marital status of this year’s Winter Texan respondents to that of the 65 and older U.S. population group. A far greater percentage of this year’s Winter Texans are married compared to that of the general U.S. 65 years and older population.
Study Results: Demographic Characteristics
7
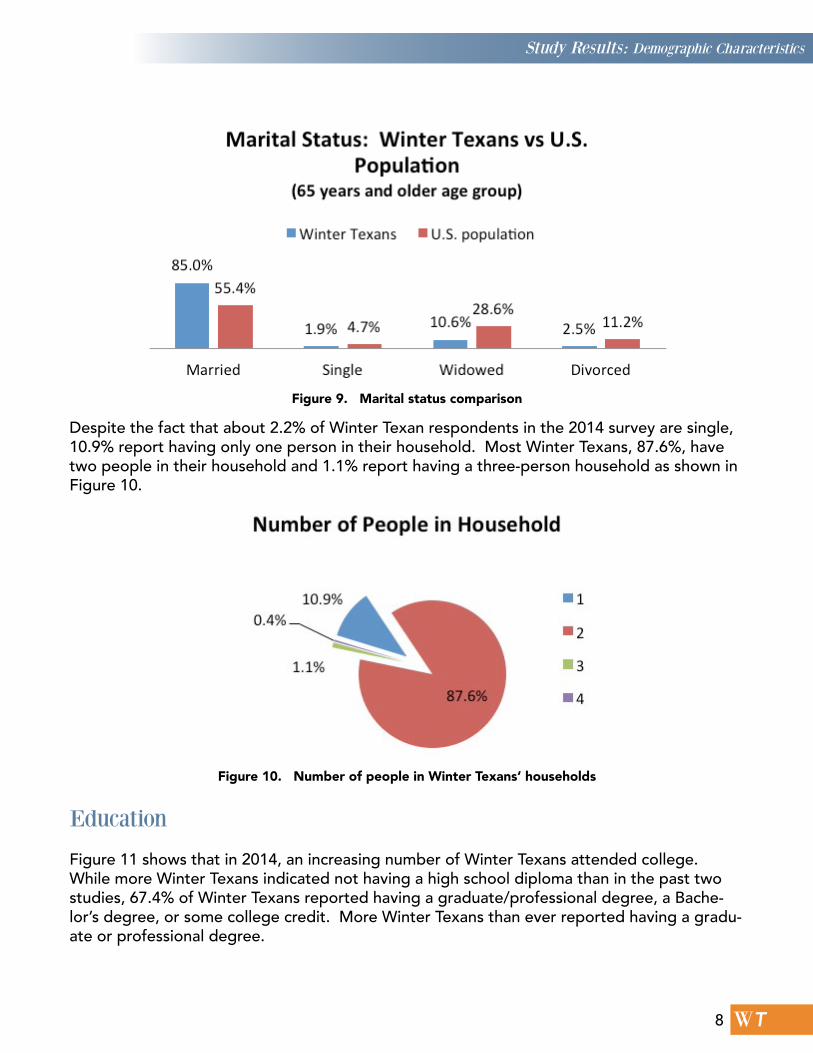
Figure 9. Marital status comparison
Figure 10. Number of people in Winter Texans’ households
WT
Despite the fact that about 2.2% of Winter Texan respondents in the 2014 survey are single, 10.9% report having only one person in their household. Most Winter Texans, 87.6%, have two people in their household and 1.1% report having a three-person household as shown in Figure 10.
Education
Figure 11 shows that in 2014, an increasing number of Winter Texans attended college. While more Winter Texans indicated not having a high school diploma than in the past two studies, 67.4% of Winter Texans reported having a graduate/professional degree, a Bache-lor’s degree, or some college credit. More Winter Texans than ever reported having a gradu-ate or professional degree.
Study Results: Demographic Characteristics
8
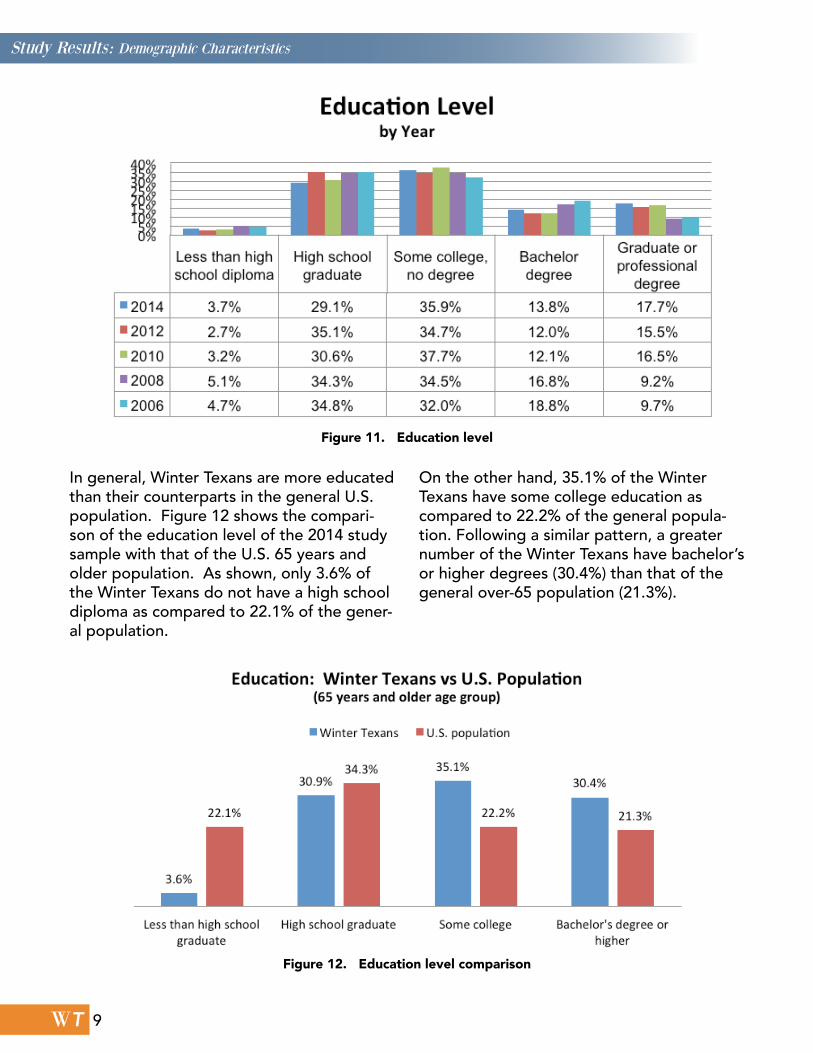
Figure 11. Education level
Figure 12. Education level comparison
WT
In general, Winter Texans are more educated than their counterparts in the general U.S. population. Figure 12 shows the compari-son of the education level of the 2014 study sample with that of the U.S. 65 years and older population. As shown, only 3.6% of the Winter Texans do not have a high school diploma as compared to 22.1% of the gener-al population.
On the other hand, 35.1% of the Winter Texans have some college education as compared to 22.2% of the general popula-tion. Following a similar pattern, a greater number of the Winter Texans have bachelor’s or higher degrees (30.4%) than that of the general over-65 population (21.3%).
Study Results: Demographic Characteristics
9
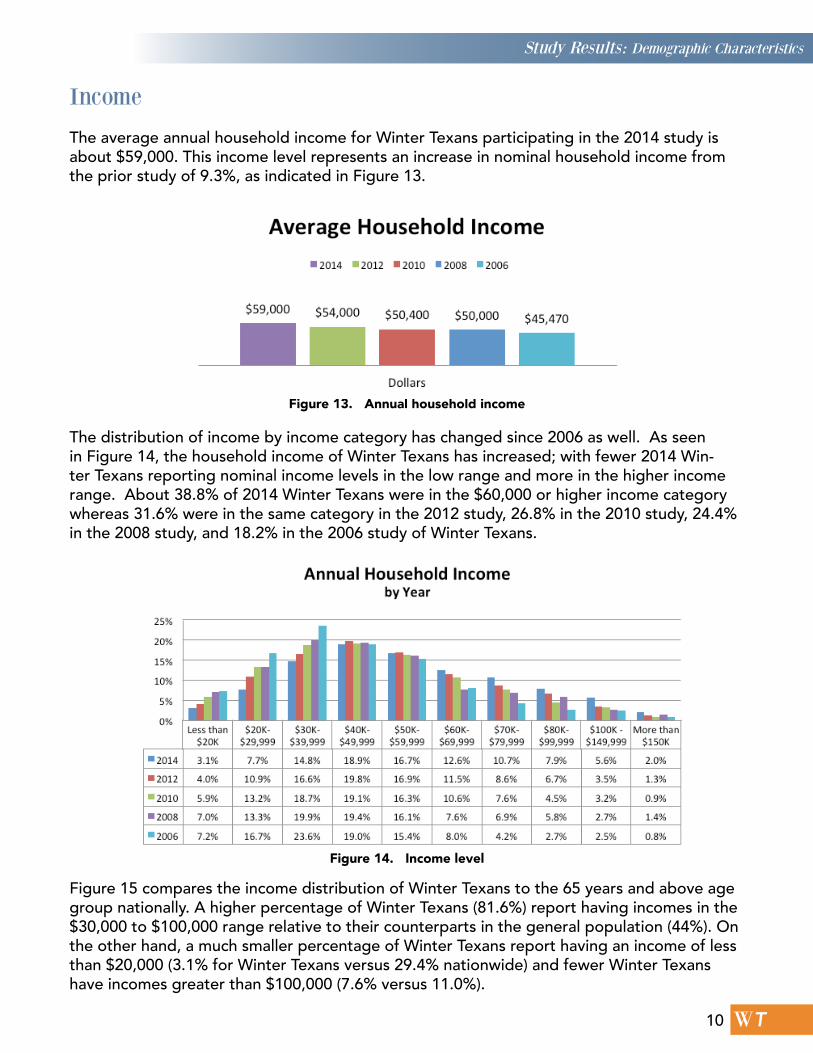
Figure 13. Annual household income
Figure 14. Income level
WT
Income
The average annual household income for Winter Texans participating in the 2014 study is about $59,000. This income level represents an increase in nominal household income from the prior study of 9.3%, as indicated in Figure 13.
The distribution of income by income category has changed since 2006 as well. As seen in Figure 14, the household income of Winter Texans has increased; with fewer 2014 Win-ter Texans reporting nominal income levels in the low range and more in the higher income range. About 38.8% of 2014 Winter Texans were in the $60,000 or higher income category whereas 31.6% were in the same category in the 2012 study, 26.8% in the 2010 study, 24.4% in the 2008 study, and 18.2% in the 2006 study of Winter Texans.
Figure 15 compares the income distribution of Winter Texans to the 65 years and above age group nationally. A higher percentage of Winter Texans (81.6%) report having incomes in the $30,000 to $100,000 range relative to their counterparts in the general population (44%). On the other hand, a much smaller percentage of Winter Texans report having an income of less than $20,000 (3.1% for Winter Texans versus 29.4% nationwide) and fewer Winter Texans have incomes greater than $100,000 (7.6% versus 11.0%).
Study Results: Demographic Characteristics
10
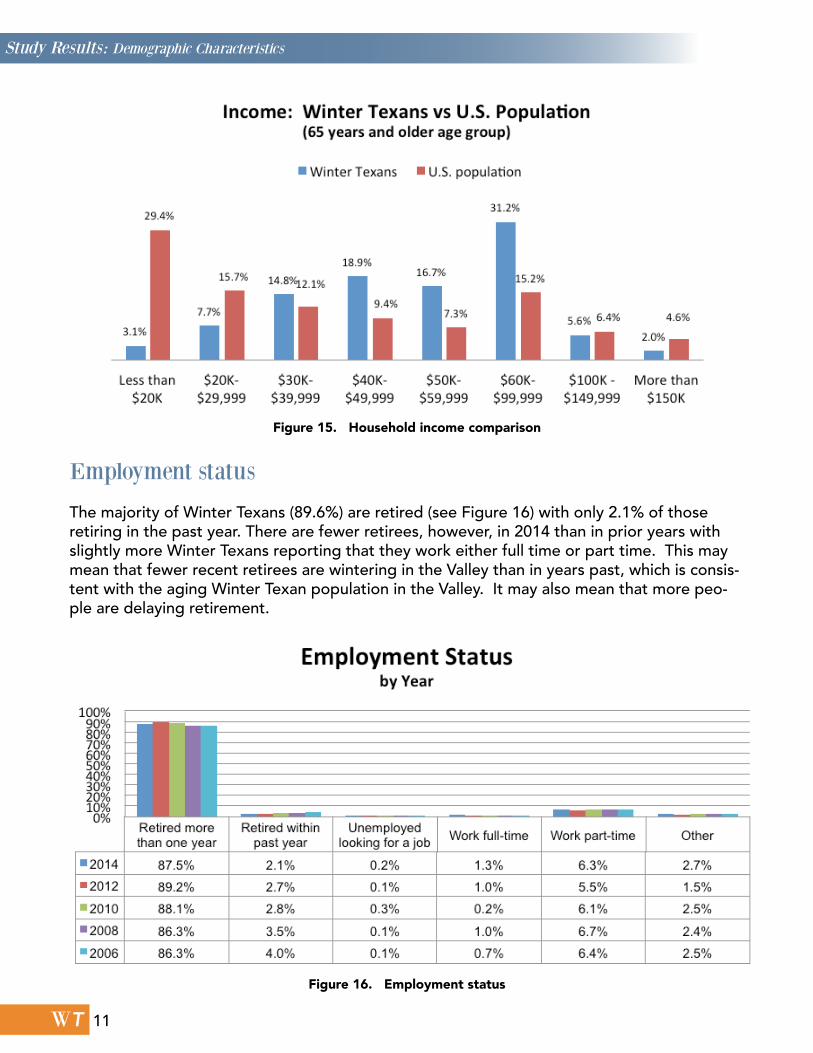
Figure 15. Household income comparison
Figure 16. Employment status
WT
Employment status
The majority of Winter Texans (89.6%) are retired (see Figure 16) with only 2.1% of those retiring in the past year. There are fewer retirees, however, in 2014 than in prior years with slightly more Winter Texans reporting that they work either full time or part time. This may mean that fewer recent retirees are wintering in the Valley than in years past, which is consis-tent with the aging Winter Texan population in the Valley. It may also mean that more peo-ple are delaying retirement.
Study Results: Demographic Characteristics
11
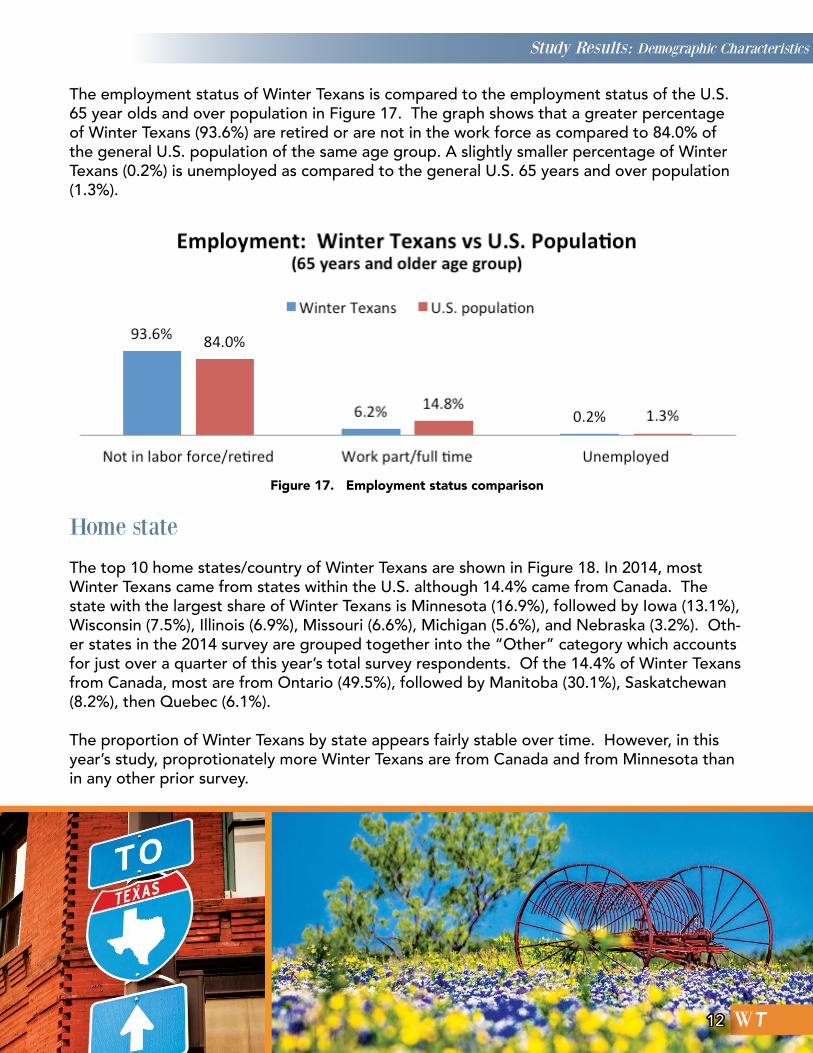
Figure 17. Employment status comparison
WT
The employment status of Winter Texans is compared to the employment status of the U.S. 65 year olds and over population in Figure 17. The graph shows that a greater percentage of Winter Texans (93.6%) are retired or are not in the work force as compared to 84.0% of the general U.S. population of the same age group. A slightly smaller percentage of Winter Texans (0.2%) is unemployed as compared to the general U.S. 65 years and over population (1.3%).
Home state
The top 10 home states/country of Winter Texans are shown in Figure 18. In 2014, most Winter Texans came from states within the U.S. although 14.4% came from Canada. The state with the largest share of Winter Texans is Minnesota (16.9%), followed by Iowa (13.1%), Wisconsin (7.5%), Illinois (6.9%), Missouri (6.6%), Michigan (5.6%), and Nebraska (3.2%). Oth-er states in the 2014 survey are grouped together into the “Other” category which accounts for just over a quarter of this year’s total survey respondents. Of the 14.4% of Winter Texans from Canada, most are from Ontario (49.5%), followed by Manitoba (30.1%), Saskatchewan (8.2%), then Quebec (6.1%).
The proportion of Winter Texans by state appears fairly stable over time. However, in this year’s study, proprotionately more Winter Texans are from Canada and from Minnesota than in any other prior survey.
Study Results: Demographic Characteristics
1212
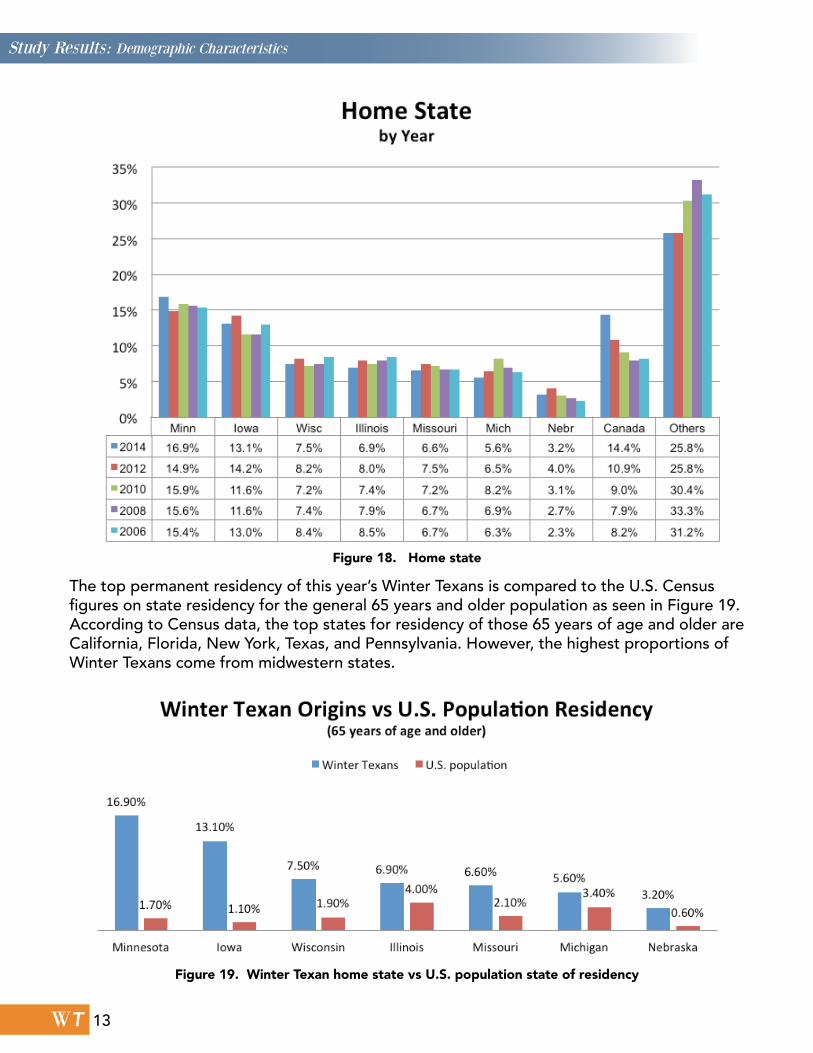
Figure 18. Home state
Figure 19. Winter Texan home state vs U.S. population state of residency
WT
The top permanent residency of this year’s Winter Texans is compared to the U.S. Census figures on state residency for the general 65 years and older population as seen in Figure 19. According to Census data, the top states for residency of those 65 years of age and older are California, Florida, New York, Texas, and Pennsylvania. However, the highest proportions of Winter Texans come from midwestern states.
Study Results: Demographic Characteristics
13
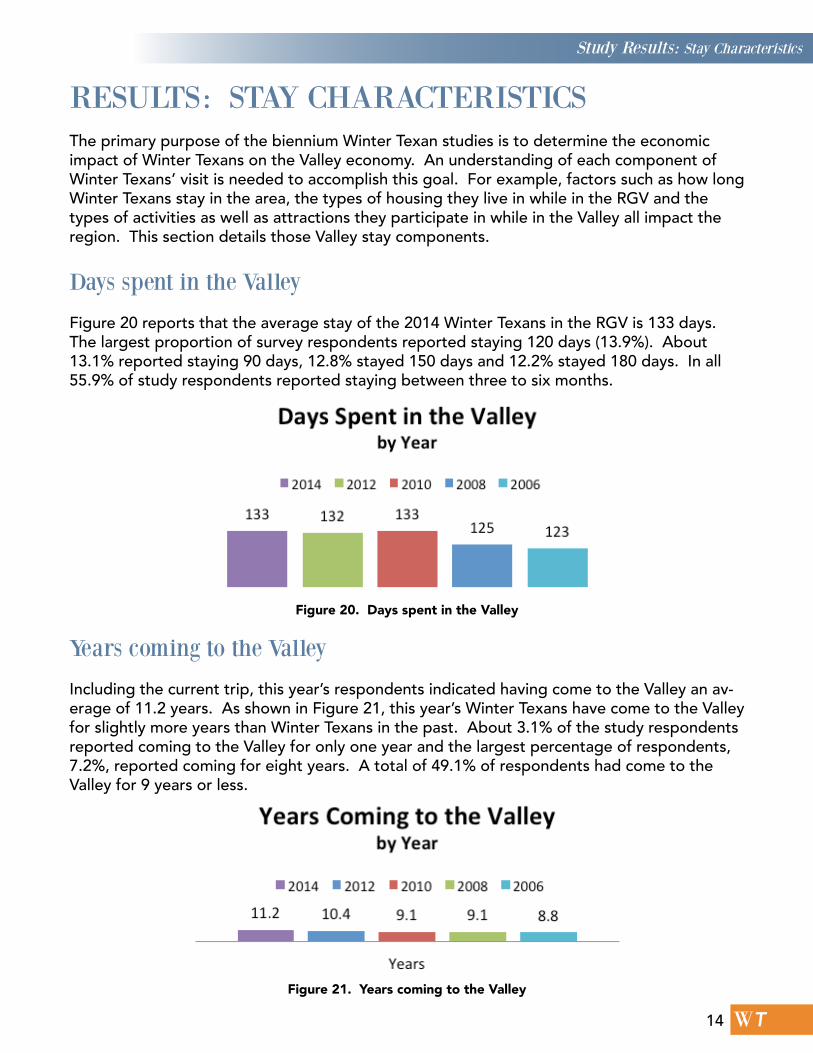
Figure 20. Days spent in the Valley
Figure 21. Years coming to the Valley
WT
RESULTS: STAY CHARACTERISTICSThe primary purpose of the biennium Winter Texan studies is to determine the economic impact of Winter Texans on the Valley economy. An understanding of each component of Winter Texans’ visit is needed to accomplish this goal. For example, factors such as how long Winter Texans stay in the area, the types of housing they live in while in the RGV and the types of activities as well as attractions they participate in while in the Valley all impact the region. This section details those Valley stay components.
Days spent in the Valley
Figure 20 reports that the average stay of the 2014 Winter Texans in the RGV is 133 days. The largest proportion of survey respondents reported staying 120 days (13.9%). About 13.1% reported staying 90 days, 12.8% stayed 150 days and 12.2% stayed 180 days. In all 55.9% of study respondents reported staying between three to six months.
Years coming to the Valley
Including the current trip, this year’s respondents indicated having come to the Valley an av-erage of 11.2 years. As shown in Figure 21, this year’s Winter Texans have come to the Valley for slightly more years than Winter Texans in the past. About 3.1% of the study respondents reported coming to the Valley for only one year and the largest percentage of respondents, 7.2%, reported coming for eight years. A total of 49.1% of respondents had come to the Valley for 9 years or less.
Study Results: Stay Characteristics
14
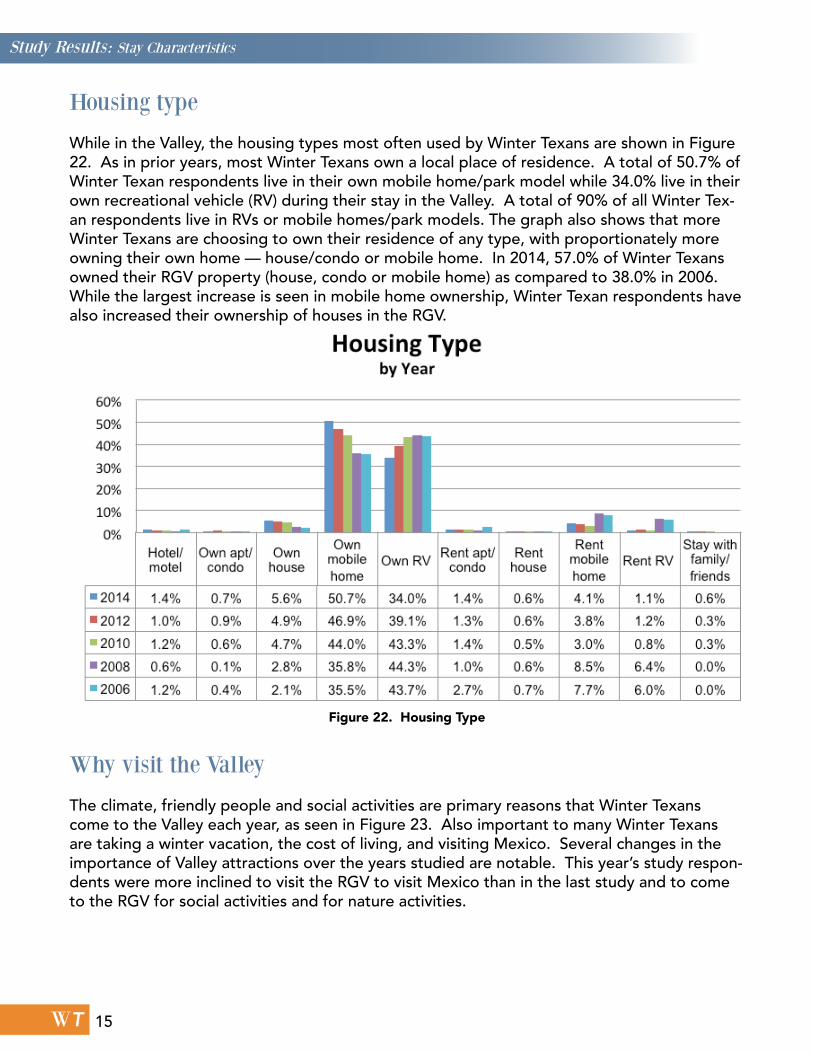
Figure 22. Housing Type
WT
Housing type
While in the Valley, the housing types most often used by Winter Texans are shown in Figure 22. As in prior years, most Winter Texans own a local place of residence. A total of 50.7% of Winter Texan respondents live in their own mobile home/park model while 34.0% live in their own recreational vehicle (RV) during their stay in the Valley. A total of 90% of all Winter Tex-an respondents live in RVs or mobile homes/park models. The graph also shows that more Winter Texans are choosing to own their residence of any type, with proportionately more owning their own home — house/condo or mobile home. In 2014, 57.0% of Winter Texans owned their RGV property (house, condo or mobile home) as compared to 38.0% in 2006. While the largest increase is seen in mobile home ownership, Winter Texan respondents have also increased their ownership of houses in the RGV.
Why visit the Valley The climate, friendly people and social activities are primary reasons that Winter Texans come to the Valley each year, as seen in Figure 23. Also important to many Winter Texans are taking a winter vacation, the cost of living, and visiting Mexico. Several changes in the importance of Valley attractions over the years studied are notable. This year’s study respon-dents were more inclined to visit the RGV to visit Mexico than in the last study and to come to the RGV for social activities and for nature activities.
Study Results: Stay Characteristics
15
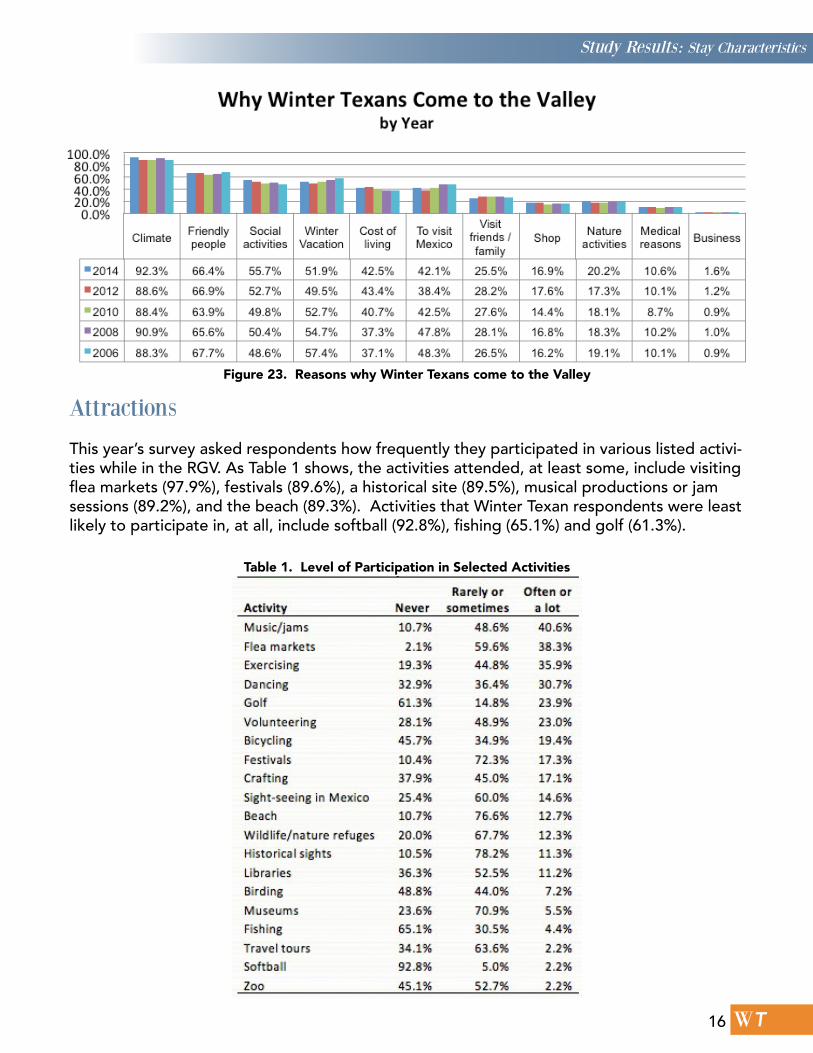
Figure 23. Reasons why Winter Texans come to the Valley
Table 1. Level of Participation in Selected Activities
WT
Attractions
This year’s survey asked respondents how frequently they participated in various listed activi-ties while in the RGV. As Table 1 shows, the activities attended, at least some, include visiting flea markets (97.9%), festivals (89.6%), a historical site (89.5%), musical productions or jam sessions (89.2%), and the beach (89.3%). Activities that Winter Texan respondents were least likely to participate in, at all, include softball (92.8%), fishing (65.1%) and golf (61.3%).
Study Results: Stay Characteristics
16
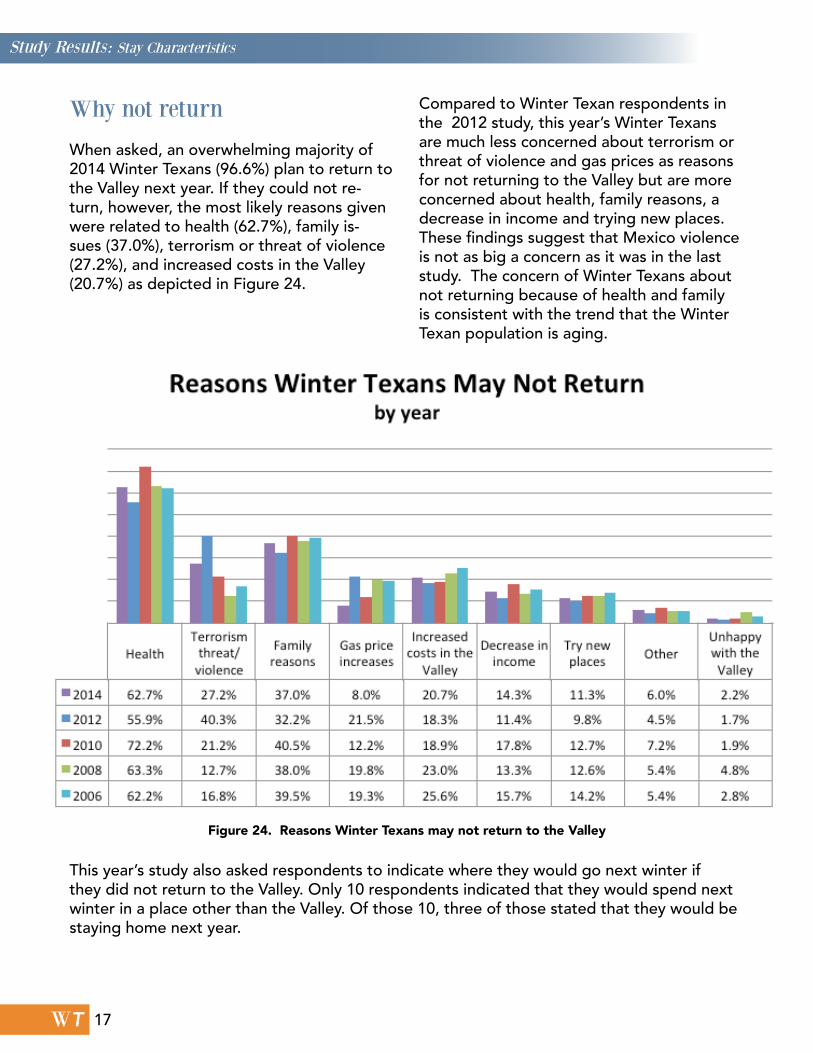
Figure 24. Reasons Winter Texans may not return to the Valley
WT
Why not return When asked, an overwhelming majority of 2014 Winter Texans (96.6%) plan to return to the Valley next year. If they could not re-turn, however, the most likely reasons given were related to health (62.7%), family is-sues (37.0%), terrorism or threat of violence (27.2%), and increased costs in the Valley (20.7%) as depicted in Figure 24.
Compared to Winter Texan respondents in the 2012 study, this year’s Winter Texans are much less concerned about terrorism or threat of violence and gas prices as reasons for not returning to the Valley but are more concerned about health, family reasons, a decrease in income and trying new places. These findings suggest that Mexico violence is not as big a concern as it was in the last study. The concern of Winter Texans about not returning because of health and family is consistent with the trend that the Winter Texan population is aging.
This year’s study also asked respondents to indicate where they would go next winter if they did not return to the Valley. Only 10 respondents indicated that they would spend next winter in a place other than the Valley. Of those 10, three of those stated that they would be staying home next year.
Study Results: Stay Characteristics
17
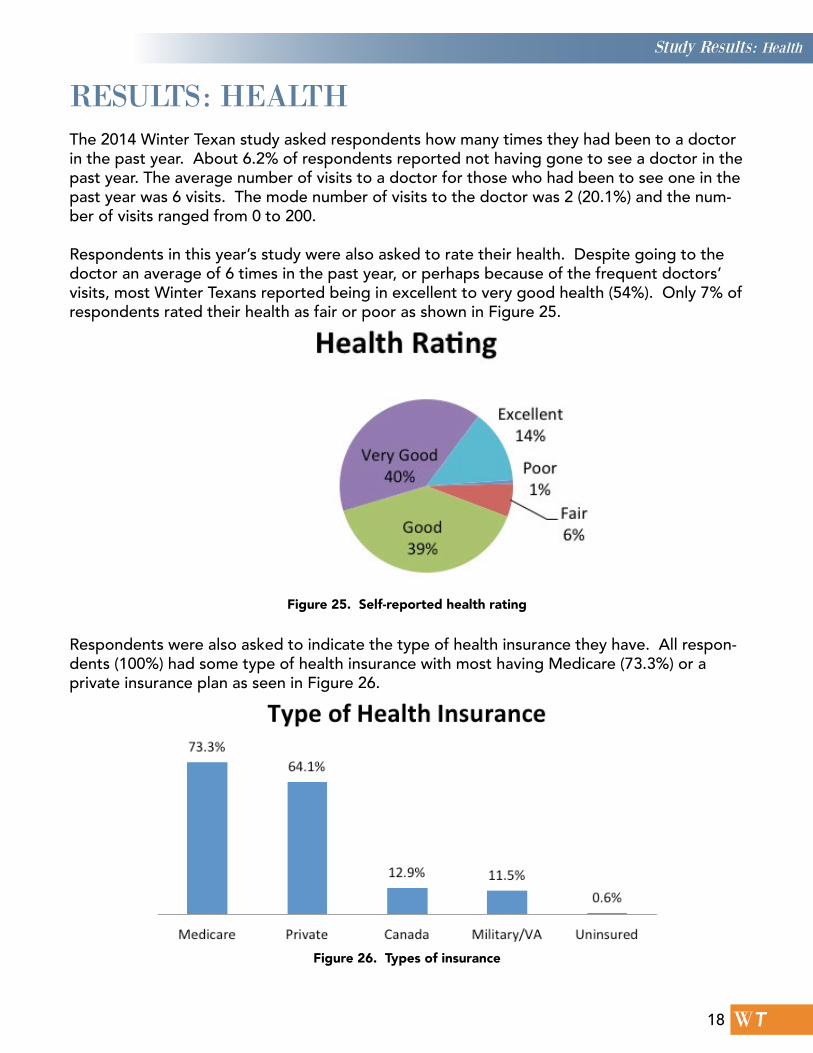
Figure 25. Self-reported health rating
Figure 26. Types of insurance
WT
RESULTS: HEALTHThe 2014 Winter Texan study asked respondents how many times they had been to a doctor in the past year. About 6.2% of respondents reported not having gone to see a doctor in the past year. The average number of visits to a doctor for those who had been to see one in the past year was 6 visits. The mode number of visits to the doctor was 2 (20.1%) and the num-ber of visits ranged from 0 to 200.
Respondents in this year’s study were also asked to rate their health. Despite going to the doctor an average of 6 times in the past year, or perhaps because of the frequent doctors’ visits, most Winter Texans reported being in excellent to very good health (54%). Only 7% of respondents rated their health as fair or poor as shown in Figure 25.
Respondents were also asked to indicate the type of health insurance they have. All respon-dents (100%) had some type of health insurance with most having Medicare (73.3%) or a private insurance plan as seen in Figure 26.
Study Results: Health
18

Figure 27. Winter Texan travel to Mexico border towns
WT
RESULTS: EXPENDITURE PATTERNS IN MEXICOMost Winter Texans (86.6%) reported making one or more trips to Mexico as shown in Figure 27. The average number of trips was 5.3. Figure 27 also shows Winter Texan visits to Mexico border towns since 2006. Both the number of Winter Texans visiting Mexico border towns and the number of trips taken have declined since 2006, reaching a low in 2012, which corresponds to heightened drug violence in Mexico beginning in spring of 2010. This year’s study’s respondents, however, have returned to 2010 levels in terms of percentage of respondents visiting Mexico but the percentage visiting is still much less than in 2008.
Winter Texan spending in Mexico border towns is estimated in two ways. First, respondents were asked to indicate about how much they spent per trip to Mexico, on average. A to-tal of 85.2% of the Winter Texans reported making a purchase in a Mexico border town, with those purchases averaging $92 per trip to Mexico, up from $72 in 2012. Respondents were then asked to estimate how much they spent in Mexico, on an average trip, in one of seven different spending categories. Using this method, Winter Texans spent an average of $170 per trip to Mexico as shown in Table 2. The difference between the two spending methods is likely attributable to large purchas-es made during one trip that are not made
during other trips. For example, a respondent reported spending an average of $25 on each trip to Mexico but then indicated spending $2,000 on dental expenses per trip. The Table 2 results show that in 2014, Winter Texans’ average nominal spending in Mexico had in-creased slightly from prior years.
While in Mexico, most Winter Texans spent money on shopping items (75.8% spent an average of $38.74), on dining (68.2% spent an average of $25.86) on prescriptions (49.5% spent an average of $64.07) and on dental (40.9% spent an average of $197.08) as shown in Table 2.
Study Results: Expenditure Patterns in Mexico
19
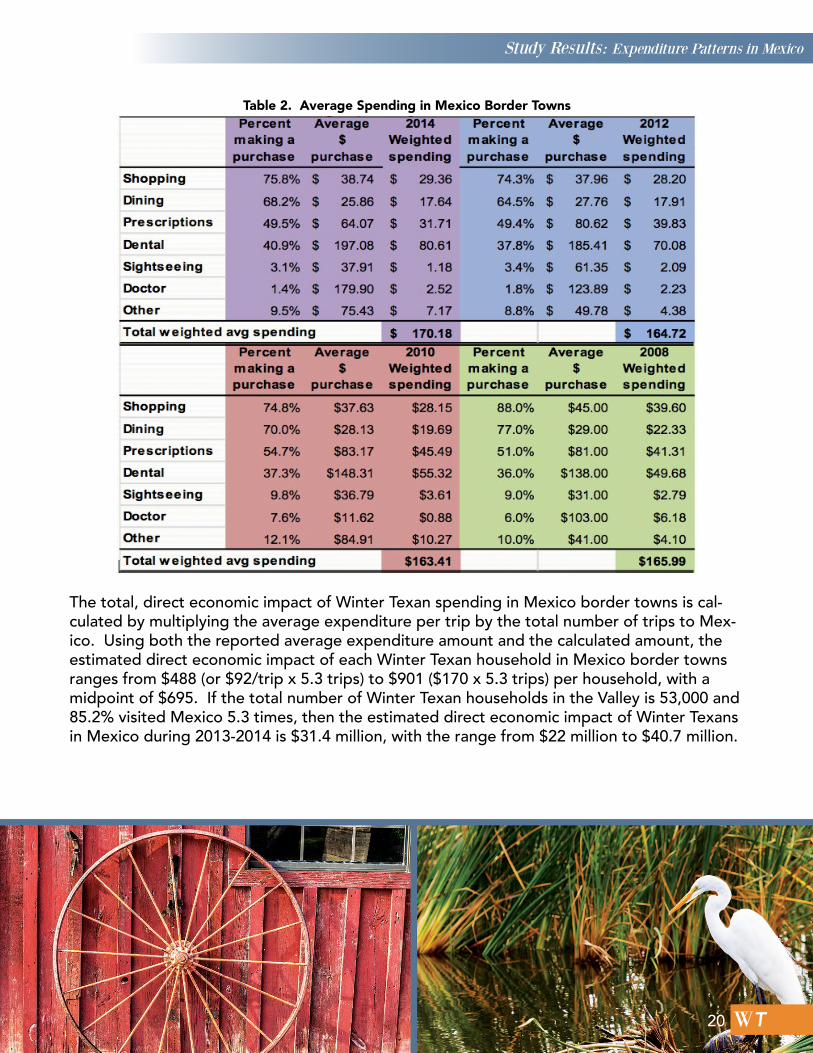
Table 2. Average Spending in Mexico Border Towns
WT
The total, direct economic impact of Winter Texan spending in Mexico border towns is cal-culated by multiplying the average expenditure per trip by the total number of trips to Mex-ico. Using both the reported average expenditure amount and the calculated amount, the estimated direct economic impact of each Winter Texan household in Mexico border towns ranges from $488 (or $92/trip x 5.3 trips) to $901 ($170 x 5.3 trips) per household, with a midpoint of $695. If the total number of Winter Texan households in the Valley is 53,000 and 85.2% visited Mexico 5.3 times, then the estimated direct economic impact of Winter Texans in Mexico during 2013-2014 is $31.4 million, with the range from $22 million to $40.7 million.
Study Results: Expenditure Patterns in Mexico
20
WT
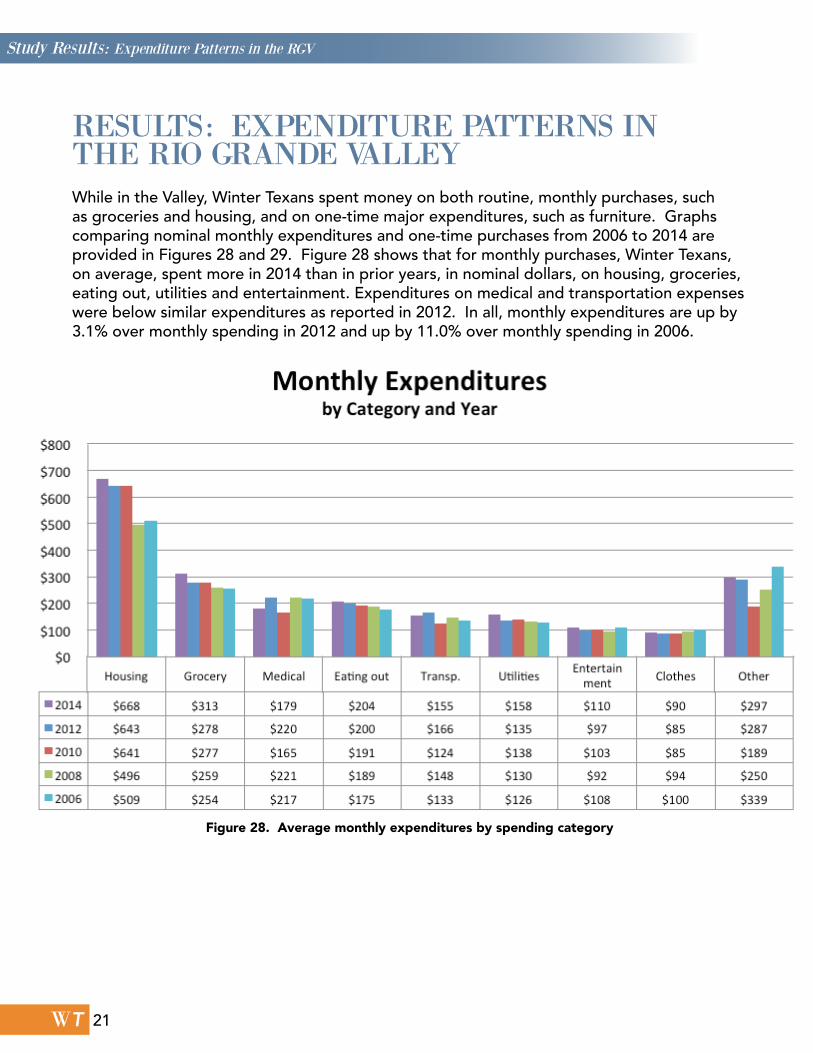
Figure 28. Average monthly expenditures by spending category
RESULTS: EXPENDITURE PATTERNS IN THE RIO GRANDE VALLEYWhile in the Valley, Winter Texans spent money on both routine, monthly purchases, such as groceries and housing, and on one-time major expenditures, such as furniture. Graphs comparing nominal monthly expenditures and one-time purchases from 2006 to 2014 are provided in Figures 28 and 29. Figure 28 shows that for monthly purchases, Winter Texans, on average, spent more in 2014 than in prior years, in nominal dollars, on housing, groceries, eating out, utilities and entertainment. Expenditures on medical and transportation expenses were below similar expenditures as reported in 2012. In all, monthly expenditures are up by 3.1% over monthly spending in 2012 and up by 11.0% over monthly spending in 2006.
Study Results: Expenditure Patterns in the RGV
21
WT
Figure 29. Weighted average spending on major purchases
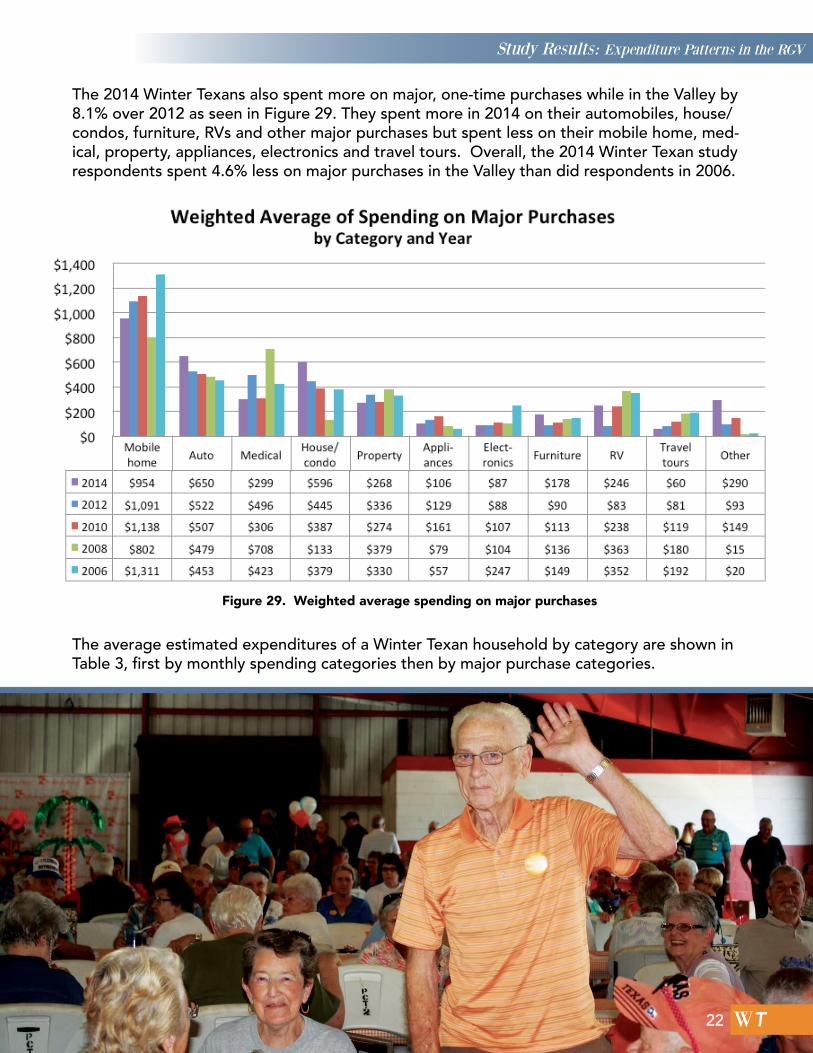
The 2014 Winter Texans also spent more on major, one-time purchases while in the Valley by 8.1% over 2012 as seen in Figure 29. They spent more in 2014 on their automobiles, house/condos, furniture, RVs and other major purchases but spent less on their mobile home, med-ical, property, appliances, electronics and travel tours. Overall, the 2014 Winter Texan study respondents spent 4.6% less on major purchases in the Valley than did respondents in 2006.
The average estimated expenditures of a Winter Texan household by category are shown in Table 3, first by monthly spending categories then by major purchase categories.
Study Results: Expenditure Patterns in the RGV
22

WT
Table 3. Winter Texan Household Spending in the Valley by Expenditure Category for 2006-20121
Figure 30. RGV spending
The table shows that Winter Texans spent more on routine purchases this season — approx-imately $9,600 — as compared to prior seasons — a nominal percentage growth of 30.6% from 2012 and 59.0% from 2006. Considering both monthly and one-time expenditures, in 2014 Winter Texans spent $13,370 while in the Valley, a 23.4% increase over the 2012-2013 Winter Texan season, as seen in Figure 30.
Study Results: Expenditure Patterns in the RGV
23
WT
THE 2014 PARK STUDY INTRODUCTIONTo estimate the total number of Winter Tex-ans who stayed in the Valley during the year, survey questionnaires were mailed or faxed to local recreational vehicle (RV) and mobile home (MH) parks. The results from this sur-vey and those from the survey of Winter Tex-ans are used to estimate the total number of Winter Texans in the Valley during 2013-2014 as well as the direct, economic impact that the Winter Texans have on the region.
Estimating the number of Winter Texans in the Valley is extremely difficult for a number of reasons. First, many Winter Texans own their own residence as shown previously in this study. Time actually spent at an owned residence is difficult, if not impossible, to determine. These residents come and go without any way of tracking their presence. Second, often the RV and MH parks do not track the numbers and turnover of Winter Texans in their parks. The park may not know if a particular visitor is a Winter Texan or a transitory tourist. Third, some parks
likely track occupancy of sites but not nec-essarily turnover with respect to different Winter Texans. Additionally, the parks have no real way of keeping track of Winter Tex-an visitors when the visitors own their own mobile home/park model in the park. Fifth, many parks do not participate in the study, perhaps skewing the results. Finally, an ac-curate tally of the population of parks — the number of parks and sites in the park — is a critical component of the estimation process but is virtually impossible to confirm. For example, different respondents from the same park replied to this year’s question-naire, each with a different site and Winter Texan numbers. Despite these challenges, information from a directory of parks and from the park respondents willing to pro-vide information about their experiences with Winter Texans allows an estimate of the number of Winter Texans in the Valley during the 2014 season, bearing in mind the flaws with obtaining the estimate.
24

WT
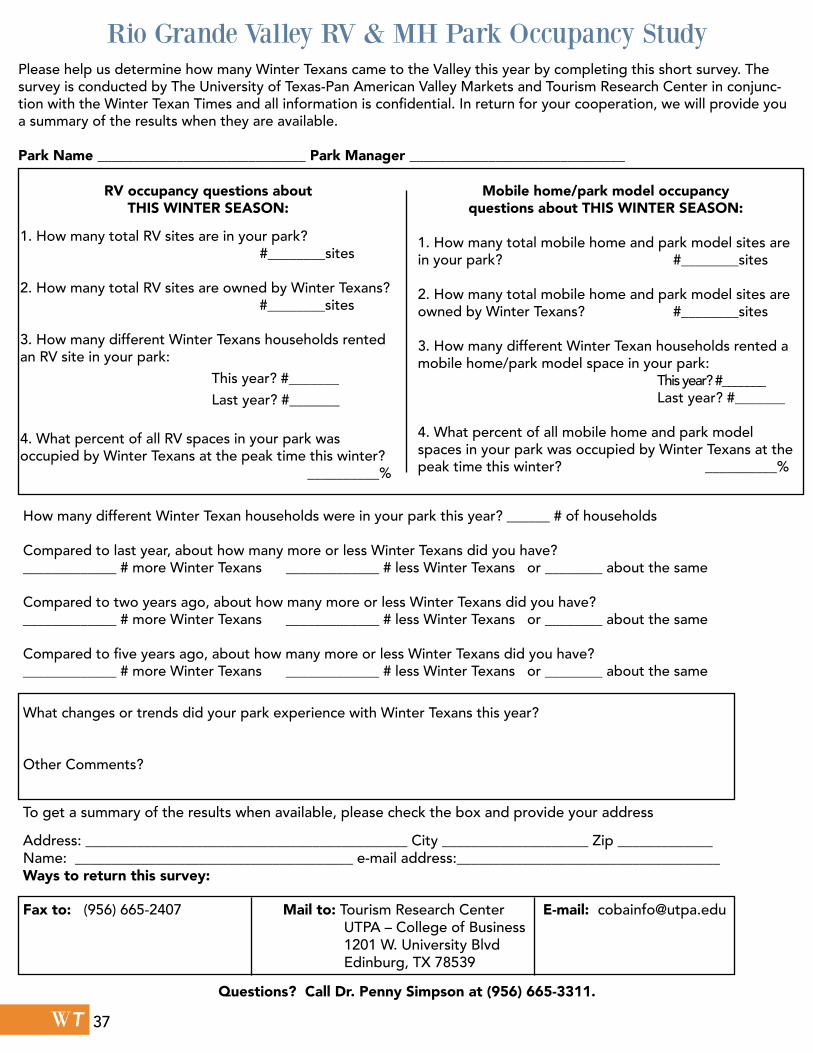
PARK STUDY METHODOLOGY A questionnaire designed to determine the number of Winter Texans staying in mobile home and RV parks was developed based on the questionnaire used in prior Winter Texan studies. The questionnaire, shown in Appen-dix A, asked park manager/owners to indicate how many RV and mobile home/park model sites are in their park, how many of the sites are owned by Winter Texans, how many were rented by Winter Texans and what percent of the park was occupied by Winter Texans during the peak time of the season. Park owners/managers were also asked to estimate how many total Winter Texan households were in their park during the season and if this number was less or more than the num-ber of Winter Texans last year, two years ago
and more or less than five years ago. Finally, park owners/managers were asked to indicate what changes or trends they experienced with Winter Texans this year.
All Rio Grande Valley Mobile Home and RV parks are listed in the Park Directory 2013-2014 Edition published by the Winter Texan Times and available at http://wintertexan-times.com. Each of these parks listed in the directory was sent a questionnaire by mail and then twice by fax if the fax number was known and most were called by phone. Respondents were asked to either fax the questionnaire to the Business and Tourism Research Center or to return the questionnaire in an enclosed, self-addressed envelope with postage paid.
Study Results: Park Population and Park Survey
25
WT
Figure 31. Directory: RV and mobile home sites per park
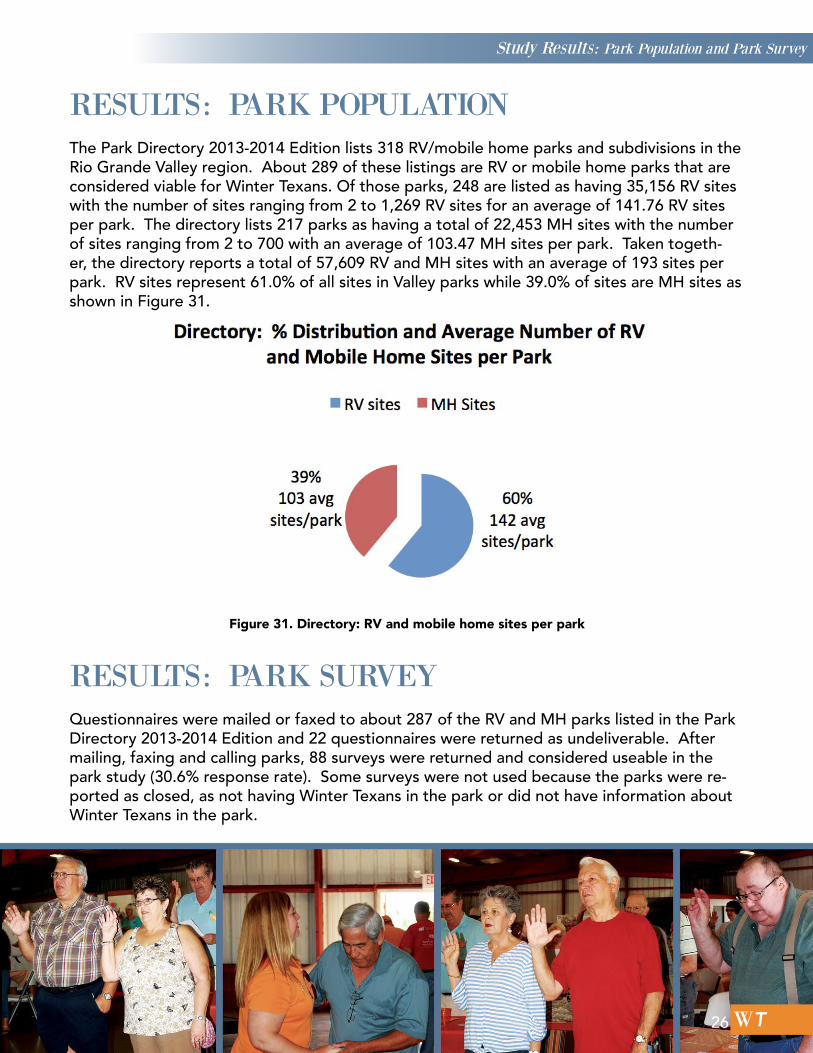
RESULTS: PARK POPULATIONThe Park Directory 2013-2014 Edition lists 318 RV/mobile home parks and subdivisions in the Rio Grande Valley region. About 289 of these listings are RV or mobile home parks that are considered viable for Winter Texans. Of those parks, 248 are listed as having 35,156 RV sites with the number of sites ranging from 2 to 1,269 RV sites for an average of 141.76 RV sites per park. The directory lists 217 parks as having a total of 22,453 MH sites with the number of sites ranging from 2 to 700 with an average of 103.47 MH sites per park. Taken togeth-er, the directory reports a total of 57,609 RV and MH sites with an average of 193 sites per park. RV sites represent 61.0% of all sites in Valley parks while 39.0% of sites are MH sites as shown in Figure 31.
RESULTS: PARK SURVEYQuestionnaires were mailed or faxed to about 287 of the RV and MH parks listed in the Park Directory 2013-2014 Edition and 22 questionnaires were returned as undeliverable. After mailing, faxing and calling parks, 88 surveys were returned and considered useable in the park study (30.6% response rate). Some surveys were not used because the parks were re-ported as closed, as not having Winter Texans in the park or did not have information about Winter Texans in the park.
Study Results: Park Population and Park Survey
26

Figure 32. Park survey: RV and MH sites/park
WT
From the 88 at least partially completed park survey responses, 84 parks reported having a total of 16,378 RV sites and 66 parks reported having 11,175 MH sites. Of all parks sites re-ported, 40.6% are RV sites while 59.4% are MH sites as seen in Figure 32. The average num-ber of RV sites for all reporting parks is 195 per park and the average number of MH sites is 169 (see Figure 32) for an average of 313 total sites per park. The proportion breakdown of RV sites and MH sites in all Valley parks as reported in the park survey is consistent with that of the Park Directory although the average number of sites reported in the survey is substan-tially more than the average reported in the Park Directory.
Study Results: Park Population and Park Survey
27
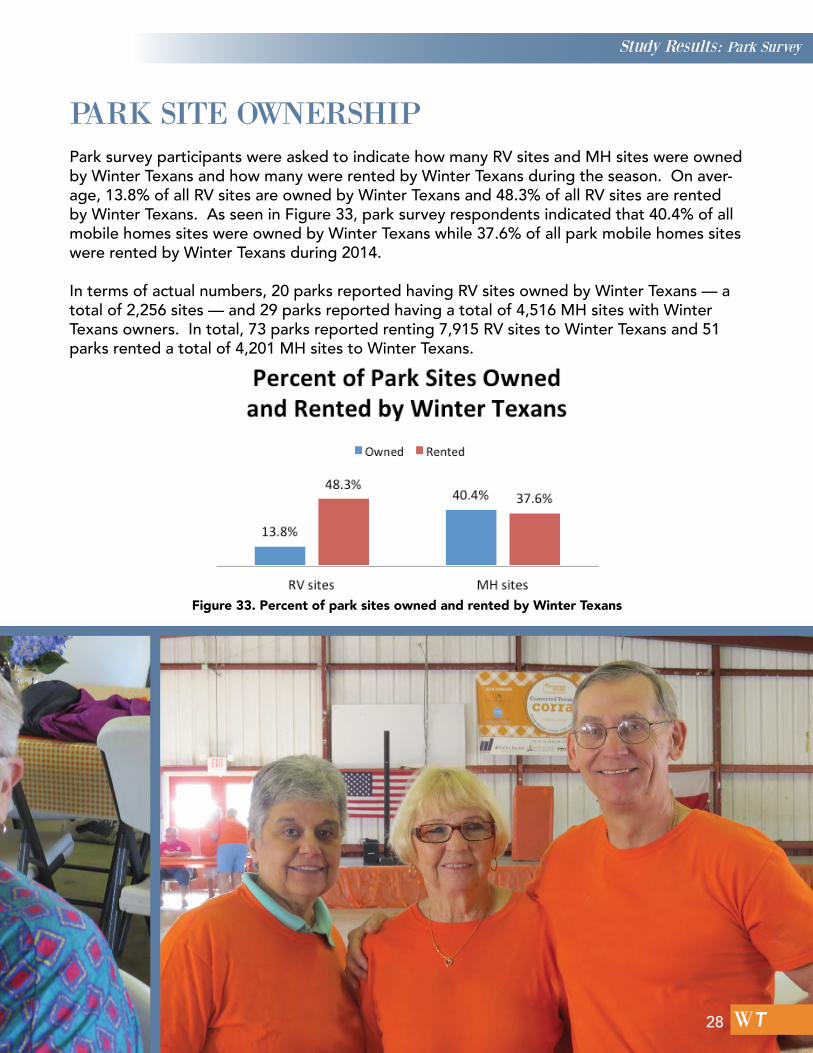
Figure 33. Percent of park sites owned and rented by Winter Texans
WT
PARK SITE OWNERSHIPPark survey participants were asked to indicate how many RV sites and MH sites were owned by Winter Texans and how many were rented by Winter Texans during the season. On aver-age, 13.8% of all RV sites are owned by Winter Texans and 48.3% of all RV sites are rented by Winter Texans. As seen in Figure 33, park survey respondents indicated that 40.4% of all mobile homes sites were owned by Winter Texans while 37.6% of all park mobile homes sites were rented by Winter Texans during 2014.
In terms of actual numbers, 20 parks reported having RV sites owned by Winter Texans — a total of 2,256 sites — and 29 parks reported having a total of 4,516 MH sites with Winter Texans owners. In total, 73 parks reported renting 7,915 RV sites to Winter Texans and 51 parks rented a total of 4,201 MH sites to Winter Texans.
Study Results: Park Survey
28
WT
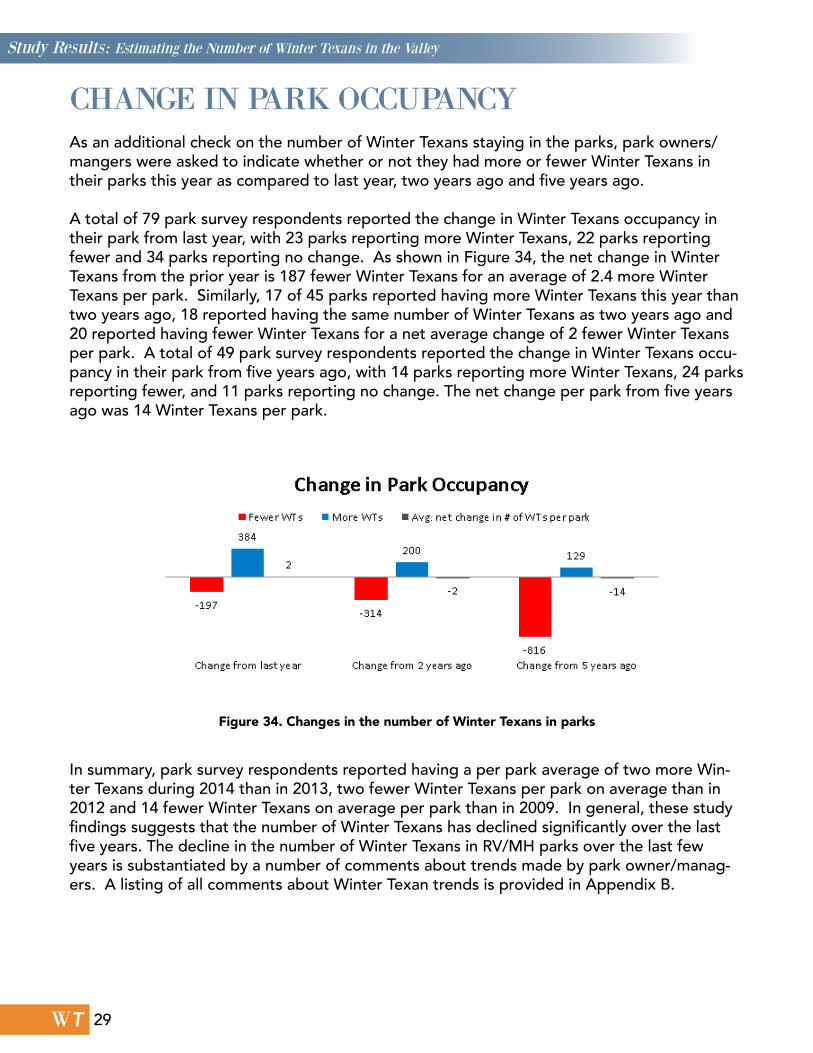
CHANGE IN PARK OCCUPANCYAs an additional check on the number of Winter Texans staying in the parks, park owners/mangers were asked to indicate whether or not they had more or fewer Winter Texans in their parks this year as compared to last year, two years ago and five years ago.
A total of 79 park survey respondents reported the change in Winter Texans occupancy in their park from last year, with 23 parks reporting more Winter Texans, 22 parks reporting fewer and 34 parks reporting no change. As shown in Figure 34, the net change in Winter Texans from the prior year is 187 fewer Winter Texans for an average of 2.4 more Winter Texans per park. Similarly, 17 of 45 parks reported having more Winter Texans this year than two years ago, 18 reported having the same number of Winter Texans as two years ago and 20 reported having fewer Winter Texans for a net average change of 2 fewer Winter Texans per park. A total of 49 park survey respondents reported the change in Winter Texans occu-pancy in their park from five years ago, with 14 parks reporting more Winter Texans, 24 parks reporting fewer, and 11 parks reporting no change. The net change per park from five years ago was 14 Winter Texans per park.
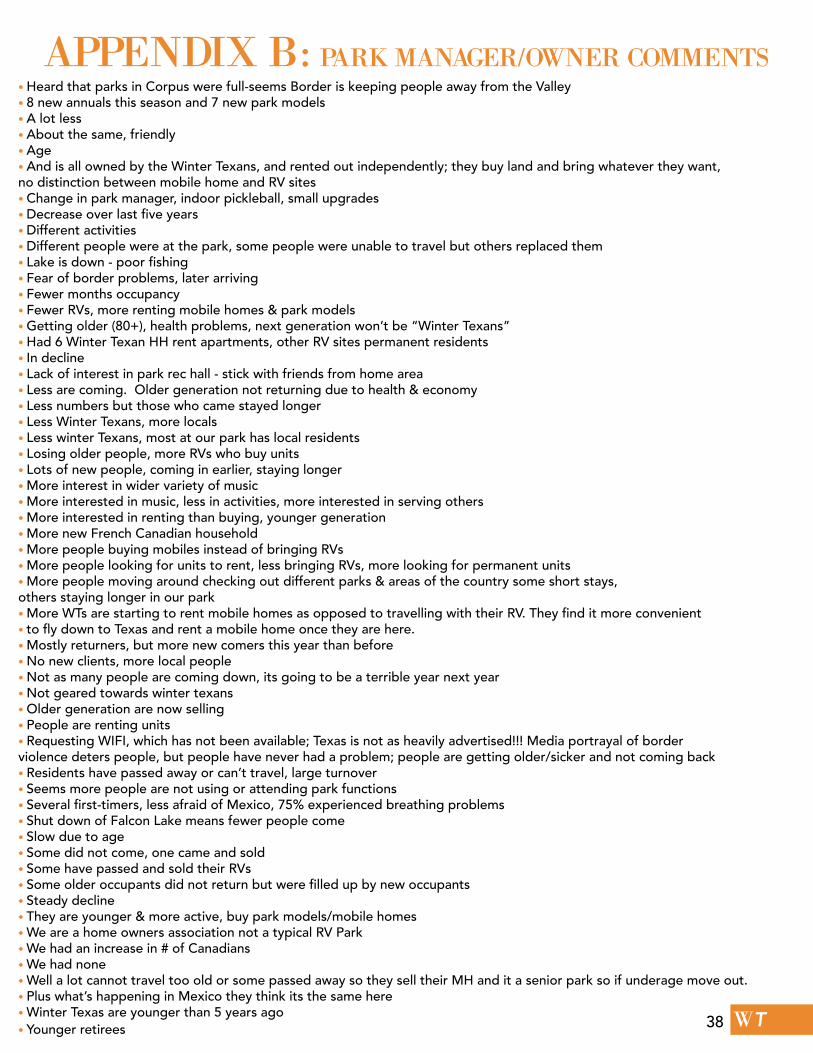
In summary, park survey respondents reported having a per park average of two more Win-ter Texans during 2014 than in 2013, two fewer Winter Texans per park on average than in 2012 and 14 fewer Winter Texans on average per park than in 2009. In general, these study findings suggests that the number of Winter Texans has declined significantly over the last five years. The decline in the number of Winter Texans in RV/MH parks over the last few years is substantiated by a number of comments about trends made by park owner/manag-ers. A listing of all comments about Winter Texan trends is provided in Appendix B.
Figure 34. Changes in the number of Winter Texans in parks
Study Results: Estimating the Number of Winter Texans in the Valley
29
WT
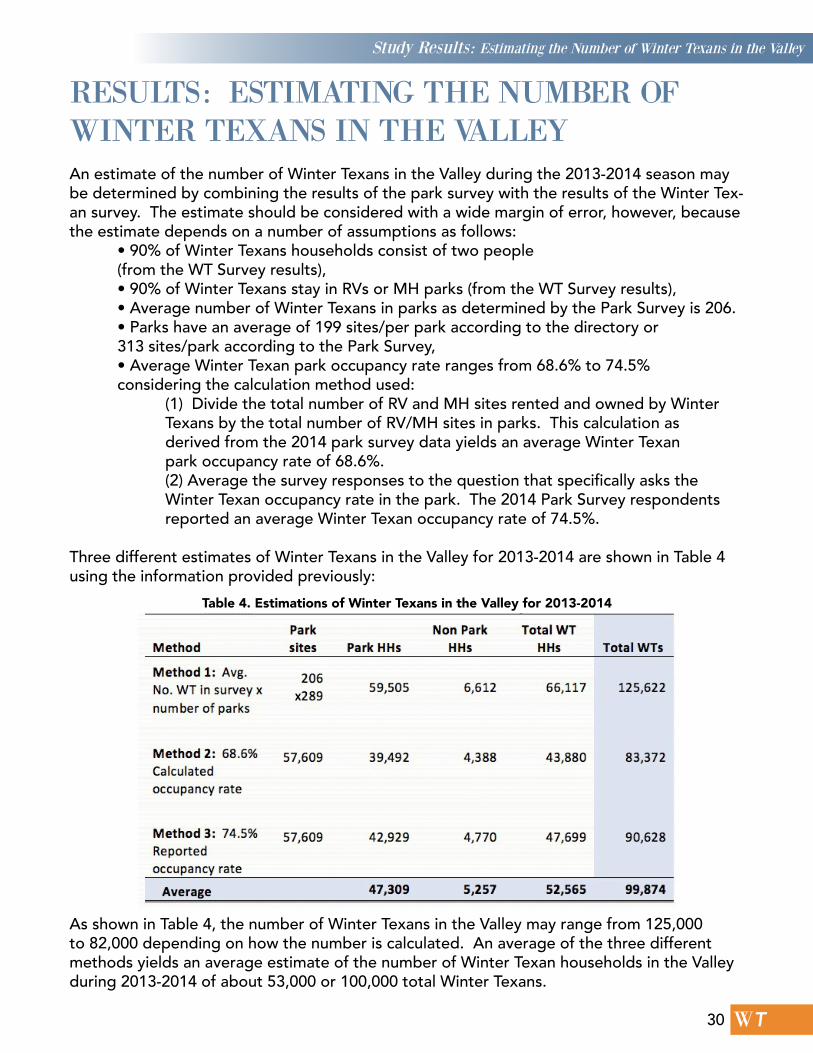
RESULTS: ESTIMATING THE NUMBER OF WINTER TEXANS IN THE VALLEYAn estimate of the number of Winter Texans in the Valley during the 2013-2014 season may be determined by combining the results of the park survey with the results of the Winter Tex-an survey. The estimate should be considered with a wide margin of error, however, because the estimate depends on a number of assumptions as follows: • 90% of Winter Texans households consist of two people (from the WT Survey results), • 90% of Winter Texans stay in RVs or MH parks (from the WT Survey results), • Average number of Winter Texans in parks as determined by the Park Survey is 206. • Parks have an average of 199 sites/per park according to the directory or 313 sites/park according to the Park Survey, • Average Winter Texan park occupancy rate ranges from 68.6% to 74.5% considering the calculation method used: (1) Divide the total number of RV and MH sites rented and owned by Winter Texans by the total number of RV/MH sites in parks. This calculation as derived from the 2014 park survey data yields an average Winter Texan park occupancy rate of 68.6%. (2) Average the survey responses to the question that specifically asks the Winter Texan occupancy rate in the park. The 2014 Park Survey respondents reported an average Winter Texan occupancy rate of 74.5%.
Three different estimates of Winter Texans in the Valley for 2013-2014 are shown in Table 4 using the information provided previously:
As shown in Table 4, the number of Winter Texans in the Valley may range from 125,000 to 82,000 depending on how the number is calculated. An average of the three different methods yields an average estimate of the number of Winter Texan households in the Valley during 2013-2014 of about 53,000 or 100,000 total Winter Texans.
Table 4. Estimations of Winter Texans in the Valley for 2013-2014
Study Results: Estimating the Number of Winter Texans in the Valley
30
WT
DIRECT IMPACT OF WINTER TEXANS ON
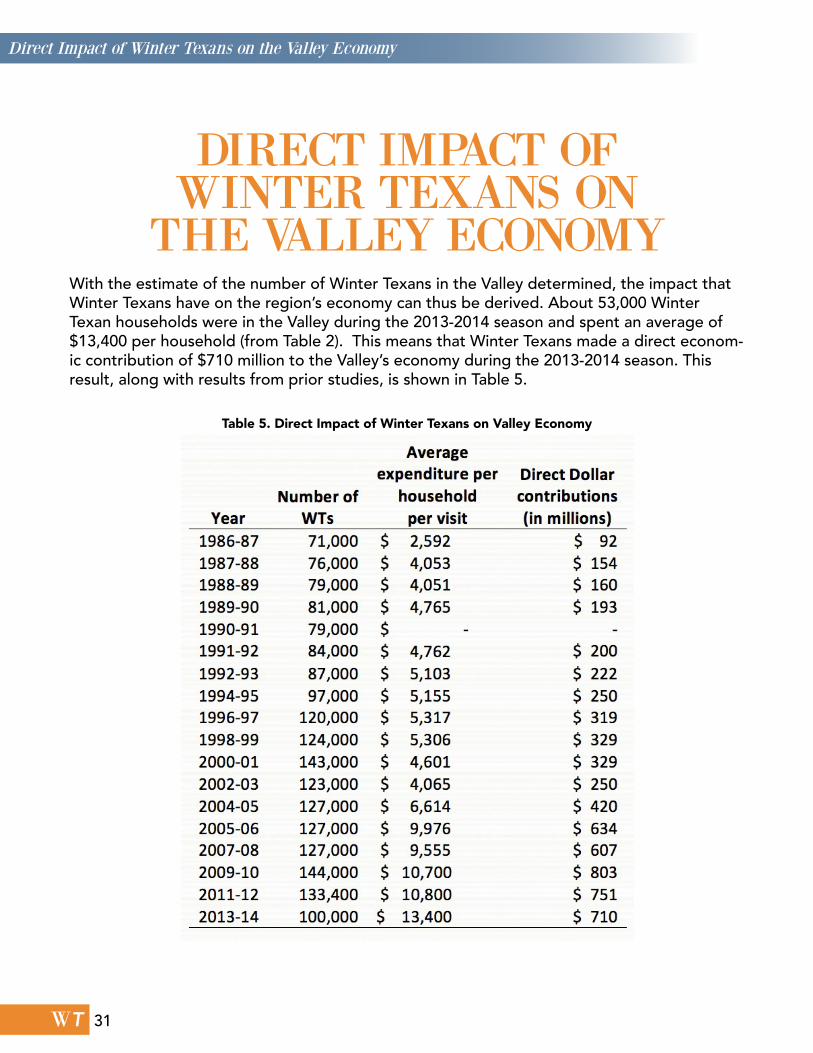
THE VALLEY ECONOMYWith the estimate of the number of Winter Texans in the Valley determined, the impact that Winter Texans have on the region’s economy can thus be derived. About 53,000 Winter Texan households were in the Valley during the 2013-2014 season and spent an average of $13,400 per household (from Table 2). This means that Winter Texans made a direct econom-ic contribution of $710 million to the Valley’s economy during the 2013-2014 season. This result, along with results from prior studies, is shown in Table 5.
Table 5. Direct Impact of Winter Texans on Valley Economy
Direct Impact of Winter Texans on the Valley Economy
31
WT
The 2013-2014 Winter Texan study reports the demographic characteristics, stay char-acteristics, and expenditure patterns of 1,394 Winter Texans who participated in the study. This report also shows a comparison of responses from this year’s Winter Texans to answers from Winter Texans as reported in Winter Texan studies since 2006.
In general, most characteristics of this year’s study participants are similar to respondents from past studies. For example, as in past years, this year’s average study respondent is a married, white female, with at least some college education, is in a two-person household and has been retired for more than one year. This year, Winter Texan households had an average income level of about $59,000, up from prior years.
This year’s study participants have come to the Valley for 11.2 years, stayed in the Valley for 133 days and generally own their Valley residence, usually a mobile home/park mod-el or a RV. The period of time Winter Texans stay in the Valley remained relatively consis-tent with the prior studies, but the propor-tion of Winter Texans who own their own residence has increased over time while the ownership of RVs has declined.
The demographic and stay comparison of Winter Texans over the past five years suggests a trend of an aging Winter Texan population which is not being replaced by a younger Winter Texan retiree group. This finding could be a warning call for the area tourism industry to focus more efforts on attracting younger travelers to replace aging Winter Texans as their health and travel to the Valley declines. The trend could be explained by factors not related to age, however. For example, Winter Texans who participate in the study may not be repre-sentative of nonparticipants. Without defin-itive evidence either way about the number of younger Winter Texans coming to the Val-ley to replace their older counterparts, this possible trend should be monitored closely each season so that action may be taken if needed.
As in prior years, typical respondents come to the Valley for the climate, the friendly people, the social activities, and as a winter vacation. While here, most Winter Texans visited flea markets and historical sites, attended musical performances and jam sessions, attended festivals, and went to the beach.
CONCLUSIONThe Winter Texan Study: Conclusion
33
WT
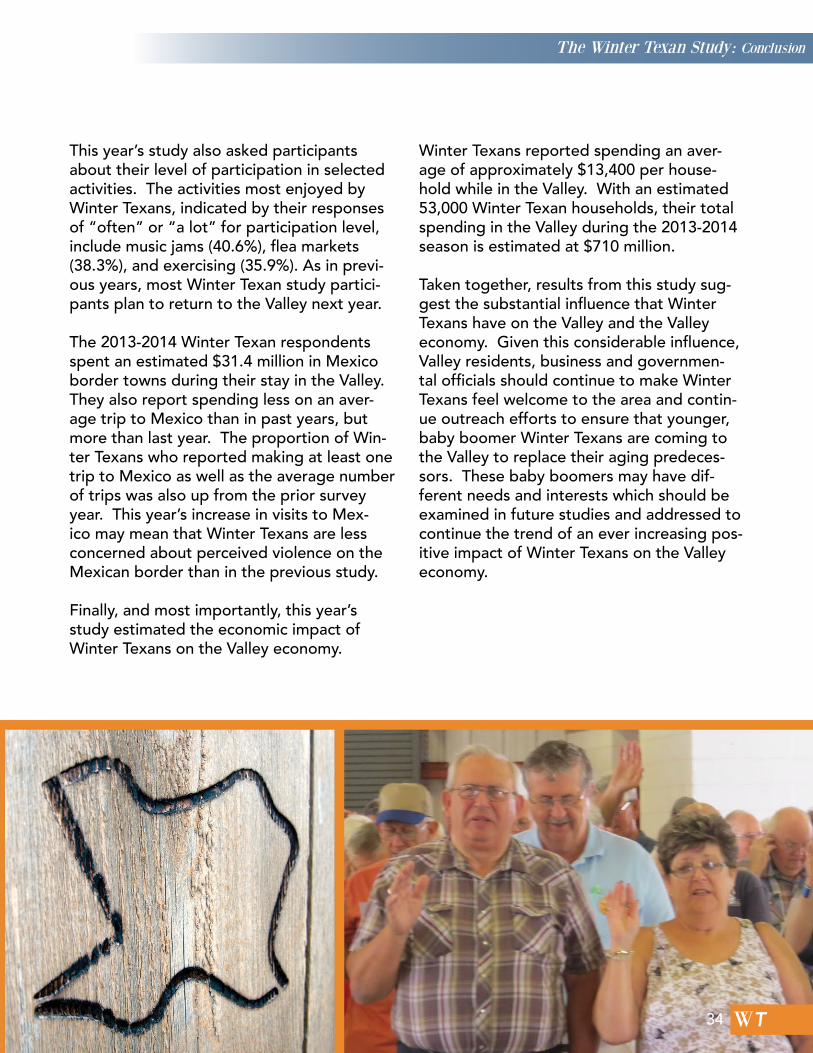
This year’s study also asked participants about their level of participation in selected activities. The activities most enjoyed by Winter Texans, indicated by their responses of “often” or “a lot” for participation level, include music jams (40.6%), flea markets (38.3%), and exercising (35.9%). As in previ-ous years, most Winter Texan study partici-pants plan to return to the Valley next year.
The 2013-2014 Winter Texan respondents spent an estimated $31.4 million in Mexico border towns during their stay in the Valley. They also report spending less on an aver-age trip to Mexico than in past years, but more than last year. The proportion of Win-ter Texans who reported making at least one trip to Mexico as well as the average number of trips was also up from the prior survey year. This year’s increase in visits to Mex-ico may mean that Winter Texans are less concerned about perceived violence on the Mexican border than in the previous study.
Finally, and most importantly, this year’s study estimated the economic impact of Winter Texans on the Valley economy.
Winter Texans reported spending an aver-age of approximately $13,400 per house-hold while in the Valley. With an estimated 53,000 Winter Texan households, their total spending in the Valley during the 2013-2014 season is estimated at $710 million.
Taken together, results from this study sug-gest the substantial influence that Winter Texans have on the Valley and the Valley economy. Given this considerable influence, Valley residents, business and governmen-tal officials should continue to make Winter Texans feel welcome to the area and contin-ue outreach efforts to ensure that younger, baby boomer Winter Texans are coming to the Valley to replace their aging predeces-sors. These baby boomers may have dif-ferent needs and interests which should be examined in future studies and addressed to continue the trend of an ever increasing pos-itive impact of Winter Texans on the Valley economy.
The Winter Texan Study: Conclusion
34

WT
APP
EN
DIX
A:
SUR
VE
Y I
NST
RU
ME
NT
S
35

WT36
WT
Rio Grande Valley RV & MH Park Occupancy StudyPlease help us determine how many Winter Texans came to the Valley this year by completing this short survey. The survey is conducted by The University of Texas-Pan American Valley Markets and Tourism Research Center in conjunc-tion with the Winter Texan Times and all information is confidential. In return for your cooperation, we will provide you a summary of the results when they are available.
Park Name _____________________________ Park Manager ______________________________
How many different Winter Texan households were in your park this year? ______ # of households
Compared to last year, about how many more or less Winter Texans did you have? _____________ # more Winter Texans _____________ # less Winter Texans or ________ about the same
Compared to two years ago, about how many more or less Winter Texans did you have? _____________ # more Winter Texans _____________ # less Winter Texans or ________ about the same Compared to five years ago, about how many more or less Winter Texans did you have? _____________ # more Winter Texans _____________ # less Winter Texans or ________ about the same
What changes or trends did your park experience with Winter Texans this year?
Other Comments?
To get a summary of the results when available, please check the box and provide your address Address: ____________________________________________ City ____________________ Zip _____________Name: ______________________________________ e-mail address:____________________________________Ways to return this survey:
Questions? Call Dr. Penny Simpson at (956) 665-3311.
Fax to: (956) 665-2407 Mail to: Tourism Research Center UTPA – College of Business 1201 W. University Blvd Edinburg, TX 78539
E-mail: [email protected]
RV occupancy questions about THIS WINTER SEASON:
1. How many total RV sites are in your park? #________sites
2. How many total RV sites are owned by Winter Texans? #________sites
3. How many different Winter Texans households rented an RV site in your park: This year? #_______ Last year? #_______ 4. What percent of all RV spaces in your park was occupied by Winter Texans at the peak time this winter? __________%
Mobile home/park model occupancy questions about THIS WINTER SEASON:
1. How many total mobile home and park model sites are in your park? #________sites 2. How many total mobile home and park model sites are owned by Winter Texans? #________sites 3. How many different Winter Texan households rented a mobile home/park model space in your park: This year? #_______ Last year? #_______ 4. What percent of all mobile home and park model spaces in your park was occupied by Winter Texans at the peak time this winter? __________%
37
WT
APPENDIX B: PARK MANAGER/OWNER COMMENTS• Heard that parks in Corpus were full-seems Border is keeping people away from the Valley• 8 new annuals this season and 7 new park models• A lot less• About the same, friendly• Age• And is all owned by the Winter Texans, and rented out independently; they buy land and bring whatever they want, no distinction between mobile home and RV sites• Change in park manager, indoor pickleball, small upgrades• Decrease over last five years• Different activities• Different people were at the park, some people were unable to travel but others replaced them• Lake is down - poor fishing• Fear of border problems, later arriving• Fewer months occupancy• Fewer RVs, more renting mobile homes & park models• Getting older (80+), health problems, next generation won’t be “Winter Texans”• Had 6 Winter Texan HH rent apartments, other RV sites permanent residents• In decline• Lack of interest in park rec hall - stick with friends from home area• Less are coming. Older generation not returning due to health & economy• Less numbers but those who came stayed longer• Less Winter Texans, more locals• Less winter Texans, most at our park has local residents• Losing older people, more RVs who buy units• Lots of new people, coming in earlier, staying longer• More interest in wider variety of music• More interested in music, less in activities, more interested in serving others• More interested in renting than buying, younger generation• More new French Canadian household• More people buying mobiles instead of bringing RVs• More people looking for units to rent, less bringing RVs, more looking for permanent units• More people moving around checking out different parks & areas of the country some short stays, others staying longer in our park• More WTs are starting to rent mobile homes as opposed to travelling with their RV. They find it more convenient • to fly down to Texas and rent a mobile home once they are here.• Mostly returners, but more new comers this year than before• No new clients, more local people• Not as many people are coming down, its going to be a terrible year next year• Not geared towards winter texans• Older generation are now selling• People are renting units• Requesting WIFI, which has not been available; Texas is not as heavily advertised!!! Media portrayal of border violence deters people, but people have never had a problem; people are getting older/sicker and not coming back• Residents have passed away or can’t travel, large turnover• Seems more people are not using or attending park functions• Several first-timers, less afraid of Mexico, 75% experienced breathing problems• Shut down of Falcon Lake means fewer people come• Slow due to age• Some did not come, one came and sold• Some have passed and sold their RVs• Some older occupants did not return but were filled up by new occupants• Steady decline• They are younger & more active, buy park models/mobile homes• We are a home owners association not a typical RV Park• We had an increase in # of Canadians• We had none• Well a lot cannot travel too old or some passed away so they sell their MH and it a senior park so if underage move out. • Plus what’s happening in Mexico they think its the same here• Winter Texas are younger than 5 years ago• Younger retirees 38