2014 SPE European Artificial Lift Forum (EuALF) Aberdeen ... · 2014 SPE European Artificial Lift...
22
2014 SPE European Artificial Lift Forum (EuALF) Aberdeen, Scotland 17–18th June, 2014 Production optimization of ESP wells in Iraq Rumaila oilfield Presenter - Peter O. Oyewole, SPE, BP (Subsurface ESP Team Leader)
Transcript of 2014 SPE European Artificial Lift Forum (EuALF) Aberdeen ... · 2014 SPE European Artificial Lift...

2014 SPE European Artificial Lift Forum (EuALF)
Aberdeen, Scotland
17–18th June, 2014
Production optimization of ESP wells in Iraq Rumaila oilfield
Presenter - Peter O. Oyewole, SPE,
BP
(Subsurface ESP Team Leader)

Presentation Objectives
• To introduce Rumaila ESP application and the “unconventional”
optimization strategy, workflow process and case history
• To share knowledge, lesson learnt and results (that might be valuable
for other operators)
• To obtain any feedback for further improvement
3
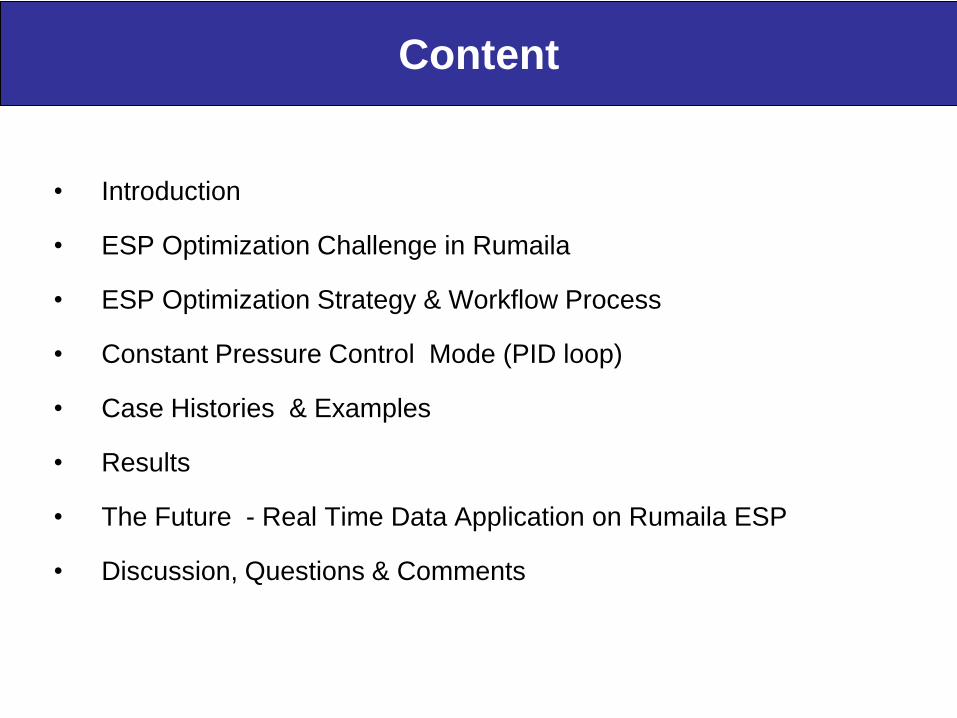
• Introduction
• ESP Optimization Challenge in Rumaila
• ESP Optimization Strategy & Workflow Process
• Constant Pressure Control Mode (PID loop)
• Case Histories & Examples
• Results
• The Future - Real Time Data Application on Rumaila ESP
• Discussion, Questions & Comments
Content
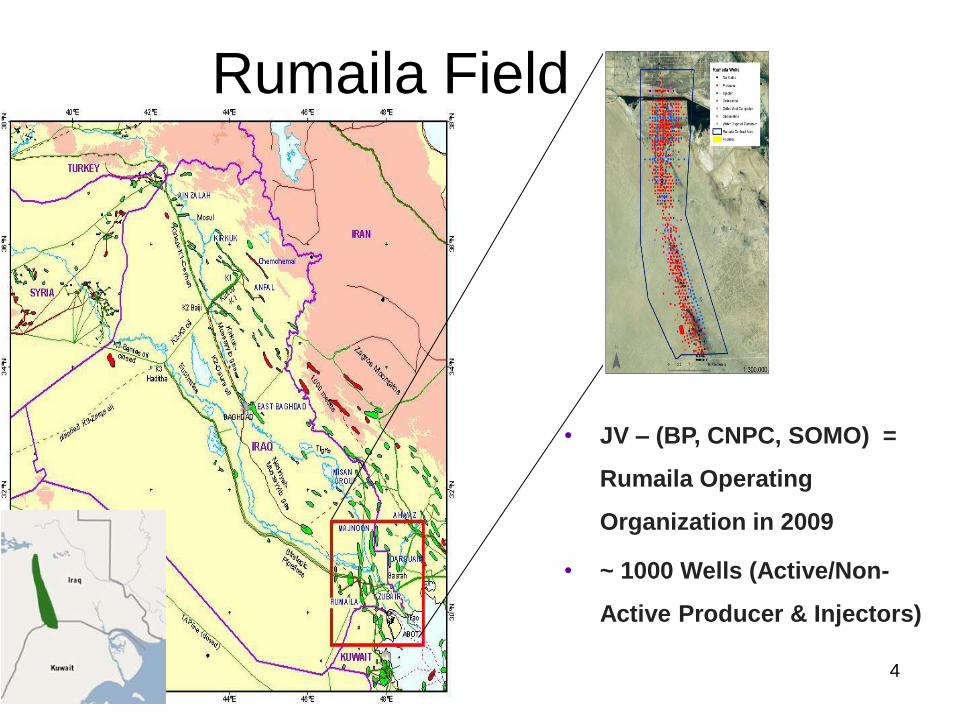
Rumaila Field
4
• JV – (BP, CNPC, SOMO) =
Rumaila Operating
Organization in 2009
• ~ 1000 Wells (Active/Non-
Active Producer & Injectors)
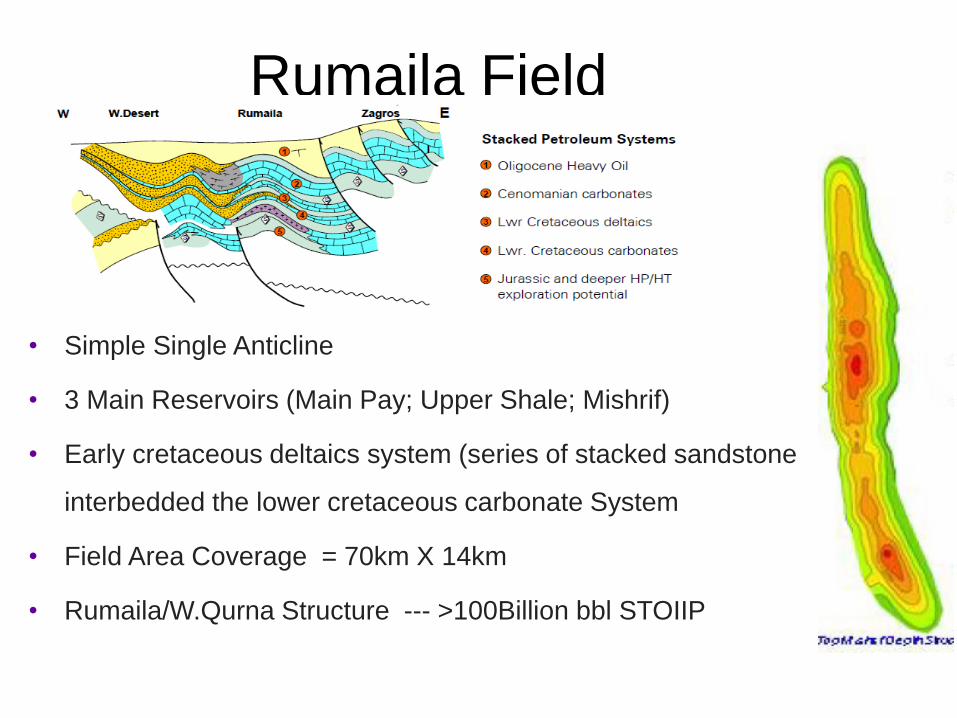
Rumaila Field
5
• Simple Single Anticline
• 3 Main Reservoirs (Main Pay; Upper Shale; Mishrif)
• Early cretaceous deltaics system (series of stacked sandstone
interbedded the lower cretaceous carbonate System
• Field Area Coverage = 70km X 14km
• Rumaila/W.Qurna Structure --- >100Billion bbl STOIIP

Reservoir & Fluid Properties
• “ESP Perfect
Application”
• High Rate (1-10mbd)
• Low to No Solid Production
• Low to Moderate GOR (400-
850 SCF/STB)
• Oil Gravity (27-34 API)
• Low Viscous Fluid (< 2cp)
• Reservoir depth (2200-
3300m)
• Water Cut (0-60%)
• Moderate (Mishrif) to High
Permeability(Main Pay)
6
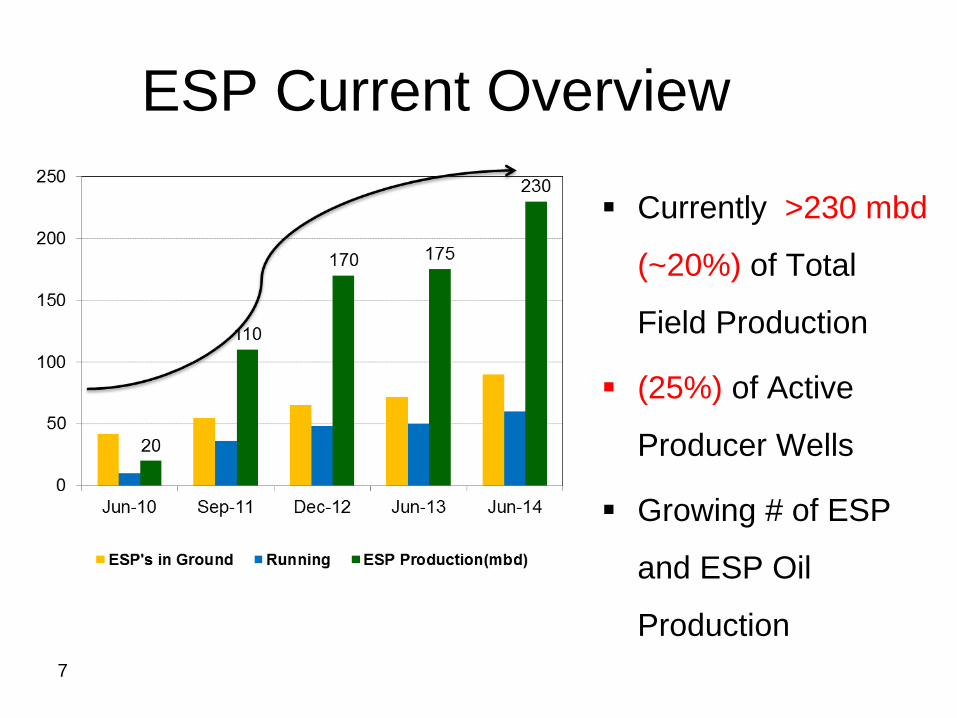
ESP Current Overview
Currently >230 mbd
(~20%) of Total
Field Production
(25%) of Active
Producer Wells
Growing # of ESP
and ESP Oil
Production
7
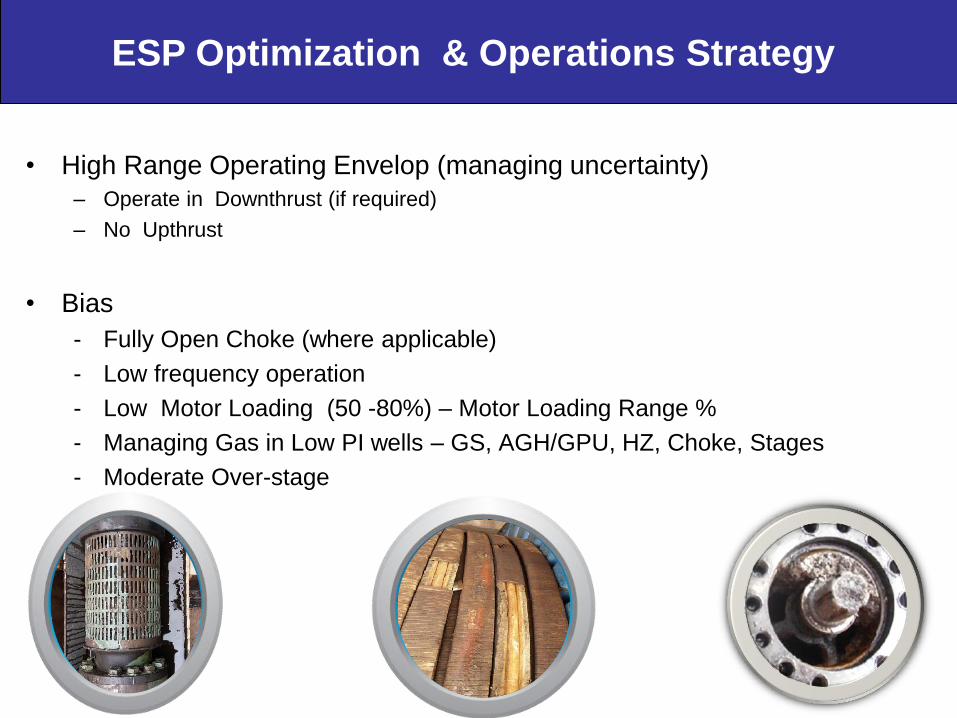
ESP Optimization & Operations Strategy
• High Range Operating Envelop (managing uncertainty)
– Operate in Downthrust (if required)
– No Upthrust
• Bias
- Fully Open Choke (where applicable)
- Low frequency operation
- Low Motor Loading (50 -80%) – Motor Loading Range %
- Managing Gas in Low PI wells – GS, AGH/GPU, HZ, Choke, Stages
- Moderate Over-stage

ESP Optimization Challenge in Rumaila
• Flow Rate & Water Cut (WC) Measurement availability and frequency??
• Flow Rate & Water Cut Measurement Accuracy??
• Common Industrial Practice - Flow Rate & WC is known and use to perform ESP Optimization and Intervention
• How do you perform ESP Optimization and Intervention without known flow rate & WC?
• How will you understand well and ESP performance?
• How do you perform monitoring and troubleshooting?
• Additional requirement to provide accurate ESP well rate into Production Allocation
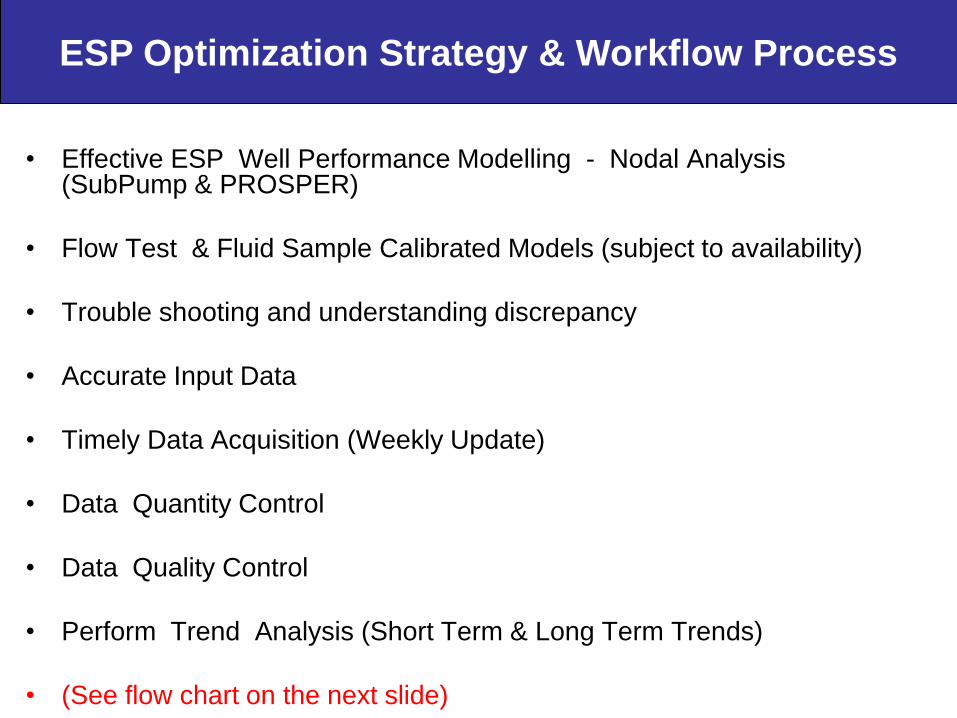
ESP Optimization Strategy & Workflow Process
• Effective ESP Well Performance Modelling - Nodal Analysis (SubPump & PROSPER)
• Flow Test & Fluid Sample Calibrated Models (subject to availability)
• Trouble shooting and understanding discrepancy
• Accurate Input Data
• Timely Data Acquisition (Weekly Update)
• Data Quantity Control
• Data Quality Control
• Perform Trend Analysis (Short Term & Long Term Trends)
• (See flow chart on the next slide)
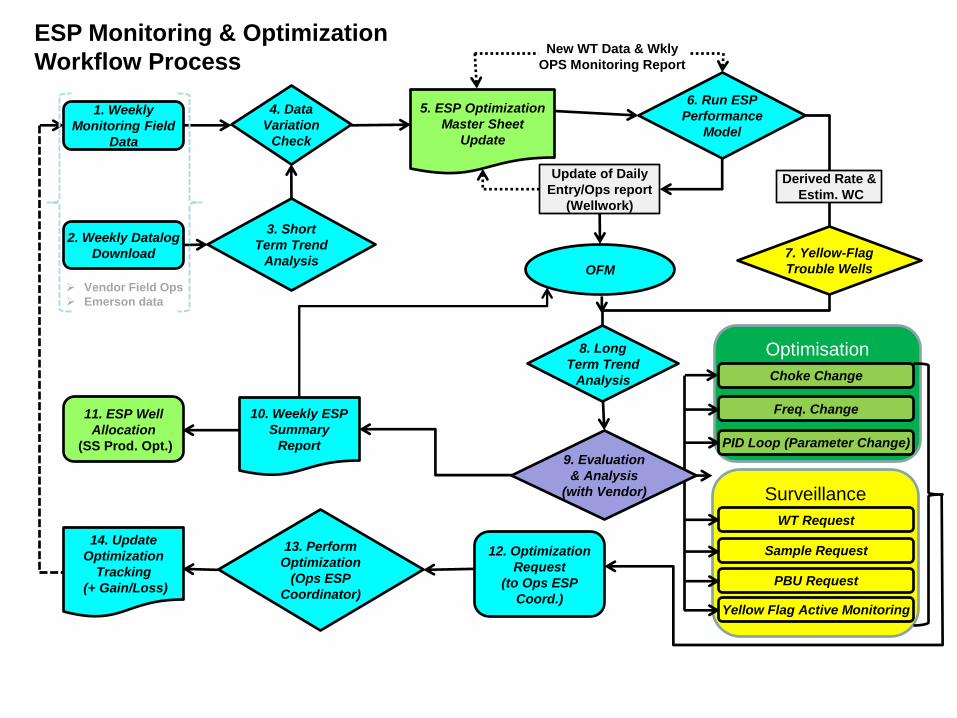
Surveillance
Optimisation
1. Weekly
Monitoring Field
Data
4. Data
Variation
Check
6. Run ESP
Performance
Model
New WT Data & Wkly
OPS Monitoring Report
8. Long
Term Trend
Analysis
3. Short
Term Trend
Analysis
2. Weekly Datalog
Download
11. ESP Well
Allocation
(SS Prod. Opt.)
12. Optimization
Request
(to Ops ESP
Coord.)
Choke Change
Freq. Change
PID Loop (Parameter Change)
WT Request
Sample Request
PBU Request
Yellow Flag Active Monitoring
ESP Monitoring & Optimization
Workflow Process
Vendor Field Ops
Emerson data
OFM
Derived Rate &
Estim. WC
7. Yellow-Flag
Trouble Wells
13. Perform
Optimization
(Ops ESP
Coordinator)
9. Evaluation
& Analysis
(with Vendor)
10. Weekly ESP
Summary
Report
5. ESP Optimization
Master Sheet
Update
14. Update
Optimization
Tracking
(+ Gain/Loss)
Update of Daily
Entry/Ops report
(Wellwork)
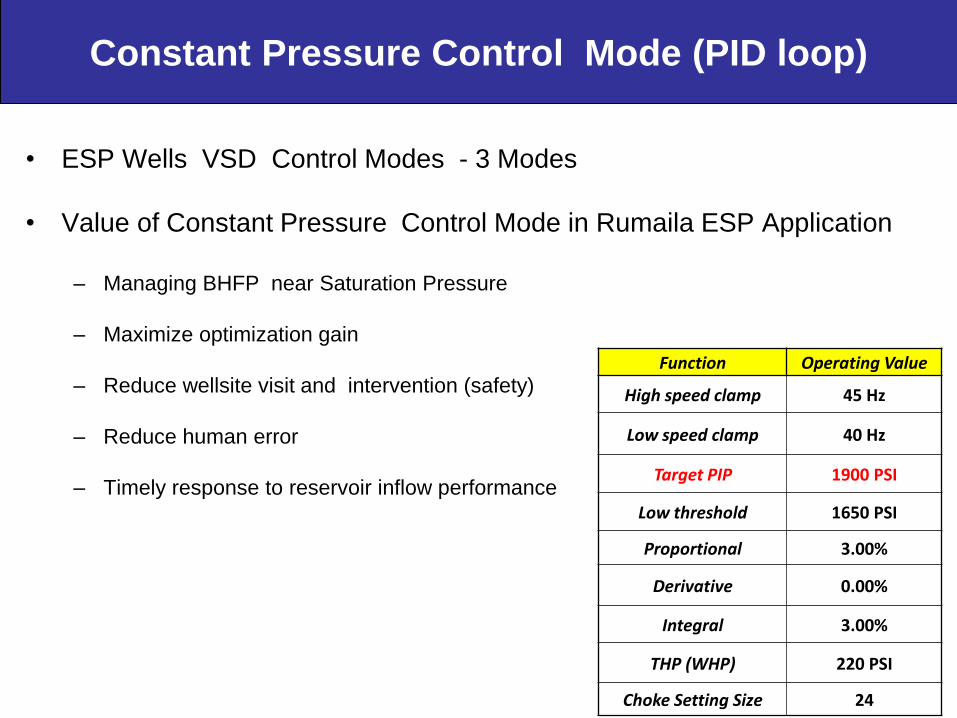
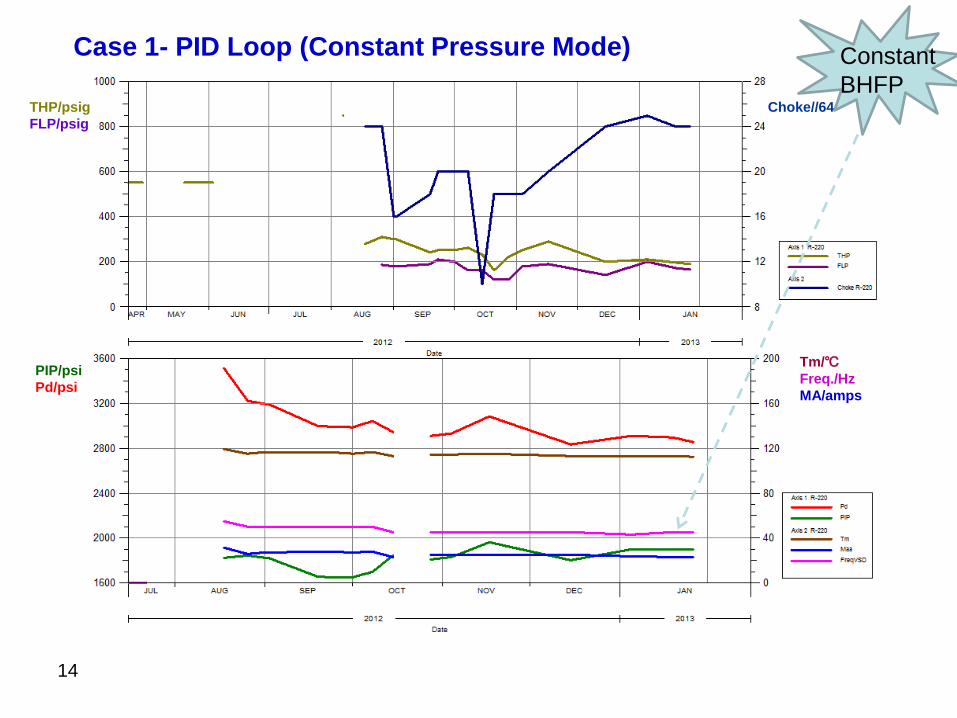
Constant Pressure Control Mode (PID loop)
• ESP Wells VSD Control Modes - 3 Modes
• Value of Constant Pressure Control Mode in Rumaila ESP Application
– Managing BHFP near Saturation Pressure
– Maximize optimization gain
– Reduce wellsite visit and intervention (safety)
– Reduce human error
– Timely response to reservoir inflow performance
Function Operating Value
High speed clamp 45 Hz
Low speed clamp 40 Hz
Target PIP 1900 PSI
Low threshold 1650 PSI
Proportional 3.00%
Derivative 0.00%
Integral 3.00%
THP (WHP) 220 PSI
Choke Setting Size 24

Case 1 : Performance vs SOR estimation
Case SBHP
(psi)
PI
(bpd/psi)
WC
(%)
THP
(psi)
Fr.
(Hz)
Intake Press
(psi)
Flow rate
(bpd)
Motor Load
(%)
Expected case 3800 1.5 5 600 55 2072 2600 53
Stable Performance 3750 1.2 0 190 45 1900 1900 36
13
Pump Curves (Design) Pump Curves (Actual)
14
THP/psig
FLP/psig
PIP/psi
Pd/psi
Choke//64
Tm/℃
Freq./Hz
MA/amps
Constant
BHFP
Case 1- PID Loop (Constant Pressure Mode)
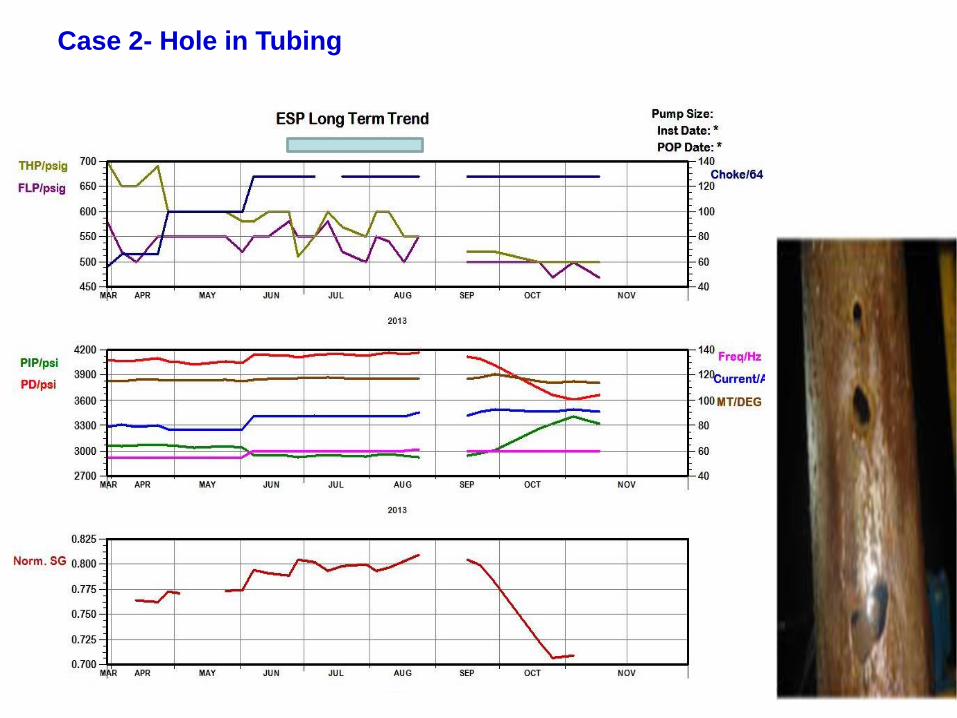
Case 2- Hole in Tubing

PIP after Optz PIP b4 Optz
Case 3 – Pre & Post Optimization

Case 4- Decreasing PIP & Norm FG

Case 5- Increasing Norm. FG & WC

19
Realtime data from RTU (Rumaila Future)
Before and after optimization (stable flow)
• The Future - Real Time Data Application on Rumaila ESP

2012 ESP Optimization Skin
12 MBD Annualized Rate
52 Optimization Interventions

Questions
• Comments?
• Feedback?
• Input?
• Discussion?
• What else?
QUESTIONS
Acknowledgement
Rumaila (ROO) ESP Subsurface & Operations team
Rumaila (ROO) Subsurface Team Management
BP