2014 Myanmar Population and Housing Census...
8
2014 Myanmar Population and Housing Census Policy Brief on Labour Force Department of Population Ministry of Labour, Immigration and Population With technical assistance from UNFPA The Republic of the Union of Myanmar
Transcript of 2014 Myanmar Population and Housing Census...

2014 Myanmar Population and Housing Census
Policy Brief on Labour Force
Department of PopulationMinistry of Labour, Immigration and Population
With technical assistance from UNFPA
The Republic of the Union of Myanmar

Key points
(1) The female labour participation rate at 50.6 per cent lags far behind that of males (85.6 per cent). Despite higher levels of educational attainment among women relative to men, these differentials in labour force participation between males and females exist at every age-group, from 15 years and above. With more rapid economic development, greater policy efforts are required to address barriers to facilitate the higher participation of women in the labour force.
(2) The national unemployment rate at 3.8 per cent for those aged 15 years and above, while relatively low, masks issues of high unemployment among youth (9.2 per cent) and among those with college (9.1 per cent) and graduate (9.3 per cent) degrees. These groups stand the risk of being socially excluded if unemployment persists. The policy challenge is the creation of the right kind of employment opportunities consistent with their levels of educational attainment.
(3) There is also a corresponding and related issue of skill mismatch. Some 1.2 million persons were working in jobs that were below their educational qualifications. Twelve million on the other hand, were under-qualified for the work they were performing. An expanding and modern economy will require more efficient use of the country’s human resources through better matching of the needs of the economy with the education and skills available in the labour force.
(4) Regional variations were identified in many labour market indicators. Levels of unemployment, for example, differed widely. In Shan State, the unemployment rate was 2 per cent, while in Rakhine State it was 10.4 per cent, 7.5 per cent in Kayin State, and 6.2 per cent in Mon State. Labour force participation rates ranged from a low of 59.2 per cent in Rakhine State to a high of 77.7 per cent in Shan State. This calls for a more balanced development strategy that seeks to promote equitable development among states/regions.
(5) While it is a challenge to be exact on the proportion of working children in the country given that the Census did not capture the employment status of persons below 10 years of age or the number of hours worked, the available data clearly indicates a significant engagement in work by children and adolescents. For instance, a fifth of those in the age-group 10-17, or 1.7 million persons, were in employment for a greater part of the 12 months preceding the Census. Those reported as working also had a low school attendance. However defined, the issue of engaging children in work needs to be addressed as a serious policy concern.
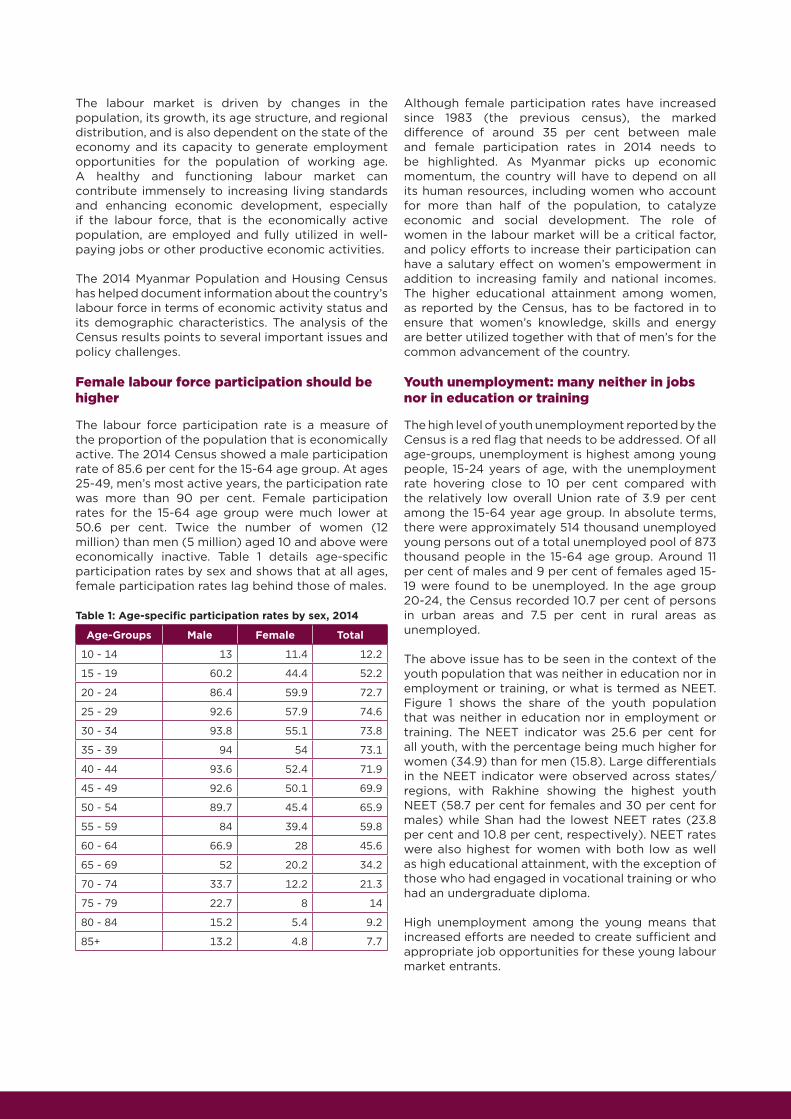
The labour market is driven by changes in the population, its growth, its age structure, and regional distribution, and is also dependent on the state of the economy and its capacity to generate employment opportunities for the population of working age. A healthy and functioning labour market can contribute immensely to increasing living standards and enhancing economic development, especially if the labour force, that is the economically active population, are employed and fully utilized in well-paying jobs or other productive economic activities.
The 2014 Myanmar Population and Housing Census has helped document information about the country’s labour force in terms of economic activity status and its demographic characteristics. The analysis of the Census results points to several important issues and policy challenges.
Female labour force participation should be higher
The labour force participation rate is a measure of the proportion of the population that is economically active. The 2014 Census showed a male participation rate of 85.6 per cent for the 15-64 age group. At ages 25-49, men’s most active years, the participation rate was more than 90 per cent. Female participation rates for the 15-64 age group were much lower at 50.6 per cent. Twice the number of women (12 million) than men (5 million) aged 10 and above were economically inactive. Table 1 details age-specific participation rates by sex and shows that at all ages, female participation rates lag behind those of males.
Table 1: Age-specific participation rates by sex, 2014
Age-Groups Male Female Total
10 - 14 13 11.4 12.2
15 - 19 60.2 44.4 52.2
20 - 24 86.4 59.9 72.7
25 - 29 92.6 57.9 74.6
30 - 34 93.8 55.1 73.8
35 - 39 94 54 73.1
40 - 44 93.6 52.4 71.9
45 - 49 92.6 50.1 69.9
50 - 54 89.7 45.4 65.9
55 - 59 84 39.4 59.8
60 - 64 66.9 28 45.6
65 - 69 52 20.2 34.2
70 - 74 33.7 12.2 21.3
75 - 79 22.7 8 14
80 - 84 15.2 5.4 9.2
85+ 13.2 4.8 7.7
Although female participation rates have increased since 1983 (the previous census), the marked difference of around 35 per cent between male and female participation rates in 2014 needs to be highlighted. As Myanmar picks up economic momentum, the country will have to depend on all its human resources, including women who account for more than half of the population, to catalyze economic and social development. The role of women in the labour market will be a critical factor, and policy efforts to increase their participation can have a salutary effect on women’s empowerment in addition to increasing family and national incomes. The higher educational attainment among women, as reported by the Census, has to be factored in to ensure that women’s knowledge, skills and energy are better utilized together with that of men’s for the common advancement of the country.
Youth unemployment: many neither in jobs nor in education or training
The high level of youth unemployment reported by the Census is a red flag that needs to be addressed. Of all age-groups, unemployment is highest among young people, 15-24 years of age, with the unemployment rate hovering close to 10 per cent compared with the relatively low overall Union rate of 3.9 per cent among the 15-64 year age group. In absolute terms, there were approximately 514 thousand unemployed young persons out of a total unemployed pool of 873 thousand people in the 15-64 age group. Around 11 per cent of males and 9 per cent of females aged 15-19 were found to be unemployed. In the age group 20-24, the Census recorded 10.7 per cent of persons in urban areas and 7.5 per cent in rural areas as unemployed.
The above issue has to be seen in the context of the youth population that was neither in education nor in employment or training, or what is termed as NEET. Figure 1 shows the share of the youth population that was neither in education nor in employment or training. The NEET indicator was 25.6 per cent for all youth, with the percentage being much higher for women (34.9) than for men (15.8). Large differentials in the NEET indicator were observed across states/regions, with Rakhine showing the highest youth NEET (58.7 per cent for females and 30 per cent for males) while Shan had the lowest NEET rates (23.8 per cent and 10.8 per cent, respectively). NEET rates were also highest for women with both low as well as high educational attainment, with the exception of those who had engaged in vocational training or who had an undergraduate diploma.
High unemployment among the young means that increased efforts are needed to create sufficient and appropriate job opportunities for these young labour market entrants.

continued
Figure 1: Share of NEET youth by highest level of educational attainment by sex, 2014 Census
Graduate unemployment- surprisingly high
College and graduate degree holders face higher unemployment rates than those with lower or no education. The Census reported that 9.1 and 9.3 per cent of persons with a college or undergraduate degree, respectively, were unemployed compared to 1.9 per cent of persons with no education at all. This could be due to the lack of jobs that require undergraduate diploma or degree level skills while those with lower or no education are better able to find employment requiring low level work-related skills. The labour force participation rate among persons with a college diploma was also very low at 41 per cent. Since the Census does not provide a reason for the low participation and high unemployment rates, a separate assessment will need to be undertaken to gain more insight into the issue and identify appropriate measures to better utilize the skills of the more educated population.
Skill mismatches – waste of human resources
The Census showed a high degree of inadequate skill-related employment or a mismatch between skills and work performed. About 7 million men and 4.6 million women were working in jobs for which they were under-qualified. Similarly, some 687,000 men and 561, 000 women were over-qualified for the work they were performing, i.e. they were employed in jobs below their educational qualifications. The policy challenge is to bring the skill level of the less-educated population in line with the job requirements of an expanding modern economy, while creating sufficient new employment opportunities that matches the qualifications of persons with higher education. A silver lining from the data is that the country has a large pool of employed persons with higher skills who can be drawn from their current work into employment for which they are more qualified.
18.2
16.7
16.8
15.8
15.2
12.6
15.0
15.4
15.2
15.0
16.2
17.3
15.0
17.6
14.1
27.8
20.5
26.4
22.5
13.1
40.8
43.8
43.5
42.1
36.7
37.9
36.7
35.1
33.1
30.2
29.4
18.7
18.6
20.8
39.6
24.3
39.5
33.5
34.4
- 5.0 10.0 15.0 20.0 25.0 30.0 35.0 40.0 45.0
None
Grade 1
Grade 2
Grade 3
Grade 4
Grade 5
Grade 6
Grade 7
Grade 8
Grade 9
Grade 10
Grade 11
College
Vocational training
Undergraduate Diploma
Graduate
Postgraduate Diploma
Master’s Degree
PhD
Other
PercentageMale Female
continued
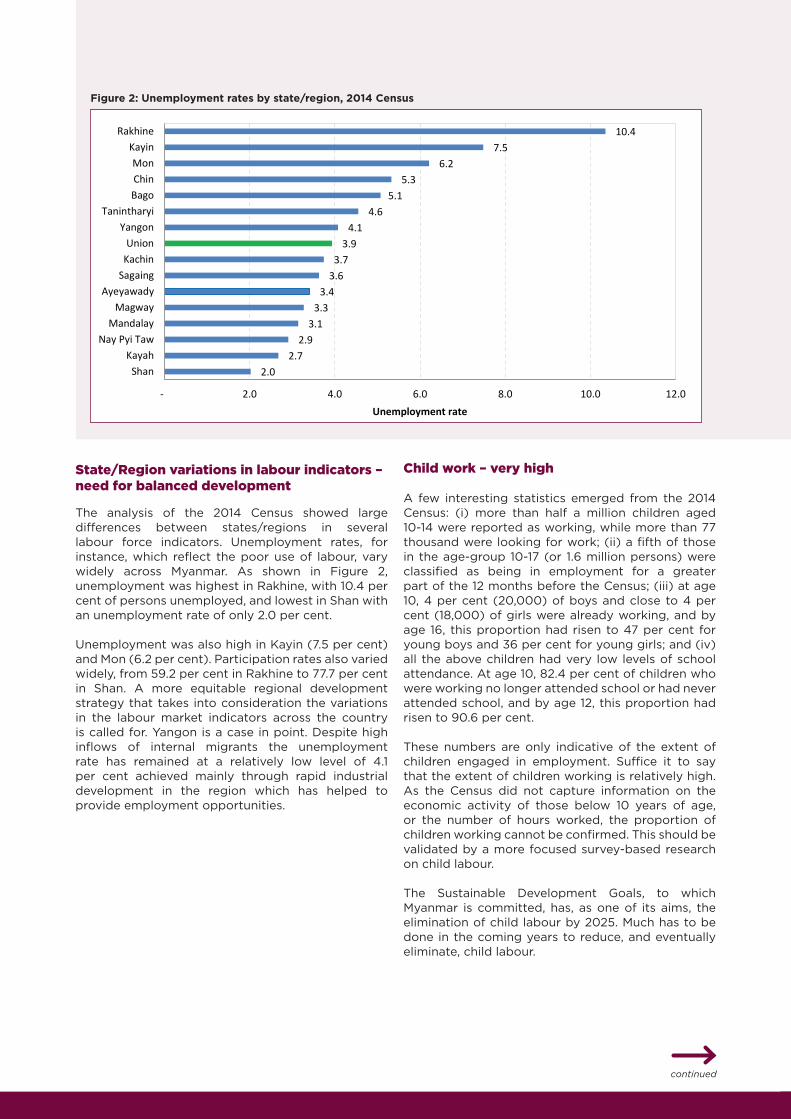
State/Region variations in labour indicators – need for balanced development
The analysis of the 2014 Census showed large differences between states/regions in several labour force indicators. Unemployment rates, for instance, which reflect the poor use of labour, vary widely across Myanmar. As shown in Figure 2, unemployment was highest in Rakhine, with 10.4 per cent of persons unemployed, and lowest in Shan with an unemployment rate of only 2.0 per cent.
Unemployment was also high in Kayin (7.5 per cent) and Mon (6.2 per cent). Participation rates also varied widely, from 59.2 per cent in Rakhine to 77.7 per cent in Shan. A more equitable regional development strategy that takes into consideration the variations in the labour market indicators across the country is called for. Yangon is a case in point. Despite high inflows of internal migrants the unemployment rate has remained at a relatively low level of 4.1 per cent achieved mainly through rapid industrial development in the region which has helped to provide employment opportunities.
Child work – very high
A few interesting statistics emerged from the 2014 Census: (i) more than half a million children aged 10-14 were reported as working, while more than 77 thousand were looking for work; (ii) a fifth of those in the age-group 10-17 (or 1.6 million persons) were classified as being in employment for a greater part of the 12 months before the Census; (iii) at age 10, 4 per cent (20,000) of boys and close to 4 per cent (18,000) of girls were already working, and by age 16, this proportion had risen to 47 per cent for young boys and 36 per cent for young girls; and (iv) all the above children had very low levels of school attendance. At age 10, 82.4 per cent of children who were working no longer attended school or had never attended school, and by age 12, this proportion had risen to 90.6 per cent.
These numbers are only indicative of the extent of children engaged in employment. Suffice it to say that the extent of children working is relatively high. As the Census did not capture information on the economic activity of those below 10 years of age, or the number of hours worked, the proportion of children working cannot be confirmed. This should be validated by a more focused survey-based research on child labour.
The Sustainable Development Goals, to which Myanmar is committed, has, as one of its aims, the elimination of child labour by 2025. Much has to be done in the coming years to reduce, and eventually eliminate, child labour.
Figure 2: Unemployment rates by state/region, 2014 Census
2.0 2.7
2.9 3.1
3.3 3.4
3.6 3.7
3.9 4.1
4.6 5.1
5.3 6.2
7.5 10.4
- 2.0 4.0 6.0 8.0 10.0 12.0
ShanKayah
Nay Pyi TawMandalay
MagwayAyeyawady
SagaingKachinUnion
YangonTanintharyi
BagoChinMon
KayinRakhine
Unemployment rate

Vulnerable employment – especially among the old
Fifty six per cent of the employed population were employed either as own account workers or as contributing family workers. Own account workers are those self-employed persons who work on their own business or work in their own/family business for family gain and do not have any employees. Contributing family workers are those working without pay in the business or farm of another household/family member. These two categories are classified as vulnerable employment mainly because they are less likely to have formal work arrangements, and are prone to unhealthy and unsafe working conditions with inadequate social security.
Compared to other countries in South-East Asia, the proportion of the population of Myanmar that is engaged in vulnerable employment is relatively high. More developed economies such as Thailand, Singapore, Malaysia, Indonesia and the Philippines have lower levels of the labour force that are in precarious employment (See Figure 3).
Source: ILO, Key Indicators of the Labour Market Database
Figure 3: Percentage of working population in vulnerable employment
The degree of vulnerability was highest among the older age groups, with the vulnerable employment rate above 70 per cent and 60 per cent for women and men respectively at ages 60-79. Employment vulnerability is also higher: (i) in rural (62.6 per cent) than in urban areas (40.1 per cent); (ii) among illiterate (75.8 per cent) than literate persons (56.8 per cent); (iii) among persons with lower levels of education; and (iv) among women (61.2 per cent) than men (53 per cent), and among persons with a disability.
There were approximately 312,000 employed persons who were 70 years and above, of whom 60,820 were in their eighties and above. More than half of the very old who are employed, work in the agriculture, forestry and fishing sector mainly as skilled workers. Census data has also identified a total of 1,378 persons aged 95 and over who are classified as being in vulnerable employment in light of the fact that they work as own account workers or as contributing family workers. Given the sizeable proportion of employed persons in vulnerable employment, greater protection of the rights of workers, especially those aged 60 and over, and people with a disability in the labour market is required
83.9
80.8
69.6
64.1
62.6
57.8
56.3
55.9
38.4
33.0
21.1
8.7
0.0 10.0 20.0 30.0 40.0 50.0 60.0 70.0 80.0 90.0
Lao PDR
India
Timor-Leste
Cambodia
Viet Nam
Bangladesh
Myanmar
Thailand
Philippines
Indonesia
Malaysia
Singapore
Percentage
Note: The analysis in this policy brief does not cover the non-enumerated populations. Some populations in three areas of the country were not enumerated. This included an estimate of 1,090,000 persons residing in Rakhine State, 69,800 persons living in Kayin State and 46,600 persons living in Kachin State (see Department of Population, 2015, for the reasons that these populations were not enumerated). In total, therefore, it is estimated that 1,206,400 persons were not enumerated in the Census.

1.2 MILLION 12 MILLION
persons were working in jobs below their educational qualificationspersons were underqualified for the work they were doing
The Republic of the Union of Myanmar
POLICY BRIEF ON LABOUR FORCELABOUR FORCE PARTICIPATION* (15-64 year olds)
85.6%
50.6%
Highest for males between 25-49 years old 90%+
EMPLOYMENT** & UNEMPLOYMENT***
National unemployment rate = 3.9%
873,000 peopleaged 15-64 are unemployed
514,000 people are youth
NATIONAL UNEMPLOYMENT
Working children 10-17yrs old
LOW SCHOOL ATTENDANCE
Rakhine State10.4% unemployed
Shan State2.0% unemployed
LARGE DIFFERENCES BETWEEN STATES/REGIONS
Union3.9% unemployed
With graduate degree9.3% unemployed
With no education at all1.9% unemployed
<Youth unemployment is high at 9.2%
*** Unemployed: Those who had no work but were able to work and actually seeking a job during the reference period, or at the time of the 2014 Census enumeration.
** Employed: The activity status of those who did any work for more than 6 months in the 12-month period prior to the Census for pay or profit. Also included in this category were persons working in family businesses, on a farm, in a store, in a private hospital etc., even though they were not paid any wages.
* Labour force participation rate: The ratio between the labour force and the overall size of the total population of the same age range.
NATIONAL EMPLOYMENT aged 15-64 21.3 MILLION WERE EMPLOYED
1.7 million or 21% of children aged 10-17 were working

Department of PopulationMinistry of Labour, Immigration and Population
With technical assistance from UNFPA
Note: The analysis in this policy brief does not cover the non-enumerated populations. Some populations in three areas of the country were not enumerated. This included an estimate of 1,090,000 persons residing in Rakhine State, 69,800 persons living in Kayin State and 46,600 persons living in Kachin State (see Department of Population, 2015, for the reasons that these populations were not enumerated). In total, therefore, it is estimated that 1,206,400 persons were not enumerated in the Census.
VULNERABLE EMPLOYMENT
56% OF THE EMPLOYED POPULATION ARE IN VULNERABLE EMPLOYMENTOwn account workers & contributing family workers
70%+ 60%+
Ages 60-79
Higher degree of vulnerability
URBAN 40.1% RURAL 62.6%
FEMALES61.2%MALES
53%
ILLITERATE 75.8%LITERATE 56.8%
Differences in vulnerable employment
<<
<POLICY OPTIONS
Create employment opportunities for youth
Better match the needs of the economy with education and skills available in the labour force
Balanced development strategy that promotes equitable development among States/Regions
Enforce laws prohibiting child work
Greater protection of the rights of workers, especially those aged 60 and over, and people with a disabiliy in the labour force is required
Address barriers to facilitate higher participation of women in the labour force