
2014 Igy Nee Bottari b&b
8
Electrochemical immunosensor based on ensemble of nanoelectrodes for immunoglobulin IgY detection: Application to identify hen's egg yolk in tempera paintings Fabio Bottari a , Paolo Oliveri b , Paolo Ugo a,n a Department of Molecular Sciences and Nanosystems, University Ca’ Foscari of Venice, S. Marta 2137, 30123 Venice, Italy b Department of Pharmacy, University of Genoa, Via Brigata Salerno,13, 16147 Genoa, Italy article info Article history: Received 5 July 2013 Received in revised form 21 August 2013 Accepted 6 September 2013 Available online 20 September 2013 Keywords: Immunosensor Nanoelectrode Egg yolk IgY Voltammetry Tempera paint abstract A nanostructured electrochemical biosensor for detecting proteins of interest in work of art, in particular in tempera paintings, is presented. To determine egg yolk we focus here on the determination of immunoglobulin IgY. The transducers are nanoelectrode ensembles (NEEs), prepared via membrane templated electroless deposition of gold. Because of their geometrical and diffusion characteristics, NEEs are characterized by significantly low detection limits, moreover they display the capability of capturing proteins by interaction with the polycarbonate membrane of the NEE. At first, the proteic component of the paint is extracted by ultrasonication in an aqueous buffer, then IgY is captured by incubation on the NEE. The immunoglobulin is detected by treatment with anti-IgY labeled with horse radish peroxidase (Anti-IgY-HRP). The binding of the Anti-IgY-HRP is detected by recording the electrocatalytic signal caused by addition of H 2 O 2 and methylene blue. The sensor detection capabilities are tested by analyzing both paint models, prepared in the lab, and real samples, from paintings of the XVIII –XX century. Multivariate exploratory analysis is applied to classify the voltammetric patterns, confirming the capability to differentiate egg-yolk tempera from other kind of tempera binders as well as from acrylic or oil paints. & 2013 Elsevier B.V. All rights reserved. 1. Introduction In the field of conservation of cultural heritage, the availability of analytical information on the materials used to produce works of art is crucial. As far as ancient paintings are concerned, the identification of the composition of painting layers furnishes valuable information on the pictorial technique used, authenticity, possible superimposition of later pictorial or varnish layers. All this information is necessary to guide the restoration intervention and to indicate the most suitable conservation conditions. To this aim, many analytical methods based on the use of advanced instrumentation are presently available. However few tools allow the quick but reliable analysis of small samples performed directly in restoration laboratories by conservation scientists. A painting is a complex analytical matrix composed by frame, support, priming and preparation, painting and finishing layers. The pictorial layer itself is a complex system composed by pigments (i.e. insoluble metal oxides or salts, organic pigments or lacquers) kept together by a binder. The nature of the binder determines the working behavior of the paint and the final characteristics of the work of art, not only from an esthetic viewpoint, but also as far as durability and conservation are concerned. The binders most commonly used by Western artists include animal glue, casein, egg, drying oils, resins, natural gums and, more recently, synthetic materials such as acrylic polymers and others. A particularly important painting technique is the tempera technique. This term indeed includes a wide range of painting media based on the use of water dispersible binders which, upon drying, become insoluble. The use of tempera techniques spans from the beginning of Christian era (for miniatures and religious icons) to modern painters (e.g. Böcklin, Giorgio de Chirico, Luigi Tito etc.) up to contemporary artists. The most classical tempera technique was described by Cennino Cennini in his XV century book “Il Libro dell’Arte” and it is based simply on mixing the finely grounded pigments with egg yolk. Other tempera techniques use whole egg or egg white, alone or mixed with flour or animal glue. Many artists used also to mix oily components to the classical tempera binders. From an analytical viewpoint, identifying proteins from differ- ent animal sources is not an easy task. One approach is based on sequencing and identifying proteins on the basis of the presence of specific chemical components, using expensive spectroscopic (Casadio and Toniolo, 2001; Doménech-Carbò, 2008; Prati et al., 2010) and chromatographic or hyphenated mass spectrometric techniques (Colombini and Modugno, 2004; Marinach et al., 2004; Doménech-Carbò, 2008). An alternative approach is based on Contents lists available at ScienceDirect journal homepage: www.elsevier.com/locate/bios Biosensors and Bioelectronics 0956-5663/$ - see front matter & 2013 Elsevier B.V. All rights reserved. http://dx.doi.org/10.1016/j.bios.2013.09.025 n Corresponding author. Tel.: þ39 041 234 8503; fax: þ39 041 234 8594. E-mail address: [email protected] (P. Ugo). Biosensors and Bioelectronics 52 (2014) 403–410
-
Upload
iuliana-raluca-scarlat -
Category
Documents
-
view
236 -
download
4
description
restaurare
Transcript of 2014 Igy Nee Bottari b&b

Electrochemical immunosensor based on ensemble of nanoelectrodesfor immunoglobulin IgY detection: Application to identify hen's eggyolk in tempera paintings
Fabio Bottari a, Paolo Oliveri b, Paolo Ugo a,n
a Department of Molecular Sciences and Nanosystems, University Ca’ Foscari of Venice, S. Marta 2137, 30123 Venice, Italyb Department of Pharmacy, University of Genoa, Via Brigata Salerno, 13, 16147 Genoa, Italy
a r t i c l e i n f o
Article history:Received 5 July 2013Received in revised form21 August 2013Accepted 6 September 2013Available online 20 September 2013
Keywords:ImmunosensorNanoelectrodeEgg yolkIgYVoltammetryTempera paint
a b s t r a c t
A nanostructured electrochemical biosensor for detecting proteins of interest in work of art, in particularin tempera paintings, is presented. To determine egg yolk we focus here on the determination ofimmunoglobulin IgY. The transducers are nanoelectrode ensembles (NEEs), prepared via membranetemplated electroless deposition of gold. Because of their geometrical and diffusion characteristics, NEEsare characterized by significantly low detection limits, moreover they display the capability of capturingproteins by interaction with the polycarbonate membrane of the NEE. At first, the proteic component ofthe paint is extracted by ultrasonication in an aqueous buffer, then IgY is captured by incubation on theNEE. The immunoglobulin is detected by treatment with anti-IgY labeled with horse radish peroxidase(Anti-IgY-HRP). The binding of the Anti-IgY-HRP is detected by recording the electrocatalytic signalcaused by addition of H2O2 and methylene blue. The sensor detection capabilities are tested by analyzing bothpaint models, prepared in the lab, and real samples, from paintings of the XVIII–XX century. Multivariateexploratory analysis is applied to classify the voltammetric patterns, confirming the capability to differentiateegg-yolk tempera from other kind of tempera binders as well as from acrylic or oil paints.
& 2013 Elsevier B.V. All rights reserved.
1. Introduction
In the field of conservation of cultural heritage, the availabilityof analytical information on the materials used to produce worksof art is crucial. As far as ancient paintings are concerned, theidentification of the composition of painting layers furnishesvaluable information on the pictorial technique used, authenticity,possible superimposition of later pictorial or varnish layers. All thisinformation is necessary to guide the restoration intervention andto indicate the most suitable conservation conditions.
To this aim, many analytical methods based on the use of advancedinstrumentation are presently available. However few tools allow thequick but reliable analysis of small samples performed directly inrestoration laboratories by conservation scientists.
A painting is a complex analytical matrix composed by frame,support, priming and preparation, painting and finishing layers. Thepictorial layer itself is a complex system composed by pigments (i.e.insoluble metal oxides or salts, organic pigments or lacquers) kepttogether by a binder. The nature of the binder determines the workingbehavior of the paint and the final characteristics of the work of art,not only from an esthetic viewpoint, but also as far as durability and
conservation are concerned. The binders most commonly used byWestern artists include animal glue, casein, egg, drying oils, resins,natural gums and, more recently, synthetic materials such as acrylicpolymers and others.
A particularly important painting technique is the temperatechnique. This term indeed includes a wide range of paintingmedia based on the use of water dispersible binders which, upondrying, become insoluble. The use of tempera techniques spansfrom the beginning of Christian era (for miniatures and religiousicons) to modern painters (e.g. Böcklin, Giorgio de Chirico, LuigiTito etc.) up to contemporary artists. The most classical temperatechnique was described by Cennino Cennini in his XV centurybook “Il Libro dell’Arte” and it is based simply on mixing the finelygrounded pigments with egg yolk. Other tempera techniques usewhole egg or egg white, alone or mixed with flour or animal glue.Many artists used also to mix oily components to the classicaltempera binders.
From an analytical viewpoint, identifying proteins from differ-ent animal sources is not an easy task. One approach is based onsequencing and identifying proteins on the basis of the presence ofspecific chemical components, using expensive spectroscopic(Casadio and Toniolo, 2001; Doménech-Carbò, 2008; Prati et al.,2010) and chromatographic or hyphenated mass spectrometrictechniques (Colombini and Modugno, 2004; Marinach et al., 2004;Doménech-Carbò, 2008). An alternative approach is based on
Contents lists available at ScienceDirect
journal homepage: www.elsevier.com/locate/bios
Biosensors and Bioelectronics
0956-5663/$ - see front matter & 2013 Elsevier B.V. All rights reserved.http://dx.doi.org/10.1016/j.bios.2013.09.025
n Corresponding author. Tel.: þ39 041 234 8503; fax: þ39 041 234 8594.E-mail address: [email protected] (P. Ugo).
Biosensors and Bioelectronics 52 (2014) 403–410

molecular recognition methods which exploit the reactivity ofspecific molecules present in the binder. Recently, immunosensorshave been developed with the purpose of determining thepresence of egg as pictorial binder. The use of antibodies inconservation science is not new; dating back to the 1960s–70s(Jones, 1962; Johnson and Packard, 1971). More recently, animmunofluorescence microscopy (IFM) method was proposed toidentify ovalbumin (Kockaert et al., 1989) and casein (Ramírez-Barat and de la Viña, 2001); while Heginbotham et al. (2006) usedboth IFM and ELISA for the identification of ovalbumin. Assaysbased on chemiluminescence (Dolci et al., 2008; Sciutto et al.,2011) have been developed and many different natural com-pounds were detected by using ELISA or IFM (Vagnini et al.,2008; Cartechini et al., 2010; Palmieri et al., 2011). Theseresearches opened new prospects for the application of immuno-sensors to the identification of pictorial binders, however they aretargeted to detect ovalbumin, a protein present in high amount inegg albumen and yolk (Mann, 2007; Mann and Mann, 2008).A limit is that those methods cannot discriminate between albumenor whole egg tempera from egg yolk tempera.
In order to develop a sensor able to give specific information onthe presence of egg yolk as the binder, in the present study wefocus on a different analyte, namely, the glycoprotein immunoglo-bulin IgY which is the main serum immunoglobulin in chicken(Carlander et al., 1999) and, in chicken eggs, is present in the yolkat concentration of 5–10 mg mL�1 (Chalghoumi et al., 2009; Diasda Silva and Tambourgi, 2010). It has a molecular mass of about180 kDa and its isoelectric point ranges between 5.7 and 7.6(Chalghoumi et al., 2009). The IgY maintains its stability in a widerange of pH (from 4 to 12) while the thermal denaturation of theprotein occurs only above 70 1C. For these reasons, IgY is a suitablecandidate to be exploited as a tracer useful to detect the presenceof egg yolk in a sample.
The transducers used by us for developing IgY immunosensor,are the nanoelectrode ensembles (NEEs). NEEs are prepared viatemplate electroless deposition of gold within the pores of apolycarbonate (PC) track-etched membrane; the characteristicsof the membranes (pore density and pore diameter) determinethe voltammetric response of the electrodes (Menon and Martin,1995; Ugo et al., 1996). When the boundaries of radial diffusionlayers of each nanoelectrode overlap, the so called total overlap(TO) diffusion regime is achieved. NEEs prepared from commercial
available track etched PC membranes typically operate under theTO regime. Under this regime, a peak dependant faradic current isrecorded which is proportional to the geometric area (Ageom),while the double layer charging current (the background current)depends only on the active area (Aact).
The high ratio between faradic and double layer chargingcurrent reflects in very high S/N ratios so that NEEs are character-ized by detection limits 2–3 orders of magnitude lower than thoseof macrolectrodes with the same geometric area (Brunetti et al.,2000; Ugo and Moretto, 2007). For biosensing purposes, anotheradvantage of NEEs is the possibility of binding organic macro-molecules, like proteins, to the PC of the electrode ensemble. On thesurface of PC membrane there are several carboxylic groups, whichinteract with the amino terminations of amino-acids (Rucker et al.,2005; Silvestrini et al., 2011). Several biosensors have been recentlydeveloped exploiting this characteristic (Zamuner et al., 2008; PozziMucelli et al., 2008; Silvestrini et al., 2013).
The detection scheme used in the present work is based onthe protein binding capability of the PC of the NEEs and it issummarized in Scheme 1.
In step (A), IgY is captured by the NEE surface. In step (B), afterblocking with BSA, the IgY captured by the NEE surface isincubated with anti-IgY labeled with HRP (Anti-IgY-HRP). Finally,in step (C), the presence of the label HRP, is detected by adding theenzyme substrate (namely, H2O2) and methylene blue (MB) as asuitable redox mediator (Pozzi Mucelli et al., 2008). At first thepaint models prepared using recipes found in the classical treatise“Il Libro dell’Arte” of Cennino Cennini (1370-1440) as well as therecipes used by the modern Venetian painter Luigi Tito (1907-1991) were analyzed. The sensor was finally applied to characterizereal samples taken from paintings spanning a time lag from XVIII toXX century.
Multivariate exploratory analysis was applied to the voltam-metric profiles. The outcomes confirm that the information embo-died in the signals is functional to characterize samples on thebasis of the nature of the binder present in the pictorial media.
2. Materials and methods
Electrochemical measurements were carried out at room tem-perature with a CH660 potentiostat using a three-electrodes cell
Scheme 1. Schematic representation of the analytical protocol.
F. Bottari et al. / Biosensors and Bioelectronics 52 (2014) 403–410404

equipped with a platinum counter electrode and an Ag\AgCl (KCl-saturated) reference electrode; the NEE was used as the workingelectrode. The polycarbonate template membranes are suppliedby SPI Pore Filter (47 mm diameter, pore thickness 6 mm, porediameter 30 nm, pore density 6�108 pores cm�2). IgY (ChromePure IgY, whole molecule) was from Jackson ImmunoresearchLaboratories; Anti-IgY-HRP was from Immunology ConsultantsLaboratory and Bovine Serum Albumin (BSA) was from Sigma-Aldrich. All other chemicals were reagent grade and used withoutfurther purification. NEEs were prepared by template gold electro-less deposition in PC track-etched membranes according to theprocedure developed by Menon and Martin (1995) and followingupdates (Pereira et al., 2006; De Leo et al., 2007; Ugo and Moretto,2007). See Supplementary data for details.
2.1. Paint model samples
All paint model samples were prepared mixing the binder withYellow Ocher (Fe2O3 �H2O). A single paint layer was applied onpure cellulose paper, using two tempera recipes found in “Il Librodell’Arte” and three recipes from the painting notes of the Venetianpainter Luigi Tito (1907-1991), summarized in Table S1, Supplemen-tary data.
The analysis were performed also on sample of commercial oil(Maimeri) and acrylic (Liquitex) paint layers. The real sampleswere taken from painting belonging to private collections. List ofsamples and paintings are reported in Table 1.
2.2. Analytical protocol
The analyses were carried out on paint samples (10 mg forpaint models, 1 mg for real paintings) dispersed in 1 mL of 0.1 Mphosphate buffer, pH 7, and treated by ultrasonication for 2 h, toextract the proteinaceous compounds. Afterward the followingprocedure was adopted:
� Ten microliters of the extraction solution were deposited on thesurface of a NEE and incubated for 30 min at room tempera-ture, in a humidity chamber made by a sealed Petri's plate withwet filter paper on the bottom. Proteins, like IgY, are expectedto bind on the carboxylic groups present on the PC surface(Zamuner et al., 2008; Pozzi Mucelli et al., 2008).
� The NEE was rinsed three times with 1 mL of phosphate buffer.� The NEE was dipped in a blocking solution (1% bovine serum
albumin in phosphate buffer) for 30 min at room temperatureon an orbital shaker plate.
� The electrode was rinsed three times with 1 mL of phosphatebuffer.
� Ten microliters of 0.05 mg mL�1 Anti-IgY HRP in phosphatebuffer were deposited onto the surface of the NEE andincubated for 30 min at room temperature in the humiditychamber.
� The NEE was rinsed three times with 1 mL of phosphate buffer.� The NEE was dipped in the voltammetric cell containing
0.1 mM MB, 0.1 M phosphate buffer, pH 7.� The CV was recorded at 50 mV s�1, initial potential 0.2 V,
vertex potential �0.6 V.� 8 mL of 1.2 mM H2O2 were added to the electrolyte solution.� The CV was recorded under the above CV conditions.
2.3. Multivariate exploratory analysis
Multivariate analysis was applied to the whole voltammetricprofiles recorded after addition of H2O2, considered as instrumen-tal fingerprints of samples analyzed. In more detail, principalcomponent analysis (PCA) was performed as exploratory method(Jolliffe, 2002). See Supplementary data for details.
3. Results and discussion
On the basis of previous studies (Pozzi Mucelli et al., 2008), MBwas used as redox mediator suitable to shuttle electrons from NEEto the HRP label, bound to Anti-IgY. The dotted line CV in Fig. 1,recorded at a bare NEE, shows a well resolved reduction peakwhich, according to previous literature reports (Wopschal andShain, 1967; Ye and Baldwin, 1988), is attributed to the twoelectron–one proton reduction of MB to the leuco form (LB). Thisreduction occurs via a rather complex ECE mechanism (Wopschaland Shain, 1967).
The dashed curve in the same figure shows only minor changesin the CV pattern as a consequence of the treatment of the NEEwith IgY, plus BSA as blocking agent and Anti-IgY-HRP. Indeed, thecathodic reduction peak current (Ipc) decreases slightly as well asthe associated anodic reoxidation peak (Ipa), with Ipa/Ipc beingclose to 1 both at a bare NEE and on the modified NEE. When1.2 mM H2O2 is added to the treated NEE, a dramatic change involtammetric pattern is detected: the reduction current increases,the reoxidation peak disappears and the CV pattern becomessigmoidally shaped (full line in Fig. 1). These features agree withthe occurrence of an electrocatalytic process, which, on the basisof previous research (Pozzi Mucelli et al., 2008), involves the
Table 1List of real samples analyzed.
Name Acronym Description Period IgY presence
Adoration of the Magi IU1 Painting on panel XVIII–XIX c. PositiveIU2 Positive
Landscape OU1 Oil on cardboard First half of XX c. NegativeStill life OU4 Oil on plywood 1960s NegativeNude CU1 Sketch on paper 1970s PositiveAdoration of the Magi I2 Painting on panel XVII–XVIII c. PositiveWooden torch-holder RT1 Wooden polychrome sculpture XVI–XVII c. PositiveGreek Statue TO1 Paint on canvas panel XIXc. Negative
TO2 NegativeTO3 Negative
Child Jesus BG1 Wooden polychrome sculpture XVI–XVII c. NegativeMadonna with child IR1 Painting on panel About 1700s NegativeCommercial oil paint Oil Produced by Maimeri ———————— NegativeCommercial acrylic paint Acr Produced by Liquitex ———————— NegativeCommercial tempera paint Tcomm Produced by Maimer ————————— Negative
F. Bottari et al. / Biosensors and Bioelectronics 52 (2014) 403–410 405
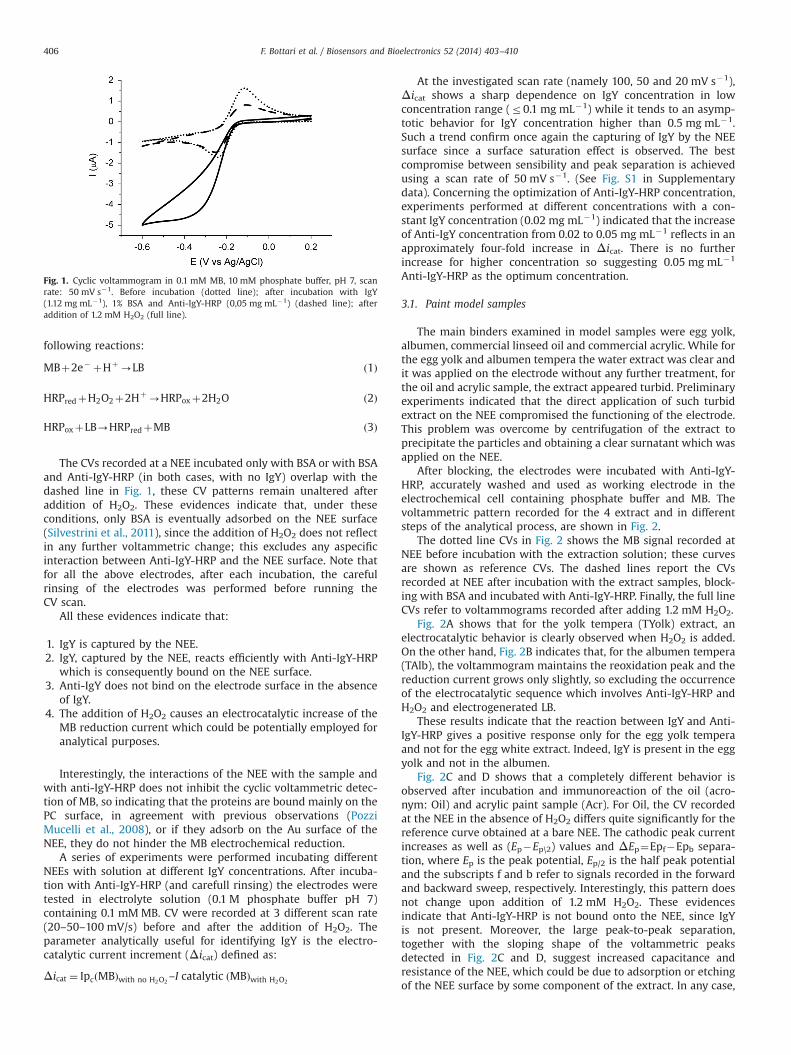
following reactions:
MBþ2e� þHþ-LB ð1Þ
HRPredþH2O2þ2Hþ-HRPoxþ2H2O ð2Þ
HRPoxþLB-HRPredþMB ð3Þ
The CVs recorded at a NEE incubated only with BSA or with BSAand Anti-IgY-HRP (in both cases, with no IgY) overlap with thedashed line in Fig. 1, these CV patterns remain unaltered afteraddition of H2O2. These evidences indicate that, under theseconditions, only BSA is eventually adsorbed on the NEE surface(Silvestrini et al., 2011), since the addition of H2O2 does not reflectin any further voltammetric change; this excludes any aspecificinteraction between Anti-IgY-HRP and the NEE surface. Note thatfor all the above electrodes, after each incubation, the carefulrinsing of the electrodes was performed before running theCV scan.
All these evidences indicate that:
1. IgY is captured by the NEE.2. IgY, captured by the NEE, reacts efficiently with Anti-IgY-HRP
which is consequently bound on the NEE surface.3. Anti-IgY does not bind on the electrode surface in the absence
of IgY.4. The addition of H2O2 causes an electrocatalytic increase of the
MB reduction current which could be potentially employed foranalytical purposes.
Interestingly, the interactions of the NEE with the sample andwith anti-IgY-HRP does not inhibit the cyclic voltammetric detec-tion of MB, so indicating that the proteins are bound mainly on thePC surface, in agreement with previous observations (PozziMucelli et al., 2008), or if they adsorb on the Au surface of theNEE, they do not hinder the MB electrochemical reduction.
A series of experiments were performed incubating differentNEEs with solution at different IgY concentrations. After incuba-tion with Anti-IgY-HRP (and carefull rinsing) the electrodes weretested in electrolyte solution (0.1 M phosphate buffer pH 7)containing 0.1 mMMB. CV were recorded at 3 different scan rate(20–50–100 mV/s) before and after the addition of H2O2. Theparameter analytically useful for identifying IgY is the electro-catalytic current increment (Δicat) defined as:
Δicat ¼ IpcðMBÞwith no H2O2–I catalytic ðMBÞwith H2O2
At the investigated scan rate (namely 100, 50 and 20 mV s�1),Δicat shows a sharp dependence on IgY concentration in lowconcentration range (r0.1 mg mL�1) while it tends to an asymp-totic behavior for IgY concentration higher than 0.5 mg mL�1.Such a trend confirm once again the capturing of IgY by the NEEsurface since a surface saturation effect is observed. The bestcompromise between sensibility and peak separation is achievedusing a scan rate of 50 mV s�1. (See Fig. S1 in Supplementarydata). Concerning the optimization of Anti-IgY-HRP concentration,experiments performed at different concentrations with a con-stant IgY concentration (0.02 mg mL�1) indicated that the increaseof Anti-IgY concentration from 0.02 to 0.05 mg mL�1 reflects in anapproximately four-fold increase in Δicat. There is no furtherincrease for higher concentration so suggesting 0.05 mg mL�1
Anti-IgY-HRP as the optimum concentration.
3.1. Paint model samples
The main binders examined in model samples were egg yolk,albumen, commercial linseed oil and commercial acrylic. While forthe egg yolk and albumen tempera the water extract was clear andit was applied on the electrode without any further treatment, forthe oil and acrylic sample, the extract appeared turbid. Preliminaryexperiments indicated that the direct application of such turbidextract on the NEE compromised the functioning of the electrode.This problem was overcome by centrifugation of the extract toprecipitate the particles and obtaining a clear surnatant which wasapplied on the NEE.
After blocking, the electrodes were incubated with Anti-IgY-HRP, accurately washed and used as working electrode in theelectrochemical cell containing phosphate buffer and MB. Thevoltammetric pattern recorded for the 4 extract and in differentsteps of the analytical process, are shown in Fig. 2.
The dotted line CVs in Fig. 2 shows the MB signal recorded atNEE before incubation with the extraction solution; these curvesare shown as reference CVs. The dashed lines report the CVsrecorded at NEE after incubation with the extract samples, block-ing with BSA and incubated with Anti-IgY-HRP. Finally, the full lineCVs refer to voltammograms recorded after adding 1.2 mM H2O2.
Fig. 2A shows that for the yolk tempera (TYolk) extract, anelectrocatalytic behavior is clearly observed when H2O2 is added.On the other hand, Fig. 2B indicates that, for the albumen tempera(TAlb), the voltammogram maintains the reoxidation peak and thereduction current grows only slightly, so excluding the occurrenceof the electrocatalytic sequence which involves Anti-IgY-HRP andH2O2 and electrogenerated LB.
These results indicate that the reaction between IgY and Anti-IgY-HRP gives a positive response only for the egg yolk temperaand not for the egg white extract. Indeed, IgY is present in the eggyolk and not in the albumen.
Fig. 2C and D shows that a completely different behavior isobserved after incubation and immunoreaction of the oil (acro-nym: Oil) and acrylic paint sample (Acr). For Oil, the CV recordedat the NEE in the absence of H2O2 differs quite significantly for thereference curve obtained at a bare NEE. The cathodic peak currentincreases as well as (Ep�Ep\2) values and ΔEp¼Epf�Epb separa-tion, where Ep is the peak potential, Ep/2 is the half peak potentialand the subscripts f and b refer to signals recorded in the forwardand backward sweep, respectively. Interestingly, this pattern doesnot change upon addition of 1.2 mM H2O2. These evidencesindicate that Anti-IgY-HRP is not bound onto the NEE, since IgYis not present. Moreover, the large peak-to-peak separation,together with the sloping shape of the voltammetric peaksdetected in Fig. 2C and D, suggest increased capacitance andresistance of the NEE, which could be due to adsorption or etchingof the NEE surface by some component of the extract. In any case,
Fig. 1. Cyclic voltammogram in 0.1 mM MB, 10 mM phosphate buffer, pH 7, scanrate: 50 mV s�1. Before incubation (dotted line); after incubation with IgY(1.12 mg mL�1), 1% BSA and Anti-IgY-HRP (0,05 mg mL�1) (dashed line); afteraddition of 1.2 mM H2O2 (full line).
F. Bottari et al. / Biosensors and Bioelectronics 52 (2014) 403–410406

these features do not change by adding H2O2, therefore, they arenot related to any IgY/Anti-IgY-HRP interaction.
The Acr sample displays a behavior intermediate between thealbumen and the oil sample, with a slight increase in cathodicpeak current after incubation and a very light further increaseafter addition of H2O2. Conversely, the anodic peak remains alwayswell detectable. These slight effects due to the H2O2 addition to thealbumen and acrylic samples are probably related to some minorside reaction between H2O2 and other components of the extract,whose effect is anyway very different and much less importantthan the one caused by the electrocatalytic cycle described byreactions 1–3. It is worth pointing out that also model samples oftempera grassa (TGr and T1, see Table S1), egg and flour tempera(T2), flour and glue tempera (T3) were examined by the sameprocedure. Relevant CVs are reported in Supplementary data. Forthese cases of complex binders it is observed that the temperagrassa and egg and flour tempera show an electrocatalytic beha-vior comparable to that of yolk tempera, while flour and gluetempera do not. This agrees with the evidence that tempera grassaand egg and flour tempera contain egg yolk while flour and gluetempera does not. A sample of modern tempera paint commer-cially available (Tcomm) gives negative response, suggesting thatthe binder does not contain egg yolk.
3.2. Application to real artworks
The analyses on real paint samples were carried out on severalpaintings that belong to private collectors. Four samples ofwooden icons of XVII–XVIII century and 2 samples of woodenpolychrome sculptures from XVI–XVII century were analyzed.Three samples from the same painting from XIX century werealso analyzed. These samples were taken from different layers: onefrom the ground layer, one from the original painting layer and
the last one from a recent repainting. To complete the set ofreal samples, also three samples from modern paintings wereanalyzed; namely, two oil on cardboard and one sketch on paper,both of XX century. The list of samples are reported in Table 1,together with relevant sample acronyms; the CVs and a briefdescription of all samples are reported in the Supplementary data.Fig. 3 shows typical voltammograms representative of the CVbehavior recorded on some real paint sample; two from paintings(IU1 and OU4) and two for wooden polychrome sculptures (BG1and RT1).
The samples IU1 and RT1 (Fig. 3A and B) show an electro-catalytic current increase, when H2O2 is added to the NEEsincubated with the sample extract and anti-Ig-Y-HRP, as abovedescribed. The detection of the electrocatalytic current agrees withthe presence of egg yolk in these paint samples; note that alsoanother sample (IU1) from the same artwork gave a similar result(see CVs in Supplementary data). On the other hand, the CVsrelevant to different samples, namely RT1 and BG1 (Fig. 3C and D,respectively), show CV patterns different from those of samplesIU1 and OU4, but comparable with those of the oil paint modelsamples. The ΔEp and (Ep–Ep/2) values increase sensibly togetherwith the cathodic peak current; note that the addition of H2O2
does not cause any further change, so suggesting that IgY/Anti-IgY-HRP were not captured by the NEE.
The analyses carried out on paint model samples and samplesfrom real paintings provided sets of analytical data, suitable for amore precise definition of the type of binder that is being analyzed.The main discriminating factor which indicates whether a samplecontains an egg yolk based binder or not is the appearance ofelectrocatalytic process between MB and HRP. However, also othercharacteristics gained for the CV patterns can be helpful to furthercharacterization of the sample. Table 2 lists four of these character-istics useful to this aim, all inserted in a tentative diagnostic scheme.
Fig. 2. Cyclic voltammograms recorded before incubation (dotted line); after incubation with extraction solution, 1% BSA and Anti-IgY-HRP conjugated (0,05 mg mL�1)(dashed line); after addition of 1.2 mM H2O2 (full line). (A) Yolk tempera, (B) Albumen tempera, (C) Oil, and (D) Acrylic. Other conditions as in Fig. 1.
F. Bottari et al. / Biosensors and Bioelectronics 52 (2014) 403–410 407

From the exam of the scheme one can conclude that theconvergence of all four factors, allow one to identify the presenceof egg yolk in the paint layers. Among the examined samples sucha positive convergence was found for samples IU1, IU2, CU1, I2,RT1, T1, T2, TGr and TYolk. Interestingly, this analysis point outthat also other binders can be identified by the response theproposed analytical procedure, as it is the case of the oil binder;the CV recorded with the NEE in these samples show indeed thespecial features represented typically by the dashed and full line inFig. 3C and D. This is not due to any specific interaction of the NEEwith any protein nor antibody, but it is related to a more generickind of interaction between the NEE and the extract. On the basisof these observations and in order to extract the maximumanalytical information for the sample, all the voltammetric datawere further examined by performing Principal Component Ana-lysis (PCA), as described below.
3.3. Principal component analysis (PCA)
PCA was applied to the raw voltammetric patterns analyzed ascomponents of a data matrix structured with 24 rows (samples)and 1600 variables (currents measured at each sweep potential).The samples acronym and characteristic are listed in Tables 1 andS1 and in the above text. Both paint model and real artwork
samples were included therein, in order to provide a comprehen-sive overview of the potentiality of the method in characterizingsamples on the basis of presence/absence of egg yolk. Thevoltammograms processed by multivariate analysis were thoserecorded after addition of H2O2.
At first, signals were transformed by means of a standardnormal variate (SNV) transform aimed at minimizing unwantedsystematic differences among different measurements (Oliveriet al., 2010). Then, data were mean-centred column-wise andsubmitted to PCA. The score plot on the two lowest-order principalcomponents is shown in Fig. 4A; samples which resulted positiveto the egg yolk presence on the basis of the criteria in Table 2, areindicated as squared data points in the plot, while all the other areshown as circled data. A clear differentiation between samplespositive to egg yolk vs. negative ones is clearly evidenced by theplot, with both of the principal components being involved in sucha differentiation.
By a joint examination of the score plot (Fig. 4A) and theloading plot (Fig. 4B), it is possible to highlight the originalvariables (namely, the regions of the CVs) that are most involvedin the characterization of samples containing egg yolk. Theycorrespond to the current values gained in the �0.3 to �0.5 Vpotential region, which are found – in the loading plot – to beopposite (with respect to the axis origin) to the direction in which
Fig. 3. Cyclic voltammograms recorded before incubation (dotted line); after incubation with extraction solution, 1% BSA and Anti-IgY-HRP conjugated (0,05 mg mL�1)(dashed line); after addition of 1.2 mM H2O2 (full line). (A) IU1, (B) RT1, (C) BG1, and (D) OU4. Other conditions as in Fig. 1.
Table 2Tentative diagnostic scheme based on the changes in the voltammetric patterns caused by the addition of H2O2.
Painting Binder Cathodic peak Anodic peak CV pattern H2O2 effect
Egg-yolk tempera Significant increase Disappears Sigmoidal (catalytic) DramaticOther tempera Slight increase Slight decrease Peak shaped Almost negligibleOil Increase Almost unchanged Peak with ohmic distortion Completely negligibleAcrylic Slight increase Slight decrease Peak shaped Almost negligible
F. Bottari et al. / Biosensors and Bioelectronics 52 (2014) 403–410408

the positive samples are localized within the score plot (solidsquares in Fig. 4A).
Such an inverse correspondence is due to the fact that currentvalues are negative in this potential range, which is, indeed, thepart of the CV where the rise of the catalytic current is eventuallyobserved.
The outcomes of PCA clearly confirm that the method proposedis a valuable tool for identifying egg yolk tempera in real paintsamples of different nature.
4. Conclusions
This approach to the analysis of ancient paint binders is able toconjugate the specificity of immunochemical techniques with therapid and cost affordable electrochemical detection. The use of adirect approach, in which the antigen is bound directly on thetransducer surface, reduces the analytical steps and the reagentsrequired. Another important advantage is the use of NEEs, whichfurnish well resolved CV patterns, with high S/N ratios and whichdemonstrate very interesting IgY capturing capability, related tothe high affinity of proteins for PC (Silvestrini et al., 2013). From a
general bioanalytical and biosensing viewpoint, this is the firstreport describing an electrochemical immunosensor suitable forIgY detection. This seems an interesting achievement, taking intoaccount the increasing use of IgY for advanced immune diagnosticand immunotherapy (Dias da Silva and Tambourgi, 2010).
Concerning the particular application studied here, i.e. paintbinder identification, the analysis of the CVs allows a satisfactorydistinction between the patterns obtained from samples contain-ing IgY from those which do not contain such a protein. A reliabledata analysis can be performed either using the simple diagnosticscheme illustrated in Table 2 or using a more sophisticated, butmore precise PCA method. In principle, if suitable antibodiesbe available, a similar procedure could be extended also to thedetection of other proteins of interest in the field of culturalheritage study and conservation.
Acknowledgments
Financial support by MIUR-Rome, (Project PRIN 2010AXENJ8) isacknowledged. We thank Giovanna Niero (conservator in Noale,Venezia) for providing some of the real samples and for skillfultechnical support and expertise.
Appendix A. Supplementary material
Supplementary data associated with this article can be found inthe online version at http://dx.doi.org/10.1016/j.bios.2013.09.025.
References
Brunetti, B., Ugo, P., Moretto, L.M., Martin, C.R., 2000. Journal of ElectroanalyticalChemistry 491, 166–174.
Carlander, D., Stalberg, J., Larsson, A., 1999. Journal of Medical Sciences 104,179–190.
Cartechini, L., Vagnini, M., Palmieri, M., Pitzurra, L., Mello, T., Mazurek, J., Chiari, G.,2010. Accounts of Chemical Research 43, 867–876.
Casadio, F., Toniolo, L., 2001. Journal of Cultural Heritage 2, 71–78.Chalghoumi, R., Beckers, Y., Portetelle, D., Théwis, A., 2009. Biotechnology, Agron-
omy, Society and Environment 13 (2), 295–308.Colombini, M.P., Modugno, F., 2004. Journal of Separation Science 27, 147–160.De Leo, M., Pereira, F.C., Moretto, L.M., Scopece, P., Polizzi, S., Ugo, P., 2007.
Chemistry of Materials 19, 5955–5964.Dias da Silva, W., Tambourgi, D.V., 2010. Veterinary Immunology and Immuno-
pathology 135 (2010), 173–180.Dolci, L.S., Sciutto, G., Guardigli, M., Rizzoli, M., Prati, S., Mazzeo, R., Roda, A., 2008.
Analytical and Bioanalytical Chemistry 392, 29–35.Doménech-Carbò, M.T., 2008. Analytica Chimica Acta 621, 109–139.Heginbotham, A., Millay, V., Quick, M., 2006. Journal of the American Institute for
Conservation 45, 89–105.Johnson, M., Packard, E., 1971. Studies in Conservation 16, 145–164.Jolliffe, I.T., 2002. Principal Component Analysis, second ed. Springer, New York.Jones, P.L., 1962. Studies in Conservation 7, 10–16.Kockaert, L., Gausset, P., Dubi-Rucquoy, M., 1989. Studies in Conservation 34 (4),
183–188.Mann, K., Mann, M., 2008. Proteomics 8, 178–191.Mann, K., 2007. Proteomics 7, 3558–3568.Marinach, C., Papillon, M.C., Pepe, C., 2004. Journal of Cultural Heritage 5, 231–240.Menon, V.P., Martin, C.R., 1995. Analytical Chemistry 67, 1920–1928.Oliveri, P., Casolino, C., Forina, M., 2010. In: Taylor, S. (Ed.), Chemometric Brains for
Artificial Tongues. Advances in Food and Nutrition Research, Academic Press,Burlington, pp. 57–117.
Palmieri, M., Vagnini, M., Pitzurra, L., Rocchi, P., Brunetti, B.G., Sgamellotti, A.,Cartechini, L., 2011. Analytical and Bioanalytical Chemistry 399, 3011–3023.
Pereira, F.C., Moretto, L.M., De Leo, M., Boldrin Zanoni, M.V., Ugo, P., 2006. AnalyticaChimica Acta 577 (1), 16–24.
Pozzi Mucelli, S., Zamuner, M., Tormen, M., Stanta, G., Ugo, P., 2008. Biosensors andBioelectronics 23, 1900–1903.
Prati, S., Joseph, E., Sciutto, G., Mazzeo, R., 2010. Accounts of Chemical Research 43,792–801.
Ramírez-Barat, B., de la Viña, S., 2001. Studies in Conservation 46, 282–288.Rucker, V.C., Havenstrite, K.L., Simmons, B.A., Sickafoose, S.M., Herr, A.E., Shediac, R.,
2005. Langmuir 21, 7621–7625.Sciutto, G., Dolci, L.S., Buragina, A., Prati, S., Guardigli, M., Mazzeo, R., Roda, A., 2011.
Analytical and Bioanalytical Chemistry 399, 2889–2897.
Fig. 4. Graphical output of PCA performed on CV recorded after addition of H2O2.(A) Score plot showing the differentiation between positive (solid squares) andnegative (circles) samples. (B) Loading plot showing the original variables mostinvolved in the differentiation.
F. Bottari et al. / Biosensors and Bioelectronics 52 (2014) 403–410 409

Silvestrini, M., Schiavuta, P., Scopece, P., Pecchielan, G., Moretto, L.M., Ugo, P., 2011.Electrochimica Acta 56, 7718–7724.
Silvestrini, M., Fruk, L., Ugo, P., 2013. Biosensors and Bioelectronics 40, 265–270.Ugo, P., Moretto, L.M., 2007. Template deposition of metal. In: Zoski, C.G. (Ed.),
Handbook of Electrochemistry. Elsevier, Amsterdam, pp. 678–709.Ugo, P., Moretto, L.M., Bellomi, S., Menon, V.P., Martin, C.R., 1996. Analytical
Chemistry 68, 4160–4165.
Vagnini, M., Pitzurra, L., Cartechini, L., Miliani, C., Brunetti, B.G., Sgamellotti, A.,2008. Analytical and Bioanalytical Chemistry 392, 57–64.
Wopschal, R.H., Shain, I., 1967. Analytical Chemistry 39, 1527–1534.Ye, J., Baldwin, R.P., 1988. Analytical Chemistry 60 (20), 2263–2268.Zamuner, M., Pozzi Mucelli, S., Tormen, M., Stanta, G., Ugo, P., 2008. European
Journal of Nanomedicine 1, 33–36.
F. Bottari et al. / Biosensors and Bioelectronics 52 (2014) 403–410410


![IgY JoVE Protocol 3084[1]](https://static.fdocuments.net/doc/165x107/577d242a1a28ab4e1e9bc162/igy-jove-protocol-30841.jpg)


