2014 Health Care Cost and Utilization Report HCCUR 10.29.15.pdf · 2014 Health Care Cost and...
26
2014 Health Care Cost and Utilization Report October 2015 www.healthcostinstitute.org Copyright 2015 Health Care Cost Institute Inc. Unless explicitly noted, the content of this report is licensed under a Creative Commons Attribution Non-Commercial No Derivatives 4.0 License
Transcript of 2014 Health Care Cost and Utilization Report HCCUR 10.29.15.pdf · 2014 Health Care Cost and...
2014 Health Care Cost and Utilization Report
October 2015
www.healthcostinstitute.org
Copyright 2015 Health Care Cost Institute Inc. Unless explicitly noted, the content of this report is licensed
under a Creative Commons Attribution Non-Commercial No Derivatives 4.0 License
www.healthcostinstitute.org
2014 Health Care Cost and Utilization Report 1
The Health Care Cost Institute (HCCI) is pleased to release the 2014 Health Care Cost and Utilization Report. The report covers
the health care cost and utilization trends for Americans younger than age 65 and covered by employer-sponsored insurance
(ESI) for the years 2010 through 2014, and it is the first look at the 2014 data. In 2014, the insurance exchanges opened with
varying participation and enrollment by state. Although impacts of the Affordable Care Act may have occurred in 2014 on the
ESI trends discussed in this report, none of those were explicitly investigated here. The impact of the ACA on the health care
trends of the ESI population is an important topic for future study.
Health care spending per capita for this population grew 3.4% in 2014. Similarly, over the 2010–2014 period, per capita
spending growth was relatively steady and grew between 3.0% and 4.0% in each year; growing an average annual 3.4%. Con-
tributing to this steady spending growth were increasing average prices for health care services and declining utilization of
services. Continuing a trend beginning in 2012, the ESI population’s utilization of services continued to decline. This decline
occurred across genders, age groups, and categories of health care services. This report details these trends, and we hope
that you find the report informative.
Throughout the last year, HCCI has continued its efforts to better inform stakeholders, policy makers, and the public about
the U.S. health care system. The most important of these efforts are detailed below, and more information on all of HCCI’s
initiatives can be found on the HCCI Website (www.healthcostinstitute.org). Initiatives include the following:
Guroo: In February 2015, HCCI released the first version of Guroo, a free Web-based portal to provide health care
price and quality information to the public. The goal of Guroo is to give consumers information on the costs and qual-
ity of health care so they can make more informed choices about how they spend their health care dollars. HCCI is
making continuous enhancements to the Website and anticipates releases throughout the upcoming year.
Data enclave: HCCI, in partnership with and hosted by the NORC at the University of Chicago, developed a secure da-
ta enclave to host the de-identified, HIPAA-compliant HCCI data. HCCI is pleased to welcome many research teams to
the data enclave, including teams from public and private universities, government agencies, and actuarial associa-
tions. These research teams are engaged in non-commercial, academic research covering many diverse health care
topics.
Grant-funded research: In late 2014, HCCI, in partnership with the National Academy for State Health Policy and with
funding from the Laura and John Arnold Foundation, granted six research teams at universities across the country
the use of the HCCI data to explore various questions around state reforms of health care policies. The research prod-
ucts from these teams will be publicly released in early 2016.
Chartbook: During the fall of 2015, HCCI will release a Chartbook using the HCCI and Guroo data. The Chartbook in-
cludes a series of graphs and maps comparing the average price of health care services in each state to the national
average price for the same services.
In addition to these activities, HCCI continues to be a source of public reporting on spending and utilization trends of the ESI
population younger than age 65. Along with this annual report, HCCI recently produced the Children’s Health Spending: 2010–
2013 report and an issue brief on health care spending trends for individuals identified with diagnosed with diabetes.
Our continued work would not have been possible without ongoing support from our stakeholders and partners. We look
forward to another year of an expanding agenda of activities in 2016.
Letter from the Executive Director
David Newman Executive Director, HCCI

www.healthcostinstitute.org
2014 Health Care Cost and Utilization Report i
The Health Care Cost Institute (HCCI)
is pleased to present the fifth in a se-
ries of annual reports detailing the
health care cost and utilization trends
for the national population younger
than age 65 and covered by employer
-sponsored insurance (ESI). This re-
port, the 2014 Health Care Cost and
Utilization Report, covers the period
2010 to 2014, with the bulk of the
analysis focused on the 2014 data.
Previous reports can be found on the
HCCI Website. As with previous re-
ports, this report details trends in per
capita spending, out-of-pocket spend-
ing per capita, utilization of services
per 1,000 individuals, and the average
price per service. These trends were
broken down by various demographic
groups including U.S. Census regions,
age, gender, and age/gender group-
ings. Additionally, we studied trends
for two broad types of services: medi-
cal (inpatient admissions, outpatient
facility, and professional services) and
prescription (brand and generic).1
In 2014, per capita health care spend-
ing for the national ESI population
grew 3.4%. Overall, this increase in
spending was largely driven by in-
creased prices, which were not offset
by declining service utilization. These
trends, increased average prices and
lower utilization of services, were
observed across categories of services
genders, and age groups.
Growth in per capita spending
steady during the study period
National per capita spending grew
3.4% to $4,967 in 2014, an increase of
$163 (Table 1). Per capita spending
for the study population has been
growing since 2010 at relatively simi-
lar rates. Between 2010 and 2014,
spending grew at an average annual
rate of 3.4%. The largest spending
growth of 4.0% was observed in
2011, whereas the lowest growth
(3.0%) occurred in 2013 (Appendix
Table A1).
Growth in spending per capita was
relatively similar across age groups.
The slowest growth rate (2.4%) was
for intermediate adults (ages 26–44),
the same rate as in the previous year
(Table 1). Per capita spending growth
rates were between 3.4% and 3.9%
for the other age groups. The fastest
growth rates (3.9%) occurred for
young adults (ages 19–25) and pre-
Medicare adults (ages 55–64).
In 2014, per capita spending growth
for men was higher than for women:
3.9% as compared to 3.0% (Table 1).
In contrast, spending for women in
that year was higher than for men.
The spending difference between men
and women narrowed slightly, with a
difference of $1,085 in 2014 as com-
pared to $1,090 in 2013.
As was observed in the previous year,
the fastest spending growth rate oc-
curred in the Northeast (5.0%), while
the slowest growth rate was in the
West (2.4%; Table 1). These two re-
gions also had the highest and lowest
spending per capita of the four re-
gions: $5,232 and $4,599, respective-
ly.
Spending on each service catego-
ry increased in 2014
Spending on the medical subservice
categories (inpatient admissions, out-
patient visits, outpatient-other ser-
vices, and professional services) in-
Executive Summary
3.4%
Increase in health care spending per
capita
16.3%
Share of total health care spending
paid by out-of-pocket by individuals,
the lowest share since 2011
2.2%
Increase in out-of-pocket health care
spending per capita
3.2% & 3.3%
Increases in utilization and average
price for generic prescriptions
–15.6% & 28.1%
Changes in utilization and average
price for brand prescriptions
$780 Dollar increase in average price of an
inpatient admission
BY THE NUMBERS: 2014
www.healthcostinstitute.org
2014 Health Care Cost and Utilization Report ii
creased between 1.7% and 4.7%
(Table 1). (See Key definitions for
more information about these catego-
ries.) Generally, per capita spending
grew more slowly in 2014 than in the
previous year. The fastest spending
growth rate was for outpatient visits,
whereas the slowest was for inpatient
admissions. The largest dollar in-
crease spent per capita was on outpa-
tient visits ($39), whereas the small-
est dollar increase was on outpatient-
other services ($15). Only for outpa-
tient visits did spending grow more
rapidly in 2014 than in the previous
year: 4.7% as compared to 4.5%.
Spending grew at faster rates for pre-
scriptions (6.5% for generic and 8.2%
for brand) than for any of the medical
subservice categories (Table 1). The
8.2% growth rate observed for brand
prescriptions was the fastest rate ob-
served in any of the previous 4 years.
For generic prescriptions, a 6.5%
growth represents the second fastest
growth rate observed since 2010, as
spending grew 13.4% in 2012. The
larger spending growth for prescrip-
tions, as compared to the other ser-
vice categories, largely contributed to
the stable rate of overall spending
growth observed in 2014.
Out-of-pocket spending grew
more slowly for 2014 compared
to previous years
Overall, out-of-pocket spending by the
national ESI population younger than
age 65 grew 2.2%, or $17 over the
previous year (Table 2). Per capita
out-of-pocket spending reached $810
in 2014 and represented 16.3% of
total per capita health care spending.
This was a similar, and only slightly
smaller, share of the total spending
than that in 2012 (16.4% of total
spending) or in 2013 (16.5% of total
spending). Spending out of pocket on
inpatient admissions and on brand
and generic prescriptions decreased
(a total of $14 per capita), whereas
spending on outpatient and profes-
sional services increased (a total of
$31 per capita).
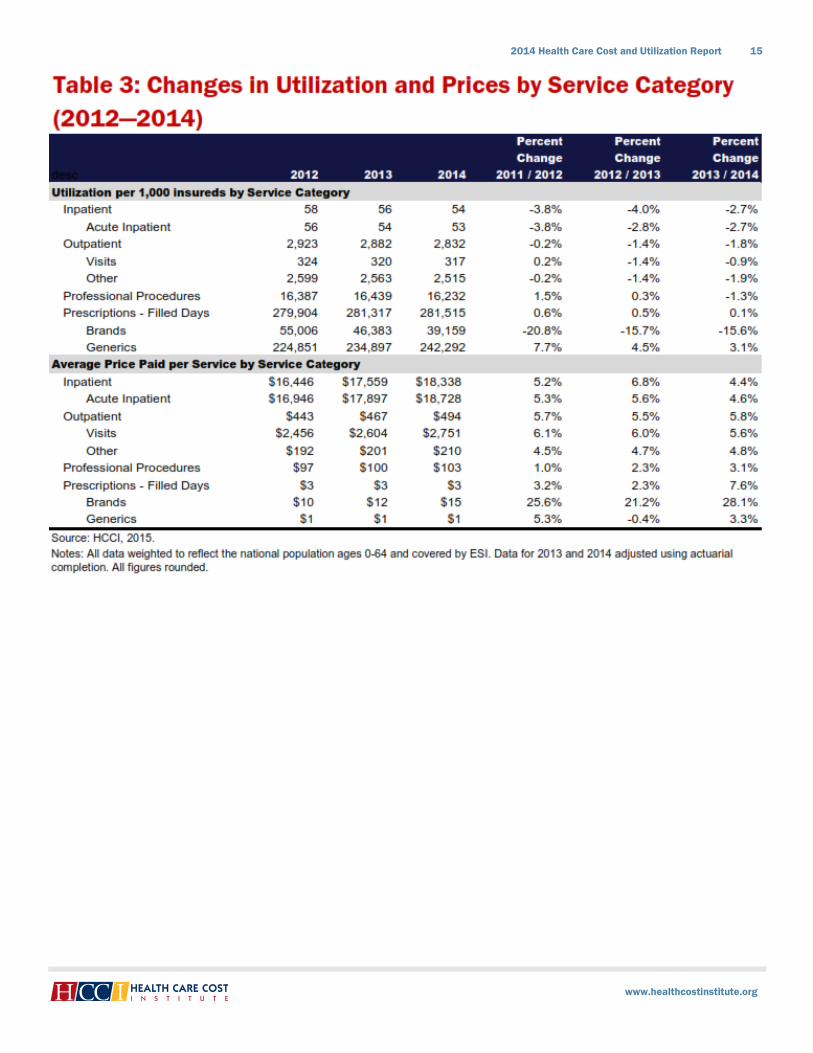
As in previous year, average pric-
es increased while utilization de-
clined
The average price paid per service
increased in 2014 for every sub-
service category. The smallest aver-
age price increase was for profession-
al services (3.1%), an increase of $3
per service (Table 3). The largest av-
erage price increase was for inpatient
admissions (4.4%), an increase of
$780 per admission.
Generic prescriptions was the only
subservice category that saw an in-
crease in utilization in 2014. Utiliza-
tion increased by 3.1%, or 7,395 filled
days per 1,000 individuals (Table 3).
For the other subservice categories
during this period, utilization de-
clined. The largest decline in utiliza-
tion was for brand prescriptions (–
15.6%) followed by inpatient admis-
sions (–2.7%).
Notable trends
ER visits continued to decline for chil-
dren (ages 0–18): For the second con-
secutive year for girls and the third
consecutive year for boys, the number
of visits to emergency rooms (ERs)
declined. In 2014, the number of ER
visits dropped by 3 visits per 1,000
boys and by 1 visit per 1,000 girls
(Appendix Table A37). In contrast, ER
visits by the other age/gender groups
increased in 2014, after a decline in
utilization in 2013.
Increase in spending on brand pre-
scriptions: Spending on brand pre-
scriptions increased by $45 per capita
in 2014 (Table 1). This was the larg-
est spending increase on brand pre-
scriptions during the study period
(Appendix Table A1). At the same
time, utilization of brand prescrip-
tions fell by 15.6%, a decline of 7,224
filled days of brand prescriptions per
1,000 individuals (Table 3).
Of the spending increase, $29.60 was
attributable to three hepatitis C virus
(HCV) antivirals (Appendix Table
A49). Correspondingly, utilization of
this subclass increased from .2 filled
days per 1,000 individuals in 2013 to
30 in 2014.
Decline in out-of-pocket spending for
pre-Medicare women: In 2014, out-of-
pocket spending by pre-Medicare
adult women declined by $11 per
woman (–0.8%; Appendix Table A31).
This was the only age/gender group
whose out-of-pocket spending de-
clined during that period. While out-
of-pocket spending by these women
increased by $30 per woman on out-
patient and professional services, this
growth was offset by a $41 decline in
spending on inpatient admissions and
prescriptions. The largest decline in
out-of-pocket spending was on brand
prescriptions, which declined by $27.
HCCI AGE GROUPS
Children
Ages 0 through 18.
Young Adults
Ages 19 through 25.
Intermediate Adults
Ages 26 through 44.
Middle-Age Adults
Ages 45 through 54.
Pre-Medicare Adults
Ages 55 through 64.
www.healthcostinstitute.org
2014 Health Care Cost and Utilization Report iii
KEY DEFINITIONS
What is per capita spending?
Per capita spending in this report is the estimate of total expenditures on medical and pharmacy claims divided by the
employer-sponsored insured (ESI) population.
What are medical services and their subservice and detailed categories?
Three medical service categories are identified: inpatient facility, outpatient facility, and professional procedures.
These service categories are divided into subservice categories and further classified into “detailed service” catego-
ries.
Acute inpatient admissions: This subservice category consists of the five detailed service categories: medical,
surgical, labor and delivery (LD), newborn, and mental health and substance use (MHSU) admissions. It excludes
hospice, skilled nursing facility, and ungroupable admissions (see Data and Methods).
Outpatient visits: This subservice category consists of three detailed service categories: ER visits, outpatient sur-
gery, and observation visits.
Outpatient-other services: This subservice category consists of four detailed categories that make up the outpa-
tient-other services category: ancillary services, miscellaneous services, laboratory and pathology services (lab/
path), and radiology services.
Professional services: This subservice category consists of 11 detailed service categories: administered drugs
(including chemotherapy drugs); the administration of drugs; anesthesia; office visits to primary care providers
(PCPs); office visits to specialists; miscellaneous services; pathology and laboratory (path/lab) services; preven-
tive visits to PCPs; preventive visits to specialists; radiology services; and surgery services.
What are prescription service, subservice, and detailed service categories and subclasses?
HCCI analyzes prescription drug and device claims from pharmacies. The prescription service category is divided into
brand and generic drug subservice categories and is further classified into detailed service categories, and further into
subclasses.
Brand and generic prescriptions: These detailed service categories for brand and generic prescriptions are
based on the AHFS classification system. The prescription detailed service categories are: anti-infective agents;
cardiovascular drugs; central nervous system (CNS) agents; eye, ear, nose, throat (EENT) preparations; gastroin-
testinal drugs; hormones and synthetic substitutes (hormones); all other therapeutic classes (other); respiratory
drugs; and skin and mucous membrane (skin) agents.

www.healthcostinstitute.org
2014 Health Care Cost and Utilization Report 1
This report analyzes trends in annual
spending per capita for individuals
covered by employer-sponsored in-
surance (ESI) and younger than age
65. Per capita spending trends were
examined for the ESI population na-
tionally; for population sub-groups
(by U.S. Census region, gender, age
group, and age/gender group); and
across broad and detailed service cat-
egories (see Key definitions and HCCI
age groups). This section describes
the per capita spending trends for the
ESI population for the study period
(2010–2014), with specific focus on
2014.
Per capita spending increased;
spending growth remained steady
In 2014, health care spending per
capita was $4,967 for the national ESI
population (Figure 1 and Table 1).
This was an increase of $163 over the
previous year. In 2014, spending
grew 3.4%. This rate of growth was
similar to that of the prior year
(3.0%), and the other years studied
(2010–2014; Appendix Table A1).
Health care spending per capita in-
creased with age. Spending was low-
est for the youngest age group
(children, ages 0–18) and highest for
the oldest age group (pre-Medicare
adults, ages 55–64): $2,660 and
$9,466, respectively, in 2014 (Table
1). The difference between the high-
est and lowest (oldest and youngest)
spending groups increased every year
studied: from $6,281 in 2010 to
$6,806 in 2014.
In 2012, the percentage changes in
per capita spending growth for each
of the five age groups varied widely
(Figure 2). For 2011, growth ranged
from a high of 7.9% (for children and
young adults, ages 19–25) to 3.1%
(for pre-Medicare adults). After 2012,
growth rates appeared to converge,
and were similar across the age
groups. In 2014, the highest spending
growth, 3.9%, was for young adults
and pre-Medicare adults, whereas the
lowest growth of 2.4%, was for inter-
mediate adults (ages 26–44).
Spending Per Capita for the ESI
Population
Growth rate remained
steady
Growth in per capita spending was
3.4%, a similar rate to 2012 (3.4%)
and 2013 (3.0%)
$4,967
Spending per capita for the national
ESI population
$6,806
Difference in per capita spending be-
tween children and pre-Medicare
adults
$45
Increase in per capita spending on
brand prescriptions
15.3%
Increase in per capita spending on
brand prescriptions for pre-Medicare
adult men
KEY FINDINGS: 2014

www.healthcostinstitute.org
2014 Health Care Cost and Utilization Report 2
Spending on all subservice cate-
gories increased
Spending on all the subservice catego-
ries increased in 2013 and 2014. For
2013, the largest dollar increase was
for professional services ($42),
whereas the smallest was for generic
and brand prescriptions ($11 each;
Figure 3 and Table 1). For 2014, the
largest spending increase was on
brand prescriptions — a $45 increase
— more than four times larger than
the increase of the previous year. This
was the largest increase in spending
on brand prescriptions during the
study period. By comparison, in 2012,
spending on brand prescriptions de-
clined by $3.
This increase in spending on brand
prescriptions occurred across the
study population for every age group
(Appendix Table A4), gender
(Appendix Table A5), and age/gender
group (Appendix Table A6). The in-
crease was largest for pre-Medicare
adult men, whose spending on brand
prescriptions increased by $190
(15.3%) to $1,427 per capita
(Appendix Table A6 and Appendix
Table A7). Though every age group
saw an increase in brand prescription
spending, the increase in spending for
men was larger than that for women.
For pre-Medicare adult men and
women and middle-age adult men,
this increase was largely due to in-
creases in spending on brand anti-
infective agents: increases of $153,
$68, and $55, respectively (Appendix
Tables A16 and A17). For the other
adult age/gender groups, the increase
in spending on brand prescriptions
was influenced largely by increases in
spending on the “other” classes cate-
gory (Appendix Tables A8-A15).
Spending on outpatient visits in-
creased by $39 in 2014 (Table 1). The
bulk of this increase was on ER visits,
which increased $26 to $304 per capi-
ta (Appendix Table A8). Spending on
outpatient surgery visits also in-
creased, by $12 to $526 per capita
and remained the detailed service
category with the highest per capita
spending (Appendix Table A18).
At the same time, spending on profes-
sional services increased by $30 per
capita (Table 1), and two-thirds of
that increase was due to increased
spending on administered drugs and
miscellaneous services ($10 per capi-
ta each; Appendix Table A18). While
spending on professional services as a
whole increased, spending on three of
the detailed categories declined
slightly: office visits to primary care
physicians (–$2 per capita), radiology

www.healthcostinstitute.org
2014 Health Care Cost and Utilization Report 3
(–$3 per capita), and surgery services
(–$2 per capita).
The spending increases on acute ad-
missions and outpatient-other ser-
vices were comparatively small: $16
and $15 per capita, respectively
(Table 1). The largest spending in-
crease in the admissions category was
on surgical admissions (a $9 in-
crease), whereas for outpatient-other
services, the largest increase was for
miscellaneous services (an $8 in-
crease; Appendix Table A13). Notably,
though spending on acute admissions
increased only modestly, it remained
a high spending category overall,
reaching $988 per capita in 2014
(Table 1).
Regional spending continued to
vary
For the second consecutive year, the
Northeast had the highest per capita
spending and the fastest growth rate,
while the West had the lowest spend-
ing level and slowest growth rate
(Table 1). The South continued to
have the second-highest per capita
spending, followed by the Midwest.
In 2014, the Northeast had large dol-
lar increases in spending on all sub-
service categories as compared to the
other regions. For example, spending
increased $61 per capita on brand
prescriptions, $56 on acute admis-
sions, and $45 on professional ser-
vices (Appendix Table A19). In com-
parison, the South, with the second-
highest per capita spending had a $44
increase for brand prescriptions and
just $12 and $24 increases, respec-
tively on acute admissions and pro-
fessional services.
In contrast to the other regions,
spending levels and growth remained
low in the West due to a small in-
crease in spending on outpatient-
other services (a $5 increase) and a
decline in per capita spending on
acute admissions (–$13). Interesting-
ly, spending was higher on acute ad-
missions in the West than in the other
regions (Figure 4). The West also
spent the fewest dollars ($762) and
the smallest share of its health care
dollars on prescriptions (16.6%) as
compared with the other regions.
In each of the regions, most of the
spending was on professional ser-
vices. In the Northeast, professional
services made up a larger percentage
of its total health care spending
(36.2%) than anywhere else. While
the Northeast generally had the high-
est spending on the subservice cate-
gories, it had the lowest spending on
outpatient visits, $201 per capita less
than the highest-spending region (the
Midwest).

www.healthcostinstitute.org
2014 Health Care Cost and Utilization Report 4

www.healthcostinstitute.org
2014 Health Care Cost and Utilization Report 5
Out-of-Pocket Spending Per Capita
This section describes the trends in out-
of-pocket spending for the national ESI
population during the study period
(2010–2014). Out-of-pocket spending
was defined as the dollars spent by indi-
viduals for health care services in the
form of co-payments, coinsurance, and
deductibles (see Out-of-Pocket Spending
Definitions).
National out-of-pocket spending
continued to increase
In 2014, the national ESI population
spent $810 per capita out of pocket, a
$17 increase over the previous year
(Figure 5 and Table 2). The $810 per
capita represents 16.3% of the total
health care spending per capita. This is a
slightly smaller share of the total than in
the prior two years: 16.5% in 2013 and
16.4% in 2012. Similarly, growth in out-
of-pocket spending (2.2%) was lower in
2014 than in the other study years.
Continuing a trend first seen in 2012,
the West was the region with the lowest
per capita out-of-pocket spending. For
2014, the West also had the smallest
dollar increase in per capita out-of-
pocket spending over the previous year
of any region: just $4 per capita (Table
2). This was the smallest increase for
any region in any year during the study
period (Appendix Table A2). The South
continued to have the highest out-of-
pocket spending, as was true throughout
the study period. The gap between the
lowest-spending region (the West) and
the highest-spending region (the South)
grew in every year studied, and reached
$169 per capita in 2014.
In every year between 2010 and 2014,
out-of-pocket spending by women was
higher than that by men. This difference
grew every year, reaching $237 in 2014
(Appendix Table A2). Over the previous
2 years, out-of-pocket spending for men
had been increasing at faster rates than
those for women. For example, in 2014,
spending grew 2.1% for women and
2.3% for men. Even with the faster
growth rates for men, the spending gap
between the men and women continued
to grow.
Largest increase in out-of-pocket
spending for intermediate adults
Generally, out-of-pocket per capita
spending increases with age. In 2014,
the youngest age group had the lowest
spending ($472), whereas the oldest age
group had the highest ($1,300; Table 2).
However, growth in spending varied
across the age groups over the years
studied. For 2014, the largest dollar in-
crease in out-of-pocket spending was for
intermediate adults (ages 26–44; $27),
whereas in 2013, the fastest growth rate
was for children (ages 0–18; 4.9%) and
the largest dollar increase was for pre-
Medicare adults (ages 55–64; $45).
What had been consistent across the age
groups is that out-of-pocket spending
increased year over year; however, in
2014, out-of-pocket spending by one age
group declined (Figure 6; see Out-of-
Pocket Spending Trends: 2013 for more
information about trends by age/gender
groups). In 2014, spending by pre-
Medicare adults out of pocket dropped
by $5 per capita, a 0.4% decline. Inter-
estingly, this 1-year decline in spending
was experienced only by pre-Medicare
women, not by pre-Medicare men.
Spending out of pocket by pre-Medicare
women dropped by $11 per woman (see
Out-of-pocket spending by pre-Medicare
women declined in 2014 for more infor-
mation), while for men in this age group
spending increased by $1. Combined,
this led to a net decline in out-of-pocket
spending by the pre-Medicare adults.

www.healthcostinstitute.org
2014 Health Care Cost and Utilization Report 6
Out-of-pocket spending on pre-
scriptions and acute admissions
declined
In 2014, out-of-pocket per capita
spending for three of the four medical
subservice categories increased. For
professional services, spending in-
creased by $15 per capita, reaching
$366 (Table 2). This was the largest
increase in spending on a subservice
category for that year. Spending out
of pocket also rose for outpatient-
other services and visits: $7 and $10,
respectively. The largest increase
within those service categories was
for ER visits, which increased by $8
(14.9%; Appendix Table A20).
At the same time and for the first time
in the study period, out-of-pocket
spending on acute inpatient admis-
sions declined by $1 per capita (–
1.0%). This decline was not con-
sistent across the age/gender groups.
For children and intermediate adult
women, out-of-pocket spending on
acute admissions increased slightly,
by about $1 per child and $3 per
woman (Appendix Table A21 and Ap-
pendix Table A22). For young adults
(ages 19–25), this spending was
steady in 2014. For the other age/
gender groups, out-of-pocket spend-
ing on acute admissions was lower in
2014 than in the prior year.
The largest decline in 2014 in spend-
ing on acute admissions was for pre-
Medicare adults, whose spending was
$5 per person lower (Appendix Table
OUT-OF-POCKET SPENDING BY PRE-MEDICARE WOMEN DECLINED IN 2014
For the first time for pre-Medicare women (ages 55–64), and only the second time for an age/gender group (by $2 for
young adult women in 2013), out-of-pocket spending declined in 2014 (Table 2). Spending out of pocket by pre-
Medicare women fell by $11.
Prior to 2014, spending on all
medical subservice categories
and generic prescriptions had
increased every year (Appendix
Table A21). In contrast, 2014
spending declined on brand pre-
scriptions, generic prescriptions,
and acute admissions (Figure 7).
The largest decline was in spend-
ing on brand prescriptions: $27
lower in 2014 than in the prior
year. Of the brand prescription
detailed categories, the largest
decline was for brand CNS agents
($10 per woman) followed by
brand cardiovascular drugs ($8
per woman).

www.healthcostinstitute.org
2014 Health Care Cost and Utilization Report 7
A21). For both pre-Medicare men and
women, this decline was due to lower
spending on medical and surgical ad-
missions. In contrast, for intermediate
adult women, the increase in acute
admissions spending was due to more
spending out of pocket on labor and
delivery (LD) admissions, which rose
$5 per woman .
Out-of-pocket per capita spending on
brand prescriptions fell every year in
the study period, from $101 in 2010
to $67 in 2014 (Table 2). This decline
was consistent across the population,
and was experienced by all age/
gender groups. This was also con-
sistent with falling utilization of
brand prescriptions during this time
period (see Utilization of prescription
services).
In contrast to the general decline in
spending out of pocket on brand pre-
scriptions, out-of-pocket spending on
generic prescriptions increased be-
tween 2010 and 2012 (Table 2). How-
ever, over the 2 subsequent years,
this spending had declined slightly. In
2013, the decline in spending on ge-
neric prescriptions was limited to the
younger female age groups (girls,
young adult women, and intermediate
adult women; Appendix Table A21).
(See 2013 Health Care Cost and Utili-
zation Report for more information
about these trends.3) For 2014, the
decline occurred for all the age/
gender groups. The smallest decline
in tdollars was for children, young
adult men, and intermediate adult
men ($2 per capita), whereas the larg-
est was for pre-Medicare adults ($9
per capita).
For pre-Medicare adults, the 2014
decline in out-of-pocket spending on
generic prescriptions was largely due
to lower spending on generic cardio-
vascular drugs (Appendix Table A31
and Appendix Table A32). Spending
on these drugs declined by $4 per
man and by $5 per woman. Lower
spending on cardiovascular drugs for
these age/gender groups was not
unique to 2014, as this was also true
in 2013
What made 2014 different from prior
years was lower spending on generic
anti-infective agents, central nervous
system (CNS) agents, respiratory
agents, and the “other” classes catego-
ry (see Key Definitions for more infor-
mation on these classes of prescrip-
tion drugs). Spending on these classes
of drugs declined by $11 for pre-
Medicare women and by $8 for pre-
Medicare men.
OUT-OF-POCKET SPENDING DEFINITIONS
Out-of-pocket spending per capita: Out-of-pocket spending includes the patient’s share of payment for the provi-
sion of health care services and prescriptions covered by insurance; such spending includes any copayments, coinsur-
ance payments, or deductible payments. If an insurance claim was not filed (e.g., for the purchase of over-the-counter
medicines), the expenditures are not included in this metric. These payments also do not reflect any refunds, rebates,
coupons, or discounts that individuals received after making the out-of-pocket payments. HCCI calculated out-of-
pocket expenditures per capita by dividing total out-of-pocket spending by the total insured population.
Deductibles: A deductible, both individual and family deductibles, is the amount of incurred health care costs that an
insured must pay out of pocket before the health plan reimbursement begins in a contract period. For example, for
health care expenses of $2,000 in a year, an insured with a $1,000 deductible would pay the first $1,000 out of pocket.
After the deductible is satisfied, the insured and the health plan jointly pay for the remaining $1,000 of expenses ac-
cording to the insurance contract’s coinsurance and co-payment policies.
Coinsurance: Coinsurance is the portion of covered health care costs borne by an insured. After insureds meet their
deductible requirements, they generally pay for a portion of the remaining health care expenses out of pocket. For
example, they may pay according to a fixed percentage of the expense, such as 20%. The insurer (payer) pays the oth-
er 80%.
Co-payments: Co-payments are out-of-pocket expenses in which the insured pays a specified charge for a specified
service. Typical co-payments are fixed fees for services such as physician office visits, prescriptions, and hospital ad-
missions.
Payer spending per capita: Spending by payers are the dollars paid by the insurer directly to a health care provider
on behalf of the insured. Any rebates, discounts, or incentive payments between insurers and providers not captured
by the insureds’ claims data are not included in this metric. HCCI calculated payer spending per capita by dividing to-
tal payer expenditures by the total insured population.

www.healthcostinstitute.org
2014 Health Care Cost and Utilization Report 8
www.healthcostinstitute.org
2014 Health Care Cost and Utilization Report 9
2014 TRENDS IN HEALTH CARE SPENDING BY PAYERS
Payer spending reflects the amounts that insurers paid to providers for health care services excluding the portion paid
out of pocket by the insured (see Out-of-pocket spending definitions). In 2014, payer expenditures accounted for the
bulk of total health care spending per capita (83.7%) for the ESI population, increasing by 3.6%, from $4,011 to $4,157
(Appendix Table A33). In each year between 2011 and 2013, payer spending per capita grew at rates slightly slower
than those for out-of-pocket spending. However, in 2014, payer spending grew at a rate faster than that of out-of-
pocket spending: 3.6% as compared to 2.2%.
In 2014, payer spending and spending growth rates varied across the four U.S. Census regions studied. Payer expendi-
tures grew fastest in the Northeast (4.9%) and the Midwest (3.7%). For the fourth consecutive year, the Northeast had
the highest per capita payer expenditures ($4,460) while the West had the lowest ($3,890).
Overall in 2014, payers had higher per capita spending for older adults as compared with the other age groups, as ex-
penditures for pre-Medicare adults reached $8,167 per capita. This increase was $2,730 per capita more than the ex-
penditures for the next oldest group (middle-age adults, $5,437 per capita) and more than twice the amount spent on
intermediate adults ($3,509 per capita). The fastest payer growth rate was also for pre-Medicare adults (4.7% in
2104), whereas the slowest rate was for intermediate adults (2.1%)
Over the study period, there was little change for payers in the share of spending on each of the service categories. In
2014, the largest share of spending and the highest per capita spending were on professional services (31.3% and
$1,303, respectively) and acute inpatient admissions (22.6% and $938, respectively). The smallest share of spending
and lowest spending level per capita were on outpatient-other services (10.5% and $437, respectively) and generic
prescriptions (5.0% and $208, respectively).
In 2014, as in the 2 prior years, payer spending on generic prescriptions accounted for the fastest growth rate of any
subservice category (12.4% in 2014; 6.8% in 2013; 14.9% in 2012). The second-fastest growth in payer expenditures
was for brand prescriptions (11.4%), which saw the largest dollar increase in payer spending ($53 per capita).
www.healthcostinstitute.org
2014 Health Care Cost and Utilization Report 10
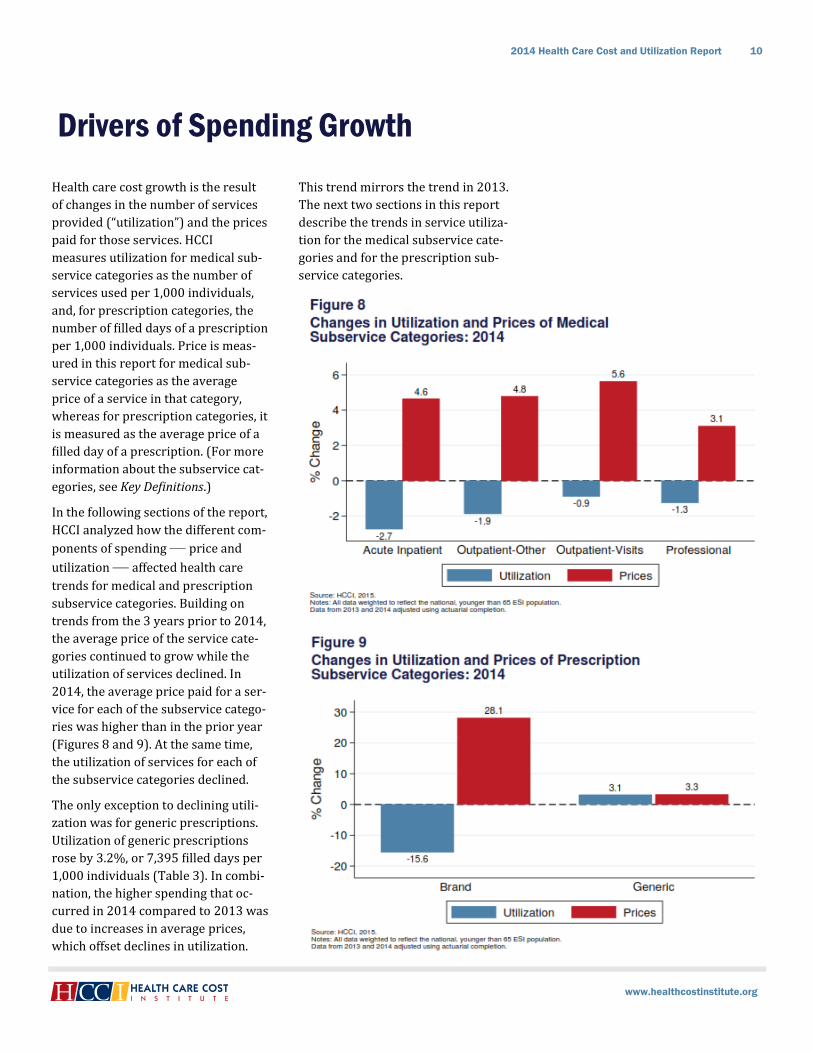
Health care cost growth is the result
of changes in the number of services
provided (“utilization”) and the prices
paid for those services. HCCI
measures utilization for medical sub-
service categories as the number of
services used per 1,000 individuals,
and, for prescription categories, the
number of filled days of a prescription
per 1,000 individuals. Price is meas-
ured in this report for medical sub-
service categories as the average
price of a service in that category,
whereas for prescription categories, it
is measured as the average price of a
filled day of a prescription. (For more
information about the subservice cat-
egories, see Key Definitions.)
In the following sections of the report,
HCCI analyzed how the different com-
ponents of spending — price and
utilization — affected health care
trends for medical and prescription
subservice categories. Building on
trends from the 3 years prior to 2014,
the average price of the service cate-
gories continued to grow while the
utilization of services declined. In
2014, the average price paid for a ser-
vice for each of the subservice catego-
ries was higher than in the prior year
(Figures 8 and 9). At the same time,
the utilization of services for each of
the subservice categories declined.
The only exception to declining utili-
zation was for generic prescriptions.
Utilization of generic prescriptions
rose by 3.2%, or 7,395 filled days per
1,000 individuals (Table 3). In combi-
nation, the higher spending that oc-
curred in 2014 compared to 2013 was
due to increases in average prices,
which offset declines in utilization.
This trend mirrors the trend in 2013.
The next two sections in this report
describe the trends in service utiliza-
tion for the medical subservice cate-
gories and for the prescription sub-
service categories.
Drivers of Spending Growth
www.healthcostinstitute.org
2014 Health Care Cost and Utilization Report 11
Utilization of Medical Services
As seen in Figure 8, utilization of all four
of the medical subservice categories
(acute inpatient admissions, outpatient
visits, outpatient-other services, and
professional services) declined in 2014.
The largest decline in utilization (–
2.7%) was for acute admissions, which
fell by 1 admission per 1,000 individuals
(Table 3). The smallest decline in utiliza-
tion (–0.9%) was for outpatient visits,
which fell by three visits per 1,000 indi-
viduals. Declines occurred across most
of the medical detailed service catego-
ries (see Key Definitions). While a few
detailed categories saw small increases
in utilization, most saw small or moder-
ate declines. This section describes the
trends in utilization of services across
the medical detailed service categories.
Acute inpatient admissions
Between 2010 and 2014, the number of
acute inpatient admissions per 1,000
individuals declined every year: 59 ad-
missions per 1,000 individuals in 2010
and 53 in 2014 (Appendix Table A3).
For most adult age groups — intermedi-
ate, middle-age, and pre-Medicare — the number of acute admissions de-
clined each year during this period
(Appendix Table A34 and Appendix Ta-
ble A35). Girls (ages 0–18), however,
accounted for a slight increase in the
overall number of admissions: 39 acute
admissions per 1,000 girls in 2010 and
40 in 2014.
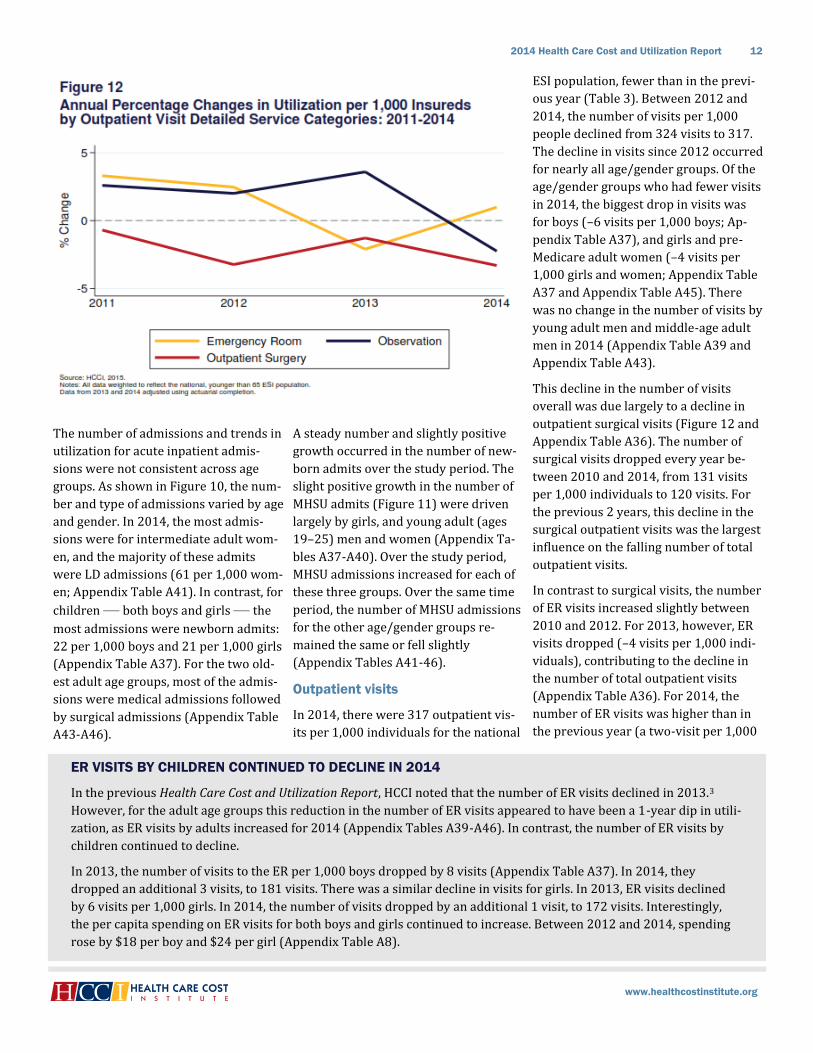
Of the five acute inpatient detailed ser-
vice categories, medical admissions and
surgical admissions declined in utiliza-
tion in every year of the study period
(Appendix Table A36). Between 2010
and 2014, the number of medical admis-
sions declined from 22 admissions per
1,000 individuals to 19. During that pe-
riod, there was an even larger decline
for surgical admissions, which dropped
from 18 admissions per 1,000 individu-
als to 13. At the same time, labor and
delivery (LD) and mental health and
substance use (MHSU) admissions were
steady throughout the time period,
while newborn admissions increased by
1 admission per 1,000 individuals
(2.7%) in 2014.
www.healthcostinstitute.org
2014 Health Care Cost and Utilization Report 12
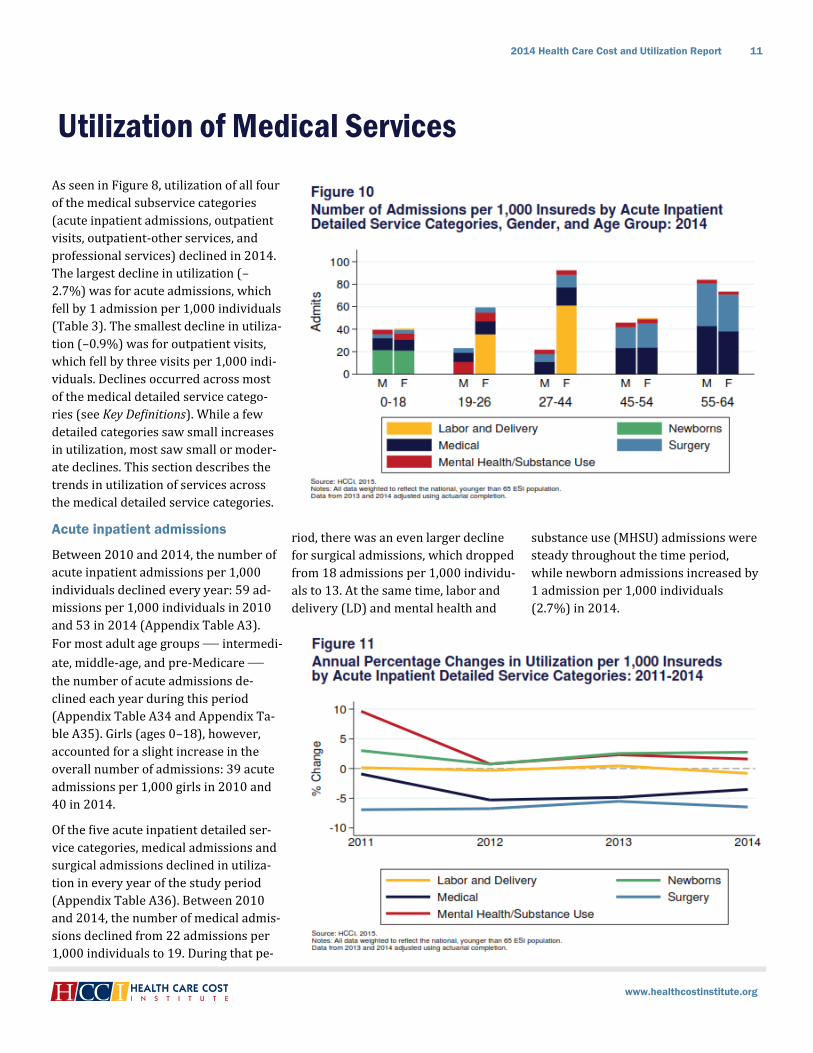
The number of admissions and trends in
utilization for acute inpatient admis-
sions were not consistent across age
groups. As shown in Figure 10, the num-
ber and type of admissions varied by age
and gender. In 2014, the most admis-
sions were for intermediate adult wom-
en, and the majority of these admits
were LD admissions (61 per 1,000 wom-
en; Appendix Table A41). In contrast, for
children — both boys and girls — the
most admissions were newborn admits:
22 per 1,000 boys and 21 per 1,000 girls
(Appendix Table A37). For the two old-
est adult age groups, most of the admis-
sions were medical admissions followed
by surgical admissions (Appendix Table
A43-A46).
A steady number and slightly positive
growth occurred in the number of new-
born admits over the study period. The
slight positive growth in the number of
MHSU admits (Figure 11) were driven
largely by girls, and young adult (ages
19–25) men and women (Appendix Ta-
bles A37-A40). Over the study period,
MHSU admissions increased for each of
these three groups. Over the same time
period, the number of MHSU admissions
for the other age/gender groups re-
mained the same or fell slightly
(Appendix Tables A41-46).
Outpatient visits
In 2014, there were 317 outpatient vis-
its per 1,000 individuals for the national
ESI population, fewer than in the previ-
ous year (Table 3). Between 2012 and
2014, the number of visits per 1,000
people declined from 324 visits to 317.
The decline in visits since 2012 occurred
for nearly all age/gender groups. Of the
age/gender groups who had fewer visits
in 2014, the biggest drop in visits was
for boys (–6 visits per 1,000 boys; Ap-
pendix Table A37), and girls and pre-
Medicare adult women (–4 visits per
1,000 girls and women; Appendix Table
A37 and Appendix Table A45). There
was no change in the number of visits by
young adult men and middle-age adult
men in 2014 (Appendix Table A39 and
Appendix Table A43).
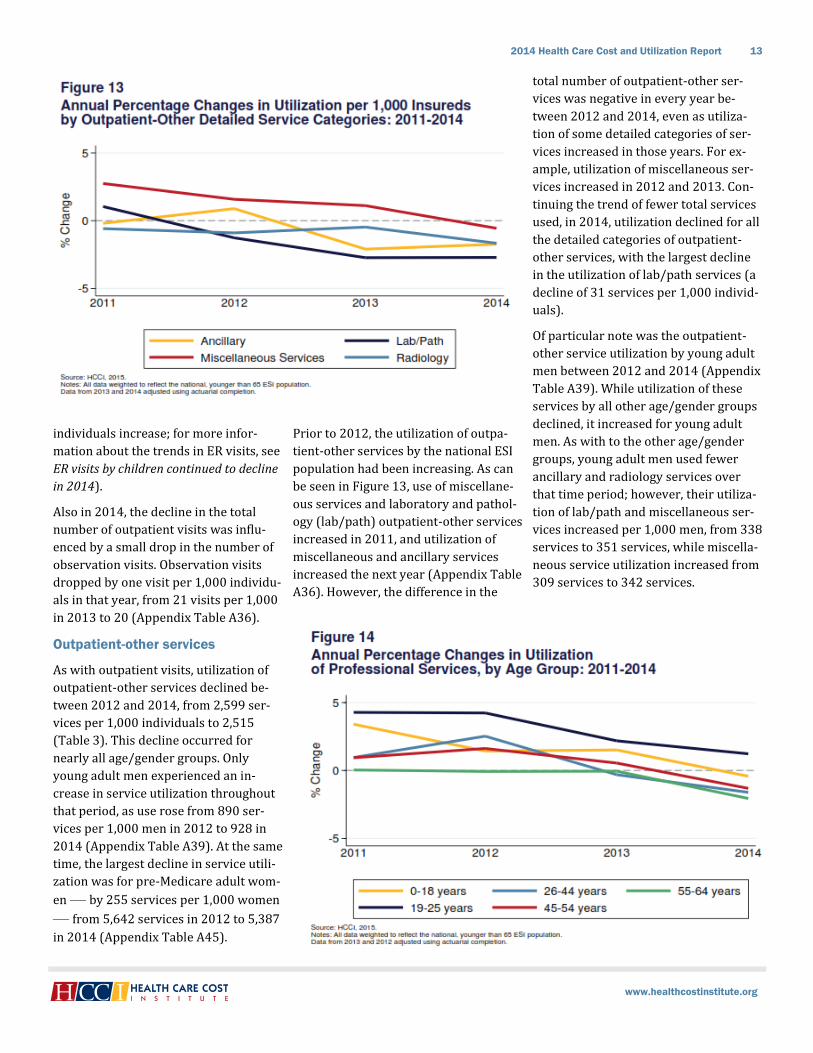
This decline in the number of visits
overall was due largely to a decline in
outpatient surgical visits (Figure 12 and
Appendix Table A36). The number of
surgical visits dropped every year be-
tween 2010 and 2014, from 131 visits
per 1,000 individuals to 120 visits. For
the previous 2 years, this decline in the
surgical outpatient visits was the largest
influence on the falling number of total
outpatient visits.
In contrast to surgical visits, the number
of ER visits increased slightly between
2010 and 2012. For 2013, however, ER
visits dropped (–4 visits per 1,000 indi-
viduals), contributing to the decline in
the number of total outpatient visits
(Appendix Table A36). For 2014, the
number of ER visits was higher than in
the previous year (a two-visit per 1,000
ER VISITS BY CHILDREN CONTINUED TO DECLINE IN 2014
In the previous Health Care Cost and Utilization Report, HCCI noted that the number of ER visits declined in 2013.3
However, for the adult age groups this reduction in the number of ER visits appeared to have been a 1-year dip in utili-
zation, as ER visits by adults increased for 2014 (Appendix Tables A39-A46). In contrast, the number of ER visits by
children continued to decline.
In 2013, the number of visits to the ER per 1,000 boys dropped by 8 visits (Appendix Table A37). In 2014, they
dropped an additional 3 visits, to 181 visits. There was a similar decline in visits for girls. In 2013, ER visits declined
by 6 visits per 1,000 girls. In 2014, the number of visits dropped by an additional 1 visit, to 172 visits. Interestingly,
the per capita spending on ER visits for both boys and girls continued to increase. Between 2012 and 2014, spending
rose by $18 per boy and $24 per girl (Appendix Table A8).
www.healthcostinstitute.org
2014 Health Care Cost and Utilization Report 13
individuals increase; for more infor-
mation about the trends in ER visits, see
ER visits by children continued to decline
in 2014).
Also in 2014, the decline in the total
number of outpatient visits was influ-
enced by a small drop in the number of
observation visits. Observation visits
dropped by one visit per 1,000 individu-
als in that year, from 21 visits per 1,000
in 2013 to 20 (Appendix Table A36).
Outpatient-other services
As with outpatient visits, utilization of
outpatient-other services declined be-
tween 2012 and 2014, from 2,599 ser-
vices per 1,000 individuals to 2,515
(Table 3). This decline occurred for
nearly all age/gender groups. Only
young adult men experienced an in-
crease in service utilization throughout
that period, as use rose from 890 ser-
vices per 1,000 men in 2012 to 928 in
2014 (Appendix Table A39). At the same
time, the largest decline in service utili-
zation was for pre-Medicare adult wom-
en — by 255 services per 1,000 women
— from 5,642 services in 2012 to 5,387
in 2014 (Appendix Table A45).
Prior to 2012, the utilization of outpa-
tient-other services by the national ESI
population had been increasing. As can
be seen in Figure 13, use of miscellane-
ous services and laboratory and pathol-
ogy (lab/path) outpatient-other services
increased in 2011, and utilization of
miscellaneous and ancillary services
increased the next year (Appendix Table
A36). However, the difference in the
total number of outpatient-other ser-
vices was negative in every year be-
tween 2012 and 2014, even as utiliza-
tion of some detailed categories of ser-
vices increased in those years. For ex-
ample, utilization of miscellaneous ser-
vices increased in 2012 and 2013. Con-
tinuing the trend of fewer total services
used, in 2014, utilization declined for all
the detailed categories of outpatient-
other services, with the largest decline
in the utilization of lab/path services (a
decline of 31 services per 1,000 individ-
uals).
Of particular note was the outpatient-
other service utilization by young adult
men between 2012 and 2014 (Appendix
Table A39). While utilization of these
services by all other age/gender groups
declined, it increased for young adult
men. As with to the other age/gender
groups, young adult men used fewer
ancillary and radiology services over
that time period; however, their utiliza-
tion of lab/path and miscellaneous ser-
vices increased per 1,000 men, from 338
services to 351 services, while miscella-
neous service utilization increased from
309 services to 342 services.
www.healthcostinstitute.org
2014 Health Care Cost and Utilization Report 14
Professional Services
In 2014, the utilization of professional
services by the national population de-
clined. This was the first time between
2010 and 2014 that utilization of profes-
sional services declined (Appendix Ta-
ble 3). Utilization dropped by 207 ser-
vices per 1,000 individuals, to 16,232
services in 2014. This decline in utiliza-
tion was generally consistent across the
population. Only young adult men (as
was true for outpatient-other service
utilization) had increased utilization of
professional services in 2014.
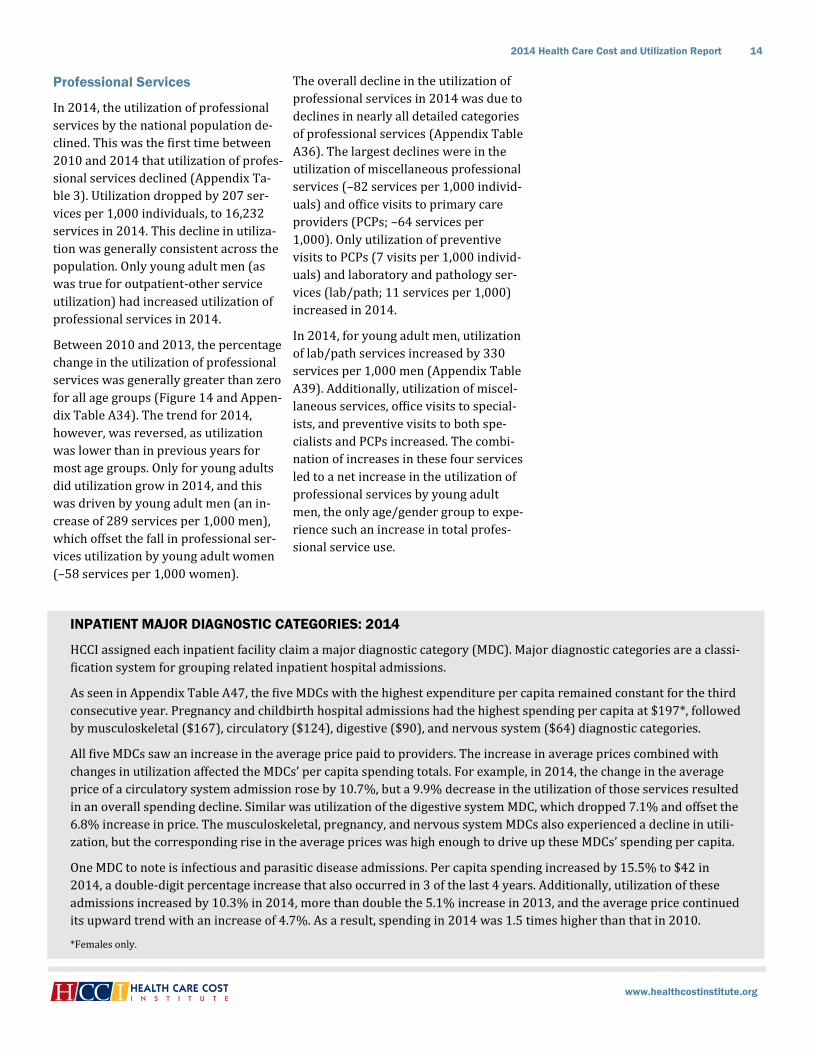
Between 2010 and 2013, the percentage
change in the utilization of professional
services was generally greater than zero
for all age groups (Figure 14 and Appen-
dix Table A34). The trend for 2014,
however, was reversed, as utilization
was lower than in previous years for
most age groups. Only for young adults
did utilization grow in 2014, and this
was driven by young adult men (an in-
crease of 289 services per 1,000 men),
which offset the fall in professional ser-
vices utilization by young adult women
(–58 services per 1,000 women).
The overall decline in the utilization of
professional services in 2014 was due to
declines in nearly all detailed categories
of professional services (Appendix Table
A36). The largest declines were in the
utilization of miscellaneous professional
services (–82 services per 1,000 individ-
uals) and office visits to primary care
providers (PCPs; –64 services per
1,000). Only utilization of preventive
visits to PCPs (7 visits per 1,000 individ-
uals) and laboratory and pathology ser-
vices (lab/path; 11 services per 1,000)
increased in 2014.
In 2014, for young adult men, utilization
of lab/path services increased by 330
services per 1,000 men (Appendix Table
A39). Additionally, utilization of miscel-
laneous services, office visits to special-
ists, and preventive visits to both spe-
cialists and PCPs increased. The combi-
nation of increases in these four services
led to a net increase in the utilization of
professional services by young adult
men, the only age/gender group to expe-
rience such an increase in total profes-
sional service use.
INPATIENT MAJOR DIAGNOSTIC CATEGORIES: 2014
HCCI assigned each inpatient facility claim a major diagnostic category (MDC). Major diagnostic categories are a classi-
fication system for grouping related inpatient hospital admissions.
As seen in Appendix Table A47, the five MDCs with the highest expenditure per capita remained constant for the third
consecutive year. Pregnancy and childbirth hospital admissions had the highest spending per capita at $197*, followed
by musculoskeletal ($167), circulatory ($124), digestive ($90), and nervous system ($64) diagnostic categories.
All five MDCs saw an increase in the average price paid to providers. The increase in average prices combined with
changes in utilization affected the MDCs’ per capita spending totals. For example, in 2014, the change in the average
price of a circulatory system admission rose by 10.7%, but a 9.9% decrease in the utilization of those services resulted
in an overall spending decline. Similar was utilization of the digestive system MDC, which dropped 7.1% and offset the
6.8% increase in price. The musculoskeletal, pregnancy, and nervous system MDCs also experienced a decline in utili-
zation, but the corresponding rise in the average prices was high enough to drive up these MDCs’ spending per capita.
One MDC to note is infectious and parasitic disease admissions. Per capita spending increased by 15.5% to $42 in
2014, a double-digit percentage increase that also occurred in 3 of the last 4 years. Additionally, utilization of these
admissions increased by 10.3% in 2014, more than double the 5.1% increase in 2013, and the average price continued
its upward trend with an increase of 4.7%. As a result, spending in 2014 was 1.5 times higher than that in 2010.
*Females only.
www.healthcostinstitute.org
2014 Health Care Cost and Utilization Report 15
www.healthcostinstitute.org
2014 Health Care Cost and Utilization Report 16
Every year between 2010 and 2014,
there was an increase (of less than 1%
per year) in the total utilization of pre-
scriptions (brand and generic), as meas-
ured in filled days per 1,000 individuals
(Appendix Table A3). In 2014, utiliza-
tion increased by 0.1% — an increase of
198 filled days per 1,000 (Table 3).
However, this increase in prescription
utilization was not consistent across the
age/gender groups. Utilization declined
for children, young adult men, and inter-
mediate adults, of which the largest de-
cline was by intermediate adult men (–
2,996 filled days, –2.0%; Appendix Table
A34 and Appendix Table A35). Utiliza-
tion of prescriptions increased for the
other age/gender groups. The largest
year-to-year increases were driven by
middle-age adult women (5,705 filled
days), pre-Medicare adult men (5,052
filled days), and middle-age adult men
(3,584 filled days).
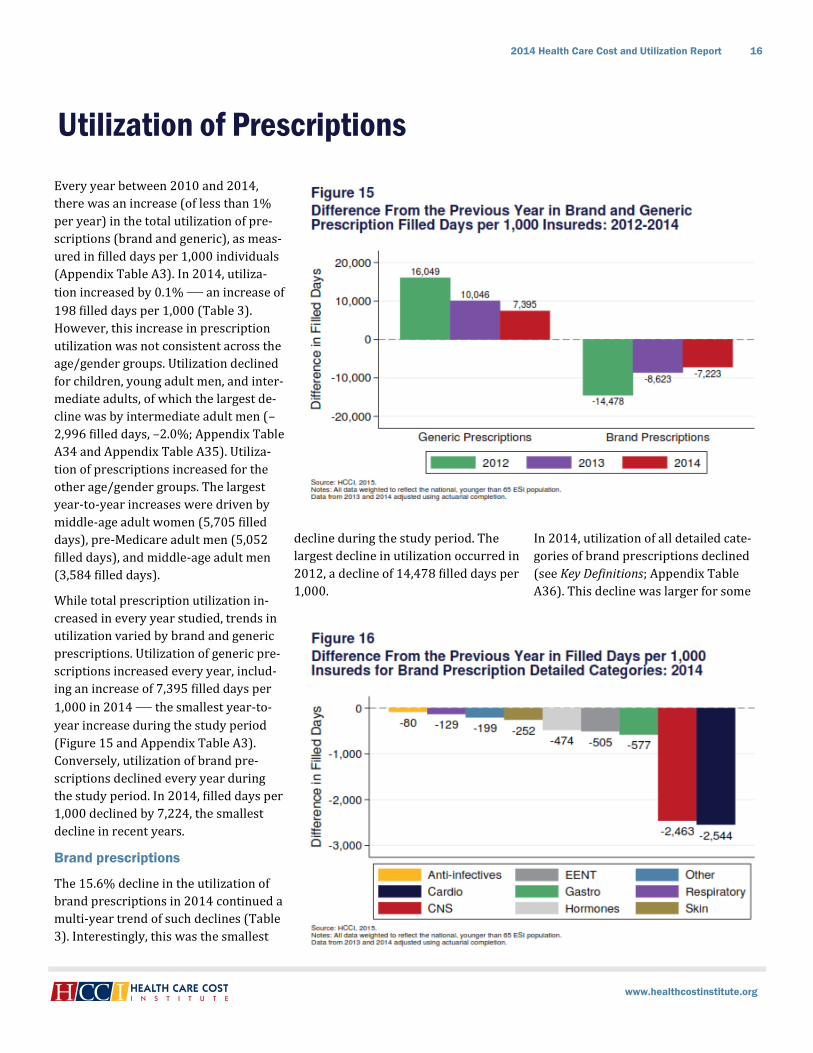
While total prescription utilization in-
creased in every year studied, trends in
utilization varied by brand and generic
prescriptions. Utilization of generic pre-
scriptions increased every year, includ-
ing an increase of 7,395 filled days per
1,000 in 2014 — the smallest year-to-
year increase during the study period
(Figure 15 and Appendix Table A3).
Conversely, utilization of brand pre-
scriptions declined every year during
the study period. In 2014, filled days per
1,000 declined by 7,224, the smallest
decline in recent years.
Brand prescriptions
The 15.6% decline in the utilization of
brand prescriptions in 2014 continued a
multi-year trend of such declines (Table
3). Interestingly, this was the smallest
decline during the study period. The
largest decline in utilization occurred in
2012, a decline of 14,478 filled days per
1,000.
In 2014, utilization of all detailed cate-
gories of brand prescriptions declined
(see Key Definitions; Appendix Table
A36). This decline was larger for some
Utilization of Prescriptions
www.healthcostinstitute.org
2014 Health Care Cost and Utilization Report 17
detailed categories than for others.
The largest declines were in cardio-
vascular drugs (–2,545 filled days per
1,000; –23.8%) and central nervous
system (CNS) agents (–2,463 filled
days; –28.2%). These categories ac-
counted for the second- and third-
highest utilization: 8,163 filled days
and 6,267 filled days, respectively.
Utilization of cardiovascular drugs
was largely confined to the oldest age
groups. The highest utilization of car-
diovascular drugs in 2014 was by pre-
Medicare adult men (37,940 filled
days per 1,000) and women (21,903;
Appendix Table A45). For adults, utili-
zation of CNS agents (i.e., antidepres-
sants, opiate agonists, and ampheta-
mines) generally increased with age,
and women had higher utilization
than did men. However, boys also had
comparatively high utilization of CNS
agents (7,152 filled days per 1,000 in
2014; Appendix Table A37) as com-
pared to the other age/gender groups.
The most utilized subservice category
of brand prescriptions was hormones
and synthetic substitutes (10,934
filled days per 1,000 in 2014; Appen-
dix Table A36). Utilization of these
prescriptions by women was higher
than by men, and generally tended to
increase with age. The decline in utili-
zation of the hormones category in
2014 (–474 filled days per 1,000) was
relatively small as compared to the
decline in the utilization of cardiovas-
cular drugs and CNS agents (Figure
16).
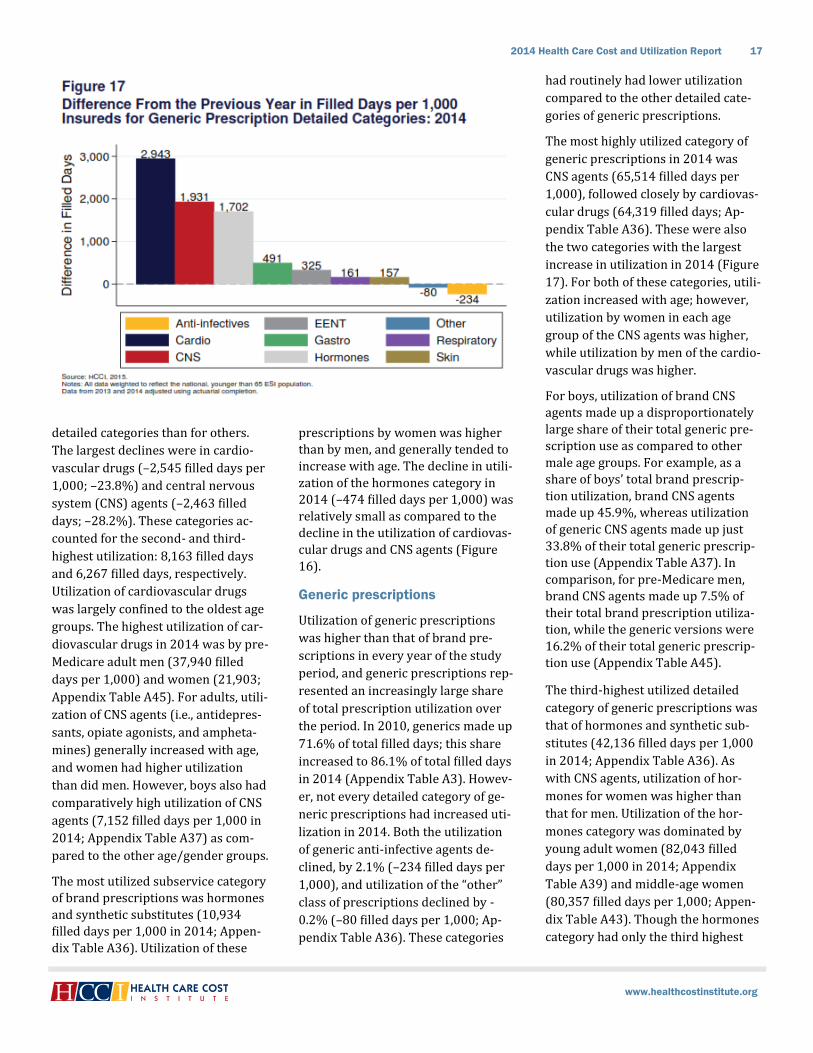
Generic prescriptions
Utilization of generic prescriptions
was higher than that of brand pre-
scriptions in every year of the study
period, and generic prescriptions rep-
resented an increasingly large share
of total prescription utilization over
the period. In 2010, generics made up
71.6% of total filled days; this share
increased to 86.1% of total filled days
in 2014 (Appendix Table A3). Howev-
er, not every detailed category of ge-
neric prescriptions had increased uti-
lization in 2014. Both the utilization
of generic anti-infective agents de-
clined, by 2.1% (–234 filled days per
1,000), and utilization of the “other”
class of prescriptions declined by -
0.2% (–80 filled days per 1,000; Ap-
pendix Table A36). These categories
had routinely had lower utilization
compared to the other detailed cate-
gories of generic prescriptions.
The most highly utilized category of
generic prescriptions in 2014 was
CNS agents (65,514 filled days per
1,000), followed closely by cardiovas-
cular drugs (64,319 filled days; Ap-
pendix Table A36). These were also
the two categories with the largest
increase in utilization in 2014 (Figure
17). For both of these categories, utili-
zation increased with age; however,
utilization by women in each age
group of the CNS agents was higher,
while utilization by men of the cardio-
vascular drugs was higher.
For boys, utilization of brand CNS
agents made up a disproportionately
large share of their total generic pre-
scription use as compared to other
male age groups. For example, as a
share of boys’ total brand prescrip-
tion utilization, brand CNS agents
made up 45.9%, whereas utilization
of generic CNS agents made up just
33.8% of their total generic prescrip-
tion use (Appendix Table A37). In
comparison, for pre-Medicare men,
brand CNS agents made up 7.5% of
their total brand prescription utiliza-
tion, while the generic versions were
16.2% of their total generic prescrip-
tion use (Appendix Table A45).
The third-highest utilized detailed
category of generic prescriptions was
that of hormones and synthetic sub-
stitutes (42,136 filled days per 1,000
in 2014; Appendix Table A36). As
with CNS agents, utilization of hor-
mones for women was higher than
that for men. Utilization of the hor-
mones category was dominated by
young adult women (82,043 filled
days per 1,000 in 2014; Appendix
Table A39) and middle-age women
(80,357 filled days per 1,000; Appen-
dix Table A43). Though the hormones
category had only the third highest

www.healthcostinstitute.org
2014 Health Care Cost and Utilization Report 18
increase in utilization in 2014, it had
the largest net increase in utilization
(measured as the increase in generic
use minus the decline in brand use):
1,228 filled days per 1,000 (Appendix
Table A36).
The detailed category hormones and
synthetic substitutes contains a multi-
tude of drug subclasses. In 2014, the
subclasses with the highest utilization
by the study population were generic
hormone contraceptives (13,045
filled days per 1,000), and generic
thyroid agents (12,839 filled days per
1,000; Appendix Table A48). Both of
these classes had increased use in
2014: 3.9% and 4.0%, respectively.
AVERAGE PRICE PER SERVICE INCREASED FOR ALL SUBSERVICE CATEGORIES IN 2014
In 2014, the average price per service increased for all the medical subservice categories (Table 3). Additionally, the
price per filled day also increased for both brand and generic prescriptions (see Drivers of spending growth).
In every year of the study period (2010-2014), the average price per service increased for each of the medical sub-
service categories (Appendix Table A33). Price growth tended to be highest for outpatient visits, with average annual
growth of 5.6%. During that period, the largest year-to-year dollar increase in the average price per service was for
acute admissions, which grew an annual average of $881. That category also had the largest dollar increase for 2014
($831), reaching an average price of $18,728 per acute admission.
The smallest growth in average price per service was for professional services, which grew from $94 in 2010 to $103
in 2014. The trends in average price for outpatient-other services were similar to those for professional services. The
average annual growth in price for outpatient-other services was 4.6%, and the price per service increased from $176
per service to $210 during the study period.
The average price per filled day of brand prescriptions increased every year of the study period. Brand prescriptions
had growth rates faster than any in the other subservice categories, rising an annual average 23.3%. The average price
of a brand prescription increased from $7 per filled day in 2010 to $15 in 2014.
While the average price increased in 2014, generic prescriptions were the only subservice category for which the av-
erage price declined in some years studied. Price declines occurred in 2011 and in 2013. Throughout the study period,
changes in the price of generic prescriptions were relatively modest. In each year, the average price per filled day re-
mained between $1 and $1.49.
www.healthcostinstitute.org
2014 Health Care Cost and Utilization Report 19
Data
HCCI’s dataset contains several billion
de-identified commercial health in-
surance claim lines for the years 2010
through 2014. Three major health
insurers contributed data to HCCI for
the purposes of producing a national,
multi-payer, commercial health care
claims database. These data include
claims for individuals covered by
group insurance through an employer
(fully insured and administrative ser-
vices only), individual insurance, and
Medicare Advantage plans. The claims
data include prices paid to providers
by both insurers and insureds and
details about the services used. Fur-
thermore, HCCI’s claims data are com-
pliant with the Health Insurance Port-
ability and Accountability Act
(HIPAA).
For this report, HCCI performed anal-
ysis on a subset of data totaling ap-
proximately 5 billion claim lines for
approximately 40 million insureds
per year (2010–2014).4 This analytic
subset consisted of all claims for in-
sureds younger than age 65 and cov-
ered by ESI and represented about
27% of the national ESI population. It
is one of the largest datasets on the
privately insured ever assembled.
Methods
The analytic subset was weighted
using U.S. Census Bureau age-gender-
geographic-based estimates of the ESI
population to make the analytic sub-
set representative of the national ESI
population younger than age 65.
Claims in the analytic subset from
2013 and 2014 were actuarially com-
pleted to account for claims that had
been incurred but not adjudicated.
Claims for years 2010 through 2012,
though refreshed over time, were
considered 100% adjudicated in
2014.
HCCI used the weighted, actuarially
completed dataset to estimate per
capita health expenditures, average
prices, and utilization of services for
2010 through 2014. HCCI did not cor-
rect dollars for inflation; thus, all re-
ported expenditures and prices were
in nominal dollars.
HCCI analyzed four major categories
of services, several subservice catego-
ries, and detailed service categories
(see Key Definitions). Inpatient facili-
ty claims were from hospitals, skilled
nursing facilities (SNFs), and hospices
in which detail was sufficient to iden-
tify an overnight stay by an insured.
Outpatient facility claims did not en-
tail an overnight stay, and included
observation and ER services. Both
outpatient and inpatient claims con-
sisted of only the facility charges as-
sociated with such claims. Profession-
al procedures included claims billed
by physicians and non-physicians
according to the industry’s standard
procedure-coding practices. Prescrip-
tion data reflected prescriptions filled
at both retail and mail-order pharma-
cies.
For a more detailed description of
HCCI’s methodology and dataset, see
the Analytic Methodology on HCCI’s
Website.1
HCCI recognizes that the terms heath
care spending and health spending
could be interpreted differently; how-
ever, they were used interchangeably
in this report.
Limitations
This report, like all research, had sev-
eral limitations that affect the gener-
alizability and interpretation of the
findings. For this reason, HCCI consid-
ers the work a starting point for anal-
ysis and research on individuals cov-
ered by ESI rather than as a conclu-
sive analysis of the ESI population’s
effect on health care in the United
States.
First, our findings were estimates for
the United States ESI population ages
0 through 64, based on a sample of
approximately 27% of these insureds.
Second, the analysis and results were
descriptive, and the findings were not
causal and cannot be used to deter-
mine causal relationships.
Third, the effect of individual or popu-
lation health status, such as existence
of chronic conditions, was not specifi-
cally investigated or discussed in the
report
Changes in 20134
HCCI’s analytic methodology under-
went a number of changes to enhance
reporting for the 2013 Health Care
Cost and Utilization Report. See the
methodology document available on
HCCI’s Website for details on these
changes. 7
Data changes.
HCCI’s analytic methodology under-
went a number of changes to enhance
reporting for the 2014 Health Care
Cost and Utilization Report. See the
Data & Methods

www.healthcostinstitute.org
2014 Health Care Cost and Utilization Report 20
methodology document available on
HCCI’s Website for a complete de-
scription of these changes.1
Data changes. In the 2014 report, new
data were provided for 2012 through
2014 from the data contributors, re-
sulting in changes in the membership,
expenditures, utilization, and prices
in all years. This is an unavoidable
consequence of updating and refining
the dataset over time. As a result, the
trends reported in the 2014 report
are somewhat different from those in
the 2013 report.
The data were adjusted to account for
new and revised data for 2013. For the
2014 analytic dataset, 2010 through
2012 data were considered complete,
and no actuarial adjustment was per-
formed. The 2013 and 2014 claims
were actuarially completed using the
new data. The average intensity
weights were changed to reflect up-
dates to DRGs, RVUs, and APCs by
CMS in 2014.
Weighting methodology was updated.
The weighting methodology was up-
dated to reflect changes in the defini-
tions of micropolitan and metropoli-
tan areas, and updates to the county
to core-based statistical area (CBSA)
mapping by the Office of Management
and Budget (OMB). The data used to
create the population weights were
updated to reflect new estimates from
the American Community Survey.
Professional procedure detailed cate-
gory added. HCCI included a new de-
tailed category “administration of
drugs” in this year’s report. This cate-
gory includes the CPT and HCPCS
codes that reflect procedures and
health care professionals who admin-
ister drugs to individuals.
Suggested citation for 2014 re-
port:
“2014 Health Care Cost and Utiliza-
tion Report.” Health Care Cost Insti-
tute, Inc., Oct. 2015. Web.
Endnotes
1. Health Care Cost Institute. 2014
Health Care Cost and Utilization
Report Analytic Methodology
v.4.0. Health Care Cost Institute,
Oct. 2015. Web.
2. McEvoy, Gerald K., ed. AHFS Drug
Information. Bethesda, MD:
American Society of Health-
System Pharmacists, 2015. PEP-
ID. Web.
3. Health Care Cost Institute. 2013
Health Care Cost and Utilization
Report. HCCI, Oct. 2014. Web.
4. Health Care Cost Institute, Inc.
Aggregated ESI Cost and Utiliza-
tion Dataset (2010-2014). Health
Care Cost Institute, 2015. Digital
file.
5. The Editorial Board. “Costly Hep-
atitis C Drugs for Everyone?” The
New York Times, Sep. 2, 2015.
Web.
6. Hepatitis C Online. “Simeprevir
(Olysio)”. University of Washing-
ton, 2015. Web.
Trend to Note: Hepatitis C Drugs and the National ESI
Population
Between winter 2013 and fall 2014, three new breakthrough drugs were approved by the FDA for the treatment of the
Hepatitis C virus (HCV). These drugs were: Olysio (FDA approval 11/22/13); Sovaldi (FDA approval 12/6/13); and Harvoni
(FDA approval 10/10/14). While the drugs have been reported to have important benefits to individuals with HCV,
discussions regarding cost have also been ongoing.5
In the American Hospital Formulary Service (AHFS) classification system used by HCCI, Olysio, Sovaldi, and Harvoni are all
classified as brand anti-infective agents. In 2013, the per capita spending on Olysio and Sovaldi for the national ESI
population was $0.20 (Appendix Table A49). In comparison, the per capita spending on all other brand anti-infective agents
was $53.10. There was relatively low utilization of the Olysio and Sovladi in 2013: 0.2 filled days per 1,000 individuals.
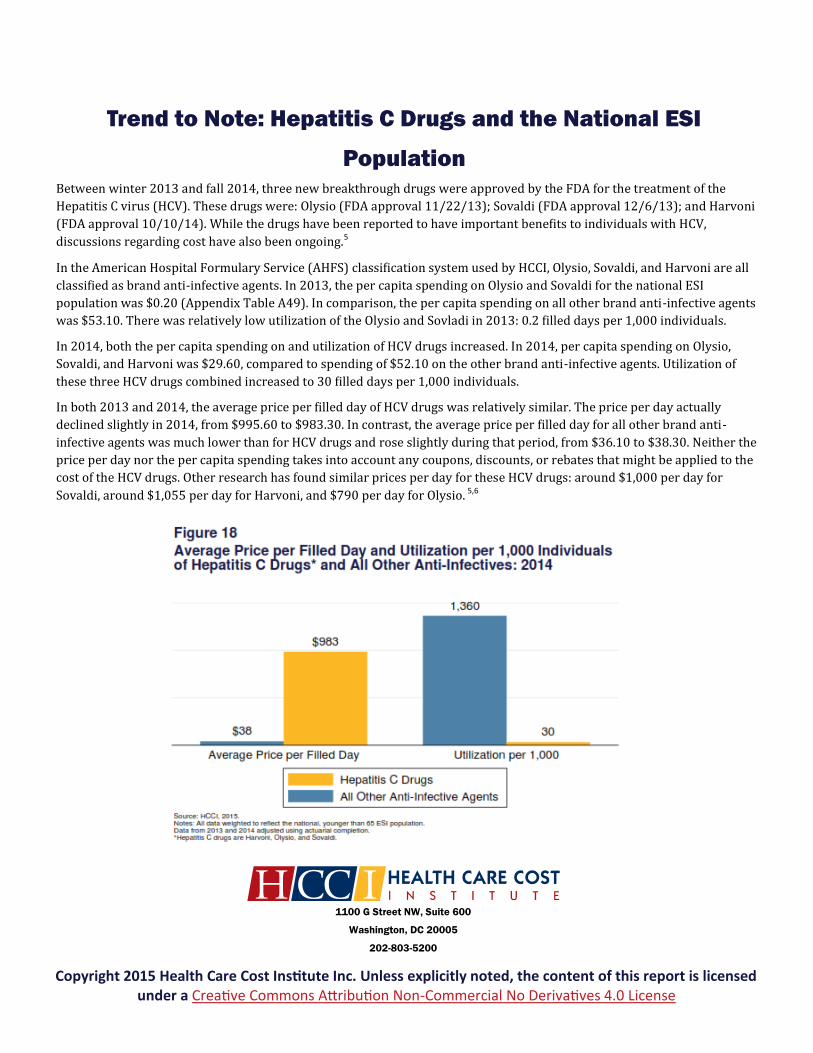
In 2014, both the per capita spending on and utilization of HCV drugs increased. In 2014, per capita spending on Olysio,
Sovaldi, and Harvoni was $29.60, compared to spending of $52.10 on the other brand anti-infective agents. Utilization of
these three HCV drugs combined increased to 30 filled days per 1,000 individuals.
In both 2013 and 2014, the average price per filled day of HCV drugs was relatively similar. The price per day actually
declined slightly in 2014, from $995.60 to $983.30. In contrast, the average price per filled day for all other brand anti-
infective agents was much lower than for HCV drugs and rose slightly during that period, from $36.10 to $38.30. Neither the
price per day nor the per capita spending takes into account any coupons, discounts, or rebates that might be applied to the
cost of the HCV drugs. Other research has found similar prices per day for these HCV drugs: around $1,000 per day for
Sovaldi, around $1,055 per day for Harvoni, and $790 per day for Olysio. 5,6
1100 G Street NW, Suite 600
Washington, DC 20005
202-803-5200
Copyright 2015 Health Care Cost Institute Inc. Unless explicitly noted, the content of this report is licensed under a Creative Commons Attribution Non-Commercial No Derivatives 4.0 License