2014 December GSOO Stakeholder Presentation
29
2014 December Gas Statement of Opportunities Joachim Tan Senior Analyst, System Capacity Stakeholder Presentation 3 February 2015
-
Upload
joachim-tan -
Category
Business
-
view
50 -
download
1
Transcript of 2014 December GSOO Stakeholder Presentation

2014 December Gas Statement of Opportunities Joachim Tan Senior Analyst, System Capacity Stakeholder Presentation 3 February 2015
2
Forecast context
Findings
Forecasts
Other information

Forecast context
Challenging time to prepare long-term forecasts of gas demand and supply:
• Volatility in oil prices
• Significant fall in the prices of WA commodities
• North West Shelf and related commercial decisions
• Falling Asia Pacific gas prices, making supply to the domestic gas market relatively more attractive
3

Falling oil prices, January 2014 – January 2015 (Brent)
4
$40
$50
$60
$70
$80
$90
$100
$110
$120
US$
/bar
rel
December 2014 GSOO Released
Peak - Brent price US115.19 on 19 June 2014
OPEC 27 November 2014
Decision
Source: EIA, Brent Spot Prices FOB
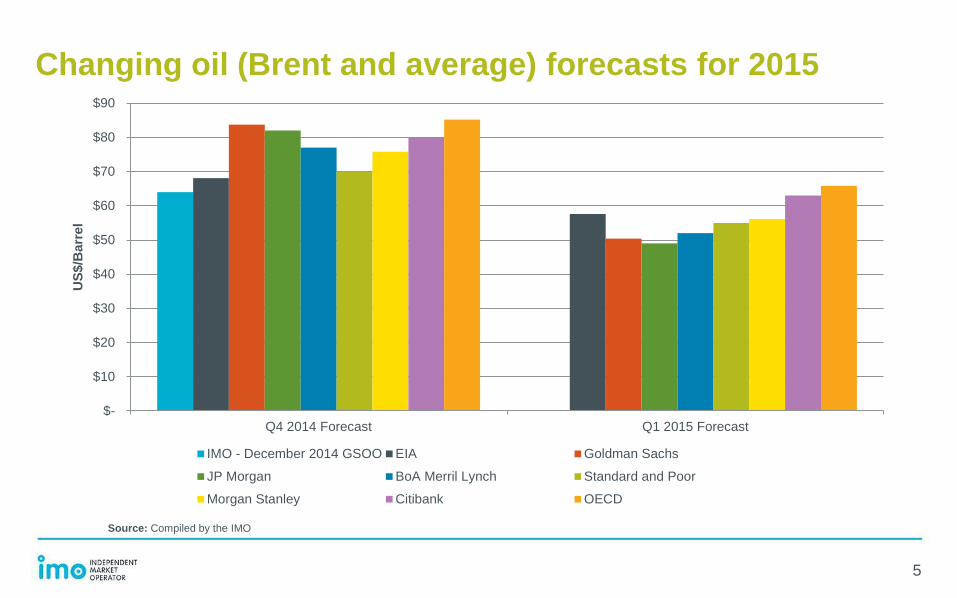
Changing oil (Brent and average) forecasts for 2015
5
Source: Compiled by the IMO
$-
$10
$20
$30
$40
$50
$60
$70
$80
$90
Q4 2014 Forecast Q1 2015 Forecast
US$
/Bar
rel
IMO - December 2014 GSOO EIA Goldman Sachs
JP Morgan BoA Merril Lynch Standard and Poor
Morgan Stanley Citibank OECD

Commodity prices, January 2014 – December 2014
6
0
10
20
30
40
50
60
70
80
90
100
Jan-14 Feb-14 Mar-14 Apr-14 May-14 Jun-14 Jul-14 Aug-14 Sep-14 Oct-14 Nov-14 Dec-14
Inde
x Va
lue
Index of commodity prices; All items US$ Index of commodity prices; Bulk commodities (spot); US$
Source: Reserve Bank of Australia, Base Year = 2012-13

North West Shelf update
NWS and WA Government signed an amendment to the State Agreement on 20 November 2014 (awaiting ratification by WA Parliament) that requires the NWS to:
• adhere to the WA Government’s domestic gas policy – reserve approximately 715 PJ
• upgrade and maintain the NWS domestic gas facilities with sufficient capacity
• diligently market the committed gas quantities to the domestic market
• report to the WA Government annually
While the Agreement Amendment provides more domestic supply certainty, several on going decisions have to be made.
7

North West Shelf update
It now appears likely that some supply will be available from the NWS beyond 2020 but …..
the amendment does not specify :
• the timing or a minimum amount of domestic gas that must be made available beyond 2020
• the minimum level of domestic gas production capacity that must be maintained
The availability of domestic gas from the NWS remains contingent on whether the NWS can profitably and commercially maintain gas supply to the domestic market and multiple investment decisions (beyond Persephone) are yet to be made by the JVs.
However, in the 2015-2024 period, Hess may contract NWS to supply domestic gas (subject to commercial negotiation). Hess announced on 23 December 2014 its intention to develop and toll its WA gas reserves through the NWS processing facilities.
8

9
Forecast context
Findings
Forecasts
Other information

Key findings
• The supply of gas to the domestic market is expected to be adequate to meet demand over the forecast period
• However, with several commercial and investment decisions yet to be made, the extent of any future supply from the NWS is not yet known with certainty, and the supply-demand balance may tighten after 2020
10

Supply – Demand balance
11
900
1,100
1,300
1,500
1,700
1,900
2,100
2015 2016 2017 2018 2019 2020 2021 2022 2023 2024
Qua
ntity
(TJ
per d
ay)
Expected gas demand Lower potential gas supply forecasts
Upper potential gas supply forecasts Total production capacity
Source: NIEIR and IMO Estimates, 2015-2024

Other findings
Gas Demand
• Demand in the non-SWIS areas will grow faster than SWIS
• Rapid growth of total gas demand (domestic & LNG); start-up of Gorgon, Wheatstone and Prelude domestic gas & LNG projects
Resources and Reserves
• Conventional gas reserves is estimated to last between 12 to 37 years, depending on technology (Table 9.4), unconventional reserves (105 years)
• Gas production in WA remain reliant on conventional reserves in the Carnarvon Basin (Table 9.5)
• Exploration of unconventional resources need to be fostered
12

13
Forecast context
Findings
Forecasts
Other information

Gas demand 2015 – 2024
Growth in the early years of the gas demand forecasts is driven by new large gas-consuming projects. These projects include:
• Sub161’s CNG facility at Port Hedland
• the Fortescue River Gas Pipeline
• the Eastern Goldfields Gas Pipeline
And increased gas consumption relating to:
• Alinta Energy’s Newman Power Station which will supply electricity to the Roy Hill mine
• operation of TransAlta’s South Hedland Power Station
• the Pilbara Temporary Power Station
• CITIC Pacific’s Sino Iron’s magnetite mine
14

Domestic gas demand and forecasts 1983 – 2024
15
0
200
400
600
800
1000
1200
140019
8319
8419
8519
8619
8719
8819
8919
9019
9119
9219
9319
9419
9519
9619
9719
9819
9920
0020
0120
0220
0320
0420
0520
0620
0720
0820
0920
1020
1120
1220
1320
1420
1520
1620
1720
1820
1920
2020
2120
2220
2320
24
Qua
ntity
(TJ
per d
ay)
Historical gas consumption Base demand forecast High demand forecast
Source: DMP and IMO Estimates, 2015-2024

IMO and CMEWA WA demand forecasts 2015 – 2023
16
340
350
360
370
380
390
400
410
2015 2016 2017 2018 2019 2020 2021 2022 2023
Qua
ntity
(PJ
per a
nnum
)
CMEWA's forecast NIEIR's forecast
Source: CMEWA, Deloitte Australia and IMO Estimates, 2015-2023

Total gas demand forecasts 2015 – 2024
17
0
1,000
2,000
3,000
4,000
5,000
6,000
2015 2016 2017 2018 2019 2020 2021 2022 2023 2024
Qua
ntity
(PJ
per a
nnum
)
Base scenario High scenario
Source: NIEIR and IMO Estimates, 2015-2024

Forecast prices used in modelling 2015 – 2024
18
$0.0
$2.0
$4.0
$6.0
$8.0
$10.0
$12.0
2015 2016 2017 2018 2019 2020 2021 2022 2023 2024
Pric
e (A
$ pe
r GJ)
December 2014 Base scenario January 2014 GSOO Base scenario
Source: NIEIR and IMO Estimates 2015-2024

Gas supply forecasts 2015 – 2024
19
Source: IMO Estimates 2015-2024
900
1,100
1,300
1,500
1,700
1,900
2,100
2015 2016 2017 2018 2019 2020 2021 2022 2023 2024
Qua
ntity
(TJ/
day)
Lower Potential Gas Supply Forecasts Upper Potential Gas Supply ForecastsTotal Production Capacity

20
Forecast context
Findings
Forecasts
Other information

What’s new in the December 2014 GSOO
Modelling
• Prospective gas projects included in High gas demand scenario
• Improvements to gas consumption estimates of iron magnetite projects
• Improvements to potential gas supply model (considers non-LNG linked facilities)
• LNG feedstock and processing requirements (now considers utilisation rates)
Information
• Greater use of GBB data (more details to come)
• More detailed analysis of demand and its drivers
21

Other information in December 2014 GSOO
Additional Information on:
• Drivers of domestic gas consumption
• Gas production outages
• Gas injection and withdrawals (Mondarra)
• Gas production statistics
• Gas shipping by pipeline
22

Gas demand, August 2013 – November 2014
23
31% 29% 30% 30% 32% 31% 27% 26% 30% 30% 28% 29%
32% 32% 32% 29% 28% 29% 31% 33% 34% 30% 30% 31%
12% 12% 12% 12% 12% 12% 14% 12% 15%
15% 13% 14%
11% 11% 11% 12% 11% 11% 11% 10% 2% 8% 11% 11%
5% 7% 7% 7% 7% 5% 5% 5% 7% 7% 6% 6%
10% 8% 9% 9% 10% 11% 13% 12% 12% 10% 10% 10%
0%
10%
20%
30%
40%
50%
60%
70%
80%
90%
100%
Dec-2013 Feb-2014 Apr-2014 Jun-2014 Aug-2014 Oct-2014
Prop
ortio
n
Minerals processing Electricity Mining Industrial Other Distribution network
Source: IMO GBB

Production facility outages, August 2013 – November 2014
24
0%
2%
4%
6%
8%
10%
12%
14%
16%
18%
Prop
ortio
n
Source: IMO GBB

Gas injections and withdrawals (Mondarra), August 2013 – November 2014
25
0
10
20
30
40
50
60
70
80
90
100
Aug-13 Oct-13 Dec-13 Feb-14 Apr-14 Jun-14 Aug-14 Oct-14
Qua
ntity
(TJ
per d
ay)
Gas withdrawn Gas injectedSource: IMO GBB

Gas production statistics, Q4 2013 to Q3 2014
Facility Nameplate capacity (TJ per day)
Peak production October 2013 to September 2014
Day of peak production Average production
Q4 2013 (TJ per day)
Q1 2014 (TJ per day)
Q2 2014 (TJ per day)
Q3 2014 (TJ per day)
Beharra Springs 19.6 19.8 5/10/2013 10.2 9.2 13.9 18.1
Dongara 7 2.5 4/9/2013 2.1 1.8 1.7 1.4
Devil Creek 220 172.5 22/11/2013 135.6 69.6 65.8 76.2
KGP 630 671.9 1/8/2013 443.6 459.2 470.0 493.7
Macedon 200 213.1 10/9/2013 164.5 141.5 142.9 152.3
Red Gully 10 14.7 14/4/2014 7.6 6.0 4.0 7.7
Varanus Island 390 371.7 3/1/2014 272.5 299.4 271.6 234.9
Total 1476.6 1,036.1 986.7 969.9 984.3
26
Source: IMO GBB

Gas production statistics, Q4 2013 to Q3 2014
Facility Nameplate capacity (TJ per day)
Peak production October 2013 to September 2014
Day of peak production Average production
Q4 2013 (TJ per day)
Q1 2014 (TJ per day)
Q2 2014 (TJ per day)
Q3 2014 (TJ per day)
Beharra Springs 19.6 19.8 5/10/2013 10.2 9.2 13.9 18.1
Dongara 7 2.5 4/9/2013 2.1 1.8 1.7 1.4
Devil Creek 220 172.5 22/11/2013 135.6 69.6 65.8 76.2
KGP 630 671.9 1/8/2013 443.6 459.2 470.0 493.7
Macedon 200 213.1 10/9/2013 164.5 141.5 142.9 152.3
Red Gully 10 14.7 14/4/2014 7.6 6.0 4.0 7.7
Varanus Island 390 371.7 3/1/2014 272.5 299.4 271.6 234.9
Total 1476.6 1,036.1 986.7 969.9 984.3
27
Source: IMO GBB

Quantity of gas shipped by pipeline, Q4 2013 to Q3 2014
28
0
10
20
30
40
50
60
70
80
90
100
Q4 2013 Q1 2014 Q2 2014 Q3 2014
Qua
ntity
(PJ)
DBNGP GGP PEP All other pipelinesSource: IMO

Events since publishing December 2014 GSOO • Oil prices (Brent and WTI) falls below US$50/bbl -> Contracted LNG prices falls
below spot (Japan)
• First shipment of LNG leaves Queensland’s QCLNG project
• Shell drops Arrow LNG project
• Quantity of gas reserves relating to Red Gully JV are upgraded
• ACCC commences an inquiry into Woodside’s purchase of Apache Energy’s interests
• Ivernia’s Paroo lead mine placed into care and maintenance (from February 2015)
• TEPCO and Chubu Electric establishing 50/50 JV (to manage all energy assets)
• Proposed Panama Canal charges for LNG carriers released
29